t. rowe price institutional common trust fund t. … · annual report december 31, 2015 t. rowe...
TRANSCRIPT
ANNUAL REPORT
December 31, 2015
T. ROWE PRICE TRUST COMPANY
T. ROWE PRICE INSTITUTIONAL COMMON TRUST FUND
T. Rowe Price New Horizons Trust
ANNUAL REPORT December 31, 2015
T. ROWE PRICE TRUST COMPANY
T. ROWE PRICE INSTITUTIONAL COMMON TRUST FUND
T. Rowe Price New Horizons Trust
TABLE OF CONTENTS
− Portfolio of Investments
− Statement of Assets and Liabilities
− Statement of Operations
− Statement of Changes in Net Assets
− Financial Highlights
− Notes to Financial Statements
− Schedules of Investments Purchased and Sold
− Report of Independent Auditors
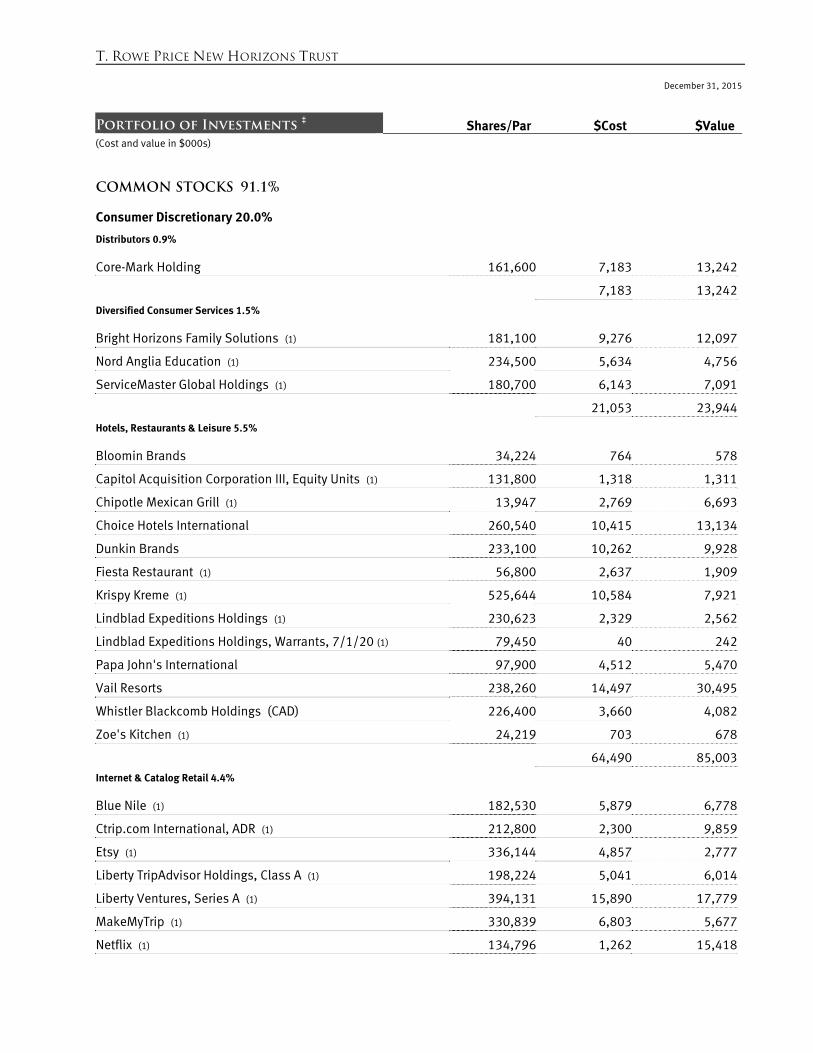
T. ROWE PRICE NEW HORIZONS TRUST December 31, 2015
Portfolio of Investments ‡ Shares/Par $Cost $Value(Cost and value in $000s)
COMMON STOCKS 91.1%
Consumer Discretionary 20.0%
Distributors 0.9%
Core-Mark Holding 161,600 7,183 13,242
7,183 13,242Diversified Consumer Services 1.5%
Bright Horizons Family Solutions (1) 181,100 9,276 12,097
Nord Anglia Education (1) 234,500 5,634 4,756
ServiceMaster Global Holdings (1) 180,700 6,143 7,091
21,053 23,944Hotels, Restaurants & Leisure 5.5%
Bloomin Brands 34,224 764 578
Capitol Acquisition Corporation III, Equity Units (1) 131,800 1,318 1,311
Chipotle Mexican Grill (1) 13,947 2,769 6,693
Choice Hotels International 260,540 10,415 13,134
Dunkin Brands 233,100 10,262 9,928
Fiesta Restaurant (1) 56,800 2,637 1,909
Krispy Kreme (1) 525,644 10,584 7,921
Lindblad Expeditions Holdings (1) 230,623 2,329 2,562
Lindblad Expeditions Holdings, Warrants, 7/1/20 (1) 79,450 40 242
Papa John's International 97,900 4,512 5,470
Vail Resorts 238,260 14,497 30,495
Whistler Blackcomb Holdings (CAD) 226,400 3,660 4,082
Zoe's Kitchen (1) 24,219 703 678
64,490 85,003Internet & Catalog Retail 4.4%
Blue Nile (1) 182,530 5,879 6,778
Ctrip.com International, ADR (1) 212,800 2,300 9,859
Etsy (1) 336,144 4,857 2,777
Liberty TripAdvisor Holdings, Class A (1) 198,224 5,041 6,014
Liberty Ventures, Series A (1) 394,131 15,890 17,779
MakeMyTrip (1) 330,839 6,803 5,677
Netflix (1) 134,796 1,262 15,418
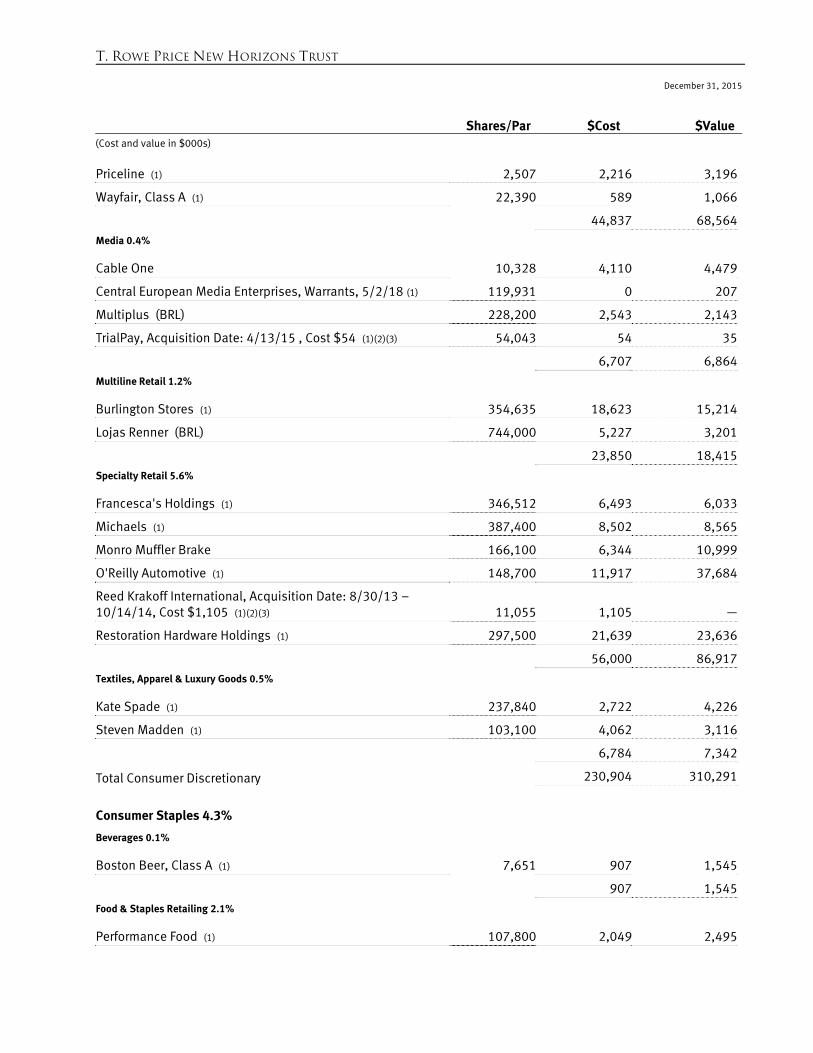
T. ROWE PRICE NEW HORIZONS TRUST December 31, 2015
Shares/Par $Cost $Value(Cost and value in $000s)
Priceline (1) 2,507 2,216 3,196
Wayfair, Class A (1) 22,390 589 1,066
44,837 68,564Media 0.4%
Cable One 10,328 4,110 4,479
Central European Media Enterprises, Warrants, 5/2/18 (1) 119,931 0 207
Multiplus (BRL) 228,200 2,543 2,143
TrialPay, Acquisition Date: 4/13/15 , Cost $54 (1)(2)(3) 54,043 54 35
6,707 6,864Multiline Retail 1.2%
Burlington Stores (1) 354,635 18,623 15,214
Lojas Renner (BRL) 744,000 5,227 3,201
23,850 18,415Specialty Retail 5.6%
Francesca's Holdings (1) 346,512 6,493 6,033
Michaels (1) 387,400 8,502 8,565
Monro Muffler Brake 166,100 6,344 10,999
O'Reilly Automotive (1) 148,700 11,917 37,684
Reed Krakoff International, Acquisition Date: 8/30/13 – 10/14/14, Cost $1,105 (1)(2)(3) 11,055 1,105 —
Restoration Hardware Holdings (1) 297,500 21,639 23,636
56,000 86,917Textiles, Apparel & Luxury Goods 0.5%
Kate Spade (1) 237,840 2,722 4,226
Steven Madden (1) 103,100 4,062 3,116
6,784 7,342
Total Consumer Discretionary 230,904 310,291
Consumer Staples 4.3%
Beverages 0.1%
Boston Beer, Class A (1) 7,651 907 1,545
907 1,545Food & Staples Retailing 2.1%
Performance Food (1) 107,800 2,049 2,495
T. ROWE PRICE NEW HORIZONS TRUST December 31, 2015
Shares/Par $Cost $Value(Cost and value in $000s)
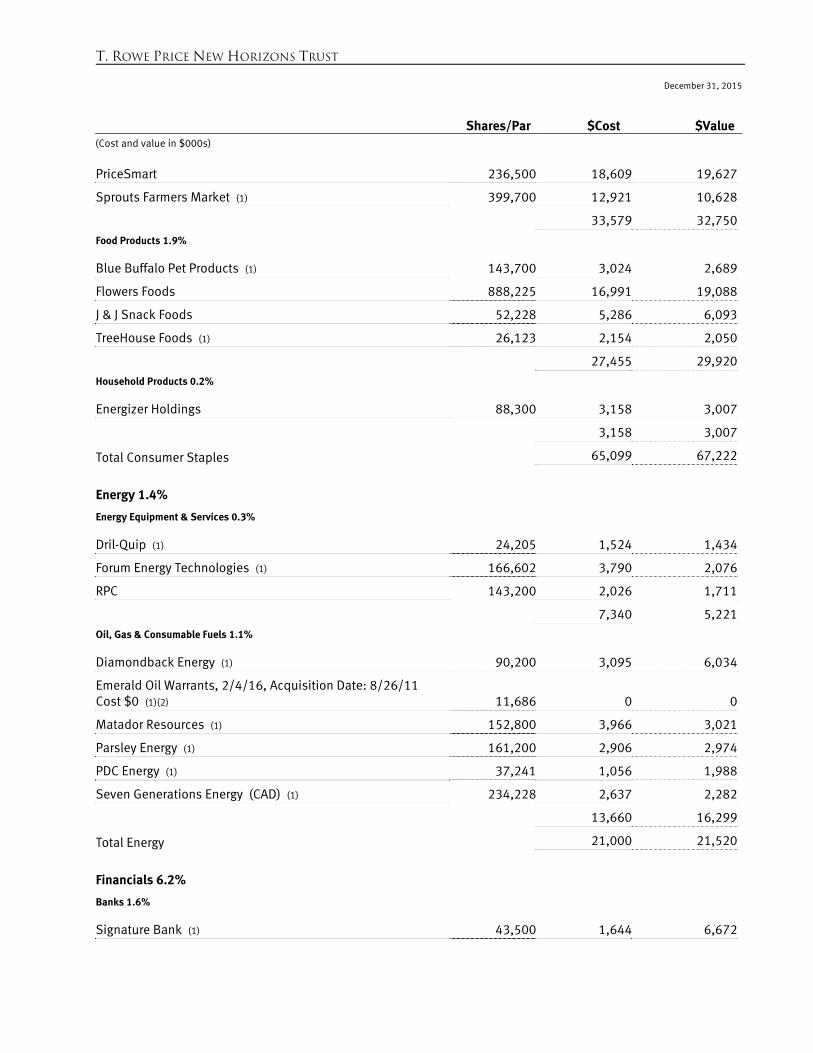
PriceSmart 236,500 18,609 19,627
Sprouts Farmers Market (1) 399,700 12,921 10,628
33,579 32,750Food Products 1.9%
Blue Buffalo Pet Products (1) 143,700 3,024 2,689
Flowers Foods 888,225 16,991 19,088
J & J Snack Foods 52,228 5,286 6,093
TreeHouse Foods (1) 26,123 2,154 2,050
27,455 29,920Household Products 0.2%
Energizer Holdings 88,300 3,158 3,007
3,158 3,007
Total Consumer Staples 65,099 67,222
Energy 1.4%
Energy Equipment & Services 0.3%
Dril-Quip (1) 24,205 1,524 1,434
Forum Energy Technologies (1) 166,602 3,790 2,076
RPC 143,200 2,026 1,711
7,340 5,221Oil, Gas & Consumable Fuels 1.1%
Diamondback Energy (1) 90,200 3,095 6,034
Emerald Oil Warrants, 2/4/16, Acquisition Date: 8/26/11 Cost $0 (1)(2) 11,686 0 0
Matador Resources (1) 152,800 3,966 3,021
Parsley Energy (1) 161,200 2,906 2,974
PDC Energy (1) 37,241 1,056 1,988
Seven Generations Energy (CAD) (1) 234,228 2,637 2,282
13,660 16,299
Total Energy 21,000 21,520
Financials 6.2%
Banks 1.6%
Signature Bank (1) 43,500 1,644 6,672
T. ROWE PRICE NEW HORIZONS TRUST December 31, 2015
Shares/Par $Cost $Value(Cost and value in $000s)
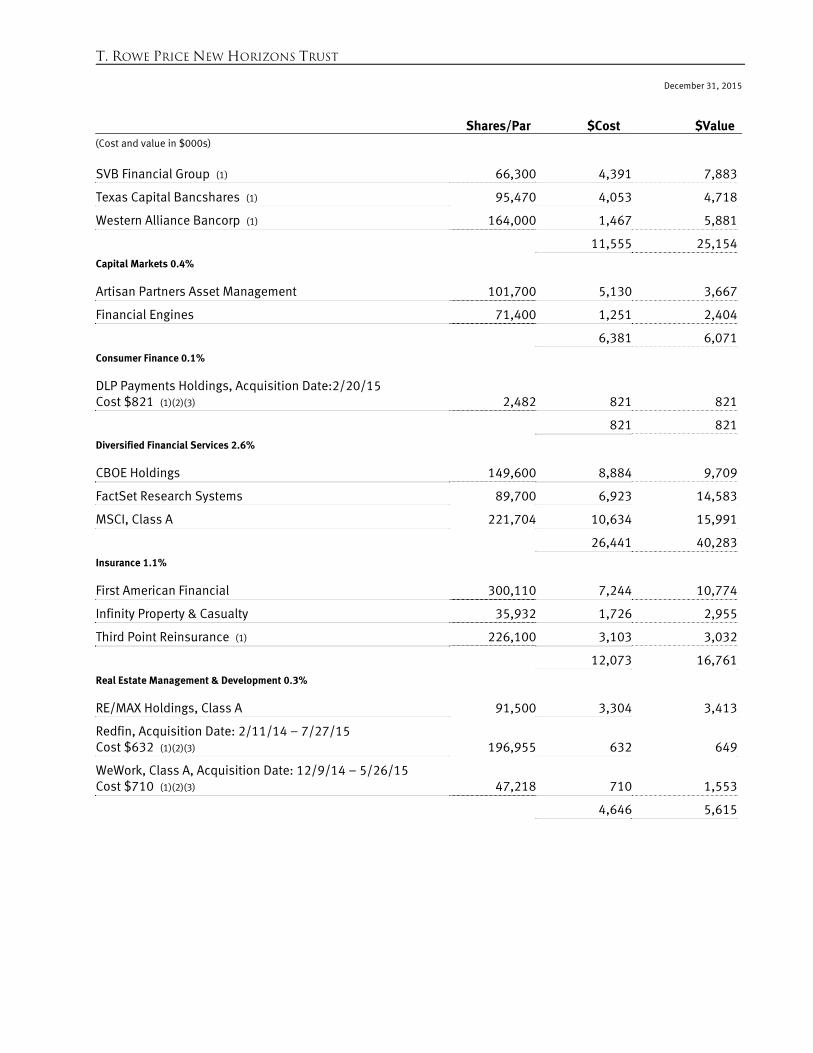
SVB Financial Group (1) 66,300 4,391 7,883
Texas Capital Bancshares (1) 95,470 4,053 4,718
Western Alliance Bancorp (1) 164,000 1,467 5,881
11,555 25,154Capital Markets 0.4%
Artisan Partners Asset Management 101,700 5,130 3,667
Financial Engines 71,400 1,251 2,404
6,381 6,071Consumer Finance 0.1%
DLP Payments Holdings, Acquisition Date:2/20/15 Cost $821 (1)(2)(3) 2,482 821 821
821 821Diversified Financial Services 2.6%
CBOE Holdings 149,600 8,884 9,709
FactSet Research Systems 89,700 6,923 14,583
MSCI, Class A 221,704 10,634 15,991
26,441 40,283Insurance 1.1%
First American Financial 300,110 7,244 10,774
Infinity Property & Casualty 35,932 1,726 2,955
Third Point Reinsurance (1) 226,100 3,103 3,032
12,073 16,761Real Estate Management & Development 0.3%
RE/MAX Holdings, Class A 91,500 3,304 3,413
Redfin, Acquisition Date: 2/11/14 – 7/27/15 Cost $632 (1)(2)(3) 196,955 632 649
WeWork, Class A, Acquisition Date: 12/9/14 – 5/26/15 Cost $710 (1)(2)(3) 47,218 710 1,553
4,646 5,615
T. ROWE PRICE NEW HORIZONS TRUST December 31, 2015
Shares/Par $Cost $Value(Cost and value in $000s)
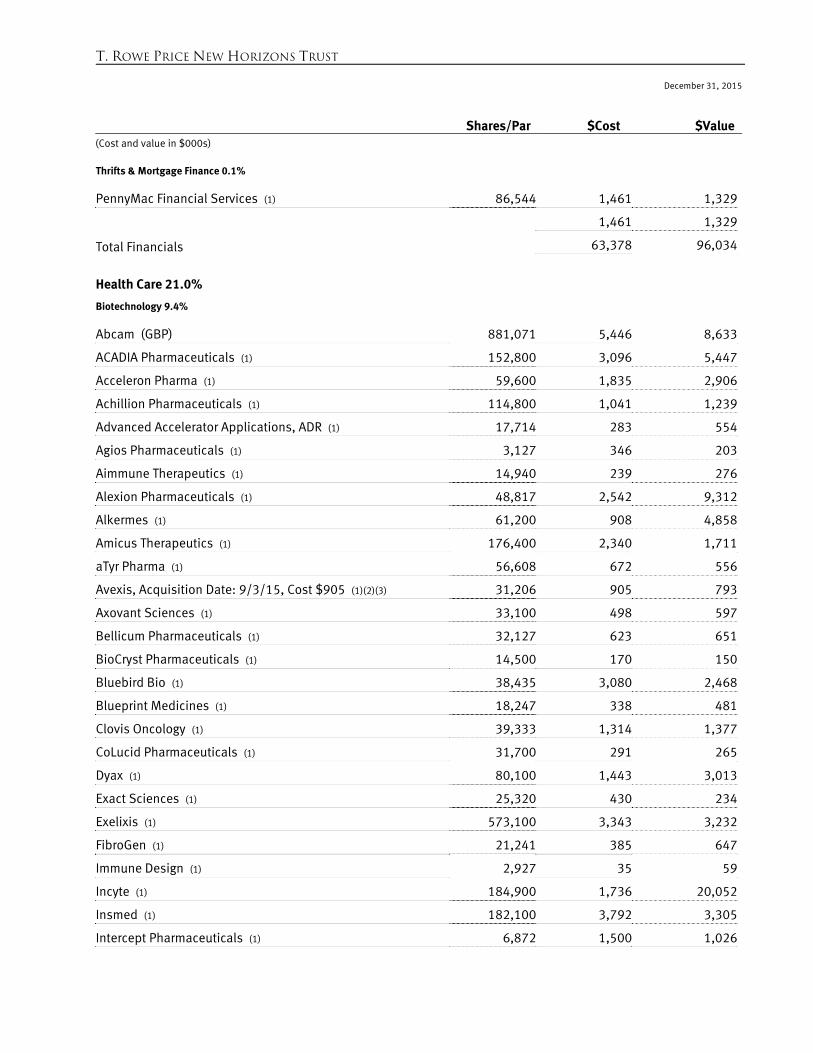
Thrifts & Mortgage Finance 0.1%
PennyMac Financial Services (1) 86,544 1,461 1,329
1,461 1,329
Total Financials 63,378 96,034
Health Care 21.0%
Biotechnology 9.4%
Abcam (GBP) 881,071 5,446 8,633
ACADIA Pharmaceuticals (1) 152,800 3,096 5,447
Acceleron Pharma (1) 59,600 1,835 2,906
Achillion Pharmaceuticals (1) 114,800 1,041 1,239
Advanced Accelerator Applications, ADR (1) 17,714 283 554
Agios Pharmaceuticals (1) 3,127 346 203
Aimmune Therapeutics (1) 14,940 239 276
Alexion Pharmaceuticals (1) 48,817 2,542 9,312
Alkermes (1) 61,200 908 4,858
Amicus Therapeutics (1) 176,400 2,340 1,711
aTyr Pharma (1) 56,608 672 556
Avexis, Acquisition Date: 9/3/15, Cost $905 (1)(2)(3) 31,206 905 793
Axovant Sciences (1) 33,100 498 597
Bellicum Pharmaceuticals (1) 32,127 623 651
BioCryst Pharmaceuticals (1) 14,500 170 150
Bluebird Bio (1) 38,435 3,080 2,468
Blueprint Medicines (1) 18,247 338 481
Clovis Oncology (1) 39,333 1,314 1,377
CoLucid Pharmaceuticals (1) 31,700 291 265
Dyax (1) 80,100 1,443 3,013
Exact Sciences (1) 25,320 430 234
Exelixis (1) 573,100 3,343 3,232
FibroGen (1) 21,241 385 647
Immune Design (1) 2,927 35 59
Incyte (1) 184,900 1,736 20,052
Insmed (1) 182,100 3,792 3,305
Intercept Pharmaceuticals (1) 6,872 1,500 1,026
T. ROWE PRICE NEW HORIZONS TRUST December 31, 2015
Shares/Par $Cost $Value(Cost and value in $000s)
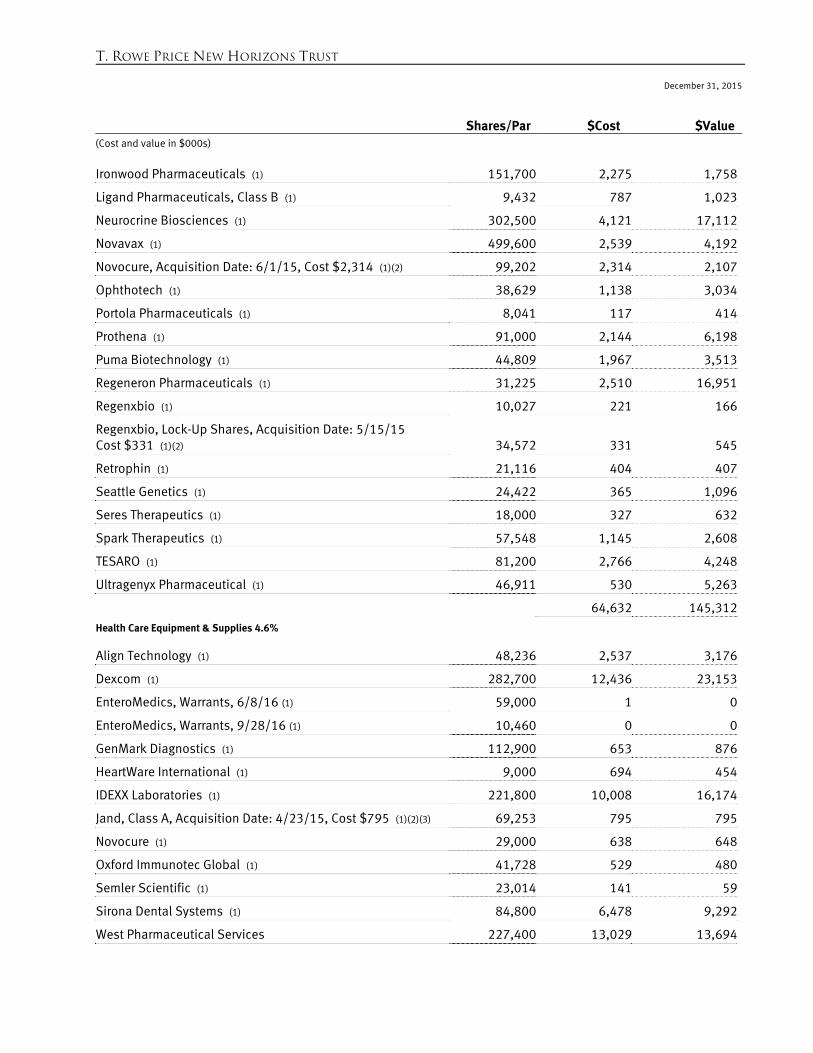
Ironwood Pharmaceuticals (1) 151,700 2,275 1,758
Ligand Pharmaceuticals, Class B (1) 9,432 787 1,023
Neurocrine Biosciences (1) 302,500 4,121 17,112
Novavax (1) 499,600 2,539 4,192
Novocure, Acquisition Date: 6/1/15, Cost $2,314 (1)(2) 99,202 2,314 2,107
Ophthotech (1) 38,629 1,138 3,034
Portola Pharmaceuticals (1) 8,041 117 414
Prothena (1) 91,000 2,144 6,198
Puma Biotechnology (1) 44,809 1,967 3,513
Regeneron Pharmaceuticals (1) 31,225 2,510 16,951
Regenxbio (1) 10,027 221 166
Regenxbio, Lock-Up Shares, Acquisition Date: 5/15/15 Cost $331 (1)(2) 34,572 331 545
Retrophin (1) 21,116 404 407
Seattle Genetics (1) 24,422 365 1,096
Seres Therapeutics (1) 18,000 327 632
Spark Therapeutics (1) 57,548 1,145 2,608
TESARO (1) 81,200 2,766 4,248
Ultragenyx Pharmaceutical (1) 46,911 530 5,263
64,632 145,312Health Care Equipment & Supplies 4.6%
Align Technology (1) 48,236 2,537 3,176
Dexcom (1) 282,700 12,436 23,153
EnteroMedics, Warrants, 6/8/16 (1) 59,000 1 0
EnteroMedics, Warrants, 9/28/16 (1) 10,460 0 0
GenMark Diagnostics (1) 112,900 653 876
HeartWare International (1) 9,000 694 454
IDEXX Laboratories (1) 221,800 10,008 16,174
Jand, Class A, Acquisition Date: 4/23/15, Cost $795 (1)(2)(3) 69,253 795 795
Novocure (1) 29,000 638 648
Oxford Immunotec Global (1) 41,728 529 480
Semler Scientific (1) 23,014 141 59
Sirona Dental Systems (1) 84,800 6,478 9,292
West Pharmaceutical Services 227,400 13,029 13,694
T. ROWE PRICE NEW HORIZONS TRUST December 31, 2015
Shares/Par $Cost $Value(Cost and value in $000s)
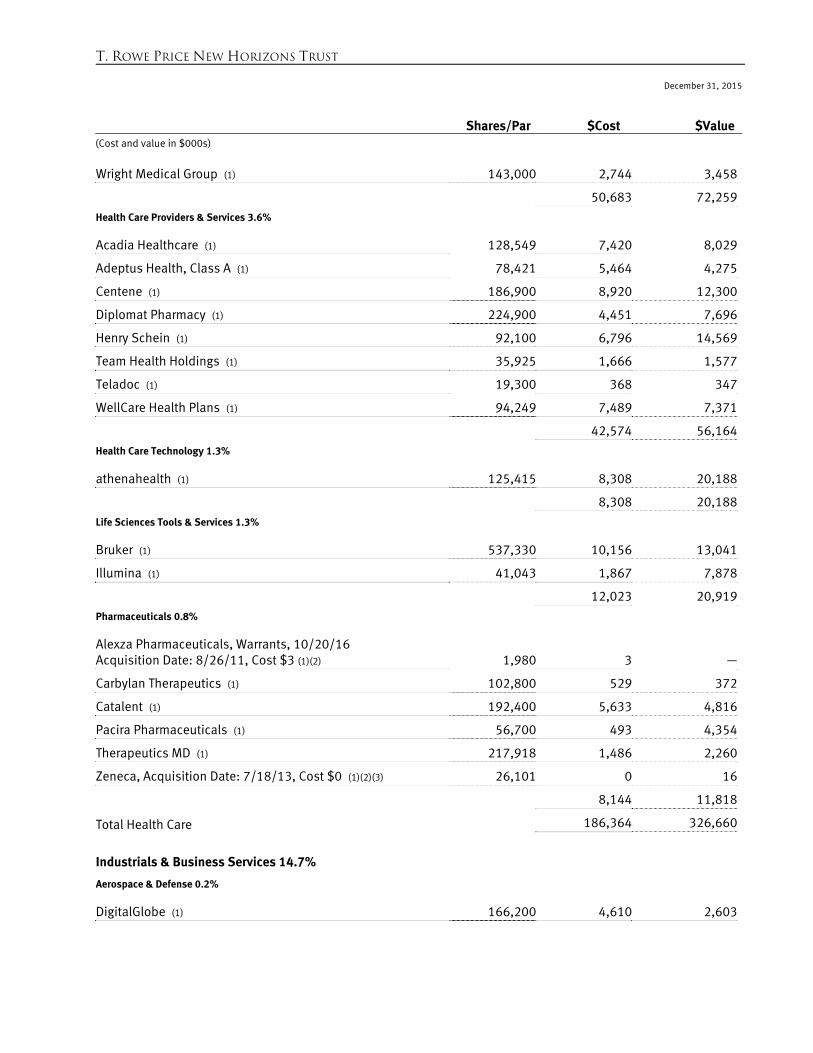
Wright Medical Group (1) 143,000 2,744 3,458
50,683 72,259Health Care Providers & Services 3.6%
Acadia Healthcare (1) 128,549 7,420 8,029
Adeptus Health, Class A (1) 78,421 5,464 4,275
Centene (1) 186,900 8,920 12,300
Diplomat Pharmacy (1) 224,900 4,451 7,696
Henry Schein (1) 92,100 6,796 14,569
Team Health Holdings (1) 35,925 1,666 1,577
Teladoc (1) 19,300 368 347
WellCare Health Plans (1) 94,249 7,489 7,371
42,574 56,164Health Care Technology 1.3%
athenahealth (1) 125,415 8,308 20,188
8,308 20,188Life Sciences Tools & Services 1.3%
Bruker (1) 537,330 10,156 13,041
Illumina (1) 41,043 1,867 7,878
12,023 20,919Pharmaceuticals 0.8%
Alexza Pharmaceuticals, Warrants, 10/20/16 Acquisition Date: 8/26/11, Cost $3 (1)(2) 1,980 3 —
Carbylan Therapeutics (1) 102,800 529 372
Catalent (1) 192,400 5,633 4,816
Pacira Pharmaceuticals (1) 56,700 493 4,354
Therapeutics MD (1) 217,918 1,486 2,260
Zeneca, Acquisition Date: 7/18/13, Cost $0 (1)(2)(3) 26,101 0 16
8,144 11,818
Total Health Care 186,364 326,660
Industrials & Business Services 14.7%
Aerospace & Defense 0.2%
DigitalGlobe (1) 166,200 4,610 2,603
T. ROWE PRICE NEW HORIZONS TRUST December 31, 2015
Shares/Par $Cost $Value(Cost and value in $000s)
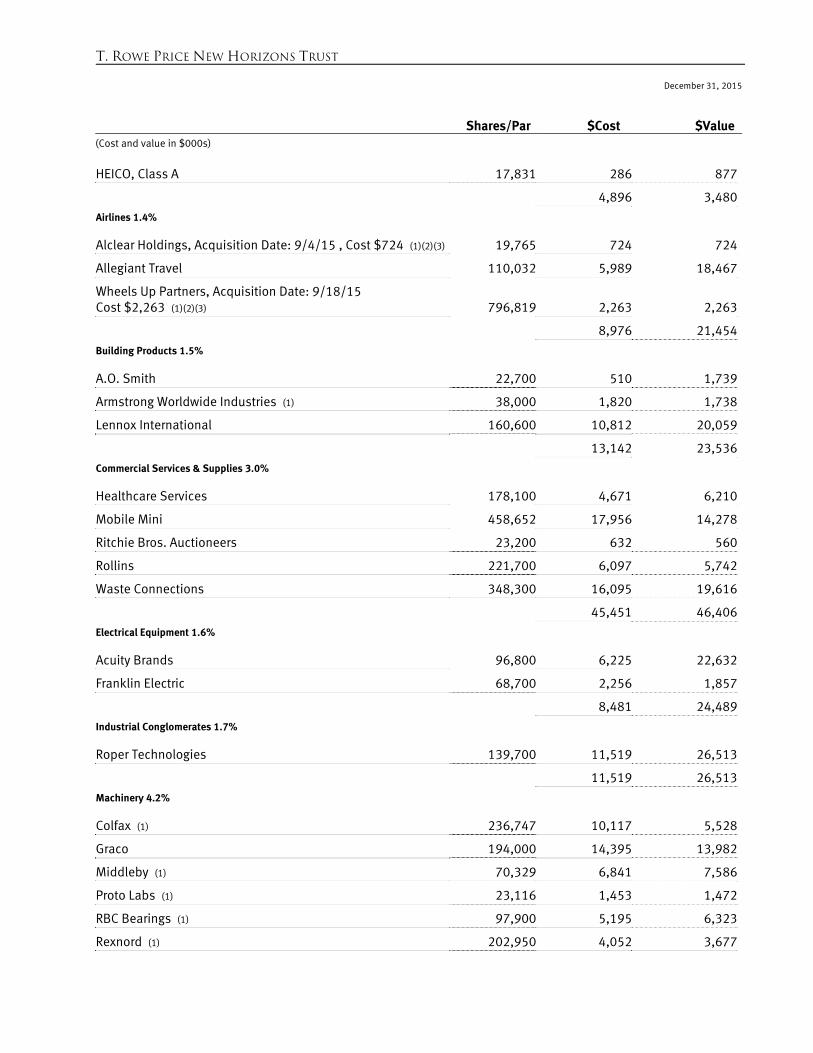
HEICO, Class A 17,831 286 877
4,896 3,480Airlines 1.4%
Alclear Holdings, Acquisition Date: 9/4/15 , Cost $724 (1)(2)(3) 19,765 724 724
Allegiant Travel 110,032 5,989 18,467
Wheels Up Partners, Acquisition Date: 9/18/15 Cost $2,263 (1)(2)(3) 796,819 2,263 2,263
8,976 21,454Building Products 1.5%
A.O. Smith 22,700 510 1,739
Armstrong Worldwide Industries (1) 38,000 1,820 1,738
Lennox International 160,600 10,812 20,059
13,142 23,536Commercial Services & Supplies 3.0%
Healthcare Services 178,100 4,671 6,210
Mobile Mini 458,652 17,956 14,278
Ritchie Bros. Auctioneers 23,200 632 560
Rollins 221,700 6,097 5,742
Waste Connections 348,300 16,095 19,616
45,451 46,406Electrical Equipment 1.6%
Acuity Brands 96,800 6,225 22,632
Franklin Electric 68,700 2,256 1,857
8,481 24,489Industrial Conglomerates 1.7%
Roper Technologies 139,700 11,519 26,513
11,519 26,513Machinery 4.2%
Colfax (1) 236,747 10,117 5,528
Graco 194,000 14,395 13,982
Middleby (1) 70,329 6,841 7,586
Proto Labs (1) 23,116 1,453 1,472
RBC Bearings (1) 97,900 5,195 6,323
Rexnord (1) 202,950 4,052 3,677
T. ROWE PRICE NEW HORIZONS TRUST December 31, 2015
Shares/Par $Cost $Value(Cost and value in $000s)
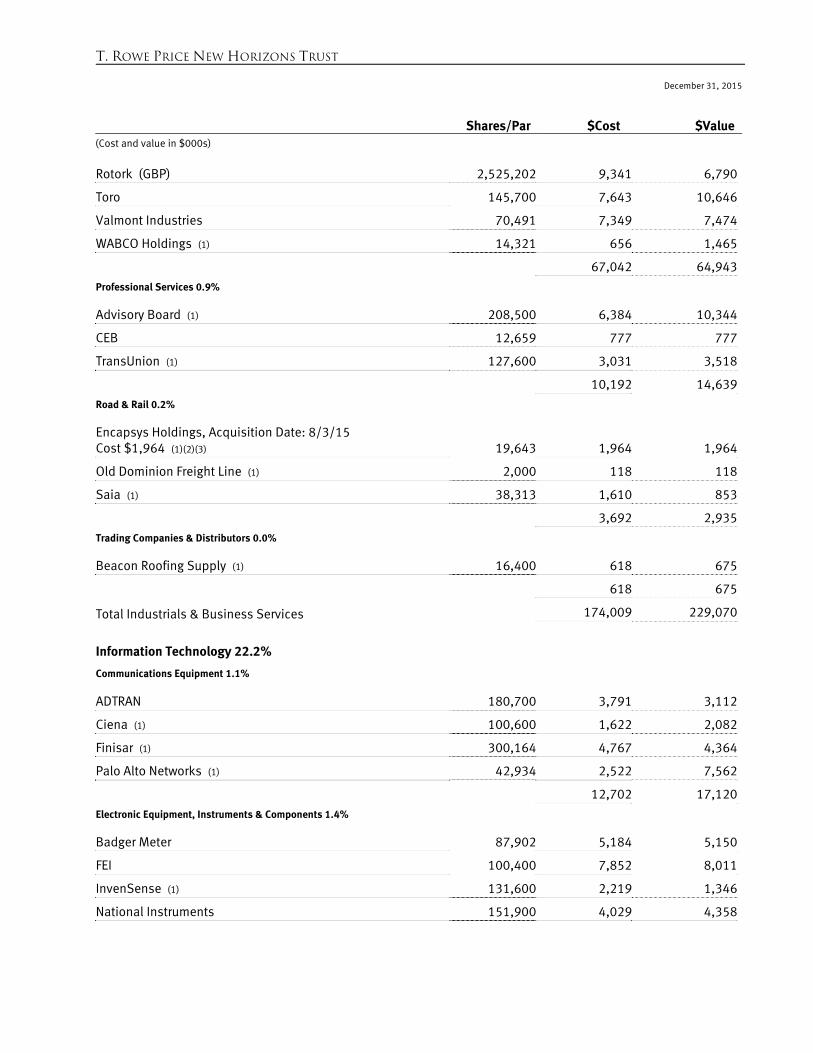
Rotork (GBP) 2,525,202 9,341 6,790
Toro 145,700 7,643 10,646
Valmont Industries 70,491 7,349 7,474
WABCO Holdings (1) 14,321 656 1,465
67,042 64,943Professional Services 0.9%
Advisory Board (1) 208,500 6,384 10,344
CEB 12,659 777 777
TransUnion (1) 127,600 3,031 3,518
10,192 14,639Road & Rail 0.2%
Encapsys Holdings, Acquisition Date: 8/3/15 Cost $1,964 (1)(2)(3) 19,643 1,964 1,964
Old Dominion Freight Line (1) 2,000 118 118
Saia (1) 38,313 1,610 853
3,692 2,935Trading Companies & Distributors 0.0%
Beacon Roofing Supply (1) 16,400 618 675
618 675
Total Industrials & Business Services 174,009 229,070
Information Technology 22.2%
Communications Equipment 1.1%
ADTRAN 180,700 3,791 3,112
Ciena (1) 100,600 1,622 2,082
Finisar (1) 300,164 4,767 4,364
Palo Alto Networks (1) 42,934 2,522 7,562
12,702 17,120Electronic Equipment, Instruments & Components 1.4%
Badger Meter 87,902 5,184 5,150
FEI 100,400 7,852 8,011
InvenSense (1) 131,600 2,219 1,346
National Instruments 151,900 4,029 4,358
T. ROWE PRICE NEW HORIZONS TRUST December 31, 2015
Shares/Par $Cost $Value(Cost and value in $000s)
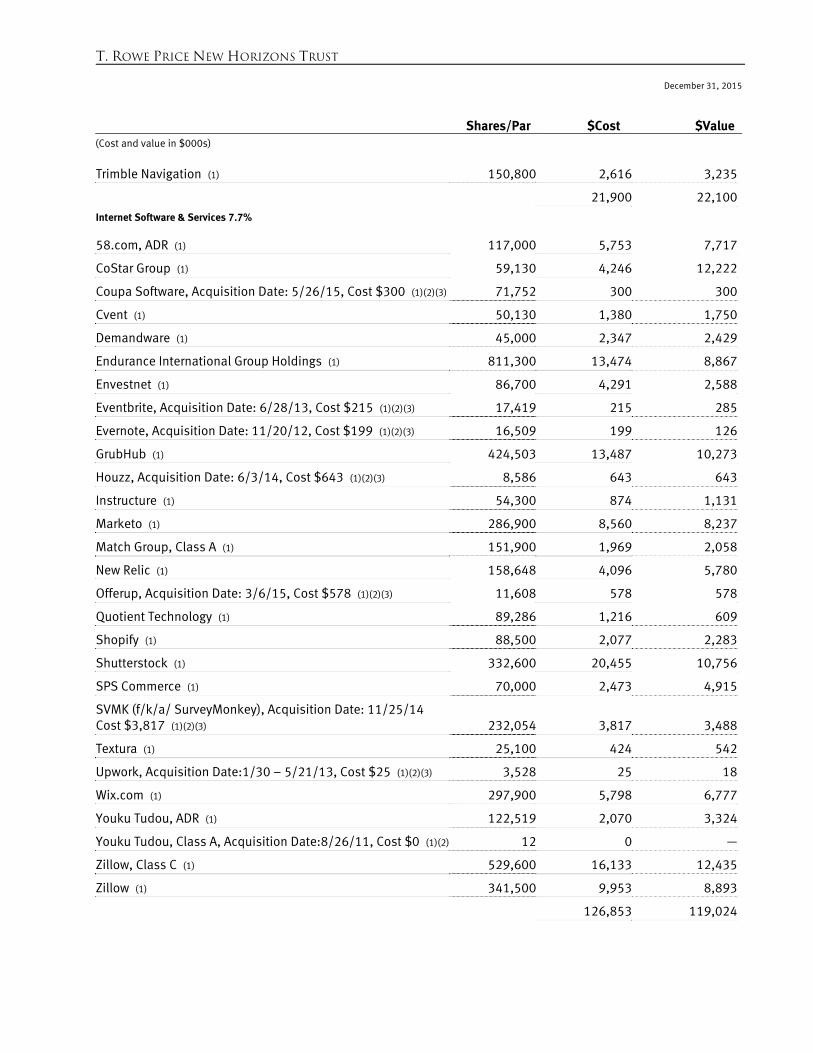
Trimble Navigation (1) 150,800 2,616 3,235
21,900 22,100Internet Software & Services 7.7%
58.com, ADR (1) 117,000 5,753 7,717
CoStar Group (1) 59,130 4,246 12,222
Coupa Software, Acquisition Date: 5/26/15, Cost $300 (1)(2)(3) 71,752 300 300
Cvent (1) 50,130 1,380 1,750
Demandware (1) 45,000 2,347 2,429
Endurance International Group Holdings (1) 811,300 13,474 8,867
Envestnet (1) 86,700 4,291 2,588
Eventbrite, Acquisition Date: 6/28/13, Cost $215 (1)(2)(3) 17,419 215 285
Evernote, Acquisition Date: 11/20/12, Cost $199 (1)(2)(3) 16,509 199 126
GrubHub (1) 424,503 13,487 10,273
Houzz, Acquisition Date: 6/3/14, Cost $643 (1)(2)(3) 8,586 643 643
Instructure (1) 54,300 874 1,131
Marketo (1) 286,900 8,560 8,237
Match Group, Class A (1) 151,900 1,969 2,058
New Relic (1) 158,648 4,096 5,780
Offerup, Acquisition Date: 3/6/15, Cost $578 (1)(2)(3) 11,608 578 578
Quotient Technology (1) 89,286 1,216 609
Shopify (1) 88,500 2,077 2,283
Shutterstock (1) 332,600 20,455 10,756
SPS Commerce (1) 70,000 2,473 4,915
SVMK (f/k/a/ SurveyMonkey), Acquisition Date: 11/25/14 Cost $3,817 (1)(2)(3) 232,054 3,817 3,488
Textura (1) 25,100 424 542
Upwork, Acquisition Date:1/30 – 5/21/13, Cost $25 (1)(2)(3) 3,528 25 18
Wix.com (1) 297,900 5,798 6,777
Youku Tudou, ADR (1) 122,519 2,070 3,324
Youku Tudou, Class A, Acquisition Date:8/26/11, Cost $0 (1)(2) 12 0 —
Zillow, Class C (1) 529,600 16,133 12,435
Zillow (1) 341,500 9,953 8,893
126,853 119,024
T. ROWE PRICE NEW HORIZONS TRUST December 31, 2015
Shares/Par $Cost $Value(Cost and value in $000s)
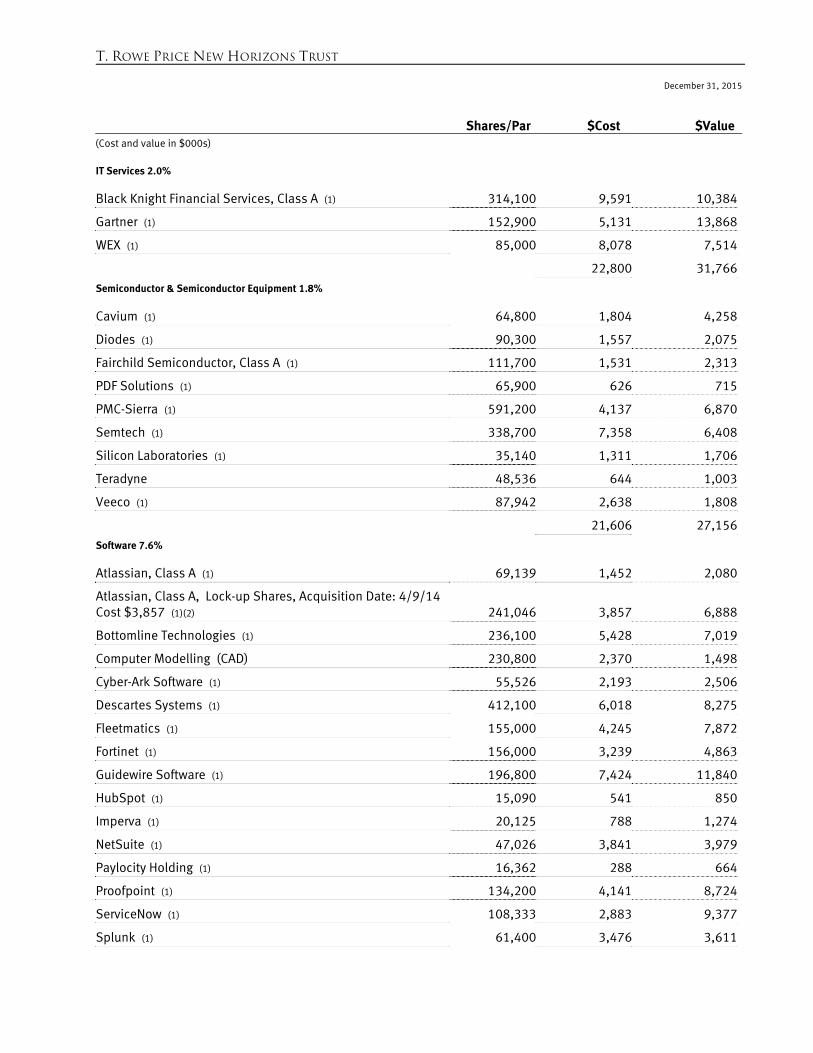
IT Services 2.0%
Black Knight Financial Services, Class A (1) 314,100 9,591 10,384
Gartner (1) 152,900 5,131 13,868
WEX (1) 85,000 8,078 7,514
22,800 31,766Semiconductor & Semiconductor Equipment 1.8%
Cavium (1) 64,800 1,804 4,258
Diodes (1) 90,300 1,557 2,075
Fairchild Semiconductor, Class A (1) 111,700 1,531 2,313
PDF Solutions (1) 65,900 626 715
PMC-Sierra (1) 591,200 4,137 6,870
Semtech (1) 338,700 7,358 6,408
Silicon Laboratories (1) 35,140 1,311 1,706
Teradyne 48,536 644 1,003
Veeco (1) 87,942 2,638 1,808
21,606 27,156Software 7.6%
Atlassian, Class A (1) 69,139 1,452 2,080
Atlassian, Class A, Lock-up Shares, Acquisition Date: 4/9/14 Cost $3,857 (1)(2) 241,046 3,857 6,888
Bottomline Technologies (1) 236,100 5,428 7,019
Computer Modelling (CAD) 230,800 2,370 1,498
Cyber-Ark Software (1) 55,526 2,193 2,506
Descartes Systems (1) 412,100 6,018 8,275
Fleetmatics (1) 155,000 4,245 7,872
Fortinet (1) 156,000 3,239 4,863
Guidewire Software (1) 196,800 7,424 11,840
HubSpot (1) 15,090 541 850
Imperva (1) 20,125 788 1,274
NetSuite (1) 47,026 3,841 3,979
Paylocity Holding (1) 16,362 288 664
Proofpoint (1) 134,200 4,141 8,724
ServiceNow (1) 108,333 2,883 9,377
Splunk (1) 61,400 3,476 3,611
T. ROWE PRICE NEW HORIZONS TRUST December 31, 2015
Shares/Par $Cost $Value(Cost and value in $000s)
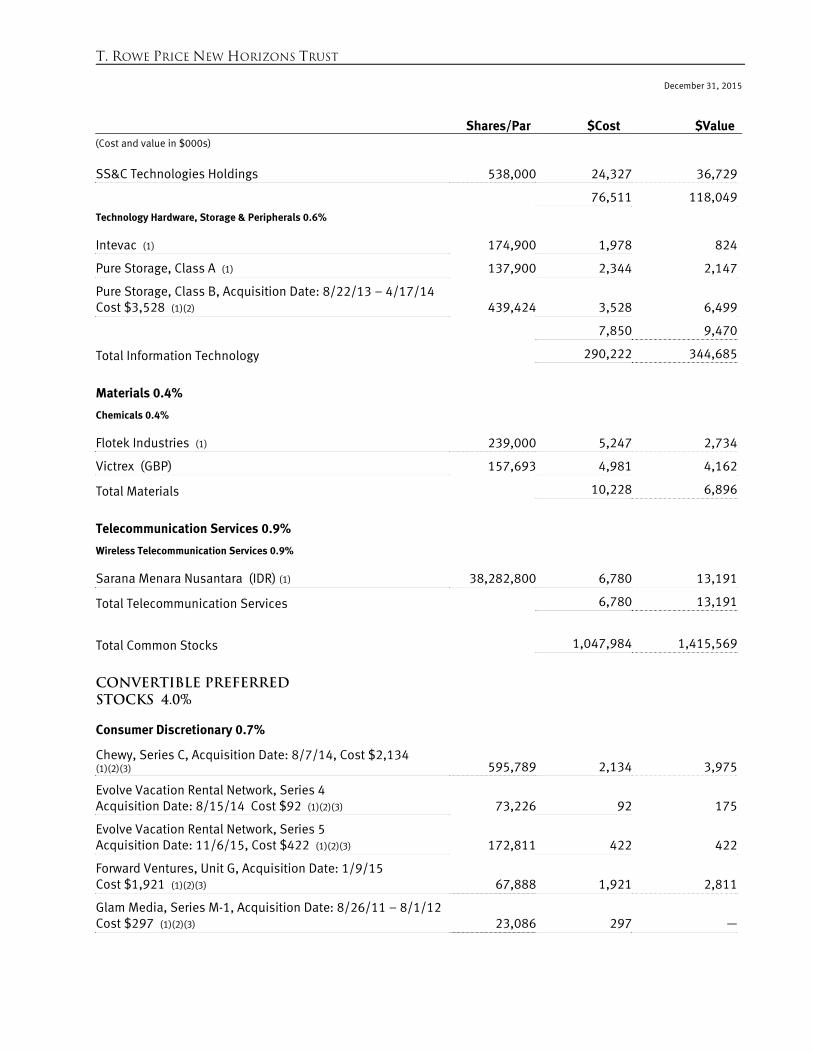
SS&C Technologies Holdings 538,000 24,327 36,729
76,511 118,049Technology Hardware, Storage & Peripherals 0.6%
Intevac (1) 174,900 1,978 824
Pure Storage, Class A (1) 137,900 2,344 2,147
Pure Storage, Class B, Acquisition Date: 8/22/13 – 4/17/14 Cost $3,528 (1)(2) 439,424 3,528 6,499
7,850 9,470
Total Information Technology 290,222 344,685
Materials 0.4%
Chemicals 0.4%
Flotek Industries (1) 239,000 5,247 2,734
Victrex (GBP) 157,693 4,981 4,162
Total Materials 10,228 6,896
Telecommunication Services 0.9%
Wireless Telecommunication Services 0.9%
Sarana Menara Nusantara (IDR) (1) 38,282,800 6,780 13,191
Total Telecommunication Services 6,780 13,191
Total Common Stocks 1,047,984 1,415,569
CONVERTIBLE PREFERRED STOCKS 4.0%
Consumer Discretionary 0.7%
Chewy, Series C, Acquisition Date: 8/7/14, Cost $2,134 (1)(2)(3) 595,789 2,134 3,975
Evolve Vacation Rental Network, Series 4 Acquisition Date: 8/15/14 Cost $92 (1)(2)(3) 73,226 92 175
Evolve Vacation Rental Network, Series 5 Acquisition Date: 11/6/15, Cost $422 (1)(2)(3) 172,811 422 422
Forward Ventures, Unit G, Acquisition Date: 1/9/15 Cost $1,921 (1)(2)(3) 67,888 1,921 2,811
Glam Media, Series M-1, Acquisition Date: 8/26/11 – 8/1/12 Cost $297 (1)(2)(3) 23,086 297 —
T. ROWE PRICE NEW HORIZONS TRUST December 31, 2015
Shares/Par $Cost $Value(Cost and value in $000s)
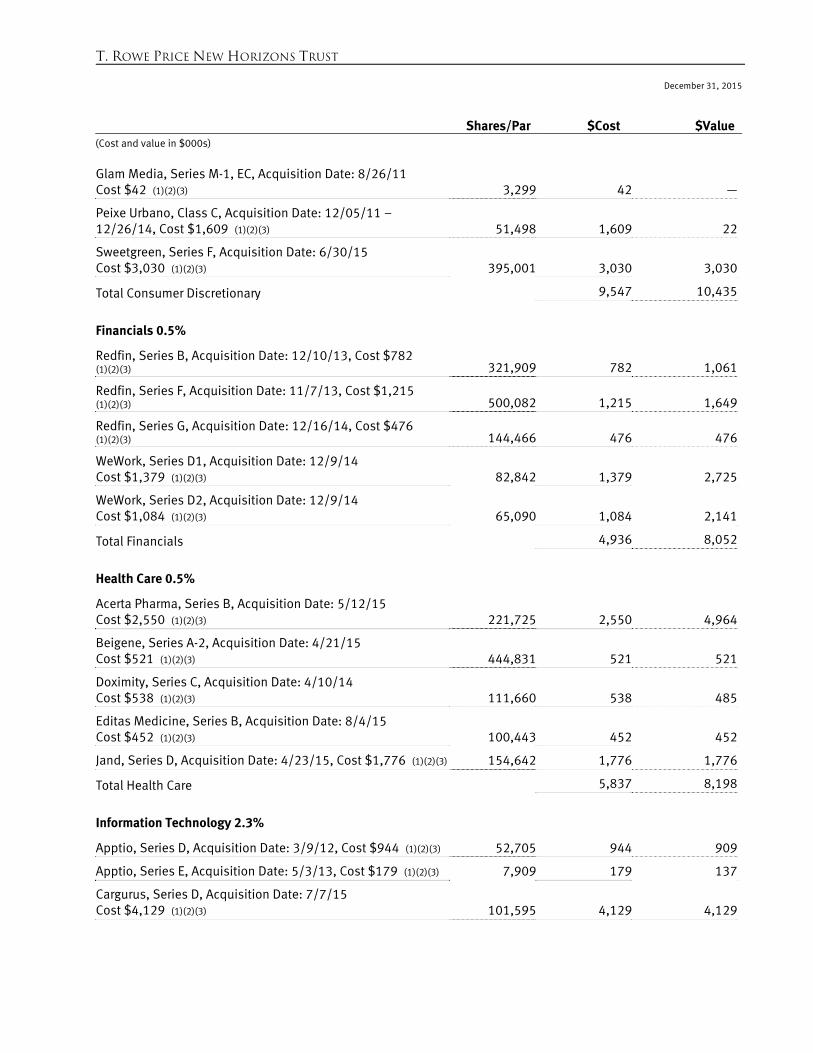
Glam Media, Series M-1, EC, Acquisition Date: 8/26/11 Cost $42 (1)(2)(3) 3,299 42 —
Peixe Urbano, Class C, Acquisition Date: 12/05/11 – 12/26/14, Cost $1,609 (1)(2)(3) 51,498 1,609 22
Sweetgreen, Series F, Acquisition Date: 6/30/15 Cost $3,030 (1)(2)(3) 395,001 3,030 3,030
Total Consumer Discretionary 9,547 10,435
Financials 0.5%
Redfin, Series B, Acquisition Date: 12/10/13, Cost $782 (1)(2)(3) 321,909 782 1,061
Redfin, Series F, Acquisition Date: 11/7/13, Cost $1,215 (1)(2)(3) 500,082 1,215 1,649
Redfin, Series G, Acquisition Date: 12/16/14, Cost $476 (1)(2)(3) 144,466 476 476
WeWork, Series D1, Acquisition Date: 12/9/14 Cost $1,379 (1)(2)(3) 82,842 1,379 2,725
WeWork, Series D2, Acquisition Date: 12/9/14 Cost $1,084 (1)(2)(3) 65,090 1,084 2,141
Total Financials 4,936 8,052
Health Care 0.5%
Acerta Pharma, Series B, Acquisition Date: 5/12/15 Cost $2,550 (1)(2)(3) 221,725 2,550 4,964
Beigene, Series A-2, Acquisition Date: 4/21/15 Cost $521 (1)(2)(3) 444,831 521 521
Doximity, Series C, Acquisition Date: 4/10/14 Cost $538 (1)(2)(3) 111,660 538 485
Editas Medicine, Series B, Acquisition Date: 8/4/15 Cost $452 (1)(2)(3) 100,443 452 452
Jand, Series D, Acquisition Date: 4/23/15, Cost $1,776 (1)(2)(3) 154,642 1,776 1,776
Total Health Care 5,837 8,198
Information Technology 2.3%
Apptio, Series D, Acquisition Date: 3/9/12, Cost $944 (1)(2)(3) 52,705 944 909
Apptio, Series E, Acquisition Date: 5/3/13, Cost $179 (1)(2)(3) 7,909 179 137
Cargurus, Series D, Acquisition Date: 7/7/15 Cost $4,129 (1)(2)(3) 101,595 4,129 4,129
T. ROWE PRICE NEW HORIZONS TRUST December 31, 2015
Shares/Par $Cost $Value(Cost and value in $000s)
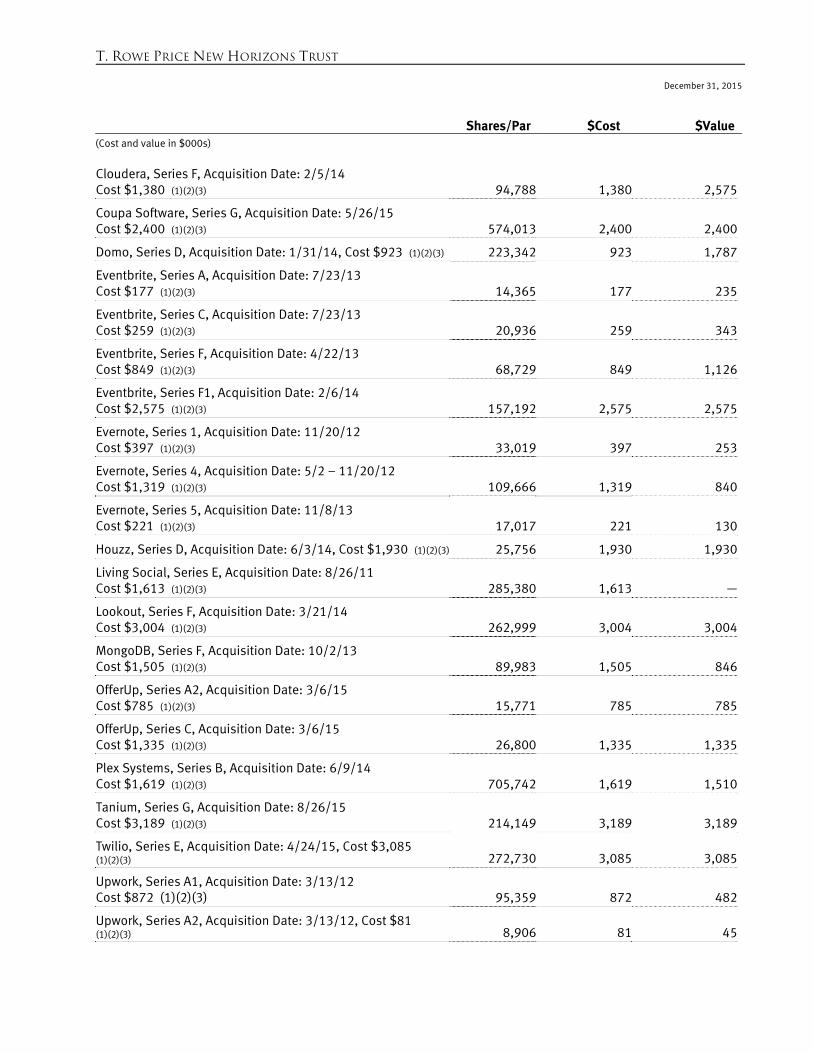
Cloudera, Series F, Acquisition Date: 2/5/14 Cost $1,380 (1)(2)(3) 94,788 1,380 2,575
Coupa Software, Series G, Acquisition Date: 5/26/15 Cost $2,400 (1)(2)(3) 574,013 2,400 2,400
Domo, Series D, Acquisition Date: 1/31/14, Cost $923 (1)(2)(3) 223,342 923 1,787
Eventbrite, Series A, Acquisition Date: 7/23/13 Cost $177 (1)(2)(3) 14,365 177 235
Eventbrite, Series C, Acquisition Date: 7/23/13 Cost $259 (1)(2)(3) 20,936 259 343
Eventbrite, Series F, Acquisition Date: 4/22/13 Cost $849 (1)(2)(3) 68,729 849 1,126
Eventbrite, Series F1, Acquisition Date: 2/6/14 Cost $2,575 (1)(2)(3) 157,192 2,575 2,575
Evernote, Series 1, Acquisition Date: 11/20/12 Cost $397 (1)(2)(3) 33,019 397 253
Evernote, Series 4, Acquisition Date: 5/2 – 11/20/12 Cost $1,319 (1)(2)(3) 109,666 1,319 840
Evernote, Series 5, Acquisition Date: 11/8/13 Cost $221 (1)(2)(3) 17,017 221 130
Houzz, Series D, Acquisition Date: 6/3/14, Cost $1,930 (1)(2)(3) 25,756 1,930 1,930
Living Social, Series E, Acquisition Date: 8/26/11 Cost $1,613 (1)(2)(3) 285,380 1,613 —
Lookout, Series F, Acquisition Date: 3/21/14 Cost $3,004 (1)(2)(3) 262,999 3,004 3,004
MongoDB, Series F, Acquisition Date: 10/2/13 Cost $1,505 (1)(2)(3) 89,983 1,505 846
OfferUp, Series A2, Acquisition Date: 3/6/15 Cost $785 (1)(2)(3) 15,771 785 785
OfferUp, Series C, Acquisition Date: 3/6/15 Cost $1,335 (1)(2)(3) 26,800 1,335 1,335
Plex Systems, Series B, Acquisition Date: 6/9/14 Cost $1,619 (1)(2)(3) 705,742 1,619 1,510
Tanium, Series G, Acquisition Date: 8/26/15 Cost $3,189 (1)(2)(3) 214,149 3,189 3,189
Twilio, Series E, Acquisition Date: 4/24/15, Cost $3,085 (1)(2)(3) 272,730 3,085 3,085
Upwork, Series A1, Acquisition Date: 3/13/12 Cost $872 (1)(2)(3) 95,359 872 482
Upwork, Series A2, Acquisition Date: 3/13/12, Cost $81 (1)(2)(3) 8,906 81 45
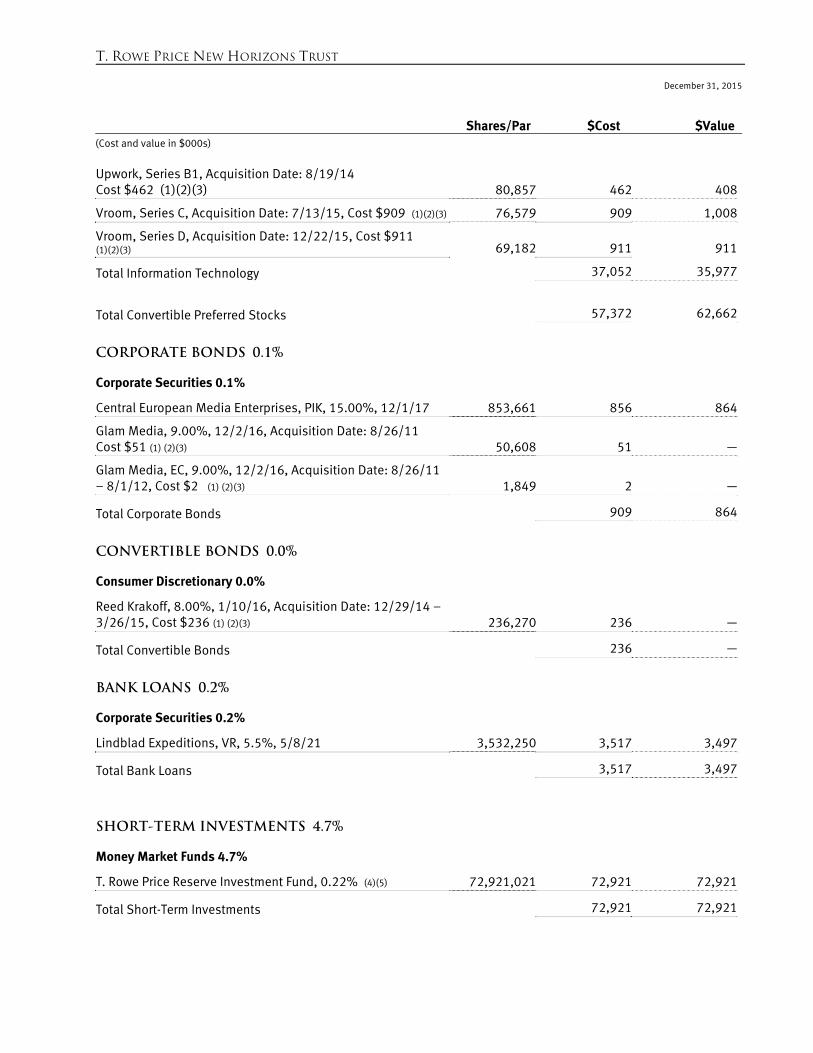
T. ROWE PRICE NEW HORIZONS TRUST December 31, 2015
Shares/Par $Cost $Value(Cost and value in $000s)
Upwork, Series B1, Acquisition Date: 8/19/14 Cost $462 (1)(2)(3) 80,857 462 408
Vroom, Series C, Acquisition Date: 7/13/15, Cost $909 (1)(2)(3) 76,579 909 1,008
Vroom, Series D, Acquisition Date: 12/22/15, Cost $911 (1)(2)(3) 69,182 911 911
Total Information Technology 37,052 35,977
Total Convertible Preferred Stocks 57,372 62,662
CORPORATE BONDS 0.1%
Corporate Securities 0.1%
Central European Media Enterprises, PIK, 15.00%, 12/1/17 853,661 856 864
Glam Media, 9.00%, 12/2/16, Acquisition Date: 8/26/11 Cost $51 (1) (2)(3) 50,608 51 —
Glam Media, EC, 9.00%, 12/2/16, Acquisition Date: 8/26/11 – 8/1/12, Cost $2 (1) (2)(3) 1,849 2 —
Total Corporate Bonds 909 864
CONVERTIBLE BONDS 0.0%
Consumer Discretionary 0.0%
Reed Krakoff, 8.00%, 1/10/16, Acquisition Date: 12/29/14 – 3/26/15, Cost $236 (1) (2)(3) 236,270 236 —
Total Convertible Bonds 236 —
BANK LOANS 0.2%
Corporate Securities 0.2%
Lindblad Expeditions, VR, 5.5%, 5/8/21 3,532,250 3,517 3,497
Total Bank Loans 3,517 3,497
SHORT-TERM INVESTMENTS 4.7%
Money Market Funds 4.7%
T. Rowe Price Reserve Investment Fund, 0.22% (4)(5) 72,921,021 72,921 72,921
Total Short-Term Investments 72,921 72,921
T. ROWE PRICE NEW HORIZONS TRUST December 31, 2015
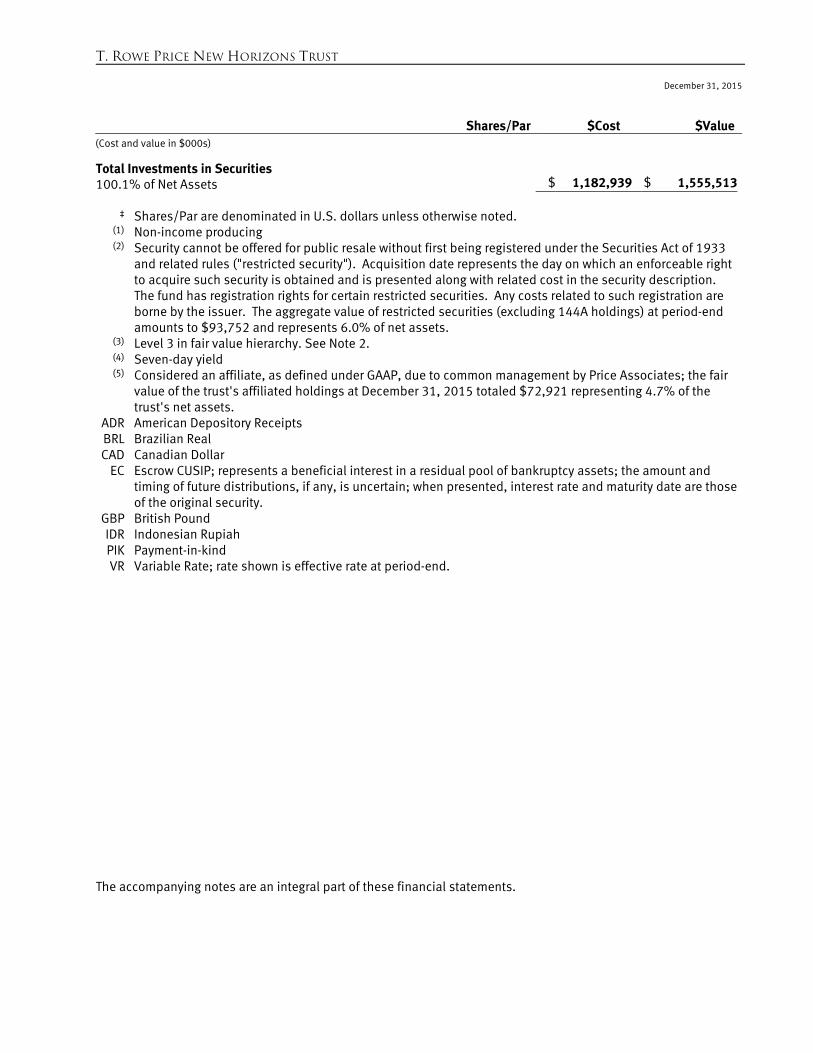
Shares/Par $Cost $Value(Cost and value in $000s) Total Investments in Securities 100.1% of Net Assets $ 1,182,939 $ 1,555,513
‡ Shares/Par are denominated in U.S. dollars unless otherwise noted.
(1) Non-income producing (2)
Security cannot be offered for public resale without first being registered under the Securities Act of 1933 and related rules ("restricted security"). Acquisition date represents the day on which an enforceable right to acquire such security is obtained and is presented along with related cost in the security description. The fund has registration rights for certain restricted securities. Any costs related to such registration are borne by the issuer. The aggregate value of restricted securities (excluding 144A holdings) at period-end amounts to $93,752 and represents 6.0% of net assets.
(3) Level 3 in fair value hierarchy. See Note 2. (4) Seven-day yield (5)
Considered an affiliate, as defined under GAAP, due to common management by Price Associates; the fair value of the trust's affiliated holdings at December 31, 2015 totaled $72,921 representing 4.7% of the trust's net assets.
ADR American Depository Receipts BRL Brazilian Real CAD Canadian Dollar
EC Escrow CUSIP; represents a beneficial interest in a residual pool of bankruptcy assets; the amount and timing of future distributions, if any, is uncertain; when presented, interest rate and maturity date are those of the original security.
GBP British Pound IDR Indonesian Rupiah PIK Payment-in-kind VR Variable Rate; rate shown is effective rate at period-end.
The accompanying notes are an integral part of these financial statements.
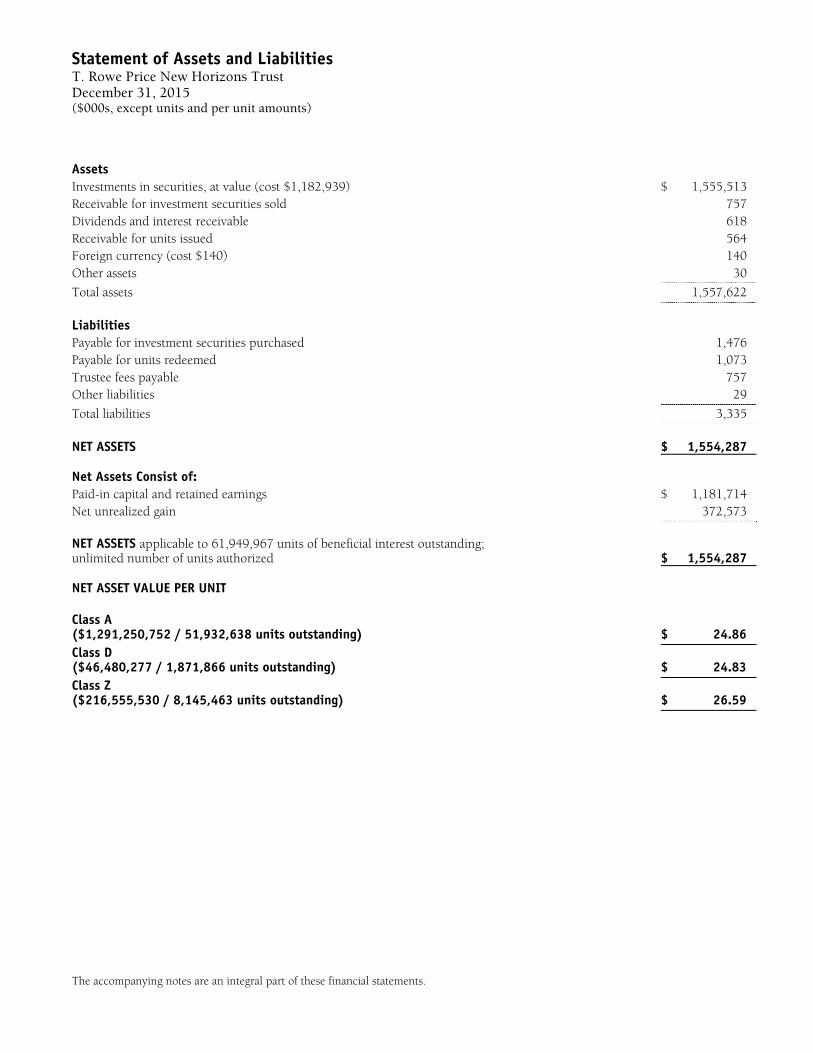
Statement of Assets and Liabilities T. Rowe Price New Horizons Trust December 31, 2015 ($000s, except units and per unit amounts)
The accompanying notes are an integral part of these financial statements.
Assets Investments in securities, at value (cost $1,182,939) $ 1,555,513 Receivable for investment securities sold 757 Dividends and interest receivable 618 Receivable for units issued 564 Foreign currency (cost $140) 140 Other assets 30
Total assets 1,557,622
Liabilities Payable for investment securities purchased 1,476 Payable for units redeemed 1,073 Trustee fees payable 757 Other liabilities 29
Total liabilities 3,335
NET ASSETS $ 1,554,287 Net Assets Consist of: Paid-in capital and retained earnings $ 1,181,714 Net unrealized gain 372,573 NET ASSETS applicable to 61,949,967 units of beneficial interest outstanding; unlimited number of units authorized $ 1,554,287 NET ASSET VALUE PER UNIT Class A ($1,291,250,752 / 51,932,638 units outstanding) $ 24.86 Class D ($46,480,277 / 1,871,866 units outstanding) $ 24.83 Class Z ($216,555,530 / 8,145,463 units outstanding) $ 26.59
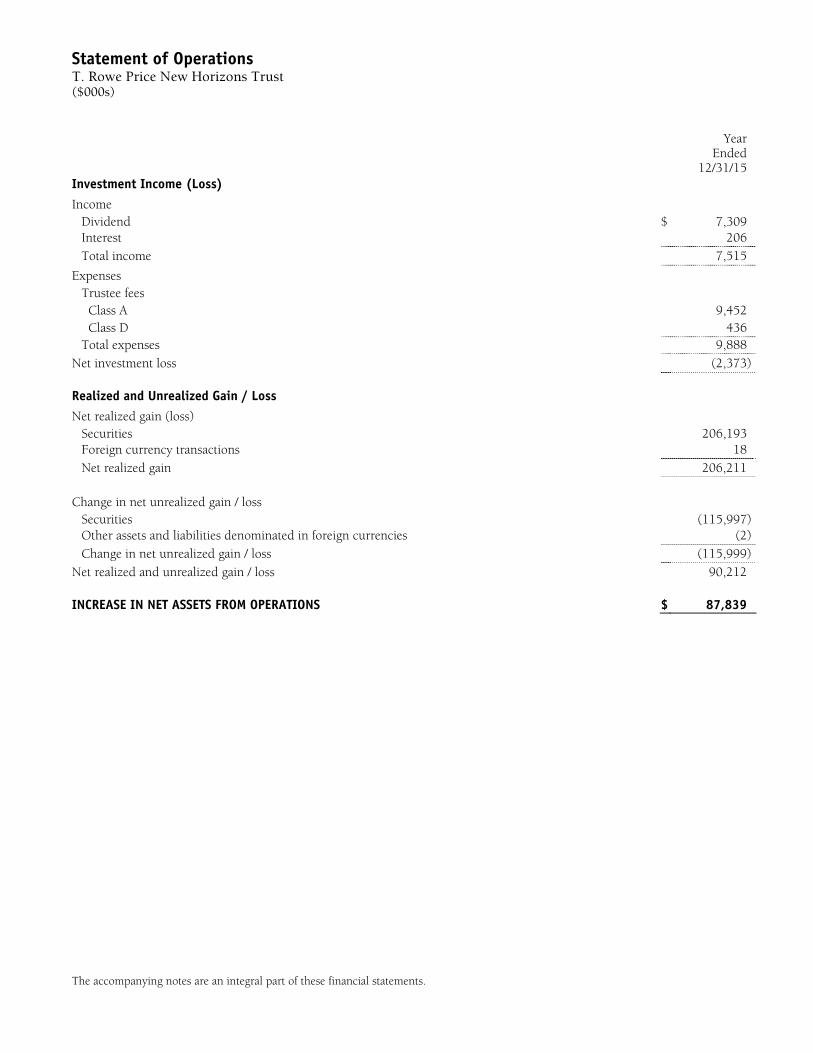
Statement of Operations T. Rowe Price New Horizons Trust ($000s)
The accompanying notes are an integral part of these financial statements.
YearEnded
12/31/15Investment Income (Loss) Income
Dividend $ 7,309Interest 206Total income 7,515
Expenses Trustee fees Class A 9,452 Class D 436 Total expenses 9,888
Net investment loss (2,373) Realized and Unrealized Gain / Loss Net realized gain (loss)
Securities 206,193Foreign currency transactions 18Net realized gain 206,211
Change in net unrealized gain / loss
Securities (115,997)Other assets and liabilities denominated in foreign currencies (2)Change in net unrealized gain / loss (115,999)
Net realized and unrealized gain / loss 90,212 INCREASE IN NET ASSETS FROM OPERATIONS $ 87,839
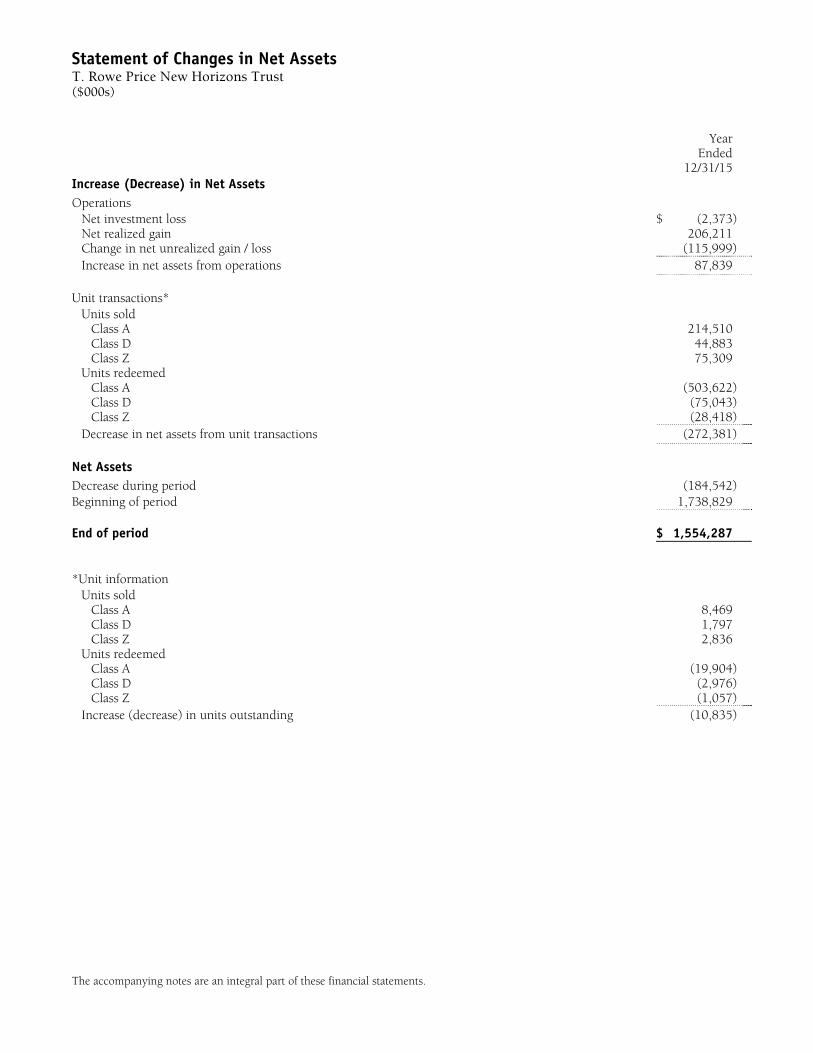
Statement of Changes in Net Assets T. Rowe Price New Horizons Trust ($000s)
The accompanying notes are an integral part of these financial statements.
Year Ended
12/31/15Increase (Decrease) in Net Assets Operations
Net investment loss $ (2,373)Net realized gain 206,211Change in net unrealized gain / loss (115,999)Increase in net assets from operations 87,839
Unit transactions*
Units sold Class A 214,510Class D 44,883Class Z 75,309
Units redeemed Class A (503,622)Class D (75,043)Class Z (28,418)
Decrease in net assets from unit transactions (272,381) Net Assets Decrease during period (184,542) Beginning of period 1,738,829 End of period $ 1,554,287 *Unit information
Units sold Class A 8,469Class D 1,797Class Z 2,836
Units redeemed Class A (19,904)Class D (2,976)Class Z (1,057)
Increase (decrease) in units outstanding (10,835)
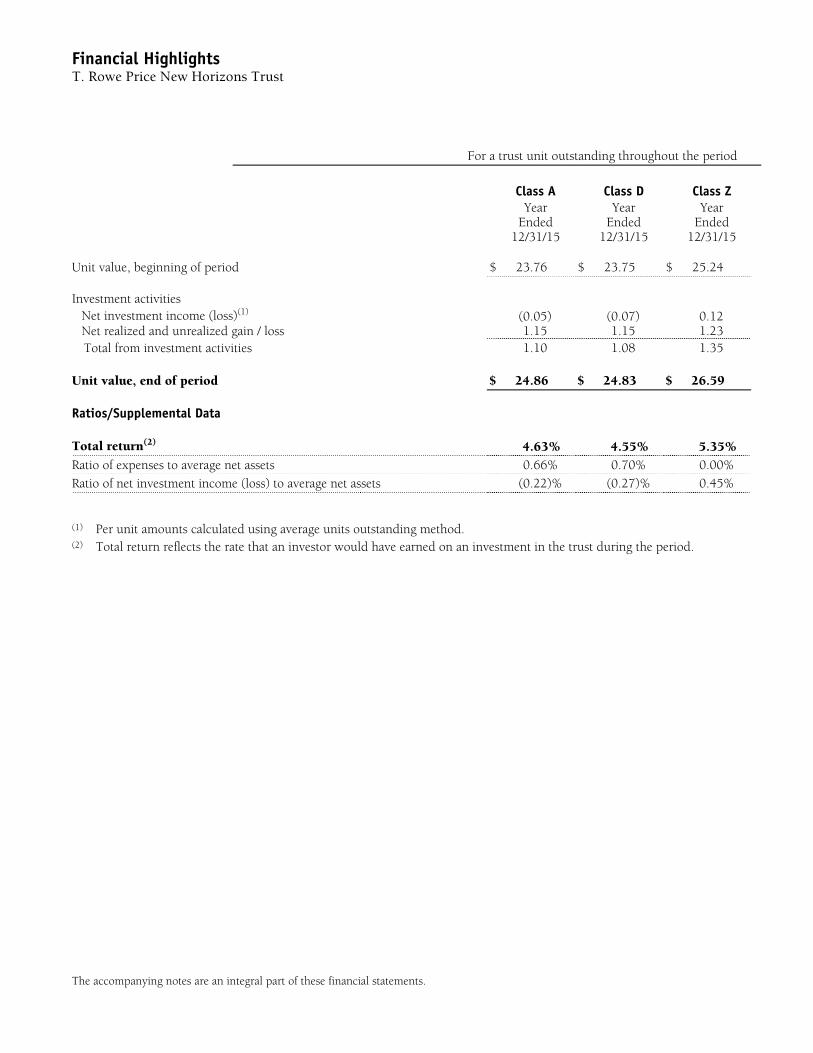
Financial Highlights T. Rowe Price New Horizons Trust
The accompanying notes are an integral part of these financial statements.
For a trust unit outstanding throughout the period
Class A Class D Class Z
YearEnded
12/31/15
Year Ended
12/31/15
YearEnded
12/31/15
Unit value, beginning of period $ 23.76 $ 23.75 $ 25.24 Investment activities
Net investment income (loss)(1) (0.05) (0.07) 0.12
Net realized and unrealized gain / loss 1.15 1.15 1.23Total from investment activities 1.10 1.08 1.35
Unit value, end of period $ 24.86 $ 24.83 $ 26.59 Ratios/Supplemental Data
Total return(2) 4.63% 4.55% 5.35%
Ratio of expenses to average net assets 0.66% 0.70% 0.00%Ratio of net investment income (loss) to average net assets (0.22)% (0.27)% 0.45% (1) Per unit amounts calculated using average units outstanding method.(2) Total return reflects the rate that an investor would have earned on an investment in the trust during the period.
T. Rowe Price New Horizons Trust
December 31, 2015
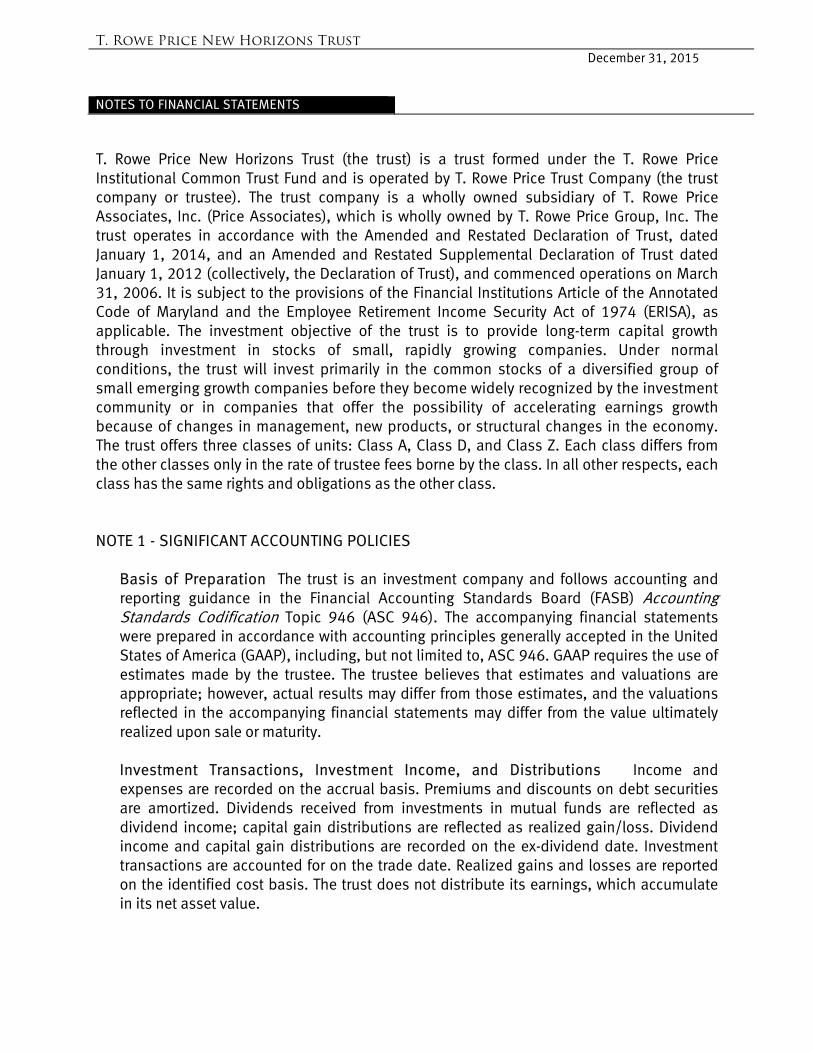
NOTES TO FINANCIAL STATEMENTS T. Rowe Price New Horizons Trust (the trust) is a trust formed under the T. Rowe Price Institutional Common Trust Fund and is operated by T. Rowe Price Trust Company (the trust company or trustee). The trust company is a wholly owned subsidiary of T. Rowe Price Associates, Inc. (Price Associates), which is wholly owned by T. Rowe Price Group, Inc. The trust operates in accordance with the Amended and Restated Declaration of Trust, dated January 1, 2014, and an Amended and Restated Supplemental Declaration of Trust dated January 1, 2012 (collectively, the Declaration of Trust), and commenced operations on March 31, 2006. It is subject to the provisions of the Financial Institutions Article of the Annotated Code of Maryland and the Employee Retirement Income Security Act of 1974 (ERISA), as applicable. The investment objective of the trust is to provide long-term capital growth through investment in stocks of small, rapidly growing companies. Under normal conditions, the trust will invest primarily in the common stocks of a diversified group of small emerging growth companies before they become widely recognized by the investment community or in companies that offer the possibility of accelerating earnings growth because of changes in management, new products, or structural changes in the economy. The trust offers three classes of units: Class A, Class D, and Class Z. Each class differs from the other classes only in the rate of trustee fees borne by the class. In all other respects, each class has the same rights and obligations as the other class. NOTE 1 - SIGNIFICANT ACCOUNTING POLICIES
Basis of Preparation The trust is an investment company and follows accounting and reporting guidance in the Financial Accounting Standards Board (FASB) Accounting Standards Codification Topic 946 (ASC 946). The accompanying financial statements were prepared in accordance with accounting principles generally accepted in the United States of America (GAAP), including, but not limited to, ASC 946. GAAP requires the use of estimates made by the trustee. The trustee believes that estimates and valuations are appropriate; however, actual results may differ from those estimates, and the valuations reflected in the accompanying financial statements may differ from the value ultimately realized upon sale or maturity. Investment Transactions, Investment Income, and Distributions Income and expenses are recorded on the accrual basis. Premiums and discounts on debt securities are amortized. Dividends received from investments in mutual funds are reflected as dividend income; capital gain distributions are reflected as realized gain/loss. Dividend income and capital gain distributions are recorded on the ex-dividend date. Investment transactions are accounted for on the trade date. Realized gains and losses are reported on the identified cost basis. The trust does not distribute its earnings, which accumulate in its net asset value.
T. Rowe Price New Horizons Trust
December 31, 2015
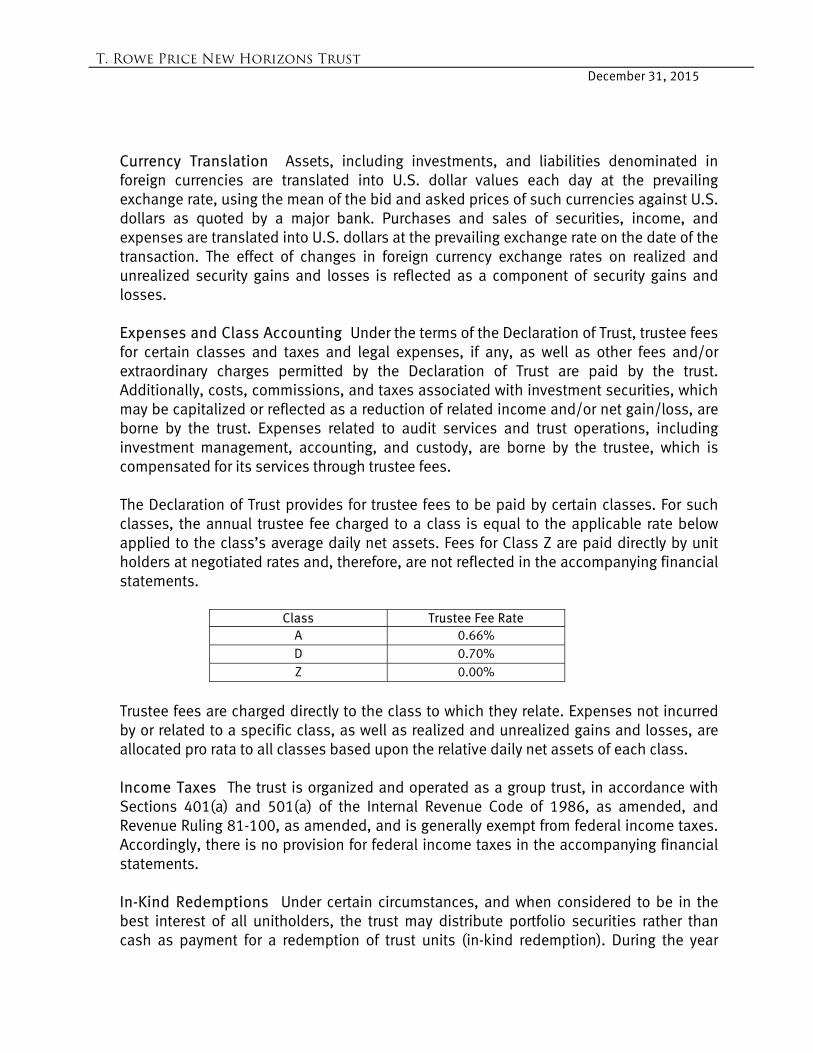
Currency Translation Assets, including investments, and liabilities denominated in foreign currencies are translated into U.S. dollar values each day at the prevailing exchange rate, using the mean of the bid and asked prices of such currencies against U.S. dollars as quoted by a major bank. Purchases and sales of securities, income, and expenses are translated into U.S. dollars at the prevailing exchange rate on the date of the transaction. The effect of changes in foreign currency exchange rates on realized and unrealized security gains and losses is reflected as a component of security gains and losses. Expenses and Class Accounting Under the terms of the Declaration of Trust, trustee fees for certain classes and taxes and legal expenses, if any, as well as other fees and/or extraordinary charges permitted by the Declaration of Trust are paid by the trust. Additionally, costs, commissions, and taxes associated with investment securities, which may be capitalized or reflected as a reduction of related income and/or net gain/loss, are borne by the trust. Expenses related to audit services and trust operations, including investment management, accounting, and custody, are borne by the trustee, which is compensated for its services through trustee fees. The Declaration of Trust provides for trustee fees to be paid by certain classes. For such classes, the annual trustee fee charged to a class is equal to the applicable rate below applied to the class’s average daily net assets. Fees for Class Z are paid directly by unit holders at negotiated rates and, therefore, are not reflected in the accompanying financial statements.
Class Trustee Fee Rate A 0.66% D 0.70% Z 0.00%
Trustee fees are charged directly to the class to which they relate. Expenses not incurred by or related to a specific class, as well as realized and unrealized gains and losses, are allocated pro rata to all classes based upon the relative daily net assets of each class.
Income Taxes The trust is organized and operated as a group trust, in accordance with Sections 401(a) and 501(a) of the Internal Revenue Code of 1986, as amended, and Revenue Ruling 81-100, as amended, and is generally exempt from federal income taxes. Accordingly, there is no provision for federal income taxes in the accompanying financial statements. In-Kind Redemptions Under certain circumstances, and when considered to be in the best interest of all unitholders, the trust may distribute portfolio securities rather than cash as payment for a redemption of trust units (in-kind redemption). During the year
T. Rowe Price New Horizons Trust
December 31, 2015
ended December 31, 2015, the trust realized $126,325,000 of net gain on $246,410,000 of in-kind redemptions. In-Kind Subscriptions Under certain circumstances, and when considered to be in the best interest of the trust, the trust may accept portfolio securities rather than cash as payment for the purchase of trust units (in-kind subscription). For financial reporting purposes, the cost of contributed securities is equal to the fair value of the securities on the date of contribution. In-kind subscriptions result in no gain or loss for the trust. During the year ended December 31, 2015, the trust accepted $114,940,000 of in-kind subscriptions, all of which were from other funds or trusts managed by Price Associates and/or its affiliates. Unit Transactions Each investor’s beneficial interest in the net assets of the trust is represented by units, an unlimited number of which are authorized. Unit transactions are subject to terms, conditions, and limitations defined in the Declaration of Trust. Trust units are issued and redeemed only on a valuation date and at the net asset value per unit computed on that date. Under the terms of the Declaration of Trust, unit holders are required to provide a 90-day advance written notice to the trustee prior to redemption of trust units; the notice period may be shortened or waived by the trustee in its sole discretion.
New Accounting Guidance In May 2015, FASB issued ASU No. 2015-07, Fair Value Measurement (Topic 820), Disclosures for Investments in Certain Entities That Calculate Net Asset Value per Share (or Its Equivalent). The ASU removes the requirement to categorize within the fair value hierarchy all investments for which fair value is measured using the net asset value per share practical expedient and amends certain disclosure requirements for such investments. The ASU is effective for interim and annual reporting periods beginning after December 15, 2015. Adoption will have no effect on the trust’s net assets or results of operations.
NOTE 2 - VALUATION The trust’s financial instruments are valued and each class’s net asset value (NAV) per unit is computed at the close of the New York Stock Exchange (NYSE), normally 4 p.m. ET, each day the NYSE is open for business. Fair Value The trust’s financial instruments are reported at fair value, which GAAP defines as the price that would be received to sell an asset or paid to transfer a liability in an orderly transaction between market participants at the measurement date. The T. Rowe Price Valuation Committee (the Valuation Committee) has been established to ensure that financial instruments are appropriately priced at fair value in accordance with GAAP.
T. Rowe Price New Horizons Trust
December 31, 2015
Subject to oversight by the trustee, the Valuation Committee develops and oversees pricing-related policies and procedures and approves all fair value determinations. Specifically, the Valuation Committee establishes procedures to value securities; determines pricing techniques, sources, and persons eligible to effect fair value pricing actions; oversees the selection, services, and performance of pricing vendors; oversees valuation-related business continuity practices; and provides guidance on internal controls and valuation-related matters. Various valuation techniques and inputs are used to determine the fair value of financial instruments. GAAP establishes the following fair value hierarchy that categorizes the inputs used to measure fair value:
Level 1 – quoted prices (unadjusted) in active markets for identical financial
instruments that the trust can access at the reporting date Level 2 – inputs other than Level 1 quoted prices that are observable, either directly
or indirectly (including, but not limited to, quoted prices for similar financial instruments in active markets, quoted prices for identical or similar financial instruments in inactive markets, interest rates and yield curves, implied volatilities, and credit spreads)
Level 3 – unobservable inputs Observable inputs are developed using market data, such as publicly available information about actual events or transactions, and reflect the assumptions that market participants would use to price the financial instrument. Unobservable inputs are those for which market data are not available and are developed using the best information available about the assumptions that market participants would use to price the financial instrument. GAAP requires valuation techniques to maximize the use of relevant observable inputs and minimize the use of unobservable inputs. When multiple inputs are used to derive fair value, the financial instrument is assigned to the level within the fair value hierarchy based on the lowest-level input that is significant to the fair value of the financial instrument. Input levels are not necessarily an indication of the risk or liquidity associated with financial instruments at that level but rather the degree of judgment used in determining those values. Valuation Techniques Equity securities listed or regularly traded on a securities exchange or in the over-the-counter (OTC) market are valued at the last quoted sale price or, for certain markets, the official closing price at the time the valuations are made. OTC Bulletin Board securities are valued at the mean of the closing bid and asked prices. A security that is listed or traded on more than one exchange is valued at the quotation on the exchange determined to be the primary market for such security. Listed securities not traded on a particular day are valued at the mean of the closing bid and asked prices for domestic securities and the last quoted sale or closing price for international securities.
T. Rowe Price New Horizons Trust
December 31, 2015
For valuation purposes, the last quoted prices of non-U.S. equity securities may be adjusted to reflect the fair value of such securities at the close of the NYSE. If the trustee (including its service providers) determines that developments between the close of a foreign market and the close of the NYSE will, in its judgment, materially affect the value of some or all of its portfolio securities, the trust will adjust the previous quoted prices to reflect what it believes to be the fair value of the securities as of the close of the NYSE. In deciding whether it is necessary to adjust quoted prices to reflect fair value, the trustee reviews a variety of factors, including developments in foreign markets, the performance of U.S. securities markets, and the performance of instruments trading in U.S. markets that represent foreign securities and baskets of foreign securities. The trustee may also fair value securities in other situations, such as when a particular foreign market is closed but the trust is open. The trustee uses outside pricing services to provide it with quoted prices and information to evaluate or adjust those prices. The trustee cannot predict how often it will use quoted prices and how often it will determine it necessary to adjust those prices to reflect fair value. As a means of evaluating its security valuation process, the trustee routinely compares quoted prices, the next day’s opening prices in the same markets, and adjusted prices. Actively traded equity securities listed on a domestic exchange generally are categorized in Level 1 of the fair value hierarchy. Non-U.S. equity securities generally are categorized in Level 2 of the fair value hierarchy despite the availability of quoted prices because, as described above, the trustee evaluates and determines whether those quoted prices reflect fair value at the close of the NYSE or require adjustment. OTC Bulletin Board securities, certain preferred securities, and equity securities traded in inactive markets generally are categorized in Level 2 of the fair value hierarchy. Debt securities generally are traded in the OTC market. Securities with remaining maturities of one year or more at the time of acquisition are valued at prices furnished by dealers who make markets in such securities or by an independent pricing service, which considers the yield or price of bonds of comparable quality, coupon, maturity, and type, as well as prices quoted by dealers who make markets in such securities. Generally, debt securities are categorized in Level 2 of the fair value hierarchy; however, to the extent the valuations include significant unobservable inputs, the securities would be categorized in Level 3. Investments in other common trust funds or mutual funds are valued at such trust’s or fund’s closing NAV per unit or share, respectively, on the day of valuation. Investments in common trust funds are categorized in Level 2 of the fair value hierarchy, and investments in mutual funds are categorized in Level 1. Assets and liabilities other than financial instruments, including short-term receivables and payables, are carried at cost, or estimated realizable value, if less, which approximates fair value.
T. Rowe Price New Horizons Trust
December 31, 2015
Thinly traded financial instruments and those for which the above valuation procedures are inappropriate or are deemed not to reflect fair value are stated at fair value as determined in good faith by the Valuation Committee. The objective of any fair value pricing determination is to arrive at a price that could reasonably be expected from a current sale. Financial instruments fair valued by the Valuation Committee are primarily private placements, restricted securities, warrants, rights, and other securities that are not publicly traded. Subject to oversight by the trustee, the Valuation Committee regularly makes good faith judgments to establish and adjust the fair valuations of certain securities as events occur and circumstances warrant. For instance, in determining the fair value of an equity investment with limited market activity, such as a private placement or a thinly traded public company stock, the Valuation Committee considers a variety of factors, which may include, but are not limited to, the issuer’s business prospects, its financial standing and performance, recent investment transactions in the issuer, new rounds of financing, negotiated transactions of significant size between other investors in the company, relevant market valuations of peer companies, strategic events affecting the company, market liquidity for the issuer, and general economic conditions and events. In consultation with the investment and pricing teams, the Valuation Committee will determine an appropriate valuation technique based on available information, which may include both observable and unobservable inputs. The Valuation Committee typically will afford greatest weight to actual prices in arm’s length transactions, to the extent they represent orderly transactions between market participants; transaction information can be reliably obtained; and prices are deemed representative of fair value. However, the Valuation Committee may also consider other valuation methods such as market-based valuation multiples; a discount or premium from market value of a similar, freely traded security of the same issuer; or some combination. Fair value determinations are reviewed on a regular basis and updated as information becomes available, including actual purchase and sale transactions of the issue. Because any fair value determination involves a significant amount of judgment, there is a degree of subjectivity inherent in such pricing decisions, and fair value prices determined by the Valuation Committee could differ from those of other market participants. Depending on the relative significance of unobservable inputs, including the valuation technique(s) used, fair valued securities may be categorized in Level 2 or 3 of the fair value hierarchy. Valuation Inputs The following table summarizes the trust’s financial instruments, based on the inputs used to determine their fair values on December 31, 2015:
T. Rowe Price New Horizons Trust
December 31, 2015
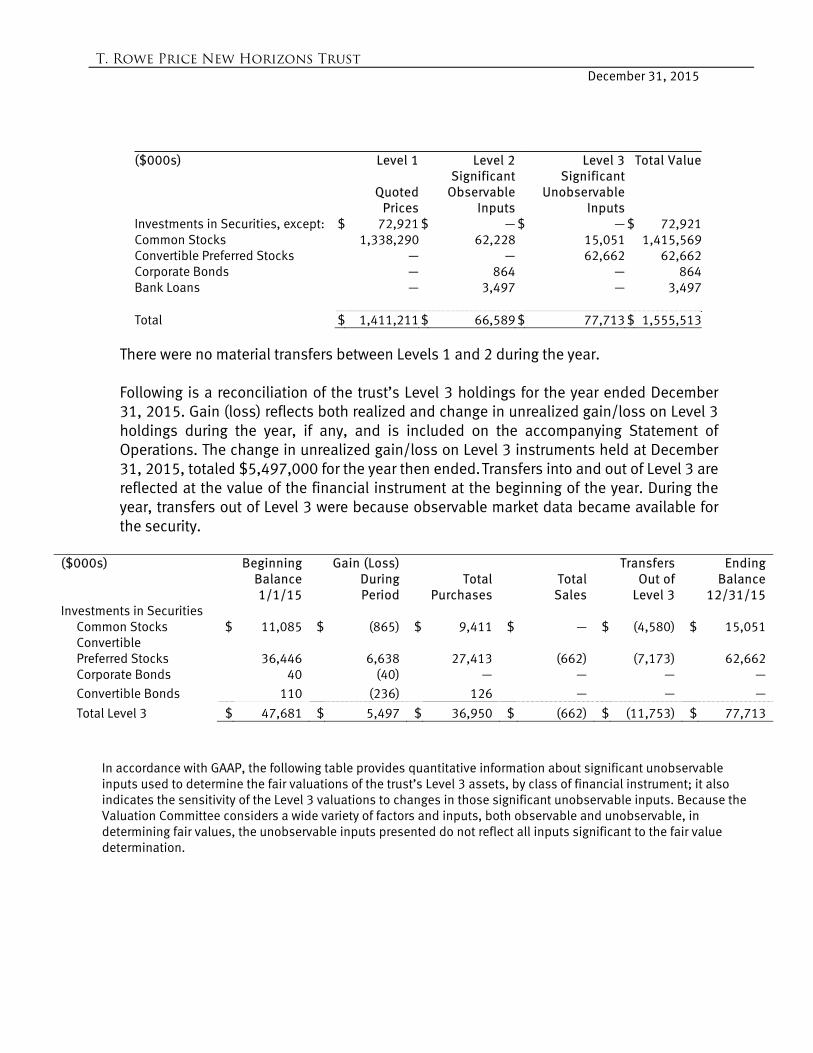
($000s) Level 1 Level 2 Level 3 Total Value
Quoted
Prices
SignificantObservable
Inputs
SignificantUnobservable
Inputs Investments in Securities, except: $ 72,921 $ — $ — $ 72,921Common Stocks 1,338,290 62,228 15,051 1,415,569Convertible Preferred Stocks — — 62,662 62,662Corporate Bonds — 864 — 864Bank Loans — 3,497 — 3,497 Total $ 1,411,211 $ 66,589 $ 77,713 $ 1,555,513
There were no material transfers between Levels 1 and 2 during the year. Following is a reconciliation of the trust’s Level 3 holdings for the year ended December 31, 2015. Gain (loss) reflects both realized and change in unrealized gain/loss on Level 3 holdings during the year, if any, and is included on the accompanying Statement of Operations. The change in unrealized gain/loss on Level 3 instruments held at December 31, 2015, totaled $5,497,000 for the year then ended. Transfers into and out of Level 3 are reflected at the value of the financial instrument at the beginning of the year. During the year, transfers out of Level 3 were because observable market data became available for the security.
($000s) Beginning Gain (Loss) Transfers Ending Balance During Total Total Out of Balance 1/1/15 Period Purchases Sales Level 3 12/31/15 Investments in Securities Common Stocks $ 11,085 $ (865) $ 9,411 $ — $ (4,580) $ 15,051
Convertible Preferred Stocks 36,446 6,638 27,413 (662) (7,173)
62,662
Corporate Bonds 40 (40) — — — — Convertible Bonds 110 (236) 126 — — — Total Level 3 $ 47,681 $ 5,497 $ 36,950 $ (662) $ (11,753) $ 77,713
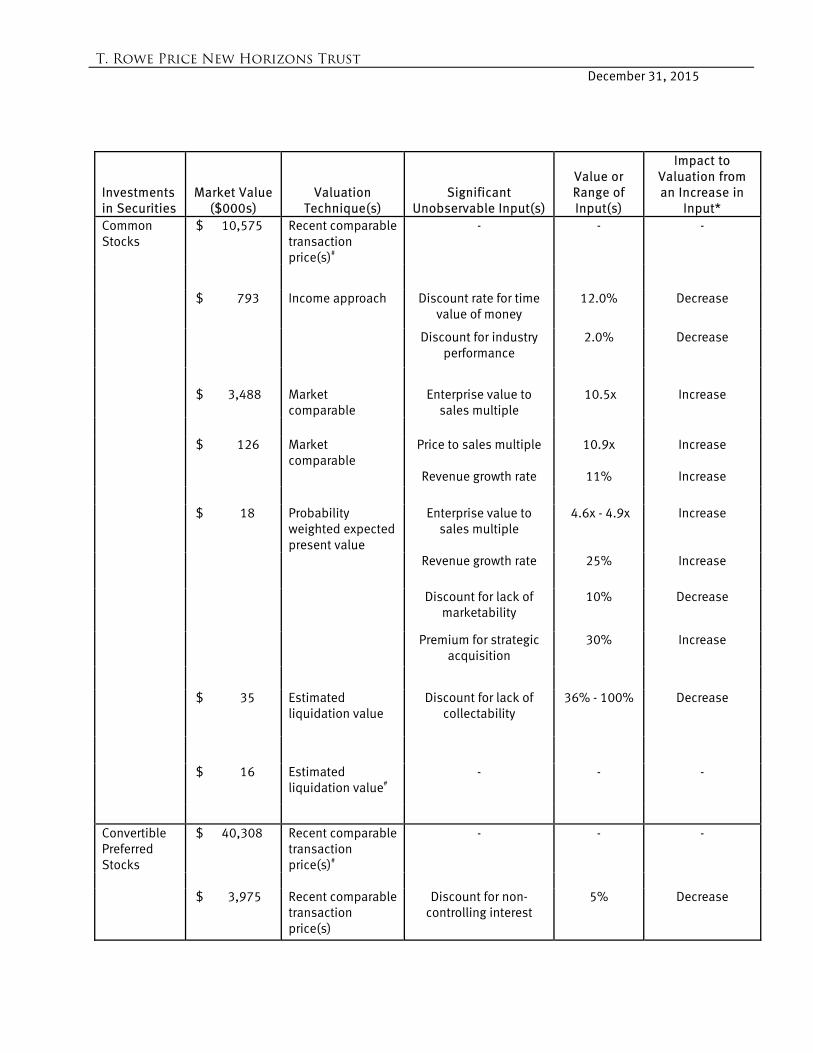
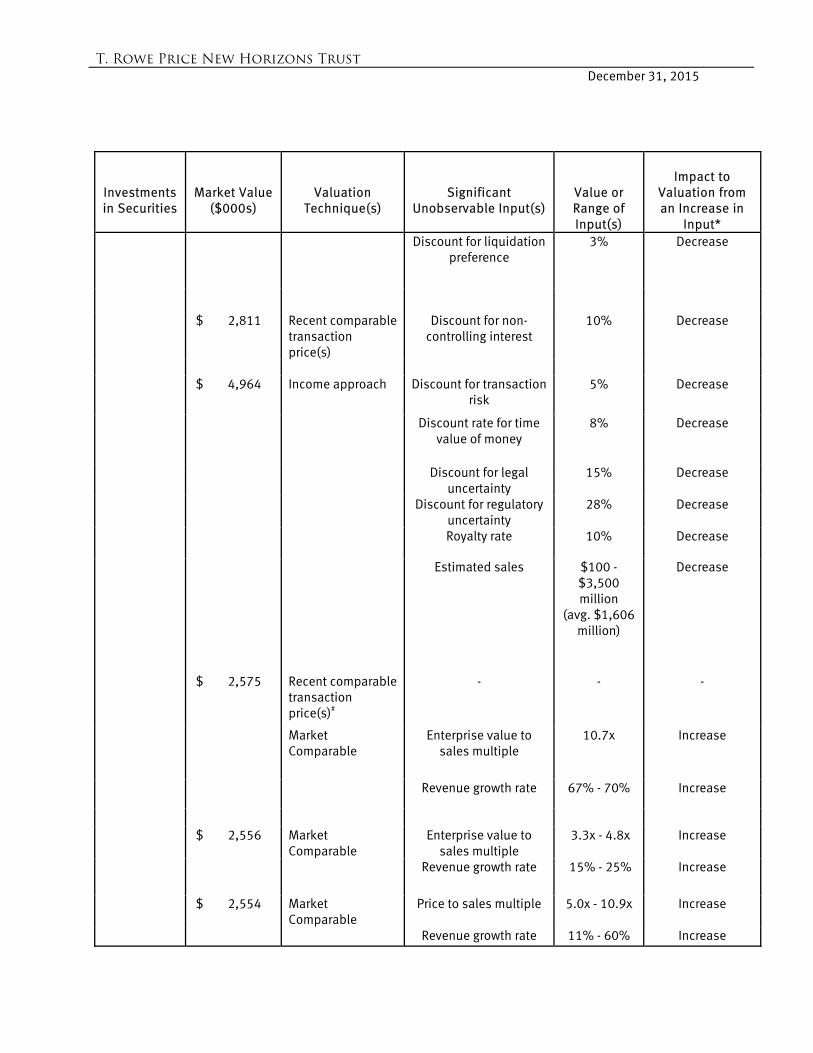
In accordance with GAAP, the following table provides quantitative information about significant unobservable inputs used to determine the fair valuations of the trust’s Level 3 assets, by class of financial instrument; it also indicates the sensitivity of the Level 3 valuations to changes in those significant unobservable inputs. Because the Valuation Committee considers a wide variety of factors and inputs, both observable and unobservable, in determining fair values, the unobservable inputs presented do not reflect all inputs significant to the fair value determination.
T. Rowe Price New Horizons Trust
December 31, 2015
Investments in Securities
Market Value ($000s)
Valuation Technique(s)
Significant Unobservable Input(s)
Value or Range of Input(s)
Impact to Valuation from an Increase in
Input* Common Stocks
$ 10,575 Recent comparable transaction price(s)#
- - -
$ 793 Income approach Discount rate for time value of money
12.0% Decrease
Discount for industry performance
2.0% Decrease
$ 3,488 Market
comparable Enterprise value to
sales multiple 10.5x Increase
$ 126 Market
comparable Price to sales multiple 10.9x Increase
Revenue growth rate 11% Increase $ 18 Probability
weighted expected present value
Enterprise value to sales multiple
4.6x - 4.9x Increase
Revenue growth rate 25% Increase
Discount for lack of marketability
10% Decrease
Premium for strategic acquisition
30% Increase
$ 35 Estimated liquidation value
Discount for lack of collectability
36% - 100% Decrease
$ 16 Estimated liquidation value#
- - -
Convertible Preferred Stocks
$ 40,308 Recent comparable transaction price(s)#
- - -
$ 3,975 Recent comparable
transaction price(s)
Discount for non-controlling interest
5% Decrease
T. Rowe Price New Horizons Trust
December 31, 2015
Investments in Securities
Market Value ($000s)
Valuation Technique(s)
Significant Unobservable Input(s)
Value or Range of Input(s)
Impact to
Valuation from an Increase in
Input* Discount for liquidation
preference 3% Decrease
$ 2,811 Recent comparable transaction price(s)
Discount for non-controlling interest
10% Decrease
$ 4,964 Income approach Discount for transaction
risk 5% Decrease
Discount rate for time value of money
8% Decrease
Discount for legal uncertainty
15% Decrease
Discount for regulatory uncertainty
28% Decrease
Royalty rate 10% Decrease
Estimated sales $100 - $3,500 million
(avg. $1,606 million)
Decrease
$ 2,575 Recent comparable transaction price(s)#
- - -
Market Comparable
Enterprise value to sales multiple
10.7x Increase
Revenue growth rate 67% - 70% Increase
$ 2,556 Market
Comparable Enterprise value to
sales multiple 3.3x - 4.8x Increase
Revenue growth rate 15% - 25% Increase $ 2,554 Market
Comparable Price to sales multiple 5.0x - 10.9x Increase
Revenue growth rate 11% - 60% Increase
T. Rowe Price New Horizons Trust
December 31, 2015
Investments in Securities
Market Value ($000s)
Valuation Technique(s)
Significant Unobservable Input(s)
Value or Range of Input(s)
Impact to Valuation from an Increase in
Input* $ - Income approach Discount for liquidation
preference 100% Decrease
$ 1,787 Probability
weighted expected present value
Discount for liquidation preference
5% - 100% Decrease
$ 175 Probability
weighted expected present value
Discount for liquidation preference
0% - 48% (weighted avg. 2%)
Decrease
$ 935 Probability weighted expected present value
Enterprise value to sales multiple
4.6x - 4.9x Increase
Revenue growth rate 25% Increase
Discount for lack of marketability
10% Decrease
Premium for strategic acquisition
30% Increase
$ 22 Estimated
liquidation value Discount for lack of
collectability 50% - 100% Decrease
Bonds $ - Income approach Discount for liquidation
preference 100% Decrease
$ - Estimated
liquidation value Discount for lack of
collectability 100% Decrease
Convertible Bonds
$ - Estimated liquidation value
Discount for lack of collectability
100% Decrease
# - No quantitative unobservable inputs significant to the valuation technique were created by the trust’s management.
* Represents the directional change in the fair value of the Level 3 investment(s) that would result from an increase in the corresponding input. A decrease to the unobservable input would have the opposite effect. Significant increases and decreases in these inputs in isolation could result in significantly higher or lower fair value measurements.
T. Rowe Price New Horizons Trust
December 31, 2015
NOTE 3 – OTHER INVESTMENT TRANSACTIONS
Consistent with its investment objective, the trust engages in the following practices to manage exposure to certain risks or to enhance performance. Restricted Securities The trust may invest in securities that are subject to legal or contractual restrictions on resale. Prompt sale of such securities at an acceptable price may be difficult and may involve substantial delays and additional costs. Bank Loans The trust may invest in bank loans, which represent an interest in amounts owed by a borrower to a syndication of lenders. Bank loans are generally noninvestment-grade and often involve borrowers whose financial condition is troubled or highly leveraged. Bank loans may be in the form of either assignments or participations. A loan assignment transfers all legal, beneficial, and economic rights to the buyer, and transfer typically requires consent of both the borrower and agent. In contrast, a loan participation generally entitles the buyer to receive the cash flows from principal, interest, and any fee payments; however, the seller continues to hold legal title to the loan. As a result, the buyer of a loan participation generally has no direct rights against the borrower and is exposed to credit risk of both the borrower and seller of the participation. Bank loans often have extended settlement periods, usually may be repaid at any time at the option of the borrower, and may require additional principal to be funded at the borrowers’ discretion at a later date (unfunded commitments). Until settlement, the trust maintains liquid assets sufficient to settle its unfunded loan commitments. The trust reflects both the funded portion of a bank loan as well as its unfunded commitment in the Portfolio of Investments. However, to the extent a credit agreement provides no initial funding of a tranche and funding of the full commitment at a future date(s) is at the borrower’s discretion and considered uncertain, no loan is reflected in the Portfolio of Investments until paid.
NOTE 4 – RELATED PARTY TRANSACTIONS
Pursuant to the Declaration of Trust, the trustee is responsible for management and control of the trust and is permitted to retain investment advisory and other services, as it deems appropriate and at its expense, to assist in fulfilling its obligations. The trustee has engaged Price Associates to provide investment advisory services for the trust. The trustee pays for investment advisory services, as well as accounting, custody, and audit services provided for the trust. The trustee is compensated for its services in the form of trustee fees that are accrued daily and paid monthly at rates described in Note 1. At December 31, 2015, trustee fees payable by all classes totaled $757,000. Further, Class Z incurs no trustee fees; however, fees are paid directly by the Class Z unit holders to the trustee in accordance with contractual agreements between the trust company and the individual
T. Rowe Price New Horizons Trust
December 31, 2015
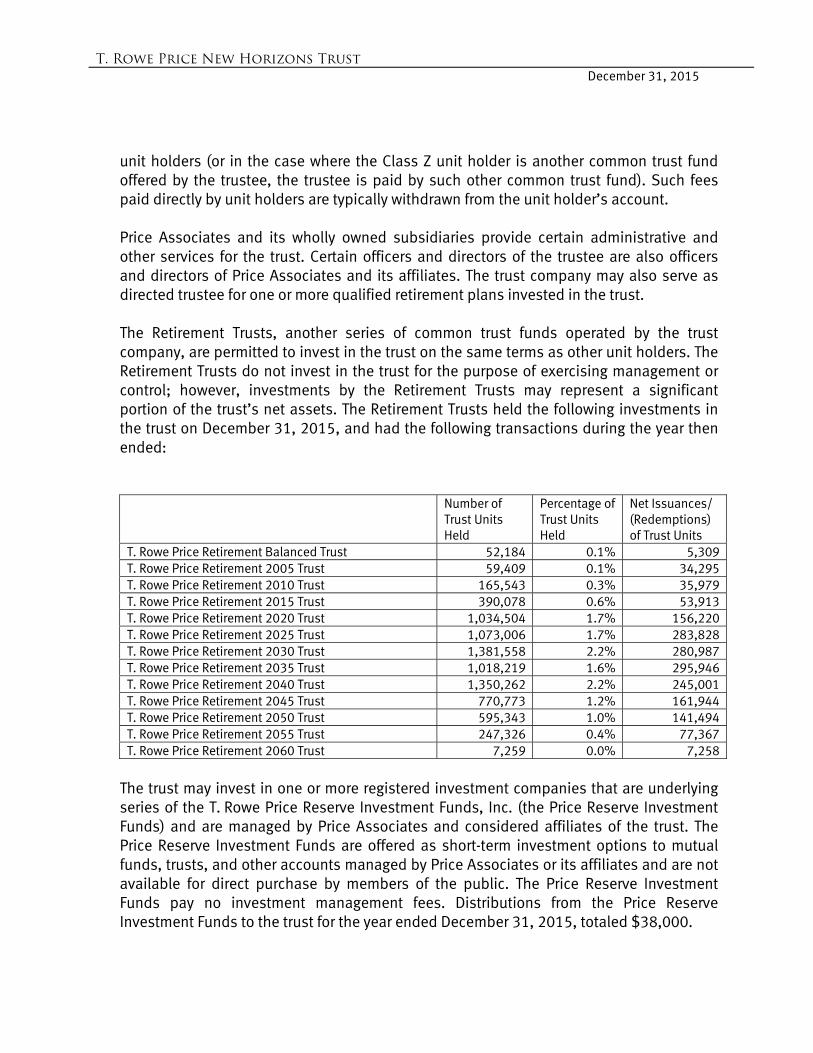
unit holders (or in the case where the Class Z unit holder is another common trust fund offered by the trustee, the trustee is paid by such other common trust fund). Such fees paid directly by unit holders are typically withdrawn from the unit holder’s account. Price Associates and its wholly owned subsidiaries provide certain administrative and other services for the trust. Certain officers and directors of the trustee are also officers and directors of Price Associates and its affiliates. The trust company may also serve as directed trustee for one or more qualified retirement plans invested in the trust. The Retirement Trusts, another series of common trust funds operated by the trust company, are permitted to invest in the trust on the same terms as other unit holders. The Retirement Trusts do not invest in the trust for the purpose of exercising management or control; however, investments by the Retirement Trusts may represent a significant portion of the trust’s net assets. The Retirement Trusts held the following investments in the trust on December 31, 2015, and had the following transactions during the year then ended:
Number of Trust Units Held
Percentage of Trust Units Held
Net Issuances/ (Redemptions) of Trust Units
T. Rowe Price Retirement Balanced Trust 52,184 0.1% 5,309 T. Rowe Price Retirement 2005 Trust 59,409 0.1% 34,295 T. Rowe Price Retirement 2010 Trust 165,543 0.3% 35,979 T. Rowe Price Retirement 2015 Trust 390,078 0.6% 53,913 T. Rowe Price Retirement 2020 Trust 1,034,504 1.7% 156,220 T. Rowe Price Retirement 2025 Trust 1,073,006 1.7% 283,828 T. Rowe Price Retirement 2030 Trust 1,381,558 2.2% 280,987 T. Rowe Price Retirement 2035 Trust 1,018,219 1.6% 295,946 T. Rowe Price Retirement 2040 Trust 1,350,262 2.2% 245,001 T. Rowe Price Retirement 2045 Trust 770,773 1.2% 161,944 T. Rowe Price Retirement 2050 Trust 595,343 1.0% 141,494 T. Rowe Price Retirement 2055 Trust 247,326 0.4% 77,367 T. Rowe Price Retirement 2060 Trust 7,259 0.0% 7,258
The trust may invest in one or more registered investment companies that are underlying series of the T. Rowe Price Reserve Investment Funds, Inc. (the Price Reserve Investment Funds) and are managed by Price Associates and considered affiliates of the trust. The Price Reserve Investment Funds are offered as short-term investment options to mutual funds, trusts, and other accounts managed by Price Associates or its affiliates and are not available for direct purchase by members of the public. The Price Reserve Investment Funds pay no investment management fees. Distributions from the Price Reserve Investment Funds to the trust for the year ended December 31, 2015, totaled $38,000.
T. Rowe Price New Horizons Trust
December 31, 2015
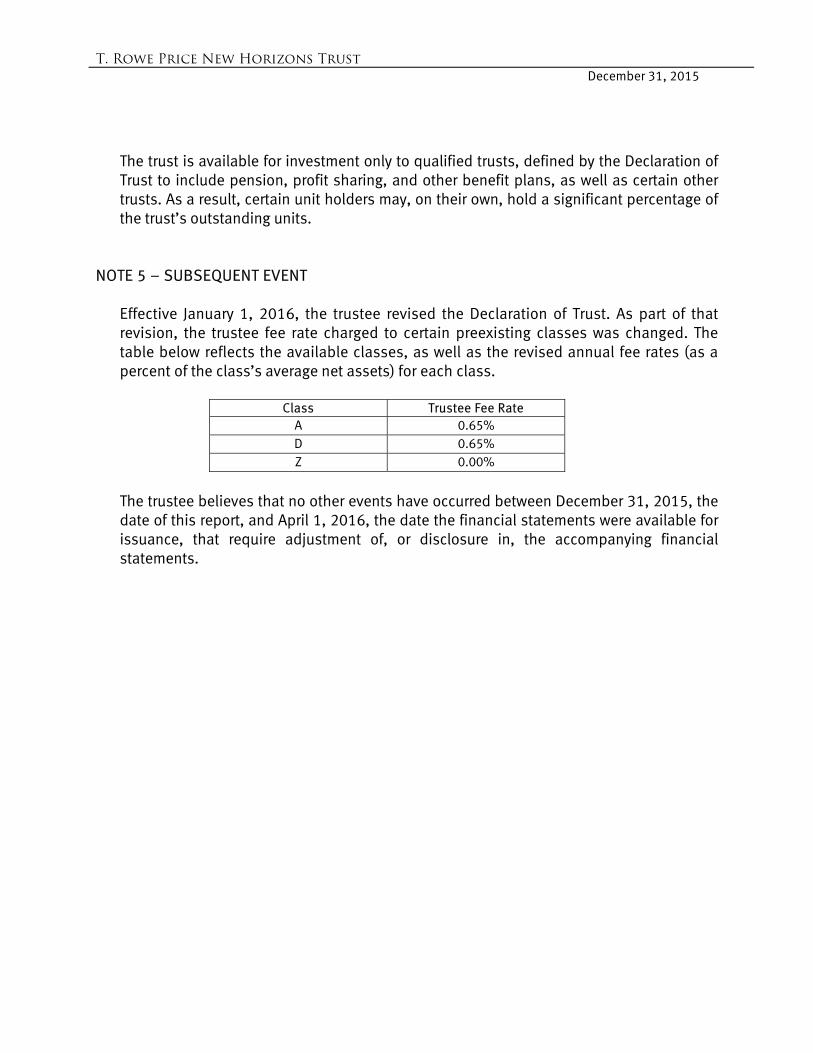
The trust is available for investment only to qualified trusts, defined by the Declaration of Trust to include pension, profit sharing, and other benefit plans, as well as certain other trusts. As a result, certain unit holders may, on their own, hold a significant percentage of the trust’s outstanding units.
NOTE 5 – SUBSEQUENT EVENT
Effective January 1, 2016, the trustee revised the Declaration of Trust. As part of that revision, the trustee fee rate charged to certain preexisting classes was changed. The table below reflects the available classes, as well as the revised annual fee rates (as a percent of the class’s average net assets) for each class.
Class Trustee Fee Rate A 0.65% D 0.65% Z 0.00%
The trustee believes that no other events have occurred between December 31, 2015, the date of this report, and April 1, 2016, the date the financial statements were available for issuance, that require adjustment of, or disclosure in, the accompanying financial statements.
T. Rowe Price New Horizons Trust
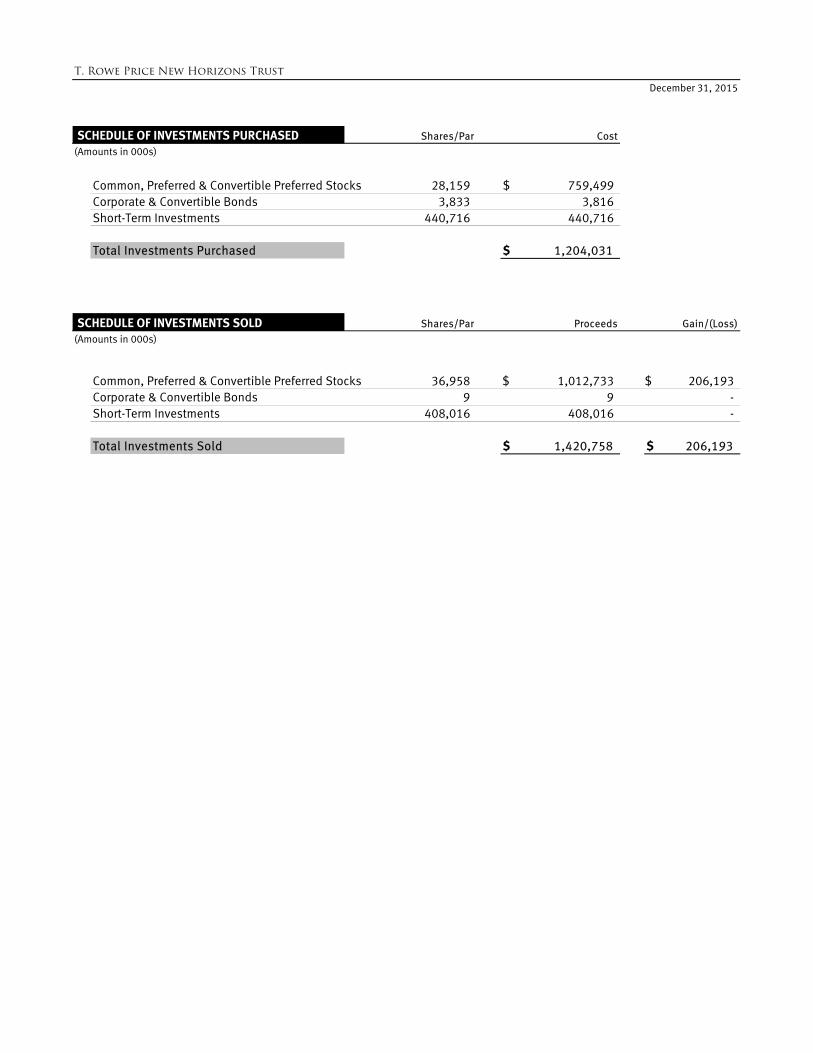
SCHEDULE OF INVESTMENTS PURCHASED Cost(Amounts in 000s)
Common, Preferred & Convertible Preferred Stocks $ 759,499Corporate & Convertible Bonds 3,816Short-Term Investments 440,716
Total Investments Purchased $ 1,204,031
SCHEDULE OF INVESTMENTS SOLD Proceeds Gain/(Loss)(Amounts in 000s)
Common, Preferred & Convertible Preferred Stocks $ 1,012,733 $ 206,193 Corporate & Convertible Bonds 9 - Short-Term Investments 408,016 -
Total Investments Sold $ 1,420,758 $ 206,193
936,958
408,016
December 31, 2015
Shares/Par
28,159
440,716
Shares/Par
3,833
PricewaterhouseCoopers LLP, 100 E. Pratt Street, Suite 1900, Baltimore, MD 21202 T: (410) 783-7600, F: (410) 783-7680, www.pwc.com
Independent Auditor’s Report To the Board of Directors of T. Rowe Price Trust Company and the
Unit holders of T. Rowe Price New Horizons Trust: We have audited the accompanying financial statements of T. Rowe Price New Horizons Trust (one of the trusts comprising T. Rowe Price Institutional Common Trust Fund, hereafter referred to as the "Trust"), which comprise the statement of assets and liabilities, including the portfolio of investments, as of December 31, 2015, and the related statements of operations, of changes in net assets and the financial highlights for the year then ended. These financial statements and financial highlights are hereafter collectively referred to as “financial statements”. Management’s Responsibility for the Financial Statements Management is responsible for the preparation and fair presentation of the financial statements in accordance with accounting principles generally accepted in the United States of America; this includes the design, implementation and maintenance of internal control relevant to the preparation and fair presentation of financial statements that are free from material misstatement, whether due to fraud or error. Auditor’s Responsibility Our responsibility is to express an opinion on the financial statements based on our audit. We conducted our audit in accordance with auditing standards generally accepted in the United States of America. Those standards require that we plan and perform the audit to obtain reasonable assurance about whether the financial statements are free from material misstatement. An audit involves performing procedures to obtain audit evidence about the amounts and disclosures in the financial statements. The procedures selected depend on our judgment, including the assessment of the risks of material misstatement of the financial statements, whether due to fraud or error. In making those risk assessments, we consider internal control relevant to the Trust’s preparation and fair presentation of the financial statements in order to design audit procedures that are appropriate in the circumstances, but not for the purpose of expressing an opinion on the effectiveness of the Trust’s internal control. Accordingly, we express no such opinion. An audit also includes evaluating the appropriateness of accounting policies used and the reasonableness of significant accounting estimates made by management, as well as evaluating the overall presentation of the financial statements. We believe that the audit evidence we have obtained is sufficient and appropriate to provide a basis for our audit opinion. Opinion In our opinion, the financial statements referred to above present fairly, in all material respects, the financial position of T. Rowe Price New Horizons Trust at December 31, 2015, and the results of its operations, changes in its net assets and the financial highlights for the year then ended, in accordance with accounting principles generally accepted in the United States of America.
2
Other Matter Our audit was conducted for the purpose of forming an opinion on the financial statements taken as a whole. The Schedules of Investments Purchased and Investments Sold are presented for purposes of additional analysis and are not a required part of the financial statements. The information is the responsibility of management and was derived from and relates directly to the underlying accounting and other records used to prepare the financial statements. The information has been subjected to the auditing procedures applied in the audit of the financial statements and certain additional procedures, including comparing and reconciling such information directly to the underlying accounting and other records used to prepare the financial statements or to the financial statements themselves and other additional procedures, in accordance with auditing standards generally accepted in the United States of America. In our opinion, the information is fairly stated, in all material respects, in relation to the financial statements taken as a whole.
April 1, 2016