2017 t. rowe price global economic outlook
TRANSCRIPT
GLOBAL ECONOMY
Alan Levenson
Chief U.S. Economist
November 17, 2016
2017 Global Market Outlook Press Briefing
2
48
50
52
54
56
58
2011 2012 2013 2014 2015 2016
Net
Pe
rce
nt
Inc
rea
sin
g
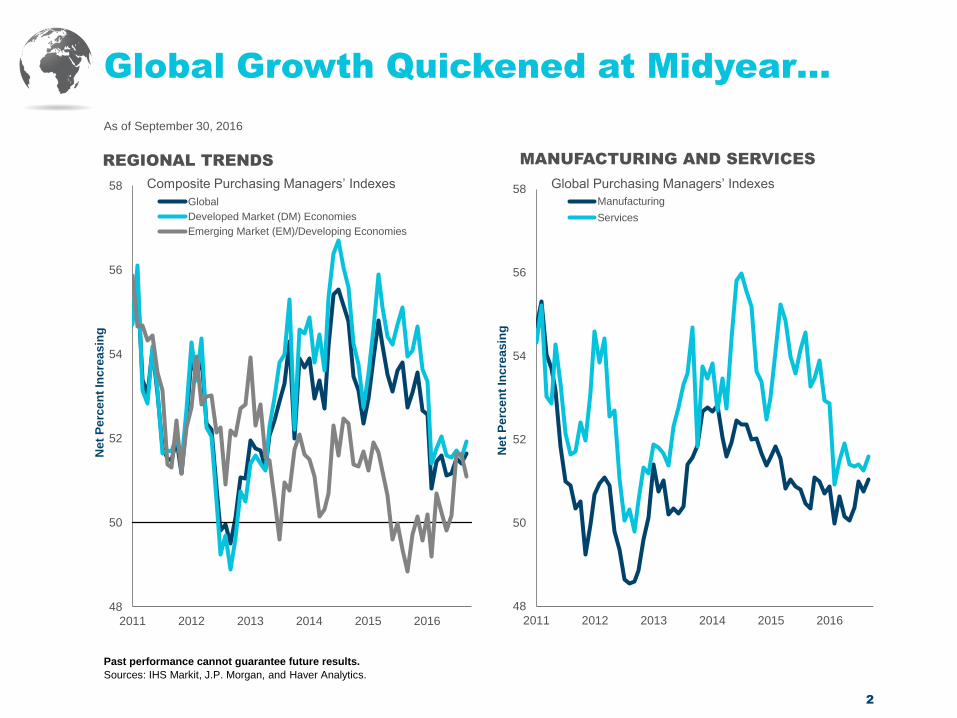
MANUFACTURING AND SERVICES
Manufacturing
Services
Global Purchasing Managers’ Indexes
As of September 30, 2016
Past performance cannot guarantee future results.
Sources: IHS Markit, J.P. Morgan, and Haver Analytics.
Global Growth Quickened at Midyear…
48
50
52
54
56
58
2011 2012 2013 2014 2015 2016
Net
Pe
rce
nt
Inc
rea
sin
g
REGIONAL TRENDS
Global
Developed Market (DM) Economies
Emerging Market (EM)/Developing Economies
Composite Purchasing Managers’ Indexes
3
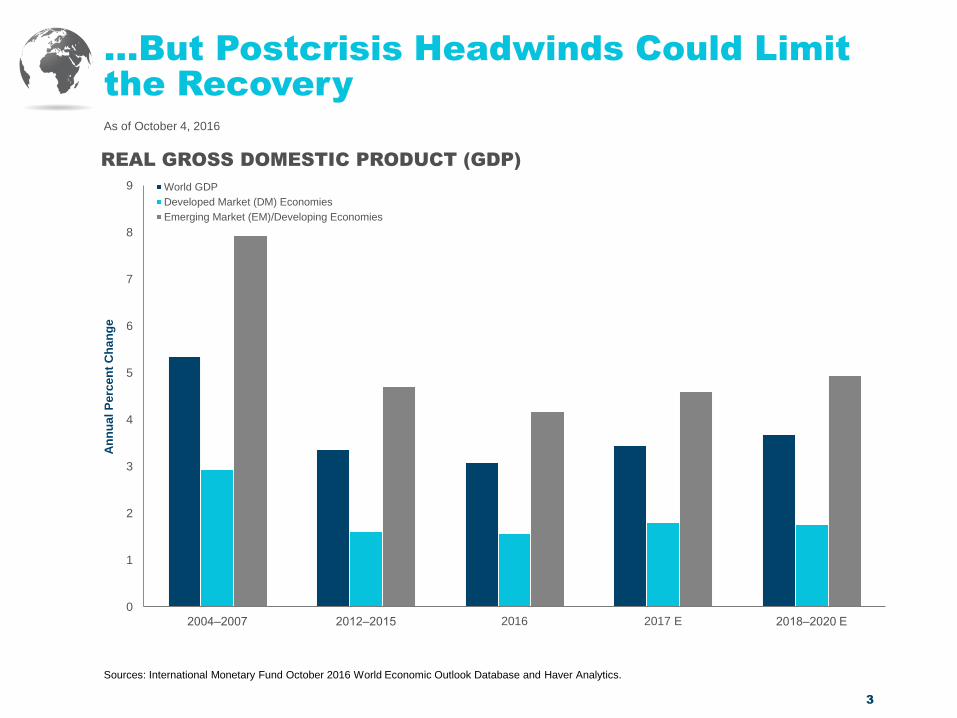
…But Postcrisis Headwinds Could Limit
the Recovery
0
1
2
3
4
5
6
7
8
9
2004‒2007 2012‒2015 2016 2017 E 2018‒2020 E
An
nu
al
Pe
rce
nt
Ch
an
ge
REAL GROSS DOMESTIC PRODUCT (GDP)
World GDP
Developed Market (DM) Economies
Emerging Market (EM)/Developing Economies
As of October 4, 2016
Sources: International Monetary Fund October 2016 World Economic Outlook Database and Haver Analytics.
4
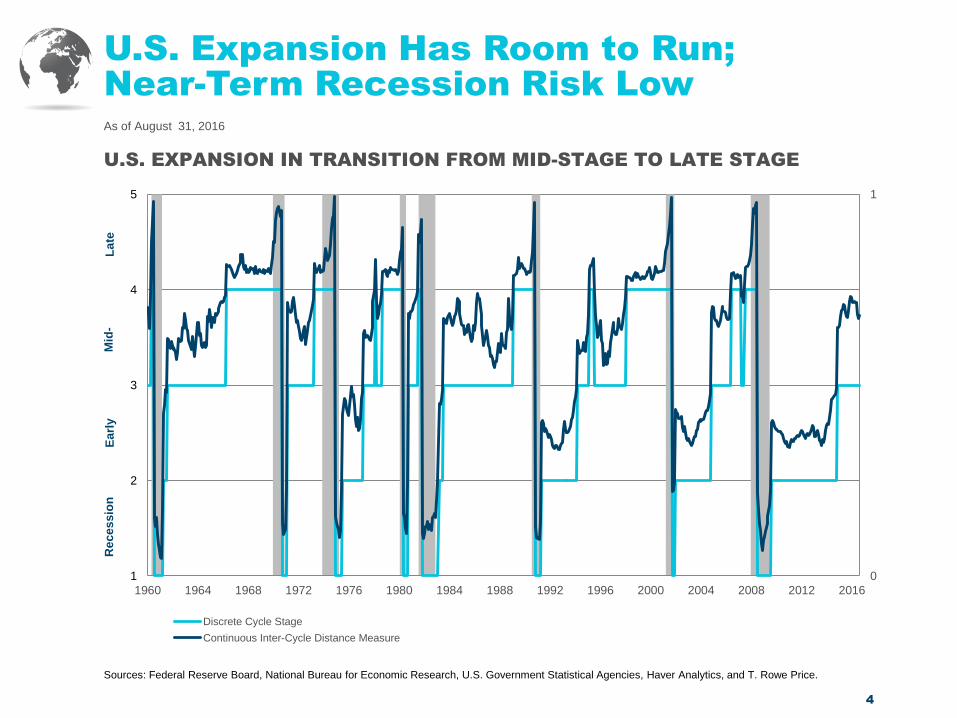
U.S. Expansion Has Room to Run;
Near-Term Recession Risk Low
As of August 31, 2016
Sources: Federal Reserve Board, National Bureau for Economic Research, U.S. Government Statistical Agencies, Haver Analytics, and T. Rowe Price.
0
1
1
2
3
4
5
1960 1964 1968 1972 1976 1980 1984 1988 1992 1996 2000 2004 2008 2012 2016
Discrete Cycle Stage
Continuous Inter-Cycle Distance Measure
Re
ce
ss
ion
E
arl
y
Mid
- L
ate
U.S. EXPANSION IN TRANSITION FROM MID-STAGE TO LATE STAGE
5
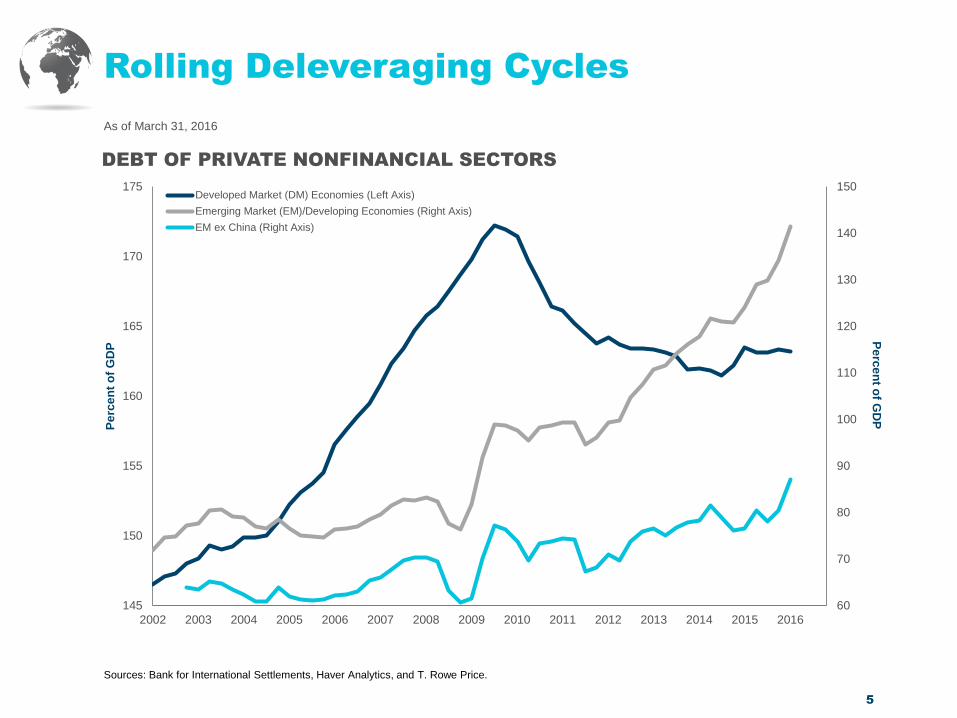
As of March 31, 2016
Sources: Bank for International Settlements, Haver Analytics, and T. Rowe Price.
Rolling Deleveraging Cycles
60
70
80
90
100
110
120
130
140
150
145
150
155
160
165
170
175
2002 2003 2004 2005 2006 2007 2008 2009 2010 2011 2012 2013 2014 2015 2016
Pe
rce
nt o
f GD
P P
erc
en
t o
f G
DP
DEBT OF PRIVATE NONFINANCIAL SECTORS
Developed Market (DM) Economies (Left Axis)
Emerging Market (EM)/Developing Economies (Right Axis)
EM ex China (Right Axis)
6
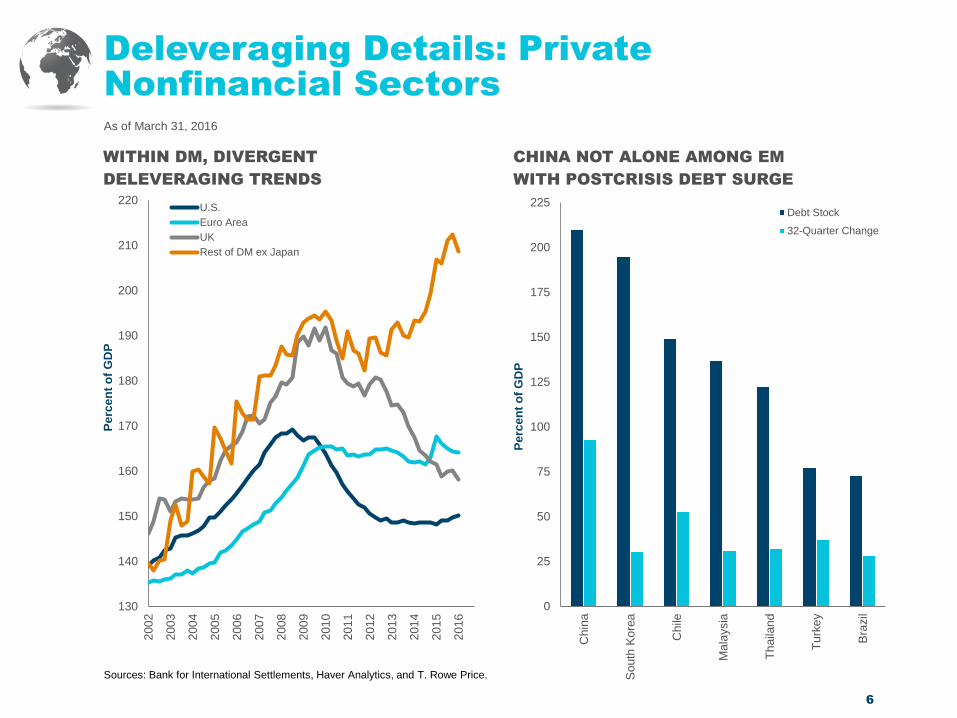
As of March 31, 2016
Sources: Bank for International Settlements, Haver Analytics, and T. Rowe Price.
Deleveraging Details: Private
Nonfinancial Sectors
130
140
150
160
170
180
190
200
210
220
200
2
200
3
200
4
200
5
200
6
200
7
200
8
200
9
201
0
201
1
201
2
201
3
201
4
201
5
201
6
Pe
rce
nt
of
GD
P
WITHIN DM, DIVERGENT
DELEVERAGING TRENDS
U.S.
Euro Area
UK
Rest of DM ex Japan
0
25
50
75
100
125
150
175
200
225
Ch
ina
So
uth
Ko
rea
Chile
Ma
laysia
Th
aila
nd
Tu
rke
y
Bra
zil
Pe
rce
nt
of
GD
P
CHINA NOT ALONE AMONG EM
WITH POSTCRISIS DEBT SURGE
Debt Stock
32-Quarter Change
7
0
2
4
6
8
10
12
14
16
18
20
2008 2009 2010 2011 2012 2013 2014 2015 2016
Pe
rce
nt
Ch
an
ge
, Y
ea
r A
go
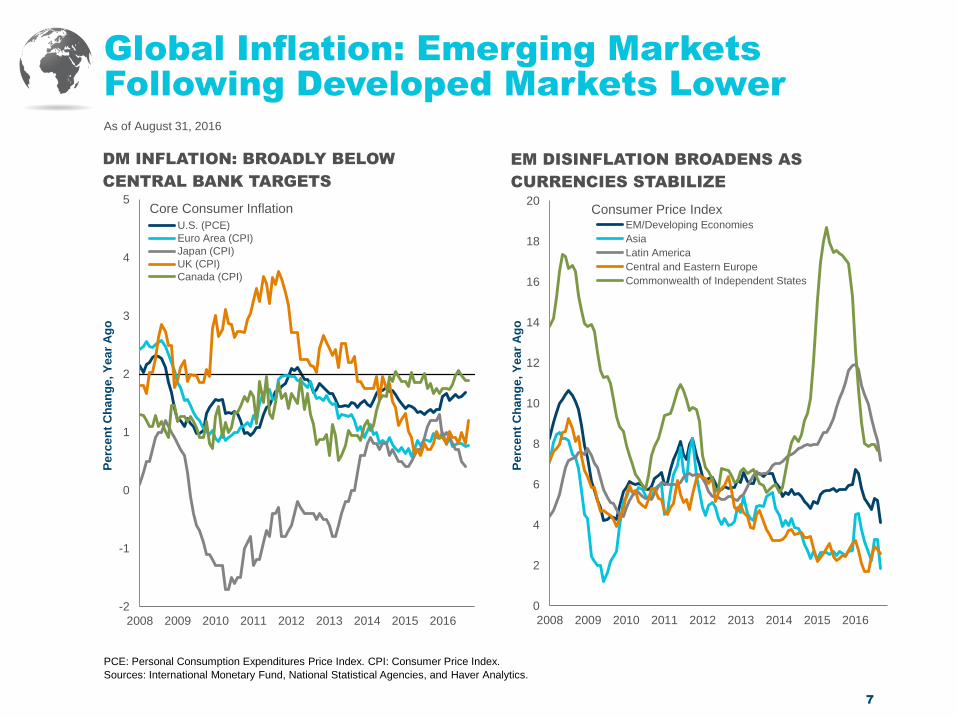
EM DISINFLATION BROADENS AS
CURRENCIES STABILIZE
EM/Developing Economies
Asia
Latin America
Central and Eastern Europe
Commonwealth of Independent States
Consumer Price Index
As of August 31, 2016
PCE: Personal Consumption Expenditures Price Index. CPI: Consumer Price Index.
Sources: International Monetary Fund, National Statistical Agencies, and Haver Analytics.
Global Inflation: Emerging Markets
Following Developed Markets Lower
-2
-1
0
1
2
3
4
5
2008 2009 2010 2011 2012 2013 2014 2015 2016
Pe
rce
nt
Ch
an
ge
, Y
ea
r A
go
DM INFLATION: BROADLY BELOW
CENTRAL BANK TARGETS
U.S. (PCE)
Euro Area (CPI)
Japan (CPI)
UK (CPI)
Canada (CPI)
Core Consumer Inflation
8
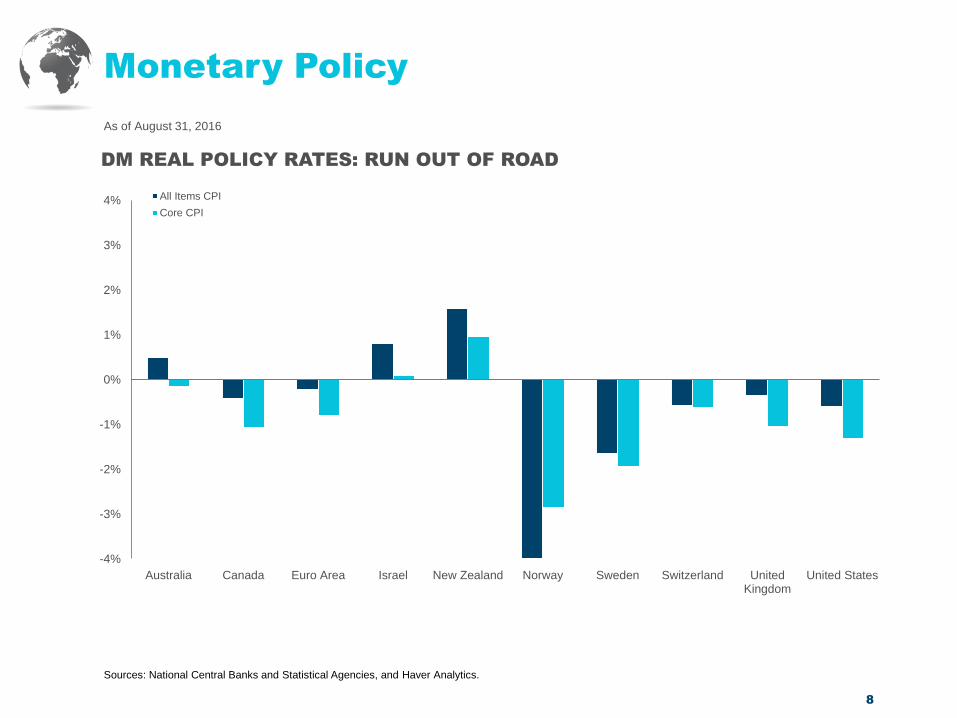
As of August 31, 2016
Sources: National Central Banks and Statistical Agencies, and Haver Analytics.
Monetary Policy
-4%
-3%
-2%
-1%
0%
1%
2%
3%
4%
Australia Canada Euro Area Israel New Zealand Norway Sweden Switzerland UnitedKingdom
United States
DM REAL POLICY RATES: RUN OUT OF ROAD
All Items CPI
Core CPI
9
As of August 31, 2016
Sources: National Central Banks and Statistical Agencies, and Haver Analytics. Details available on request.
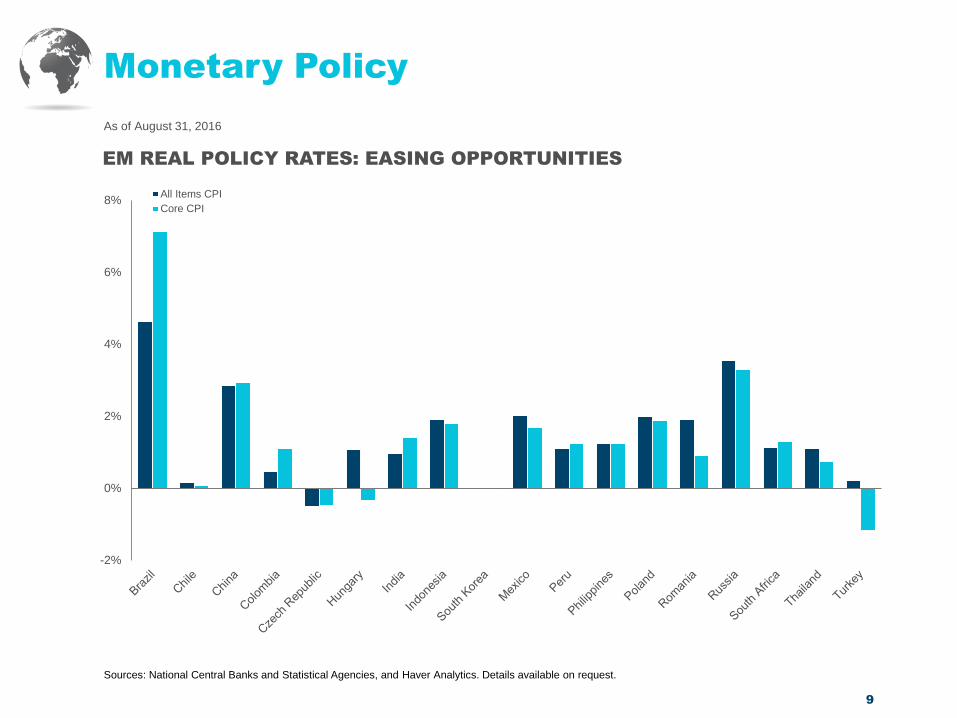
Monetary Policy
-2%
0%
2%
4%
6%
8%
EM REAL POLICY RATES: EASING OPPORTUNITIES
All Items CPI
Core CPI
10
As of October 4, 2016
Sources: International Monetary Fund October 2016 World Economic Outlook Database, Haver Analytics, and T. Rowe Price.
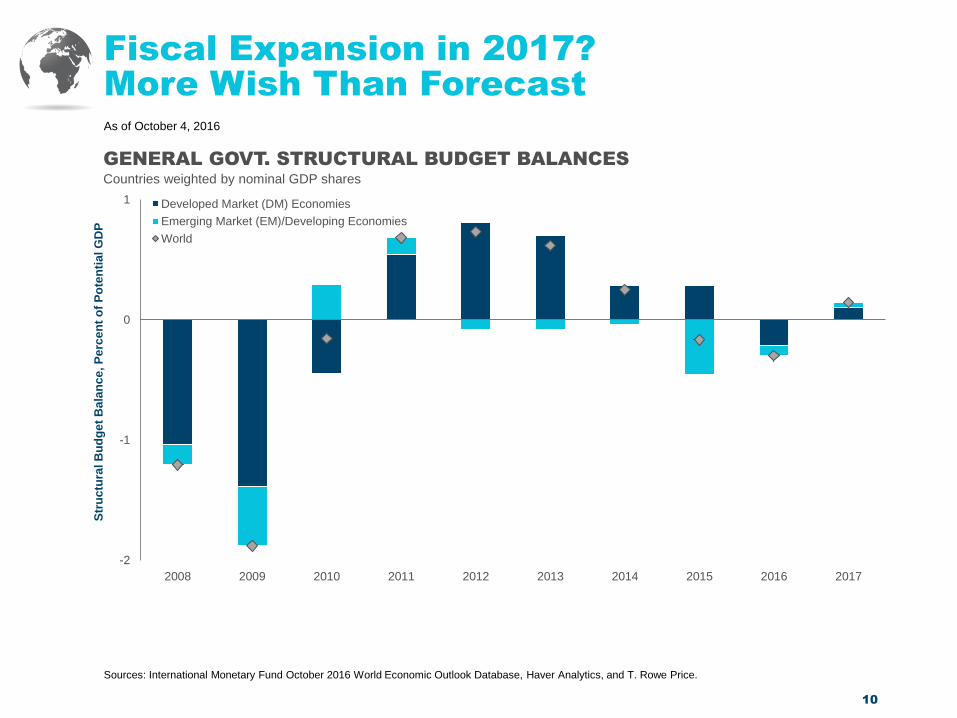
Fiscal Expansion in 2017?
More Wish Than Forecast
-2
-1
0
1
2008 2009 2010 2011 2012 2013 2014 2015 2016 2017
Str
uc
tura
l B
ud
ge
t B
ala
nc
e, P
erc
en
t o
f P
ote
nti
al G
DP
GENERAL GOVT. STRUCTURAL BUDGET BALANCES
Countries weighted by nominal GDP shares
Developed Market (DM) Economies
Emerging Market (EM)/Developing Economies
World
11
Politics
ITALY: Constitutional referendum, December 4, 2016
U.S.: Continuing budget resolution expires December 9, 2016;
debt limit reinstated March 16, 2017
FRANCE: National elections, April‒May 2017
GERMANY: Federal elections, September 2017
CHINA: Communist Party Congress, autumn 2017
As of October 28, 2016
12
Global Outlook Summary
As of October 28, 2016
Growth improving in second half of 2016 as impact of commodity
price plunge fades
Slight improvement in 2017 on rebound in U.S., Canada, Brazil,
and Russia, but deleveraging and restructuring headwinds persist,
particularly in EM
Relative stability in currencies after 2014‒2015 rout fosters
disinflation in EM, contributes to modest U.S. inflation lift
Fed normalization creep to continue, while European Central
Bank (ECB) and Bank of Japan (BoJ) rethink quantitative
easing (QE); EM central bank outlooks mixed, though easing
predominates as inflation falls
13
Important Information
This material is being furnished by T. Rowe Price for general informational purposes only. Under no circumstances should the content, in whole or in part, be copied
or redistributed without consent from T. Rowe Price. The material does not constitute a distribution, an offer, an invitation, recommendation or solicitation to sell or
buy any securities in any jurisdiction. The material has not been reviewed by any regulatory authority in any jurisdiction. The material does not constitute advice of
any nature and prospective investors are recommended to seek independent legal, financial, and tax advice before making any investment decision.
The views contained herein are as of November 2016 and may have changed since that time.
Past performance cannot guarantee future results.
Australia—Issued in Australia by T. Rowe Price International Ltd (ABN 84 104 852 191), Level 50, Governor Phillip Tower, 1 Farrer Place, Suite 50B, Sydney, NSW
2000, Australia. T. Rowe Price International Ltd is exempt from the requirement to hold an Australian financial services licence in respect of the financial services it
provides in Australia. T. Rowe Price International Ltd is authorised and regulated by the UK Financial Conduct Authority under UK laws, which differ from Australian
laws. For Wholesale Clients only.
Canada—Issued in Canada by T. Rowe Price (Canada), Inc. T. Rowe Price (Canada), Inc.’s investment management services are only available to Accredited
Investors as defined under National Instrument 45-106. T. Rowe Price (Canada), Inc. enters into written delegation agreements with affiliates to provide investment
management services.
DIFC—Issued in the Dubai International Financial Centre by T. Rowe Price International Ltd. This material is communicated on behalf of T. Rowe Price International
Ltd by its representative office which is regulated by the Dubai Financial Services Authority. For Professional Clients only.
EEA—Issued in the European Economic Area by T. Rowe Price International Ltd, 60 Queen Victoria Street, London EC4N 4TZ which is authorised and regulated by
the UK Financial Conduct Authority. For Professional Clients only.
Hong Kong—Issued in Hong Kong by T. Rowe Price Hong Kong Limited, 21/F, Jardine House, 1 Connaught Place, Central, Hong Kong. T. Rowe Price Hong Kong
Limited is licensed and regulated by the Securities & Futures Commission. For Professional Investors only.
Singapore—Issued in Singapore by T. Rowe Price Singapore Private Ltd., No. 501 Orchard Rd, #10-02 Wheelock Place, Singapore 238880. T. Rowe Price
Singapore Private Ltd. is licensed and regulated by the Monetary Authority of Singapore. For Institutional and Accredited Investors only.
Switzerland—Issued in Switzerland by T. Rowe Price (Switzerland) GmbH ("TRPSWISS"), Talstrasse 65, 6th Floor, 8001 Zurich, Switzerland. For Qualified
Investors only.
USA (public)—Issued in the USA by T. Rowe Price Associates, Inc., and by T. Rowe Price Investment Services, Inc., 100 East Pratt Street, Baltimore, MD, 21202.
T. ROWE PRICE, INVEST WITH CONFIDENCE and the Bighorn Sheep design are, collectively and/or apart, trademarks or registered trademarks of T. Rowe Price
Group, Inc. in the United States, European Union, and other countries. This material is intended for use only in select countries.
77306
THANK YOU.