december investor presentation - s2.q4cdn.com · in this presentation, proved reserves attributable...
TRANSCRIPT

Investor PresentationDecember 2018

Forward-Looking Statements and Other Disclaimers
Forward-Looking Statements and Cautionary StatementsThe foregoing contains “forward-looking statements” within the meaning of Section 27A of the Securities Act of 1933 and Section 21E of the Securities Exchange Act of 1934. All statements, other than statements of historical fact, included in this presentation thataddress activities, events or developments that the Company expects, believes or anticipates will or may occur in the future are forward-looking statements. Forward-looking statements contained in this presentation specifically include statements relating tobenefits of the acquisition of RSP Permian, Inc. (“RSP”). The words “estimate,” “project,” “predict,” “believe,” “expect,” “anticipate,” “potential,” “could,” “may,” “enable,” “foresee,” “plan,” “will,” “guidance,” “outlook,” “goal” or other similar expressions that convey theuncertainty of future events or outcomes are intended to identify forward-looking statements, which generally are not historical in nature. However, the absence of these words does not mean that the statements are not forward-looking. These statements arebased on certain assumptions and analyses made by the Company based on management’s experience, expectations and perception of historical trends, current conditions, anticipated future developments and other factors believed to be appropriate. Forward-looking statements are not guarantees of performance. Although the Company believes the expectations reflected in its forward-looking statements are reasonable and are based on reasonable assumptions, no assurance can be given that these assumptions areaccurate or that any of these expectations will be achieved (in full or at all) or will prove to have been correct. Moreover, such statements are subject to a number of assumptions, risks and uncertainties, many of which are beyond the control of the Company,which may cause actual results to differ materially from those implied or expressed by the forward-looking statements. These include the risk factors and other information discussed or referenced in the Company’s most recent Annual Report on Form 10-K andother filings with the SEC. Any forward-looking statement speaks only as of the date on which such statement is made, and the Company undertakes no obligation to correct or update any forward-looking statement, whether as a result of new information, futureevents or otherwise, except as required by applicable law.
This presentation includes financial measures that are not in accordance with generally accepted accounting principles (“GAAP”), including free cash flow and EBITDAX. While management believes that such measures are useful for investors, they should not beused as a replacement for financial measures that are in accordance with GAAP. For definitions of such measures and the reconciliation of EBITDAX to the nearest comparable measure in accordance with GAAP, please see the appendix.
The SEC requires oil and natural gas companies, in their filings with the SEC, to disclose proved reserves, which are those quantities of oil and natural gas, which, by analysis of geoscience and engineering data, can be estimated with reasonable certainty to beeconomically producible—from a given date forward, from known reservoirs and under existing economic conditions (using the trailing 12-month average first-day-of-the-month prices), operating methods and government regulations—prior to the time at whichcontracts providing the right to operate expire, unless evidence indicates that renewal is reasonably certain, regardless of whether deterministic or probabilistic methods are used for the estimation. The SEC also permits the disclosure of separate estimates ofprobable or possible reserves that meet SEC definitions for such reserves; however, the Company currently does not disclose probable or possible reserves in its SEC filings.
In this presentation, proved reserves attributable to the Company at December 31, 2017 are estimated utilizing SEC reserve recognition standards and pricing assumptions based on the trailing 12-month average first-day-of-the-month prices of $47.79 per Bbl ofoil and $2.98 per MMBtu of natural gas. The Company’s estimate of its total proved reserves at December 31, 2017 is based on reports prepared by Cawley, Gillespie & Associates, Inc. and Netherland, Sewell & Associates, Inc., independent petroleum engineers.The Company may use the terms “unproved reserves,” “resources” and similar phrases to describe estimates of potentially recoverable hydrocarbons that the SEC rules prohibit from being included in filings with the SEC. These are based on analogy to theCompany’s existing models applied to additional acres, additional zones and tighter spacing and are the Company’s internal estimates of hydrocarbon quantities that may be potentially discovered through exploratory drilling or recovered with additional drilling orrecovery techniques. These quantities may not constitute “reserves” within the meaning of the Society of Petroleum Engineer’s Petroleum Resource Management System or SEC rules. Such estimates and identified drilling locations have not been fully risked byCompany management and are inherently more speculative than proved reserves estimates. Actual locations drilled and quantities that may be ultimately recovered from the Company’s interests could differ substantially from these estimates. There is nocommitment by the Company to drill all of the drilling locations that have been attributed to these quantities. Factors affecting ultimate recovery include the scope of the Company’s ongoing drilling program, which will be directly affected by the availability of capital,drilling and production costs, availability of drilling services and equipment, drilling results, lease expirations, transportation constraints, regulatory approvals, actual drilling results, including geological and mechanical factors affecting recovery rates, and otherfactors. Such estimates may change significantly as development of the Company’s oil and natural gas assets provide additional data. The Company’s production forecasts and expectations for future periods are dependent upon many assumptions, includingestimates of production decline rates from existing wells and the undertaking and outcome of future drilling activity, which may be affected by significant commodity price declines or drilling cost increases or other factors that are beyond the Company’s control.
Cautionary Statements Regarding ResourceConcho may use the term “resource potential” and similar phrases to describe estimates of potentially recoverable hydrocarbons that SEC rules prohibit from being included in filings with the SEC. These are based on analogy to Concho’s existing models appliedto additional acres, additional zones and tighter spacing and are Concho’s internal estimates of hydrocarbon quantities that may be potentially discovered through exploratory drilling or recovered with additional drilling or recovery techniques. These quantities maynot constitute “reserves” within the meaning of the Society of Petroleum Engineer’s Petroleum Resource Management System or SEC rules. Such estimates and identified drilling locations have not been fully risked by Concho management and are inherentlymore speculative than proved reserves estimates. Actual locations drilled and quantities that may be ultimately recovered from Concho’s interests could differ substantially from these estimates. There is no commitment by Concho to drill all of the drilling locationsthat have been attributed to these quantities. Factors affecting ultimate recovery include the scope of Concho’s ongoing drilling program, which will be directly affected by the availability of capital, drilling and production costs, availability of drilling services andequipment, drilling results, lease expirations, transportation constraints, regulatory approvals, actual drilling results, including geological and mechanical factors affecting recovery rates, and other factors. Such estimates may change significantly as development ofConcho’s oil and natural gas assets provide additional data. Concho’s production forecasts and expectations for future periods are dependent upon many assumptions, including estimates of production decline rates from existing wells and the undertaking andoutcome of future drilling activity, which may be affected by significant commodity price declines or drilling cost increases or other factors that are beyond Concho’s control. Concho’s use of the term “premium resource” refers to assets with the capacity to produceat an internal rate of return that is greater than thirty-five percent based on fifty-five dollar oil and three dollar gas.
2

Concho ResourcesLeading Development of the Permian Basin
3
The Permian BasinOur home for 30+ years
Home-field advantage with HQ in Midland, Texas
The pillars of our strategyBuilding a great team
Investing in high-margin assets
Generating high-quality returns
Maintaining a strong balance sheet
Leadership Position~640,000 net acres
CXO Acreage
Note: Concho acreage as of December 31, 2017, pro forma for transactions announced to date.
Texas
New Mexico
Permian Basin
10.8 10.5
4.6 4.4
4.2 3.7
3.2 2.9
2.6 1.9 1.9 1.9
1.6 1.6 1.5 1.4 1.3
1.0 0.9
United StatesRussia
Saudi ArabiaIraqIran
CanadaChinaU.A.E
KuwaitBrazil
KazakhstanMexicoNigeriaAngolaNorway
QatarVenezuela
AlgeriaOman
U.K
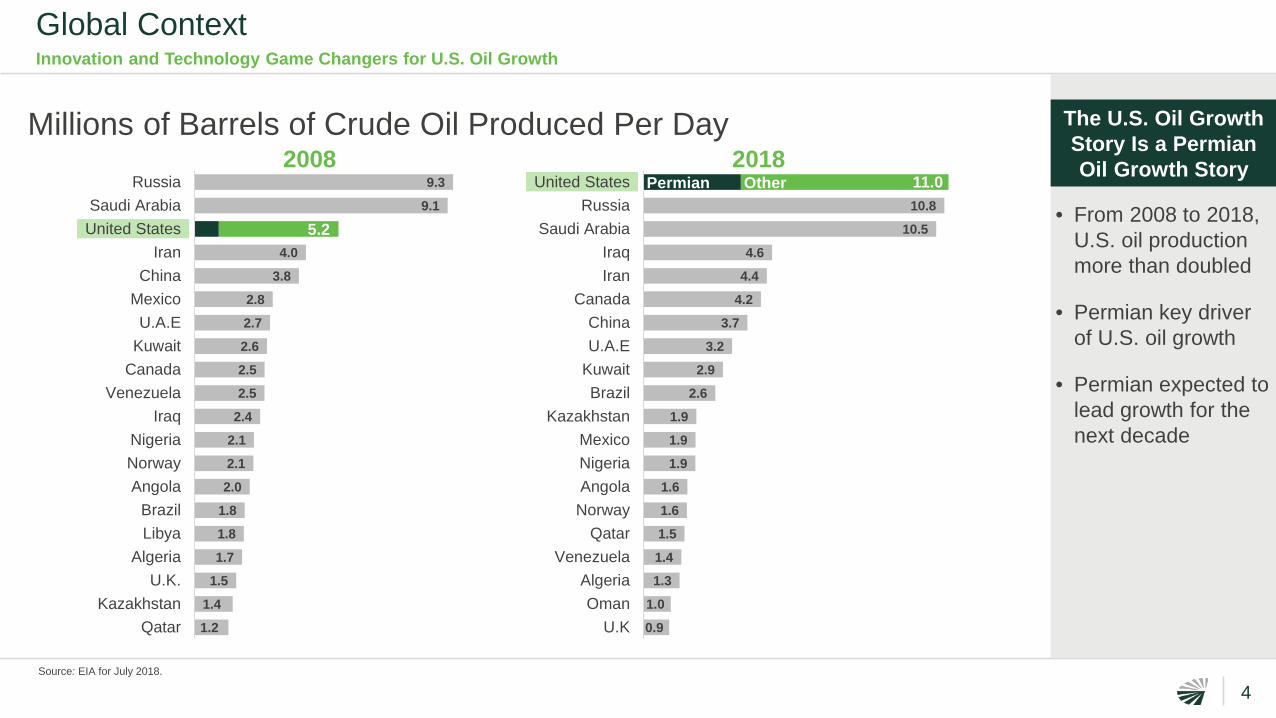
Global ContextInnovation and Technology Game Changers for U.S. Oil Growth
The U.S. Oil Growth Story Is a Permian Oil Growth Story
• From 2008 to 2018, U.S. oil production more than doubled
• Permian key driver of U.S. oil growth
• Permian expected to lead growth for the next decade
4
9.3 9.1
4.0 3.8
2.8 2.7 2.6 2.5 2.5
2.4 2.1 2.1 2.0
1.8 1.8 1.7
1.5 1.4 1.2
RussiaSaudi ArabiaUnited States
IranChina
MexicoU.A.E
KuwaitCanada
VenezuelaIraq
NigeriaNorwayAngola
BrazilLibya
AlgeriaU.K.
KazakhstanQatar
Millions of Barrels of Crude Oil Produced Per Day2008 2018
5.2
11.0
Source: EIA for July 2018.
Permian Other 11.0

Well Positioned with Unique Competitive AdvantagesLeveraging Our Advantages to Deliver Growth and Value
5
Our Advantages
Execution Strength and Scale
Breadth and Depth of High-Quality
Portfolio
Superior Capital EfficiencyFinancial Strength
• Running one of the largest rig programs
• Largest shale producer• Leader in horizontal
development
• Balanced portfolio within the Permian
• ~30 years of premium resource at current development pace
• Delivering production growth and free cash flow
• Leading production growth per debt-adjusted share performance
• Low leverage provides substantial flexibility
• <1.5x target leverage ratio
• Investment grade credit ratings
Note: Leverage ratio determined using total long-term debt and the non-GAAP measure EBITDAX. See appendix for definition of EBITDAX.

Execution Strength and ScaleLeading Large-Scale Development in the Permian
6
Running a Large, Manufacturing-Like Program to Maximize Resource Recovery and Economics
Mitigates parent/child well degradation and downtime for offset activity Captures supply chain and logistics advantages Accelerates learning and adaptation
Vertical SpacingHorizontal Spacing Sequencing (order in which zones are completed)Timing
1234
Manufacturing Mode Accounts for All Four Dimensions and…
Four Dimensions of Full-Field Development:
1 MILE
2 MILES
660’
660’
660’

High-Quality PortfolioHigh-Grading Assets Through Continuous Portfolio Management
7
Concho Acreage Then: 2016
CXO Acreage
New Mexico Shelf
Delaware Basin
Note: Concho acreage as of January 31, 2016.
MidlandBasin

High-Quality PortfolioHigh-Grading Assets Through Continuous Portfolio Management
8
Building for the Future: Concho Acreage Now
Balanced portfolio within the Permian
Big, blocky position with high working interest that is amenable to large-scale development
Strategic, complementary additions
Trades enhance core positions
Divestment of non-core leasehold and assets
CXO AcreageCXO Acreage Additions/Trades
Note: Concho acreage as of December 31, 2017, pro forma for transactions announced to date.
New Mexico Shelf
Delaware Basin
MidlandBasin

Financial StrengthLow Leverage Provides Significant Flexibility
9
5.72%
4.37%
3Q16 3Q18
Avg. Maturity(years)
6.5 15.6
Average Coupon Rate
• Investment grade credit ratings
• Reducing cost of capital
• Lower interest expense supporting margin expansion
• Average maturity extended

Source: Bloomberg.Note: Reflects 10-year CAGR ended September 30, 2018. Oil-weighted peers have >50% oil mix; gas-weighted peers have <50% oil mix.Note: Average does not include CXO.
Superior Capital Efficiency10-Year Production Growth per Debt-Adjusted Share
10
-6%
-3% -3%
0% 0%1% 1%
2%
5%6%
9% 9%11%
21% 21%23%
A B C D E F G H I J K L M N P
Average: 5.1%
Peers
Oil-Weighted Peers Gas-Weighted Peers

Track Record of Delivering Production Growth & Free Cash FlowFoundation for New Capital Allocation Framework
11
$-
$10.00
$20.00
$30.00
$40.00
$50.00
$60.00
$70.00
$80.00
WTI
Pric
e ($
/Bbl
)
$301
$236 $253
$272 $274
$351
$393 $383
$427
$471 $450
$501
$761
$436
$326
$370
$306 $343
$365
$407 $398 $380
$510 $488
$602
$771
149 144 139145
153164
181 185193
211
228 229
287
3Q15 4Q15 1Q16 2Q16 3Q16 1Q18
D&C Capital Cash Flow from Operating Activities Production (MBoepd) WTI Price ($/Bbl)Note: Free cash flow is a non-GAAP measure. See appendix for reconciliation to GAAP measure. Drilling & Completion (D&C) capital represents exploration and development costs incurred for oil and natural gas producing activities for each quarter shown. See appendix for a summary of costs incurred.
4Q16
Cash Flow from Operating Activities vs. D&C Capital ($mm)
3Q182Q181Q17 2Q17 3Q17 4Q17
Organic Growth & RSP
Takeaways Free cash flow
generation for 12 out of past 13 quarters
Sustained performance driven by efficient, disciplined capital allocation
Sets foundation for new capital allocation framework
Generated ~$630mm Free Cash Flow Since 3Q15

New Capital Allocation Framework
Historically guided by growth-within-cash flow framework
Historically guided by growth within cash flow
Enhance free cash flow generation and corporate returns
Disciplined approach to growth
Capital returns to shareholders
Maintain a strong balance sheet
Cash Flow Priorities Free Cash Flow Opportunities
Capital Program Dividend Strengthen
Balance Sheet
Additional Returns to
Shareholders
Portfolio Enhancement
Our Mindset• Reflects evolution
of the E&P business model
• Substantial free cash flow momentum following RSP combination
• Underscores outlook for sustainable, profitable growth and returns
12Note: Free cash flow is a non-GAAP measure. See appendix for reconciliation to GAAP measure.
Driving Shareholder Returns

2019 Development Sets Up Strong 2020+
13
2019 Development OutlookMore Capital to Large-Scale Projects Significant Increase in Lateral Length Production Starts 2H19-Weighted
1H19 2H19
Drilling
Completing
Put on Production
400-420
350-370
390-410
Gross Operated Activity
Note: A large-scale project includes 4 wells or more. 2018e RSP activity reflects RSP’s standalone plan. Gross operated activity represents the wells the Company expects to start drilling, completing and/or put on production.
2018e 2019e
~25%
Capital Allocated to Large-Scale Projects
~65%
~80%
~70%
RSP
CXO RSP
Tota
l Pro
gram
Average Lateral Length
2018e 2019e
~7.8k’
~8.1k’
~9.7k’~8.7k’
RSP
CXO RSP
Tota
l Pro
gram
20%
Annual # of Wells

2019-2020 Financial Outlook
2019 Development Sets Up Strong 2020+
14Notes: Capital program excludes acquisitions. 2019e crude oil growth and total production growth guidance equates to 16%-20% and 12%-16%, respectively, on a pro forma basis. The two-year crude oil and total production CAGR guidance equates to 20% and 17%, respectively, on a pro forma basis from 2018 to 2020. Free cash flow is a non-GAAP measure. See appendix for reconciliation to GAAP measure. Additionally, ROCE is a non-GAAP measure that is defined as net income plus after-tax interest expense divided by average stockholders equity plus average net debt.
Exit Rate Outlook4Q 2018 4Q 2019• +25% crude oil
growth• +18% total
production growth
Capital Program
Free Cash Flow (FCF)
Crude Oil Growth
Total Production Growth
ROCE
$3.4-$3.6bn
FCF+35%-40%
25%-30%
>Cost of Capital
2019e 2019e-2020e
2020+ >10%
25% 2-YR CAGR
30% 2-YR CAGR
Run ~34 rigs in ‘19;~38 rigs in ‘20
FCF+
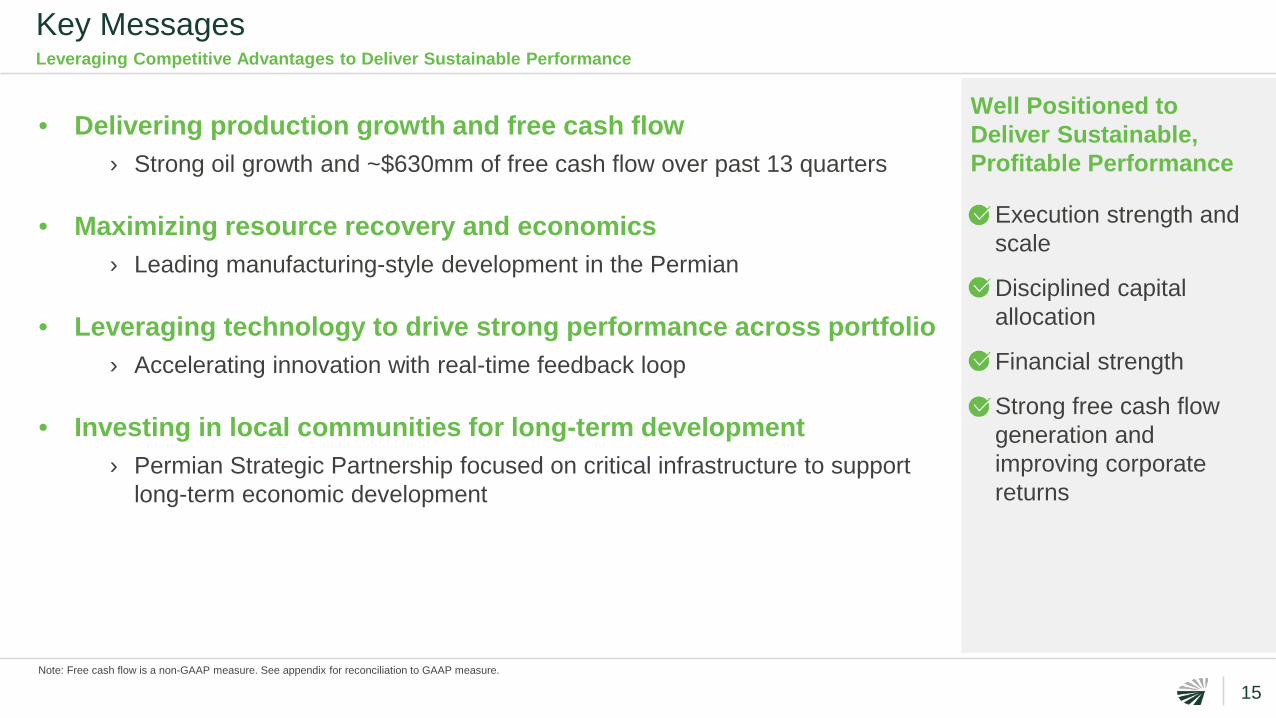
Key MessagesLeveraging Competitive Advantages to Deliver Sustainable Performance
15
Well Positioned to Deliver Sustainable, Profitable Performance
• Execution strength and scale
• Disciplined capital allocation
• Financial strength
• Strong free cash flow generation and improving corporate returns
• Delivering production growth and free cash flow› Strong oil growth and ~$630mm of free cash flow over past 13 quarters
• Maximizing resource recovery and economics› Leading manufacturing-style development in the Permian
• Leveraging technology to drive strong performance across portfolio› Accelerating innovation with real-time feedback loop
• Investing in local communities for long-term development› Permian Strategic Partnership focused on critical infrastructure to support
long-term economic development
Note: Free cash flow is a non-GAAP measure. See appendix for reconciliation to GAAP measure.
Appendix

3Q 2018 Operational HighlightsScaling Development to Maximize Recoveries and Economics
17Note: Well results provided for wells with >60 days of production data in 3Q18. Concho moved from 4 operating areas to 2. Delaware Basin asset performance excludes New Mexico Shelf results. Historical data for Delaware Basin and Midland Basin is provided in the appendix.
Activity Overview
Delaware Basin
MidlandBasin
CXO Acreage3Q18 well•
Key Operating StatsMoved to 2 Operating Areas from 4
› Delaware Basin & Midland BasinOperated Rigs
› 3Q18 average: 31 rigsCompletion Crews
› 3Q18 average: 9 crews
Asset Performance
Recent Large-Scale Projects
› Added 31 horizontal wells (avg. lateral length 6,685’)• Avg. 30-day peak rate: 1,422 Boepd
(73% oil)• Avg. 60-day peak rate: 1,269 Boepd
(73% oil)
Delaware Basin› Added 34 horizontal wells (avg. lateral
length 9,686’)• Avg. 30-day peak rate: 1,178 Boepd
(86% oil)• Avg. 60-day peak rate: 1,066 Boepd
(85% oil)
Midland Basin
White Falcon7 wells› Targets: 3rd Bone Spring,
Wolfcamp A› Avg. lateral length: 8,772’› Avg. 30-day peak rate:
1,804 Boepd per well(84% oil)
Iceman/Hollywood8 wells› Targets: 3rd Bone Spring,
Wolfcamp A› Avg. lateral length: 11,679’› Avg. 30-day peak rate:
1,765 Boepd per well(70% oil)
Windham B10 wells› Targets: Lower Spraberry,
Wolfcamp A, B and C› Avg. lateral length: 10,332’› Avg. 30-day peak rate:
1,238 Boepd per well(84% oil)
1
2
3
1 2 3

Large-Scale Project UpdateStatus of 2Q18 Announced Projects
18
Delaware Basin
MidlandBasin
CXO Acreage
Delaware Basin› Taylor – 8 wells
Key Projects on RSP Acreage
Midland Basin› Calverley – 6 wells› Spanish Trail – 5 wells› Ted Johnson – 13 wells
Delaware BasinProject Well Count Drilling Completion ProductionTiger Cat 4 ✔ ✔ ✔Gettysburg 5 ✔ ✔ 4Q18
Dominator 23 ✔ In progress 1H19
Eider 12 ✔ In progress 1H19
Jack 6 In progress 1H19 1H19
Taylor 8 1H19 2H19 2H19
Midland BasinProject Well Count Drilling Completion ProductionCalverley 6 ✔ ✔ ✔Windham TXL 11 ✔ In progress 4Q18
Pegasus 6 ✔ 4Q18 1H19
Spanish Trail 5 ✔ 4Q18 1H19
Ted Johnson 13 4Q18 1H19 2H19

Historical Well PerformanceHistorical Activity Tables & Well Results
19Note: Horizontal wells added include wells that had at least 60 days of production in each respective quarter; excludes RSP activity prior to closing date of July 19, 2018. Delaware Basin asset performance excludes New Mexico Shelf results.
Horizontal Wells Added 1Q17 2Q17 3Q17 4Q17 1Q18 2Q18 3Q18Delaware Basin 25 20 23 27 33 21 31Midland Basin 21 31 13 10 20 21 34
Avg. 30-Day Peak Rates (Boepd) 1Q17 2Q17 3Q17 4Q17 1Q18 2Q18 3Q18Delaware Basin 1,530 1,532 1,392 1,787 2,042 1,863 1,422Midland Basin 1,164 923 1,272 1,102 1,156 1,294 1,178
Avg. Lateral Length (ft.) 1Q17 2Q17 3Q17 4Q17 1Q18 2Q18 3Q18Delaware Basin 6,200 7,168 7,171 7,093 8,964 7,358 6,685Midland Basin 9,910 9,995 10,198 11,620 10,156 9,800 9,686
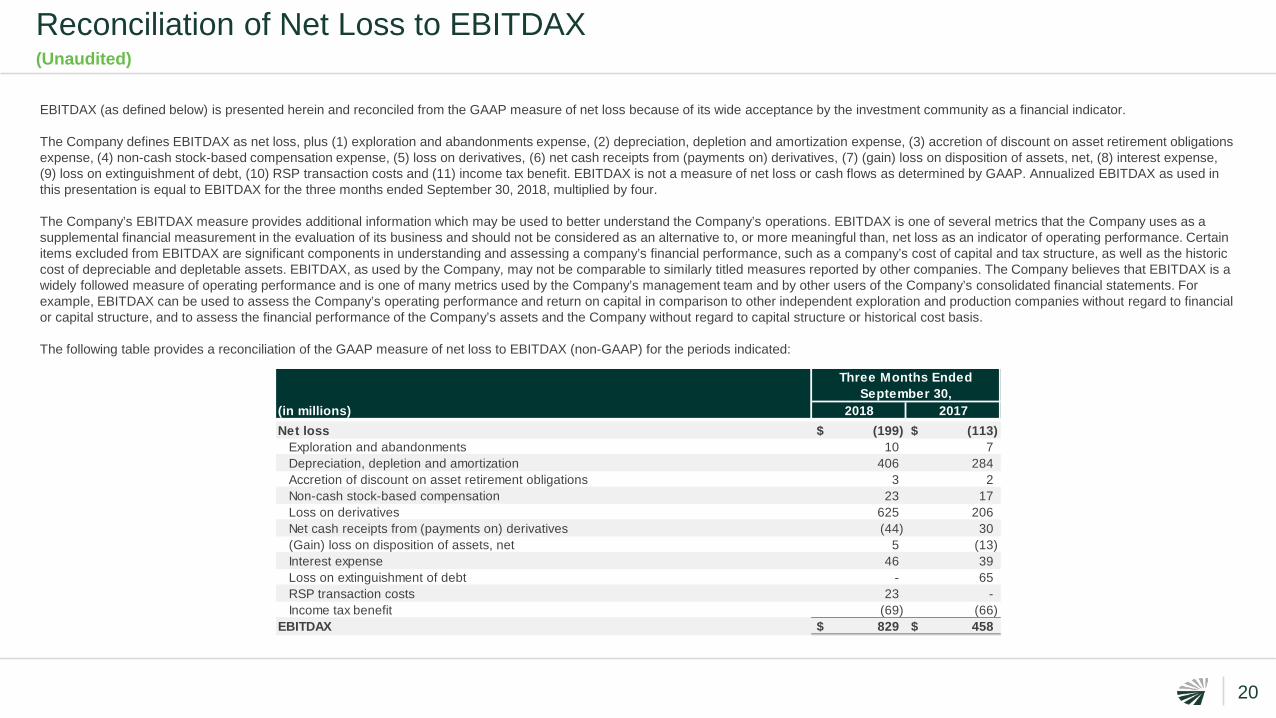
Reconciliation of Net Loss to EBITDAX(Unaudited)
20
EBITDAX (as defined below) is presented herein and reconciled from the GAAP measure of net loss because of its wide acceptance by the investment community as a financial indicator.
The Company defines EBITDAX as net loss, plus (1) exploration and abandonments expense, (2) depreciation, depletion and amortization expense, (3) accretion of discount on asset retirement obligations expense, (4) non-cash stock-based compensation expense, (5) loss on derivatives, (6) net cash receipts from (payments on) derivatives, (7) (gain) loss on disposition of assets, net, (8) interest expense, (9) loss on extinguishment of debt, (10) RSP transaction costs and (11) income tax benefit. EBITDAX is not a measure of net loss or cash flows as determined by GAAP. Annualized EBITDAX as used in this presentation is equal to EBITDAX for the three months ended September 30, 2018, multiplied by four.
The Company’s EBITDAX measure provides additional information which may be used to better understand the Company’s operations. EBITDAX is one of several metrics that the Company uses as a supplemental financial measurement in the evaluation of its business and should not be considered as an alternative to, or more meaningful than, net loss as an indicator of operating performance. Certain items excluded from EBITDAX are significant components in understanding and assessing a company’s financial performance, such as a company’s cost of capital and tax structure, as well as the historic cost of depreciable and depletable assets. EBITDAX, as used by the Company, may not be comparable to similarly titled measures reported by other companies. The Company believes that EBITDAX is a widely followed measure of operating performance and is one of many metrics used by the Company’s management team and by other users of the Company’s consolidated financial statements. For example, EBITDAX can be used to assess the Company’s operating performance and return on capital in comparison to other independent exploration and production companies without regard to financial or capital structure, and to assess the financial performance of the Company’s assets and the Company without regard to capital structure or historical cost basis.
The following table provides a reconciliation of the GAAP measure of net loss to EBITDAX (non-GAAP) for the periods indicated:
Net loss $ (199) $ (113)Exploration and abandonments 10 7Depreciation, depletion and amortization 406 284Accretion of discount on asset retirement obligations 3 2Non-cash stock-based compensation 23 17Loss on derivatives 625 206Net cash receipts from (payments on) derivatives (44) 30(Gain) loss on disposition of assets, net 5 (13) Interest expense 46 39Loss on extinguishment of debt - 65 RSP transaction costs 23 - Income tax benefit (69) (66)
EBITDAX $ 829 $ 458
(in millions)
Three Months EndedSeptember 30,
2018 2017

Reconciliation of Net Cash Provided by Operating Activities to EBITDAX(Unaudited)
21
EBITDAX is presented herein and reconciled to the GAAP measure of net cash provided by operating activities because the Company believes EBITDAX is a widely accepted financial indicator of a company’s ability to internally fund exploration and development activities and to service or incur debt without regard to financial or capital structure. EBITDAX should not be considered an alternative to net cash provided by operating activities, as defined by GAAP.
The following table provides a reconciliation of the GAAP measure of net cash provided by operating activities to EBITDAX (non-GAAP) for the period presented:
Net cash provided by operating activities $ 771Exploration and abandonments, including dry holes 4Interest expense 46RSP transaction costs 23Changes in working capital (14)Other (1)
EBITDAX $ 829
2018
Three Months EndedSeptember 30,
(in millions)

Reconciliation of Net Cash Provided by Operating Activities to Free Cash Flow(Unaudited)
22
The Company's presentation of free cash flow is a non-GAAP financial measure. Free cash flow is defined as net cash provided by operating activities less exploration and development costs incurred. Free cash flow is presented herein and reconciled from the GAAP measure of net cash provided by operating activities because the Company believes that it provides useful information to analysts and investors. For example, free cash flow can be used to assess the Company's ability to internally fund its capital expenditures and service or incur debt. Free cash flow should not be considered in isolation or as a measure of net income or net cash provided by operating activities, as defined by GAAP, and may not be comparable to other similarly titled measures of other companies.
The following table provides a reconciliation from the GAAP measure of net cash provided by operating activities to free cash flow (non-GAAP), for the periods indicated:
Three Months EndedSeptember 30, June 30, March 31, December 31, September 30, June 30, March 31, December 31, September 30, June 30, March 31, December 31, September 30,
(in millions) 2018 2018 2018 2017 2017 2017 2017 2016 2016 2016 2016 2015 2015Net cash provided by operating activities 771$ 602$ 488$ 510$ 380$ 398$ 407$ 365$ 343$ 306$ 370$ 326$ 436$ Less: Exploration and development costs incurred (761) (501) (450) (471) (427) (383) (393) (351) (274) (272) (253) (236) (301)
Free Cash Flow 10$ 101$ 38$ 39$ (47)$ 15$ 14$ 14$ 69$ 34$ 117$ 90$ 135$

Costs Incurred(Unaudited)
23
The table below provides the costs incurred for oil and natural gas producing activities for the periods indicated:
Three Months EndedSeptember 30, June 30, March 31, December 31, September 30, June 30, March 31, December 31, September 30, June 30, March 31, December 31, September 30,
(in millions) 2018 2018 2018 2017 2017 2017 2017 2016 2016 2016 2016 2015 2015Property Acquisition Costs:
Proved 4,126$ -$ -$ 2$ 162$ 12$ 127$ 725$ 1$ 4$ 252$ (2)$ 57$ Unproved 3,578 5 13 40 472 87 306 982 14 19 139 10 162
Exploration 481 335 243 296 252 238 235 189 177 165 170 149 202 Development 280 166 207 175 175 145 158 162 97 107 83 87 99
Total Costs Incurred 8,465$ 506$ 463$ 513$ 1,061$ 482$ 826$ 2,058$ 289$ 295$ 644$ 244$ 520$

2018 Operational & Financial OutlookUpdated as of October 30, 2018
24
4Q18 PRODUCTION305-310 MBoepd
(65% oil)
Note: FY18 guidance includes production (on a 2-stream basis) and capital from RSP beginning on the acquisition closing date of July 19, 2018. The Company’s capital program guidance excludes acquisitions and is subject to change without notice depending upon a number of factors, including commodity prices and industry conditions.
ProductionProduction (MBoepd)Crude oil production mix
Price realizations, excluding commodity derivatives Crude oil differential (per Bbl) (Relative to NYMEX - WTI; excludes Midland-Cushing basis differential) ($1.50) - ($2.00)Natural gas (per Mcf) (% of NYMEX - Henry Hub) 110% - 120%
Operating costs and expenses ($ per Boe, unless noted)Lease operating expense and workover costsGathering, processing and transportationOil and natural gas taxes (% of oil & natural gas revenues)General and administrative ("G&A") expense:
Cash G&A expenseNon-cash stock-based compensation
DD&AExploration and otherInterest expense ($mm):
CashNon-cash
Income tax rate (%)Capital program ($bn)1
2018 Guidance
260 - 26364%
$6.00 - $6.50$0.55 - $0.65
7.75%
$2.30 - $2.50$0.80 - $1.00
$15.00 - $16.00$0.25 - $0.75
$150 - $160$6
24%$2.5 - $2.6
Updated items

Hedge PositionUpdated as of October 30, 2018
25
2018 20204Q 1Q 2Q 3Q 4Q Total Total
Oil Price Swaps1:Volume (Bbl) 11,902,007 11,992,250 10,835,750 10,066,000 9,484,000 42,378,000 26,534,000 Price per Bbl 56.86$ 56.80$ 56.40$ 56.24$ 56.12$ 56.41$ 58.44$
Oil Three-Way Collars1:Volume (Bbl) 1,227,000 - - - - - - Ceiling price per Bbl 60.96$ -$ -$ -$ -$ -$ -$ Floor price per Bbl 48.00$ -$ -$ -$ -$ -$ -$ Short put price per Bbl 38.00$ -$ -$ -$ -$ -$ -$
Oil Costless Collars1:Volume (Bbl) 1,058,000 1,335,250 1,213,250 1,135,000 1,058,000 4,741,500 - Ceiling price per Bbl 60.11$ 64.67$ 64.00$ 63.47$ 62.95$ 63.83$ -$ Floor price per Bbl 46.52$ 56.46$ 56.06$ 55.74$ 55.43$ 55.96$ -$
Oil Basis Swaps2:Volume (Bbl) 10,517,000 11,730,000 11,419,500 10,994,000 10,533,000 44,676,500 34,770,000 Price per Bbl (0.77)$ (2.93)$ (3.02)$ (2.97)$ (3.07)$ (2.99)$ (0.82)$
Natural Gas Price Swaps3:Volume (MMBtu) 18,458,000 7,291,533 7,231,387 7,178,537 7,089,535 28,790,992 12,808,000 Price per MMBtu 3.00$ 2.82$ 2.81$ 2.81$ 2.81$ 2.81$ 2.70$
2019
1The oil derivative contracts are settled based on the New York Mercantile Exchange (“NYMEX”) – West Texas Intermediate (“WTI”) monthly average futures price.2The basis differential price is between Midland – WTI and Cushing – WTI. The majority of these contracts are settled on a calendar-month basis, while certain contracts assumed in connection with the RSP acquisition are settled on a trading-month basis.3The natural gas derivative contracts are settled based on the NYMEX – Henry Hub last trading day futures price.