decentralization and the quality of government - imf · pdf filedecentralization and the...
TRANSCRIPT

DECENTRALIZATION AND
THE QUALITY OF GOVERNMENT
How does the degree of political decentralization in a country affect the quality of its government? Greater political decentralization might make governments more honest and efficient by bringing officials “closer to the people”, forcing them to compete for mobile capital, and facilitating the satisfaction of diverse local tastes. On the other hand, it might create coordination problems or roadblocks to reform and exacerbate incentives to predate and shirk on public good provision. Empirical work has been inconclusive, in part because different types of decentralization are examined. I define five types of decentralization, and outline five arguments about how specific types may affect government quality. Statistical tests, using newly collected data on up to 154 countries, suggest that states which have more tiers of goverment tend to have higher perceived corruption, and may do a worse job of providing public health services. Federal states appear less effective at providing public health services and (at least among developing countries) at lowering adult illiteracy. The Tieboutian idea that decreasing the size of government units will strengthen competition between governments for capital, thus stimulating greater efficiency and honesty, is not supported. Countries with smaller first-tier jurisdictions tended to be perceived as more corrupt.
Daniel Treisman
Department of Political Science University of California, Los Angeles
4289 Bunche Hall Los Angeles, CA 90095-1472 [email protected]
November 2000
Preliminary draft, comments welcome. I am grateful to Sanchita Bannerjee, Stephen
Bloom, and Preston Keat for research assistance.

Decentralization and the Quality of Government
By Daniel Treisman
November 20, 2000
Contents Page I. Introduction………………………………….…………………………………..……1 II. Decentralization and Government Quality: Theory …..………………..…………….2
A. Five definitions………………………………..………………………………2 B. Large countries have worse governments…….……………………………….3 C. Vertical competition within the state………………………………………….5 D. Horizontal competition for mobile factors ……………………………………7 E. More vetoes over central policy ..……………………………………………..8 F. Local government more corrupt……..………………………………………...9
III. Testing the Argument…….…………………………………………………………...9 A. Data and definitions…………………………………………………………....9 Governance………………….…………………………………………….9 Decentralization …..……………………………………………………..11
B. Method………..……………………………………..………………….……14 C. Results……………………………………………………………………… 16
IV. Conclusions. …………………………………………………………………..…… 19 Tables 1. Examining the effect of decentralization indicators taken separately on government
quality………………………………………………………………………………..22 2. The effect of decentralization indicators included simultaneously on government
quality………………………………………………………………………………..24 Appendices 1. A simple formalization of the overgrazing argument…………………………………25

I. INTRODUCTION
Looking around the world, there can be little doubt that countries differ dramatically in the quality of their governments. Great variation exists, no matter how one wishes to define and measure government quality.1 Some governments are extremely corrupt, wasteful, and ineffective at providing basic public services to their citizens. Others are far more honest, efficient, and responsive. Recent empirical research has started to pin down what factors account for such differences.2 One important group of factors has to do with the way that states are structured.3 This paper focuses on one aspect of state structure—the degree of political decentralization. How does the degree of political decentralization in a state affect the quality of its government? Do more decentralized states have more or less corrupt governments? Do these governments provide public goods and services more or less effectively than those in more centralized states? As countries around the world embark on decentralization reforms, these questions are particularly urgent. Existing theories conflict. Some argue that decentralization should improve the quality of government by bringing officials “closer to the people”, encouraging competition between governments for mobile resources, and facilitating the satisfaction of diverse local tastes. Others contend that decentralization creates coordination problems, exacerbates incentives for officials to predate, and generates roadblocks to any change from the status quo. Empirical research also seems to offer contradictory conclusions. For instance, Treisman (2000a) finds that perceived corruption is higher in federally structured states.4 Fisman and Gatti (2000) report that fiscal decentralization, as measured by the
1 I define the quality of government in this paper as the provision of public goods and services that the public demands at minimum cost in taxation and regulatory burden. 2 See La Porta et al. (1999), Treisman (2000a), Lipset and Lenz (1999), Ades and Di Tella (1999), Sandholtz and Koetzle (2000), Goldsmith (1999). 3 Pioneering work on the theoretical relationship between state structure and corruption includes Rose-Ackerman (1978) and Shleifer and Vishny (1993). Other determinants found to be significant predictors of lower perceived corruption include higher economic development (Treisman (2000a), Sandholtz and Koetzle (2000)), Protestant religious traditions (La Porta et al. (1999), Treisman (2000a), Lipset and Lenz (1999), Sandholtz and Koetzle (2000)), former British colonial status (Treisman (2000)), openness to trade (Ades and Di Tella (1999), Treisman (2000a), Sandholtz and Koetzle (2000), current democratic government (Sandholtz and Koetzle (2000), Goldsmith (1999)), or long exposure to democracy (Treisman 2000a)). Authors disagree on how to measure economic freedom or liberalism, and also on the size and significance of any associated effect once one controls for exogenous factors. 4 Goldsmith (1999) also finds a significant positive relationship between decentralization and corruption.

- 2 -
subnational share of government expenditure, is associated with lower perceived corruption. The divergence of predictions and of results is not surprising once one realizes that different theories—and the empirical studies based on them—often adopt different definitions of decentralization. In this paper, I present five definitions of different types of decentralization. I then outline five theoretical arguments about how specific types or aspects of decentralization may affect the quality of government. Using a newly created data set of up to 154 countries, I seek evidence for or against these arguments. I examine three types of indicator of the quality of government—indexes of perceived corruption, an indicator of the effectiveness of public health services, and an indicator of the effectiveness of basic educational services. The empirical results suggest that several aspects of decentralization are associated with lower quality of government (even controlling for economic development, regime type, region, and various cultural and legal factors found by previous research to affect the quality of government). Countries that have a larger number of tiers of government tend to have higher perceived corruption, and may do a worse job of providing public health services. Federal states seem clearly less effective at providing public health services, in part because they tend to have central government structures that entrench the veto power of regional interests. Federations are also less successful at at reducing adult illiteracy, though this effect weakens as income rises. Some evidence casts doubt on the idea that interjurisdictional competition is a major source of discipline on subnational governments worldwide: in fact, countries with smaller first-tier subnational units—and therefore lower costs of interjurisdictional mobility—had higher perceived corruption. The next section defines five types of decentralization and outlines five arguments about how specific types of decentralization may affect government quality. Section 3 examines how closely these arguments fit existing data. Section 4 concludes.
II. DECENTRALIZATION AND GOVERNMENT QUALITY: THEORY
A. Five Definitions A number of different concepts often appear in writing on political decentralization. I distinguish the following types or aspects.5 One concept—which I shall call structural decentralization—refers simply to the number of tiers of government.6 The more tiers
5 There is the additional ambiguity in that “decentralization” is used alternately to refer to both a process and a state. I refer here to decentralization as a state—i.e., the condition of being decentralized. 6 This obviously requires a definition of a “tier” of government. I define “tier” as follows. Each government in a country has a jurisdiction, an area of space or a subset of the country’s population over which that government has constitutional authority. A tier of government is the subset of governments in a country such

- 3 -
there are, the more decentralized is the system. For instance, Singapore, in which no local government exists separate from the national government, is maximally centralized in this conception. China, which has four tiers of government below the national government—provinces; prefectures; counties and county-level cities; townships, villages, and city districts—is far more decentralized. A second conception of decentralization—call this decision decentralization—focuses on the scope of issues on which subnational governments can decide autonomously (that is, without fear of being overruled by higher tier governments). A country whose constitution reserves a large subset of policymaking areas to the subnational governments is more decentralized than one in which final decisions on all matters are the central government’s preserve. A third concept of decentralization—resource decentralization—refers to how government resources (revenues, manpower) are distributed between central and subnational tiers. Electoral decentralization refers to the method by which subnational officials are selected. If subnational officials are chosen locally (by election or appointment by local communities), the system is more decentralized in this sense than if all local officials are appointed by the central authorities. A final kind of decentralization—institutional decentralization—concerns the degree to which subnational communities or their representatives have formal rights within the procedures of central decisionmaking. A system in which state legislatures must ratify constitutional amendments is more decentralized in this sense than one in which the constitution can be changed by just a national referendum. Countries in which states have significant veto powers over central legislation via their representatives are also more “institutionally decentralized”. Existing arguments about decentralization and governance relate to different types of decentralization, and it is quite possible that some types improve governance while others impair it. Below, I present five arguments about how decentralization (in a specific conception) might affect the quality of government.
B. Large Countries Have Worse Governments Central officials in large countries will find it more difficult to monitor those who must implement policy in distant regions. As a result, large countries will always exhibit considerable decision decentralization, de facto if not de jure. The ability of public-spirited central officials to keep self-interested local bureaucrats in check will be correspondingly diminished. In a large country, according to Rousseau: “The rulers, overburdened with business, see nothing for themselves; clerks govern the state” (Rousseau 1762, pp.49-50). Of course, this argument falls apart if central officials are not, as assumed, public-spirited and local officials are not self-interested. If local officials are public-spirited social welfare that all members of this subset have jurisdictions that are contained by the same number of (other governments’) jurisdictions. For instance, all governments whose jurisdictions are contained only by the jurisdiction of the national government are denoted “first-tier” subnational governments. All those whose jurisdictions are contained by that of the national government and that of one “first-tier” government are “second-tier” governments.

- 4 -
maximizers, their greater access to relevant information may make them better at providing public services than their more distant central counterparts (Hayek 1939). Even if local officials are, by nature, self-interested, they may be constrained by institutions of local accountability. Besides control from above, they may be subject to control from below. If Rousseau’s “clerks” must undergo regular election—that is, if electoral decentralization is combined with decision decentralization—the problems associated with large country size may disappear.7 However, a second modification of the country size argument, suggested by Montesquieu, has contrasting implications about democracy. Even if central officials cannot monitor their subordinates effectively in a large state, they can compensate for this by punishing more severely when misdeeds are discovered. “[F]ear must prevent negligence in the distant governor or magistrate” (Montesquieu 1748, Part I, Book 8, ch.18). Punishments, he argues, can only be severe and immediate enough in a despotism, which is unconstrained by the procedures and ethos of a more moderate state. Thus, problems of central control should be greater under a moderate form of government (a republic or a monarchy) than in a dictatorship. To test these conjectures, I examine whether indicators of government quality are lower in: (a) more populous states; (b) more populous states in which few tiers of government have elected executives; and (c) more populous democracies. Some scholars have suggested other reasons why smaller states should have more effective and honest governments. Bueno de Mesquita and Root (2000) argue that in smaller countries, rulers must include a larger part of the population in their patronage network, rendering patronage relatively less attractive as a means of buying support. Instead, incumbent governments in small countries buy support through the provision of public goods. In larger countries, patronage is more cost-effective. Small states may also have more effective and liberal governments because they are more open to foreign trade and capital flows, and thus must work harder to attract foreign capital. A finding that larger population is associated with worse government might, therefore, have several interpretations.
C. Vertical Competition Within the State One argument suggests that vertical competition among governments at different levels should lower the quality of government. If several levels of government share the authority to regulate the same firms, and the governments are not subordinate to each other and do not collude, then the level of bribes extracted in return for regulatory
7 Indeed, Rousseau himself emphasized the importance of local representative bodies. In his Considerations on the Government of Poland, he instructs the Poles to perfect and extend the authority of their provincial parliaments, or dietines, in order to avoid the dangers of large state size (Rousseau 1772, p.183).

- 5 -
leniency will be higher than if just one government (or coordinated group of them) had this authority. Structural decentralization, combined with some decision decentralization, will lead to “overgrazing” of the bribe base, and higher corruption (Shleifer and Vishny 1993).8 Similarly, if several independent levels of government share the responsibility for providing particular public goods, the level of provision will be lower than if a single government (or coordinated group of them) had this responsibility. In both cases, decentralization creates an externality. A higher aggregate bribe rate reduces output by discouraging economic activity. If one government increases its bribe rate, this imposes a cost on the others by decreasing output and therefore the base from which it extracts bribes. Because this cost is not internalized, the aggregate bribe rate will be higher (and economic output lower) than if a single government could demand bribes from each firm. The same logic applies to competitive taxation. (The Appendix provides a simple formalization.) In the case of public good provision, the externality occurs because voters are grateful to both governments when public goods increase, even if only one government has contributed. Each government will supply only as long as the marginal benefit to it from voters’ gratitude equals the marginal cost to it of provision. However, a unified government would provide as long as the marginal benefit to all units of government equaled the cost of provision. Thus, decision decentralization in the absence of clear assignment of separate responsibilities, should reduce the supply of public goods. Again, the underprovision should increase with the number of tiers of government. In practice, however clearly different levels of government may try to separate their responsibilities, the distinctions will be somewhat blurred in the minds of citizens. The governments will themselves exploit the voters’ misperceptions to avoid responsibility for their own underprovision and claim responsibility for the good deeds of other governments. Two familiar examples illustrate. Candidates in American presidential campaigns regularly devote an enormous amount of time to outlining and defending plans for primary and secondary education, although the federal role in providing these services is tiny. In Russia in the 1990s, wage arrears to public sector workers accrued by regional goverments repeatedly prompted public protests against the national government. These arguments suggest that the level of corruption will be higher and the level or quality of provision of public services will be lower in countries with a larger number of tiers of government—and especially in those which have relatively more autonomous subnational governments with regulatory authority. Federal states are more likely than unitary states to divide the power to regulate the economy between two or more levels of semi-autonomous government. Some parts of the state might be particularly vulnerable to overgrazing problems. For instance, if both a national police force and subnational police forces have authority to enforce laws, both will have opportunities to extort bribes from the same citizens. In some countries—for instance, Canada, Switzerland, the UK, and
8 This may not be the case if one assumes politicians’ only objective is to maximize social welfare. I do not.

- 6 -
Japan—separate police forces exist under the control of state or local governments. In others, the police force is centralized. Vertical divisions in law enforcement and justice are not restricted to the police. Some states have bifurcated judiciaries, with separate courts, laws, and enforcement procedures at subnational and central levels. For instance, in the U.S. both federal and state laws exist, and their relations are regulated by the constitution, interpreted ultimately by the Supreme Court. While in some systems, judges are all appointed by the central government, in others subnational governments appoint those with jurisdiction in matters of state or provincial law. Contradictions between the laws of the different levels of state create opportunities for corrupt officials to extract bribes. Rose-Ackerman (1997) notes “the (perhaps apocryphal) tale of one entrepreneur [in Brazil] who reported that he was visited by state and federal inspectors simultaneously. The goal of the joint visit was to be sure that the firm would be observed violating at least one of the two governments’ inconsistent rules on the placement of fire extinguishers.”9 When judges at different levels are appointed by different governments, they may also become adjuncts to the corrupt overgrazing of their patrons. To test these arguments, I examined whether: (a) the number of tiers of government; (b) federal structure; (c) the existence of subnational police forces (controlled by subnational governments); or (d) the subnational appointment of some judges were associated with higher perceived corruption. I also explored whether (a) or (b) predicted poorer provision of public health and education services (there was no reason to believe that (c) or (d) would affect these.) Because overgrazing by independent tiers of government might be restrained by democratic accountability, I also examined whether there was a relationship with the number of tiers of government that did not have elected executives. Some scholars have suggested an opposite prediction about the effect of vertical competition. If two levels of government produce the same public good or service, voters can use the performance of each as a benchmark to judge the efficiency of the other (Salmon 1987, Breton 1996, p.189). A level of government that provides the good or service less efficiently will be punished by the voters. This would suggest that—so long as governments at all levels are subject to electoral accountability and the particular contributions of each government to public good provision are clear to the voters—the effectiveness and honesty of government should be greater when more than one level of government has responsibility for providing the same public good.
D. Horizontal Competition for Mobile Factors One of the most powerful reasons to expect lower corruption in federal states derives from the Tiebout (1956) argument that interjurisdictional competition disciplines governments. When residents (or businesses) can move freely between regions or localities, this should pressure the regional or local governments to provide local public 9 The story comes from Stone, Levy, and Paredes (1992).

- 7 -
goods efficiently. If they steal or waste resources, residents (and businesses) will move to other towns or regions where government is more efficient, reducing the tax base of the less efficient governments. If local governments over-regulate businesses in order to extract bribes, firms will exit to lower-regulation settings. In federal countries, where regional governments have greater autonomy and a larger share of responsibility for economic regulation, these competitive pressures should motivate governments to seek out efficiency improvements more actively and to limit their appetite for bribes and intervention in the economy (Brennan and Buchanan 1980; Montinola et al. 1995). Many similar arguments have been made about the benefits of competition between governments to attract capital. For instance, Qian and Roland (1998) argue that such competition will increase the incentive for local governments to provide growth-promoting infrastructure and reduce the incentive to provide socially inefficient services such as bailouts to inefficient firms. Such horizontal competition will not exist in a unitary state, in which the local governments are just administrative subdivisions of the central government. However, arguments also exist that the competition between subnational jurisdictions may decrease provision of public goods and services below the level of a more centralized state. Various scholars have warned of a “race to the bottom”, in which competition drives local tax rates below the level necessary to fund the public goods that residents demand. Cai and Treisman (2000) argue that regional governments will sometimes compete to attract capital not in growth-promoting ways as usually assumed (e.g., by providing infrastructure), but in ways that decrease efficiency (e.g., helping enterprises to evade central laws and regulations necessary for efficient market exchange). Competition can lead to equilibria in which the central state is weakened by such evasion beyond the point at which it can provide public services that residents demand. The mobility of residents or capital occupies a central place in the logic of these arguments. Subnational governments face competitive pressures only to the extent that their “clients” can move away. The costs of moving are likely to increase with the size of the subnational units: it is far easier to move to a neighboring town than to a neighboring state (Brennan and Buchanan 1980, p.180). Thus, horizontal competition should affect governance more—whether for better of for worse—in countries with smaller first-tier units. Competition to attract capital will be far greater among Slovenia’s municipalities, which occupy on average about 100 square kilometers each, than among Canada’s provinces and territories, which occupy on average about 770 thousand square kilometers.10 Within the Tiebout framework, one would expect countries with smaller first-tier units to have less over-regulation and corruption, and more efficient provision of public goods. By contrast, the arguments that horizontal competition reduces
10 These figures are rough averages calculated by dividing the country’s total surface area by the number of first-tier units.

- 8 -
governments’ ability to tax and to enforce laws imply that such countries would have greater illegality and lower public goods provision.
E. More Vetoes Over Central Policy Tsebelis (1995, 1999) has argued that changes in central government policies will be rarer and less radical, the more veto-players there are with a veto over policy enactment. Institutional decentralization—the constitutional entrenchment of rights of subnational communities in the determination of central policy—will often increase the number of veto-players by giving subnational actors vetoes. Such institutional decentralization is a key feature of political institutions in federal states and in many where consociational or other power-sharing arrangements exist to protect the rights of ethnic minorities. In at least 28 countries (about 17 percent of those included in the data set for this paper), the central parliament has an upper house whose members are selected on a regional basis. Of these, 12 have the power to block lower house non-financial legislation or to require a supermajority in the lower house for passage (Tsebelis and Money 1997).11 In some federal countries, regional governments are incorporated into other organs of the central state. For instance, in Germany a majority of the members of the central bank’s governing council are representatives of the Land governments. In federal states, an additional veto-player sometimes exists in the form of the court system. If neither the state nor the central governments are supreme, some institution must be able to resolve disputes between them. In the US, it is the Supreme Court that ultimately rules on the constitutionality of legislation of both central and state governments. Some empirical evidence suggests that major changes in central policy are less frequent in federal states. Treisman (2000b) demonstrates that federal states show greater continuity in monetary policy and relative inflation rates even over very long periods than do unitary states. One hypothesis is, then, that the greater number of veto-players on average in federal states—and, in particular, in those with regionally elected upper houses that have authority to block legislation—may make central efforts to fight corruption harder by slowing down and restricting central policy initiatives. Corrupt regional governments will have far greater leverage to protect their ill-gotten gains. Similarly, a larger number of veto-players may make it harder to introduce new central programs to provide public goods or services. Furthermore, in “blocked” political systems, illicit bargains may be required to get even ordinary public business done. According to James Q. Wilson, one cause of corruption in the US system is "the need to exchange favors to overcome decentralized authority" (Wilson 1970, p.304). Of course, the policy “stickiness” that more veto players provide might serve to constrain the central government from enacting corruption-enhancing central regulatory policies or from canceling public services, so the implications do not pull unequivocally in one direction. Complicated systems of checks-and-balances are often advocated as ways to
11 Eight of these are federal states (Switzerland, Germany, USA, Russia, India, Spain, Mexico, and Brazil). The others are Chile, Dominican Republic, Bolivia, and Italy.

- 9 -
preserve good policies and to prevent or delay radical changes in government. David Hume advocated a complex vertical structure of government for precisely this reason: “In a large government, which is modelled with masterly skill… the parts are so distant and remote, that it is very difficult, either by intrigue, prejudice, or passion, to hurry them into any measures against the public interest” (Hume 1994). In sum, it is not clear that the entrenchment of regional veto players should either improve or impair the quality of government, though it may be expected to make either good or bad government harder to change.
F. Local Governments More Corrupt A final set of arguments focuses on what I have called resource decentralization. Some economists suggest that local governments and officials may be more susceptible to corruption than their central counterparts (Tanzi 1995, Prud’homme 1995). At more decentralized levels, the intimacy and frequency of interaction between private individuals and officials are likely to be greater, reducing the risk of corrupt collusion. The local press and local citizen watchdog groups may be less professional and more easily bought than the national press or national civic organizations. Interest groups may be more cohesive at the local level, leading to greater state capture and the substitution of private transfers for public services (Bardhan and Mookherjee 2000). If this is correct, it would suggest that countries in which a greater share of public business is conducted at subnational levels would be more corrupt and less effective at providing public goods than those in which public resources were more centralized. One might measure resource decentralization by looking at the share of government employees that work at the local rather than the national level, or at the share of fiscal resources—revenues, expenditures—that are collected or spent by subnational governments.
III. TESTING THE ARGUMENTS
A. Data and Definitions Governance The dependent variable I seek to explain is the quality of government. I divide this into two parts: first, the extent of corruption, defined as “the misuse of public office for private gain”; and second, the effectiveness with which public services are provided.12 In measuring the second part, I looked for indicators of concrete achievement—the “outputs” of policy rather than “outcomes”, which depend on many environmental factors. The effectiveness of public services depends on both the level of resources
12 In reality, these aspects are of course related. As Tanzi and Davoodi (1997) show, corruption itself can reduce the quality of public investment and may well reduce public spending on capital maintenance and other public services.

- 10 -
allocated by government and the efficiency with which these resources are spent. I do not separate the two but look merely at the final achievement level. To measure corruption, or more accurately “perceived corruption”, I use three indicators. First, I use the indexes compiled by Transparency International for 1999 and 2000. More details on TI’s methodology in constructing its perceived corruption index is in Treisman (2000a), and on TI’s website (www.transparency.org). Very briefly, the TI indexes are compiled by averaging the standardized values of a number of separate surveys and country ratings published by different consultancies and business risk analysts (17 ratings from 10 organizations in 1999, and 16 ratings from 8 organizations in 2000). The selection of surveys changes somewhat from year to year. Ratings compiled during a three-year period are used, so there is some overlap across consecutive years. Some ratings capture mostly evaluations by expatriate businessmen of the country in which they are posted; others are answered mostly by domestic business people. In 1999, a Gallup International poll of the countries’ populations themselves was also included. All surveys asked reasonably comparable questions about the level of corruption.13 In all, 99 countries appear in the 1999 rating, and 90 in the 2000 rating. Third, I use an indicator of corruption compiled by experts at the World Bank.14 This is also calculated from 12 separate surveys and country corruption ratings by business risk organizations, many of them the same as those used by Transparency International. The main difference is the method of aggregation. Whereas TI simply standardizes and averages the ratings, Kaufmann et al. weight each source according to how reliable it is, as proxied by how closely it correlates with the others. (They assume that each indicator is a noisy measure of the same underlying variable and model this variable in an unobserved components framework.) The World Bank and TI indexes are highly correlated (at around .97), but the World Bank index has the advantage of including a much larger number of countries (155, compared to the 90-99 for TI). Since the increased country coverage is achieved by lowering the criterion for including a country (Kaufmann et al. include a country if one source exists for it, while TI requires at least three surveys per country), it may contain greater measurement error, which should be borne in mind in interpreting results. But the more representative country coverage is a major advantage. As will be seen, findings using any of the three indicators are generally similar.
13 The subjects asked about in 1999 were: “improper practices (such as bribing or corruption) in the public sphere”, “level of corruption”, “effect of corruption on the attractiveness of the country as a place to do business”, “extent of corruption in a way that detracts from the business environment for foreign companies”, “corruption in government”, the frequency of “cases of corruption for politicians, public officials, policemen and judges,” the frequency of “irregular, additional payments” which “represent an obstacle to doing business”, “pervasiveness of corruption among politicians and civil servants”, whether bribes have been requested in the past year by government officials, and the frequency of “irregular, additional payments connected with import and export permits, business licenses, exchange controls, tax assessments, police protection or loan application”. 14 For details, see Kaufmann Kraay and Zoido-Lobaton (1999a, 1999b).
- 11 -
Both the TI and World Bank corruption indicators come with estimates of the variability of the ratings. In the case of TI, these are the standard errors for the rating of a given country across the sources used to construct its rating. For the World Bank index, the “standard error” reported is a measure based on the estimated reliability of the polls that went into constructing the given country’s estimate—i.e., the correlation of that poll to the others on all observations, not the variability on just that country. I use these measures of variability to place lower weight on the less reliable cases in regressions; specifically, I weight by the inverse of the reported “standard error” for each country. As measures of public service provision, I chose two indicators that capture the degree of success in meeting basic goals in public health and education. The first is a measure of the percentage of infants under 12 months who had been inocculated for diphtheria, tetanus, and pertussis (from the World Bank’s World Development Indicators). The second is the adult illiteracy rate (i.e. the percentage of the population aged 15 and older who cannot read and write a short, simple statement on their everyday life; taken from the UN’s Human Development Report). I use the adult illiteracy rate in log form, on the assumption that reducing illiteracy from 10 percent to zero is much harder—and requires a larger improvement in the effectiveness of government—than decreasing it from 90 to 80 percent. Clearly, illiteracy and the inocculation rate will be affected by various environmental factors besides government effectiveness. I control in the regressions for log per capita GNP and for a measure of durable democracy (both of these are expected to have a positive impact on the quality of government, and a negative impact on corruption), as well as for region, and in some cases cultural and legal factors. The desire to focus on government outputs rather than more complex outcomes explains why I chose the rate of inocculation rather than, say, the infant mortality rate.15 In measuring educational outputs, it was not possible to separate out the quality of schooling from the influence of the environment in which it was offered—adult illiteracy is an outcome of government policy and other factors rather than an indicator of government policy per se. It was, however, the best indicator available.16 Decentralization I examined a number of indicators of decentralization (or country size). Different indicators aim to capture different decentralization concepts, as appropriate to the particular arguments outlined in the previous section. It should be noted, however, that the indicators of structural decentralization will often coincide with decision decentralization. 15 La Porta et al. (1999), for instance, use infant mortality as a measure of government performance. 16 For instance, I preferred it to such indicators as the primary or secondary enrollment rate, since these reveal nothing about the quality of instruction actually provided (and also reflect both government policy and environmental factors).
- 12 -
To capture country size, I used countries’ populations in both non-log and log forms, taken from the World Bank’s World Development Reports and the CIA’s World Factbook. The log population results were generally more significant, so I report these. I used three indicators of structural decentralization. First, I used a variable measuring the number of tiers of government in the country. Data on this for 145 countries were compiled from more than 180 sources. (This dataset will soon be made available on the author’s website.) A level of territorial subdivision of the state was said to constitute a “tier” of subnational government if: 1) subdivisions at this level had an executive with government authority; 2) this executive had responsibility for general administration, not just for provision of a particular public service; and 3) the superior “tier” of government (or, in the case of first-tier units, the entire state) was subdivided territorially into units of this type (at least in some areas). The U.S., for example, was coded as having three tiers of subnational government—states, counties, and municipalities. Locating detailed information on many of the countries proved to be extremely difficult. Some gaps remain, and inevitably the data will contain some error, which should be borne in mind in interpreting the results. Measurement error should bias the coefficients toward zero, so actual effects may be larger and more significant than those estimated. Note that the definition of a tier applies equally to governments with or without legislative councils, and with or without elected leaders, and therefore applies also to what are often termed levels of administration rather than government. The nature of state institutions and method of selection of leadership at each level were treated as additional variables. Besides the number of tiers, I examined the number of tiers of government which had executives appointed from above (on the theory that local accountability should reduce the problems of central control). A second indicator of structural decentralization was whether or not each country had a separate subnational police force. For instance, in the U.S., state and municipal police forces exist as well as the central FBI. Third, as a measure of the structural decentralization of the judicial system, I used a dummy for whether local or regional level governments had the right to appoint judges, derived mostly from the countries’ constitutions. The main indicator of decision decentralization was whether scholars consider the state to be federal. Countries were classified as federal or non-federal on the basis of Elazar (1995). The federal states included in the data set are: Canada, Switzerland, Australia, Germany, Austria, Belgium, USA, Malaysia, Spain, Argentina, Mexico, Brazil, India, Russia, Venezuela, Pakistan, Nigeria, Yugoslavia, Bosnia and Herzegovina, United Arab Emirates, Comoros, and St Kitts and St Nevis. These range from the highly developed to the underdeveloped, and include all continents of the world. They also include both democracies and authoritarian federations. I do not include Ethiopia among the federations, since a federal constitution was only adopted in December 1994, too late to have affected governance in the mid-1990s. What these states share is some

- 13 -
constitutionally defined autonomy for subnational governments.17 It should be noted that the degree of decision decentralization in practice varies considerably among the group of federations. Constitutional autonomy is quite different from autonomy in practice, so this is a highly approximate indicator. However, I did not know of any more fine-grained, reliable indicator of decision-making decentralization, so I used federal structure nevertheless. Another reason to use it was the prior finding (Treisman 2000a) that federal structure did appear related to higher perceived corruption in earlier indexes. This project made it possible to test this finding on more recent datasets with broader country coverage. To test arguments about the effects of horizontal mobility, I exploit the fact that mobility should be greater between units of smaller size. I collected data on the number of first-tier subnational governments in 150 countries. The first-tier governments, on average, are likely to have the greatest ability of any subnational level to set up alternate regulatory or tax regimes in order to compete for capital. The “average” size of the first-tier jurisdictions was calculated by simply dividing the country’s area by the number of first-tier governments. Land area was preferred to population as a measure of size since the costs of mobility relate to distance not to population. “Average” is in quotation marks because when the size distribution of units is skewed, there may be few units that actually have areas or populations close to the “average”. A better variable would be derived by averaging the areas of all actual units, but data were not easily available to do this. Another reason for caution is that it was clear in collecting data that the number of first-tier units in many countries changed over time, sometimes quite frequently, as units split or were combined. Different sources often differed slightly in the number of units they reported. As a result, the variable used can be taken as only a rough indicator, and measurement error may lead to underestimation of the true effects. Nevertheless, the data should capture much of the important variation. The more than 7,000:1 ratio of average first-tier unit size between Canada and Slovenia is large enough to survive such marginal uncertainties. Greater institutional decentralization should increase the number of veto players who can prevent central efforts to improve the quality of government. On the other hand, the additional veto players might prevent central government from introducing new inefficiencies and corrupt practices. To test these opposite conjectures, I constructed a dummy variable measuring whether the country had a regionally-elected upper house of parliament that could block non-financial legislation from the lower house. The data came from listings in Tsebelis and Money (1997). The variable I constructed took the value zero if the state was not bicameral with a regionally-elected upper house or if the upper house had no power (other than delaying tactics) to overrule lower house non-financial 17 Such constitutionally defined subnational autonomy is the central feature of most definitions of federalism (see for instance Riker 1964). There are two points on which experts might disagree about how to code countries. Belgium only became officially federal in the early 1990s, and Spain is sometimes classified as only a proto-federation. Following Elazar (1995), I classify both of these as federal states.
- 14 -
legislation; one if an upper house veto could be overridden only by a supermajority in the lower house or by a majority of a joint session of both houses; and two if an upper house veto would stand even against a lower house supermajority. I used three alternative indicators of resource decentralization. Two of these measured fiscal decentralization—the share of government expenditures and the share of tax revenues that accrued to subnational levels of government as of 1994 (or a year close to it). Most data on these came from the IMF’s Government Finance Statistics Yearbooks, the same source as used in Fisman and Gatti (2000). However, data were only available for 53 countries, rendering the results somewhat unreliable. A third indicator of resource decentralization was the share of total employment in civilian government administration that occurred at subnational levels, collected by and published in Schiavo-Campo et al. (1997). These data were available for 71 countries.
B. Method To test the various arguments about how different types of decentralization affect corruption and public service provision, I ran a series of regressions with indicators of government quality as the dependent variable. Results are presented in Tables 1 and 2. In all, I report White heteroskedasticity-corrected standard errors. All regressions controlled for region—Africa, Asia, Latin America and Caribbean, Eastern Europe and the former Soviet Union, Middle East, and OECD (in case the inclusion of OECD countries in the Asian category, for instance, led to misleading results); the excluded category was Western Europe and North America. I also controlled for economic development and democracy. For economic development, I used per capita GDP in purchasing power parity terms as of 1995, from the World Bank’s 1997 World Development Report. To control for democracy, I used a dummy for whether the country had been continuously democratic from 1950 to 1995. Definitions and classifications come from Alvarez et al. (1996). Treisman (2000a) found that this variable was more closely related to perceived corruption than indicators of current democracy, suggesting that democracy has long-term effects on the quality of government. I found that the uninterrupted democracy dummy was also more significant at predicting perceived corruption using the more recent and broader measures examined in this paper than, for instance, Freedom House’s index of political rights. Controlling for economic development and democracy is important both because these factors are very likely to affect the quality of government and because both correlate with various indicators of decentralization. Richer and more stably democratic countries tend to be more decentralized on a number of dimensions: fiscal decentralization, decentralization of government employment, federal structure, subnational police forces.18 At the same time, economic development and a long experience of democracy
18 Each of these correlates with log GNP per capita and stable democracy at .25 or higher.

- 15 -
themselves have been found to reduce corruption (Treisman 2000a). Omitting them leads to omitted variable bias, and would misleadingly reduce the estimated effect if any of these indicators of decentralization does reduce government quality. In columns marked (2) in Table 1, and in all columns of Table 2, I controlled in addition for four cultural and legal variables that other researchers have found to correlate with perceived corruption or other indicators of the quality of government. La Porta et al. (1999) found that Protestant religion correlated with higher quality government, while a French civil law or communist legal system and ethnolinguistic fragmentation all correlated at times with poorer quality government.19 These variables are all somewhat correlated with decentralization indicators, which raises the danger of omitted variable bias. In the (2) columns and all of Table 2, I therefore control for the share of Protestants in the population as of 1980 (from Barrett (1982), as reported in La Porta et al. (1999)); for French civil law system and socialist legal system (from La Porta et al. (1999)); and for ethnolinguistic heterogeneity. For the latter, I used a variable measuring the percentage of the population that spoke a language other than the country’s official language at home as of 1990 (from Gunnemark 1991).20 I updated this to include countries from the former Communist bloc (almost completely excluded from the Gunnemark data), using a number of sources.21 I began by testing the indicators of decentralization separately, since many are highly correlated among themselves.22 The estimated coefficient on each decentralization indicator when included separately in a regression of government quality, with the various controls as described above, is given in Table 1. I also used interaction terms to look for relationships conditioned on the level of economic development (this turned out to be important in predicting adult illiteracy). In addition, I used interaction terms to test the specific arguments about country size raised in the theoretical section. Then, I tried running longer models, including a number of decentralization indicators simultaneously (Table 2). Since including the resource decentralization variables required a large drop in the number of available cases, I present models both with and without these. I also present models both with and without the veto-players variable, since this is quite highly correlated with the federal and subnational police force dummies (at .39 and .47).
C. Results
19 Treisman (2000a) also found that British colonial heritage correlates with lower perceived corruption, and more robustly so than English legal system. However, this did not correlate with any of the indicators of decentralization used, so excluding it should not bias the results. The results are not much changed if this, too, is included. 20 I used the Gunnemark data as in the Easterly and Levine (1997) data set. 21 In particular, Goskomstat Rossii, Rossiisky Statistichesky Yezhegodnik 1996, the 1996 CIA World Factbook, and the Ethnologue database at http://www.sil.org/ethnologue/. 22 Pairwise correlations run as high as .70, between the federal and the subnational police force dummies.

- 16 -
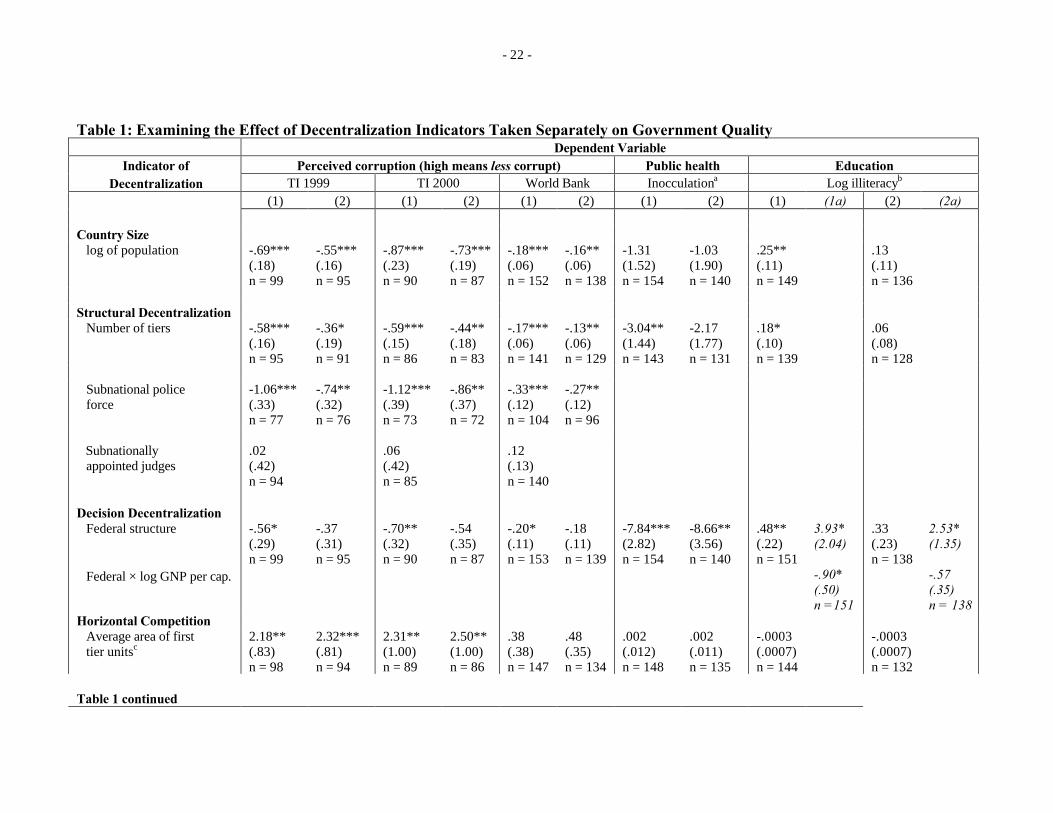
The high level of correlation between different decentralization indicators, and between them and various controls, made discerning the separate effects of each difficult. Nevertheless, some statistically significant results did emerge. First, there is some weak evidence that countries with larger populations tend to have governments that are perceived to be more corrupt. This was significant for all three corruption indexes when the log of population was included as the only decentralization indicator, with or without legal system, ethnic and religious controls. However, the estimated effect was usually somewhat smaller, and at best only marginally significant, when I controlled for other decentralization variables (Table 2, line 4). Thus, some doubt remains about whether large countries are more corrupt just because of their size, or because they tend also to have decentralized institutions (log population correlates with federal structure at .34 and with the number of tiers at .38). I tried including an interaction term (uninterrupted democracy multiplied by log population) to test the Montesquieu hypothesis that corruption should be greater in large democracies, but not necessarily in large dictatorships. However, it was never significant, suggesting that democracies today are not overly burdened by their relative inability to punish corrupt administrative personnel peremptorily and harshly. To test whether the disadvantages of large size were reduced by electoral accountability at subnational levels, I tried using another interaction term (log population multiplied by the number of tiers of government that had centrally appointed executives).23 If local accountability alleviates the weakening of central authority in large states, one would expect this interaction term to be significant and to indicate the presence of poorer government in the countries with more unelected tiers. It was not significant for any of the corruption regressions, or for the inocculation rate. The interaction term was significant (at p < .03) for log illiteracy without the controls for legal system, religion, and ethnicity, but was not at all significant if these were included. There does not seem to be much evidence that problems of governance in large states are alleviated when more tiers of government have locally elected leaders. Tables 1 and 2 do show some fairly robust evidence that structural decentralization—a larger number of tiers of government—is associated with greater perceived corruption, and perhaps with poorer provision of basic health services. The coefficients on the tiers variables were always negative, and often significant in these regressions, even when correlated control variables were included. States tended to be rated from .14 to .45 points more corrupt on the 10-point Transparency International scale per additional tier of government. They were .16 to .21 points more corrupt per tier on the (roughly 3.5 point) World Bank corruption scale.24 Going by the World Bank scale, if Uruguay, with two tiers of government, were to decentralize to the level of Indonesia, with five tiers, its corruption 23 When both a centrally appointed and a locally elected executive existed, as for instance in Sweden—where each landsting (county) council elected its own executive but there also existed a centrally appointed landsting governor—this was coded as ½ instead of 1. 24 These are figures from the controlled regressions in Table 2.

- 17 -
level would sink by to around the level of Guinea-Bissau. The size and significance of the effect for public health is far less clear, but there is some weak evidence that countries with more tiers of government do a poorer job of inocculating babies for common diseases.25 Federal structure always had a negative coefficient in the corruption regressions, but this was not significant controlling for legal system, ethnic fragmentation, and religion. However, countries that had separate subnational as well as national police forces—a variable which correlates closely with federal structure—did have significantly higher perceived corruption even controlling for the legal and cultural variables. The subnational police force variable lost significance as well, though, when various decentralization indicators were tested simultaneously. It is hard to be sure what this means. The vertical division of the police force into potentially competing units may increase corruption slightly, but the data do not permit us to say this with confidence. Countries with subnationally appointed judges did not have significantly poorer government than those in which the judicial system was more centralized.26 Federal structure was, however, quite robustly significant in predicting poorer performance at inocculating babies. Regardless of what controls were included, federal states tended to inocculate up to about 12 percentage points fewer infants for diphtheria, tetanus and pertussis. When the regional veto power variable is included as well, it steals about half of the effect from the federal dummy and has a significant coefficient. Federal structure and the presence of a regionally elected upper house with power to block non-financial legislation are correlated at about .41. This may mean that federal structure impairs the central government’s ability to set up effective nationwide programs to inocculate babies by entrenching the blocking power of obstructionist regional elites who would like to spend the money in other ways. Regional veto power was not significant in any other regressions that controlled for other decentralization indicators. Federal structure also predicted a higher level of adult illiteracy, at least among poorer countries. The federal effect is significant in the controlled regressions if one also includes an interaction term for federalism with log per capita GNP. The results suggest that federal structure increases the illiteracy rate—presumably by complicating the administration of basic education—but that the effect falls as income rises. I did not find any measure of resource decentralization—fiscal decentralization or decentralization of government employees—to be significant, in these regressions. These results may differ from those in Fisman and Gatti (2000) because of the use of different indicators of corruption or because of the inclusion of more controls. (For instance, fiscal
25 I also tried to see if the effect was stronger if one counted only the number of tiers that had centrally appointed executives, or alternatively only those that had locally elected or selected executives. Neither of these was as significant as just the number of tiers. 26 I did not test for a relationship between subnational police or judges and public service provision, as there was no theoretical relationship to expect such a relationship.

- 18 -
decentralization correlates quite highly with Protestant religion, which significantly predicts lower corruption, and fiscal decentralization is also negatively correlated with French civil law systems, which are associated with higher corruption.) Finally, do countries with smaller first-tier units benefit from the greater discipline on their subnational governments generated by capital and labor mobility? Or does the competition for capital in such countries prompt perverse government responses? The estimated coefficients on size of the first-tier units is consistently positive in the corruption regressions, and often significant. If the costs of mobility do decline with distance, this suggests that in countries with greater mobility, perceived corruption is higher, supporting the second hypothesis, that regional governments compete to attract capital more often in corrupt than in efficiency-enhancing ways. (It may be the case that countries with larger first-tier units do a better job of inocculating infants, but this is only significant in one of the controlled regressions in which the sample size drops substantially because of missing data.) How much difference in the perceived corruption regressions does the weighting scheme—designed to place greater emphasis on observations that are more reliable—make? To assess this, I tried running the regressions in Tables 1 and 2 without weighting. In the Table 1 regressions for the TI indexes, the results for many decentralization indicators were actually stronger without the weighting. For instance, federal structure now was significant at p < .10 in the controlled regressions for both the 1999 and 2000 TI regressions. In the Table 1 regressions for the World Bank corruption index, some decentralization indicators were slightly less significant (for instance, significance levels for the number of tiers in regressions with and without the legal and cultural controls fell from p < .01 to p < .05, and from p < .05 to p < .10, respectively; but the pattern of results was the same.) In the Table 2 regressions, which combine a number of mutually correlated decentralization indicators, the results were little changed by eliminating the weighting, though population sometimes gained slightly in significance and the significance of the number of tiers sometimes dropped slightly. To summarize the positive results, there seems clear support for the overgrazing theory. Perceived corruption tends to be higher in countries with a larger number of tiers of government. It does not seem to matter whether these tiers have elected executives or not. Corruption may also be higher in countries with subnational police forces and with larger populations, but this data set does not permit one to assert this with confidence. Perceived corruption is also higher in countries with smaller first-tier units—and therefore greater mobility among subnational governments at the first level. This suggests that Tieboutian competition for residents or capital does not always restrain government abuses, and may even encourage abuses that help to attract capital. Countries with more tiers of government may also do a worse job of inocculating babies for diphtheria, tetanus, and pertussis. Federal states seem clearly less effective at inocculating babies, in part because they tend to have central government structures that entrench the veto power of regional interests. Countries with regionally-elected upper

- 19 -
houses of parliament that could block legislation inocculated a significantly smaller percentage of infants. Federal structure appears also to correlate with higher adult illiteracy rates, though the effect gets weaker as a country’s income rises.27
IV. CONCLUSIONS As numerous countries throughout the developed and developing world embark on projects to decentralize government, understanding how this may affect government quality is crucial. Different theories, often focusing on different types of decentralization, yield contradictory or inconclusive implications. Attempts to test them have also been generally contradictory and inconclusive. In this paper, I attempted to define five types of political decentralization, to present five specific arguments about how particular types of decentralization should affect government quality, and then to test these arguments using a newly created data set. Some quite strong evidence emerged that several types of decentralization tend to reduce the quality of government, as measured by perceived corruption or the effectiveness of basic healthcare or education services. Perceived corruption is higher in those countries whose governments are vertically divided into a larger number of tiers. This fits a story in which the failure of predatory governments in a decentralized state to coordinate leads to a very high aggregate rate of bribes, which drives many firms underground or out of business. Federally structured states do a significantly poorer job of inocculating infants against common diseases, perhaps because such states give regional interests greater power to block central programs. Federal states tend to have higher rates of adult illiteracy, though this effect is weaker among richer federations. Furthermore, contrary to the Tieboutian idea that competition between small government units for residents and capital disciplines governments, it was the countries with larger first-tier subnational units (and therefore higher barriers to mobility) that were perceived to have the least corrupt governments. More research is needed to test the strength of this finding, but if corroborated it would suggest that the emphasis on decentralization to increase competition at local levels may at times be overdone. Reducing the size of subnational units does, as argued, increase competition between them. However, this may lead not to efficiency-enhancing responses by subnational governments but to perverse attempts to attract capital by offering enterprise managers corrupt collusive deals (Cai and 27 I also tried to see whether federal structure and the number of tiers were related to several other possible indicators of public service provision, which for various reasons I thought inferior to the main ones used (inocculations and adult literacy). I tried running regressions with the percentage of roads that were paved, the secondary and primary school enrollment rates, the number of pupils per teacher in primary schools, the percentage of the population that had access to safe water, health services and sanitation, and public healthcare or education spending as a percent of GNP or GDP. Of 18 indicators, all but two had the “right” signs, suggesting that federal structure or more tiers of government were associated with poorer quality or less extensive services. Four of the 16 were significant at p < .05, and one more at p < .10.

- 20 -
Treisman 2000). Breaking larger subnational units into smaller ones may also reduce the ability of subnational governments to coordinate to police abuses of the central government and its officials.28 Where subnational governments are smaller, central governments may be able to get away with greater corruption. The evidence presented in this paper is far from conclusive. However, if borne out, it would suggest that the current vogue for decentralization should not be pushed too far, especially in developing countries. Policymakers might be well-advised to consider carefully before introducing additional tiers of government, as occurred recently in Russia and in Poland. Requiring electoral accountability at the new levels is not usually enough to offset the problems caused by additional vertical divisions. Central politicians might also be wise to refrain from reforms to decentralize the police force (as was done in Russia in the early 1990s, when municipal forces were legalized). Abstracting from all other factors, the data suggest that the highest quality governments will tend to occur in less populous countries with unitary states, few tiers of government and relatively large first tier units, a single centralized police force, and a central legislature in which regional actors do not have veto power—similar, for instance, to Finland and New Zealand, or in the developing world, to Jordan and Botswana. In some cases, however, tradeoffs arise. Larger subnational subunits may, as argued, have greater power to coordinate to restrict corrupt abuses by central officials and their agents. But, especially in countries with ethnic minorities and problems of integration, larger subunits can also threaten more credibly to secede, and use such threats to obtain central financial aid, weakening macroeconomic policy.29 Often the latter risk will be more important than the former. For instance, to attempt to consolidate Russia’s 89 regions into a few super-regions in the hope of strengthening political checks on central corruption might well exacerbate secessionist threats and macroeconomic strains. If the preliminary empirical evidence on this point stands up to closer examination, there may turn out to be an unavoidable tradeoff in federal or ethnically divided countries between higher corruption, on the one hand, and greater macroeconomic stability and territorial cohesion, on the other. Some important questions remain for future research. The veto-players argument, in fact, predicts not that governments in decentralized states should be better or worse, but that the level of government quality should be more constant over time in countries in which decentralization has created additional veto players. I was not able to investigate this properly for lack of reliable longitudinal data on corruption. But some longitudinal data on public service provision do exist and could usefully be examined to see whether changes in public provision, controlling for the relevant environmental factors, are smaller in 28 For a model that emphasizes this role of subnational governments in securing liberal central government policy, see Weingast 1995. 29 On how such threats have been mobilized even in a federation with a large number of subunits, Russia, see Treisman (1999a). Treisman (1999b) models the logic of such center-region interactions, and their impact on macroeconomic outcomes and state stability.

- 21 -
countries with greater entrenchment of regional interests. A great deal more could also be done to understand the mechanisms by which particular types of decentralization impair the quality of government. Various problems of decentralization may be solvable by combining decentralization with other institutional changes. More examination of interaction terms might find that some combinations of different types of decentralization avoid the problems created by these types of decentralization if implemented in isolation. Some argue that adequate fiscal and electoral decentralization can offset the problems created by decision decentralization—if local governments are elected and must raise their own resources to pay for public services, then they may be less prone to predate on local businesses or to seek rents by lobbying the central government. Such possibilities await empirical testing.
- 22 -
Table 1: Examining the Effect of Decentralization Indicators Taken Separately on Government Quality Dependent Variable
Indicator of Perceived corruption (high means less corrupt) Public health Education Decentralization TI 1999 TI 2000 World Bank Inocculationa Log illiteracyb
(1) (2) (1) (2) (1) (2) (1) (2) (1) (1a) (2) (2a) Country Size log of population -.69***
(.18) n = 99
-.55*** (.16) n = 95
-.87*** (.23) n = 90
-.73*** (.19) n = 87
-.18*** (.06) n = 152
-.16** (.06) n = 138
-1.31 (1.52) n = 154
-1.03 (1.90) n = 140
.25** (.11) n = 149
.13 (.11) n = 136
Structural Decentralization Number of tiers -.58***
(.16) n = 95
-.36* (.19) n = 91
-.59*** (.15) n = 86
-.44** (.18) n = 83
-.17*** (.06) n = 141
-.13** (.06) n = 129
-3.04** (1.44) n = 143
-2.17 (1.77) n = 131
.18* (.10) n = 139
.06 (.08) n = 128
Subnational police force
-1.06*** (.33) n = 77
-.74** (.32) n = 76
-1.12*** (.39) n = 73
-.86** (.37) n = 72
-.33*** (.12) n = 104
-.27** (.12) n = 96
Subnationally appointed judges
.02 (.42) n = 94
.06 (.42) n = 85
.12 (.13) n = 140
Decision Decentralization Federal structure
-.56* (.29) n = 99
-.37 (.31) n = 95
-.70** (.32) n = 90
-.54 (.35) n = 87
-.20* (.11) n = 153
-.18 (.11) n = 139
-7.84*** (2.82) n = 154
-8.66** (3.56) n = 140
.48** (.22) n = 151
3.93* (2.04)
.33 (.23) n = 138
2.53* (1.35)
Federal × log GNP per cap. -.90* (.50) n =151
-.57 (.35) n = 138
Horizontal Competition Average area of first tier unitsc
2.18** (.83) n = 98
2.32*** (.81) n = 94
2.31** (1.00) n = 89
2.50** (1.00) n = 86
.38 (.38) n = 147
.48 (.35) n = 134
.002 (.012) n = 148
.002 (.011) n = 135
-.0003 (.0007) n = 144
-.0003 (.0007) n = 132
Table 1 continued

- 23 -
Veto Players Regionally elected upper house can block non-financial legislation
-.44* (.24) n = 98
-.31 (.19) n = 94
-.46** (.23) n = 90
-.42** (.18) n = 87
-.12* (.07) n = 150
-.09 (.06) n = 136
-6.96*** (2.32) n = 151
-6.66*** (2.39) n = 137
.22** (.11) n = 149
.13 (.08) n = 136
Resource Decentralization Subnational expenditure share
.01 (.02) n = 53
-.01 (.02) n = 52
.01 (.02) n = 48
-.03 (.02) n = 47
.003 (.006) n = 53
-.005 (.006) n = 52
.05 (.13) n = 53
-.05 (.11) n = 52
-.008 (.005) n = 52
-.009 (.007) n = 51
Subnational tax share .01
(.02) n = 53
-.02 (.02) n = 53
.01 (.02) n = 48
-.02 (.02) n = 48
-.00 (.01) n = 53
-.009 (.007) n = 53
.12 (.14) n = 53
.01 (.14) n = 53
-.010* (.006) n = 52
-.011 (.007) n = 52
Subnational share of government employment
.07 (.07) n = 72
-.05 (.05) n = 70
.08 (.07) n = 67
-.04 (.06) n = 65
.02 (.02) n = 88
-.01 (.02) n = 85
.30 (.54) n = 89
.18 (.50) n = 86
-.03 (.02) n = 89
.002 (.025) n = 86
a Percent of children inocculated for diptheria, tetanus, and pertussis by end of first year. b Log of the percentage of adult population (15 and older) illiterate. c controlling for country total area, which is negatively related to quality of governance. Note: figure shown is estimated coefficient on the given indicator of decentralization. (1) columns control for 1995 log per capita GNP (in purchasing power parity terms), uninterrupted democracy since 1950, and region (Africa, Asia, Latin America and Caribbean, Middle East, Eastern Europe and former Soviet Union, OECD). (2) columns control in addition for ethnolinguistic division, French civil law legal system, socialist legal system, and share of Protestants in the population. OLS with White heteroskedasticity corrected standard errors in parentheses. * p < .10; ** p < .05; *** p < .01. Range of TI 1999 perceived corruption index is from 1.5 for Cameroon (most corrupt) to 10 for Denmark (least corrupt); for TI 2000 index, 1.2 for Nigeria to 10 for Finland ; that of World Bank is from -1.567 (Niger) to 2.129 (Denmark). Transparency International corruption regressions have observations weighted by the inverse of the standard error of ratings across the sources used to construct the perceived corruption index; World Bank corruption regression has observations weighted by inverse of “standard error”—a measure based on the relative correlation of the sources used for that observation with other sources overall. Public health and education regressions unweighted.

- 24 -
Table 2: The Effect of Decentralization Indicators Included Simultaneously on Government Quality Dependent Variable
Independent Perceived corruption (high means less corrupt) Public health Education Variables TI 1999 TI 2000 World Bank Inocculationa Log illiteracyb
1. Number of tiers -.15
(.20) -.45** (.21)
-.14 (.21)
-.36* (.21)
-.40** (.17)
-.40* (.20)
-.17** (.08)
-.21** (.10)
-.16* (.08)
-2.68 (1.87)
-6.43*** (2.24)
-3.07 (1.89)
.05 (.08)
.06 (.08)
.06 (.12)
.04 (.08)
2. Subnational police force
-.55 (.48)
-.46 (.57)
-.54 (.52)
-.55 (.55)
-.53 (.73)
-.42 (.64)
-.16 (.19)
-.15 (.23)
-.17 (.21)
3a. Federal structure
-11.86** (4.55)
-11.80** (5.32)
-7.04 (5.31)
.14 (.20)
3.37** (1.64)
6.31** (2.48)
3.07* (1.73)
3b. Federal × log GNP per capita
-.83** (.40)
-1.53** (.60)
-.78* (.42)
4. Log of population -.35 (.27)
-.57* (.31)
-.35 (.27)
-.58* (.32)
-.53 (.36)
-.44 (.28)
-.10 (.10)
-.19 (.13)
-.09 (.10)
1.92 (2.24)
-.23 (2.50)
3.31 (2.31)
.05 (.13)
-.01 (.14)
.03 (.17)
-.02 (.14)
5. Average area of first tier unitsc
.002** (.001)
.001** (.001)
.002** (.001)
.002** (.001)
.001 (.001)
.002** (.001)
.0003 (.0003)
.0004 (.0003)
.0003 (.0003)
.01 (.01)
.02* (.01)
.01 (.01)
-.0001 (.0004)
.0002 (.0004)
.0005 (.0004)
.0002 (.0004)
6. Subnational share of government emp.
-.02 (.06)
-.01 (.06)
-.01 (.03)
.83 (.57)
.018 (.029)
7. Regionally elected upper house can block non- financial legislation
-.01 (.25)
-.24 (.27)
.002 (.093)
-6.25** (2.87)
.09 (.09)
Constant -5.56*
(3.28) -1.88 (3.66)
-5.64* (3.32)
-1.35 (3.06)
-1.99 (3.48)
-2.01 (2.89)
-3.1*** (.99)
-2.49* (1.48)
-3.2*** (1.00)
47.22* (25.14)
110.5*** (23.86)
46.52* (24.67)
8.1*** (1.06)
8.0*** (1.05)
7.8*** (1.59)
8.1*** (1.06)
R2 .9004 .9209 .9003 .8976 .9130 .9002 .8502 .8737 .8515 .5648 .5520 .5815 .8387 .8431 .8544 .8460 N 73 57 72 69 55 69 89 63 87 128 81 126 125 125 80 123 a Percent of children inocculated for diptheria, tetanus, and pertussis by end of first year. b Log of the percentage of adult population (15 and older) illiterate. c controlling for country total area, which is negatively related to quality of governance. Note: all regressions control for 1995 log per capita GNP (in purchasing power parity terms), uninterrupted democracy since 1950, region (Africa, Asia, Latin America and Caribbean, Middle East, Eastern Europe and former Soviet Union, OECD), ethnolinguistic division, French civil law legal system, socialist legal system, and share of Protestants in the population. OLS with White heteroskedasticity-corrected standard errors in parentheses. * p < .10; ** p < .05; *** p < .01. Range of TI 1999 perceived corruption index is from 1.5 for Cameroon (most corrupt) to 10 for Denmark (least corrupt); for TI 2000 index, 1.2 for Nigeria to 10 for Finland ; that of World Bank is from -1.567 (Niger) to 2.129 (Denmark). Transparency International corruption regressions have observations weighted by the inverse of the standard error of ratings across the sources used to construct the perceived corruption index; World Bank corruption regression has observations weighted by inverse of “standard error”—a measure based on the relative correlation of the sources used for that observation with other sources overall. Public health and education regressions unweighted.

- 25 -
APPENDIX 1: A SIMPLE FORMALIZATION OF THE OVERGRAZING ARGUMENT
If governments are predatory, they will extract more in aggregate bribes, the more tiers of government have jurisdiction over the same citizens or businesses. The argument assumes that high bribe rates depress economic activity or discourage investment. Given this, the bribe rate that maximizes total bribe revenues will be at an intermediate level. A unified predatory government would set the rate at this revenue-maximizing point. But when several predatory governments set bribe rates on the same base in an uncoordinated fashion, each will ignore the cost its extraction imposes on the other governments by depressing economic activity. The result will be an aggregate bribe rate set above the maximum-extraction rate. One might expect such states to have relatively high aggregate bribe rates but relatively low actual bribe revenues.30 Consider the following simple model. N revenue-maximizing governments independently and simultaneously demand a percentage of the output of a number of enterprises in the form of bribes. Denote the bribe rate set by government i bi, and the aggregate bribe rate B
= min { 1
1bii
N
=∑ . Output, Y, falls as the aggregate bribe rate rises according to the
production function Y = (1 - B)Ka, where K is the capital stock, assumed fixed and positive in this simple example. Each government plays Cournot-Nash; that is, each maximizes its bribe revenues subject to the bribe rates set by the other governments. Government i maximizes Ri = bi(1 - B)Ka. ∂Ri/∂bi = (1 - b1 - b2 - … - bi - 1 - 2bi - bi + 1 - … - bN)Ka = 0 ⇔ bi = (1 - b1 - b2 - … - bi - 1 - bi + 1 - … - bN)/2 Assuming a symmetric solution, in which b1 = b2 = bi = … = bN, bi = [1 - (N - 1)bi]/2 bi = 1/(N + 1), B = N/(N + 1), and aggregate bribe revenues, BY = B(1 - B)Ka decrease when B > ½ , i.e. when N > 1. In other words, the aggregate bribe rate is set at the revenue-maximizing level when there is only one government, but rises above the revenue-maximizing level causing a fall in revenues as the number of governments increases. The aggregate tax rate increases with the number of governments (since B = N/(N + 1) increases with N). (For a more complicated, realistic and general demonstration of this point, see Berkowitz and Li 2000).
30 Relative, that is, to those of a unified, predatory government.

- 26 -
REFERENCES
Ades, Alberto and Rafael Di Tella. 1999. “Rents, Competition and Corruption,” American Economic Review. Alvarez, Mike, Jose Antonio Cheibub, Fernando Limongi, and Adam Przeworski. 1996. “Classifying Political Regimes,” Studies in Comparative International Development, Summer, 31, 2, pp.3-36. Bardhan, Prahab and Dilip Mookherjee. 2000. “Capture and Governance at Local and National Levels,” American Economic Review, 90, 2, May, pp.135-9. Barrett, D., ed. 1982. World Christian Encyclopedia, New York: Oxford University Press. Berkowitz, Daniel M. and Wei Li. 2000. “Decentralization in Transition Economies: A Tragedy of the Commons?” Journal of Public Economics, June. Brennan, Geoffrey and James M. Buchanan. 1980. The Power to Tax: Analytical Foundations of a Fiscal Constitution, New York: Cambridge University Press. Breton, Albert. 1996. Competitive Governments: An Economic Theory of Politics and Public Finance, New York: Cambridge University Press. Bueno de Mesquita, Bruce and Hilton Root, eds. 2000. Governing for Prosperity, New Haven: Yale University Press, forthcoming. Cai, Hongbin and Daniel Treisman. 2000. “Decentralization, Capital Mobility and Governance in Weak States,” UCLA: manuscript. Easterly, William and Ross Levine. 1997. “Africa’s Growth Tragedy: Policies and Ethnic Divisions,” Quarterly Journal of Economics, Nov, 112, 4, pp.1203-1250. Elazar, Daniel. 1995. “From Statism to Federalism: A Paradigm Shift,” Publius, winter. Fisman, Raymond and Roberta Gatti. 2000. “Decentralization and Corruption: Evidence Across Countries,” manuscript, Washington, DC: World Bank. Goldsmith, Arthur A. 1999. “Slapping the Grasping Hand: Correlates of Political Corruption in Emerging Markets,” American Journal of Economics and Sociology, forthcoming. Gunnemark, Erik V. 1991. Countries, Peoples and Their Languages: the Linguistic Handbook, Gothenburg, Sweden: Lanstryckeriet. Hayek, Friedrich von. 1939. “The Economic Conditions of Interstate Federalism,” reprinted in Friedrich von Hayek, Individualism and the Economic Order, ch.12. Chicago: University of Chicago Press, 1948. Hume, David. 1994. “Idea of a Perfect Commonwealth,” in Knud Haakonssen, ed., Hume: Political Essays, New York: Cambridge University Press.

- 27 -
Kaufmann, Daniel, Aart Kraay and Pablo Zoido-Lobaton. 1999a. “Aggregating Governance Indicators,” Policy Research Working Paper 2195, Washington DC: The World Bank. --------------------------------------------------------------------. 1999b. “Governance Matters,” Policy Research Working Paper 2196, Washington DC: The World Bank. La Porta, Rafael, Florencio Lopez-de-Silanes, Andrei Shleifer and Robert W. Vishny. 1999. “The Quality of Government,” Journal of Law, Economics and Organization, 15, 1, pp.222-79. Lipset, Seymour Martin and Gabriel Salman Lenz. 1999. “Corruption Culture and Markets,” George Mason University, manuscript. Montesquieu, Charles de Secondat, baron de. 1748. L’esprit des lois, translated and edited by Anne Cohler, Basia Miller and Harold Stone, New York: Cambridge University Press, 1989. Montinola, Gabriella, Yingyi Qian, and Barry R. Weingast. 1996. “Federalism, Chinese Style: The Political Basis for Economic Success,” World Politics, 48, 1, pp.50-81. Prud’homme, Remy. 1995. “On the Dangers of Decentralization,” World Bank Research Observer, 10, 2, pp.201-20. Qian, Yingyi and Gérard Roland. 1998. “Federalism and the Soft Budget Constraint,” American Economic Review, December, 88, 5, pp.1143-62. Riker, William. 1964. Federalism: Origin, Operation, and Significance. Boston: Little Brown. Rose-Ackerman, Susan. 1978. Corruption: A Study in Political Economy, New York: Academic Press. ----------------------------. 1997. “The Political Economy of Corruption,” in Kimberly Ann Elliott, ed., Corruption and the Global Economy, Washington DC: Institute for International Economics. Rousseau, Jean Jacques. 1762. The Social Contract¸ in Political Writings, translated and edited by Frederick Watkins, Madison, University of Wisconsin Press, 1986. ----------------------------. 1772. Considerations on the Government of Poland and on its Proposed Reformation, in Political Writings, translated and edited by Frederick Watkins, Madison, University of Wisconsin Press, 1986. Salmon, Pierre. 1987. “Decentralization as an Incentive Scheme,” Oxford Review of Economic Policy, 3, 2, summer, pp.24-43. Sandholtz, Wayne and William Koetzle. 2000. “Accounting for Corruption: Economic Structure, Democracy, and Trade,” International Studies Quarterly, 44, pp.31-50. Schiavo-Campo, Salvatore, Giulio de Tommaso and Amitabha Mukherjee. 1997. An International Statistical Survey of Government Employment and Wages, Washington DC: The World Bank, PRWP 1806.

- 28 -
Shleifer, Andrei and Robert Vishny. 1993. “Corruption,” Quarterly Journal of Economics, vol.108 (August), pp.599-617. Stone, Andrew, Brian Levy, and Ricardo Paredes. 1992. Public Institutions and Private Transactions: The Legal and Regulatory Environment for Business Transactions in Brazil and Chile, Washington, DC: World Bank, Policy Research Working Paper 891. Tanzi, Vito. 1995. “Fiscal Federalism and Decentralization: A Review of Some Efficiency and Macroeconomic Aspects,” in World Bank, Annual World Bank Conference on Development Economics 1995, Washington DC: World Bank. Tanzi, Vito and Hamid Davoodi. 1997. “Corruption, Public Investment, and Growth,” IMF Workding Paper 97/139, Washington, DC: IMF. Tiebout, Charles. 1956. “A Pure Theory of Local Expenditures,” Journal of Political Economy, 64, October, 416-24. Treisman, Daniel. 1999a. After the Deluge: Regional Crises and Political Consolidation in Russia, Ann Arbor: University of Michigan Press. ---------------------. 1999b. ““Political Decentralization and Economic Reform: A Game Theoretic Analysis,” American Journal of Political Science, April. ---------------------. 2000a. “The Causes of Corruption: A Cross-National Study,” Journal of Public Economics, June. ---------------------. 2000b. “Decentralization and Inflation: Commitment, Collective Action, or Continuity?” American Political Science Review, December. Tsebelis, George. 1995. “Decision Making in Political Systems: Veto Players in Presidentialism, Multicameralism and Multipartyism,” British Journal of Political Science, 25, July, pp.289-325. --------------------. 1999. “Veto Players and Law Production in Parliamentary Democracies: An Empirical Analysis,” American Political Science Review, forthcoming. Tsebelis, George. 1995. “Decision Making in Political Systems: Veto Players in Presidentialism, Multicameralism and Multipartyism,” British Journal of Political Science, 25, July, pp.289-325. --------------------. 1999. “Veto Players and Law Production in Parliamentary Democracies: An Empirical Analysis,” American Political Science Review. Tsebelis, George and Jeannette Money. 1997. Bicameralism, New York: Cambridge University Press. Weingast, Barry R. 1995. "The Economic Role of Political Institutions: Market- Preserving Federalism and Economic Development," Journal of Law, Economics, and Organization, 11, 1 April, pp.1-31. Wilson, James Q. 1970. "Corruption: The Shame of the States," in Arnold J. Heidenheimer, ed., Political Corruption: Readings in Comparative Analysis,

- 29 -
New York: Holt, Rinehart and Winston.