decision-making networks across political systems filedecision-making networks in german and swiss...
TRANSCRIPT

Decision-making networks across political systems
Florence Metz∗1, 2 and Laurence Brandenberger2,3
1Natural Resource Policy Group, Institute for Environmental Decisions, ETH Zürich, Zürich,Switzerland
2Institute of Political Science, University of Bern, Switzerland3Department of Environmental Social Sciences, Swiss Federal Institute of Aquatic Science and
Technology (Eawag), ETH Domain, Switzerland
Abstract
Institutions matter in policy-making. Political systems shape power structures and interac-tion patterns between actors in decision-making processes. Although the social fabric ofdecision-makers’ interactions is key to successful policy-making, it remains unclear whichrelational structures can typically be found across political systems. This paper uncov-ers the ways in which macro-political institutions shape political processes by adopting anetwork approach.
We analyze differences in power structures and interaction patterns across four differentdecision-making networks in German and Swiss consensual-federal, French majoritarian-unitary, and hybrid Dutch consensual-unitary democracies. We surveyed 199 state andnon-state actors on their network interactions in decision-making processes on water pro-tection. We fit exponential random graph models and calculate predicted probabilities tocompare the structural composition of those four networks. Results show that our cases ofconsensus democracies tend to institutionalize neighborhoods of networks where severalnetwork members are central and share power. Actors tend to exhibit close-knit collab-orative interactions and to seek compromise with opponents. Our case of a majoritariandemocracy shows power concentration with few highly centralized actors. The competitivestyle of policy-making restrains access to competitors, thereby limiting the need to interactand search for compromises with opponents.
The paper uncovers how political structures translate into network interactions duringdecision-making processes and ultimately produce social environments that produce (orfail to produce) policy outputs.
Keywords: decision-making process, political systems, comparative politics, policy net-work, interaction pattern, water protection policy
∗Corresponding author at: ETH-NARP, Swiss Federal Institute of Technology Zurich, Universitätstrasse 22,8092 Zurich, Switzerland, +41 (0)44 63 388 68E-mail address: [email protected]
1
source: https://doi.org/10.7892/boris.117347 | downloaded: 27.12.2019

Introduction
Analyzing the structures of policy-making networks is key to understanding decision-making
across political systems. Political systems provide opportunity structures for the emergence of
certain network structures over others. Uncovering interaction and power patterns in decision-
making networks, we shed light on the social environment that produces (or fails to produce)
policy outputs. The network perspective is a powerful tool to uncover how political structures
(i.e., polity) translate into political processes (i.e., politics) and shape policy content in a dis-
tinctive manner across political systems.
It is uncontested today that institutions matter in shaping policy content (Aoki, 2011). Po-
litical systems institutionalize the distribution of power and interaction patterns among actors
taking policy decisions (Immergut, 1992; Lijphart, 2012; North, 1990). Despite uncontested in-
stitutionalism, the literature has difficulties establishing a systematic link between a country’s
overall political structure and its policies across time and policy fields. Rather than establish-
ing a direct link some authors suggest instead an indirect impact, mediated via decision-making
networks (Bressers and O’Toole, 1998; Kriesi et al., 2006). Decision-making networks serve
as maps of policy-making processes. Policy-making has been described as a black box where a
societal problem ‘goes in’ and a solution ‘goes out’ in the form of a policy. To uncover the so-
cial processes in the black box of policy-making, scholars have relied on the network approach
(Easton, 1965; Immergut, 1998; Ingold, 2011; Metz, 2017). The network approach provides
a synthetic overview of the actors involved in policy-making, their power dependencies (In-
gold and Leifeld, 2016), and interactions (Dowding, 1995, 157). We define decision-making
networks as snapshots of the aggregated result of multi-actor interactions in the policy-making
processes over time. By analyzing network interactions in more detail, we capture the impact
of diverse formal institutions on decision-making.
The words institutions or institutional structures are commonly used to refer to polity, i.e.
rules that characterize a political system by defining political structures of power-sharing in
decision-making (Knill and Tosun, 2012). It is important to note that there are diverging defini-
2

tions of the term institution in scientific literature (Aoki, 2011; Immergut, 1998; North, 1990).
Here, a narrow definition is chosen according to which institutions are a set of formal rules
defining the functioning and composition of a country’s political architecture (adapted from
Knill and Tosun, 2012).
A country’s macro-political architecture impacts on the structure of decision-making net-
works by defining participation mechanisms or attributing decision-making power to specific
policy actors. In general, constitutions formally define the structure of political systems by
determining electoral and party systems, as well as the horizontal and vertical distribution of
power (Knill and Tosun, 2012). In his seminal work, Lijphart (1999) establishes a typology of
modern democracies according to the extent to which states formally and informally concen-
trate or diffuse political responsibility. Lijphart distinguishes consensus democracies, which
diffuse and limit political responsibility in a variety of ways, from majoritarian democracies,
which concentrate political responsibility in the hands of the majority (Lijphart, 2008). By ap-
plying Lijphart’s typology, Kriesi et al. (2006) as well as Adam and Kriesi (2007) explore the
impact of macro-political institutional contexts on the structure of decision-making networks.
Consensus democracies are said to provide strong incentives for cooperation, while majoritar-
ian democracies are known for their competitive style of policy-making (Kriesi et al., 2006).
Hence, the authors expect network members’ “interaction patterns to be more cooperative in
consensus democracies and more competitive in majoritarian democracies” (Adam and Kriesi,
2007, 138).
However, a country’s institutional architecture is not assumed to be reflected 1:1 in the
network structure, because decision-making networks can develop a dynamic beyond formal
institutions (Börzel, 1998). While institutional arrangements are stable, decision-making net-
works can be described as fluid. Hence, the assumption here is that given a stable institutional
arrangement, not every type of network structure is possible, but the observable patterns in
decision-making are expected to belong to a neighborhood of networks (Lubell et al., 2012).
Analyzing these diverse network structures is a key to understanding policy-making across po-
litical systems. Towards this goal, the present article addresses the following research question
3

from a comparative perspective: Which structural aspects do decision-making networks exhibit
given their embeddedness into a political system?
To answer this question, we compare decision-making networks in the field of water pro-
tection in four countries, which display different degrees of variation with regards to their po-
litical architectures. While Switzerland and Germany are both examples of consensual-federal
democracies, France is a classic majoritarian-unitary system, and the Netherlands a hybrid
form of federal-unitary democracy. Our case selection enables us to understand (as thoroughly
as possible with the limitations of only four cases) which network properties exist given their
institutional frame. This way, we explore structural aspects, which characterize the neighbor-
hoods of networks in various political systems.
In the first section of the article, we define network structures that are expected to be ev-
ident in consensus, majoritarian, or hybrid democracies according to the literature. With a
comparative research design, we categorize the macro-political systems of Switzerland, Ger-
many, France, and the Netherlands following Lijphart’s typology. In the methods section, we
explain the use of exponential random graph models (ERGM) to analyze the network data and
compare decision-making networks. As comparisons between networks of different size repre-
sent an inherent difficulty in network research (see e.g., Friedkin, 1981), this paper makes use
of micro-level interpretations of ERGMs (Desmarais and Cranmer, 2012) and compares pre-
dicted probabilities based on said models (Faust and Skvoretz, 2002). After presentation and
discussion of our results, we reflect on the structural properties that characterize neighborhoods
of networks across political systems and discuss broader simplications.
Macro-Political Structures and Decision-Making Networks
Lijphart (1984) modernized the comparative literature on political systems with his systematic-
empirical approach to categorizing countries’ political architecture (Mainwaring 2001, 57, after
Vatter 2014).
4

While the classical distinction between parliamentary and presidential democracies relies
on constitutional formal rules, Lijphart additionally takes informal characteristics of political
systems into consideration. Accordingly, formal and informal rules structure power depen-
dencies and interactions between policy actors, and also define how democracies operate. Li-
jphart’s systematic-empirical approach focuses on the analysis of different modes of decision-
making as well as the distribution of power. These elements connect particularly well to the
study of political networks, which aggregate multi-actor interactions of decision-making pro-
cesses and reflect power dependencies. Hence, Lijphart’s typology of democracies concentrates
on aspects that are constitutive of the policy network approach.
In Lijphart’s (1999) distinction between the two extreme models of modern democracies,
namely consensus and majoritarian democracies, a central distinctive element is the dispersion
of power. Majoritarian democracies concentrate power in the hands of the majority government,
while consensus democracies emphasize the diffusion of power (Lijphart, 2008).
More specifically, Lijphart bases his distinction on two dimensions: vertical division of
power termed the federal-unitary dimension, and horizontal division of power, the executive-
party dimension (Lijphart, 2012; Vatter and Stadelmann-Steffen, 2013). Ideal-typical majori-
tarian democracies are characterized by unitary and centralized governments (on the federal-
unitary dimension), a competitive two-party system out of which one majority party controls
the entire government and dominates the parliament, a first-past-the-post electoral system and
competitive interest group pluralism (on the executive-party dimension). Hence, distinctive
is the concentration of power in the hands of the majority, typically in the form of one-party
cabinets (Lijphart, 1999, 91). While competition and majority rule guide decision-making
processes in majoritarian democracies, compromise-seeking and consensual negotiations are
emphasized in consensus democracies (Kriesi et al. 2006, Vatter 2014, 56). Consensus democ-
racies are defined by federal and decentralized governments (on the federal-unitary dimension);
multi-party systems, executive power sharing, balance of power between the executive and the
legislative, proportional representation, and interest group corporatism (on the executive-party
dimension). According to those characteristics, ideal-typical consensual democracies restrain
5

power from governmental and parliamentary majorities; they strengthen participatory rights of
political minorities, and aim at the diffusion of power (Schmidt, 2010). To overcome political
conflicts, political elites are incentivized to work towards amicable agreements in both parlia-
mentary and extra-parliamentary phases of decision-making processes. As a result, Lijphart’s
typology distinguishes between consensual-federal and majoritarian-unitary democracies at the
extremes, and consensual-unitary as well as majoritarian-federal democracies as hybrid forms
of democracies.
Distribution of power
Kriesi et al. (2006) make use of Lijphart’s typology of democracies, and propose that different
types of political systems provide opportunity structures for the emergence of certain network
structures over others. In consensus democracies several organizations share power, and within
those organizations, different political forces further split power. Ingold and Leifeld (2016)
argue that the diffusion of power should also be reflected in the structure of decision-making
networks. Kriesi et al. (2006) expect several central network actors to share power in consensus
democracies. Majoritarian democracies, on the contrary, are said to concentrate power within
a few political institutions and actors (Kriesi et al., 2006). Consequently, decision-making
networks are expected to be largely centralized around a few powerful actors.
Consensus democracies are more likely to display decision-making networks with a
fragmentation of power among policy actors. In majoritarian democracies, on the contrary,
decision-making networks are more likely to be characterized by the concentration of power in
the hands of a few actors (according to Kriesi et al., 2006; Fischer, 2012).
Based on these theoretical foundations, we formulate the following hypothesis:
Hypothesis 1 (Power) Consensus democracies tend to be characterized by a fragmentation
of power among network members, while majoritarian democracies tend to concentrate power
in the hands of only a few actors.
6

Types of interactions
Political systems do not only structure power dependencies but also define interaction patterns
between policy actors. In consensus democracies, institutionalized consultative procedures in-
centivize the diverse types of policy actors to seek compromise, whereas majoritarian democ-
racies induce competitive interaction patterns through unilateral styles of policy-making.
More specifically, institutionalized consultative procedures of consensus democracies can
include participative committees or advisory bodies. Such formal consultative processes pro-
mote negotiations in cases of conflict, they induce cooperative styles of policy-making (Kriesi
et al., 2006), and as such, increase the interconnectedness between policy actors (Bressers and
O’Toole, 1998, 219). Bressers and O’Toole (1998) categorize decision-making networks by
their level of interconnectedness, which stands for the number of contacts among actors. In-
teraction patterns can be labeled as cooperative or competitive, where cooperative stands for
many interaction points and competitive stands for few opportunities for exchange.
The expectation for consensus democracies is that network structures reflect the cooperative
style of policy-making by means of close-knit, interconnected patterns of ties among network
members (Adam and Kriesi, 2007). In majoritarian democracies informal rules are thought to
underline more competitive interaction patterns along with a unilateral style of policy-making.
In comparison to consensus democracies, network interactions are less close-knit and rather
competitive in nature (Adam and Kriesi, 2007).
While the previous authors’ (Adam and Kriesi, 2007; Kriesi et al., 2006) typology of net-
work structures focuses on interactions between policy actors, Fischer (2012) concentrates on a
more aggregated level: on coalition structures. He argues that advocacy coalitions, as defined
by Sabatier (1988) and Sabatier and Jenkins-Smith (1994), are the most crucial structural ele-
ments of decision-making networks because they represent belief-cohesive subgroups in which
actors coordinate action and work towards a common political goal (Fischer 2012, 55, see also
Ingold 2011, Kriesi and Jegen 2001). By focusing on interactions between coalitions rather
than among single actors, we deduce that, in consensus democracies with consultation mecha-
nism and a cooperative styles of policy-making, interactions between coalitions are necessary
7

for building compromise. In majoritarian democracies, by contrast, conflictive types of inter-
actions between coalitions are likely to be common as these systems typically lack consultation
mechanisms and provide incentives for competition.
Combining insights of the above-presented authors, i.e., Lijphart with his typology of
democracies, and Kriesi et al. (2006), Bressers and O’Toole (1998), and Fischer (2012) with
their network typologies, suggests the following hypothesis regarding the intensity of network
interactions.
Hypothesis 2 (Interconnectedness) Consensus democracies tend to display rather close-knit
cooperative interactions, while majoritarian democracies tend to exhibit sparse and competi-
tive interactions among policy actors and across coalitions.
In their network typology, Bressers and O’Toole (1998) do not only characterize the quan-
tity (i.e., interconnectedness) of interactions between policy actors, but also specify a more
qualitative or normative aspect of it.
A central aspect of decision-making networks is the distribution of objectives among net-
work members. Actors base their policy objectives on fundamental values or worldviews, also
termed beliefs in the language of the Advocacy Coalition Framework (ACF) (Sabatier and
Jenkins-Smith, 1994). Underlying beliefs guide policy actors objectives, instrument prefer-
ences, and actions. With shared beliefs, actors tend to self-identify as cohesive clusters or
coalitions drawing a line between "us" and "them" (Bressers and O’Toole, 1998). Within co-
hesive coalitions of belief-similar actors, interactions are more likely to be consensual and
mutually reinforcing. Across coalitions, however, belief-dissimilar actors are likely to clash. In
fact, it is an inherent characteristic of political processes that actors with diverging beliefs clash
as they advocate their preferred policy during negotiations. Despite this common feature, po-
litical systems diverge with regard to participation mechamisms, i.e. the degree to which they
give access to a large diversity of actors (with diverging and potentially conflicting objectives)
or rather restrain access to belief-similar actors. Furthermore, political systems are distinct in
the degrees to which they provide for consensus-seeking mechanisms across belief-dissimilar
actors or groups of actors, or whether they lack institutionlized conflict-settlement.
8

Ideal-typical consensus democracies, according to (Lijphart, 1999), provide strong incen-
tives for compromise-seeking and negotiations across belief-dissimilarities. Where belief-
dissimilar actors seek compromise or consensus, interactions can be labeled as consensual.
Majoritarian democracies, by contrast, lack both formal and informal incentives for coopera-
tive and consensual styles of policy-making, and therefore belief dissimilarities hamper actors’
interactions in this type of macro-political system comparably more than in consensus democ-
racies.
There are (counter-intuitive) side effects of the structurally given consensus-seeking mecha-
nism in consensus democracies. By incentivizing belief-dissimilar actors to find compromises,
consensus democracies potentially give more room for conflicts. While consensus democra-
cies diffuse power among diverse, potentially belief-dissimilar actors (e.g. multi-party gov-
ernments), majoritarian democracies concentrate power. Clear majorities are more likely to
be composed of a group of belief-similar actors (e.g. one-party governments), which are less
prone to conflictual interactions. The argument here is not that consensus democracies are more
conflictual than their majoritarian counterparts, but their mechanisms to deal with fundamental
conflicts of belief-dissimilarities are distinct. Consensus democracies integrate a larger vari-
ety of actors from the political spectrum into decision-making and include conflict-settlement
mechanisms through consensus-seeking mechanisms. Majoritarian democracies, by contrast,
tend to exclude parts of the political spectrum to the advantage of one clear majority, thereby
preventing conflicts rather than settling them. If clear majorities fail to build, however, majori-
tarian democracies find themselves locked into particularly polarized conflicts that, addition-
ally, lack conflict-settlement mechanisms.
From these theoretical foundations, we deduce the following hypotheses on the quality of
network interactions:
Hypothesis 3 (Belief dissimilarities) In consensus democracies actors tend to interact across
belief-dissimilarities, while in majoritarian democracies belief-dissimilarities tend to hamper
interactions among policy actors.
9

Table 1: Typology of country-specific network structures after Adam and Kriesi (2007),Bressers and O’Toole (1998), and Fischer (2012)
Consensus democracies Majoritarian democraciesConsensual-federal
Consensual-unitary
Majoritarian-federal
Majoritarian-unitary
Distribution of power Fragmentation of power Concentration of powerType of interaction: interconnected-ness
Cooperative interactions(across coalitions)
Competitive interactions(across coalitions)
Type of interaction: belief cohesion Interactions across belief-dissimilarities
Few interactions acrossbelief-dissimilarities
In summary, we propose a two-dimensional typology of network structures in Table 1, in
which the distribution of power constitutes the first dimension and the types of interactions
(quantity and quality) represents the second dimension. Together these two dimensions distin-
guish network structures in consensus and majoritarian democracies.
Data and Methods
Case
We categorize the Swiss, German, French, and Dutch macro-political systems according to Li-
jphart (1999) typology in order to illustrate what types of network structures are to be expected
in these four cases. Section A in the Supplementary Information (SI) online contains additional
information on the political systems of the four countries. Germany or Switzerland are both
typical consensual-federal democracies, while France is a classic example of a majoritarian-
unitary system. The Netherlands is a hybrid system with its federal-unitary democracy. In ac-
cordance with their macro-political systems, network structures of Switzerland and Germany
are assumed to belong to the same neighborhood (Lubell et al., 2012). In these consensus
democracies, networks are presumed to display a fragmented power structure, cooperative in-
teraction patterns, and a low degree of conflict or belief dissimilarities. Due to their ’opposite’
type of democratic system, French network structures are expected to concentrate power in the
hands of a few actors, to display competitive interaction patterns, and a higher degree of con-
10

flict. The Dutch macro-political system is positioned between the two extremes of consensus
and majoritarian democracies, so its network structures can be expected hybrid as well. Table 2
provides a summary of the link between macro-political and network structures, following the
different typologies exposed in the previous section.
Table 2: Overview of expected network structures and interactions in the four cases.
Consensus democracies Majoritarian democraciesConsensual-federal Consensual-unitary Majoritarian-federal Majoritarian-unitary
Expected network structure Switzerland, Germany Netherlands — FranceInterconnectedness Cooperative interactions Competitive interactionsCohesion Consensual interactions Conflictive interactionsPower Power fragmentation Power concentration
Data
We contacted a total of 199 state and non-state actors in Switzerland, Germany, France, and
the Netherlands through a mixed-mode survey1 between 2011 and 2014. Network boundaries
were delimited based on the concept of policy domain by Laumann and Knoke (1987). We
selected all actors who were involved in formulating, advocating, and selecting policies on
emerging pollution issues in water protection, including governmental bodies, science, political
parties as well as water, environmental, and economic associations. Network members are all
actors involved in the following decision-making processes during the following timeframes:
the Swiss amendment of the Waters Protection Act and Ordinance between 2007 and 2013;
the German adoption of the Surface Water Ordinance between 2008 and 2011; the adoption
of the French Micropollutants Plan between 2009 and 2013; the Dutch policy-making process
on pharmaceutical micropollutants between 2001 and 2013. We surveyed actors if they a)
participated at least twice in the mentioned decision-making processes (decisional approach),
or b) hold formal regulatory competences in the field of emerging water pollutants (positional
approach), or c) were considered important by knowledgeable experts in the field (reputational
1From the 199 observations, a majority of actors (i.e., 158) were surveyed by paper-and-pencil mail ques-tionnaire (Metz, 2017). Following respondents’ preferences, 41 actors were surveyed through semi-structuredpersonal interviews by using the same questionnaire.
11

approach) (see Knoke, 1994; Laumann et al., 1989). Response rates range from 89.2% for
Switzerland, 68.4% for Germany, 45.5% for France, to 50.5% for the Netherlands (response
rates calculated after AAPOR 2011).
We surveyed each actors’ cooperative/competitive interaction patterns through their collab-
oration ties. Respondents received a complete list of country-specific actors and were asked
to check all those with whom their organization had closely collaborated during the decision-
making process on micropollutants in the respective timeframe. For each country we created a
n×n adjacency matrix (N) of cooperation ties with n actors (values 0 indicating no cooperation
ties and 1 indicating cooperation between two actors). Additionally, we surveyed actors’ con-
sensual/conflictive interaction patterns through their ally/opponents ties. Allies or opponents
correspond to actors with whom they agree or disagree on policy content.
Figure 1 depicts the four collaboration networks. The Swiss network NCH contains 47
unique nodes (i.e., actors) together with 253 directed edges (i.e., collaboration ties between
actors), resulting in a network density of almost 12% (253/(47 · 46)). The German decision-
making network NDE contains 29 actors and 121 edges (network density = 15%). The French
network NFR contains 18 actors and 96 edges (network density = 31%). And the Dutch
decision-making network NNL contains 16 actors and 108 edges (network density = 45%).
Statistical approach
Exponential random graph models. We examine structural differences in the four decision-
making networks using Exponential Random Graph Models (ERGMs). The inherent depen-
dencies among observations in network settings violate the core assumption of independence
in conventional regression models. The violence of the independence assumption may result in
biased estimates and optimistic p-values (Cranmer and Desmarais, 2011; Cranmer et al., 2017).
To overcome these difficulties, we use a statistical model that can handle and model dependen-
cies. ERGMs are developed to estimate effects of exogenous as well as endogenous covariates
on network formation (Frank and Strauss 1986; Wasserman and Pattison 1996; Robins et al.
12

●
●
●
●●
●
●
●
●
●
●
●
●
●
●
●
●
●
●
●
●
●
●
●
●●
●
●
●
●
●
●
●
●
●
●●
●
●
●
●
●
●
●
●
●
Switzerland
●
●
●
●
●
●
●●
●
●
●
●●
●
●
●
●
●
●
●
●
●
●
●
●
●
Germany
●
● ●
●
●
●
●
●
●
●
●
●
●
●●
●
●
●
France●
●
●
●
●
●
●
●
●
●
●
●
●●
●
Netherlands
●●
●●
●●
●national government
regional, local government
water association
environmental association
industrial, agricultural association
science
political party
Figure 1: Decision-making networks from Switzerland, Germany, France and the Netherlands.Nodes colored by actor types, and sized by indegree centraly. Isolate nodes were removed fromthe graphs but not from the analysis.
13

2007; Robins et al. 2007). The model can be expressed as the probability of observing the
given network N over all possible permutations N of the network:
P(N, θθθ) =exp{θθθThhh(N)}∑
N∗∈N exp{θθθThhh(N∗)}, (1)
where N is the observed network, θθθ represent the estimated parameters and hhh(N) is a vector
of statistics containing exogenous and endogenous covariates (Cranmer and Desmarais, 2011).
The ERGM can also be thought of as a logistic regression of tie formation, where the
probability of observing a specific tie between two actors i and j is dependent on the specified
changes in the hhh(N) statistics (Wasserman and Pattison, 1996; Desmarais and Cranmer, 2012).
P(Ni j = 1|N−i j, θθθ) = logit−1(θθθ · δδδ(i j)(N)
), (2)
where N−i j refers to the network excluding Ni j, logit−1 is the inverse logistic function and
δδδ(i j)(N) are the vector of change statistics for the vector of endogenous and exogenous covariate
statistics such that they measure the changes in the statistics as dyad {i,j} changes from zero to
one (Desmarais and Cranmer, 2012, 404-5).
To allow the incorporation of endogenous network statistics into the model, the estimation
of the ERGM is carried out with Markov Chain Monte Carlo Maximum Likelihood Estimation
(MCMC MLE) (Wasserman and Pattison, 1996; Cranmer and Desmarais, 2011). We use the
ergm package (Hunter et al., 2008) in the statnet suit of packages (Handcock et al., 2003)
for the statistical computing environment R (R Core Team, 2016) to estimate the ERGMs.
The inclusion of endogenous network statistics are bound to the assumption that all neces-
sary statistics are modeled to prevent omitted variable bias (Cranmer et al., 2017). To ensure
the sufficient inclusion of endogenous network statistics we perform goodness-of-fit tests for
each of the models using the btergm package (Leifeld et al., 2018).
Comparing results across networks. We run four separate ERGMs, one for each of the
decision-making networks, and compare the effects of our independent variables across the
14

models. To ensure comparability of the effects as well as their effect sizes, we use the micro-
level interpretation of ERGM models that conceptualize ERGMs as a logistic regression of tie
formation (Desmarais and Cranmer, 2012). We calculate predicted probabilities over all dyads
in the networks, using change statistics for all endogenous and exogenous variables and the
estimated coefficients from the ERGMs, as proposed by Faust and Skvoretz (2002).
Comparing structural properties across different networks is difficult, as the number of
nodes and the number of ties differ between each of the networks. The estimated coefficients
of the ERGMs allow for an interpretation of which structural patterns or data-generating pro-
cesses are discernible within one network. However, they do not allow for a direct comparison
of coefficient sizes across different networks. This is because the coefficients are reported as
log-odds and show relative risks, i.e., they can be interpreted as the risk of having a cooperative
tie between two actors compared to the risk of a non-cooperative tie. These risks are depen-
dent on network size and density. In order to compare the effects between different ERGMs,
predicted probabilities can be calculated for each dyad (i, j) in the network. These predicted
probabilities can be used at the dyad-level to examine the probability that node i has a tie to
node j conditional on the rest of the network (Faust and Skvoretz, 2002).
Pr({i, j} = 1|N−i j) =exp(θ̂edges + h(Ni j)h(Ni j)h(Ni j) · θ̂̂θ̂θ)
(1 + exp(θ̂edges + h(Ni j)h(Ni j)h(Ni j) · θ̂̂θ̂θ))(3)
First, the odds of a dyad between nodes i and j is calculated using the baseline probability
of a tie (captured in the edges-term) plus the change statistic for each independent and control
variable (here in the simplified notation h(Ni j)) times the estimated coefficient of said variable
(Faust and Skvoretz, 2002, 276-7). Then the odds are transformed into probabilities by dividing
them by one plus the odds. The change statistic represents the difference in the value of the
independent or control variable if the dyad (i, j) is toggled, i.e., if the dyad (i, j) is transformed
into a edge if it was previously a non-edge; or if the dyad (i, j) is transformed into a non-edge,
if it was previously an edge.
15

We use the btergm package (Leifeld et al., 2018) to calculate predicted probabilities that
allow comparisons of effects between ERGMs.
Operationalization of variables
We use a number of endogenous and exogenous variables to test our main hypotheses whilst
controlling for a number of possibly confounding effects.
Power concentration. Hypothesis 1 relates to power concentration and network centraliza-
tion. We examine to which extent the four networks show centralized or decentralized ten-
dencies by examining the indegree distribution of the network nodes. In centralized networks,
coordination is dominated by few central actors and power is inherently concentrated, resulting
in a distinct network structure of few high-indegree nodes and many low-indegree nodes. How-
ever, in networks where power is more broadly distributed and shared, there are fewer high-
indegree nodes and more nodes with similar numbers of incoming ties. We use a geometrically
weighted indegree distribution term, presented by Hunter (2007) to model power concentra-
tion. The term captures tendencies of popular nodes (i.e., nodes with high indegree centrality)
to disproportionally attract other nodes and become even more popular. More formally, the
term creates a count of nodes with indegrees ranging from its minimum to its maximum:
hgwindegree = eαn−1∑m=1
{1 − (1 − e−α)m}IDegm(N), (4)
where N refers to the Network, m are indegree specifications ranging from 1 to the maxi-
mum indegree (in a network with n nodes, max(IDeg) = n−1) and α is a decay parameter used
to scale down low indegree counts of high indegree nodes (Hunter, 2007, 221). The higher
the α-parameter, the more weight is given to changes to high-indegree nodes. To adequately
model high-indegree nodes, we set a high α-parameter of 1.4 and compare model fit (using
BIC scores) with other models with slightly higher or lower α-parameters. A negative coef-
ficient for the geometrically-weighted indegree distribution term indicates that the network is
more centralized due to its large variance in the indegree distribution among the nodes (Levy,
16

2016). The term can be interpreted as a popularity statistic that captures whether indegree is
distributed equally among the nodes or not. In networks, where the distribution is skewed,
some nodes have high indegrees, i.e., are popular nodes in the network.
We expect popularity—or network centralization—to play a role in all four decision-making
networks. However, we expect the effect to be stronger in both the French and the Dutch
decision-making network due to the nature of their unitary political system that favors central-
ization and gives a few actors the opportunity to hold strong positions to exercise power and
marginalize opponents.
To compare the effects of popularity on the probability of forming ties, we calculate pre-
dicted probabilities for a random selection of nodes and with specific indegree levels. We use
these predicted probabilities to assess the increase in the probability of forming a new tie, if the
node has a high or low indegree centrality (following the framework of interpreting ERGMs at
the dyad level, presented by Desmarais and Cranmer, 2012).
Network interconnectedness. To capture network interconnectedness (Hypothesis 2) we use
a variable on cooperation among actors of opposing coalitions. We also measure the overall
level of interconnectedness through triadic closure in the network.
The first variable is an edge covariate that measures whether actors reach out towards op-
ponents, i.e. actors with whom they have a conflictive relationship.
hedgeCovariate =∑
i, j
Ni jxi j, (5)
where N refers to the all edges in the focal network and x refers to the edge attribute pertain-
ing to nodes i and j. A positive coefficient indicates that actors have a tendency to collaborate
with other actors despite their opposition. We expect to find a positive relationship in consensus
democracies due to their inherent necessity to collaborate and overcome adversities and seek
compromises across coalitions.
We further test interconnectedness in the decision-making networks by including a triadic
closure effect that examines to what extent two nodes i and j become tied due to the number of
17
additional partners k they share. We use a geometrically weighted term, presented by Hunter
(2007, 224), to capture effects of triadic closure:
hgwesp = eαn−2∑k=1
{1 − (1 − e−α)k}EPk(N), (6)
where N represents the network and EP refers to the number of shared partners k that edges
i, j have in common. The counts of shared partners for all edges in the network are summed
up. The α-parameter is used to weight the counts, with a α-value near 0 giving more weight
to lower counts (i.e., number of edges with only one or two shared partners, for instance). We
chose an α-parameter of 0.25 as it produced the best fit for the four network models based on
the Bayesian Information Criterion (BIC). The effect yields a positive coefficient if nodes have
a tendency to close open triads and therefore form denser collaboration patterns. We expect to
find a positive effect of triadic closure in consensus democracies, because consensus democra-
cies foster close-knit collaboration patterns. We also expect a smaller or nonexistent effect of
triadic closure in majoritarian democracies, which institutionalize competitive relations.
Belief dissimilarities. For Hypothesis 3 we examine belief dissimilarities among collabora-
tion partners in all four networks. We operationalize belief dissimilarities using an absolute
difference effect for weighted policy beliefs.
We surveyed beliefs on environmental concern and risk averseness by asking respondents
to rate their level of agreement on a four-point Likert scale with five different statements. We
asked whether water protection measures should 1) address the sources of pollution, or 2) the
end-of-pipe; 3) follow the precautionary principle or 4) the risk-based principle; and 5) aim
at completely eliminating micropollutants in waters. We coded answers between 1 (strongly
disagree) and 4 (strongly agree) (see Section B in the SI online for additional information and
phrasing of the variables). The absolute differences effects was calculated by comparing the
differences in answers for each of the five questions k:
habsdi f f =
∑lk |x(k)i − x(k) j|
l, (7)
18

where k refers to the l belief questions and x(k) represents the value of question k for each
respondent i and j.
In the resulting dissimilarity matrices, higher values stand for actors’ belief dissimilarities.
Smaller values express belief cohesion and point to situations where pairs of nodes display
similar levels of environmental concern and risk averseness in the field of water protection.
A negative coefficient in the ERGM indicates that strong belief dissimilarities among two
nodes has a negative effect on their likelihood of forming a collaboration tie. In other words, the
smaller the differences in beliefs between two actors, the more likely are they to work together.
Based on insights from the multiple studies on advocacy coalitions and their applications in
various political systems, we expect to find a negative effect of belief dissimilarities on collab-
oration in all four networks (Henry et al., 2011; Ingold and Varone, 2012; Henry, 2011; Ingold,
2011; Weible and Sabatier, 2005). However, we expect the effect to be stronger in majoritarian
democracies, where cooperation and consensus-seeking among dissimilar actors is not instiu-
tionally encouraged as is the case for consensus democracies (Adam and Kriesi, 2007; Kriesi
et al., 2006; Lijphart, 1999).
Control variables. We control for a number of endogenous and exogenous variables. Apart
from the most basic control variable—the network density—we control for instrument prefer-
ence dissimilarity, reciprocity, popularity and activity effects of governmental actors, activity
effects of important actors (i.e., actors with high reputation power) and differences in reputa-
tion power between two nodes. Section C in the SI online holds additional details as well as
specifications of control variables.
Results
Table 3 reports the results of the four ERGMs on tie formation. Model 1 corresponds to the re-
sults of the Swiss case, Model 2 corresponds to the German case and Models 3 and 4 correspond
to the results of the French and Dutch decision-making networks, respectively. Coefficients are
19

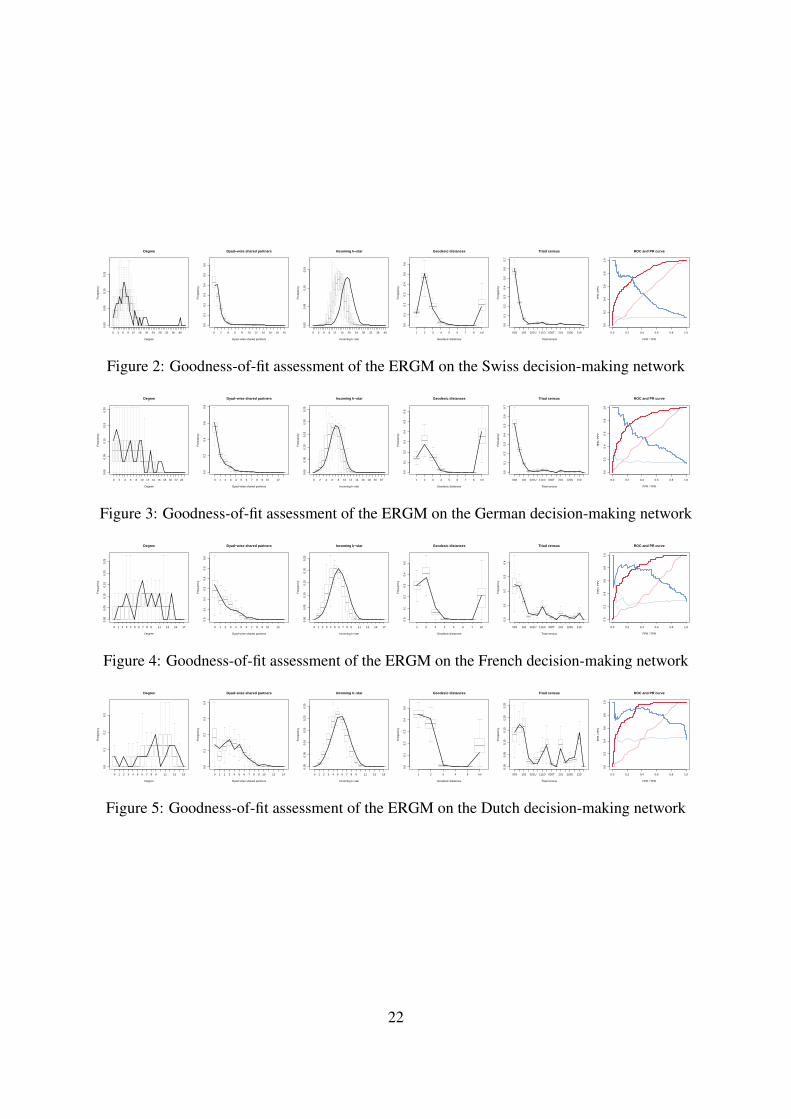
reported as log odds. Figures 2-5 show goodness-of-fit assessment of the models. We simu-
lated 500 networks using the estimated parameters and compared their network properties to the
original network (boxplots represent the values from simulated networks and black lines rep-
resent values from the original networks). We compare degree distributions, dyad-wise shared
partners, incoming k-stars, geodesic distance and triadic closure for the observed and simulated
networks. All networks show an acceptable fit with the small exception of incoming k-stars for
the Swiss network.2 We further check whether tie prediction in the simulated networks is ac-
curate using receiver-operating curves (see far right panels in Figures 2-5). All curves are well
above the curves including exogenous variables only, which indicates good fit and predictive
power and allows for a substantive interpretation of the coefficients of the models.
We test our first hypothesis on power-sharing by examining the degree of centralization of
the four decision-making networks. As expected, all networks exhibit negative and significant
popularity effects, demonstrating skewed indegree distributions. To examine the effect in more
detail, we calculate the (relative) probability of adding an additional tie for a randomly selected
node to a node with a specified indegree. Figure 6 shows the increase in the probability of a tie
when an additional incoming tie is added to a node. Both the Swiss and German networks show
slowly increasing probabilities, with an additional incoming tie increasing a node’s attractive-
ness by only a few percentage points. In the unitary French and Dutch systems, networks show
much steeper increases in popularity effects (as well as overall higher probabilities, controlled
for overall network density) that tailor off only after six existing incoming ties. Results indi-
cate higher levels of power concentration in the French and Dutch cases than in the Swiss and
German federal systems that prioritize power fragmentation.
In our second hypothesis, we assumed that actors in consensus democracies are more likely
to exhibit close-knit collaborative interaction patterns (across coalitions) than in majoritarian
democracies. The term for collaboration across coalitions is highly significant and positive in
the Swiss and German networks, non-significant in the French network and weakly significant
2Adjusting the indegree distribution decay parameter lead to degeneracy in the German, French and Dutchnetwork. We report an additional ERGM for the Swiss case controlling for incoming 2-stars in Section D in theSI Online. Results do not change by exchanging indegree distribution term with incoming 2-stars term. However,the fit improves.
20

Table 3: Results on network structure using exponential random graph models for each of thefour policy networks
CH DE FR NL
Hypotheses
H1: Popularity distribution (gwidegree) −1.11∗∗∗ −1.11∗ −2.34∗∗ −3.16∗∗∗
(0.34) (0.52) (0.71) (0.87)H2: Collaboration across coalitions 1.60∗∗∗ 1.62∗∗∗ 1.16 0.92∗
(0.33) (0.30) (0.60) (0.45)H2: Triadic closure (gwesp) 1.15∗∗∗ 1.11∗∗∗ 1.03∗ 1.81
(0.19) (0.27) (0.46) (1.03)H3: Belief dissimilarity −0.06 −0.63∗∗ −0.79∗ 0.17
(0.14) (0.24) (0.32) (0.23)Controls
Instrument preference dissimilarity −0.88∗∗∗ −0.46 −1.10∗ 0.12(0.19) (0.34) (0.43) (0.51)
Reciprocity 1.21∗∗∗ 1.25∗∗∗ 1.13∗∗ 1.51∗∗∗
(0.26) (0.35) (0.42) (0.44)Outdegree: Governmental actors −0.12 0.13 0.39 −0.60
(0.16) (0.28) (0.40) (0.37)Indegree: Governmental actors 0.08 0.32 0.62∗ 0.37
(0.13) (0.23) (0.28) (0.28)Outdegree: high reputation 0.01 0.05∗∗ 0.07∗ 0.34∗∗∗
(0.01) (0.02) (0.03) (0.07)Difference in reputation 0.03∗∗∗ −0.00 0.00 0.05
(0.01) (0.02) (0.03) (0.05)Edges −3.21∗∗∗ −2.80∗∗∗ −1.36 −6.20∗∗∗
(0.31) (0.53) (0.87) (1.58)
AIC 1149.83 497.73 300.86 243.98BIC 1212.30 549.42 341.82 282.27Log Likelihood −563.92 −237.86 −139.43 −110.99
∗∗∗ p < 0.001, ∗∗ p < 0.01, ∗ p < 0.05
21
0 3 6 9 12 16 20 24 28 32 36 40
0.00
0.05
0.10
0.15
Degree
Degree
Fre
quen
cy
0 2 4 6 8 10 12 14 16 18 20
0.0
0.1
0.2
0.3
0.4
0.5
0.6
Dyad−wise shared partners
Dyad−wise shared partners
Fre
quen
cy
0 3 6 9 12 16 20 24 28 32 36 40
0.00
0.05
0.10
0.15
Incoming k−star
Incoming k−star
Fre
quen
cy
1 2 3 4 5 6 7 8 Inf
0.0
0.1
0.2
0.3
0.4
0.5
0.6
Geodesic distances
Geodesic distances
Fre
quen
cy
003 102 021U 111D 030T 201 120U 210
0.0
0.1
0.2
0.3
0.4
0.5
0.6
0.7
Triad census
Triad census
Fre
quen
cy
ROC and PR curve
FPR / TPR
TP
R /
PP
V
0.0 0.2 0.4 0.6 0.8 1.0
0.0
0.2
0.4
0.6
0.8
1.0
Figure 2: Goodness-of-fit assessment of the ERGM on the Swiss decision-making network
0 2 4 6 8 10 12 14 16 18 20 22 24
0.00
0.05
0.10
0.15
0.20
Degree
Degree
Fre
quen
cy
0 1 2 3 4 5 6 7 8 9 10 12
0.0
0.2
0.4
0.6
0.8
Dyad−wise shared partners
Dyad−wise shared partners
Fre
quen
cy
0 2 4 6 8 10 12 14 16 18 20 22
0.00
0.05
0.10
0.15
0.20
0.25
Incoming k−star
Incoming k−star
Fre
quen
cy
1 2 3 4 5 6 7 8 Inf
0.0
0.1
0.2
0.3
0.4
0.5
0.6
Geodesic distances
Geodesic distances
Fre
quen
cy
003 102 021U 111D 030T 201 120U 210
0.0
0.1
0.2
0.3
0.4
0.5
0.6
0.7
Triad census
Triad census
Fre
quen
cy
ROC and PR curve
FPR / TPR
TP
R /
PP
V
0.0 0.2 0.4 0.6 0.8 1.0
0.0
0.2
0.4
0.6
0.8
1.0
Figure 3: Goodness-of-fit assessment of the ERGM on the German decision-making network
0 1 2 3 4 5 6 7 8 9 11 13 15 17
0.00
0.05
0.10
0.15
0.20
0.25
Degree
Degree
Fre
quen
cy
0 1 2 3 4 5 6 7 8 9 10 12
0.0
0.1
0.2
0.3
0.4
0.5
0.6
Dyad−wise shared partners
Dyad−wise shared partners
Fre
quen
cy
0 1 2 3 4 5 6 7 8 9 11 13 15 17
0.00
0.05
0.10
0.15
0.20
0.25
Incoming k−star
Incoming k−star
Fre
quen
cy
1 2 3 4 5 6 7 Inf
0.0
0.1
0.2
0.3
0.4
0.5
Geodesic distances
Geodesic distances
Fre
quen
cy
003 102 021U 111D 030T 201 120U 210
0.0
0.1
0.2
0.3
0.4
Triad census
Triad census
Fre
quen
cy
ROC and PR curve
FPR / TPR
TP
R /
PP
V
0.0 0.2 0.4 0.6 0.8 1.0
0.0
0.2
0.4
0.6
0.8
1.0
Figure 4: Goodness-of-fit assessment of the ERGM on the French decision-making network
0 1 2 3 4 5 6 7 8 9 11 13 15
0.0
0.1
0.2
0.3
Degree
Degree
Fre
quen
cy
0 1 2 3 4 5 6 7 8 9 10 12 14
0.0
0.1
0.2
0.3
0.4
Dyad−wise shared partners
Dyad−wise shared partners
Fre
quen
cy
0 1 2 3 4 5 6 7 8 9 11 13 15
0.00
0.05
0.10
0.15
0.20
0.25
Incoming k−star
Incoming k−star
Fre
quen
cy
1 2 3 4 5 Inf
0.0
0.1
0.2
0.3
0.4
0.5
Geodesic distances
Geodesic distances
Fre
quen
cy
003 102 021U 111D 030T 201 120U 210
0.00
0.05
0.10
0.15
0.20
0.25
Triad census
Triad census
Fre
quen
cy
ROC and PR curve
FPR / TPR
TP
R /
PP
V
0.0 0.2 0.4 0.6 0.8 1.0
0.0
0.2
0.4
0.6
0.8
1.0
Figure 5: Goodness-of-fit assessment of the ERGM on the Dutch decision-making network
22

Switzerland Germany France Netherlands
0 1 2 3 4 5 6 7 8 9 0 1 2 3 4 5 6 7 8 9 0 1 2 3 4 5 6 7 8 9 0 1 2 3 4 5 6 7 8 9
0.0%
2.5%
5.0%
7.5%
10.0%
12.5%
15.0%
17.5%
Number of existing ties
Rel
ativ
e pr
obab
ility
of a
tie
(bas
elin
e pr
obab
ility
of t
ie h
eld
at 0
%)
Figure 6: Popularity effect over the four different decision-making networks. x-axis representsthe number of edges to a target, y-axis represents the relative probability of forming an addi-tional tie (controlled for the baseline probability of forming a tie in each network). Error barsrepresent 95% confidence intervals.
23

and positive in the Dutch case. Decision-makers in Switzerland and Germany have a strong
tendency to collaborate with actors with whom they disagree. The term has to be interpreted as
a correlation between naming someone as a collaboration partner and naming someone as an
opponent.
Figure 7 shows edge probabilities for actors creating ties with opponents. In the German
(and to lesser extent in the Swiss) case, actors have a strong tendency to collaborate with actors
with whom they also disagree. The same is true for the Dutch case but not in the French case,
where the bootstrapped confidence intervals are too large to draw a meaningful conclusion. In-
terestingly, the probability of collaborating with an opponent is driven in the Swiss and German
case by collaborations with governmental actors. This is not true for the Dutch case. Section D
in the SI online shows the results of a detailed analysis on cooperating with governmental and
non-governmental opponents.
In summary, the results show that, for the consensus democracies of Switzerland and Ger-
many (and to a lesser degree the Netherlands) there is a high probability of establishing a tie
with opponents across coalitions. In other words, activities in political decision-making pro-
cesses are largely about finding common ground with opponents across coalitions.
Results for the French case seem atheoretical at first sight. At closer look, the network
contains few mentions of opponents (see Figure 1 in the SI online) resulting in large confi-
dence intervals for predicted probabilities. Results indicate that there are less opponents in the
French case. Rather than exhibiting several opposing coalitions, the French network structure
resembles one large majority coalition within which intensive collaboration takes place.
We further examine network interconnectedness by studying triadic closure. While the
Swiss and German networks exhibit a strong tendency toward triadic closure and, hence, close-
knit colllaboration patterns, the French and Dutch networks exhibit less or no tendencies to-
wards triadic closure respectively.
Considering results for both operationlizations of Hypothesis 2 together provides a more
detailed picture of actors’ interaction patterns across political systems. Our findings confirm
that interactions tend to be more cooperative in the consensual systems of Switzerland and Ger-
24

NL
FR
DE
CH
0% 10% 20% 30% 40% 50% 60%
Relative probability of a tie(baseline probability of tie held at 0%)
Figure 7: Median relative probability of establishing a tie with an opponent. Error bars refer tobootstrapped bias-corrected 95%-confidence intervals based on 10,000 draws.
many than in the French-style majoritarian democracies. At first sight, collaborative patterns
look not so different for the French network than for the Swiss and German ones. However, our
analysis showed that these results originate from different network structures. Reflecting the
more competitive nature of the French political system, its network exhibits only few mentions
of opponents. In the French majoritarian system opponents are more marginalized and less
integrated into the policy-making process than is the case for the Swiss and German networks.
Hence, dense collaborative patterns (triadic closure) take place among actors who generally
agree on policy content rather than as a result of consensus finding mechanism across coali-
tions of opposing actors. Our results show that there are less opponents in the French case and,
thus, point to a decision-making process that is less open for diverse types of interests.
Results for the Dutch case reflect the demand of its political system for compromise seek-
ing. The Dutch network shows strong tendencies (see Figure 7) to collaborate with named
opponents (i.e., or being on bad terms with collaboration partners). The data mirrors the fact
that the Dutch decision-making process lasted for more than 15 years. Despite this long pe-
riod of time, actors could not yet agree on a policy for the reduction of micropollutants in
water. One reason for the difficulties in reaching agreement was that the Dutch pharmaceutical
25

industry doubted the robustness of scientific results on micropollutants (i.e., those indicating
negative effects on the environment) and called for further research before adopting any policy
measures. To overcome these difficulties and reach agreement, a number of working groups
have been set up, which integrate diverse interests regarding the use and the protection of the
resource water, thereby providing multiple opportunities for exchange among opponents.
Our third hypothesis builds on Lijphart’s typology according to which majoritarian democ-
racies lack consensus-finding mechanisms. Belief-dissimilar actors are therefore less likely to
collaborate. Accordingly, we assumed a negative effect of belief dissimilarities on interactions
in the French-style majoritarian democracy. In the consensus oriented Swiss and German cases,
by contrast, we assumed belief dissimilarities to play out less importantly (Hypothesis 3).
Figure 8 (left panel) shows the dissimilarities regarding policy beliefs among two collabo-
rating actors. In fact, French members have a significantly lower mean compared to the other
three cases (Two-sample t-test, mean CH, DE and NL = .83, mean FR = .68, t = 3.06, p-value
= .003), indicating stronger belief similarities among collaboration partners in the French case
compared to Swiss, German or Dutch ones. This result also indicates that actors with diverg-
ing policy beliefs take part and collaborate in the Swiss, German, and Dutch policy-making
processes. In the French process, by contrast, actors with diverging policy beliefs have been
marginalized, which reduces the necessity to encounter opponents. In line with the comparably
higher belief similarities in the French case, are results in Table 3 reporting the coefficients of
the absolute difference effects as well as the marginal effects of belief differences on collabora-
tion.
Results in Table 3 show that only the German and French coefficients are significant and
negative for belief dissimilarities. As belief dissimilarities between pairs of actors increase,
their odds of forming a collaboration tie decrease when holding all other independent and con-
trol variables constant. In the Swiss and Dutch cases, by contrast, belief dissimilarities do not
impact collaboration patterns. Swiss and Dutch actors collaborate with belief-similar and dis-
similar others, which is in accordance with what we can expect from consensus democracies. In
line with theory is also the French case, where diverging beliefs hamper collaboration. In sum,
26

our results follow theoretical expectation in the Swiss, French, and Dutch cases, but are in-
congruent with theory in the German case. Belief dissimilarities seem to hamper collaboration
more than we would expect from the German consensual type of democracy.
To understand this result in the German case, we re-ran the models including a interaction
effect for the collaboration with oppenents variable and belief dissimilarities. The results are
reported and interpreted in detail in Section D in the SI online. Even though the interaction
effect does not show any significant results, its control reduces the belief dissimilarity term to a
non-significant parameter estimate (θ = −0.23, p-value = 0.786284), while increasing the size
of the collaboration across coalition parameter estimate (θ = 1.98, p-value = 0.622067). The
results for the other models do not change (see Table 4 in the SI online).
All in all, results follow theory for Swiss, German and Dutch consensus democracies where
belief dissimilarities have no significant effect on collaboration (see Table 3 as well as Table
4 in the SI online). Results also support our expectations for the French majoritarian democ-
racy where actors who display dissimilar beliefs are less likely to collaborate. A more fine-
grained analysis of interactions across belief dissimilarities shows that effects are more compli-
cated than expected. Even if consensus democracies provide for mechanisms of compromise-
seeking, they also allow more for the integration of heterogeneous actors which, in turn, creates
opportunities for belief dissimilarities and conflictive interactions.
Figure 8 on the right depicts a more fine-grained interpretation of the belief differences
and their correlation with cooperative ties. All four curves show large confidence intervals
that almost all spread across the zero-line (which reflects the baseline probability of a tie for
each network). In the case of the significant and negative effect for the French network, the
marginal effect shows a slightly curved relationship, where the probability of a tie decreases as
differences in policy beliefs increase and then trais off.
We controlled for a number of effects to ensure the models have a good fit and the inde-
pendent variables are not confounded. When it comes to instrument preference dissimilarity,
the Swiss and French case show negative effects, indicating that actors with the same instru-
ment preferences are more likely to work together. Unsurprisingly, reciprocity has a strong
27

●●● ●
●●
●
●
●
●
●
●●
●
●
●
●
●●
●●
●●
●
●
0
1
2
Switzer
land
Germ
any
Franc
e
Nethe
rland
sAve
rage
diff
eren
ces
in p
olic
y be
liefs
−20%
−10%
0%
10%
20%
30%
0 1 2
Average differences in policy beliefs
Rel
ativ
e pr
obab
ility
of a
tie
(bas
elin
e pr
obab
ility
of t
ie h
eld
at 0
%)
CH DE FR NL
Figure 8: Absolute differences in policy beliefs. Boxplot (left panel) reports absolute differ-ences in policy beliefs for each edge in the four collaboration networks. Red dot representmean policy belief differences. Marginal plot (right panel) of the effect of differences in policybeliefs on tie probability. Shaded area represent 95%-confidence intervals.
28

positive effect in all four networks. The positive effect indicates that reciprocity is stronger for
the observed networks than the random networks with all other variables held constant. Actors
who nominate other actors as collaboration partners are often named as partners themselves.
Governmental actors are slightly more popular in France reflecting French etatism, and actors
which are regarded as important by network members have higher outdegree centrality. Please
refer to Section D in the SI online for more detailed interpretation of control variables.
Conclusion
The paper assesses whether different types of democratic systems shape interactions between
actors participating in political decision-making processes as we would expect from institu-
tional theory. According to Lijpharts typology of democracies, one would expect a fragmen-
tation of power across diverse actors with cooperative, consensus-oriented interactions in con-
sensus democracies. Majoritarian democracies, by contrast, are said to concentrate power in
the hands of a few actors, lack consensus-building mechanisms, and are therefore character-
ized by competitive interactions where belief-dissimilar actors do not interact. In our analysis,
we tested these expectations against empirical observation of actors’ interaction patterns in
decision-making processes on water protection. We compared the consensual-federal democ-
racies of Switzerland and Germany, with the French majoritarian-unitary case; and the Dutch
hybrid system of consensual-unitary democracy. Our findings generally support theoretical
expectations and additionally provide a detailed picture of how macro-political systems shape
actors’ interaction patterns in policy-making processes.
Results that test our Hypothesis 1 show that power generally matters in political networks.
In a political context, it is not a surprising finding that actors tend to collaborate with others that
they consider powerful. Our data additionally indicates that the popularity effect is stronger in
the French and Dutch unitarian systems where higher levels of power concentration occur than
in the Swiss and German federal systems that diffuse power.
29

Additionally, our findings highlight that policy-making processes are all about finding com-
mon ground with opponents in consensus democracies. In line with Hypothesis 2, our results
show that there is a tendency to collaborate with opponents across coalitions in the Swiss,
German, and Dutch cases more so than in the French network. As expected for Swiss and
German consensus democracies (and to a lesser extent for the hybrid Dutch consensual-unitary
democracy), networks exhibit close-knit collaborative interaction patterns across coalitions.
Moreover, results indicate that governmental actors are driving consensus-seeking inter-
actions in Switzerland and Germany. We also find a higher tendency towards cooperative
interactions (assessed through triadic closure) in the Swiss and German consensus-oriented
democracies than in the French and Dutch cases.
Overall, results for the intensity of interactions follow the pattern of Lijpharts typology of
democracies according to which German and Swiss consensual-federal systems are diametri-
cally opposed to the French majoritarian-unity democracy, while the Dutch consensual-unitary
democracy represents a hybrid case in between.
Finally, our results allow us to better understand how political systems shape the quality
of actors’ interactions. In Hypothesis 3 we assumed interactions to be inhibited by belief-
dissimilarities in majoritarian-unitary systems more so than in consensual-federal ones. As
expected for the Swiss, German and Dutch consensus democracies, actors collaborate indepen-
dently of belief-dissimilarities, while belief dissimilarities hamper interactions in the French
majoritarian system. We also find that the relationship between beliefs and collaboration de-
pends on the openness (or closedness) of political processes to include heterogeneous actors
with diverse beliefs (or only homogeneous ones). Political processes that welcome heteroge-
nous actors are also more prone to conflictual interactions. We interpret our results according
to which French actors named less opponents and diverged less on policy beliefs as a con-
sequence of the majoritarian system, where opponents are marginalized. Instead of forming
opposing coalitions, our French case of a majoritarian system builds one dominant coalition
where actors tend to converge on policy beliefs. Such structures are designed to avoid conflict-
ual interactions instead of encouraging interactions among oppontents.
30

Another added value of our paper is that our models accurately capture the mechanisms
behind tie-creation despite the differences in network size and institutional structures. Thereby,
we are able to compare results across cases and better understand the ways in which formal
institutions frame actors’ interactions in decision-making processes.
One drawback of our study is that we possess of snapshot data only. Future research could
assess the linkages between political systems and network structures more thoroughly by us-
ing longitudinal data, which capture how decision-making processes evolve over time. Such
research would be valuable in order to understand the importance of consensus-building mech-
anisms in processes, that welcome diverse interests to partake, and therefore are more prone to
conflictive interactions than closed settings that marginalize opponents. Additionally, it would
be valuable to better understand which dimensions of belief cohesion improves over time where
consensus-building mechanisms are in place. The latter may not necessarily lead to a situation
where all actors agree on policy orientation and content; but to one where actors understand
each others positions and motivations better, trust each other, and therefore are more willing
to engage in compromise. Finally, longitudinal data would be necessary to capture whether
network structures change in policy-making processes between low, medium, and high levels
of interactions depending on the stage of the policy process. Different quantities and types of
actors may intervene and interact depending on whether the policy-process is, for example, in
the stage of agenda-setting or policy-formulation.
We have argued that analyzing interaction patterns within network structures contributes
to better understanding the social context within which policy content is agreed upon. To ulti-
mately better understand why certain political systems perform better in terms of producing pol-
icy outputs and policy change, future research is needed that links network structures to policy
outputs (as attempted in Metz 2017). Such a research agenda would have to consider the inter-
dependencies between political systems on the macro-level, decision-making networks on the
meso-level, and actors beliefs and preferences on the micro-level in order to understand these
variables’ impact on policy outputs. Beyond that, a complete model of policy outputs would
have to consider further contextual variables that impact why (or why not) policy outputs are
31

produced. Such a complete model would serve to estimate the explanatory value of the network
variable compared to other explanations for policy outputs, which is an insight lacking from the
literature so far. To date, it remains a challenge to include the network variable together with
other explanations in one coherent policy-making model: Network data is particularly resource
intensive to gather and its analysis demands specific, "relational" approaches. To circumvent
such challenges, macro-political structures may serve as a proxy capturing "neighborhoods of
network structures". Our paper indicates that stable institutional environment limit observable
network structures to neighborhoods of networks, but more empirical evidence is necessary to
identify the structures that can typically be found in such neighborhoods beyond power depen-
dencies and interaction patterns. For example, an important feature of decision-making pro-
cesses is the role of non-governmental actors, representing different societal interests, and the
degree to which democratic systems give or restrain access of interest group to policy-making
processes. Finally, not only macro-political systems, but also policy domains establish insti-
tutional structures (Hacker and Pierson, 2014; Fischer, 2015). Accordingly, neighborhoods of
networks may look different, for example, in environmental, economic, or social policy. While
we kept the policy domain constant in our study, future research is necessary that compares
network structures across domains.
Funding This work was supported by the Swiss National Science Foundation (105217_140395,149410).
Acknowledgements The authors would like to thank Philip Leifeld for helpful discussions oncomparing network model effects. We are grateful for insightful comments by Karin Ingold andRobert Keohane. Previous versions of this paper were presented at MPSA Annual Conference,April 6-9 2017, Chicago, USA, and at SPSA Annual Conference, February 5-6 2018, Geneva,Switzerland. Conference discussants and panel members gave insightful feedback that helpedimprove our paper.
32

ReferencesAAPOR (2011). Standard Definitions: Final Dispositions of Case Codes and Outcome Rates
for Surveys. The American Association for Public Opinion Research.
Adam, S. and H. Kriesi (2007). The network approach. In P. A. Sabatier (Ed.), Theories of thepolicy process, pp. 189–220. Cambridge MA: Westview Press.
Aoki, M. (2011). Institutions as cognitive media between strategic interactions and individualbeliefs. Journal of Economic Behavior & Organization 79(1), 20–34.
Börzel, T. A. (1998). Organizing babylon-on the different conceptions of policy networks.Public administration 76(2), 253–273.
Bressers, H. T. A. and L. J. O’Toole (1998). The selection of policy instruments: A network-based perspective. Journal of Public Policy 18(03), 213–239.
Cranmer, S. J. and B. A. Desmarais (2011). Inferential network analysis with exponentialrandom graph models. Political Analysis 19(1), 66–86.
Cranmer, S. J., P. Leifeld, S. D. McClurg, and M. Rolfe (2017). Navigating the range ofstatistical tools for inferential network analysis. American Journal of Political Science 61(1),237–251.
Desmarais, B. A. and S. J. Cranmer (2012). Micro-level interpretation of exponential randomgraph models with application to estuary networks. Policy Studies Journal 40(3), 402–434.
Dowding, K. (1995). Model or metaphor? a critical review of the policy network approach.Political Studies 43(1), 136–158.
Easton, D. (1965). A Framework for Political Analysis. Englewood Cliffs, NJ: Prentice-Hall.
Faust, K. and J. Skvoretz (2002). 8. comparing networks across space and time, size andspecies. Sociological methodology 32(1), 267–299.
Fischer, M. (2012). Entscheidungsstrukturen in der Schweizer Politik zu Beginn des 21.Jahrhunderts. Glarus: Ruegger.
Fischer, M. (2015). Institutions and coalitions in policy processes: a cross-sectoral comparison.Journal of Public Policy 35(2), 245–268.
Frank, O. and D. Strauss (1986). Markov graphs. Journal of the American Statistical Associa-tion 81(395), 832–42.
Friedkin, N. E. (1981). The development of structure in random networks: an analysis of theeffects of increasing network density on five measures of structure. Social Networks 3(1),41–52.
Hacker, J. S. and P. Pierson (2014). After the “master theory”: Downs, schattschneider, and therebirth of policy-focused analysis. Perspectives on Politics 12(3), 643–662.
33
Handcock, M. S., D. R. Hunter, C. T. Butts, S. M. Goodreau, and M. Morris (2003). stat-net: Software Tools for the Statistical Modeling of Network Data. Seattle, WA. http://statnetproject.org (last access: May 8, 2018).
Henry, A. D. (2011). Ideology, power, and the structure of policy networks. Policy StudiesJournal 39(3), 361–383.
Henry, A. D., M. Lubell, and M. McCoy (2011). Belief systems and social capital as driversof policy network structure: The case of california regional planning. Journal of PublicAdministration Research and Theory 21(3), 419–444.
Hunter, D. R. (2007). Curved exponential family models for social networks. Social net-works 29(2), 216–230.
Hunter, D. R., M. S. Handcock, C. T. Butts, S. M. Goodreau, and M. Morris (2008). ergm: Apackage to fit, simulate and diagnose exponential-family models for networks. Journal ofStatistical Software 24(3), nihpa54860.
Immergut, E. (1992). Health Politics: Interests and Institutions in Western Europe. Cambridge:Cambridge University Press.
Immergut, E. M. (1998). The theoretical core of the new institutionalism. Politics & Soci-ety 26(1), 5–34.
Ingold, K. (2011). Network structures within policy processes: Coalitions, power, and broker-age in swiss climate policy. Policy studies journal 39(3), 435–459.
Ingold, K. and P. Leifeld (2016). Structural and institutional determinants of influence reputa-tion: A comparison of collaborative and adversarial policy networks in decision making andimplementation. Journal of Public Administration Research and Theory 26(1), 1–18.
Ingold, K. and F. Varone (2012). Treating policy brokers seriously: Evidence from the climatepolicy. Journal of Public Administration Research and Theory 22(2), 319–46.
Knill, C. and J. Tosun (2012). Public policy: a new introduction. London: Palgrave Macmillan.
Knoke, D. (1994). Networks of elite structure and decision making. In W. Stanley andJ. Galaskiewicz (Eds.), Advances in social network analysis: Research in the social andbehavioral sciences, pp. 274–294. Thousand Oaks: Sage.
Kriesi, H., S. Adam, and M. Jochum (2006). Comparative analysis of policy networks inwestern europe. Journal of European public policy 13(3), 341–361.
Kriesi, H. and M. Jegen (2001). The swiss energy policy elite: The actor constellation of apolicy domain in transition. European Journal of Political Research 39(2), 251–287.
Laumann, E. O. and D. Knoke (1987). The organizational state: Social choice in nationalpolicy domains. Madison: Univ of Wisconsin Press.
Laumann, E. O., P. V. Marsden, and D. Prensky (1989). The boundary specification problemin network analysis. In L. C. Freeman, D. R. White, and A. K. Romney (Eds.), Researchmethods in social network analysis, pp. 61–88. New Jersey: Transaction Publishers, Rutgers.
34

Leifeld, P., S. J. Cranmer, and B. A. Desmarais (2018). Temporal exponential random graphmodels with btergm: Estimation and bootstrap confidence intervals. Journal of StatisticalSoftware 83(6), 1–36.
Levy, M. A. (2016). gwdegree: Improving interpretation of geometrically-weighted degreeestimates in exponential random graph models. The Journal of Open Source Software 1(3),36.
Lijphart, A. (1984). Democracies. Patterns of Majoritarian and Consensus Government inTwenty-One Countries. New Haven: Yale University Press.
Lijphart, A. (1999). Patterns of Democracy: Government Forms and Performance in Thirty-SixCountries. New Haven: Yale University Press.
Lijphart, A. (2008). Thinking About Democracy: Power Sharing and Majority Rule in Theoryand Practice. New York: Routledge.
Lijphart, A. (2012). Patterns of Democracy. Government Forms and Performance in Thirty-SixCountries. (2 ed.). New Haven: Yale University Press.
Lubell, M., J. Scholz, R. Berardo, and G. Robins (2012). Testing policy theory with statisticalmodels of networks. Policy Studies Journal 40(3), 351–374.
Mainwaring, S. (2001). Two models of democracy. Journal of Democracy 12(3), 170–175.
Metz, F. (2017). From Network Structure to Policy Design in Water Protection. A ComparativePerspective on Micropollutants in the Rhine River Riparian Countries. Cham: SpringerInternational Publishing.
North, D. C. (1990). Institutions, Institutional Change and Economic Performance. Cambridge,New York: Cambridge University Press.
R Core Team (2016). R: A Language and Environment for Statistical Computing. Vienna,Austria: R Foundation for Statistical Computing. https://www.R-project.org/ (lastaccess: May 8, 2018).
Robins, G., P. Pattison, Y. Kalish, and D. Lusher (2007). An introduction to exponential randomgraph (p*) models for social networks. Social Networks 29(2), 173–191.
Robins, G., T. A. Snijders, P. Wang, M. Handcock, and P. Pattison (2007). Recent developmentsin exponential random graph (p*) models for social networks. Social Networks 29(2), 192–215.
Sabatier, P. A. (1988). An advocacy coalition framework of policy change and the role ofpolicy-oriented learning therein. Policy sciences 21(2-3), 129–168.
Sabatier, P. A. and H. Jenkins-Smith (1994). Policy change and learning: An advocacy coalitionframework. Policy Studies Journal 22(1), 176.
Schmidt, M. (2010). Demokratietheorien: Eine Einführung (5 ed.). Wiesbaden: VS Verlag fürSozialwissenschaften.
35

Vatter, A. (2014). Das politische System der Schweiz. Baden-Baden: Nomos.
Vatter, A. and I. Stadelmann-Steffen (2013). Subnational patterns of democracy in austria,germany and switzerland. West European Politics 36(1), 71–96.
Wasserman, S. and P. Pattison (1996). Logit models and logistic regressions for social net-works: I. an introduction to markov graphs andp. Psychometrika 61(3), 401–425.
Weible, C. M. and P. A. Sabatier (2005). Comparing policy networks: Marine protected areasin california. Policy Studies Journal 33(2), 181–201.
36