decoupling provenance capture and analysis from execution
TRANSCRIPT

Decoupling Provenance Capture and Analysis from Execution
Manolis Stamatogiannakis (@mstamat)Paul Groth (@pgroth)
Herbert Bos

2
Stamatogiannakis, M., Groth, P., & Bos, H. (2014). Looking inside the black-box: Capturing data provenance using dynamic instrumentation. In Provenance and Annotation of Data and Processes (pp. 155-167). Springer International Publishing.
http://bit.ly/dtracker-demo

3
Capturing Provenance
Disclosed Provenance
+ Accuracy
+ High-level semantics
– Intrusive
– Manual Effort
Observed Provenance
– False positives
– Semantic Gap
+ Non-intrusive
+ Minimal manual effort
CPL (Macko ‘12)Trio (Widom ‘09)
PrIME (Miles ‘09)
Taverna (Oinn ‘06)
VisTrails (Fraire ‘06)
ES3 (Frew ‘08)
Trec (Vahdat ‘98)
PASSv2 (Holland ‘08)
DTrace Tool (Gessiou ‘12)

4
What to capture?
Miles, Simon, Groth, Paul, Munroe, Steve and Moreau, Luc (2011) PrIMe: a methodology for developing provenance-aware applications. ACM Transactions on Software Engineering and Methodology, 20, (3), 8:1-8:42.

5
Provenance is post hoc.
Aim: Eliminate the need for developers to know what provenance needs to be captured.

6
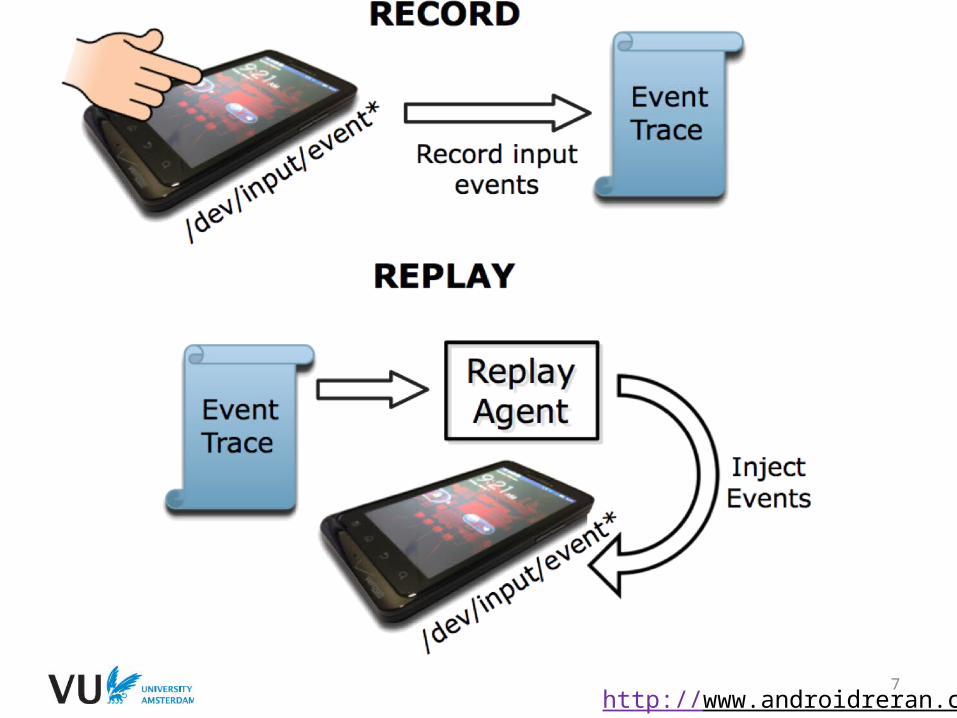
Re-execution
Common tactic in provenance:
• DB: Reenactment queries (Glavic ‘14)
• DistSys: Chimera (Foster ‘02), Hadoop (Logothetis
‘13), DistTape (Zhao ‘12)
• Workflows: Pegasus (Groth ‘09)
• PL: Slicing (Perera ‘12)
• OS: pTrace (Guo ‘11)
• Desktop: Excel (Asuncion ‘11)
8
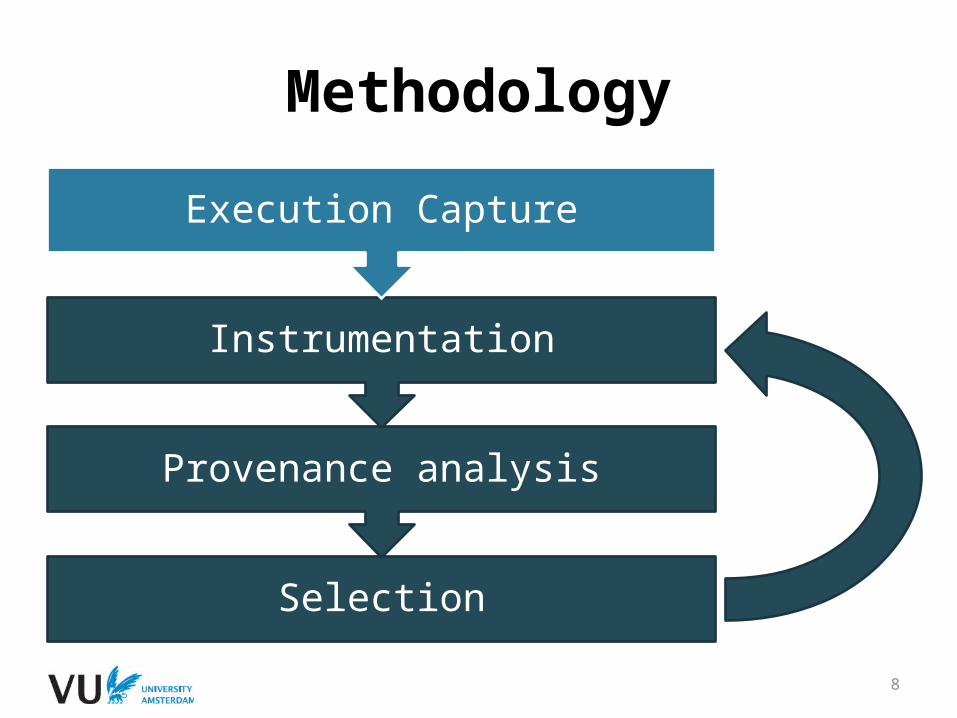
Methodology
Selection
Provenance analysis
Instrumentation
Execution Capture

9
• PANDA: an open-source Platform for Architecture-Neutral Dynamic Analysis. (Dolan-Gavitt et al. ‘14)
• Based on QEMU virtualization platform.• Logs self-contained execution traces.
– An initial RAM snapshot.– Non-deterministic inputs.
Prototype Implementation (1/2)
PANDA
CPU RAMInput
Interrupt
DM
AInitial RAM Snapshot
Non-determinism
log
RAM
PANDA Execution Trace

10
Prototype Implementation (2/2)
• Debian Linux guest.• Analysis plugins
– Read-only access to the VM state.– Invoked per instr., memory access, context switch, etc.– Can be combined to implement complex functionality.– OSI Linux, PROV-Tracer, ProcStrMatch.
• Provenance stored PROV/RDF triples, queried with SPARQL.
PANDA Execution Trace
PANDA
Triple Store
Plugin APlugin C
Plugin B
CPU
RAM

11
OS Introspection
• What processes are currently executing?
• Which libraries are used?• What files are used?
• Possible approaches:– Execute code inside the guest-OS.– Reproduce guest-OS semantics purely
from the hardware state (RAM/registers).

12
Introspecting Kernel Structures (1/2)
• Kernel structure members are known.
• Their offsets depend on compile-time configuration.
• Each linux vendor supplies a few different kernel configurations.
• Rule of thumb: same vendor/configuration/version combo same offsets.

13
Introspecting Kernel Structures (2/2)
• Offset profile created once for each kernel “family”.
• E.g. one profile for all Debian/amd64/3.2.* kernels.
• The profile is used by osi_linux module to extract process info from the execution trace.
Kernel offset profile
Live OS Probe Modul
e
Process Info
PANDA Replay
VM
osi_linux
PANDA Trace
Monitored OS
Pointer arithmetic:struct task_struct t;
int off = &(t.memb) – &t;
printk(“off: %d”, off);

14
The PROV-Tracer Plugin
• Registers for process creation/destruction events.
• Decodes executed system calls.• Keeps track of what files are used as
input/output by each process.• Emits provenance in an intermediate
format when a process terminates.

15
More Analysis Plugins
• ProcStrMatch plugin.– Which processes contained string S in
their memory?
• Other possible types of analysis:– Taint tracking– Dynamic slicing

16
Execution Overhead (1/2)
• QEMU incurs a 5x slowdown.• PANDA recording imposes an
additional 1.1x – 1.2x slowdown.
Virtualization is the dominant overhead factor.

17
Execution Overhead (2/2)• QEMU is a suboptimal virtualization
option.• ReVirt – User Mode Linux (Dunlap et al. ‘02)
– Slowdown: 1.08x rec. + 1.58x virt.
• ReTrace – VMWare (Xu et al. ‘07)
– Slowdown: 1.05x-2.6x rec. + ??? virt.
Virtualization slowdown is considered acceptable.
Recording overhead is fairly low.

18
Storage Requirements
• Storage requirements vary with the workload.
• For PANDA (Dolan-Gavitt et al. ’14):– 17-915 instructions per byte.
• In practice: O(10MB/min) uncompressed.• Different approaches to reduce/manage
storage requirements.– Compression, HD rotation, VM snapshots.
• 24/7 recording seems within limits of todays’ technology.

19
An Example (1)
<exe://pam-foreground-~3451> prov:endedAtTime 199090196 .<exe://getent~3451> a prov:Activity . <exe://getent~3451> rdf:type dt:getent .<exe://cut~3452> a prov:Activity . <exe://cut~3452> rdf:type dt:cut .<file:/etc/nsswitch.conf> a prov:Entity .<file:/etc/nsswitch.conf> rdfs:label "/etc/nsswitch.conf" .<file:/etc/nsswitch.conf> rdf:type dt:Unknown .<exe://getent~3451> prov:used <file:/etc/nsswitch.conf> .# unused file:3477815296:getent~3451:/etc/passwd:r0:w0:f524288<exe://getent~3451> prov:startedAtTime 199090196 .<exe://getent~3451> prov:endedAtTime 200392668 .<file:FD0_3452> a prov:Entity .<file:FD0_3452> rdfs:label "FD0_3452"

20
An Example (2

21
Example (3)

22
Example (4)

23
Conclusion
• Decouple capture/analysis from execution
• VMs provide a useful indirection mechanism
• Future: – More plugins– Real world analysis (rrshare.org)– Cloud analysis
• Are traces/immutable logs primitive?

24
Source & Text
• PROV-Tracer source:– https
://github.com/m000/panda/tree/prov_tracer/– Plugins under qemu/panda_plugins.
• Paper:– http://workshops.inf.ed.ac.uk/tapp2015/TAPP15
_I_3.pdf