deep diving into africa’s inter-country latencies
TRANSCRIPT
Deep Diving into Africa’s Inter-Country LatenciesAgustin Formoso∗, Josiah Chavula†, Amreesh Phokeer† ‡, Arjuna Sathiaseelan§, Gareth Tyson¶
∗LACNIC †AFRINIC ‡University of Cape Town§University of Cambridge ¶Queen Mary University of London
Emails: [email protected], [email protected], [email protected]@cl.cam.ac.uk, [email protected]
Abstract—The Internet in Africa is evolving rapidly,yet remains significantly behind other regions in termsof performance and ubiquity of access. This clearlyhas negative consequences for the residents of Africa,but also has implications for organisations designingfuture networked technologies that might see deploy-ment in the region. This paper presents a measurementcampaign methodology to explore the current stateof the African Internet. Using vantage points acrossthe continent, we perform the first large-scale mappingof inter-country delays in Africa. Our analysis revealsa number of clusters, where countries have built uplow delay interconnectivity, dispelling the myth thatintra-communications in Africa are universally poor.Unfortunately, this does not extend to the remainderof the continent, which typically suffers from exces-sively high delays, often exceeding 300ms. We findthat in many cases it is faster to reach European orNorth American networks that those in other regionsof Africa. By mapping the internetwork topology, weidentify a number of shortcomings in the infrastructure,most notably an excessive reliance on intercontinentaltransit providers.
I. Introduction
Africa currently has the lowest rate of Internet pene-tration in the world [1], with many unable to afford ac-cess [23]. This is set to change with Africa predicted to bea major driving force in expanding global uptake. Despitethis, recent studies have observed generally poor perfor-mance on the continent, e.g., slow page load times [11].Although the exact causality is yet to be seen, thereare a number of general trends that can be highlighted,including the use of high-delay access technologies andsuboptimal country-level topologies [10]. We argue thatunderstanding and quantifying these issues is critical fornot only their short-term amelioration, but also for in-forming future design and deployment strategies, e.g., forCDNs in the region. Importantly, the underdeveloped (butrapidly expanding) nature of Africa’s Internet ecosystemmeans that this must be done now.Although there have been a number of seminal stud-
ies that have explored global Internet performance andtopology [5], [9], [25], the diversity of networking infras-tructure across Africa makes them largely inapplicable. Ofparticular interest is the means by which the countries ofAfrica are interconnected; only by improving this can alocal Africa-wide Internet ecosystem flourish. For example,
the deployment of much-needed African data centres de-pends on underlying connectivity to make them availableto the wider region [16]. Thus, in this paper we ask asimple question: What is the inter-country delay in Africa,and how is this impacted by topology and interconnectionstrategies? Our long term goal is to exploit this new-found understanding for informing future protocol andapplication developments in the region.Answering the above question, however, requires van-
tage points across Africa — a challenge which has pre-vented many studies from focussing on Africa. Hence, weexploit a new platform, Speedchecker (a commercial mea-surement service), which has around 850 probes in Africa.This allows us to cover 322 networks and 52 countries(§III). Our measurements reveal a highly uneven delaydistribution, with some countries exhibiting European-likedelays (e.g., South Africa→ Botswana takes 25ms), whilstothers suffer from delays exceeding 300ms (going up to900ms). For context, typical latency in North Americais <45ms and <30ms for Europe [2]. This leads us toexplore patterns and cluster countries into groups of highconnectivity (§IV). This reveals distinct geographical pat-terns, as well as a number of corner cases, where moredistant countries actually have lower delay than nearercountries (§V). We find that some countries and regionshave built up relatively low delay infrastructure, althoughmany others have not. To explore this, we inspect thecontinent’s topology to identify key issues in the region(§VI). We find that the use of intercontinental transit(rather than local interdomain peering) plays a key role ininflating delays. This sees Africa→Africa packets leavingthe continent via international transit, simply to re-enteragain in a circuitous manner. This dramatically increasesnetwork operator costs, due to the high prices charged forinternational transit [7]. It also makes certain commoninfrastructure deployment practices unworkable, e.g., itmakes little sense to deploy content servers at regional ex-change points if networks do not peer there [11]. Whereaswe quantify the delay impact these decisions have, wealso observe cases in which using European or Americanupstream providers actually results in better performancethan using African upstream networks. Such observationsbest highlight the immediate challenges in the region, andhelp explain the difficulty in accessing and deploying ser-vices on a continent-wide basis (as exemplified by several
studies [17], [20]). Our findings offer insight into how theseproblems can be addressed (§VII).
II. Related Work
Recent studies have begun to recognise the traffic en-gineering problems in Africa’s Internet topology [6], [10],[13], [14]. Primarily, these studies have highlighted Inter-net performance issues that are attributed to a lack ofpeering amongst Africa’s ISPs. Due to this, models thataim to predict global latencies have consistently modelledAfrica as the slowest in the world [15]. Studies have alsolooked at inefficient DNS configurations, a lack of localcontent caching servers, as well as a lack of cross-bordercable systems [11], [16], [27].
Gilmore et al. [13] performed a logical mapping ofAfrica’s Internet topology, highlighting the router leveland Autonomous System (AS) level paths followed byintra-Africa traffic. Their analysis was based on traceroutedata obtained from measurements conducted from a singlevantage point in South Africa towards all AFRINIC allo-cated IP addresses. The key limitation of this work wasthat it only contained one-way paths from South Africa.
Gupta et al. [14] increased the number of vantage points,although they still launched probes from a small set ofcountries. Similarly, Chavula et al. [6] used five nodesfrom the CAIDA Archipelago platform to conduct logi-cal topology mapping for Africa’s national research andeducation networks. They found that over 75% of Africa’sinter-university traffic followed intercontinental routes. Al-though more extensive than [13], these restricted studiesonly provide insights into a small number of countries andnetworks. To the best of our knowledge, the first study totake a wide-area perspective was by Fanou et al. [10]. Thiswork launched traceroute measurements from 90 ASes.Their results too showed a lack of direct interconnectionamongst African ISPs.
Our research differs from these past works in threekey ways. First, our focus is not on enumerating tracer-oute paths leaving the continent. Instead, we strive tocharacterise the delay of the inter-country interactions.Our rationale is that the future success of local servicesdepends on low delay underlying connectivity within thewhole region (not leaving the region). Second, we do notsimply observe network performance — we explore thecausality behind high delays, and the implications of thetopology configurations observed. Further, we utilise thisdata to identify the key clusters of connectivity in theregion. Third, our study achieves the above goals on a scalenot seen before, covering 52 countries and 319 networksacross Africa.
III. Data Collection
A. Measurement platformDue to the deficit of research infrastructure in Africa,
there are only two feasible platforms for launching our
measurements: (i) RIPE Atlas,1 which is known for pro-viding a worldwide network of physical probes to theirmembers; and (ii) Speedchecker,2 a platform consisting ofsoftware agents installed on desktop clients. The Speed-checker platform offers Internet performance monitoringthrough ICMP ping, DNS and traceroute. Both platformshave probes deployed in Africa. At the moment of writing,RIPE Atlas had 229 active probes in Africa, covering 36African countries, whilst the Speedchecker platform hasnearly 850 installations covering 52 countries. Unfortu-nately, RIPE Atlas also has a strong bias towards univer-sity networks, as well as around half of all probes hostedin South Africa. In contrast, Speedchecker covers 91%of African countries and is not biased towards universitynetworks. Hence, for this study, we select Speedchecker.
B. Data collectionWe have used Speedchecker to collect two core datasets
based on latency and topology measurements. We chooseto focus on these low-level metrics as they can be usedto shed insight on how various applications might per-form, e.g., web, gaming. Latency data was collected bylaunching pings from all Africa-based Speedchecker probesto randomly selected Speedtest servers located in Africancountries. There are 213 Speedtest servers in Africa, cov-ering 42 countries (from 54). Note that this means wehave countries with sources (Speedchecker clients) but notdestinations (Speedtest servers). In these cases, we cannotcompute the intra-country delays, and therefore excludethem from later analysis. Speedtest servers are generallyhosted by ISPs and are therefore perfect end-points fornetwork to network latency profiling. Full details aboutthe service and its locations can be found online.3 Themeasurements were launched four times a day, at 00:00,06:00, 12:00, and 18:00 probe time.4 In each case, we ran-domly selected up to 20 probes from all countries in thattime zone. These probes were then instructed to launch10 consecutive pings (one second apart) to their randomlychosen Speedtest server. Following this, the SpeedcheckerAPI returns the minimum ping delay observed, giving usthe “best” observed delay at that time period.By repeating this each day for 3 months, we garnered
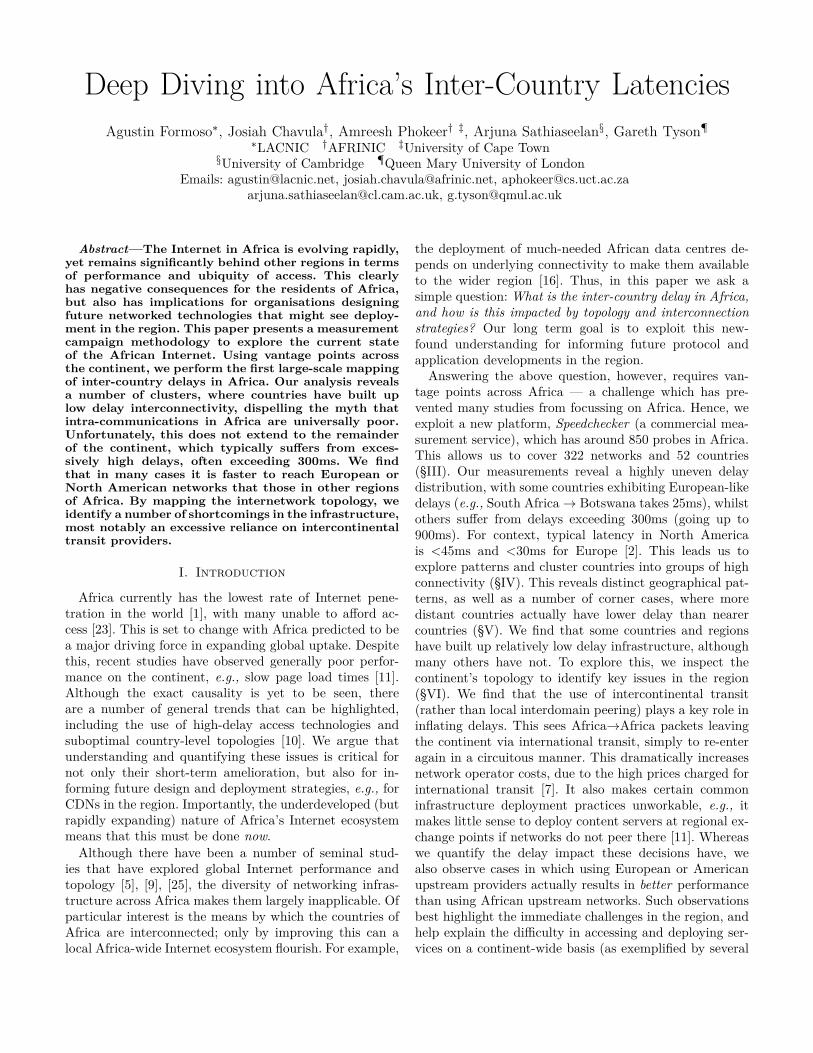
delay measurements across the continent, consisting of42.2k ping samples. To quantify the coverage, Figure 1presents the percentage of networks that the Speedcheckerprobes covered across each country (we take the overallcount from the AFRINIC allocation files). In total, ourdata covers 319 networks across 52 African countries. Asshown in Figure 1 (top CDF), 50% of the countries hadat least 20% of their networks probed.To complement the raw delay measurements, we also
launched a parallel traceroute campaign using the same
1http://www.atlas.ripe.net/2http://www.speedchecker.xyz/3http://www.speedtest.net/4Note that the times were based on the local time zone
0 20 40 60 80 100Percentage of networks covered
EritreaGuinea-Bissau
Cape VerdeMauritania
RwandaSierra Leone
TanzaniaGuinea
LesothoNigeriaLiberia
The GambiaKenya
South AfricaMauritius
MozambiqueMalawi
SwazilandGhana
Burkina FasoSeychelles
AngolaBotswana
NamibiaBurundi
Ivory CoastZambiaSenegal
Republic of the CongoGabon
ZimbabweMadagascar
Democratic Republic of the CongoEgyptNigerLibya
UgandaTunisiaDjibouti
Central African RepublicMorocco
ChadSomalia
CameroonEquatorial Guinea
MaliBenin
AlgeriaTogo
EthiopiaComoros
SudanMayotteRéunion
São Tomé and Príncipe0.000.250.500.75
CDF
(nor
med
)
Network coverage by country
Fig. 1: Percentage of Autonomous Systems covered percountry by our measurements.
setup. At 00:00, 06:00, 12:00, and 18:00 local time, welaunched traceroutes from up to 20 random probes inthat timezone, targeting random Speedtest servers acrossAfrica. This campaign covered 49 countries, and consistedof 31.5k traceroute measurements from 207 distinct net-works. For each router hop within the traceroute data, weattached the Autonomous System (AS) using the RIPERouting Information Service.5 We also attach the locationof each router using MaxMind GeoLite2-City. We restrictourselves to country-level analysis, as this has been foundto have relatively high accuracy [24].
C. LimitationsIt is important to highlight the limitations of our data.
First, we have limited insight into the devices launchingthe measurements, e.g., their network access technology.This means we cannot provide causal insight into theperformance of individual measurement samples. Thatsaid, we have gained a sufficiently large number of samplesfrom each country to allow us to extract regional trends.Second, all measurements are launched against Speedtest
5http://ris.ripe.net/
servers. Although they have a wide geographical distri-bution, they are not necessarily representative of futureserver deployments. Hence, future services may observedifferent performances based on how and where theydeploy their servers. Third, due to the nature of the Speed-checker service, it was not possible to launch all pings andtraceroutes in parallel from the same locations. Hence, wehave sampled different locations across the period of ourcampaign. Due to this, we later perform data aggregationto underpin our clustering and analysis. Although notideal, this allows more tractable exploration and shedsinsight for “typical” users. Finally, we also highlight knownlimitations with geolocation databases — it is likely thatdiscrepancies within MaxMind introduce noise to the data.However, as stated above, we limit ourselves to country-level analysis [24] (to minimise impact), and note that thislimitation is applicable to any study reliant on geolocation.
IV. Clustering Communities of ConnectivityOne of our goals is to detect the strengths and weak-
nesses of the connectivity in the African Internet. As aprecursor to this, we analyse the relationships betweencountries by clustering them based on their latencies.
A. Clustering methodologyWe convert the latency measurements into a graph
structure (G) that represents connectivity between coun-tries. Each node in the graph is a country, whilst a linkrepresents a set of latency measurements between twocountries. The links are weighted by the median latencyobserved. We select median as it provides insight intothe “typical” delay seen between two countries, althoughclearly this removes a portion of data — particularlyoutlier networks within a country. Our future work willinvolve inspecting the full breadth of delays seen, andclustering on a per-network basis..Once the weighted undirected graph G is computed, we
cluster countries based on their latency-defined distanceusing the Louvain algorithm [3]. The Louvain communitydetection algorithm is based on the modularity function,which performs clustering based on the measure of parti-tion between communities found in a network. Let G =(V, E) be the graph of vertices V representing countriesand E, a set of undirected edges representing latencies.Suppose u, v ∈ V , e(u, v) ∈ E has a weight wu, v, whichis the median latencies from u → v and v → u. Thecommunity detection algorithm partitions the graph intocommunities, C, as expressed by Equations (1) and (2).
∪ci = V,∀ci ∈ C (1)
ci ∩ cj = ∅,∀ci, cj ∈ C (2)
The quality of the partitioning is measured using modu-larity Q [19], where −1 < Q < 1. We define modularityas the difference between the number of intra-cluster
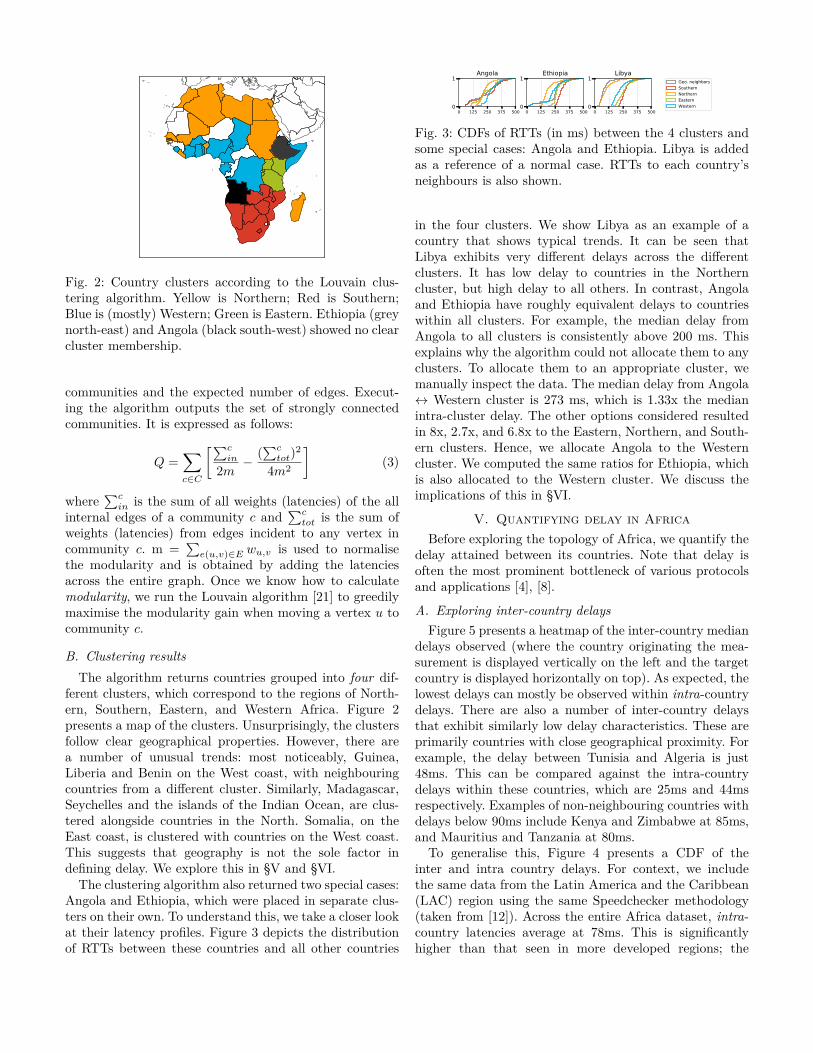
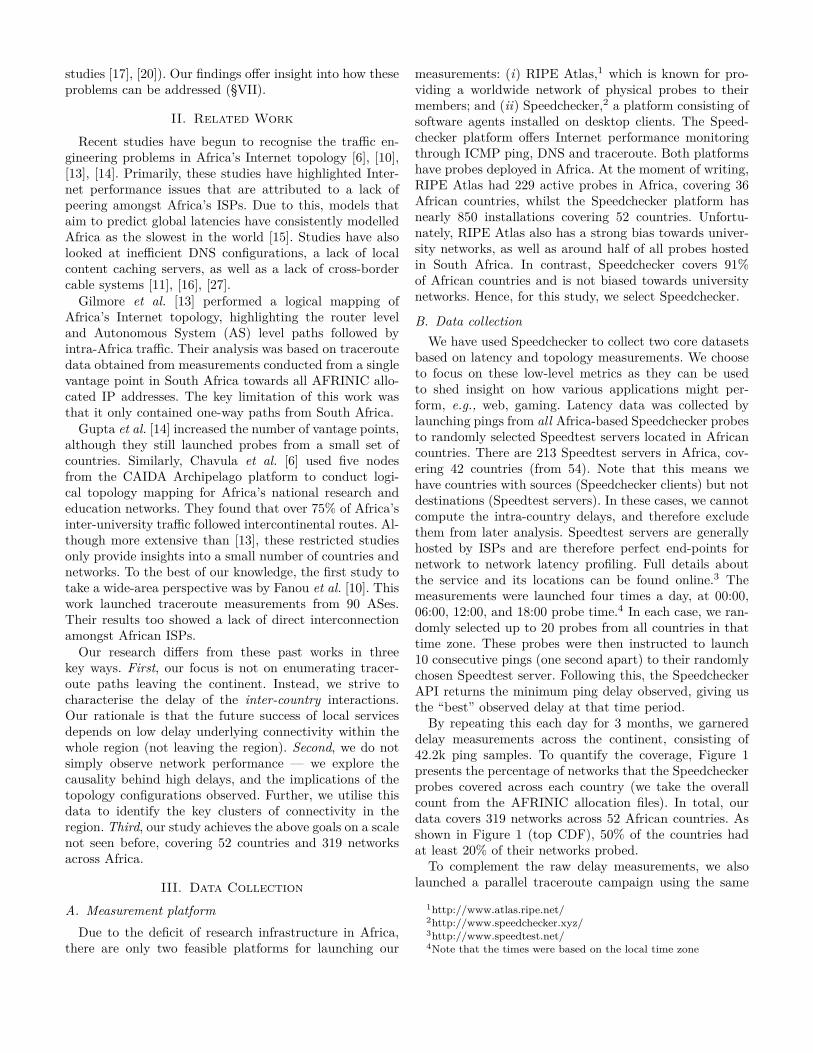
Fig. 2: Country clusters according to the Louvain clus-tering algorithm. Yellow is Northern; Red is Southern;Blue is (mostly) Western; Green is Eastern. Ethiopia (greynorth-east) and Angola (black south-west) showed no clearcluster membership.
communities and the expected number of edges. Execut-ing the algorithm outputs the set of strongly connectedcommunities. It is expressed as follows:
Q =∑c∈C
[∑cin
2m−
(∑c
tot)2
4m2
](3)
where∑c
in is the sum of all weights (latencies) of the allinternal edges of a community c and
∑ctot is the sum of
weights (latencies) from edges incident to any vertex incommunity c. m =
∑e(u,v)∈E wu,v is used to normalise
the modularity and is obtained by adding the latenciesacross the entire graph. Once we know how to calculatemodularity, we run the Louvain algorithm [21] to greedilymaximise the modularity gain when moving a vertex u tocommunity c.
B. Clustering resultsThe algorithm returns countries grouped into four dif-
ferent clusters, which correspond to the regions of North-ern, Southern, Eastern, and Western Africa. Figure 2presents a map of the clusters. Unsurprisingly, the clustersfollow clear geographical properties. However, there area number of unusual trends: most noticeably, Guinea,Liberia and Benin on the West coast, with neighbouringcountries from a different cluster. Similarly, Madagascar,Seychelles and the islands of the Indian Ocean, are clus-tered alongside countries in the North. Somalia, on theEast coast, is clustered with countries on the West coast.This suggests that geography is not the sole factor indefining delay. We explore this in §V and §VI.
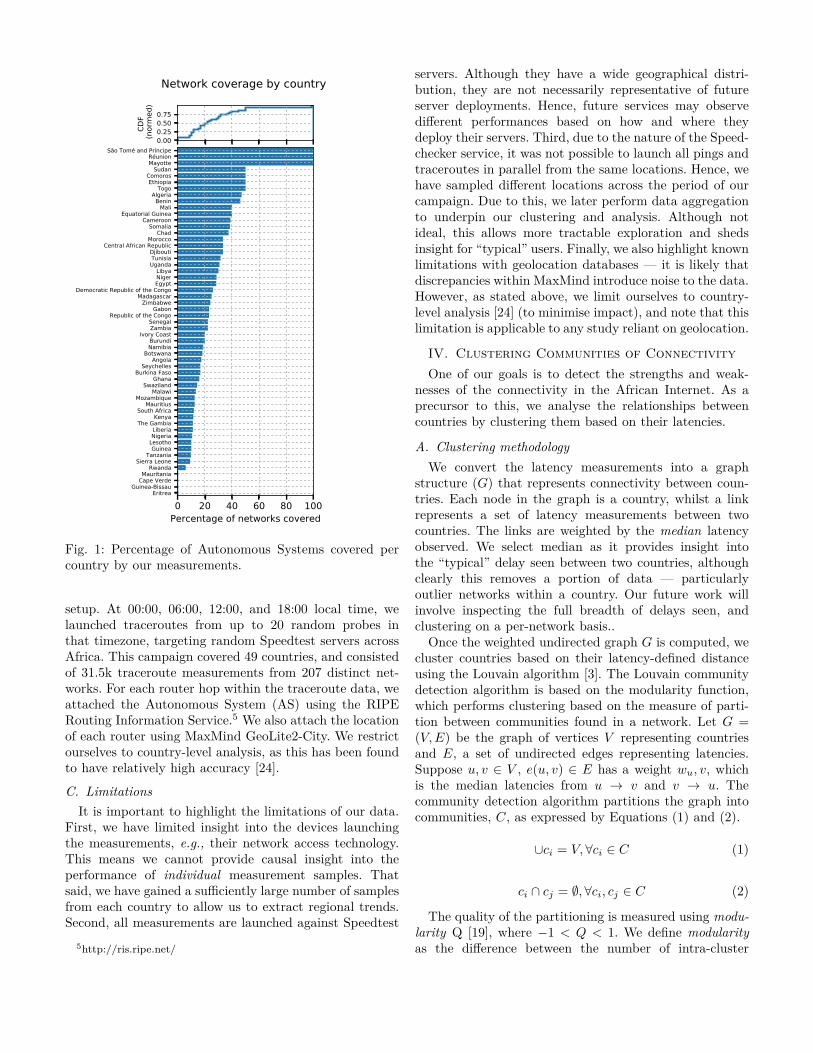
The clustering algorithm also returned two special cases:Angola and Ethiopia, which were placed in separate clus-ters on their own. To understand this, we take a closer lookat their latency profiles. Figure 3 depicts the distributionof RTTs between these countries and all other countries
0 125 250 375 5000
1Angola
0 125 250 375 5000
1Ethiopia
0 125 250 375 5000
1Libya
Geo. neighborsSouthernNorthernEasternWestern
Fig. 3: CDFs of RTTs (in ms) between the 4 clusters andsome special cases: Angola and Ethiopia. Libya is addedas a reference of a normal case. RTTs to each country’sneighbours is also shown.
in the four clusters. We show Libya as an example of acountry that shows typical trends. It can be seen thatLibya exhibits very different delays across the differentclusters. It has low delay to countries in the Northerncluster, but high delay to all others. In contrast, Angolaand Ethiopia have roughly equivalent delays to countrieswithin all clusters. For example, the median delay fromAngola to all clusters is consistently above 200 ms. Thisexplains why the algorithm could not allocate them to anyclusters. To allocate them to an appropriate cluster, wemanually inspect the data. The median delay from Angola↔ Western cluster is 273 ms, which is 1.33x the medianintra-cluster delay. The other options considered resultedin 8x, 2.7x, and 6.8x to the Eastern, Northern, and South-ern clusters. Hence, we allocate Angola to the Westerncluster. We computed the same ratios for Ethiopia, whichis also allocated to the Western cluster. We discuss theimplications of this in §VI.
V. Quantifying delay in AfricaBefore exploring the topology of Africa, we quantify the
delay attained between its countries. Note that delay isoften the most prominent bottleneck of various protocolsand applications [4], [8].
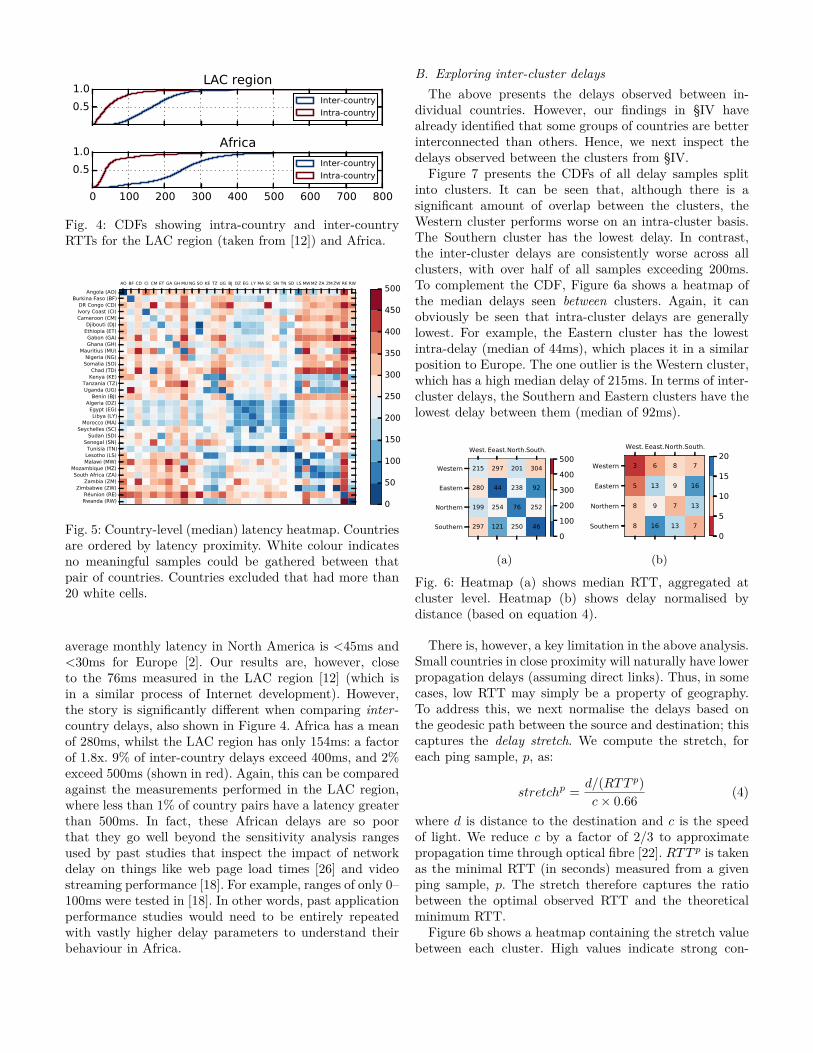
A. Exploring inter-country delaysFigure 5 presents a heatmap of the inter-country median
delays observed (where the country originating the mea-surement is displayed vertically on the left and the targetcountry is displayed horizontally on top). As expected, thelowest delays can mostly be observed within intra-countrydelays. There are also a number of inter-country delaysthat exhibit similarly low delay characteristics. These areprimarily countries with close geographical proximity. Forexample, the delay between Tunisia and Algeria is just48ms. This can be compared against the intra-countrydelays within these countries, which are 25ms and 44msrespectively. Examples of non-neighbouring countries withdelays below 90ms include Kenya and Zimbabwe at 85ms,and Mauritius and Tanzania at 80ms.To generalise this, Figure 4 presents a CDF of the
inter and intra country delays. For context, we includethe same data from the Latin America and the Caribbean(LAC) region using the same Speedchecker methodology(taken from [12]). Across the entire Africa dataset, intra-country latencies average at 78ms. This is significantlyhigher than that seen in more developed regions; the
0.5
1.0LAC region
Inter-country
Intra-country
0 100 200 300 400 500 600 700 800
0.5
1.0Africa
Inter-country
Intra-country
Fig. 4: CDFs showing intra-country and inter-countryRTTs for the LAC region (taken from [12]) and Africa.
AO BF CD CI CM ET GA GH MU NG SO KE TZ UG BJ DZ EG LY MA SC SN TN SD LS MWMZ ZA ZM ZW RE RW
Angola (AO)Burkina Faso (BF)
DR Congo (CD)Ivory Coast (CI)Cameroon (CM)
Djibouti (DJ)Ethiopia (ET)Gabon (GA)Ghana (GH)
Mauritius (MU)Nigeria (NG)
Somalia (SO)Chad (TD)
Kenya (KE)Tanzania (TZ)Uganda (UG)
Benin (BJ)Algeria (DZ)
Egypt (EG)Libya (LY)
Morocco (MA)Seychelles (SC)
Sudan (SD)Senegal (SN)Tunisia (TN)
Lesotho (LS)Malawi (MW)
Mozambique (MZ)South Africa (ZA)
Zambia (ZM)Zimbabwe (ZW)
Réunion (RE)Rwanda (RW) 0
50
100
150
200
250
300
350
400
450
500
Fig. 5: Country-level (median) latency heatmap. Countriesare ordered by latency proximity. White colour indicatesno meaningful samples could be gathered between thatpair of countries. Countries excluded that had more than20 white cells.
average monthly latency in North America is <45ms and<30ms for Europe [2]. Our results are, however, closeto the 76ms measured in the LAC region [12] (which isin a similar process of Internet development). However,the story is significantly different when comparing inter-country delays, also shown in Figure 4. Africa has a meanof 280ms, whilst the LAC region has only 154ms: a factorof 1.8x. 9% of inter-country delays exceed 400ms, and 2%exceed 500ms (shown in red). Again, this can be comparedagainst the measurements performed in the LAC region,where less than 1% of country pairs have a latency greaterthan 500ms. In fact, these African delays are so poorthat they go well beyond the sensitivity analysis rangesused by past studies that inspect the impact of networkdelay on things like web page load times [26] and videostreaming performance [18]. For example, ranges of only 0–100ms were tested in [18]. In other words, past applicationperformance studies would need to be entirely repeatedwith vastly higher delay parameters to understand theirbehaviour in Africa.
B. Exploring inter-cluster delaysThe above presents the delays observed between in-
dividual countries. However, our findings in §IV havealready identified that some groups of countries are betterinterconnected than others. Hence, we next inspect thedelays observed between the clusters from §IV.Figure 7 presents the CDFs of all delay samples split
into clusters. It can be seen that, although there is asignificant amount of overlap between the clusters, theWestern cluster performs worse on an intra-cluster basis.The Southern cluster has the lowest delay. In contrast,the inter-cluster delays are consistently worse across allclusters, with over half of all samples exceeding 200ms.To complement the CDF, Figure 6a shows a heatmap ofthe median delays seen between clusters. Again, it canobviously be seen that intra-cluster delays are generallylowest. For example, the Eastern cluster has the lowestintra-delay (median of 44ms), which places it in a similarposition to Europe. The one outlier is the Western cluster,which has a high median delay of 215ms. In terms of inter-cluster delays, the Southern and Eastern clusters have thelowest delay between them (median of 92ms).
West. Eeast.North.South.
Western
Eastern
Northern
Southern
215 297 201 304
280 44 238 92
199 254 76 252
297 121 250 460100200300400500
(a)
West. Eeast.North.South.
Western
Eastern
Northern
Southern
3 6 8 7
5 13 9 16
8 9 7 13
8 16 13 70
5
10
15
20
(b)
Fig. 6: Heatmap (a) shows median RTT, aggregated atcluster level. Heatmap (b) shows delay normalised bydistance (based on equation 4).
There is, however, a key limitation in the above analysis.Small countries in close proximity will naturally have lowerpropagation delays (assuming direct links). Thus, in somecases, low RTT may simply be a property of geography.To address this, we next normalise the delays based onthe geodesic path between the source and destination; thiscaptures the delay stretch. We compute the stretch, foreach ping sample, p, as:
stretchp = d/(RTT p)c× 0.66 (4)
where d is distance to the destination and c is the speedof light. We reduce c by a factor of 2/3 to approximatepropagation time through optical fibre [22]. RTT p is takenas the minimal RTT (in seconds) measured from a givenping sample, p. The stretch therefore captures the ratiobetween the optimal observed RTT and the theoreticalminimum RTT.Figure 6b shows a heatmap containing the stretch value
between each cluster. High values indicate strong con-
0 100 200 300 400 5000.0
0.5
1.0
WENS
0 100 200 300 400 5000.0
0.5
1.0
WENS
Fig. 7: CDFs showing intra-cluster RTTs (left) and inter-cluster RTTs (right).
2 4 6Interdomain hop count
for intra-cluster measurements (ASes)
0.0
0.5
1.0
5 10 15Traceroute hop count
for intra-cluster measurements (routers)
0.0
0.5
1.0
Fig. 8: Number of AS and router-level hops traversed bythe traceroute.
nectivity; for example, a value of 20 indicates that thespeed of the packet is 20% of the maximum theoreticalspeed. By comparing figures 6a and 6b we immediatelyidentify differences. In figure 6b, some inter-cluster delaysare actually lower than intra-cluster delays when measuredusing this normalised metric. In other words, some lowobserved RTTs are a property of geography — the clus-ters are still highly suboptimal. A good example is theSouthern ↔ Eastern cluster, which has a high mediandelay of 92ms, yet performs far better when normalisedby distance. Whereas Southern ↔ Southern only attains7% of the optimal speed (46ms), Southern ↔ Easterngains 16%. That said, there are some results that areconsistent between the two heatmaps, namely the poorperformance of the Western cluster. To explore why thismight be, we initially checked Somalia, as it is actuallygeographically located on the Eastern coast (cf. Figure 2).However, curiously, Somalia actually has the fastest intra-cluster ping measurements in the Western cluster: locatedat around 20% of 0.66c. The ping speeds in the remainingcountries, instead, attained around just 5% of 0.66c.
VI. Dissecting Paths Across AfricaThe previous section has highlighted the high network
delays suffered when traversing countries in Africa. Nextwe inspect the reasons behind this using the topology mapsobtained via our traceroute campaign.
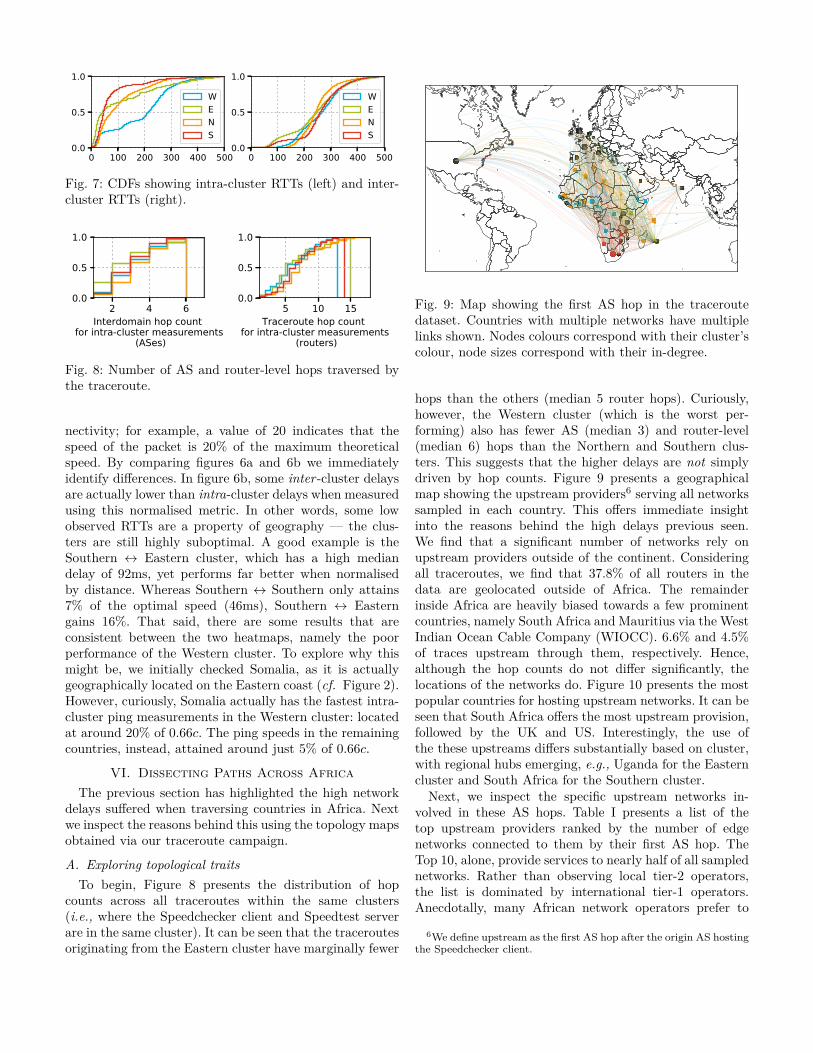
A. Exploring topological traitsTo begin, Figure 8 presents the distribution of hop
counts across all traceroutes within the same clusters(i.e., where the Speedchecker client and Speedtest serverare in the same cluster). It can be seen that the traceroutesoriginating from the Eastern cluster have marginally fewer
Fig. 9: Map showing the first AS hop in the traceroutedataset. Countries with multiple networks have multiplelinks shown. Nodes colours correspond with their cluster’scolour, node sizes correspond with their in-degree.
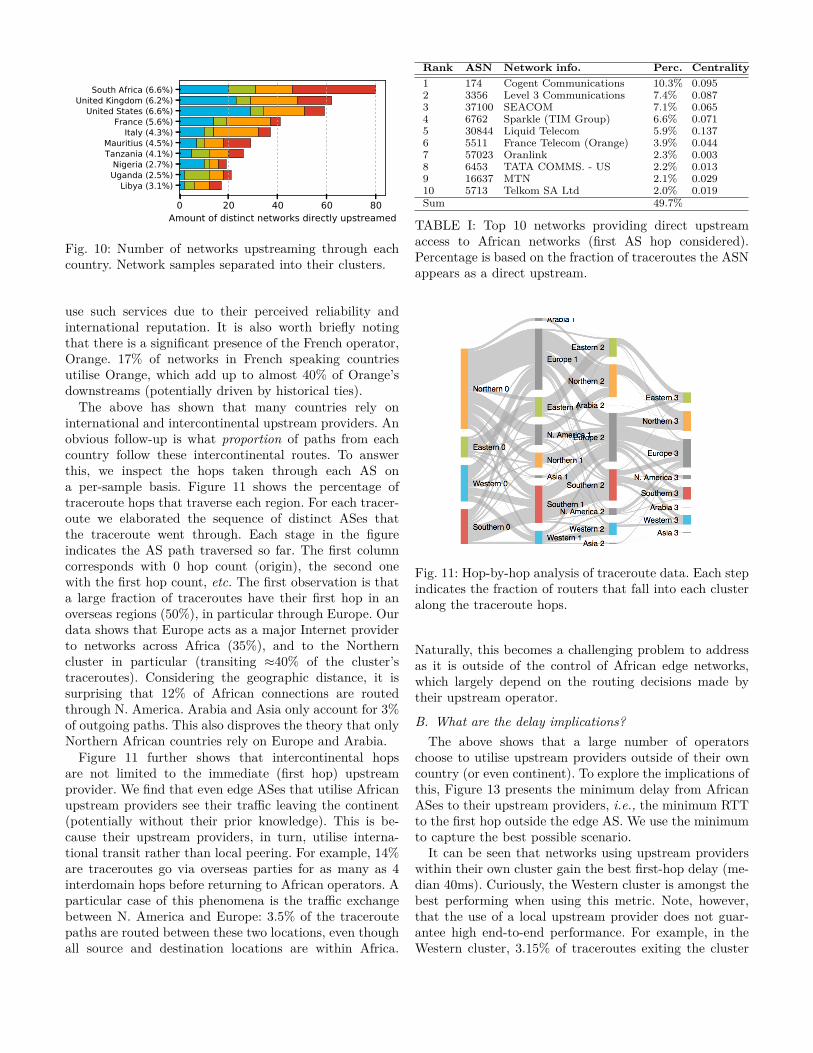
hops than the others (median 5 router hops). Curiously,however, the Western cluster (which is the worst per-forming) also has fewer AS (median 3) and router-level(median 6) hops than the Northern and Southern clus-ters. This suggests that the higher delays are not simplydriven by hop counts. Figure 9 presents a geographicalmap showing the upstream providers6 serving all networkssampled in each country. This offers immediate insightinto the reasons behind the high delays previous seen.We find that a significant number of networks rely onupstream providers outside of the continent. Consideringall traceroutes, we find that 37.8% of all routers in thedata are geolocated outside of Africa. The remainderinside Africa are heavily biased towards a few prominentcountries, namely South Africa and Mauritius via the WestIndian Ocean Cable Company (WIOCC). 6.6% and 4.5%of traces upstream through them, respectively. Hence,although the hop counts do not differ significantly, thelocations of the networks do. Figure 10 presents the mostpopular countries for hosting upstream networks. It can beseen that South Africa offers the most upstream provision,followed by the UK and US. Interestingly, the use ofthe these upstreams differs substantially based on cluster,with regional hubs emerging, e.g., Uganda for the Easterncluster and South Africa for the Southern cluster.Next, we inspect the specific upstream networks in-
volved in these AS hops. Table I presents a list of thetop upstream providers ranked by the number of edgenetworks connected to them by their first AS hop. TheTop 10, alone, provide services to nearly half of all samplednetworks. Rather than observing local tier-2 operators,the list is dominated by international tier-1 operators.Anecdotally, many African network operators prefer to
6We define upstream as the first AS hop after the origin AS hostingthe Speedchecker client.
0 20 40 60 80Amount of distinct networks directly upstreamed
Libya (3.1%)Uganda (2.5%)Nigeria (2.7%)
Tanzania (4.1%)Mauritius (4.5%)
Italy (4.3%)France (5.6%)
United States (6.6%)United Kingdom (6.2%)
South Africa (6.6%)
Fig. 10: Number of networks upstreaming through eachcountry. Network samples separated into their clusters.
use such services due to their perceived reliability andinternational reputation. It is also worth briefly notingthat there is a significant presence of the French operator,Orange. 17% of networks in French speaking countriesutilise Orange, which add up to almost 40% of Orange’sdownstreams (potentially driven by historical ties).
The above has shown that many countries rely oninternational and intercontinental upstream providers. Anobvious follow-up is what proportion of paths from eachcountry follow these intercontinental routes. To answerthis, we inspect the hops taken through each AS ona per-sample basis. Figure 11 shows the percentage oftraceroute hops that traverse each region. For each tracer-oute we elaborated the sequence of distinct ASes thatthe traceroute went through. Each stage in the figureindicates the AS path traversed so far. The first columncorresponds with 0 hop count (origin), the second onewith the first hop count, etc. The first observation is thata large fraction of traceroutes have their first hop in anoverseas regions (50%), in particular through Europe. Ourdata shows that Europe acts as a major Internet providerto networks across Africa (35%), and to the Northerncluster in particular (transiting ≈40% of the cluster’straceroutes). Considering the geographic distance, it issurprising that 12% of African connections are routedthrough N. America. Arabia and Asia only account for 3%of outgoing paths. This also disproves the theory that onlyNorthern African countries rely on Europe and Arabia.
Figure 11 further shows that intercontinental hopsare not limited to the immediate (first hop) upstreamprovider. We find that even edge ASes that utilise Africanupstream providers see their traffic leaving the continent(potentially without their prior knowledge). This is be-cause their upstream providers, in turn, utilise interna-tional transit rather than local peering. For example, 14%are traceroutes go via overseas parties for as many as 4interdomain hops before returning to African operators. Aparticular case of this phenomena is the traffic exchangebetween N. America and Europe: 3.5% of the traceroutepaths are routed between these two locations, even thoughall source and destination locations are within Africa.
Rank ASN Network info. Perc. Centrality1 174 Cogent Communications 10.3% 0.0952 3356 Level 3 Communications 7.4% 0.0873 37100 SEACOM 7.1% 0.0654 6762 Sparkle (TIM Group) 6.6% 0.0715 30844 Liquid Telecom 5.9% 0.1376 5511 France Telecom (Orange) 3.9% 0.0447 57023 Oranlink 2.3% 0.0038 6453 TATA COMMS. - US 2.2% 0.0139 16637 MTN 2.1% 0.02910 5713 Telkom SA Ltd 2.0% 0.019Sum 49.7%
TABLE I: Top 10 networks providing direct upstreamaccess to African networks (first AS hop considered).Percentage is based on the fraction of traceroutes the ASNappears as a direct upstream.
Fig. 11: Hop-by-hop analysis of traceroute data. Each stepindicates the fraction of routers that fall into each clusteralong the traceroute hops.
Naturally, this becomes a challenging problem to addressas it is outside of the control of African edge networks,which largely depend on the routing decisions made bytheir upstream operator.
B. What are the delay implications?The above shows that a large number of operators
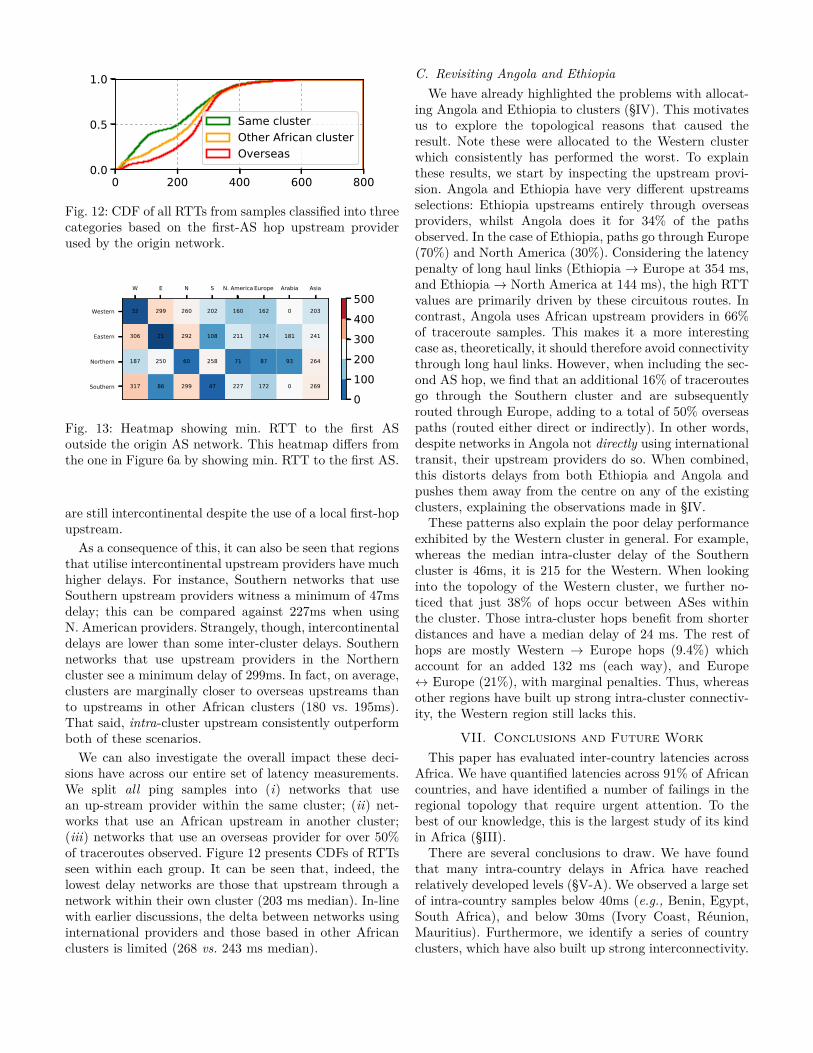
choose to utilise upstream providers outside of their owncountry (or even continent). To explore the implications ofthis, Figure 13 presents the minimum delay from AfricanASes to their upstream providers, i.e., the minimum RTTto the first hop outside the edge AS. We use the minimumto capture the best possible scenario.It can be seen that networks using upstream providers
within their own cluster gain the best first-hop delay (me-dian 40ms). Curiously, the Western cluster is amongst thebest performing when using this metric. Note, however,that the use of a local upstream provider does not guar-antee high end-to-end performance. For example, in theWestern cluster, 3.15% of traceroutes exiting the cluster
0 200 400 600 8000.0
0.5
1.0
Same clusterOther African clusterOverseas
Fig. 12: CDF of all RTTs from samples classified into threecategories based on the first-AS hop upstream providerused by the origin network.
W E N S N. America Europe Arabia Asia
Western
Eastern
Northern
Southern
32 299 260 202 160 162 0 203
306 21 292 108 211 174 181 241
187 250 60 258 71 87 93 264
317 86 299 47 227 172 0 269
0100200300400500
Fig. 13: Heatmap showing min. RTT to the first ASoutside the origin AS network. This heatmap differs fromthe one in Figure 6a by showing min. RTT to the first AS.
are still intercontinental despite the use of a local first-hopupstream.
As a consequence of this, it can also be seen that regionsthat utilise intercontinental upstream providers have muchhigher delays. For instance, Southern networks that useSouthern upstream providers witness a minimum of 47msdelay; this can be compared against 227ms when usingN. American providers. Strangely, though, intercontinentaldelays are lower than some inter-cluster delays. Southernnetworks that use upstream providers in the Northerncluster see a minimum delay of 299ms. In fact, on average,clusters are marginally closer to overseas upstreams thanto upstreams in other African clusters (180 vs. 195ms).That said, intra-cluster upstream consistently outperformboth of these scenarios.
We can also investigate the overall impact these deci-sions have across our entire set of latency measurements.We split all ping samples into (i) networks that usean up-stream provider within the same cluster; (ii) net-works that use an African upstream in another cluster;(iii) networks that use an overseas provider for over 50%of traceroutes observed. Figure 12 presents CDFs of RTTsseen within each group. It can be seen that, indeed, thelowest delay networks are those that upstream through anetwork within their own cluster (203 ms median). In-linewith earlier discussions, the delta between networks usinginternational providers and those based in other Africanclusters is limited (268 vs. 243 ms median).
C. Revisiting Angola and EthiopiaWe have already highlighted the problems with allocat-
ing Angola and Ethiopia to clusters (§IV). This motivatesus to explore the topological reasons that caused theresult. Note these were allocated to the Western clusterwhich consistently has performed the worst. To explainthese results, we start by inspecting the upstream provi-sion. Angola and Ethiopia have very different upstreamsselections: Ethiopia upstreams entirely through overseasproviders, whilst Angola does it for 34% of the pathsobserved. In the case of Ethiopia, paths go through Europe(70%) and North America (30%). Considering the latencypenalty of long haul links (Ethiopia → Europe at 354 ms,and Ethiopia→ North America at 144 ms), the high RTTvalues are primarily driven by these circuitous routes. Incontrast, Angola uses African upstream providers in 66%of traceroute samples. This makes it a more interestingcase as, theoretically, it should therefore avoid connectivitythrough long haul links. However, when including the sec-ond AS hop, we find that an additional 16% of traceroutesgo through the Southern cluster and are subsequentlyrouted through Europe, adding to a total of 50% overseaspaths (routed either direct or indirectly). In other words,despite networks in Angola not directly using internationaltransit, their upstream providers do so. When combined,this distorts delays from both Ethiopia and Angola andpushes them away from the centre on any of the existingclusters, explaining the observations made in §IV.These patterns also explain the poor delay performance
exhibited by the Western cluster in general. For example,whereas the median intra-cluster delay of the Southerncluster is 46ms, it is 215 for the Western. When lookinginto the topology of the Western cluster, we further no-ticed that just 38% of hops occur between ASes withinthe cluster. Those intra-cluster hops benefit from shorterdistances and have a median delay of 24 ms. The rest ofhops are mostly Western → Europe hops (9.4%) whichaccount for an added 132 ms (each way), and Europe↔ Europe (21%), with marginal penalties. Thus, whereasother regions have built up strong intra-cluster connectiv-ity, the Western region still lacks this.
VII. Conclusions and Future WorkThis paper has evaluated inter-country latencies across
Africa. We have quantified latencies across 91% of Africancountries, and have identified a number of failings in theregional topology that require urgent attention. To thebest of our knowledge, this is the largest study of its kindin Africa (§III).There are several conclusions to draw. We have found
that many intra-country delays in Africa have reachedrelatively developed levels (§V-A). We observed a large setof intra-country samples below 40ms (e.g., Benin, Egypt,South Africa), and below 30ms (Ivory Coast, Réunion,Mauritius). Furthermore, we identify a series of countryclusters, which have also built up strong interconnectivity.
Universally characterising the African Internet as pooris therefore misplaced. However, by corollary, this meansthat inter-cluster delays are significantly worse (§IV).Our clustering has shown that performance varies heavilybased on region: Whereas some clusters have relatively lowlevels of delay (e.g., the median intra-cluster delay in theSouth is just 46ms), other areas have consistently highdelay (§V-B). For example, the Western cluster suffersfrom intra-cluster delays that are similar to its inter-clusterdelays. Our analysis confirms that this is largely drivenby the use of transit providers that route traffic throughEurope and N. America (§VI). Our work therefore offersan effective means for automatically extracting regions andnetworks that critically require more local peering andinterconnection. Only by addressing these issues will itbecome possible for high performance service hosting andinteraction across the entire African continent.
There are many remaining topics to explore, such asthe relationship between physical infrastructure and delay.For those countries with a direct physical connection, itwould be expected that RTT would be lower. In orderto find a relationship between infrastructure and RTT,there is need for further analysis of the submarine orterrestrial cables and in some cases satellite links. It is alsoworth noting that inter-country delays are only one partof the problem, and it is necessary to investigate delaysbetween countries and popular web/content infrastructure(which the Speedtest servers may not be representativeof). It is also important to expand our analysis to gobeyond inspection of aggregated data and, instead, inspectthe variance seen within networks, countries and clusters.Indeed, this work only presents one side of a latency storyby aggregating the data at country level. Future workshould include a more granular analysis e.g., from a cityto city or AS to AS perspective. Further, we believe thatlinking the findings to regional strategies (e.g., deploymentof IXPs) would reveal a more complex evolving picture.Finally, we wish to revisit a number of other studies(e.g., web performance evaluations) to understand howthey perform with more realistic African-level delays.
AcknowledgementsWe thank the EPSRC for supporting this work via
the African Internet Measurement Observatory (AIMO)project.
References[1] Internet Penetration in Africa, 31 March 2017 internet world
stats, 2017. http://www.internetworldstats.com/stats1.htm.Accessed: 26-Jul-2017.
[2] IP latency statistics. http://www.verizonenterprise.com/about/network/latency/, 2017.
[3] Blondel, V. D., Guillaume, J.-L., Lambiotte, R., andLefebvre, E. Fast unfolding of communities in large networks.Journal of Statistical Mechanics: Theory and Experiment, 10(2008).
[4] Briscoe, B., Brunstrom, A., Ros, D., Hayes, D., Petlund,A., Tsang, I., Gjessing, S., and Fairhurst, G. A surveyof latency reducing techniques and their merits. In ISOCWorkshop on Reducing Internet Latency, Sep (2013).
[5] Broido, A., et al. Internet topology: Connectivity of IPgraphs. In ITCom 2001: International Symposium on theConvergence of IT and Communications (2001), pp. 172–187.
[6] Chavula, J., Feamster, N., Bagula, A., and Suleman, H.Quantifying the Effects of Circuitous Routes on the Latency ofIntra-Africa Internet Traffic: A Study of Research and Educa-tion Networks. 2015, pp. 64–73.
[7] Christian, P. International bandwidth trends in africa. InAfrican Peering Forum (AfPIF) (2015).
[8] Elkhatib, Y., Tyson, G., and Welzl, M. Can spdy reallymake the web faster? In IFIP Networking Conference (2014).
[9] Faloutsos, M., Faloutsos, P., and Faloutsos, C. On power-law relationships of the internet topology. In ACM SIGCOMMCCR (1999), vol. 29, pp. 251–262.
[10] Fanou, R., Francois, P., and Aben, E. On the Diversity ofInterdomain Routing in Africa. 2015, pp. 41–54.
[11] Fanou, R., Tyson, G., Francois, P., and Sathiaseelan, A.Pushing the frontier: Exploring the african web ecosystem. InWorld Wide Web Conference (WWW) (2016).
[12] Formoso, A., and Casas, P. Looking for network latencyclusters in the lac region. In Workshop on Fostering Latin-American Research in Data Communication Networks (2016).
[13] Gilmore, J., Huysamen, N., and Krzesinski, A. Mappingthe african internet. In Proceedings Southern African Telecom-munication Networks and Applications Conference (SATNAC),Mauritius (2007).
[14] Gupta, A., Calder, M., Feamster, N., Chetty, M., Ca-landro, E., and Katz-Bassett, E. Peering at the internet’sfrontier: A first look at isp interconnectivity in Africa. PassiveActive Measurement Conference (PAM) (2014), 204–213.
[15] Kaune, S., Pussep, K., Leng, C., Kovacevic, A., Tyson, G.,and Steinmetz, R. Modelling the internet delay space basedon geographical locations. In 17th International Conference onParallel, Distributed and Network-based Processing (2009).
[16] Kende, M., and Quast, B. Promoting content in africa. ISOCReport (2016).
[17] Mathur, A., Schlotfeldt, B., and Chetty, M. A mixed-methods study of mobile users’ data usage practices in southafrica. In Proceedings of the 2015 ACM International JointConference on Pervasive and Ubiquitous Computing (2015),ACM, pp. 1209–1220.
[18] Mok, R. K., Chan, E. W., and Chang, R. K. Measuring thequality of experience of HTTP video streaming. In IntegratedNetwork Management (IM), 2011 IFIP/IEEE InternationalSymposium on (2011), pp. 485–492.
[19] Newman, M. E. Analysis of weighted networks. Physical reviewE 70, 5 (2004).
[20] Phokeer, A., Densmore, M., Johnson, D., and Feamster,N. A first look at mobile internet use in township communitiesin south africa. In Proceedings of the 7th Annual Symposium onComputing for Development (2016), p. 15.
[21] Que, X., Checconi, F., Petrini, F., and Gunnels, J. A.Scalable community detection with the louvain algorithm. InInternational Parallel and Distributed Processing Symposium(IPDPS) (2015), pp. 28–37.
[22] Ramaswami, R., Sivarajan, K., and Sasaki, G. Opticalnetworks: a practical perspective. 2009.
[23] Sathiaseelan, A., Tyson, G., and Sen, S. Exploring the roleof smart data pricing in enabling affordable internet access. InIEEE INFOCOM Smart Data Pricing Workshop (SDP) (2015).
[24] Shavitt, Y., and Zilberman, N. A geolocation databasesstudy. IEEE Journal on Selected Areas in Communications 29,10 (2011), 2044–2056.
[25] Siganos, G., Faloutsos, M., Faloutsos, P., and Faloutsos,C. Power laws and the as-level internet topology. IEEE/ACMTransactions on Networking (TON) 11, 4 (2003), 514–524.
[26] Wang, X. S., Balasubramanian, A., Krishnamurthy, A.,and Wetherall, D. Demystifying page load performance withWProf. In NSDI (2013), pp. 473–485.
[27] Zaki, Y., Chen, J., Pötsch, T., Ahmad, T., and Subra-manian, L. Dissecting web latency in ghana. In InternetMeasurement Conference (IMC) (2014), pp. 241–248.