deep learning based abnormal gait classification system
TRANSCRIPT
Deep Learning Based Abnormal Gait
Classification System Study with
Heterogeneous Sensor Network
UNIVERSITY OF TURKU
Department of Future Technologies
Master of Science in Technology Thesis
Networked Systems Security
September 2019
Shubao Yin
Supervisors:
Wei Chen
Syed Rameez Kakakhel
The originality of this thesis has been checked in accordance with the University of Turku quality
assurance system using the Turnitin OriginalityCheck service.

UNIVERSITY OF TURKU
Department of Future Technologies
SHUBAO YIN: Deep Learning Based Abnormal Gait Classification System Study
with Heterogeneous Sensor Network
Master of Science in Technology Thesis, 83 p., 0 app. p.
Software Engineering, Embedded Electronics, and Communication Technology
September 2019
Gait is one of the important biological characteristics of the human body. Abnormal
gait is mostly related to the lesion site and has been demonstrated to play a guiding role
in clinical research such as medical diagnosis and disease prevention. In order to
promote the research of automatic gait pattern recognition, this paper introduces the
research status of abnormal gait recognition and systems analysis of the common gait
recognition technologies. Based on this, two gait information extraction methods,
sensor-based and vision-based, are studied, including wearable system design and deep
neural network-based algorithm design.
In the sensor-based study, we proposed a lower limb data acquisition system. The
experiment was designed to collect acceleration signals and sEMG signals under
normal and pathological gaits. Specifically, wearable hardware-based on MSP430 and
upper computer software based on Labview is designed. The hardware system consists
of EMG foot ring, high-precision IMU and pressure-sensitive intelligent insole.
Data of 15 healthy persons and 15 hemiplegic patients during walking were collected.
The classification of gait was carried out based on sEMG and the average accuracy rate
can reach 92.8% for CNN. For IMU signals five kinds of abnormal gait are trained
based on three models: BPNN, LSTM, and CNN. The experimental results show that
the system combined with the neural network can classify different pathological gaits
well, and the average accuracy rate of the six-classifications task can reach 93%.
In vision-based research, by using human keypoint detection technology, we obtain the
precise location of the key points through the fusion of thermal mapping and offset,
thus extracts the space-time information of the key points. However, the results show
that even the state-of-the-art is not good enough for replacing IMU in gait analysis and
classification. The good news is the rhythm wave can be observed within 2 m, which
proves that the temporal and spatial information of the key points extracted is highly
correlated with the acceleration information collected by IMU, which paved the way
for the visual-based abnormal gait classification algorithm.
Keywords: deep neural network, abnormal gait analysis, IMU, sEMG

3
图尔库大学
未来科技系
殷书宝: 基于深度学习与异构传感网络的异常步态分类系统研究
硕士论文,共 83 页,0 附录,
涉及软件工程,嵌入式电子和通信技术,
写于 2019 年九月
步态指人走路时表现出来的姿态,是人体重要生物特征之一。异常步态多与病变部位有关,作为
反映人体健康状况和行为能力的重要特征,其被论证在医疗诊断、疾病预防等临床研究中具有指
导作用。为了促进步态模式自动识别的研究,本文介绍了异常步态识别的研究现状,系统地分析
了常见步态识别技术以及算法,以此为基础研究了基于传感器与基于视觉两种步态信息提取方法,
内容包括可穿戴系统设计与基于深度神经网络的算法设计。
在基于传感器的研究中,本工作开发了下肢步态信息采集系统,并利用该信息采集系统设计实验,
采集正常与不同病理步态下的加速度信号与肌电信号,搭建深度神经网络完成分类任务。具体的,
在系统搭建部分设计了基于 MSP430 的可穿戴硬件设备以及基于 Labview 的上位机软件,该硬件
系统由肌电脚环,高精度 IMU 以及压感智能鞋垫组成,该上位机软件接收、解包蓝牙数据并计算
出步频步长等常用步态参数。
在基于运动信号与基于表面肌电的研究中,采集了 15 名健康人与 15 名偏瘫病人的步态数据,并
针对表面肌电信号训练卷积神经网络进行帕金森步态的识别与分类,平均准确率可达 92.8%。针
对运动信号训练了反向传播神经网络,LSTM 以及卷积神经网络三种模型进行五种异常步态的分
类任务。实验结果表明,本工作中步态信息采集系统结合神经网络模型,可以很好地对不同病理
步态进行分类,六分类平均正确率可达 93%。
在基于视觉的研究中,本文利用人体关键点检测技术,首先检测出图片中的一个或多个人,接着
对边界框做图像分割,接着采用全卷积 resnet 对每一个边界框中的人物的主要关节点做热力图
并分析偏移量,最后通过热力图与偏移的融合得到关键点的精确定位。通过该算法提取了不同步
态下姿态关键点时空信息,为基于视觉的步态分析系统提供了基础条件。但实验结果表明目前最
高准确率的人体关键点检测算法不足以替代 IMU 实现步态分析与分类。但在 2m 之内可以观察到
节律信息,证明了所提取的关键点时空信息与 IMU 采集的加速度信息呈现较高相关度,为基于视
觉的异常步态分类算法铺平了道路。
关键词:深度神经网络,异常步态分析,IMU,表面肌电,人体关键点检测
I
Table of Contents
1 Introduction ................................................................................ 1
2 Background & Related Works .................................................. 3
2.1 Human Motion Recognition and Gait Analysis ............................................ 3
2.2 Deep Learning and Human Skeleton Key Point Detection .......................... 6
2.3 Analysis of Advantages and Disadvantages ................................................. 6
2.4 Study Target and System Solution ................................................................ 7
3. System & Platform Design ....................................................... 8
3.1 Top-level System Architecture ...................................................................... 8
3.3 hardware design decisions .......................................................................... 11
3.4 System Implementation .............................................................................. 16
3.4.1 Plantar pressure acquisition unit ...................................................... 19
3.4.2 Signal processing module ................................................................ 21
3.4.3 Signal sending module ..................................................................... 22
3.5 System Prototype ........................................................................................ 24
3.6 Software Application .................................................................................. 26
3.7 Key formula and algorithm design ............................................................. 27
3.7.1 Coordinate correction algorithm ...................................................... 27
3.7.2 Range of motion algorithm .............................................................. 28
3.7.3 Gait Period ....................................................................................... 29
3.7.4 walking distance............................................................................... 29
3.8 Evaluation and conclusion .......................................................................... 30
3.8.1 Plantar pressure distribution measurements..................................... 30
II
3.8.2 EMG signal measurement ................................................................ 31
3.8.3 Motion signal measurements .............................................................. 32
3.9 Discussion and Conclusion ............................................................................ 32
4 Convolutional Neural Network for Parkinsonian Gait
Recognition and Classification using Surface Electromyography
.......................................................................................................... 34
4.1 Introduction ................................................................................................. 34
4.2 Method ........................................................................................................ 36
4.2.1 Data acquisition experiment setup ................................................... 36
4.2.2 Dataset preparation .......................................................................... 39
4.2.3 Neural network build-up and training .............................................. 40
4.2.4 Training Process ............................................................................... 44
4.3 Results ......................................................................................................... 45
4.3.1 Generic model .................................................................................. 45
4.3.2 Subject specific model ..................................................................... 47
4.4 Conclusion .................................................................................................. 48
5 Neural Networks for Pathological Gait Classification Using
Wearable Motion ............................................................................ 50
5.1 Introduction ................................................................................................. 50
5.2 Method ........................................................................................................ 52
5.2.1 Data acquisition experiment setup ................................................... 52
5.2.2 Data preprocessing and dataset preparation ..................................... 54
5.2.3 Neural network build up and training .............................................. 55
5.2.4 Training Process ............................................................................... 60
5.3 Results ......................................................................................................... 61
5.4 Conclusion .................................................................................................. 63
III
6 Skeleton Keypoints detection for abnormal gait recognition
.......................................................................................................... 65
6.1 Methods....................................................................................................... 65
6.1.1 Data acquisition experiment setup ................................................... 65
6.1.2 Human Keypoints detection ............................................................ 68
6.2 Results ......................................................................................................... 69
6.3 Future works ............................................................................................... 71
Summary ......................................................................................... 72
Bibliography .................................................................................... 73
Acknowledgements ......................................................................... 76
Publications and Awards ............................................................... 77

Abbreviations and Acronyms
IMU Inertial Measurement Unit
DMP Digital Motion Processor
sEMG Surface Electromyogram
BLE Bluetooth Low Energy
SoC System on Chip
MCU Micro Controller Unit
DCO Digitally Controlled Oscillator
RISC Reduced Instruction Set Computer
SPI Serial Peripheral Interface
I2C Inter-Integrated Circuit
ADC Analog-to-Digital Converter
GPIO General Purpose Input Output
UART Universal Asynchronous Receiver/Transmitter
PCB Printed Circuit Board
FPC Flexible Printed Circuit
ROM Read-only Memory
ANN Artificial Neural Network
CCD Charge Coupled Device
FSRS Force Sensing Resistors
PCA Principal Component Analysis
SMOTE Synthetic Minority Oversampling Technique
SPCA Supervised Principal Component Analysis
GEI Gait Energy Image
FOG Freezing of Gait

HMM Hidden Markov Model
ROC Receiver Operating Characteristic
AUC Area Under Curve
EER Equal Error Rate
SDK Software Development Kit
GRF Ground Reaction Force
DWT Discrete Wavelet Transform
NNC Nearest Neighbor Classifier
CNN Convolutional Neural Network
BPNN Back Propagation Neural Network
RNN Recurrent Neural Network
LSTM Long Short Term Memory
RAM Random Access Memory
USB Universal Serial Bus
PG Parkinson's Gait

1
1 Introduction
Gait, as the manner of walking, is an idiosyncratic and perceptible biological
behavioral feature of a person. Normal gait has the following characteristics, including
stability, periodicity, rhythm, and individual differences. Generally, gait can be
classified into normal gait and pathological gait. The pathological gaits may mainly
cause due to hemiplegia, Parkinson's disease, myopathy, and pain. It includes typically
gaits, namely, hemiplegic gait, Parkinson gait, gluteus medius gait, steppage gait and so
on[1]. By classifying the walking pattern of people, gait recognition can be used to
detect people’s identities. Gait also has many other applications in fields like medical
treatment and abnormal behavior detection.
Musculoskeletal diseases are one of the main causes of abnormal gait, which have a
significant impact on society, it may cause long-term disability. With the aging of the
population in some countries, these problems will increase rapidly in the future[2]. In
the field of medicine, researchers have studied gait as a unique feature of human
beings[3]. Medical studies have shown that gait analysis can diagnose abnormal gait
and pathological gait such as hemiplegia[4], [5]. Etiological analysis of human athletic
system and nervous system diseases can provide a lot of important information for the
reconstruction, prevention, and rehabilitation of walking ability of patients who are
suffering from paralysis or other diseases. Compared with other biological
characteristics, gait has the characteristics of long-distance, inviolability, difficult to
hide and camouflage, and easy to collect. Such characteristics show great potentials in
computer vision-based gait study. The relative position of the key points of human
skeleton and the angle of joints are different. Therefore, we can use the key points of the
human skeleton to describe the gait characteristics and apply them to the recognition
and prediction of human motion[6].
Identification of normal and pathological gaits could provide deep insights to
2
understand various human movement patterns across different gait pathologies.
However, traditional gait assessment is mainly based on clinical observations. It is a
subjective and time-consuming decision-making process for clinicians. To address
these issues, automatic methods to discriminate between normal and pathological gaits
have been attracted widespread attention.
Gait analysis[3] is a kind of biomechanical research method, which uses the concept
and processing method of sports biomechanics to analyze human walking. Gait
analysis is the acquisition of human motion information, such as ground reaction force,
force path, gait stability, stride frequency and so on, without disturbing human natural
activities. It can be applied to the following aspects:
(1) To assess abnormal gait.
(2) To assess the degree and nature of abnormal gait.
(3) To provide necessary data for the analysis of the causes of abnormal gait and how to
correct abnormal gait, thus formulate a treatment plan.
(4) To evaluate the effect of rehabilitation treatment.
By identifying the abnormal gait, we can find out whether the person under
guardianship has an abnormal condition, so as to take timely measures.
The remaining chapters are assigned as follows. We present technological background
and related works in chapter 2 as well as a brief introduction to this work. In chapter 3,
the structure of the experiment platform and the proposed system are introduced in
detail. The design of the neural-network-based algorithm for pathological gait analysis
is proposed in chapter 4 and 5, including the design of experiments and the discussion
of results. The conclusion of the work is summarized in chapter 6.

3
2 Background & Related Works
2.1 Human Motion Recognition and Gait Analysis
Basically, research on abnormal gait recognition consists of two types, sensor based[7],
[8] [9]and video based[10]. For sensor-based studies, they mainly contain two aspects,
which are the study, design, build and development of hardware platform, and the
improvement of exiting gait recognition algorithm[11], [12].
For video-based studies, from feature extraction to feature fusion, and design of
classifying machines, many relevant pieces of research have been done internationally.
Ziba Gandomkar et al.[13] proposed a markless vision-based technique for extracting a
set of features from the human walking sequence for differentiating normal and
abnormal gait. The classification steps are as follows: firstly, the contour and its
boundary box are extracted in each frame. Then, the contour is normalized according to
the height of the contour. Finally, the gait Fritz pattern is adopted for feature extraction.
Murase, H, and Sakai, R[14] describe a new method to calculate the spatial-temporal
correlation of the feature space representation of the parameter effectively in moving
target recognition. Parametric feature space compactly represents the time variation of
image sequence through the tracks in feature space. This representation reduces the
computational cost of correlation-based comparison between image sequences. In
Élodie Desseré and Louis Legrand’s [15] study, a complete method of gait analysis
using an unmarked system is proposed. The designed acquisition system consists of
three CCD cameras calibrated synchronously. The legs of walkers are recognized in a
gray image sequence, reconstructed in three-dimensional space, and the movement of
the human body in gait activity is analyzed. This paper introduces a three-dimensional
model of the human joint based on conic super conic. The image sequence is segmented
based on a motion by a morphological operator, and the boundary of the moving leg is
extracted. Next, the least square method (LMS) is used to reconstruct the human body
4
in order to determine the position of the human body in three-dimensional space.
Finally, spatial coherence is applied to the reconstructed curve to better fit the
anatomical structure of the leg and consider the joint model. Researchers also proposed
a synthesis method to compose gait sequences to the canonical-viewed ones based on
the planar homography, thus reduce the directional dependency[16], [17]. Based on the
overall consideration of speed and effect, Han et al.[18] proposed a new spatiotemporal
gait representation method, called gait energy image (GEI), which is proposed to
represent the gait characteristics of human beings and realize the gait recognition of
individuals. Based on this work, in Theekhanont et al.’s work [19] GEI was
transformed into a trace transform image. The threshold value of the tracking
transformed image is used to calculate the mode tracking transformed image to develop
the mode tracking transformation. Finally, they use template matching for recognition.
The research of abnormal gait based on non-video sensors can be divided into two
aspects: one is the research and establishment of a hardware platform for abnormal gait
recognition for elderly monitoring, the other is the improvement and optimization of
abnormal gait recognition algorithm (classifier).
Howell, Adam M., et al.[20] measured the ground support force by placing 12 pressure
sensors on the insoles, and the gait was further analyzed. To determine the ground
reaction force and the moments corresponding, subject-specific linear regression
models were used. Which is corresponding to ankle dorsiflexion/plantarflexion, knee
flexion/extension, and knee abduction/adduction? Other studies using force sensor
includes[21], [22] use a hidden Markov model (HMM) to analyze the gait stage in gait
movement. The ground contact force (GRF) obtained by intelligent shoes is used as the
observation data in HMM, and the posterior probability in HMM is used to infer the
gait stage.
In [23], [24], a gait analysis system based on a single accelerometer is described to

5
evaluate the dynamic gait characteristics. The acceleration data of normal people and
Parkinson's disease patients were recorded continuously, from which the peak value of
gait was extracted, and the relationship between gait period and vertical gait
acceleration was evaluated. By fitting the model equation, the quantitative index of
walking behavior was obtained. The mean index of patients with gait disorders was
statistically lower than that of normal people. [25] presents a wearable device based on
IMU and its associated stride detection algorithm to analyze gait information for
patients with Alzheimer's disease (AD).
Abnormal gait recognition based on one kind of sensor (accelerometer or pressure
sensor) is mainly introduced. The related research using multiple sensors is introduced
below. For example:
C. Senanayake et al.[26] proposed a system to obtain ground contact force and knee
joint angles. The system consists of four force-sensitive resistors and two inertial
sensors. They also build the software application to be used in a clinical environment
that is user-friendly and allows users to perform gait analysis without knowledge in the
area.
A wireless wearable system was developed by Stacy J Morris Bamberg et al.[27] to
provide gait analysis outside the motion laboratory. The sensor kit consists of three
orthogonal accelerometers and gyroscopes as well as four force sensors. Two
bidirectional bending sensors, two dynamic pressure sensors and an electric field height
sensor were also used. "Gaithoe" can be designed to wear on any shoe without
disturbing the gait, and can collect data in any environment for a long time without
interference.
Some other studies deal with gait analysis using one camera. For example, a clinical
measurement system based on the elliptical hierarchical tree structure is proposed in

6
[28]. However, the system is limited to the front parallel (side view) gait and does not
provide a complete three-dimensional measurement.
2.2 Deep Learning and Human Skeleton Key Point Detection
Meng Chen et al.[29] presents a method using a hidden Markov model for modeling
human abnormal gait. The system modeling normal gait, toe-in and toe-out gait
abnormalities patterns. An IMU is employed to measure angular velocities and
accelerations of the human foot. One bend sensor and four force-sensing resistors
(FSRs) are arranged on the insole for force and flexion information acquisition. For
feature generation, principal component analysis (PCA) is mainly used and
multi-pattern modeling hidden Markov model (HMM) is used. The experiment results
show the proposed models are robust and efficient.
Nguyen Trong-Nguyen et al.[2] proposed an approach for detecting abnormal gait.
Their model is based on a human joint skeleton in time series instead of using the
silhouette, color image or Spatio-temporal volume. They decompose the normal gait
images sequence by gait cycles and each instant posture is represented by a feature
vector. The vector describes relationships between pairs of the bone of the lower body.
A clustering technique was used and those vectors are then converted into codewords.
On Kinect skeleton and marker-based data, the experimental results show that the
method does well in distinguishing normal and abnormal gaits, and the overall accuracy
can reach 90.12%.
2.3 Analysis of Advantages and Disadvantages
Researchers have conducted researches on recognition of abnormal gait for a long time,
and many techniques, systems, and algorithms have been demonstrated. For
sensor-based research, IMU is the most popular one since it is intuitive and detailed.

7
While multi-sensor gait analysis contains gyroscopes, accelerometers, surface EMG,
planta pressure and so on. With the help of these multi-source heterogeneous sensors,
more data can be gathered during walking and much data fusion algorithms can be
explored. On the other hand, video-based research on recognition of abnormal gait is
not so much a problem in the field of biomedical engineering as a problem in the field
of computer vision. To analysis the information of gait, the skeleton needs to be
extracted, while the precision of the key-points model may not good enough for
abnormal gait analysis.
To sum up, the sensor-based system has the advantages of cheap and precision, but it
needs a system to wear or adorn, which is an inconvenience to users. It is also worth
mentioning that traditional study usually forces on the methods of feature extraction
or design of the system. The video-based study is easy to use but the accuracy still
needs to be improved.
2.4 Study Target and System Solution
The purpose of this study is to explore the new gait recognition system and algorithm
design. First, a heterogeneous sensor networks system was built as our experiment
platform. Two wearable motion sensors were used to acquire the motion signals.
Second, ANNs (BPNN, LSTM, and CNN) based pathological gait classifiers were used
to identify different pathological gaits. At last, the key points of the human skeleton
have extracted and analyzed the ability to replacing low-precision wearable devices.

8
3. System & Platform Design
In this part, we launch the design procedure from the requirement design and the
architecture of the top-level system is presented. Then the hardware selection and
design decision-making will be introduced and discussed. Finally, the hardware
structure of the system is given and the basic functional unit testing, as well as joint
testing, was demonstrated. Experiments were carried out to investigate the system
performance, which demonstrated the potential of the proposed system in home-based
scenarios and clinical practice.
3.1 Top-level System Architecture
In this work, a novel wearable multimode system for lower limb activity evaluation and
gait recognition comprised of a multi-functional band, plantar pressure distribution
sensor and a local terminal connected to an upper machine platform is presented. This
proposed system can acquire the necessary data for lower limb activity evaluation and
gait recognition based on clinical practice. By using the proposed system, we can gather
necessary data for ANN (artificial neural network) based gait classification research,
and the therapists can distribute the specific training plans based on the evaluation
results through the system for the patients to rehabilitate more efficiently.
Inertial Measurement Units (IMU) and physiological signal front end with carbonized
foam electrode are embedded in the proposed system to obtain motion signals and
electromyogram (EMG) signals.[30] Furthermore, a novel plantar pressure distribution
sensor using flexible pressure sensors, flexible conductive lines, and fabric materials is
proposed to get the plantar pressure distribution. The carbonized foam electrode and
proposed plantar pressure distribution sensor enable a more convenient evaluation and
rehabilitation process. Patients can switch between two different wearing modes with
9
EMG signals on and off.
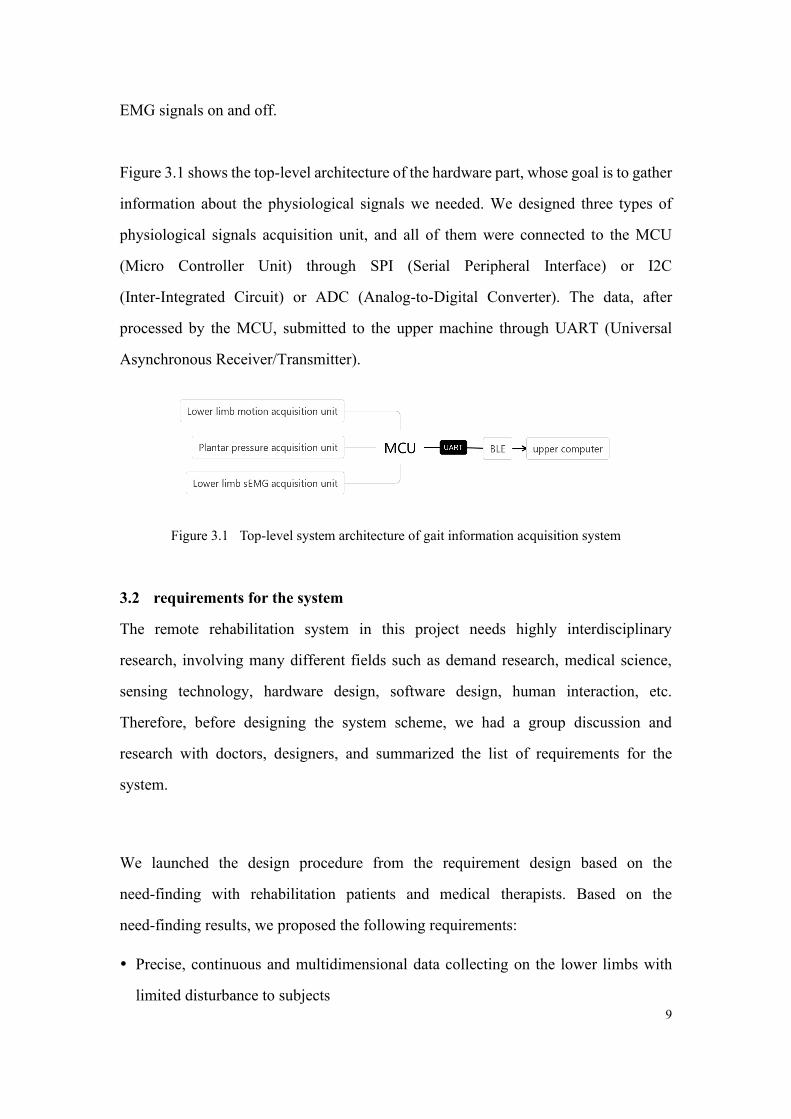
Figure 3.1 shows the top-level architecture of the hardware part, whose goal is to gather
information about the physiological signals we needed. We designed three types of
physiological signals acquisition unit, and all of them were connected to the MCU
(Micro Controller Unit) through SPI (Serial Peripheral Interface) or I2C
(Inter-Integrated Circuit) or ADC (Analog-to-Digital Converter). The data, after
processed by the MCU, submitted to the upper machine through UART (Universal
Asynchronous Receiver/Transmitter).
Figure 3.1 Top-level system architecture of gait information acquisition system
3.2 requirements for the system
The remote rehabilitation system in this project needs highly interdisciplinary
research, involving many different fields such as demand research, medical science,
sensing technology, hardware design, software design, human interaction, etc.
Therefore, before designing the system scheme, we had a group discussion and
research with doctors, designers, and summarized the list of requirements for the
system.
We launched the design procedure from the requirement design based on the
need-finding with rehabilitation patients and medical therapists. Based on the
need-finding results, we proposed the following requirements:
Precise, continuous and multidimensional data collecting on the lower limbs with
limited disturbance to subjects
10
Data management for further use, like retrospective analysis and longitudinal study.
Some reserve ports for further expanding modules.
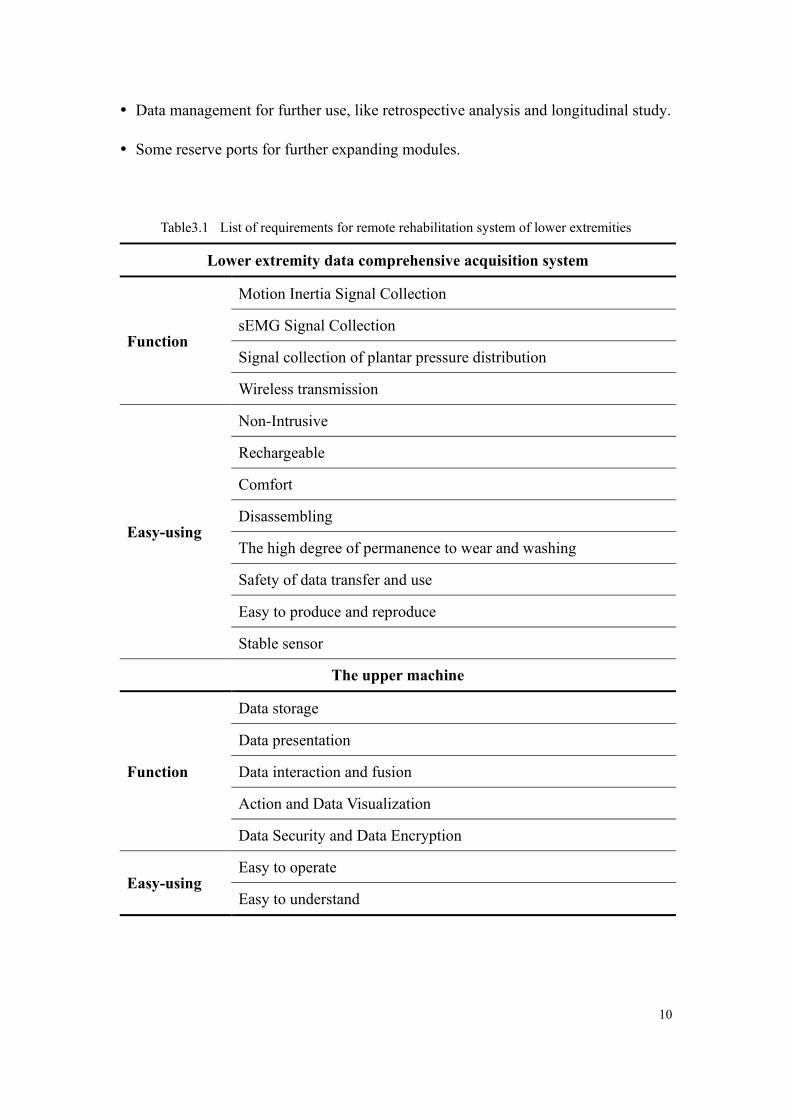
Table3.1 List of requirements for remote rehabilitation system of lower extremities
Lower extremity data comprehensive acquisition system
Function
Motion Inertia Signal Collection
sEMG Signal Collection
Signal collection of plantar pressure distribution
Wireless transmission
Easy-using
• Non-Intrusive
• Rechargeable
• Comfort
Disassembling
The high degree of permanence to wear and washing
Safety of data transfer and use
Easy to produce and reproduce
Stable sensor
The upper machine
Function
Data storage
Data presentation
Data interaction and fusion
Action and Data Visualization
Data Security and Data Encryption
Easy-using Easy to operate
Easy to understand

11
3.3 hardware design decisions
Based on the requirement list, we design the system framework. The system is
roughly divided into three parts: data acquisition, data processing, and system
software.
For data acquisition, three kinds of sensors are needed. They are a sensor for motion
inertia signal collection, sEMG signal collection, and plantar pressure distribution
collection.
MPU9250 integrates 3-axis gyroscope, 3-axis accelerometer, and 3-axis
magnetometer, and the output is 16-bit digital. The data can be exchanged through the
integrated circuit bus (IIC) interface to the microcontroller, and the transmission rate
can reach 400 kHz/s. The angular velocity measurement range of the gyroscope is up
to 2000 (degrees /s), and it has good dynamic response characteristics. The maximum
measurement range of accelerometer is ±16g, g is gravitational acceleration, and the
static measurement accuracy is high enough. Its magnetometer uses a high-sensitivity
Hall-type sensor for data acquisition and the measurement range of magnetic
induction intensity is 4800 UT, which can be used for auxiliary measurement of yaw
angle. Fig 3.2 shows the chip’s internal block diagram.
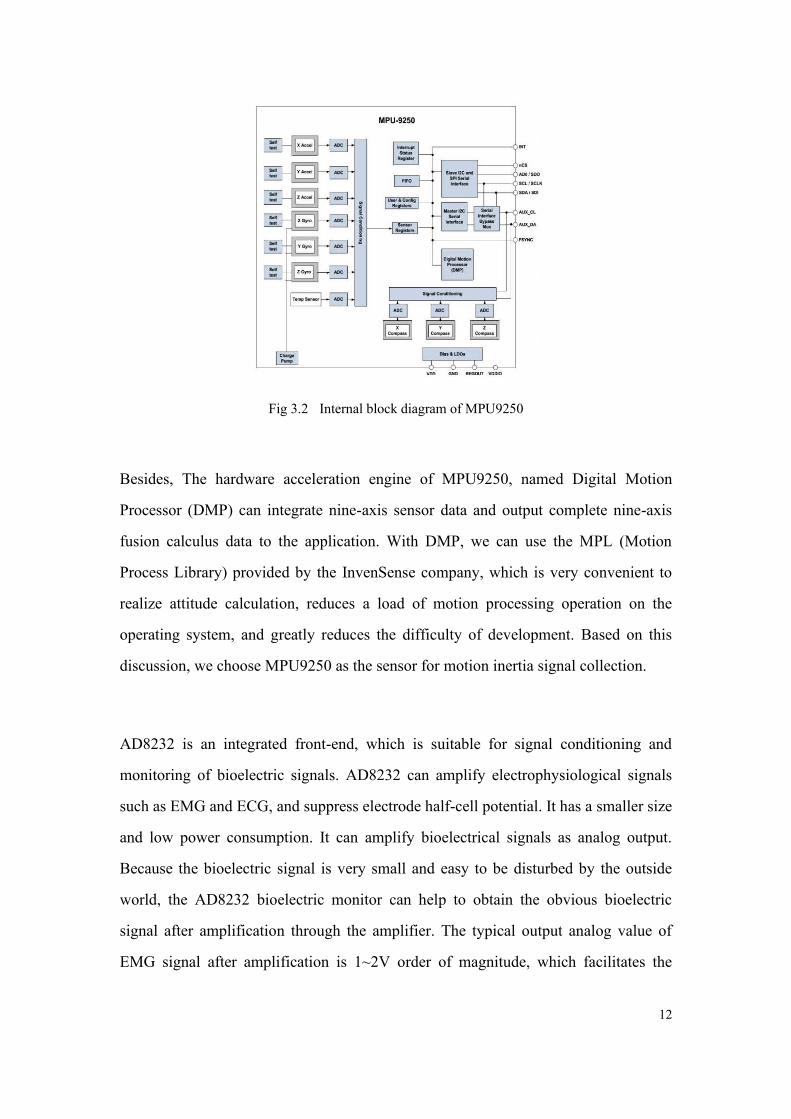
12
Fig 3.2 Internal block diagram of MPU9250
Besides, The hardware acceleration engine of MPU9250, named Digital Motion
Processor (DMP) can integrate nine-axis sensor data and output complete nine-axis
fusion calculus data to the application. With DMP, we can use the MPL (Motion
Process Library) provided by the InvenSense company, which is very convenient to
realize attitude calculation, reduces a load of motion processing operation on the
operating system, and greatly reduces the difficulty of development. Based on this
discussion, we choose MPU9250 as the sensor for motion inertia signal collection.
AD8232 is an integrated front-end, which is suitable for signal conditioning and
monitoring of bioelectric signals. AD8232 can amplify electrophysiological signals
such as EMG and ECG, and suppress electrode half-cell potential. It has a smaller size
and low power consumption. It can amplify bioelectrical signals as analog output.
Because the bioelectric signal is very small and easy to be disturbed by the outside
world, the AD8232 bioelectric monitor can help to obtain the obvious bioelectric
signal after amplification through the amplifier. The typical output analog value of
EMG signal after amplification is 1~2V order of magnitude, which facilitates the

13
analog-to-digital conversion of the latter stage. The typical structure of double-lead is
shown in Fig 3.3 below.
Fig 3.3 A typical double lead circuit of AD8232
Therefore, EMG signals collected by flexible carbonized sponge electrodes are
filtered by AD8232 combined with peripherals. Based on this discussion, we choose
AD8232 as a sensor for sEMG Signal collection.
The signal transmission module chip of this system adopts the FSC-BT822 Bluetooth
module. The device has good compatibility and is easy to connect with computers,
mobile phones, tablets, and other devices. The serial port of the Bluetooth module is
connected with the serial port of MSP430F5529. Complies with Bluetooth 4.2 dual
mode protocols (BR/EDR/BLE), FSC-BT822 is a fully integrated Bluetooth module.
It supports SPP, HID, GATT, Beacon, profiles. It integrates the Baseband controller
and MCU in a small package(Integrated chip antenna), so the designers can have
better flexibilities for the product shapes. Fig 3.4 shows the BLE module we used.

14
Fig 3.4 FSC-BT822
After selection among various pressure material, our system adopts Velostat pressure
material from 3M company, this conductive material (also known as "Veloster" or
"linqstat") is a good addition to the wearable/sensor hack kit. It is pressure-sensitive:
squeezing it will reduce the resistance, so it is very convenient to make flexible
sensors. It's much cheaper than off the shelf pressure or bend sensors, which is lower
cost and better flexibility. The physical properties are opaque black with a thickness
of about 100 um. Its electrical property is piezoresistive, that is, resistance decreases
with the increase of pressure. This material was originally used for ESD
(Electro-Static Discharge) bags, but at present, some researchers have used this
material as a simple pressure sensing system. Based on these discussions, the plantar
pressure array acquisition module is made of Velostat material and flexible plastic
film conductive tape. Fig 3.5 shows this material named Velostat.
Fig 3.5 the Velostat conductive material

15
MSP430F5529 MCU is chosen as the main processing module of the system. TI
MSP430 series ultra-low-power microcontrollers are composed of a number of
devices with peripheral devices for various applications. This architecture, combined
with a wide range of low power consumption modes, can be optimized to extend
battery life in portable measurement applications. What’s more, the microcontroller
has a powerful 16 bit RISC CPU, 16-bit register and constant generator, which helps
to improve code efficiency. The digital control oscillator (DCO) allows the device to
wake up from a low power mode to an active mode in 3.5 mesh.
Msp430f5529 microcontroller integrates USB and PHY supporting DMA, four 16 bit
timers, USB 2.0, two USCIS, a hardware multiplier, an RTC module with alarm
function, a high-performance 12-bit analog-to-digital converter (ADC) and 63 I / O
pins. Its typical applications include analog and digital sensor systems, data recorders
and other applications that need to be connected to various USB hosts.
To sum up, MSP430 series MCU is a 16-bit mixed-signal processor with ultra-low
power consumption and Reduced Instruction Set Computer (RISC). Compared with
other microcontrollers, this series of microcontrollers have the advantages of
ultra-low power consumption and abundant peripherals on-chip, which are very
suitable for EMG signal processing. MSP430F5529 is selected as the control chip in
this system. In MSP430 series chips, MSP430F5529 can not only meet the functional
requirements but also has lower power consumption and cost overall. Figure 3.6
shows the structure of the MSP430F5529.
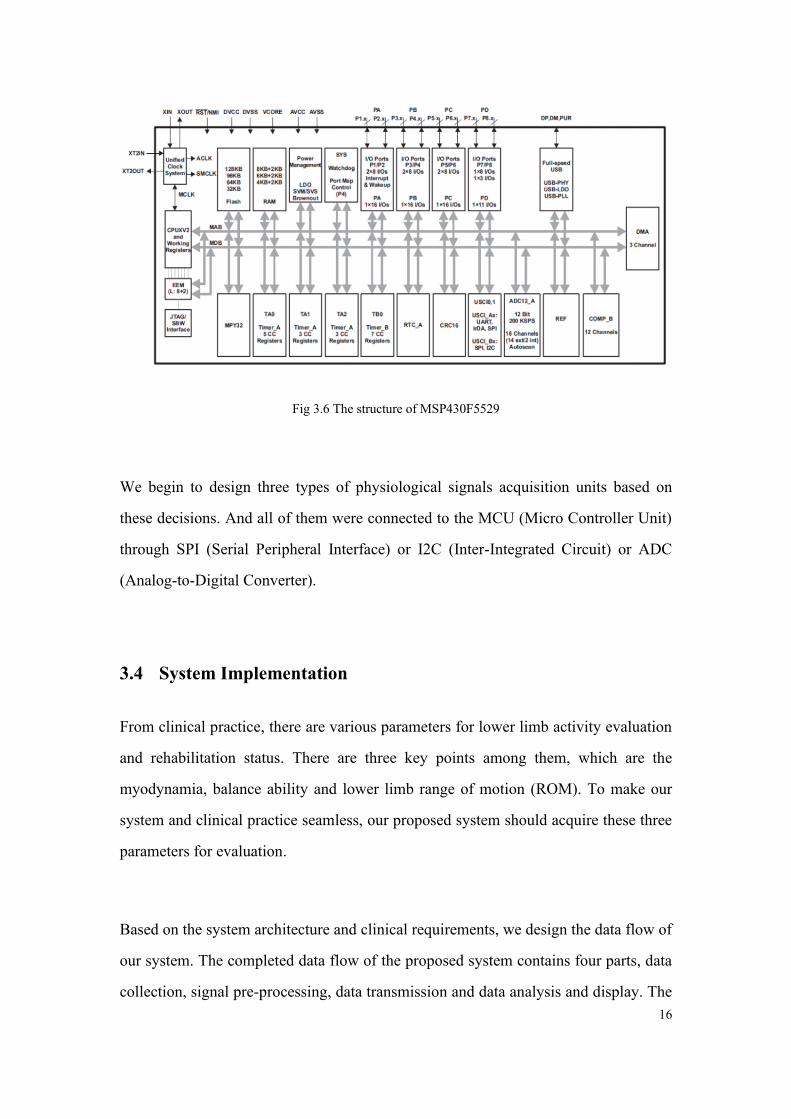
16
Fig 3.6 The structure of MSP430F5529
We begin to design three types of physiological signals acquisition units based on
these decisions. And all of them were connected to the MCU (Micro Controller Unit)
through SPI (Serial Peripheral Interface) or I2C (Inter-Integrated Circuit) or ADC
(Analog-to-Digital Converter).
3.4 System Implementation
From clinical practice, there are various parameters for lower limb activity evaluation
and rehabilitation status. There are three key points among them, which are the
myodynamia, balance ability and lower limb range of motion (ROM). To make our
system and clinical practice seamless, our proposed system should acquire these three
parameters for evaluation.
Based on the system architecture and clinical requirements, we design the data flow of
our system. The completed data flow of the proposed system contains four parts, data
collection, signal pre-processing, data transmission and data analysis and display. The

17
data flow sketch is shown in Fig 3.7. The wearable multimode system collects plantar
pressure distribution, motion signals, and EMG signals. Then the microcontroller unit
(MCU) fixed in the multifunctional band will process the signals and transmit them to
the local mobile terminal via Bluetooth. Finally, the mobile terminal together with the
cloud platform will analyze and store the data.
MCU
Signal Processing
Bluetooth
Transmission
Local Mobile Terminal
Evaluation
Plantar
Pressure
Motion Signals
EMG Signals
Smart Sneaker Upper Monitor
WLAN
Transmission
Cloud Platform
Storage
Fig 3.7 Data flow sketch
In this section, the technical details about the whole system are presented. The overall
wearable multimode system consists of two parts, a multifunctional band with a
plantar pressure sensor as well as a mobile terminal with the application. For detail,
the signal acquisition module includes an EMG module, two IMU modules, and a
planter pressure acquisition module. As for the data acquisition, a new type of flexible
plantar pressure distribution sensor is used to collect plantar pressure distribution,
EMG signal is collected by physiological signal front-end, and motion signal is
collected by IMU module. All the data are transmitted to the local mobile terminal
through the Bluetooth module. Then the application will upload the evaluation data to
the cloud platform for the therapists to check and modify the training plans.
The hardware of the system is mainly divided into five modules: signal acquisition
module, a signal processing module, signal transmission module, power management,
and a charging module. The signal acquisition module consists of three parts: a

18
piezoresistive matrix composed of Veloster material, a plantar pressure signal
acquisition unit with HC4051 analog multiplexer, an instrument amplifier to complete
the acquisition of surface EMG signals and a motion sensor unit based on MPU9250.
The signal processing and sending module are composed of MSP430 MCU and
FSC-BT822 Bluetooth dual-mode module. The power supply module consists of
lithium-ion battery, BQ24610 charging unit and voltage stabilizing unit. The working
principle of the system is as follows: the MCU receives data from IMU through SPI
communication protocol, collects sEMG and plantar pressure data and preprocesses
them. Finally, the above sEMG signal, motion signal, and plantar pressure signal are
transmitted through Bluetooth. The data collected from our hardware is then sent to
the host computer.
The multifunctional band is an unobtrusive and wearable front end of the wearable
multimode system. It’s made up of the multifunctional band and a plantar pressure
sensor. The main processing module, communication module, and rechargeable
Li-battery power supply module were embedded in the multifunctional band with an
inertial measurement unit (IMU, Invensense MPU9250) module and an sEMG
module with carbonized foam electrode. The novel plantar signal module is connected
to the multifunctional band through Flexible Printed Circuit (FPC) cable. The
structure of this band and plantar pressure distribution sensor are illustrated in Fig 3.8.

19
Fig 3.8 (a)Structure of multifunctional band (b) Structure of plantar pressure distribution sensor
The plantar signal module contains two parts, the IMU sensor for plantar motion
detection, and a novel plantar pressure distribution insole. We use Velostat, a new
pressure-resistance material, to develop a flexible pressure sensor with a novel
structure. Furthermore, flexible conductive lines and fabric materials were
employed to develop the plantar pressure sensor. The novel structure of this sensor is
shown in Fig. 3.8(b).
3.4.1 Plantar pressure acquisition unit
To be specific, a sensor array with 16 rows and 4 columns is used to acquire the
high-resolution pressure distribution. The vertical and horizontal conductive lines
together with the MCU and resistances put the flexible pressure sensor in a circuit. To
minimize the number of ADC ports on-chip, a 16-channel analog multiplexer
CD74HC4067 is used in the circuit. The schematic of the plantar pressure distribution
insole circuit is displayed in Fig 3.9. Four flexible conductive lines in the upper layer
are controlled by the General Purpose Input Output (GPIO) of MCU, and they are set

20
to Vcc successively to have four loops for the lower layer to acquire the pressure on
each flexible pressure sensor.
Fig 3.9 Schematic of plantar pressure distribution insole circuit
During the time of choosing a row of electrode signals, the Vcc is connected by the
upper analog switch in order. In this way, the 1-10 horizontal lines are selected
sequentially. Each time, the 1-5 AD converter works in turn, thus completing the
whole sampling process. The circuit diagram of each sample point scanned is shown
in Fig 3.10.
Fig 3.10 circuit diagram of a single sampling point
Therefore, the voltage collected at each sampling point is (3-1):
𝑉𝑠𝑎𝑚𝑝𝑙𝑒 =𝑅0
𝑅𝑠𝑒𝑛𝑠𝑜𝑟 + 𝑅0× 𝑉𝑐𝑐 (3-1)

21
By this method, only 15 electrodes are needed to scan and can collect 10*5 matrix
data. At the same time, only one analog switch chip is needed, which improves the
efficiency of the IO port and takes into account the spatial layout. The structure
diagram of the whole intelligent insole is shown in Fig 3.11.
Fig 3.11 schematic diagram of intelligent insoles
3.4.2 Signal processing module
(1) Application architecture
The program is composed of the main program occupying the kernel and the timer
interrupt service program, which can realize many tasks such as timing sampling,
timing sending, data communication, sensor array scanning and so on. Several tasks
are performed sequentially in timer interruption by means of a supercycle. Under the
normal working condition of hardware, the task of sampling, filtering, and sending
can be executed separately under the design idea of the super-cycle. The sequential
execution of each function has no influence on each other, that is to say, the real-time
performance of the system is guaranteed. At the same time, the design method has
strong program readability and improves the efficiency of modification and
transplantation.
Longitudinal conducting band
Velostat
Transverse conduction band
22
(2) Interrupt Service
The timer interrupt service program completes the sampling and sending operations.
Sampling is conducted every 100ms. Before sending, the main program checks
whether the sending queue has been filled out. If the sending queue has been filled out,
the DMA sending program will be started, and the data will be filled out
automatically from the sending queue to the UART and sent to the register.
The designated length data is sent to the serial port sending register by DMA_0
channel once, and the rising edge of the interrupt flag bit is triggered by the serial port
sending. Enter the DMA interrupt service function after a single transmission is
completed. The task of this function is to change the DMA_Done flag bit to 1 in order
to inform the main program that the transmission has been completed.
3.4.3 Signal sending module
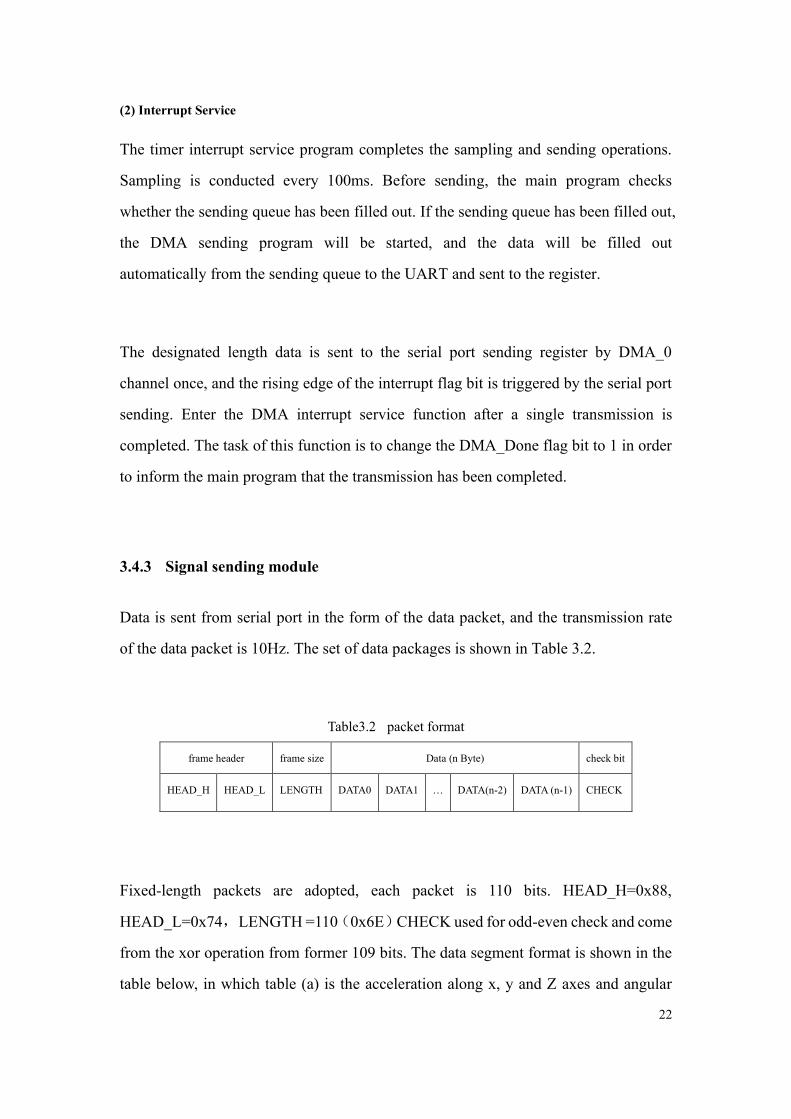
Data is sent from serial port in the form of the data packet, and the transmission rate
of the data packet is 10Hz. The set of data packages is shown in Table 3.2.
Table3.2 packet format
frame header frame size Data (n Byte) check bit
HEAD_H HEAD_L LENGTH DATA0 DATA1 … DATA(n-2) DATA (n-1) CHECK
Fixed-length packets are adopted, each packet is 110 bits. HEAD_H=0x88,
HEAD_L=0x74,LENGTH =110(0x6E)CHECK used for odd-even check and come
from the xor operation from former 109 bits. The data segment format is shown in the
table below, in which table (a) is the acceleration along x, y and Z axes and angular

23
velocity along x, y and Z axes of two IMUs, and quaternion. Table (b) is the pressure
value and EMG signal of the sampled plantar pressure acquisition unit. Among them,
the first IMU is placed in the insole, and the second IMU is fixed on the leg.
ACCEL_X, Y, Z are the acceleration values of each axis of the motion sensor, GYR_X,
Y, Z are the angular velocity values of the motion sensor around each axis, and Q_0,
Q_1, Q_2, Q_3 are quaternions.
Table3.3(a) The format of data segment
Data
bits 0-1 2-3 4-5 6-7 8-9 10-11
12-1
3
14-1
5
16-1
7
18-
19
Data ACCE
L0_X
ACCEL
0_Y
ACCEL
0_Z
GYR0
_X
GYR0
_Y
GYR0
_Z
Q0_
0
Q0_
1
Q0_
2
Q0
_3
20-21 22-23 24-25 26-27 28-29 30-31 32-3
3
34-3
5
36-3
7 38-39
ACCEL
1_X ACCEL1_Y
ACCEL
1_Z
GYR1_
X
GYR1
_Y
GYR1
_Z Q1_0
Q1_
1
Q1_
2 Q1_3
Table 3.3(b) The format of the data segment
PRES_s the voltage value of the sampling point of the wheel
Data
bits 40-41 42-43 44-45 … 98-99 100-101 102-103 104-105
Data PRES_1 PRES_2 PRES_3 … PRES_30 PRES_31 PRES_32 EMG
The data transmission rate of system: serial port baud rate is 115200 and thus
transmission rate can reach 10 packages/s, which is 2200 byte/s.

24
3.5 System Prototype
The prototype of the proposed wearable multimode system is shown in Fig 3.8(a), a
plantar pressure distribution sensor can be seen in Fig 3.8(b), printed circuit
board(PCB) inside the multifunctional band is shown in Fig 3.12.
Fig 3.12 (a)Prototype of proposed wearable multimode system (b) Prototype of plantar pressure
distribution sensor (c) PCB inside the multifunctional band
We use the instrumentation amplifier to build a physiological signal front ends with a
novel carbonized foam electrode to gather the signal of EMG. The analog output of
the EMG module is converted to a digital signal by an on-chip 12-bit high accurate
Analog-Digital Converter (ADC) in MCU. The use of a carbonized foam electrode
will reduce the with less power line interference compared with Ag/AgCl. Fig 3.13
shows the carbonized foam electrode and the EMG module of the proposed system.

25
Fig 3.12 (a) Carbonized foam (b) Carbonized foam electrode
Overall, there are two IMUs in this system. One is set under the plantar pressure
sensor as presented above, and the other is in the multifunctional band, We collect
tri-axis acceleration and tri-axis angular rate from them. The IMU automatic
calibrates the tri-axis angular rate by subtracting the offset calculated from the
average value of the first 3 seconds when powered on, and the tri-axis acceleration
doesn’t need to be calibrated under the proposed scenario. These motion signals from
these two sensors are transferred to MCU MSP430 in the multifunctional band via
Serial Peripheral Interface (SPI).
All the signals from these three modules are collected and processed with the
management of MCU. The signal processing procedure includes filtering and data
packing. These algorithms will make the local mobile terminal have a better signal
quality and to reduce the transmission bandwidth simultaneously. Then, the packaged
data are sent to the local mobile terminal synchronously via Bluetooth module, we
choose FSC-BT822, whose default UART Baud rate is 115.2Kbps and can support
from 1200bps up to 921Kbps. In our system, each data package takes 174 bytes and
we send 10 packages per second, which means we need 1740 bps.
26
Fig 3.13 The illustration of the system in using
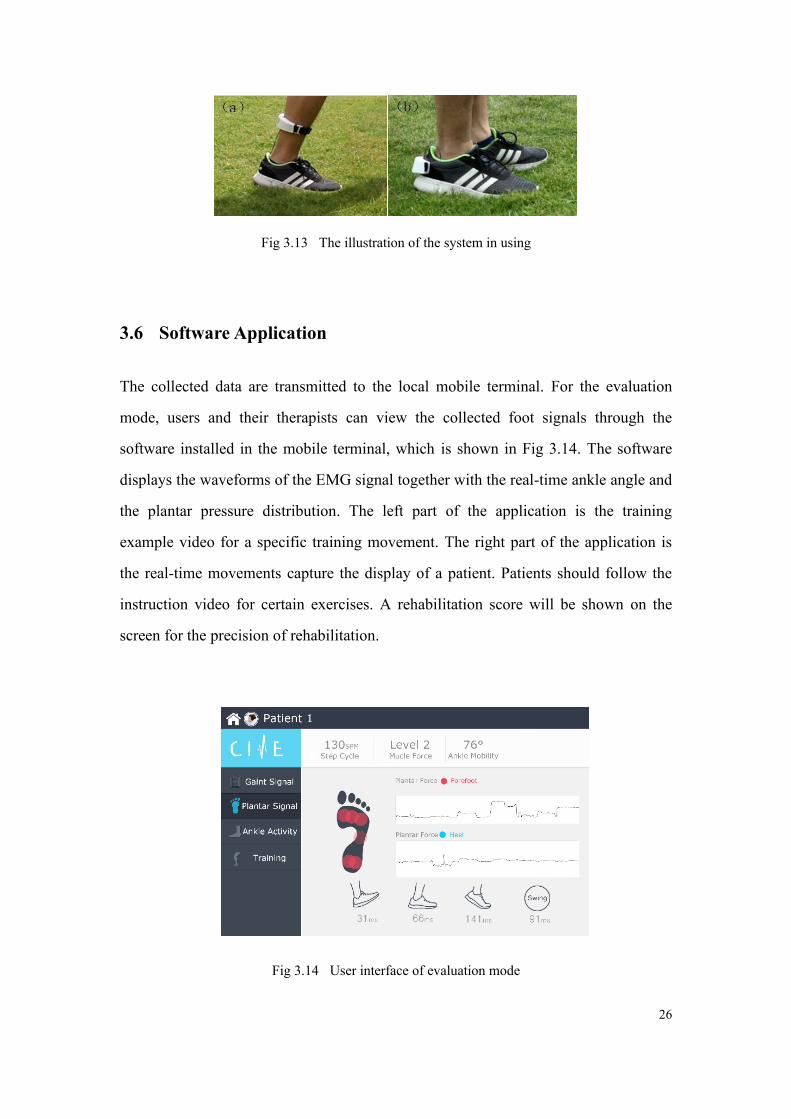
3.6 Software Application
The collected data are transmitted to the local mobile terminal. For the evaluation
mode, users and their therapists can view the collected foot signals through the
software installed in the mobile terminal, which is shown in Fig 3.14. The software
displays the waveforms of the EMG signal together with the real-time ankle angle and
the plantar pressure distribution. The left part of the application is the training
example video for a specific training movement. The right part of the application is
the real-time movements capture the display of a patient. Patients should follow the
instruction video for certain exercises. A rehabilitation score will be shown on the
screen for the precision of rehabilitation.
Fig 3.14 User interface of evaluation mode
27
The proposed multifunctional band together with the plantar pressure distribution
sensor was worn to have a whole test of each module and verify their performance,
including the signal quality and accuracy test of plantar pressure distribution, EMG
signal and motion signal measurement.
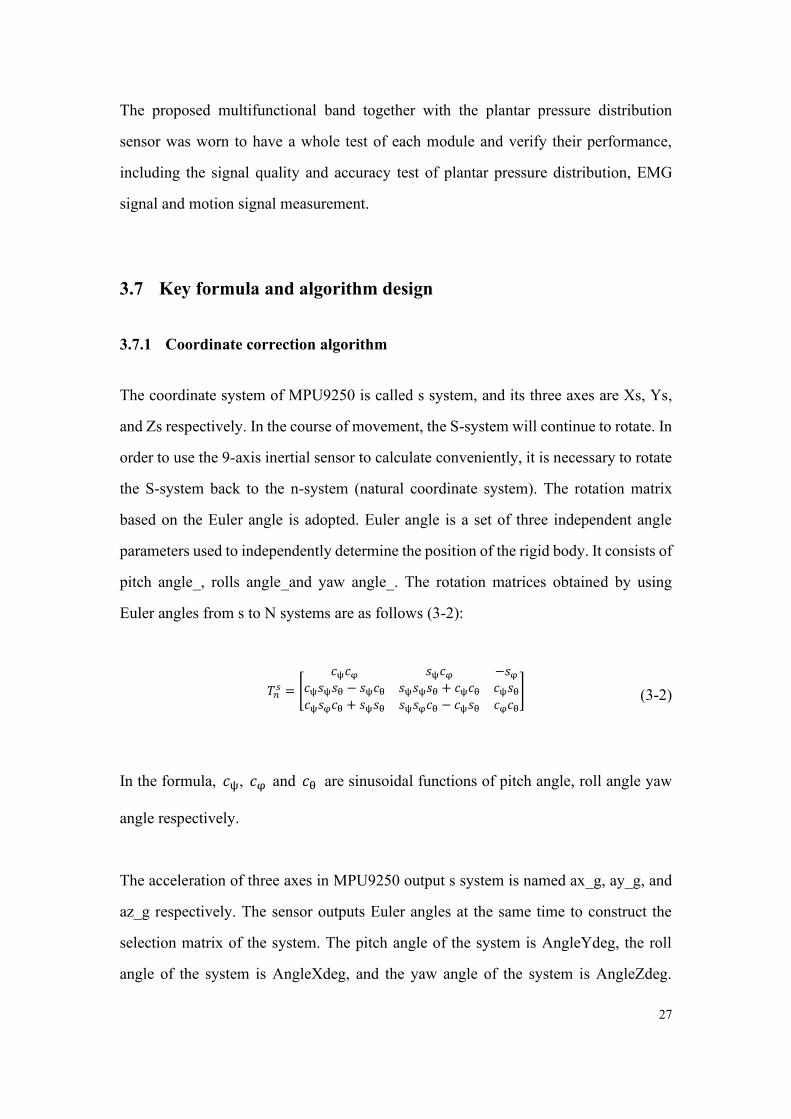
3.7 Key formula and algorithm design
3.7.1 Coordinate correction algorithm
The coordinate system of MPU9250 is called s system, and its three axes are Xs, Ys,
and Zs respectively. In the course of movement, the S-system will continue to rotate. In
order to use the 9-axis inertial sensor to calculate conveniently, it is necessary to rotate
the S-system back to the n-system (natural coordinate system). The rotation matrix
based on the Euler angle is adopted. Euler angle is a set of three independent angle
parameters used to independently determine the position of the rigid body. It consists of
pitch angle_, rolls angle_and yaw angle_. The rotation matrices obtained by using
Euler angles from s to N systems are as follows (3-2):
𝑇𝑛𝑠 = [
𝑐ψ𝑐φ 𝑠ψ𝑐φ −𝑠φ𝑐ψ𝑠ψ𝑠θ − 𝑠ψ𝑐θ 𝑠ψ𝑠ψ𝑠θ + 𝑐ψ𝑐θ 𝑐ψ𝑠θ𝑐ψ𝑠φ𝑐θ + 𝑠ψ𝑠θ 𝑠ψ𝑠φ𝑐θ − 𝑐ψ𝑠θ 𝑐φ𝑐θ
] (3-2)
In the formula, 𝑐ψ, 𝑐φ and 𝑐θ are sinusoidal functions of pitch angle, roll angle yaw
angle respectively.
The acceleration of three axes in MPU9250 output s system is named ax_g, ay_g, and
az_g respectively. The sensor outputs Euler angles at the same time to construct the
selection matrix of the system. The pitch angle of the system is AngleYdeg, the roll
angle of the system is AngleXdeg, and the yaw angle of the system is AngleZdeg.

28
Every moment has an angular velocity matrix and a systematic Euler angle matrix from
which the acceleration information of three directions in n system can be extracted for
subsequent processing.
3.7.2 Range of motion algorithm
For the measurement of dorsiflexion and metatarsal flexion of the human ankle joint, it
is necessary to establish an appropriate ankle joint motion model without considering
factors such as muscle contraction and deformation. In addition, the ankle rotation can
also be neglected in the evaluation of the joint activity. Therefore, the human ankle
joint is simplified as shown in Fig 3.15 below. Two-link model. When evaluating the
range of motion of rehabilitation patients, the tibia and sole of the lower leg are
abstracted in one plane. The reference range of dorsiflexion is 20 ~30 and the reference
range of plantar flexion is 40 ~50.
Fig 3.15. A two-link model of human ankle joints
𝑤𝑥 =𝑞1
√1 − 𝑞02𝑤𝑦 =
𝑞2
√1 − 𝑞02𝑤𝑧 =
𝑞3
√1 − 𝑞02
(3-3)
90°
Normal
standing 45°
plantar
flexion
25°
dorsal
flexure

29
Where 𝑞0, 𝑞
1, 𝑞
2, 𝑞
3 is the quaternion calculated by MCU. X type, w, w a y, w z is the
Angle of the three directions in fig 3.16.
Fig 3.16 schematic diagram of rotation Angle
3.7.3 Gait Period
In normal gait, the time from one heel or toe landing to the other heel or toe landing is
called a walking gait cycle. A complete gait cycle is divided into the first touching,
supporting and swinging stages, each stage corresponds to different gait periods. The
reciprocal of the gait cycle is the step frequency. In order to get the step frequency of
rehabilitation patients, it is necessary to divide the acceleration signal into periods.
3.7.4 walking distance
In this system, the step distance is calculated by the kinematics principle. For horizontal
acceleration a_x (t) and a_y (t), if the initial velocity of horizontal motion is 0, then
there are two kinds of acceleration, one is acceleration a_x (t) and the other is
acceleration a_y (t).
α x
x’
y
z z’
y’
β
γ
g
30
𝑥(t) = ∑∑𝑎𝑥(𝑡𝑖)(𝑡𝑖+1) − 𝑡𝑖)
𝑛−1
𝑖=0
𝑛−1
𝑖=0
(3-4)
In the formula, a_x (t) is a function of the acceleration in the direction of X and Y
changing with time, and X (T) is the moving distance in the direction of X.
3.8 Evaluation and conclusion
3.8.1 Plantar pressure distribution measurements
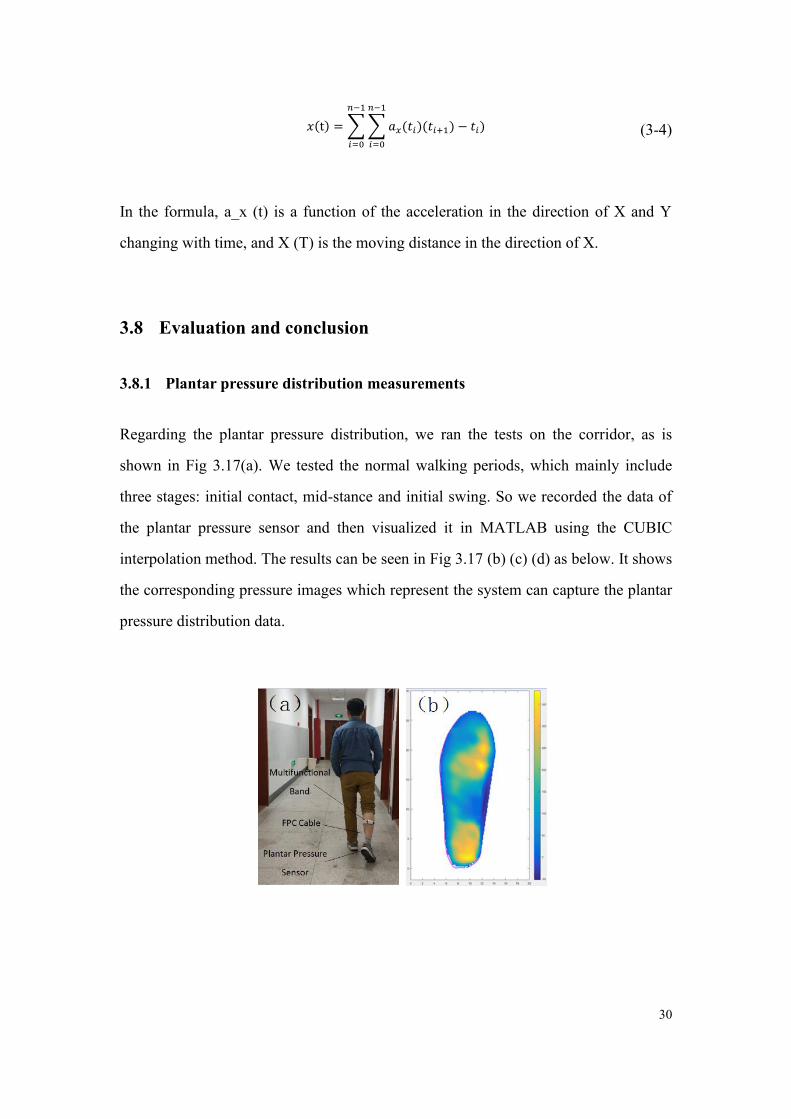
Regarding the plantar pressure distribution, we ran the tests on the corridor, as is
shown in Fig 3.17(a). We tested the normal walking periods, which mainly include
three stages: initial contact, mid-stance and initial swing. So we recorded the data of
the plantar pressure sensor and then visualized it in MATLAB using the CUBIC
interpolation method. The results can be seen in Fig 3.17 (b) (c) (d) as below. It shows
the corresponding pressure images which represent the system can capture the plantar
pressure distribution data.

31
Fig 3.17 Illustration of plantar pressure distribution experiment (b) mid-stance (c) initial swing (d)
initial contact
3.8.2 EMG signal measurement
Experiments on lower limb motion were designed to validate the EMG module of our
system. We tested the motions of normal walking and stamping the ground, and
carbonized foam electrodes were put on the calf muscle and the results are shown in
Fig 3.18. The waveform of EMG signals shows this module can measure whether a
certain muscle or a muscle group is active when a patient does a specific motion.
Fig 3.18 EMG waveforms under: (a) normal walking (b) stamping ground

32
3.8.3 Motion signal measurements
For the test of ankle mobility, we used video information to compare with the
proposed system, as shown in Fig 3.19. We recorded the video of a subject doing
ankle dorsiflexion and plantar flexion, then calculated the ankle mobility on the
computer. From the video, the maximal angle for the subject’s ankle motion is 61.8°,
while the result from our system is 65.2 °, then the error percentage is 5.5%. This
error rate is acceptable because the IMU may have some fluctuation.
Fig 3.19 Screenshots of the video for ankle mobility
3.9 Discussion and Conclusion
In this part, a novel wearable multimode system using soft sensors for lower limb
activity evaluation and rehabilitation systems with flexibility and modularity is
proposed. Patients can get lower limb activity evaluation in home-based scenarios and
rehabilitate with the training plan given by therapists through the Internet using the
proposed system’s software. Compared with the current clinical practice, this
proposed system will reduce the cost of the rehabilitation process and bring
convenience for the patients. Also, the therapists can get access to the rehabilitation
status of different patients using the cloud platform in this system and give a more
efficient training plan.

33
The novel soft carbonized foam electrodes are embedded in the proposed system to
obtain an EMG signal and a novel flexible plantar pressure distribution sensor is also
used in this system. All the sensors and electrodes are all unobtrusive for the patients’
daily life. The multimode design of this system can also make the system suitable for
different patients.
More clinical trials are needed to evaluate the performance of the algorithms, system
endurance, and sensibility under different rehabilitation circumstances. Detailed
analysis and optimized algorithms will be studied based on this system. The system
has some reserve ports for the further development of different sensors, such as
galvanic skin response (GSR) signal. These additional sensors will provide modalities
of monitoring parameters. And data fusion techniques will be explored with more
clinical data. Also,Some self-adaption networks will be used in the algorithms as
well.

34
4 Convolutional Neural Network for Parkinsonian Gait
Recognition and Classification using Surface Electromyography
Parkinson's disease (PD), as a common neurodegenerative disorder, has primary
manifestations like movement poverty, muscle rigidity, gait disturbances, etc.
Recognition of Parkinsonian gait patterns is helpful in the diagnosis of PD and
establishing effective therapies. In this thesis, a Convolutional Neural Network (CNN)
and surface Electromyography (sEMG) based Parkinsonian gait (PG) recognition
system is proposed. Two-channel sEMG signals were obtained from gastrocnemius
muscle and tibial anterior muscle at the shin. Then these signals were passed to CNN
after filtering and time-series segmentation. The system omits the complex
hand-crafted feature extraction process. Meanwhile, two CNN models, namely,
generic model and subject-specific model were built and validated on a dataset that
was collected from eleven volunteers. The accuracy of the proposed system for
distinguishing the Parkinsonian gait from normal or other pathological gaits can reach
90% for the generic model, and 97% for the subject-specific model. With the high
accuracy in identifying the PG, the proposed system can be extended as a promising
aid tool in discriminating PG from normal gait and pathological gaits.
4.1 Introduction
PD is a common neurodegenerative disorder of unknown cause that occurs in adults,
whose clinical hallmarks are movement poverty and slowness, muscle rigidity, limb
tremor or gait disturbances and as called, parkinsonian gait[31]. Although PD is
common in the clinic, it’s still difficult to diagnose, mainly relies on the medical
history, physical examination and signs after dopamine supplementation
treatment[30]. These examinations heavily depend on the experience of doctors, and

35
can not reflect the development of PD and the neuromuscular function in dynamic
activities. Acting as a portrayal of people's physical behavior, gait analysis has been
widely used in rehabilitation treatment, disease prediction and clinical aspects[32].
sEMG is a comprehensive effect of superficial muscle EMG and nerve trunk
electrification on the skin surface, at present, many scholars have begun to use sEMG
to evaluate the neuromuscular status and motor function of PD patients. A.I.Meigal et
al.[33] evaluate a variety of traditional and novel sEMG characteristics of biceps
brachii muscle in patients with PD and compare the results with the healthy old and
young control subjects to evaluate the potential of the parameters in the assessment of
the severity of PD. On the other hand, PD patients always show abnormal gait, so it’s
of great clinical value and social significance to explore the gait characteristics from
sEMG in the dynamic activities of PD patients. Julien Stamatakis et al.[34] proposed
a low-cost Gait feature extraction method for the application of PD, which could
quantify the Gait asymmetry and FOG (Freezing of Gait) more deeply and improve
the accuracy, such study may be beneficial to guide clinical treatment and improve the
diagnostic accuracy of PD.
Traditional gait analysis methods are mainly based on the video, pressure sensors or
large gait simulation platform, while with the improvement of computer power, deep
learning technology, especially CNN has dramatically improved the state of the art in
medical applications. Esmaeilzadeh et al.[35] applied a deep learning framework for
simultaneous classification and regression of Parkinson's disease diagnosis based on
MR-Images and personal information. Wei Yuan et al.[36] proposed a CNN based
gait classification method from mobile phone built-in accelerometer and overall
classification accuracy can reach over 90%. While before training the raw data need
to be transformed into image firstly, which increased the complexity of the method.
36
To our best knowledge, using neural networks without the complex feature extraction
process for the sEMG of PD has seldom been explored.
In this thesis, sEMG and deep learning-based framework for identification of the PD
gait is proposed. Two-channel sEMG signals from gastrocnemius muscle and tibial
anterior muscle were collected and passed to a six-layer CNN after filtering and
time-series segmentation. As a preliminary study to distinguish normal gait, PG and
other pathological gaits, both subject-specific models and generic models were
established and validated. With the help of neural networks, the proposed system
doesn’t require the complex hand-crafted feature extraction process and shows great
potential in clinical assistant diagnosis, illness-early-warning and guardianship
in-home.
4.2 Method
4.2.1 Data acquisition experiment setup
Basic pathological gaits that can be attributed to neurological conditions include
hemiplegic, sensory, neuropathic, spastic diplegic, choreiform, myopathic, ataxic
(cerebellar) and Parkinsonian. In clinical research, besides parkinsonian certain
pathological gait are more likely to encounter, some typical representatives are
neuropathy-related pathological gait like hemiplegic gait, spastic diplegia gait and
steppage gait, and also some other pathological gait like gluteus medius gait and
gluteus maximus gait.
During free ambulation, patients with PD demonstrate shorter stride length and
walking speed while double support duration and cadence rate are increased[37].
They have difficulty starting, but also has difficulty stopping and this is due to muscle

37
hypertonicity. In this study, we established an sEMG based dataset of simulated PG,
in which more than 60 thousand segments sEMG data of natural gait and simulated
pathological gait were collected from 11 subjects. The sEMG data of gaits were
measured by the Shimmer3 EXG unit, which is a small and robust wearable wireless
sensor created by Realtime Technologies Ltd and offers good data quality.
Experiments were conducted on 11 subjects (eight males and three females). To test
the recognition ability of the proposed neural network, besides PG we added
hemiplegia gait, gluteus medius gait, and steppage gait as supplementary. Each
subject was asked to imitate PG and another one kind of pathological gait among
them in addition to normal gait. The height of subjects ranges from 163cm to 191cm
with a mean value of 173.5cm, the weight of subjects ranges from 48kg to 93kg with
a mean value of 65.8kg. Table 4.1 shows the detail information of subjects.
Table 4.1 The Detailed Information of Subjects
No. gender Height(cm) Weight(kg) pathological gait besides
Parkinson
1 male 191 93 hemiplegic gait
2 male 170 70 gluteus medius gait
3 male 168 60 steppage gait
4 male 176 55 hemiplegic gait
5 male 165 62 gluteus medius gait
6 female 168 56 steppage gait
7 male 185 62 gluteus medius gait
8 male 180 82 hemiplegic gait
9 male 174 77 steppage gait
10 female 168 59 gluteus medius gait
11 female 163 48 hemiplegic gait
38
(1) Learn and train to simulate pathological gaits
For the learning of PG and the other three kinds of pathological gaits, every subject was
instructed to watch and study the Stanford Medicine 25 video which was created in
conjunction with Stanford's AIM lab to teach the examination of the gait[38].
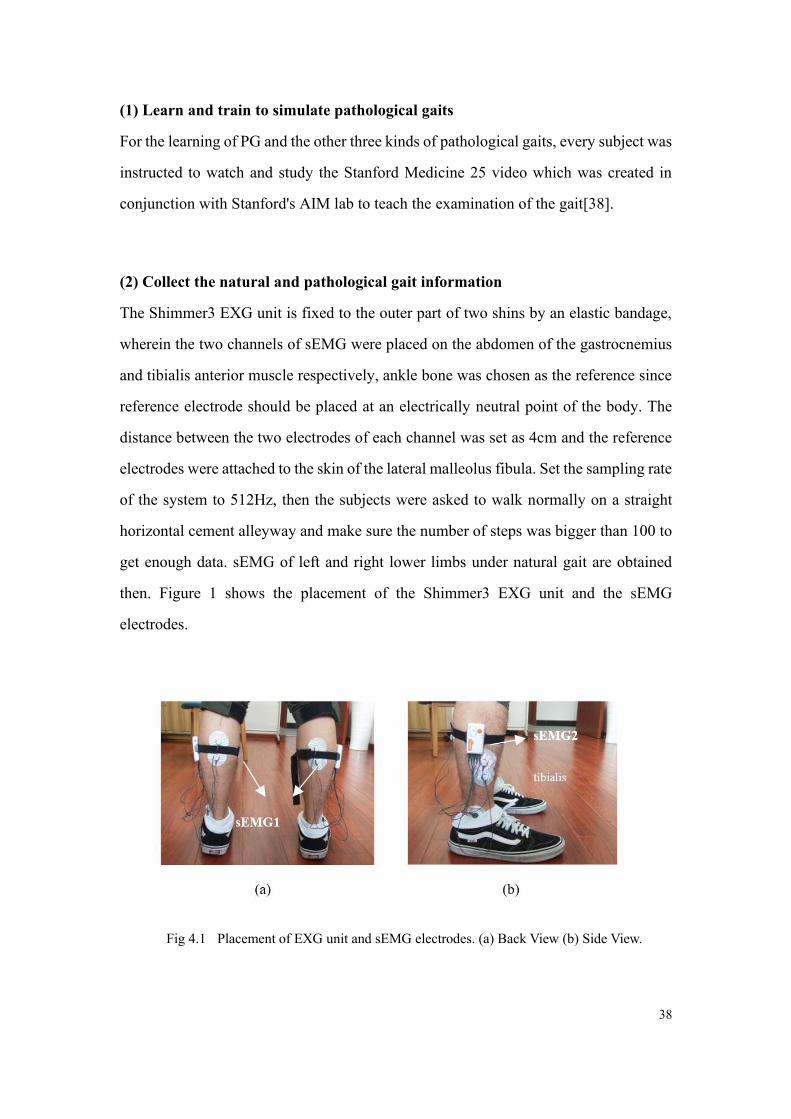
(2) Collect the natural and pathological gait information
The Shimmer3 EXG unit is fixed to the outer part of two shins by an elastic bandage,
wherein the two channels of sEMG were placed on the abdomen of the gastrocnemius
and tibialis anterior muscle respectively, ankle bone was chosen as the reference since
reference electrode should be placed at an electrically neutral point of the body. The
distance between the two electrodes of each channel was set as 4cm and the reference
electrodes were attached to the skin of the lateral malleolus fibula. Set the sampling rate
of the system to 512Hz, then the subjects were asked to walk normally on a straight
horizontal cement alleyway and make sure the number of steps was bigger than 100 to
get enough data. sEMG of left and right lower limbs under natural gait are obtained
then. Figure 1 shows the placement of the Shimmer3 EXG unit and the sEMG
electrodes.
Fig 4.1 Placement of EXG unit and sEMG electrodes. (a) Back View (b) Side View.

39
Fig 4.2 shows the sEMG’s linear envelope of PG and other selected three kinds of
pathological gaits (20s per segment), where we can see a more disorderly pace.
Fig 4.2 The sEMG’s linear envelope of (a) Parkinsonian gait (b) hemiplegic gait (c) gluteus medius
gait (d) steppage gait
4.2.2 Dataset preparation
The ADS1292R chips on the EXG Unit provide a DC-coupled measurement. To
detect when a muscle is active and to give an indication of the overall level of activity
in a particular muscle the linear envelope of EMG signal was extracted. Meanwhile,
since the sensor is very sensitive, many noises are introduced thus may cause the
overfitting of neural network and in view of normal stride frequency of adult range
from 0.5 Hz to 3 Hz roughly, a third-order low-pass Butterworth Filter is designed
and used. The normalized cut-off frequency WN = 2 ∗ fcut−off/fsample was set as
0.02, where 𝑓𝑐𝑢𝑡−𝑜𝑓𝑓 is the raw cut-off frequency and 𝑓𝑠𝑎𝑚𝑝𝑙𝑒 stands for our
sampling rate, 512Hz.

40
We use a sliding sequential segmentation window with 1024 points long (which is,
2000ms in time series under a sampling rate of 512Hz) and 256 points stepping to
segment the waveforms into fragments of 2000ms. Each segment contains
2*1024=2048 points, wherein the 2 here are two channels of sEMG which collected
from the gastrocnemius and tibialis anterior muscle respectively. And all the two
adjacent fragments overlap each other by three quarters after this process. Fig 4.3
shows 5 segments of data each, where (a) is a raw sEMG linear envelope and (b) shows
the filtered signal.
(a) (b)
Fig 4.3 (a) Raw SEMG linear envelope (b) Filtered SEMG linear envelope
Meanwhile, all fragments are labeled according to the gait category to obtain the (data,
label) pair. The labels are set as 0 for the subject’s simulated pathological gait, 1 for
hemiplegic gait and 2 for Parkinson's gait.
4.2.3 Neural network build-up and training
Neural Networks can work as a kind of classification system. Inspired by biological
neural networks of human brains, it’s a framework for many different machine learning
methods rather than an algorithm, and has advantages in processing complex data
inputs. CNNs are a category of Neural Networks that have proven very effective in
areas such as image recognition and classification. CNN was built and trained in this
section to explore its performance in this PG recognition and classification task.
41
(1) Structure
CNNs are a category of Neural Networks that have been proved to be very effective in
image recognition and classification. Lenet is one of the earliest convolutional neural
networks, which promotes the development of deep learning. Yann Lecun's pioneering
work was named lenet5 after many successful iterations. In image recognition tasks the
nearby pixels typically have a strong relationship with each other, and similarly, for our
study, the nearby acceleration readings are likely to be correlated in the given data
fragments. Thus LeNet-like CNN is chosen as the third model to build in this study.
In image recognition tasks the nearby pixels typically have a strong relationship with
each other, and similarly, for our study, the nearby sEMG readings are likely to be
correlated in the given data fragments. Thus LeNet-like CNN is chosen as the model to
build in this study.
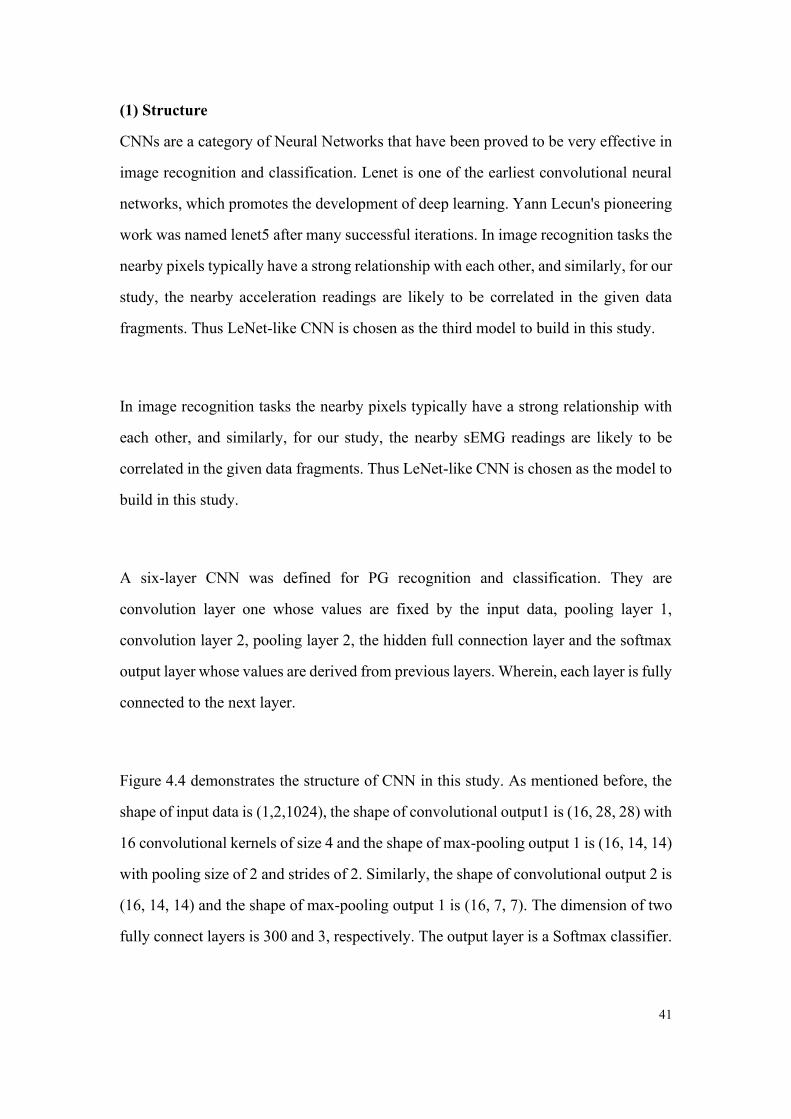
A six-layer CNN was defined for PG recognition and classification. They are
convolution layer one whose values are fixed by the input data, pooling layer 1,
convolution layer 2, pooling layer 2, the hidden full connection layer and the softmax
output layer whose values are derived from previous layers. Wherein, each layer is fully
connected to the next layer.
Figure 4.4 demonstrates the structure of CNN in this study. As mentioned before, the
shape of input data is (1,2,1024), the shape of convolutional output1 is (16, 28, 28) with
16 convolutional kernels of size 4 and the shape of max-pooling output 1 is (16, 14, 14)
with pooling size of 2 and strides of 2. Similarly, the shape of convolutional output 2 is
(16, 14, 14) and the shape of max-pooling output 1 is (16, 7, 7). The dimension of two
fully connect layers is 300 and 3, respectively. The output layer is a Softmax classifier.

42
Fig 4.4 The structure of CNN for PG Recognition and Classification
The activation function of the hidden layer is ReLU (Rectified Linear Unit) to introduce
non-linearity in our net, and its formula is given by (4-1).
f(x) = 𝑚𝑎𝑥(0, x) (4-1)
Other nonlinear functions such as tanh or sigmoid can also be used instead of ReLU,
but ReLU has been found to perform better in these situations.
By using softmax as the activation function, the sum of output probabilities from the
output layer is 1. The softmax function can take a vector of arbitrary real-valued scores
and squashes it to a vector of values between zero and one that sums to one. Here it’s
given by (4-2).
P(y = j|x) = 𝑒𝑥𝑇𝑤𝑗/∑ 𝑒𝑥
𝑇𝑤𝑗
3
𝑘=1 (4-2)
Where 𝑤𝑗(j=0,1,2) here represents the weight vector from the hidden layer to the
output layer.

43
(2) Cost function and optimization algorithm
A cost function is needed to optimize the weights of each node during training. In
multi-classification tasks, mean square error (MSE) is usually used as the basic kind
of cost function. While in the process of training the neural network, we update the
node weights W and node output B by gradient descent algorithm, so we need to
calculate the derivative of the cost function to W and B, but the update may be very
slow in this process. To overcome this cross-entropy cost function is chosen as the
cost function, it’s formula is given by (4-3):
C = −1
𝑛∑[𝑦𝑙𝑛𝑎 + (1 − 𝑦) ln(1 − 𝑎)]
𝑥
(4-3)
Where y is the expected output and a = σ(∑𝑊𝑗 ∗ 𝑋𝑗 + 𝑏) is the actual output of
neurons.
Meanwhile, to prevent overfitting and improve the generalization ability of our neural
network, and L2 regularization was added into the cost function, thus the lost function
becomes (4-4):
L = 𝐶0 +λ2𝑛
∑𝑤𝑗2
𝑤
(4-4)
Where 𝐶0 stands for the former cost function, n is the size of the training set and λ is
the regularization parameter.
The optimization algorithm is set as Adam optimizer that combines the advantages of
both the AdaGrad and RMSProp optimization algorithms. The gradient update formula
is (4-5):

44
𝜃𝑡 = 𝜃𝑡−1 − 𝛼 ∗ 𝑚�̂�/(√𝑣�̂� + ε) (4-5)
Where the default learning rate 𝛼 is set as 0.001, ε = 10−8 just in case the dividend is
zero. 𝑚𝑡 stands for gradient mean:
𝑚𝑡 = 𝛽1𝑚𝑡−1 + (1 − 𝛽1)𝑔𝑡 (4-6)
and 𝑣𝑡 stands for gradient variance (4-7).
𝑚𝑡 = 𝛽1𝑚𝑡−1 + (1 − 𝛽1)𝑔𝑡 (4-7)
Where 𝛽1,𝛽2 is exponential attenuation rate, 𝑔𝑡 is the gradient at time t.
4.2.4 Training Process
The training of neural networks we built in this study follows the typical process and
weight updating rules. To take a general exposition the pseudo-code for the PG
recognition CNN model is described in Algorithm 4.1 below.
Algorithm 4.1: CNN for Parkinsonian Gait recognition and classification
Input: Labeled train dataset D = {(( 𝑥𝑖 , 𝑦𝑖 , 𝑧𝑖 ), 𝐿𝑖 )}, an unlabeled dataset
D(unlabeled) = {(𝑥𝑖, 𝑦𝑖 , 𝑧𝑖)}
Output: gait type Labels 𝐿𝑝𝑟𝑒 of the unlabeled data
Initialization
random assignment weights and biases of the network
Repeat
Forward Propagation:
For each Labeled train data of sEMG from D:

45
do
• Calculate Output of Hidden Layer and Output Layer
• Calculate the deviation between the output layer and the expected output
end
• Use softmax to do classification and update
the weight of each edge in the network
Backward Propagation:
• Conduct backward propagation
Until 𝑤𝑖 convergences or training epochs meet n;
Use the trained network to predict the labels
4.3 Results
After preprocessing of the acquired sEMG, we get a labeled dataset
D{( )( )iii LSEMG ,2,SEMG1 }(Li =0,1,2) of 5 types of gait with more than 60 thousand
segments. After the shuffle, the dataset was grouped into the training set and the test
set with a ration of 0.7. The training set was used to train the model and the test set
was used to verify the classification effect of the model when the train finished.
4.3.1 Generic model
In the generic model, CNN is established for a three-class classification task (normal
gait, Parkinsonian gait, and other pathological gaits). The node counts of hidden fully
connect layer were set as 300, the learning rate was 0.0001 and batch size, which is
the number of training samples in each batch, was set as 128. Fig 4.5 shows the
confusion matrix and ROC of PG recognition of the model after 24 epochs of training.
Where the Precision P = TP/(TP+FP) is the proportion of real positive samples in the

46
positive samples judged by the classifier, the Recall R = TP/(TP+FN) is the
proportion of the true judged positive cases in all positive cases.
Fig 4.5 The confusion matrix and ROC after 24 epochs of training
ROC (receiver operating characteristic curve) and confusion matrix are used to
evaluate the performance of the proposed system. ROC can identify the ability of PG
recognition at any threshold value. Confusion matrix, also known as error matrix, is a
standard format for accuracy evaluation. From the confusion matrix of the 24th epoch,
we can observe that for the PG recognition task, the precision of recognizing different
types of gait is 0.98, 0.74 and 0.88 respectively, where the precision is the proportion
of real positive samples in the positive samples judged by the classifier. We can
calculate the recall value from the matrix as well, which is 0.77, 0.98 and 0.85
respectively, where the recall is the proportion of the true judged positive cases in all
positive cases. For PG the recall value is 0.98, far bigger than its precision, this is
promising because in practical use scenarios we hope the model can recognize the
disease as much as possible, even if the false alarm occurs.
By applying the generic model on the test set, the accuracy can achieve 0.9008. For a
generalization model, the result is quite promising and exhibits the feasibility of the
proposed system for the PG recognition.

47
4.3.2 Subject-specific model
To take the individual variability into consideration and to obtain a personalized
model for each subject, subject-specific models were obtained. The setting of all
parameters remains unchanged. Fig 4.6 shows the confusion matrix and ROC of one
of our subjects after 20 epochs of training.
Fig 4.6 The confusion matrix and ROC of subject No.3 after training
Where label 0 stands for NG and 1 stands for PG. We can observe a higher accuracy
of 100% for NG and 0.98 for PG. Table 4.1 shows the accuracy score after the
training for each subject after training. The accuracy score fluctuates between 0.8361
and 0.9737 with an average value of 0.9282.
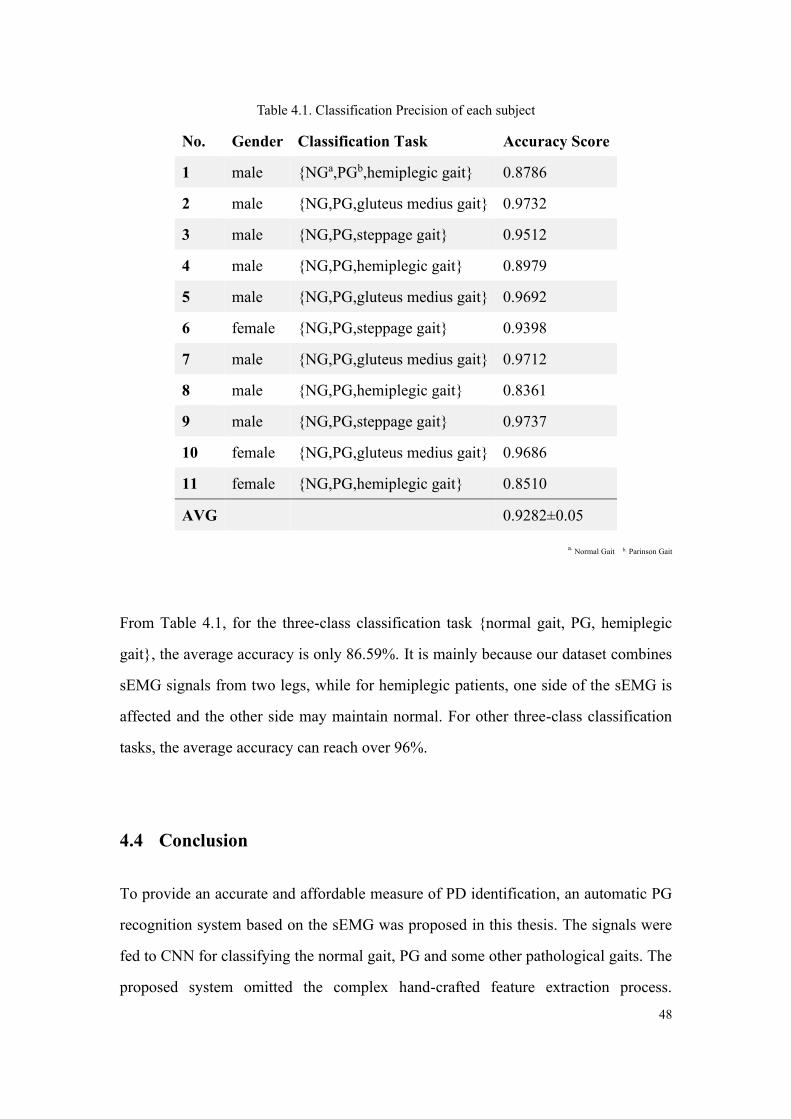
48
Table 4.1. Classification Precision of each subject
No. Gender Classification Task Accuracy Score
1 male {NGa,PGb,hemiplegic gait} 0.8786
2 male {NG,PG,gluteus medius gait} 0.9732
3 male {NG,PG,steppage gait} 0.9512
4 male {NG,PG,hemiplegic gait} 0.8979
5 male {NG,PG,gluteus medius gait} 0.9692
6 female {NG,PG,steppage gait} 0.9398
7 male {NG,PG,gluteus medius gait} 0.9712
8 male {NG,PG,hemiplegic gait} 0.8361
9 male {NG,PG,steppage gait} 0.9737
10 female {NG,PG,gluteus medius gait} 0.9686
11 female {NG,PG,hemiplegic gait} 0.8510
AVG 0.9282±0.05
a. Normal Gait b. Parinson Gait
From Table 4.1, for the three-class classification task {normal gait, PG, hemiplegic
gait}, the average accuracy is only 86.59%. It is mainly because our dataset combines
sEMG signals from two legs, while for hemiplegic patients, one side of the sEMG is
affected and the other side may maintain normal. For other three-class classification
tasks, the average accuracy can reach over 96%.
4.4 Conclusion
To provide an accurate and affordable measure of PD identification, an automatic PG
recognition system based on the sEMG was proposed in this thesis. The signals were
fed to CNN for classifying the normal gait, PG and some other pathological gaits. The
proposed system omitted the complex hand-crafted feature extraction process.

49
Experimental results demonstrate the effectiveness of the proposed approach in
automatic PG gait recognition. The accuracy of the proposed CNN can reach 90% for
all the subjects' generic models and 97% for the subject-specific model. Meanwhile,
the results showed that the network works better when trained for a specific subject,
which is of great significance in tracking patients' disease stages. To our best
knowledge, this is the first work that combines sEMG with CNN for recognition of
PG. In the future, larger datasets will be collected in the cooperated hospital to further
validate the robustness of the proposed system. Some data fusion technologies like
camera + sEMG based PG analysis are also worth pursuing.
50
5 Neural Networks for Pathological Gait Classification Using
Wearable Motion
Gait, as an essential feature reflecting human health status, has attracted extensive
attention in research. Automatic pathological gait identification can contribute to
disease diagnosis and intervention. In this thesis, an unobtrusive sensing technology
with deep learning methods to discriminate healthy and pathological gaits is proposed.
Two accelerometers are mounted on the left and right lower limbs to acquire the
motion signals. Based on these signals, three Neural Networks, namely, BPNN (Back
Propagation Neural Network), LSTM (Long Short Term Memory) and CNN
(Convolutional Neural Networks) are proposed for classifying the gaits. Experimental
results exhibit that the accuracy of the proposed method can reach 86%, 81%, and 93%
on a database of 15 participants while using BPNN, LSTM, CNN, respectively. With
the strong ability of spatial-temporal signal analysis, CNN outperforms the other two
neural networks and provides a favorable result. The proposed method can be
extended to an automated gait classification tool, which can be used in the diagnosis
and identification of pathological gaits.
5.1 Introduction
Gait, as the manner of walking, is an idiosyncratic feature of a person. In general,
gaits can be classified into normal gait and pathological gaits. The pathological gaits
may mainly cause due to hemiplegia, Parkinson's disease, myopathy, and pain. It
includes typically gaits, namely, hemiplegic gait, Parkinson gait, gluteus medius gait,
steppage gait and so on[39]. Identification of normal/pathological gaits could provide
deep insights to understand various human movement patterns across different gait
pathologies. It has been proven that gait analysis has a guiding role both in clinical
51
research and guardianship in-home[40]. However, traditional gait assessment is
mainly based on clinical observations. It is a subjective and time-consuming
decision-making process for clinicians. To address these issues, automatic methods to
discriminate between normal and pathological gaits have been attracted widespread
attention.
With the benefits of precise, stable and affordable sensors, various motion
sensor-based gait classification methods have been presented. Dolatabadi et al.[41]
integrated machine learning methods to discriminate between healthy and
pathological gait patterns using the Kinect motion sensor. Gait features are extracted
and k-nearest neighbor and a dynamical generative classifier are used. Murad et al.[42]
classified pathological gait patterns using 3D ground reaction force (GRFs) data, the
GRFs parameters and the discrete wavelet transform (DWT) were used to extract the
gait features and nearest neighbor classifier (NNC) and artificial neural networks
(ANN) were investigated for the classification of gait features, the result shows the
optimal feature set of six features enhanced the accuracy to 95%. In the existing
works, by combining the sensor technology and traditional machine learning
algorithms, gait classification can achieve high performance in pathological gait
classification tasks. However, hand-crafted features are required to be extracted
before the classification.
Nowadays, deep neural networks have shown great potential in feature extraction and
become a research hotspot. Neural networks have shown their ability in gait
authentication[36] and activity recognition[43]. To our best knowledge, using neural
networks without the complex feature extraction process for the pathological gait
classification has never been explored. With the hypothesis that gait patterns could be
captured and compartmentalized via combining motion sensors with neural networks, a
novel method is proposed. In this thesis, two wearable motion sensors are used to

52
acquire the motion signals and ANNs (BPNN, LSTM, and CNN) based pathological
gait classifiers are used to identify different gaits. The proposed method omits the
complex sensor set-up process and hand-crafted feature extraction process. On the
contrary, with the ability to act as feature extractors, the proposed method can learn
multiple layers of feature hierarchies and realize the classification automatically.
5.2 Method
5.2.1 Data acquisition experiment setup
In clinical research certain pathological gait are more likely to encounter, they are
hemiplegic gait, steppage gait, parkinsonian gait, and gluteus medius gait. For this
study, we established a dataset of pathological gait, in which more than 100 thousand
segments motion data of natural gait and five simulated pathological gaits were
collected. The gait data were measured by Shimmer 3 IMU unit which is a small
wearable wireless sensor and can offers data with integrated 9DoF inertial sensing.
Experiments were conducted on 15 subjects and among them 3 are female. The height
of subjects ranges from 163cm to 191cm with a mean value of 172.47cm and the
weight range from 48kg to 93kg with a mean value of 65.8kg. The steps of the
experiment to obtain the needed data are presented below.
(1) Collect motion data of natural gait
The Shimmer 3 IMU unit is fixed to the outer part of two shins by an elastic bandage,
wherein the Y-axis of IMU is set perpendicular to the horizontal plane, the X-axis is
perpendicular to the human coronal plane, and the Z-axis is perpendicular to the sagittal
plane of the human body. We set the sampling rate of the system to 512Hz and set the
IMU’s accelerometer sensitivity to ±2g, then the subjects were asked to walk naturally

53
on a straight horizontal cement alleyway and make sure the number of steps was bigger
than 100 to get enough data. The triaxial acceleration information of the left and right
lower limbs under natural gait is obtained then. Fig 5.1(a) shows the placement of
Shimmer 3 and Fig 5.1(b) shows the scene of the experiment during subject walking.
(a) (b)
Fig 5.1 (a) The placement of Shimmer 3 IMU unit; (b) The walking scene.
(2) Learn to simulate five pathological gaits
Since in this study we only use the motion sensor, it’s promising to just simulate those
pathological gaits instead of collect clinical data to verify the model. For learning those
pathological gaits, each subject was instructed to watch and study the Stanford
Medicine 25 video which was created in conjunction with Stanford's AIM lab to teach
the examination of the gait[38].
(3) Collect pathological gait information
The placement of the IMU and data acquisition process is the same as step 1. Five
typical pathological gaits were selected, they are hemiplegia gait, Parkinson gait,
gluteus medius gait, steppage gait and diplegia gait (scissor gait).
IMU2
IMU1

54
Fig 5.2 (a) natural gait (b) hemiplegic gait (c) Parkinson gait (d) gluteus medius gait (e) steppage
gait (f) diplegia gait.
Fig 5.2 shows the original triaxial acceleration data of the natural gait and five
pathological gaits (10s per segment), from which we can observe a lower stride
frequency and disorderly pace.
5.2.2 Data preprocessing and dataset preparation
Since the IMU is very sensitive, the obtained motion signals are contaminated with
noise that may cause the overfitting of neural networks. To reduce this side effect and
since normal stride frequency of adults ranges from 0.5 Hz to 3 Hz roughly[44], a
third-order low-pass Butterworth Filter is designed and used. The normalized cut-off

55
frequency 𝑊𝑁 = 2 ∗ 𝑓𝑐𝑢𝑡−𝑜𝑓𝑓/𝑓𝑠𝑎𝑚𝑝𝑙𝑒 was set as 0.1, where 𝑓𝑐𝑢𝑡−𝑜𝑓𝑓 is raw cut-off
frequency and 𝑓𝑠𝑎𝑚𝑝𝑙𝑒 stands for our sampling rate, 512Hz.
Then the filtered IMU data is normalized into [-1,1] with zero mean to reduce
individual variability. We use a sliding sequential segmentation window with 1024
points long (which is, 2000ms in time under a sampling rate of 512Hz) and 256 points
stepping to segment the waveforms into fragments of 2000ms. Each segment contains
3*1024=3072 points where 3 represents the x, y, and z-axis’ triaxial acceleration
information. Meanwhile, all fragments are labeled according to the gait category to
obtain the (data, label) pair.
5.2.3 Neural network build-up and training
Inspired by biological neural networks of human brains, Artificial Neural Network
(ANN) is able to recognize patterns and learn features from input data without
extensive data preprocessing, handcrafted rules or feature engineering[45], which
makes them particularly well suitable for classifying our motion data of gait. To
explore a suitable neural network for this Pathological Gait Classification task, we start
from the most basic one – back propagation neural network. On the other hand in view
of our input data is in time series and RNN is quite good at processing sequential data,
we built an RNN to evaluate its classification performance. We also evaluate CNN
cause lately, it has dramatically improved the state of the art in medical applications in
recent years.
(1) BPNN (backpropagation neural network)
We build up a three-layer BPNN in this part. It’s the most basic neural network, whose
output results are propagated forward and the error is propagated backward, simple and
efficient. The layers are the input layer, hidden layer, and output layer. In our study, the

56
number of nodes in the input layer was set according to the points in each data
fragments, which is 3072 (3 axes * 2000ms * 512Hz). The number of output layer
nodes is 6 since we have 6 types of gaits in all. Fig 5.3 shows the structure of our
BPNN.
Fig 5.3 The structure of constructed three-layer BPNN
The activation function of the hidden layer is ReLU (Rectified Linear Unit) to introduce
non-linearity in our net, and its formula is given by (5-1).
f(x) = max(0, x) (5-1))
Other non-linear functions such as tanh or sigmoid can also be used instead of ReLU,
but ReLU has been found to perform better in this situation.
The sum of output probabilities from the output layer is 1. This is ensured by using the
softmax as the activation function in the output layer and the function is given by (5-2).
P(y = j|x) = 𝑒𝑥𝑇𝑤𝑗/∑ 𝑒𝑥
𝑇𝑤𝑗
6
𝑘=1 (5-2)
Where 𝑤𝑗(j=0:5) is the weight vector from the hidden layer to the output layer.
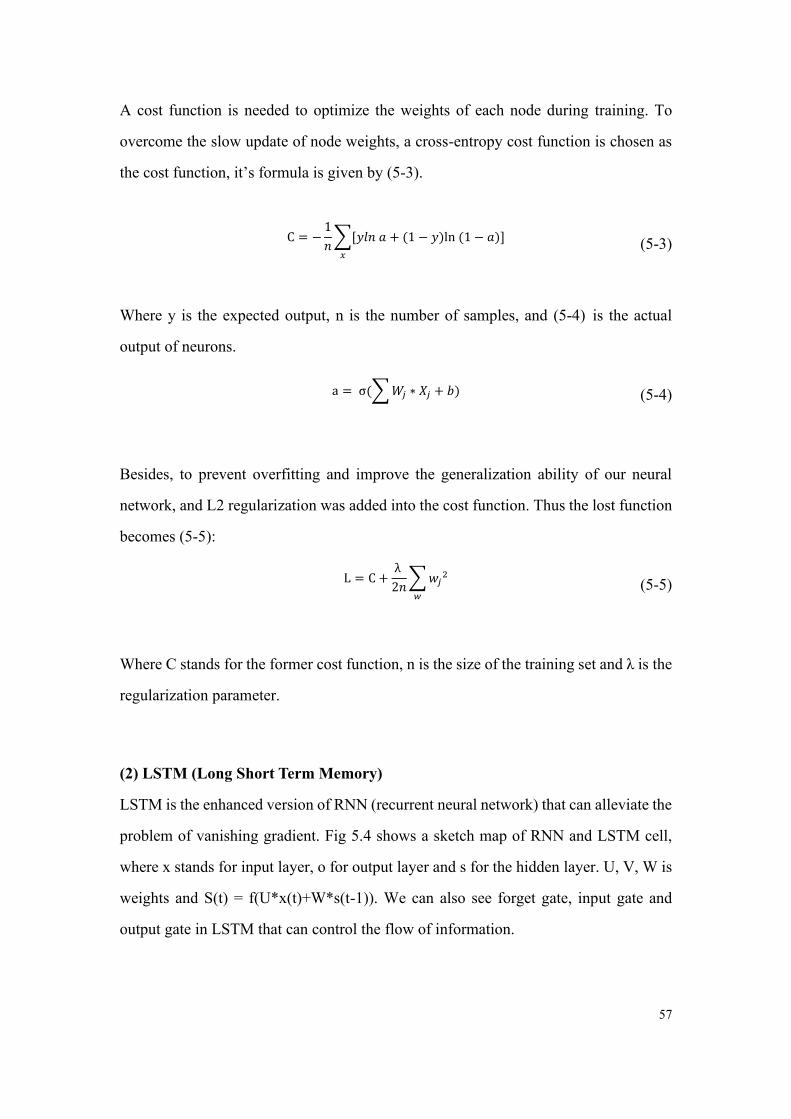
57
A cost function is needed to optimize the weights of each node during training. To
overcome the slow update of node weights, a cross-entropy cost function is chosen as
the cost function, it’s formula is given by (5-3).
C = −1
𝑛∑[𝑦𝑙𝑛𝑎 + (1 − 𝑦)ln(1 − 𝑎)]
𝑥
(5-3)
Where y is the expected output, n is the number of samples, and (5-4) is the actual
output of neurons.
a = σ(∑𝑊𝑗 ∗ 𝑋𝑗 + 𝑏) (5-4)
Besides, to prevent overfitting and improve the generalization ability of our neural
network, and L2 regularization was added into the cost function. Thus the lost function
becomes (5-5):
L = C +λ
2𝑛∑𝑤𝑗
2
𝑤
(5-5)
Where C stands for the former cost function, n is the size of the training set and λ is the
regularization parameter.
(2) LSTM (Long Short Term Memory)
LSTM is the enhanced version of RNN (recurrent neural network) that can alleviate the
problem of vanishing gradient. Fig 5.4 shows a sketch map of RNN and LSTM cell,
where x stands for input layer, o for output layer and s for the hidden layer. U, V, W is
weights and S(t) = f(U*x(t)+W*s(t-1)). We can also see forget gate, input gate and
output gate in LSTM that can control the flow of information.
58
Fig 5.4 The sketch map of RNN (left) and LSTM Cell
In view of the original data of our system is time-series waveform, while the calculation
results of each hidden layer in LSTM are related to the current input and the last hidden
layer results, we built an LSTM based neural network to classify them. Tensorflow and
Keras are used to build our model. The shape of the input array is (3,1024) and the set of
the cost function is the same as BPNN.
(3) CNN (Convolutional Neural Networks)
CNNs are a category of Neural Networks that have proven very effective in areas such
as classification and image recognition. In image recognition tasks, the nearby pixels
typically have a strong relationship with each other, and our data is similar to this
situation where the nearby acceleration readings are likely to be correlated in the given
data fragments. Thus CNN is chosen as the third model to build in this study. A
six-layer CNN was defined for pathological gait classification. The layers are
convolution layer 1 whose values are fixed by the input data, pooling layer 1,
convolution layer 2, pooling layer 2, the hidden full connection layer and the softmax
output layer whose values are derived from previous layers. Wherein, each layer is fully
connected to the next layer.
Fig 5.5 demonstrates the structure of CNN in this study. As mentioned before, the shape
of input data is (1,3,1024), the shape of convolutional output 1 is (32, 28, 28) with 32

59
convolutional kernels of size 5 and the shape of max-pooling output 1 is (32, 14, 14)
with pooling size of 2 and strides of 2. Similarly, the shape of convolutional output 2 is
(64, 14, 14) and the shape of max-pooling output 2 is (64, 7, 7). The dimension of two
fully connect layers is 1024 and 6, respectively. The output layer is a softmax classifier.
Fig 5.5 The structure of CNN for Pathological Gait Classification
Besides the use of ReLU and softmax like BPNN, the optimization algorithm is set as
Adam optimizer that combines the advantages of both the AdaGrad and RMSProp
optimization algorithms. The gradient update formula is (5-6):
𝜃𝑡 = 𝜃𝑡−1 − 𝛼 ∗ 𝑚�̂�/(√𝑣�̂� + ε) (5-6)
Where the default learning rate 𝛼 is set as 0.001, ε = 10−8 just in case the dividend is
zero. 𝑚𝑡 stands for gradient mean:
𝑚𝑡 = 𝛽1𝑚𝑡−1 + (1 − 𝛽1)𝑔𝑡 (5-7)
and 𝑣𝑡 stands for gradient variance (5-8):
𝑣𝑡 = 𝛽2𝑣𝑡−1 + (1 − 𝛽2)𝑔𝑡 (5-8)

60
Where 𝛽1,𝛽2 is exponential attenuation rate, 𝑔𝑡 is the gradient at time t.
5.2.4 Training Process
The training of all neural networks in this study follows the same process and weight
updating rules. To take a general exposition the pseudo-code for our net is proposed.
Algorithm5.1: ANN for pathological gait classification
Input: Labeled train dataset D = {((𝑥𝑖 , 𝑦𝑖 , 𝑧𝑖), 𝐿𝑖 )},
an unlabeled dataset D(unlabeled) = {(𝑥𝑖 , 𝑦𝑖, 𝑧𝑖)}
Output: gait type Labels 𝐿𝑝𝑟𝑒 of the unlabeled data
Initialization
random assignment weights and biases of network
Repeat
Forward Propagation:
For each Labeled train data of tri-axises from D:
do
• Calculate the output of the hidden and output layer
• Calculate the deviation between the output layer and the expected
output
end
• Use softmax to do classification and update
the weight of each edge in the network
Backward Propagation:
• Conduct backward propagation
Until 𝑤𝑖 convergences or training epochs meet n;
Use the trained network to predict the labels

61
5.3 Results
After preprocessing of the acquired data, we get a labeled motion dataset D
{((𝑥𝑖, 𝑦𝑖 , 𝑧𝑖), 𝐿𝑖 )} of pathological gait with more than 100 thousand segments. After
shuffling, the dataset was split into a training set and test set with a ratio of 0.64. The
training set was used to train the model and the test set was used to verify the model
when the train finished.
Table 5.1 shows the accuracy of the test for each type of gait and neural network. For
BPNN, the hidden layer node was set as 512, the learning rate was 0.003 and batch
size, which is the number of training samples in each batch, was set as 200. For
LSTM, the learning rate was 0.002 and batch size was set as 128, time steps were set
as 5 and neurons in the hidden layer was 128. For CNN, the learning rate was 0.0001
and batch size was set as 128.
Table 5.1 Classification Accuracy of BPNN, LSTM, CNN
Classifier type BPNN LSTM CNN
Hemiplegic gait 96.52% 80.5% 97%
Parkinson gait 70.01% 75.8% 90%
Natural gait 93.51% 83.4% 90%
Gluteus medius gait 98.56% 86.2% 93%
Steppage gait 86.42% 83.3% 93%
Diplegia gait 75.47% 79.2% 95%
Overall Accuracy 86.75% 81.4% 93%
From Table Ⅰ we can observe that for this pathological gait classification task, the
precision of CNN are higher than other ANNs, and can reach 93% in four types of
gait, which is quite a good performance and proved the great potential of neural
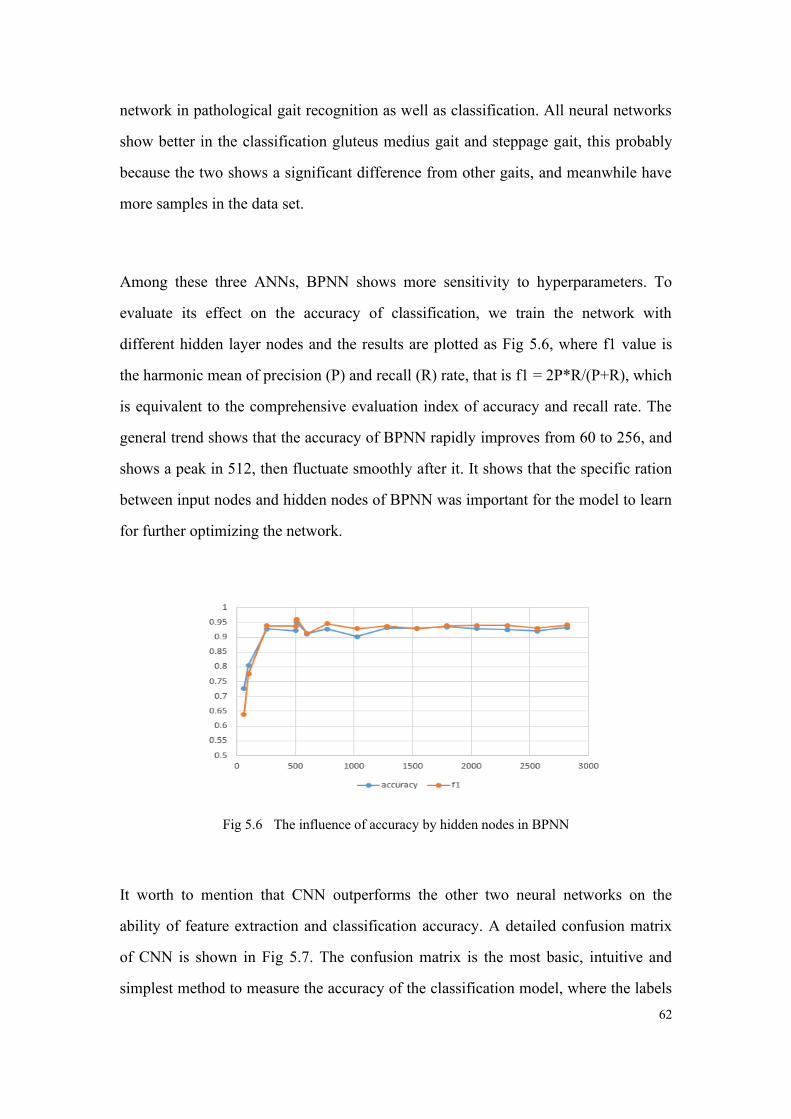
62
network in pathological gait recognition as well as classification. All neural networks
show better in the classification gluteus medius gait and steppage gait, this probably
because the two shows a significant difference from other gaits, and meanwhile have
more samples in the data set.
Among these three ANNs, BPNN shows more sensitivity to hyperparameters. To
evaluate its effect on the accuracy of classification, we train the network with
different hidden layer nodes and the results are plotted as Fig 5.6, where f1 value is
the harmonic mean of precision (P) and recall (R) rate, that is f1 = 2P*R/(P+R), which
is equivalent to the comprehensive evaluation index of accuracy and recall rate. The
general trend shows that the accuracy of BPNN rapidly improves from 60 to 256, and
shows a peak in 512, then fluctuate smoothly after it. It shows that the specific ration
between input nodes and hidden nodes of BPNN was important for the model to learn
for further optimizing the network.
Fig 5.6 The influence of accuracy by hidden nodes in BPNN
It worth to mention that CNN outperforms the other two neural networks on the
ability of feature extraction and classification accuracy. A detailed confusion matrix
of CNN is shown in Fig 5.7. The confusion matrix is the most basic, intuitive and
simplest method to measure the accuracy of the classification model, where the labels
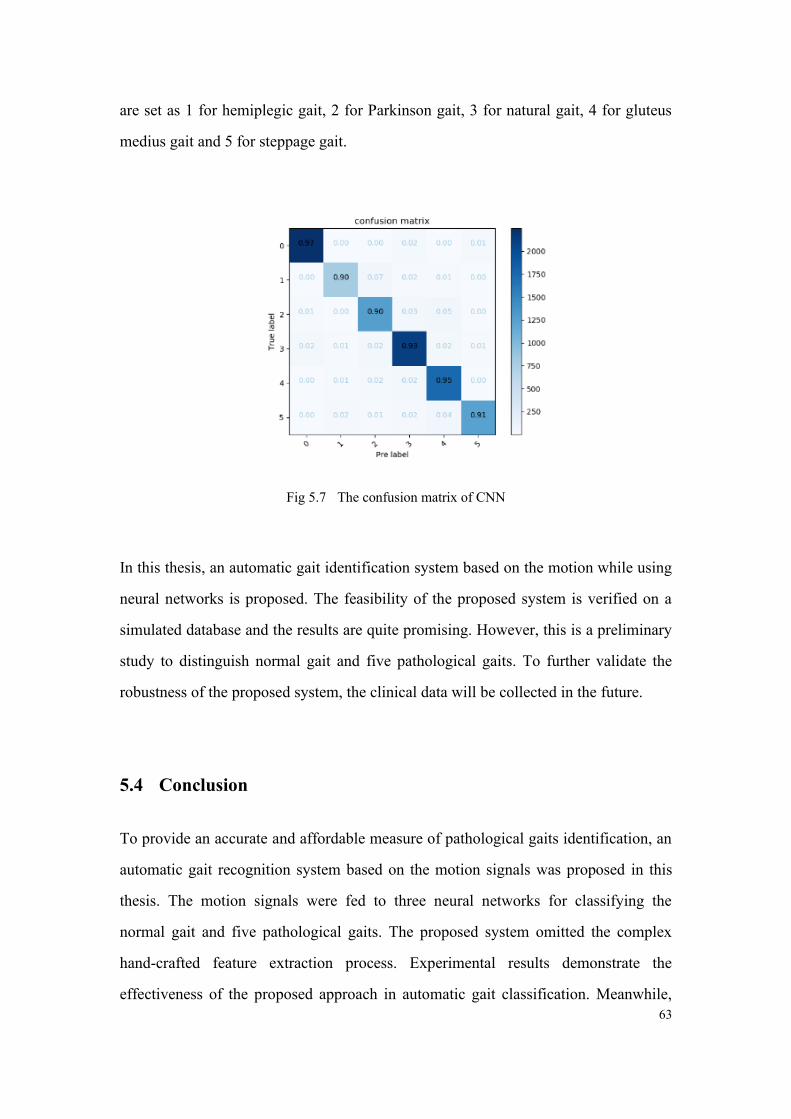
63
are set as 1 for hemiplegic gait, 2 for Parkinson gait, 3 for natural gait, 4 for gluteus
medius gait and 5 for steppage gait.
Fig 5.7 The confusion matrix of CNN
In this thesis, an automatic gait identification system based on the motion while using
neural networks is proposed. The feasibility of the proposed system is verified on a
simulated database and the results are quite promising. However, this is a preliminary
study to distinguish normal gait and five pathological gaits. To further validate the
robustness of the proposed system, the clinical data will be collected in the future.
5.4 Conclusion
To provide an accurate and affordable measure of pathological gaits identification, an
automatic gait recognition system based on the motion signals was proposed in this
thesis. The motion signals were fed to three neural networks for classifying the
normal gait and five pathological gaits. The proposed system omitted the complex
hand-crafted feature extraction process. Experimental results demonstrate the
effectiveness of the proposed approach in automatic gait classification. Meanwhile,
64
the results showed that CNN can achieve better performance in comparison with
BPNN and LSTM, which mainly due to the excellent feature extraction capability
with the help of convolution kernels. To our best knowledge, this is the first work that
involves five pathological modalities and provides the comparison and verification of
three neural networks. In the future, larger datasets will be collected in the cooperated
hospital to further validate the robustness of the proposed system. Some data fusion
technologies like IMU+sEMG based pathological gait classifiers are also worth
pursuing.

65
6 Skeleton Keypoints detection for abnormal gait recognition
Human Keypoint Detection, also known as human posture recognition, aims to locate
the position of human joints in the image accurately. As one of the indispensable hot
research fields of computer vision, human posture recognition has a large number of
landing scenes and broad application prospects. The existing and promising scenarios
can be widely used in human gait recognition, rehabilitation training, somatosensory
games, augmented reality, etc. Enabled in games, mobile phones, medical care,
education, and other fields.
In this part, we exploring unmarked gait information extraction technology of lower
limbs for gait analysis. A key point detection system based on the state of the art was
used. Clinical data of a patient with abnormal gait was collected in Huashan Hospital,
Shanghai. 18 key points of the patient while walking were calculated with a trained
neural network. We plot the calculated points in a time domain and then the wave was
compared with IMU data. The results show currently deep neural network-based key
points detection model is not good enough for abnormal gait recognition. The proposed
method omits the complex sensor set-up process and hand-crafted feature extraction
process. And, with the ability to act as feature extractors, the proposed method can learn
multiple layers of feature hierarchies and realize the classification automatically.
6.1 Methods
6.1.1 Data acquisition experiment setup
In clinical research certain pathological gait are more likely to encounter like
hemiplegic gait, parkinsonian gait, etc. For this study, 12 patients with abnormal gait
were recruited. Detailed information can be seen in Table 6.1.
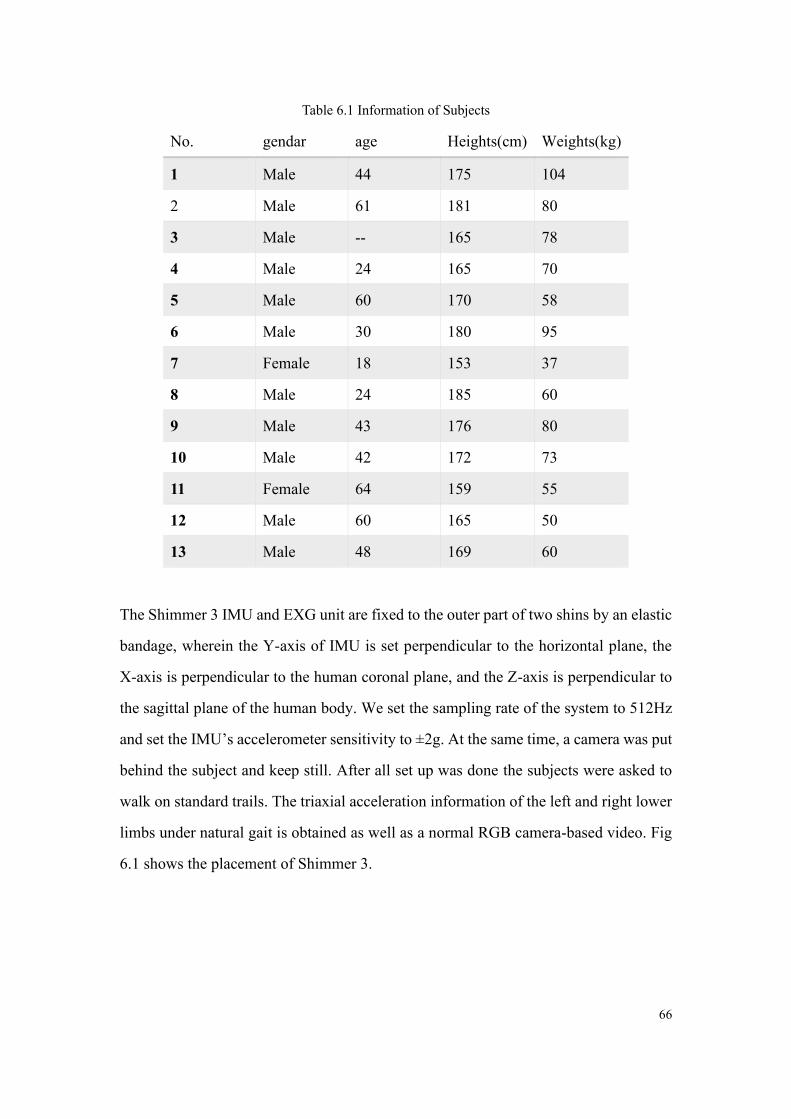
66
Table 6.1 Information of Subjects
No. gendar age Heights(cm) Weights(kg)
1 Male 44 175 104
2 Male 61 181 80
3 Male -- 165 78
4 Male 24 165 70
5 Male 60 170 58
6 Male 30 180 95
7 Female 18 153 37
8 Male 24 185 60
9 Male 43 176 80
10 Male 42 172 73
11 Female 64 159 55
12 Male 60 165 50
13 Male 48 169 60
The Shimmer 3 IMU and EXG unit are fixed to the outer part of two shins by an elastic
bandage, wherein the Y-axis of IMU is set perpendicular to the horizontal plane, the
X-axis is perpendicular to the human coronal plane, and the Z-axis is perpendicular to
the sagittal plane of the human body. We set the sampling rate of the system to 512Hz
and set the IMU’s accelerometer sensitivity to ±2g. At the same time, a camera was put
behind the subject and keep still. After all set up was done the subjects were asked to
walk on standard trails. The triaxial acceleration information of the left and right lower
limbs under natural gait is obtained as well as a normal RGB camera-based video. Fig
6.1 shows the placement of Shimmer 3.
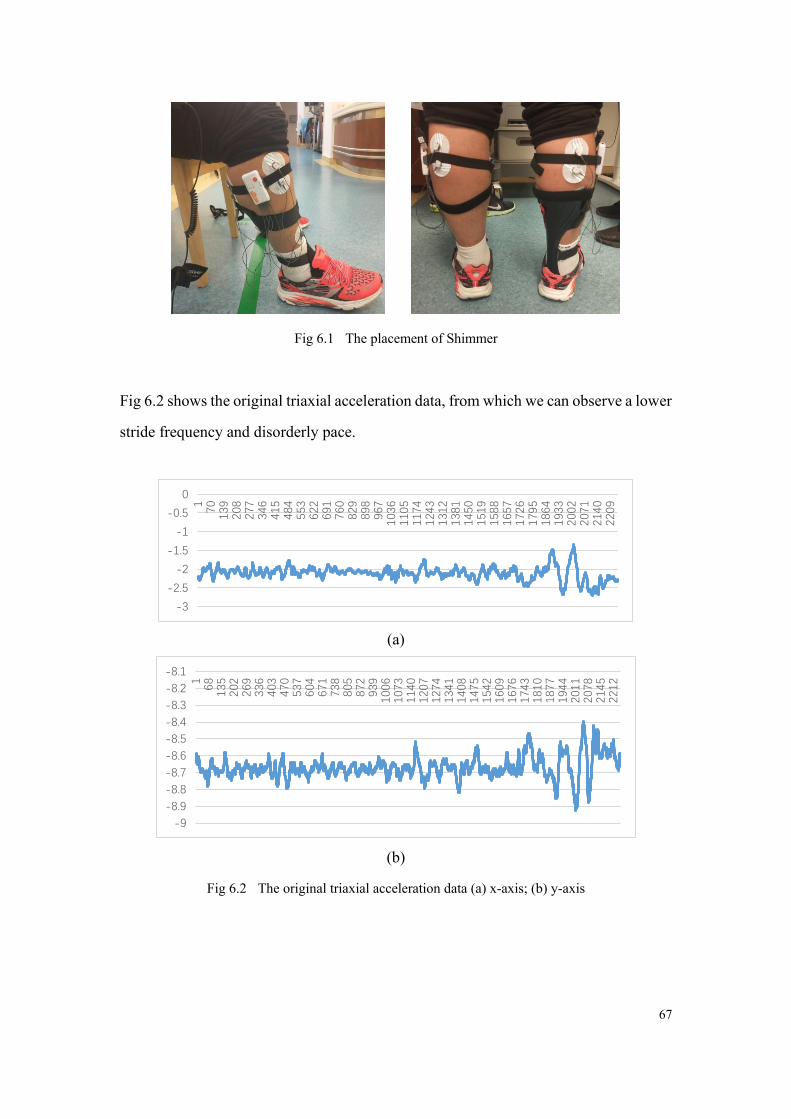
67
Fig 6.1 The placement of Shimmer
Fig 6.2 shows the original triaxial acceleration data, from which we can observe a lower
stride frequency and disorderly pace.
(a)
(b)
Fig 6.2 The original triaxial acceleration data (a) x-axis; (b) y-axis
-3
-2.5
-2
-1.5
-1
-0.5
0
170
139
208
277
346
415
484
553
622
691
760
829
898
967
103
6110
5117
4124
3131
2138
1145
0151
9158
8165
7172
6179
5186
4193
3200
2207
1214
0220
9
-9
-8.9
-8.8
-8.7
-8.6
-8.5
-8.4
-8.3
-8.2
-8.1
168
135
202
269
336
403
470
537
604
671
738
805
872
939
100
6107
3114
0120
7127
4134
1140
8147
5154
2160
9167
6174
3181
0187
7194
4201
1207
8214
5221
2

68
6.1.2 Human Keypoints detection
For human keypoint detection, the champion algorithm of coco2018 was reproduced
and used. There are two main ways of human gesture recognition: single-stage and
multi-stage. Although the latter is more suitable for the task from rough to fine logic, it
seems that the performance is not superior to the single-stage method.
After the emergence of deep convolution network, human pose recognition has
developed rapidly. At present, the network structure of the optimal method[46], [47] is
relatively simple, mostly using single-stage network design, such as the 2007 COCO
Keypoint Challenge Championship method[46] using ResNet-Inception-based network
structure, and the latest Simple Baseline[47] using ResNet network structure. Another
network structure is a multi-stage network design, that is, a lightweight network as a
unified network, and then simply stack it into multi-stage.
They believe that the poor performance of the multi-stage method is mainly due to a
variety of unreasonable designs. Their work starts with 1) network design, 2) feature
flow and 3) loss function, and proposes a series of improvement measures. The results
of their work exceed the existing methods on the MSCOCO Keypoint data set to
achieve the best results. The paper has been published in Arxiv. The Overview of
Multi-Stage Pose Network(MSPN) can be seen in Fig 6.3.

69
Fig 6.3 Overview of Multi-Stage Pose Network(MSPN)
The multi-stage attitude estimation network MSPN is shown in Figure 6.3. It uses a
top-down framework, i.e. the human body detection algorithm is first used to give the
human body frame, and then matting, and estimating the pose of a single human body.
As mentioned above, there are three new breakthroughs in MSPN: firstly, the network
with good image classification performance (such as ResNet) is used as the unit
network of multi-stage network; secondly, the information aggregation model is
proposed to reduce information loss by stages; thirdly, the coarse-to-fine supervision is
introduced and multi-scale supervision is carried out.
6.2 Results
The key points of our clinical video data were recognition by MSPN, the method build
before. The results can be seen in fig 6.4 below.

70
Fig 6.4 Key-points of Skeleton
The raw video is 44Hz, to get time serious points in the space, the original video is
converted into a picture set at 20 Hz sampling frequency. And all pictures were detected
and a JSON file of 21 key-points of the body in time serious was saved. They are head,
left ear, right ear, left eye, right eye, nose, left mouth corner, right mouth corner, neck,
left shoulder, right shoulder, left elbow, right elbow, left wrist, right wrist, left hip, right
hip, left knee, right knee, left ankle, and right ankle. Each point contains two float
number, they are coordinates on the X-Y plane of that point.
Use head as an example, the point’s x-coordinate, and they-coordinate location were
plotted in the time domain in fig 6.5.

71
Fig 6.5 The point’s x-coordinate(a) and y-coordinate(b) location in time serious
IMU data can be seen in figure 2. Through the analysis and comparison of the data, we
can see that when the subjects are within 2 meters of the camera, they can observe the
periodic information, but when the subjects leave the camera 2 meters away, the error
will increase sharply and lose the periodic information. It is easy to draw a conclusion
that the accuracy of the current human keypoint detection technology is not enough to
use directly.
6.3 Future works
For future study, a tracking test video acquisition is deserved to be used for a stable
point error rate, and the same neural network like the last chapter can be used for the
analysis of the gait info from keypoints, thus a video-based abnormal gait classifier
system can be released.
72
Summary
In this thesis, we proposed a lower limb data acquisition system and a neural
network-based model for abnormal gait classification. The experiment was designed to
collect acceleration signals and sEMG signals under normal and pathological gaits.
Data of 15 healthy persons and 15 hemiplegic patients during walking were collected.
The classification of gait was carried out based on sEMG and the average accuracy rate
can reach 92.8% for CNN. For IMU signals five kinds of abnormal gait are trained
based on three models: BPNN, LSTM, and CNN. The experimental results show that
the system combined with the neural network can classify different pathological gaits
well, and the average accuracy rate of the six-classifications task can reach 93%.
In vision-based research, by using human keypoint detection technology, we obtain the
precise location of the key points through the fusion of thermal mapping and offset,
thus extracts the space-time information of the key points. However, the results show
that even the state-of-the-art is not good enough for replacing IMU in gait analysis and
classification. The good news is the rhythm wave can be observed within 2 m, which
proves that the temporal and spatial information of the key points extracted is highly
correlated with the acceleration information collected by IMU, which paved the way
for show visual-based abnormal gait classification algorithm.

73
Bibliography
[1] R. Caldas, M. Mundt, W. Potthast, F. Buarque de Lima Neto, and B. Markert, “A systematic
review of gait analysis methods based on inertial sensors and adaptive algorithms,” Gait Posture,
vol. 57, pp. 204–210, Sep. 2017, doi: 10.1016/j.gaitpost.2017.06.019.
[2] T. N. Nguyen, H. H. Huynh, and J. Meunier, “Skeleton-Based Abnormal Gait Detection,”
Sensors, vol. 16, no. 11, p. 1792, 2016.
[3] M. V. D. Linden, “Gait Analysis, Normal and Pathological Function, 2nd ed. J. Perry, J.M.
Burnfield, Slack Inc., 576 pages, ISBN 978-1-55642r-r766-4,” Physiotherapy, vol. 97, no. 2, pp.
180–180, 2010.
[4] J. P. B. Junior et al., “Applicability of using inertial sensor during gait analysis for hemiplegia
patients: Case series,” Gait Posture, vol. 38, no. 8, pp. S64–S64, 2013.
[5] D. F. Macgregor and R. A. Minns, “GAIT ANALYSIS IN CHILDHOOD HEMIPLEGIA,”
Pediatr. Res., vol. 32, no. 5, pp. 620–620, 1992.
[6] C. Sun, C. Wang, and W. Lai, “Gait analysis and recognition prediction of the human skeleton
based on migration learning,” Phys. Stat. Mech. Its Appl., vol. 532, p. 121812, 2019, doi:
10.1016/j.physa.2019.121812.
[7] S. R. Simon, “Quantification of human motion: gait analysis—benefits and limitations to its
application to clinical problems,” J. Biomech., vol. 37, no. 12, pp. 1869–1880, Dec. 2004, doi:
10.1016/j.jbiomech.2004.02.047.
[8] J. Hannink, T. Kautz, C. Pasluosta, K. G. Gassmann, J. Klucken, and B. Eskofier, “Sensor-based
Gait Parameter Extraction with Deep Convolutional Neural Networks,” IEEE J. Biomed. Health
Inform., vol. 21, no. 1, pp. 85–93, 2016.
[9] W. Tao, T. Liu, R. Zheng, and H. Feng, “Gait Analysis Using Wearable Sensors,” Sensors, vol.
12, no. 2, pp. 2255–2283, Feb. 2012, doi: 10.3390/s120202255.
[10] H. H. Manap, N. M. Tahir, and R. Abdullah, “Anomalous gait detection using Naive Bayes
classifier,” in Industrial Electronics & Applications, 2012.
[11] T. Chau, “A review of analytical techniques for gait data. Part 1: fuzzy, statistical and fractal
methods,” Gait Posture, vol. 13, no. 1, pp. 49–66, 2001.
[12] T. Chau, “A review of analytical techniques for gait data. Part 2: neural network and wavelet
methods,” Gait Posture, vol. 13, no. 2, pp. 102–120, Apr. 2001, doi:
10.1016/S0966-6362(00)00095-3.
[13] Z. Gandomkar and F. Bahrami, “Proposing a new set of features based on frieze pattern to
discriminate normal and abnormal gait,” in Biomedical Engineering, 2013.
[14] H. Murase and R. Sakai, Moving object recognition in eigenspace representation: gait analysis
and lip reading. 1996.
[15] E. Desseree-Calais and L. Legrand, “First results of a complete marker-free methodology for
human gait analysis,” in IEEE Engineering in Medicine & Biology Conference, 2005.
[16] S. Jeong, T. Kim, and J. Cho, “Gait recognition using description of shape synthesized by planar
homography,” J. Supercomput., vol. 65, no. 1, pp. 122–135, 2013.
[17] I. Sarkar, F. Alisherov, T. Kim, and D. Bhattacharyya, “Palm Vein Authentication System: A
Review,” Int J Control Autom Syst, vol. 3, 2010.
74
[18] H. Ju and B. Bir, “Individual recognition using gait energy image,” IEEE Trans. Pattern Anal.
Mach. Intell., vol. 28, no. 2, pp. 316–322, 2005.
[19] P. Theekhanont, W. Kurutach, and S. Miguet, “Gait recognition using GEI and pattern trace
transform,” in International Symposium on Information Technology in Medicine & Education,
2012.
[20] Howell Adam M., K. Toshiki, Hayes Heather A., F. K Bo, and Bamberg Stacy J. Morris,
“Kinetic Gait Analysis Using a Low-Cost Insole,” IEEE Trans. Biomed. Eng., vol. 60, no. 12, pp.
3284–3290, 2013.
[21] C. B. Redd and S. J. M. Bamberg, “A Wireless Sensory Feedback Device for Real-Time Gait
Feedback and Training,” IEEEASME Trans. Mechatron., vol. 17, no. 3, pp. 425–433, 2012.
[22] J. Bae, “Gait analysis based on a hidden Markov model,” in International Conference on Control,
2012.
[23] M. Yoneyama, Y. Kurihara, K. Watanabe, and H. Mitoma, “Accelerometry-based gait analysis
and its application to Parkinson’s disease assessment- part 2: a new measure for quantifying
walking behavior,” IEEE Trans. Neural Syst. Rehabil. Eng., vol. 21, no. 6, pp. 999–1005, 2013.
[24] M. Yoneyama, Y. Kurihara, K. Watanabe, and H. Mitoma, “Accelerometry-based gait analysis
and its application to Parkinson’s disease assessment–part 1: detection of stride event,” IEEE
Trans Neural Syst Rehabil Eng, vol. 22, no. 3, pp. 613–622, 2014.
[25] P. C. Chung, Y. L. Hsu, C. Y. Wang, C. W. Lin, J. S. Wang, and M. C. Pai, “Gait analysis for
patients with Alzheimer’S disease using a triaxial accelerometer,” in IEEE International
Symposium on Circuits & Systems, 2012.
[26] C. Senanayake and S. M. N. A. Senanayake, “Human Assisted Tools for Gait Analysis and
Intelligent Gait Phase Detection,” in Innovative Technologies in Intelligent Systems & Industrial
Applications, Citisia, 2009.
[27] Bamberg Stacy J. Morris, Benbasat Ari Y., S. Donna Moxley, Krebs David E., and Paradiso
Joseph A., “Gait analysis using a shoe-integrated wireless sensor system,” IEEE Trans. Inf.
Technol. Biomed., vol. 12, no. 4, pp. 413–423, 2008.
[28] J. Courtney and A. M. de Paor, “A monocular marker-free gait measurement system,” IEEE
Trans. Neural Syst. Rehabil. Eng. Publ. IEEE Eng. Med. Biol. Soc., vol. 18, no. 4, p. 453, 2010.
[29] M. Chen, B. Huang, and Y. Xu, “Human Abnormal Gait Modeling via Hidden Markov Model,”
in International Conference on Information Acquisition, 2007.
[30] S. Bao, S. Yin, C. Hongyu, and W. Chen, “A wearable multimode system with soft sensors for
lower limb activity evaluation and rehabilitation,” 2018, pp. 1–6, doi:
10.1109/I2MTC.2018.8409880.
[31] I. Fentiman, “Clinical Features and Diagnosis,” Behavior, vol. 3, no. 2, pp. 41–44, 1991.
[32] D. Tan, K. Huang, S. Yu, and T. Tan, “Efficient Night Gait Recognition Based on Template
Matching,” in International Conference on Pattern Recognition, 2006.
[33] A. I. Meigal et al., “Novel parameters of surface EMG in patients with Parkinson’s disease and
healthy young and old controls,” J. Electromyogr. Kinesiol. Off. J. Int. Soc. Electrophysiol.
Kinesiol., vol. 19, no. 3, pp. e206–e213, 2009.
[34] J. Stamatakis, J. Cremers, D. Maquet, B. Macq, and G. Garraux, “Gait feature extraction in
Parkinson’s disease using low-cost accelerometers,” in 2011 Annual International Conference of
the IEEE Engineering in Medicine and Biology Society, Boston, MA, 2011, pp. 7900–7903, doi:
10.1109/IEMBS.2011.6091948.
75
[35] S. Esmaeilzadeh, Y. Yao, and E. Adeli, “End-to-End Parkinson Disease Diagnosis using Brain
MR-Images by 3D-CNN,” 2018.
[36] W. Yuan and L. Zhang, “Gait Classification and Identity Authentication Using CNN,” in Asian
Simulation Conference, 2018.
[37] P. Vieregge, H. Stolze, C. Klein, and I. Heberlein, “Gait quantitation in Parkinson’s disease —
locomotor disability and correlation to clinical rating scales,” J. Neural Transm., vol. 104, no. 2–
3, pp. 237–248, 1997.
[38] K. M. Iyer, Clinical Examination in Orthopedics. 2012.
[39] J. Jankovic, “Gait disorders,” Neurol. Clin., vol. 33, no. 1, pp. 249–268, 2015.
[40] T. A. L. Wren and G. E. G. Iii, “Efficacy of clinical gait analysis: A systematic review,” Gait
Posture, vol. 34, no. 2, pp. 149–153, 2011.
[41] E. Dolatabadi, B. Taati, and A. Mihailidis, “An Automated Classification of Pathological Gait
using Unobtrusive Sensing Technology,” IEEE Trans. Neural Syst. Rehabil. Eng., vol. PP, no. 99,
pp. 1–1, 2017.
[42] M. Alaqtash, T. Sarkodie-Gyan, H. Yu, O. Fuentes, R. Brower, and A. Abdelgawad, “Automatic
classification of pathological gait patterns using ground reaction forces and machine learning
algorithms,” Conf Proc IEEE Eng Med Biol Soc, vol. 2011, no. 4, pp. 453–457, 2011.
[43] M. Zeng et al., “Convolutional Neural Networks for Human Activity Recognition using Mobile
Sensors,” in Proceedings of the 6th International Conference on Mobile Computing,
Applications and Services, Austin, United States, 2014, doi: 10.4108/icst.mobicase.2014.257786.
[44] C. K. Du, N. H. Molen, and R. H. Rozendal, “Step length, step frequency and temporal factors of
the stride in normal human walking,” Proc. K. Ned. Akad. Van Wet., vol. 73, no. 2, p. 214, 1970.
[45] Y. Lecun, Y. Bengio, and G. Hinton, “Deep learning.,” Nature, vol. 521, no. 7553, p. 436, 2015.
[46] Y. Chen, Z. Wang, Y. Peng, Z. Zhang, and S. Jian, “Cascaded Pyramid Network for
Multi-Person Pose Estimation,” 2017.
[47] B. Xiao, H. Wu, and Y. Wei, “Simple Baselines for Human Pose Estimation and Tracking,”
2018.

76
Acknowledgments
The completion of this article is inseparable from the guidance and help I got in the
graduate stage. First of all, I want to express my highest appreciation to my supervisor
Prof. Wei Chen, she is powerful while easy-going, without her thoughtful guidance and
unconditional support I can’t achieve these outcomes. The moments in CIME (Center
for Intelligent Medical Electronics) will always be shining in the future and become a
precious treasure of my life.
I also want to express my sincere thanks to Assoc. Prof. Yu Ma, Assoc. Prof. Dai
Chenyu, Dr. Chen Chen from Fudan University and Assoc. Prof Syed Kakakhel from
the University of Turku for their help in the thesis writing work. For clinical data
collection, thanks to Prof. Junfa Wu from Huashan Hospital, college students Hangyu
Zhu, Xinping Wang from Fudan University and all the coordinators in this research.
I also want to thanks all the colleagues in CIME and all the classmates at Fudan
University, they build a good memory at Fudan and Turku. Special thanks to my firsts
teammate Shenjie Bao, Ph.D. candidate Hongyu Chen, my friend Wei Li, Ya‘nan Lu,
Haoran Ren and Xiaoyu Wang for their cooperation during my study.
Finally, I would like to thank my parents, grandparents and my lovely girl. Thanks for
their support and trust, with them I always feel happy and have more courage to meet
the future.

77
Publications and Awards
Publications
[1] Shenjie Bao, Shubao Yin, Hongyu Chen, Wei Chen. A wearable multimode system
with soft sensors for lower limb activity evaluation and rehabilitation[C]//2018 IEEE
International Instrumentation and Measurement Technology Conference (I2MTC).
IEEE, 2018: 1-6.
[2] Shubao Yin, Chen Chen, Hnagyu Zhu, Xinping Wang, Wei Chen. Neural Network
for Pathological Gait Classification Using Wearable Motion Sensor[C]// 2018 IEEE
Biomedical Circuits and Systems Conference (BioCAS). IEEE, 2019.
Patents
[1] A wearable signal acquisition system for lower limb rehabilitation and evaluation.
Inventors: Shenjie Bao, Wei Chen, Hongyu Chen, Shubao Yin (patent for utility
models, application number 201721400281.5, authorized public number: CN
208492094 U)
[2] Plantar pressure signal acquisition system. Inventors: Hongyu Chen, Wei Chen,
Shenjie Bao, Shubao Yin (patent for utility models, application number
201721392982.9, authorized public number: CN 208511028 U)
[3] Wearable lower limb rehabilitation and evaluation system. Inventors: Hongyu
Chen, Wei Chen, Shenjie Bao, Shubao Yin (patent for invention, application number
201711013940.4)
[4] A gait anomaly classification method based on deep convolution neural network.
Inventors: Shubao Yin, Hangyu Zhu, Xinping Wang, Wei Chen. (patent for invention,
application number 201910063488.5)

78
[5] A gait anomaly recognition method based on back propagation neural network.
Inventors: Shubao Yin, Hangyu Zhu, Xinping Wang, Wei Chen. (patent for invention,
application number 201910064053.2)
[6] Multi-sensor signal fusion method based on deep learning for gait classification.
Inventors: Shubao Yin, Hangyu Zhu, Xinping Wang, Wei Chen. (patent for invention,
application number 201910063463.5)
Awards
[1] First Prize of 2017 National Undergraduate Biomedical Engineering Innovation
Design Competition. Team member: Hongyu Chen, Shenjie Bao, Shubao Yin, mentor:
Wei Chen.
[2] First Prize of Medical Service Robot Innovation Design Session in 2018 China
Robot Competition. Team member: Shenjie Bao, Hongyu Chen, Shubao Yin, Zeguo
Shao, mentor: Wei Chen.
[3] Second Prize of 2017 National college students mathematical modeling contest.
Team member: Wei Li, Ya’nan Lu, Shubao Yin, mentor: Wei Chen.