defect escape analysis: test process improvement
TRANSCRIPT
Defect Escape Analysis: Test Process Improvement
Author: Mary Ann VandermarkIBM Software Group, Tivoli Software
January 23, 2003
Definition of EscapeAn escape is a defect that wasn’t discovered by test teams. Instead, the defect was found bycustomers. When problems are exposed by customers, they are quite costly. The further back inthe software development process that defects are uncovered, the less expensive they are. Muchless money is spent overall when a problem is caught by the test team instead of by the customer.Furthermore, it is even less expensive when the development team catches a problem instead ofthe test team. Because of this, it is beneficial to analyze the escapes in order to determine whythey escaped, prevent future escapes, and drive the defect discovery as far back into the softwaredevelopment process as possible. This will reduce costs and improve the quality of yoursoftware product.
PurposeThe purpose of Escape Analysis is to ensure that continual improvement is made on yoursoftware product and on your testing and development processes. This will be done throughanalyzing defects that have escaped development and test and making preventative plans toavoid future similar escapes. Continual improvement of the test processes will increaseeffectiveness of test environments and methods, decrease number of customer-found defects andtherefore cost, and improve product quality, reputation, and sales. The more teams within theoverall software development effort for your product that are involved in Escape Analysis, themore effective the Escape Analysis process will be. It will be most effective if development, aswell as test, is closely involved.
This process focuses on high severity, prevalent, and costly problems. More specifically, theobjectives of escape analysis are to:
-Separate escapes into useful categories for further, more in-depth analysis-Run statistics on the categorized data-Identify and implement overall process changes needed based on the statistics-Identify and implement low-level (department-level) changes needed based on in-depthanalysis of specific escapes-Use metrics to demonstrate effectiveness of process changes
How ToThe following steps should be followed to implement an Escape Analysis process. Afterbecoming familiar with the steps, it should be decided how often the procedures will beperformed. For the best results, you should follow a regular and consistent schedule. Once amonth might be an appropriate timetable.
PlanningThis process is designed to be most effective for a cross-functional team. If that is notpossible, you can adapt the process to work within the boundaries of a test team.
This process is difficult to implement effectively if it is not given regular attention. Foroptimal results, there should be a specific number of people and a specific amount of timeplanned for Escape Analysis work. The effectiveness of the process is completely dependent

on the manner in which it is implemented. Half-hearted attempts to apply the process willnot bring about much improvement of your processes.
Before assigning escapes to categories, it might be helpful to choose only a subset of escapesfor analysis. For instance, if your escapes had severity levels of one through four, four beingthe least severe, maybe it would be best only to analyze the severity one and two escapes.This will prevent you from doing needless work on defects that really don’t matter too muchto the customer. You also might want to wait to analyze only customer problems that havealready been closed out and fixed. If they are analyzed before that, you might be missingsome crucial information. It will also be helpful to eliminate defects that were cancelled,caused by user error, or duplicates. You only want to analyze valid defects that are truly anindication of a development or test process in need of improvement.
Categorize Escapes The first step in Escape Analysis involves separating the escapes into useful and meaningfulcategories. Of course, a prerequisite is to obtain a list of escapes that includes as muchdetailed information as possible. It then must be decided what categories will be helpful inthe analysis. Here are some examples:
•Process Step (where the escape should have been caught)–Development (Marketing Literature Review, Concept Review, Design Review,Code Review, Unit Test, Packaging, Information Development)–Test (Function Test Group, System Test Group, Translation Test Group, DeviceDriver Test Group, Installation Test Group, Performance Test Group, Error-InjectTest Group)
•Product Component (in which component of the code the defect occurred)–Component A, B, C, etc.
•Defect Impact (the impact experienced by the customer)–Crash, hang, data integrity, command failure, install failure, device/hardware,performance, documentation, usability, etc.
•Level Introduced–What version of the code the problem was introduced
•Platform•Severity•Release Discovered
The Process Step is the step in the product development process where a particular type ofescape should have been caught. The purpose of creating a category like this would be tofacilitate further low-level analysis within that process step. The Product Component is thecomponent of code that the problem escaped from. The Defect Impact is the type of problemthe escape caused for the customer. The Level Introduced is the version of code in which thedefect was introduced. It should be the point at which the code was first ‘broken.’ ThePlatform is the platform or operating system on which the escape occurred. The Severity isthe measurement of the degree of seriousness of the defect - for instance, critical, severe,wrong, or a nit. If this is not already a part of your defect logging process, then your EscapeAnalysis process should definitely assign a severity to each defect. The Release Discoveredis the version of the software in which the escape was initially reported.
If you have been able to get development’s buy-in for this process, it would be ideal to haverepresentatives from development, test, support, and all other process steps that can beinvolved to meet regularly to categorize the most recent escapes. Support employees can beextremely helpful in providing more detail during discussion of the defects.
Your team may have need for other categories and may not need some of the suggested ones.It would be best to brainstorm with your team to determine which categories would be mostuseful.
Statistics are run on the output data from this categorizing for further high-level analysis.Each defect assigned to each process step is considered for low-level process changes in thatprocess step.
Analysis - Tracking Tool It would be very difficult to do Escape Analysis without some type of tracking tool. Youshould look for a tool that can keep totals for different categories. A good example of a toolis a Lotus Notes database. It is convenient to be able to slice the data in many different ways.Lotus Notes databases allow you to create different views on the same data, which will allowyou to run many different statistics.
Analysis - StatisticsStatistics are used for analysis to make high-level process changes. It should be decided howoften statistics will be performed. Once a quarter might be a good schedule for this. Toperform statistics, you should compare the totals of each section within each category to theother sections in the same category. More statistics can be run on the sections with relativelyhigh totals.
Analysis - High-level Process ChangesThe escape analysis team should meet as often as the statistics are run, perhaps once aquarter, to specifically discuss the results. Based on the statistics, trends can be recognizedand the team can begin to brainstorm ideas for high-level improvements within the overalldevelopment process. The group should then make formal recommendations forimprovement in those areas and make plans for implementation of those recommendations.In subsequent meetings, the team should discuss the progress of the changes. Action itemsshould be assigned and tracked in an escape analysis database or other tool of choice. Anexample of a high-level process change would be to add another test team, such as an error-inject test team if many of the defects seemed to occur in an environment where somethinghad become corrupted. Another example of a high-level process change would be toimprove the hardware acquisition process if there are many defects where the customer isusing hardware that the test team doesn’t have. These high-level changes would be vast inimpact and would need management support and approval.
Analysis - Low-level Process ChangesIf working in a cross-functional team, a representative should be selected for each ProcessStep (i.e. Development, Test, Documentation, etc.) The escapes that have been categorized

to each Process Step should be assigned to each representative for that area. For instance, anescape categorized to the Unit Test process step should be assigned to the Developmentrepresentative for further low-level analysis. Each process area representative should takethe list of escapes that were categorized to their area (listed in the Escape Analysis database)and come up with low-level improvements for their area. For instance, the Testrepresentative could take the list of escapes that were categorized to Test, divide them up,and assign them to team members within Test to analyze. Those team members would thenanalyze the escapes and come up with an action plan to prevent that type of problem from“escaping” Test again. These action plans should then be completed, approved, and thenimplemented. This progress would be tracked in the database. Each action plan should bemapped to a single escape, and the Test representative should drive the completion, approval,and implementation of those action plans. It is important to note that these action plans arenot created to fix a defect. Only escapes that have already been fixed should be analyzed.The action plans are simply to identify an improvement in the testing process (ordevelopment process, etc.). Based on the detailed information on the particular escape beinganalyzed, the action plan should identify how to avoid that class of problems from occurringin the future, not how to avoid that particular problem in the future (since it should already befixed). An example would be to add a test case not previously considered. Another examplewould be to add a certain type of hardware to the test environment in an effort to moreclosely match what is common in a customer’s environment. Creativity in the action plandevelopment should be encouraged.
MetricsThe last step in the process of Escape Analysis is to periodically measure the improvementsthat have been made on your processes. This will be explained in detail later in this paper.
Examples
Figure 1

* APAR is a term to describe a field reported defect.
In Figure 1, a Lotus Notes database tool for a hypothetical product is demonstrated. There arethree tabs to track data and analysis for a single escape. The first tab is for the detailed dataabout that escape. This data can come from the tool that tracks your defect information. It isbest to automate the transport of this data into your Escape Analysis tool. Also, not shown inthis screen shot is a large field that contains the details describing the history and summary of thedefect.
Figure 2
In Figure 2, the Development Analysis tab is shown. Within development, there are differentcategories to which the escape can be classified. This particular example of an escape isclassified as something that escaped the Design Review process. The example shows aprocedure being added to create a “concept review” for all new functions for the product. TheCapture Probability is designed to assess the effectiveness of the proposed change. It is apercentage that answers the question “what is the likelihood this defect would have been caughtif the solution specified existed at the time the escape went through the development process?”This will be discussed later in the measurements section. This form also contains fields for theinput of target completion dates of both the action plan development and the implementation ofthe action plan. In Lotus Notes, these fields can be set up to send reminder notes to the actionplan assignee based on the target dates.

Figure 3
The Test Analysis tab example is displayed in Figure 3. The Test Classification field could beused to demonstrate whether or not the customer-reported defect was really an escape. In otherwords, it is important to identify whether there really is a hole in the test process or whether thedefect was not worth the effort to find. It is important to keep in mind during Escape Analysisthat some defects are just too expensive or obscure to catch. Some customers discover problemson environments that are uncommon or obsolete. It is then up to the Escape Analysis team todetermine whether or not a change in the test process is needed. Perhaps the environment isuncommon, but the customer is an important customer and will always have that environment. Itmight be important to alter your test environment to accommodate that type of testing anyway,even if the setup is odd. In the example above, the defect was classified under the category “testtype not performed” because it was an error inject situation. After running statistics on hundredsof escapes, if it is found that a large percentage are for a “test type not performed,” it may be thatthe test type needs to be added to the overall development process. The Capture Probability fieldis explained in the section above.
MeasurementsIncluded here are several different suggestions for measurements. First, there are ideas formeasurements that can guide the Escape Analysis team to develop appropriate action plans for
needed improvements. Next, there are methods for measuring the effectiveness of your EscapeAnalysis process It might be helpful to use one of them, all of them, or to build upon the ideasto create your own measurements.
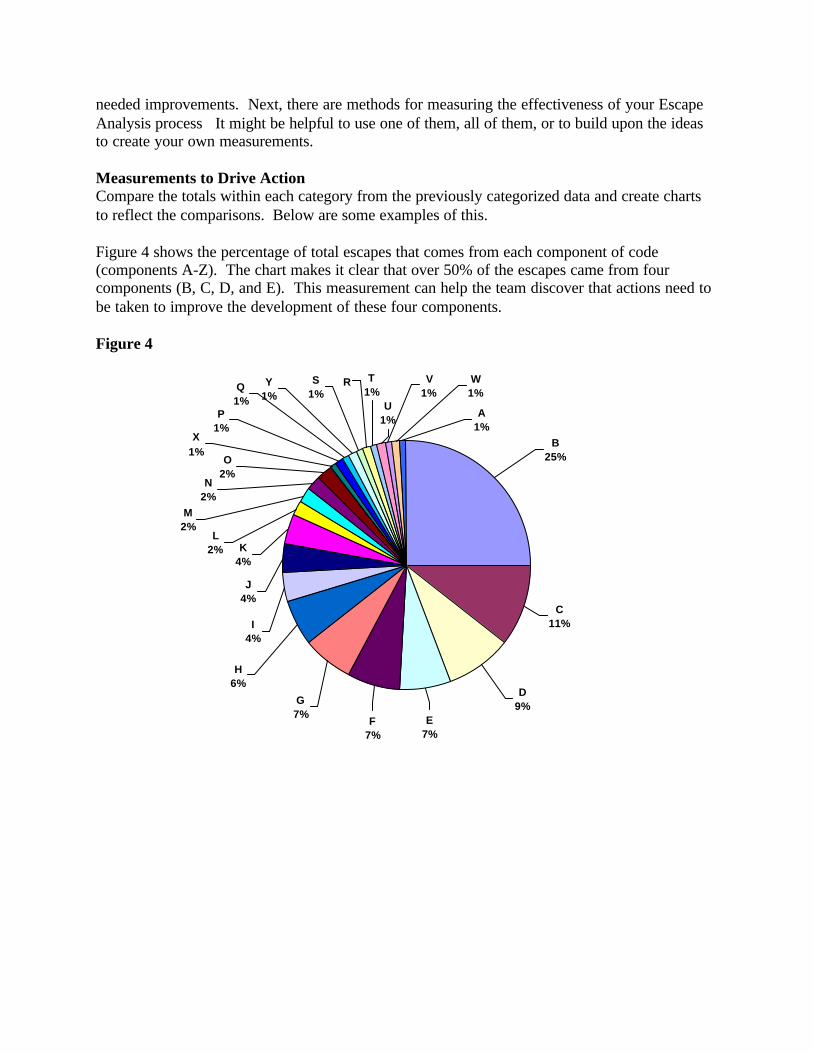
Measurements to Drive ActionCompare the totals within each category from the previously categorized data and create chartsto reflect the comparisons. Below are some examples of this.
Figure 4 shows the percentage of total escapes that comes from each component of code(components A-Z). The chart makes it clear that over 50% of the escapes came from fourcomponents (B, C, D, and E). This measurement can help the team discover that actions need tobe taken to improve the development of these four components.
Figure 4
B25%
C11%
D9%
E7%
F7%
G7%
H6%
I4%
J4%
K4%
M2%
L2%
P1%
O2%
N2%
Q1%
X1%
RS1%
Y1%
A1%
W1%
V1%
U1%
T1%

Figure 5
Figure 5 shows the analysis of different types of impacts to customers, such as hangs, crashes ordevice related problems. For instance, if “Impact 1” were device related problems, then thenecessary action would probably be to improve the hardware that your software is tested on.Also, if the impacts in the blue squares were highly severe impact types, it would be helpful tosee that less than half the escapes are highly severe impact types.
There are many other charts that could be created, based on the example database tool. The twoillustrated above are just highlights of what could be done.
Measuring Escape Analysis EffectivenessAccurate data and consistent reporting are necessary to measure improvement effectively.
TFVUD is the Total Field Valid Unique Defects. In other words, TFVUD is all of the defectsfound by customers that were not cancelled, duplicates, user errors, or suggestions. Youprobably only want to use defects that have been closed out or fixed for this measurement. PostDevelopment Defects (PDD) is the defects found in the test cycle and after development iscomplete, but not including those found after release to the field. KLOC stands for thousands oflines of code.
A. TFVUD ---------------------
KLOC changed & new
This value should go down over time, as one release is compared to another release at the sametime checkpoint. For instance, the value measured one quarter after release 2.0 should be lowerthan the value measured one quarter after release 1.0. The purpose of this measurement is toreduce the number of valid problems found by customers relative to the size of the code.
Impact 125%
Impact 216%
Impact 314%
Impact 411%
Impact 58%
Impact 65%
Impact 75%
Impact 84%
Impact 112%
Impact 93%
Impact 161%
Impact 151%
Impact 141%
Impact 121%
Impact 131%
Impact 102%
B. PDD---------------------------
PDD + TFVUD
This value should go up over time, as one release is compared to another release at the same timecheckpoint. For instance, the value measured one quarter after release 2.0 should be higher thanthe value measured one quarter after release 1.0. The purpose of this measurement is to drive thediscovery of defects back earlier into the process, and to incur the least amount of cost.
C. Capture Probability
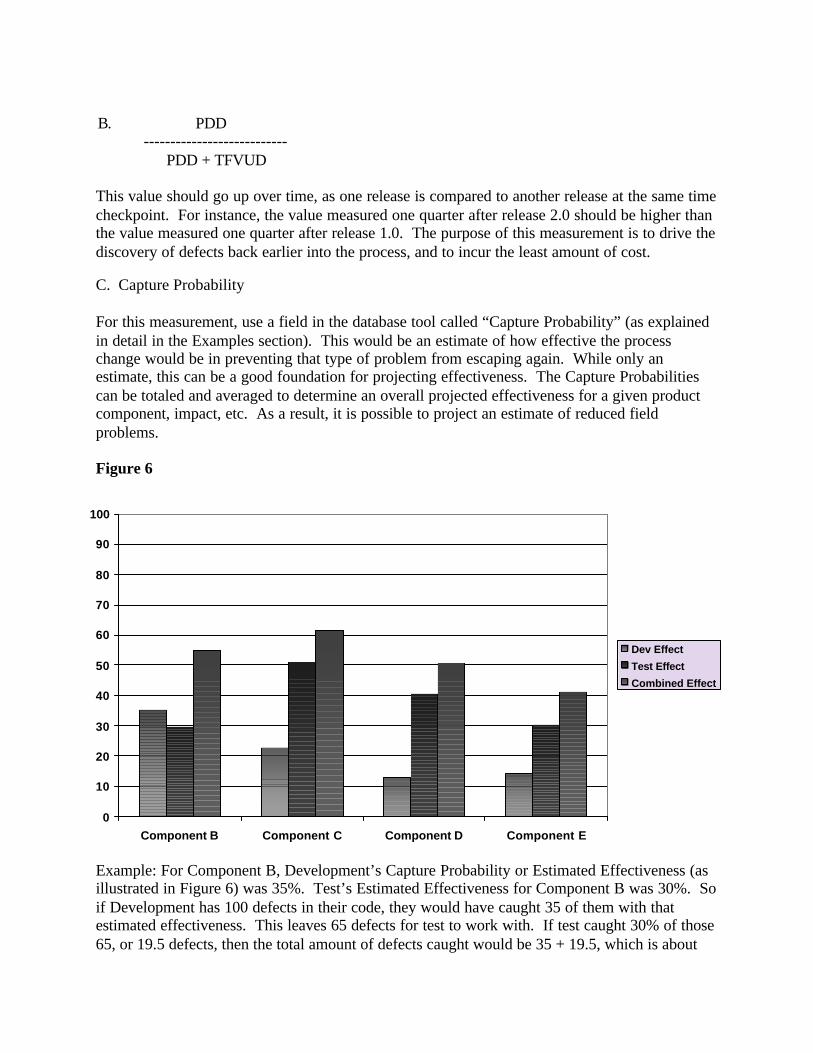
For this measurement, use a field in the database tool called “Capture Probability” (as explainedin detail in the Examples section). This would be an estimate of how effective the processchange would be in preventing that type of problem from escaping again. While only anestimate, this can be a good foundation for projecting effectiveness. The Capture Probabilitiescan be totaled and averaged to determine an overall projected effectiveness for a given productcomponent, impact, etc. As a result, it is possible to project an estimate of reduced fieldproblems.
Figure 6
Example: For Component B, Development’s Capture Probability or Estimated Effectiveness (asillustrated in Figure 6) was 35%. Test’s Estimated Effectiveness for Component B was 30%. Soif Development has 100 defects in their code, they would have caught 35 of them with thatestimated effectiveness. This leaves 65 defects for test to work with. If test caught 30% of those65, or 19.5 defects, then the total amount of defects caught would be 35 + 19.5, which is about
0
10
20
30
40
50
60
70
80
90
100
Component B Component C Component D Component E
Dev Effect
Test Effect
Combined Effect

55 APARs or 55% of the original 100. This 55% is what we call the Combined Effectiveness.The equation for Combined Effectiveness as demonstrated above is (.35) + (1-.35)(.30) orD + (1-D)(T) where D is Development’s Estimated Effectiveness and T is Test’s EstimatedEffectiveness. This example was based on the code components, though this measurement canbe run on other categories, as demonstrated in Figure 7.
Figure 7
The last step is to project the amount by which the valid customer defects can be reduced. Thisis done by totaling and averaging the Combined Effectiveness values. First, select a group ofescapes that will be the focus group for Projected Effectiveness. In this example, the focus groupwill consist of 76 escapes. If the Combined Effectiveness values for those 76 defects weretotaled and averaged for the example above, the result would be 52.5% effectiveness for those 76defects. This translates to 40 escapes that would be prevented. Now, suppose there were 250escapes for a given time period such as a year. Assuming the 52.5% is an accurate projection, itis then true that 40 out of those 250 escapes, or 16% would be prevented. This is the finalprojection for the reduction in escapes for the next software release. And this is only theminimum, because we are assuming that the types of implementations made for the focus groupescapes might not help other types of future problems. If we did not make that assumption, thenthe projected reduction in escapes would be a straight 52.5% which is probably not realistic.
0
10
20
30
40
50
60
70
80
90
100
Impact 1 Impact 2 Impact 3 Impact 4 Impact 5 Impact 6
Eff
ecti
ven
ess
% DevEffectiveness
TestEffectiveness
CombinedEffectiveness
ResultsThe key purpose in Escape Analysis is to improve product quality and customer satisfaction, andto lower costs spent on resolving customer-found defects. This is done by driving the defectdiscovery as far back into the software development process as possible. A software test teamthat implements this Escape Analysis process will benefit over other software developmentcompanies in many ways. Their test processes will become more sophisticated and their testenvironments will more closely match the customers’ actual environments. The data collectedfrom the analysis will provide accurate justification for spending on improvements such asadditional hardware. The implementation of this process will demonstrate continualimprovement during ISO audits. In addition, the process will foster inter-team communication,cooperation, and productivity to create the highest quality software product. It also adds value inbeing able to project the amount of customer-found defects in the future. Finally, this process isself-evaluating in that it is able to measure its own effectiveness and justify the resources spenton it.