defense documentation center defense ... data obtained over a wide range of parameters--compression...
TRANSCRIPT

UNCLASSIFIED
AD 633 632
PERFORMANCE OF ANHYDROUS AMMONIA ASA SPARK IGNITION ENGINE FUEL
D. S. Smith, et al
California UniversityBerkeley, California
February 1966
Processed for...
DEFENSE DOCUMENTATION CENTERDEFENSE SUPPLY AGENCY
FOR FEDERAL SCIENTIFIC AND TECHNICAL INFORMATION
U. S. DEPARTMENT OF COMMERCE / NATIONAL BUREAU OF STANDARDS ' 1NSTT UYL FOR AflPLIt" TCHOLCG
UNCLASSIFIED

PERFORMANCE OF ANHYDROUS AMMONIA AS
A SPARK IGNITION ENGINE FUEL
by
D. S. SmithE. S. Starkman
Report No. TS-66-2
Contract DA-04-200-AMC-791 (XFebruary 1966 D C
IrMAY 2 519
COLLEGE OF ENGINEER WG
UNIVERSITY OF CALIFORNIA, Berkeley

4
NASA Scientific and Technial Information Facilityoperated for the National Aerorautics and Space Administration by Documentation Incorporated
Post Office Box 33College Park. Md 20740
Telephone Area Code 301.k -+779-2121
FACILITY CONTROL NO. '2 '-
DATE ' /Li
ATTACHED IS A DOCUMENT ON LOAN
FROM: NASA Scientific and Technical Information Facility
TO: Defense Documentation CenterAttn: DDC-IRC (Control Branch)Cameron StationAlexandria, Va. 22314
In accordance with the NASA-DOD Cooperative AD Number Assignment Agreement it isreques'.ed that an AD number be assigned to the attached report.
LI'A$ this is our only available copy the return of the document (with ADnumber and any applicable distribution l'itations) to the address below
is essential.
l This document may be retained by DOC. If retained, please indicate ADnumber 'and any applicabie distribution li-mitations en the reproducedcopy of the title page and return to the address be'ow.
Return Address: NASA Scientifi,: and Technical Information FacilityAttention: !NPUT BRANCHP. 0. Box 33
College Park, Maryland 20740

UNIVERSITY OF CALIFORNIADepartment of Mechanical Engineering
Thermal Systern Division
PERFORMANCE OF ANHYDROUS AMMONIA AS A SPARK IGNITION ENGINE FUEL
by
D. S. Smith
E. S. Starkman
J Technical Report No. 6
Under ContractDA-O4-200-AMC-791(X) Ammonia Fuel
Army Material Command.
R & D DirectorateChemistry and Materials Branch
Project DirectorE, S. ar1an
4, February, 1966

F
SUMMARY
The operating characteristics of anhydrous ammonia as a fuel for a
spark ignition engine were determined and compared, experimentally and
theoretically, to those of iso-octane, the reference hydrocarbon fuel.
Experimental data obtained over a wide range of parameters--compression
ratio, engine speed, manifold pressure--displayed no grossly divergent
fuel characteristics for ammonia compared to iso-octane.
Anhydrous ammonia was demonstrated to operate successfully as a fuel
for spark ignition engit. . Principal requirements are that it be intro-
duced into the engine in the vapor phase and be partly dissociated to
hydrogen and nitrogen (NH3 -a PH + H + Dissociation wascatalyst ' 3 2 2
accomplished in a temperature controlled catalvtic dissociator using pel-
letized activated iron catalyst. The optimal weight concentration of
hydrogen to insure against power ioss 4s approximately 5 per cent.
The maximum theoretically possible indicated output using ammonia vapor
when adjusted for 5 per cent hydrogen dissociation is about 75 per cent of
that with ydrocarbi.n. The presently obtained maximum experimental level
is 7" per cent at a compression ratio of 10.
Specific fuel consumption, both by theory and experiment, is twofold
at maximum power and 2-1/2 fold at maximum economy when using ammonia as a
replacemlent for hydrocarbon.
Spark timing for maximum performance must be advanced slightly for
emonia but eensitlvity to spark timing is very little greater than with
hydrocarbons.

i
TABLE OF CONTENTS
eage
I. INTPr,;DUCTION . . . . . . . . . . . . . . . . . . . . . . . . . 1
II. EXPERIMENTAL FACILITIES AND EQUIPMENT..... . . . . . . . . 2
III. EXPERIMENTAL RESULTS ... .................. 10
1. Power Output. . . . . . . . . . . . . . . . . .. . .
2. Specific Fuel Consumption . . ............... .*.
3 Influence of Hydrogen ConcentrationResulting from Ammonia Dissociation . . . . . . . . . 17
4. Spark Timing. . . . . . . . . . . . .. . .. .
5. Engine Oil Analysis ... . . . . . .. . . . . . . .
IV. CONCLUSIONS. . . . . . . . . . . . . . . . . . . . . . 20
V. REFERENCES . . . . . . . . . . . . . . . . . . ..... . . 48
VI. ACKNOnW Em..ENT . . . . . . . . . . . . . . . . . . . . 49
VII. APPENDIX . . . . . . . . . . . . . . . . . . . . . . . . . . 50
g

IA' -
ii
LIST OF ILLUSTRATIONS
Fige Title Page
1 CFR Engine Test Facility 5
2 System Schematic Diagram 6
3 Schematic Diagram of Air Supply System T
4 Schematic Diagram of Ammonia Fuel Supply System 8
5 Liquid Fuel Flow Meter 9
6-11 Influence of Fuel-Air Ratio on Power Output 21-26
12 Comparative Performance of Ammonia and Iso- 27Octane
13 Effect of Engine Speed on Power Output 28
14 Effect of Manifold Pressure on Power Output 29
15 Variation of Maximum Power uutput with Compression 30Ratio
16 Relative Maximum Output for Ammonia as compared to 31Iso-Octane
17-22 Influence c' Fuel-Air Ratio upon Fuel Consumption 32-37
23 Comparat:i'e Fuel Consumption of Ammonia and Iso- 38Octane, Varlable Compression Ratio
24 Comparative Fuel Consumption of Ammonia and Iso- 39Octane, Variable Manifold Pressure
25 Comparative Fuel Consumption of Ammonia and Iso- 4oOctane, Variable Engine Speed
26 Fuel Consumption of Ammonia Compared To Iso-Octane 41
27 Influence of Compression Ratio on Fuel Consumption 42
28 Influence of Compression Ratio on Relative Fuel 43Consumption

IA
Fig Title iag
29 Effect of~ Predissociation of Ammonia on Power 44
Output
30-31 Influence of Spark Advance on Power Output As 45-46a Function of Mixture Strength
32 Influence of Spark Timing on Power Output at 47Fuel-Air Equivalence Ratio for Maximum Power

iv
LIST OF EXHIBITS
Exhibit Title Page
I Engine Oil Analysis 51
II Tabulation of Data, Engine Oil Analysis 52
LIST OF TABLES
Table List of Tables _
I Experimental Data, Iso-Octane 53
II Experimental Data, Ammonia 55
55F

1
I. INTRODUCTION
Investigation of the operating characteristics of anhydrous ammcrnia
as a fuel for spark ignition engines and comparison with a reference hydro-
carbon, iso-octane, was conducted under Contract DA-04-200-AMC-791(X)
AMMONIA FUEL, Army Material Command, R & D Directorate, Chemistry and
Materials Branch. The general objective was to extend the area of applied
information relative to successful substitution of gaseous, predissociated
ammonia for hydrocarbons as a fuel for spark ignition engines. The reasons
for renewed interest in ammonia as a fuel and a review of early success in
its application are presented in the SAE literature. (* The experimental
investigation reported here was initiated in August of 1964 and completed
in August of 1965.
The goal of the experimental work, carried out in a single cylinder CFR
engine, was to point the way to successful operational application and at
the same time to do this with the minimum of engine modification. Thus, the
investigation was pursued using nominal and existing engine compression ratios,
normal ignition systems, atmospheric or throttled manifold pressures and
ammonia dissociation methods well within practical capabilities of a military
application.
The purpose of this report is twofold; to present the comparative experi-
mental results and to compare the experimental results with the previously
published theoretical predictions (2 ) which were based on thermodyrnamic cal-
culationb of the relative performance to be expected when operating a spark
Ignition engine on gaseous ammonia and iso-octane.
* Numbers in parenthesis designate references.

II. EXPERIMENTAL FACILITIES AND EOUIPMENT
The CFR engine test facilit- and a schematic diagram of the test
system for gaseous ammonia are shown in Figures 1 and 2. They provide
a general orientation to the physical arrangement of the test facilities
and show the significant flow processes.
1. Kanen -and _!ynamometer
A CFR single cylinder engine of 3-1/4" x 4-1/2" dimensions, the
primary research apparatus, was used for obtaining all of the experimental
data. The engine was well suited for this combustion research because of
its small fuel requirement and the ease with which the test variables could
be changed, controlled, and observed. Cooling jacket temperatures were
fixed by evaporation and recycle of coolants--a J&cket terperature of
152*F was maintained for iso-octane by the use of methanol, ethylene
glycol was used to maintain a jacket temperature of 3540F for ammonia.
The usual "supercharge method" instrumentation was provided in order to
facilitate close control and accurate measurement of air pressure and flow
rate as shown in Figure 3. Engine speed was monitored by an electronic
counter actuated by a magnetic pick up.
The engine was connected to a Sprague electric dynamometer capable
of a wide speed range for motoring or power absorbtion. The d.c. output
from the dyna-ometer was dumped into a resistance bank with fine adjust-
ment controls for accurate speed control and power output measurements.
2. Ammonia Suvvlv and M etering
A schematic diagram of the ,mmonia fuel supply system is shown in
3
Figure 4. Ammonia vapor was drpwn from a refillable high pressure bottle
maintained in a tempering tank of water. Constant temperature of the bath
and replacement of the ammonia latent heat were affected by supplying sub-
merged steam to the water bath. Primary measurement and calibration of
ammonia flow were accomplished with volume calibrated sight glass on the
ammonia bottle. Continuous flow rate determinations of ammonia were made D"
with turbine flow meter with data read-out from an electronic counter.
Suitable regulators and needle 'alve were installed to reduce the pressure
and meter the ammonia flow. The pressure and temperature of the ammonia
were monitored at several points in the fuel supply line. Introduction to
the engine ras by simple standpipe in the intake manifold.
3. Ammonia Dissociator
Partial decomposition of the ammonia vapor was carried out in a 266
cubic inch capacity stainless steel catalyst chamber. This was loosely
filled with a pelletized activated iron catalyst. Two kilowatts of
electrical resistance element heaters of the globar type were submerged
in the catalyst bed.
A limitation of the catalytic dissociator was its very large thermal
lag. It was difficult to quickly adjust the temperature or electrical
energy supply to a predetermined level of decomposition. Future considera-
tions of similar dissociators should incorporate a more flexible and rapid
means of control of the ammonia decomposition. In addition, there was
inadequate dissociation capacity to supDly the engine with sufficient
hydrogen at an engine speed of 1800 rpm for rich vixtures (this condition
is discussed extensively in a later section).

4. Iso-Octane Supply and Metejrin
Iso-octane was supplied to the erigine by the standard CFR pump and
injector system.
Metering was accomplished by means r-f an electrically co-.trolled U-
tube type meter shown in Figure 5. This type of meter has the advantage
of not requiring buoyancy effect corrections as does the ASTM bean balance
method. Water in the left leg is balanced at an immiscible inner face by
the iso-octane in the right leg. A calibrated weight of fuel is withdrawn
from the meter as the water level drops from electrode B to electrode C.
The water serves as a conductor between the electrodes and the breaking
of the miniscus on the various electrodes actuates the clock and solenoid
values thus affecting the operations of timing, draining, and filling.
5. Gas Chromatograph
A Beckman GC-2 gas chromatograph was used tr, determine the hydrogen
dissociation at engine inlet. The sample was withdrawn by hypodermic
syringe from the fuel line sample septum shown in Figure 2 and injected
into the chromatograph.
For hydrogen detection a stainless steel molecular sieve (Beckman
Column 70015) w~s used. Nitrogen was used as the carrier gas to make
the chromatograph sensitive to hydrogen and quite insensitive to ammonia.
The chromatograph was calibrated on the peak height basis using
laboratory prepared samples consisting of ammonia, nitrogen and hydrogen
in proportions comparable to the range of dissociation products from the
catalytic dissociator.

'4L
FIGURE 1. CFR ENGINE TEST FACILITY

w
M00>42 J
o 01m w 4
ca 0
0 04 w w~ CO
)-0 C0
W WO a -X WW 2
4zw4
> MO42.4
xwo w
-Jg I 0M0iz -.
ilo0 LL
04

AIR SUPPLY HEATERCONTROL
PRESSUREAFILTER REGULATOR
ORI FICE
AAIR
AIR INLET FLOWPRESSURE AIR SUPPLY RATE
(MERIAM TANKS (MERIAMMODEL MODEL
30 F 10)30EB25)
CFRNH 3 VARIABLE
SUPPLY SPEEDENGINE
FIGURE 3
SCHEMATIC DIAGRAM OF AIR SUPPLY SYSTEMTO CFR ENGINE

ELECTR ICALSOLENOID 60 MICRONSAFETY FITEVALVE
-------- PRESSUREREGULATOR
FILL LINE POTENTIOMETER.. 'STEAM
NH 3 NHCALIBRATED
SIGHT LIQGLASS NH ELECTRONIC
-'--'-COUNTER
WATER BATH Cox GL.-TURBINE
FLOW METER
TPOWERSTATS
01 CHAMBER
:- 0- 2000- WATTS
! GCo lH r'---l_._FLOW CONTROL
0 OLINGLJ- VALVEi COIL ----
POTENT IOMETERL
CATALYSTCHAMBER
CFRVARIABLESPEED
ENGINEENGINE LMNFLINTAKE |SNAE POTENTIOMETERSAMPLE
SEPTUM
FIGURE 4
SCHEMATIC DIAGRAM OF AMMONIAFUEL SUPPLY SYSTEM
" '. fPr- m x . .. .

A-
in4
MMI"MM
N'IGtURP
1,TQUI) Vr
W'

10
III. EXPERIMENTAL RESULTS
As indicated previously, all experimental results were obtained from
a CFR spark ignition engine with gaseous premixed anhydrous ammonia and
manifold injected iso-octaie as the fuels. The test parameters were com-
pression ratio, engine speed, manifold pressure and for certain tests hydrogen
dissociation and spark advance. Iso-octane, C8H1 8 , was selected as a repre-
sentative hydrocarbon for the experimental reference fuel. Iso-octane
was also used as the model for theoretical calculations (2) comparing ammonia
and hydrocarbon fuels. The comparison in this report of experimental and
theoretical results are thus compatible.
Throughout this report, fuel-air ratio will be presented in terms
of the fuel-air equivalence ratio, 0, defined as the actual fuel-air ratio
divided by the stoichiometrically correct fuel-air ratio. Therefore, 0 = 1
corresponds to a stoichiometrically correct fuel-air ratio. Use of equivalence
ratio rather than fuel-air ratio displays the data in better perspective,
particularly since ammonia has a chemically correct mixture with 6:1 parts
of air by weight and iso-octane has a chemically correct mixture with 15:1
parts of air by weight.
The experimental results were obtained for a cooling jacket temperature
of 1520F for iso-octane and 3540F for ammonia. The ase of a relatively high
jacket temperature when burning ammonia was for the purpose of enhancing
ammonia decomposition during the compression stroke. A relatively low
jacket temperature was used with iso-octane in order to suppress a tendency
to knock at a compression ratio of 10.

Ammonia dissociation and thus hydrogen supply rates were held only
as high as was felt necessary to obtain optimum performance at any given
operating point. The amourt of dissociated ammonia was thus a variable.
It is now recognized that the quantity of ammonia which was dissociated was
in a few instances marginally low or even below a critical amount. Thisen
factor will be considered in a later section at length. Nevertheless, the
results shown in Figures 6 through 32 are completely satisfactory for com-
prehensive and reliable illustration of the important functional relation-
ships.
1. Power Output
Indicated mean effective pressure, the universal expression for the
power output to be obtained from an engine of given volumetric capacity, is
shown as a function of the fuel-air equivalence ratio in Figures 6-11. The
parameters are compression ratio, engine speed and manifold pressure. Thece
data for each curve was collected at a fixed spark setting; the spark advance
was adjusted for optimum at maximum power output. The range of optimum spark
advance for iso-octane was 220 - 430, and 350 - 550 BTDC for ammonia.
At an engine speed of 1800 rpm the predissociation of hydrogen, due
to the limited capacity of the catalytic dissoclator, was insufficient for
ammonia to produce full power above a fuel-air equivalence ratio of approxi-
mately 0.90. The range of hydrogen deficiency is represented by the dashed
portion of the curves.
Figures 12-14 present comparative power output data for ammonia and
iso-octane as a function of fuel-air equivalence ratio over the range of

12
parameters. Power output for iso-octane is greater than for ammonia at
the same test conditions over the c(cnplete range of interest of variables
and parameters. However, it is also evident from these figures that ammonia
V, has ao grossly divergent power performance characteristics from iso-octane
and that the ammonia data are consistent and orderly within the limitations
of hydrogen deficiency (for an engine speed of 1800 rpm at an equivalence
ratio greater than 0 = 0.90). Peak power output for iso-octane occurs near
0 a 1.15; in contrast, peak power for ammonia is obtained at a mixture ratio
which is about 10 per cent lean.
Power output for ammonia, as indicated by Figure 12, is affected to
a much greater extent by low compression ratios than is iso-octane. The
increase in maximum output for a compression ratio increase from 6 tc 8
is 22 per cent for ammonia and 8 per cent for Iso-octane. However, an increase
in compression ratio from 8 to 10 produced modest increases in power output
of nearly the same magnitude - 10 per cent for ammonia and 7 per cent for
iso-octane.
Figure 13 shows power cutput as influenced by engine speed. The dashed
portion of the 1800 rpm ammonia curve reflects a subcritical hydrogen supply
rate, as previously mentioned. This decline in performance is dramatic as
the mixture is richened. Reflected here is the self-generating character
of the ammonia decomposition and flame phenomena, or the failure thereof when
insufficient precombustion decomposition has been effected. Observation of
this same sudden drop off was noted by Cornelius. HulLantel and 4t-CU-h1 (i)
The trend of mean effective pressure with speed is a slightly increasing
13
one, except of course for that portion of the 1800 rpm cu've where the
ammonia dissociator, because of its size, was unable to provide sufficient
dissociation. For ammonia an increasing trend w&s not expected. Power out-
put for ammonia is highly dependent upon hydrogen dissociation. Some dis-
sociation occurs during the compression p.-ocess and is dependent upon the
time for reaction. Since at higher engine speeds there is less dwell time,
less dissociation would be expected to occur in the cylinder. Therefore,
the increasing trend for ammonia seems to indicate that the dissociation
in the cylinder at these low compression rates is not significant compared
to the amount of prediesociation or other effects, perhaps related to
turbulence and mixing factors.
The curves at the lower engine speeds, without hydrogen deficiency,
indicate that the sensitivity of power output to fuel-air equivalence ratio
is approximately the same for the two fuels.
Figure 14 shows the effect of manifold pressure on power output for
a compression ratio of 8 and an engine speed of 1800 rpm. The increase in
maximum power output for ammonia is in direct proportion to the absolute
manifold pressure.
Figures 15 and 16 display the variation of maximum power output,
relative maximum power output and theoretical power output with compression
ratio. Figure 16 shows directly the relative indicated mean effective
pressure obtained when using ammonia as a substitute for iso-octane. Also
shown, as dashed lines, are the theoretical prediction of relative power
ountput of approximately .80 and the theoretical prediction adjusted for
4
5 per cent hydrogen dissociation. The predicted output was obtained by
comparing the theoretical output for ammonia at 0 = 0.90 with that for iso-
octane at 0 = 1.15 (the respective fuel-air equivalence ratios for maximum
output).
The experimentally determined relative output falls about 8 per cent
short of the 80 per cent predicted at a compression ratio of 10 and about
17 per cent less for a compression ratio of 6. There are at least two
reasons for this disDarity between experiment and theory.
Z* The first and most straight forward is related to prior dissociation
of ammonia into H2 and N2 before introduction into the cylinder. Theoretical
calculations did not account for the accompanying increase in volume of fuel
and resulting decrease in volumetric efficiency. For example, decomposition
of 25 per cent of the ammonia (for 4 to 5 per cent level of H2 by weight)
will increase the total volume of fuel by the same 25 per cent. At a
stoichiometric fuel-air ratio this reducei. the amount of air inducted by
about 5 per cent. The power output will drop off accordingly. This then
accounts fo: a significant portion of the difference between theory and
experiment at a compression ratio of 10.
The other factor involved in tbe disparity between theory and experi-
ment and particularly the improvement with increasing compression ratio is
concerned with the reluctance with which ammonia burns. It has already been
indicated that hydrogen in the fuel feed improves the combustion process
and so does an increase in compression ratio. It is almost certain that
decomposition of ammonia takes place during the compression process. The

15
decomposition produces more hydrogen, but also intermediate species. Thus,
as compression ratio and temperature of compression are increased, so are
hydrogen and intermediate species concentrations.
This later phenomenon is different from that of dissociating the
ammonia in a catalytic dissociator prior to induction. With prior decom-
position the engine will receive substantially only hydrogen, nitrogen
and ammonia. Because of the time factor involved the engine cannot r.-ceive
intermediate dissociation species which may have an important role in com-
bustion.
Note also that overly decomposing the ammonia prior to introduction
into the engine will result in a mixture which is too rich in hydrogen and
attendant difficulties with rapid burn and engine roughness. There is
undoubtedly an optimum amount of predissociation corresponding to maximum
obtainable output and smooth operation. This latter type of optimization
has not been carried out to completion under this program. This optimizing
procedure will be a function o' engine combustion chamber shape in addition
to such other factors as speed, compression ratio, engine ttmperatures, load
and other items.
2. Specific Fuel Consumption
The most significant measure of engine economy is specific fuel con-
sumption. Figures 17 - 22 are the basic comparative fuel consumption curves
for ammonia and iso-octane. Indicated specific fuel consumption is shown
as a function of the fuel-air equivalence ratio. The parameters are comprepsion
ratio, engine speed, and manifold pressure. Cooling jacket temperatures,

16
spark advance and regions of hydrogen deficiency are identical to those for
the power output curves. The range of hydrogen deficiency is again repre-
sented as the dashed portion of the curves.
Figures 23 - 25 present comparative indicated specific fuel consumption
4ata for ammonia and iso-octane as a function of fuel-air equivalence ratio
C over the range of the parameters. Over the complete range of interest of
parameters and variables, for the same test conditions, the indicated specific
fuel consumption for ammonia is greater than that for iso-octane. It is also
evident from these curves that, as for 1ower output, ammonia has no grossly
divergent characteristics from iso-octane and that the ammonia data are
consistent and orderly within the limitations of hydrogen deficiency (at an
engine speed of 1800 rpm for a fuel-air equivalence ratio greater than 0 -
0.90). These figures illustrate directly that specific fuel consumption for
ammonia is over twice that of iso-octane on comparable operations. They
also illustrate that minimum specific fuel consumption with ammonia occurs
at fuel-air equivalence ratios wlich are 20 to 25 per ce-t lean in contrast
to iso-octane for which minimum values occur at mixtures which are approxi-
mately 10 per cent lean.
Figure 23 indicates that specific fuel consumption for ammonia is
affected to a much greater extent than for iso-octane by low compression
ratios. The decrease in minimum specific fuel consumption for a compression
ratio increase from 6 to 8 is 22 per cent for ammonia and 8 per cent for
iso-octane. However, an increase in compression ratio from 8 to 10 produced
modest decreases in indicated specific fuel consumption of nearly the same

17
magnitudes--3 per cent for ammoria and 2 Der cent for iso-octane.
Figure 24 shows the effect of manifold pressur- on indicated specific
fuel consumption. For both fuelE, the change in manifold pressure produced
only a very modest effect of approximately 2 - 3 per cent on fuel consump-
tion. However, for ammonia the decrease in manifold pressure prCduced a
reduction in fuel consumption whilE the opposite effect was produced for
c iso-octane.
The effect of engine speed on indicated specific fuel consumption is
shown in Figure 25. The curves for bo"h fuels display, as would be expected,
little or no effect of engine speed cn fuel consumption. The effect of
hydrogen deficiency is again quite noticeable from the ammonia curve for
an engine speed of 1800 rpm. The curves at the lower engine speeds, without
hydrogen deficiency, indicate that the sensitivity of fuel consumption to
fuel-air equivalence ratio is similar for the two fuels.
The variation of actual, relative, and theoretical indicated specific
fuel consumption with compression ratio is displayed, in Figures 26 - 28.
Figure 26 shows a comparison of actual and theoretical fuel consumption for
the condition of minimum fuel consumption and maximum power output. At
minimum consumption, ammonia must be supplied at two and one-half tim s
the weight flow rate of iso-octane. For maximum power ammonia flow is
double that of iso-octane. The experimental results fall remarkably close
to the theoretical.
3. Influence of Hydrogen Concentration Resulting From Ammonia
Dissociation
Figure 29 contains the results of an investization into the jnfluences
. . .

18
of hydrogen concentration on power output. Hydrogen content of the
partially dissociated ammonia stream was determined directly by gas chroma-
tography as previously described in Section II. The figure shows that 4
to 5 per cent hydrogen is necessary to obtain maximum power at any given
mixture ratio when running at 1800 rpm, a compression ratio of eight, and
manifold pressure of 30" Hg. This 3et of relationships would be expected
to apply generally to other operating conditions.
Hydrogen was supplied to the test engine in the most likely piactical
manner, by partially decomposing the ammonia supply. This procedure results
in a fuel-air mixture which is exactly corresponding in ammonia, hydrogen,
oxygen and nitrogen concentrations to that in any proposed practical apli-
cation which would use ammonia dissociation for hydrogen.
4. Spark Advance
The effect of spark timing on power output for ammonia and iso-octane
is shown in Figures 30 - 32.
Figures 30 sad 31 show how optimizing spark timing can influence power
output over a range of fuel-air equivalence ratios at a compression ratio
of 8 and an engine speed of 1800 rpm. For ammonia the spark should be
slightly retarded and for iso-octane slightly advanced frcm peak power
optimum for maximum performance at richer mixtures. For lean mixtures,
ammonia required :,o sark adjustment; iso-octane requiree slightly greater
advancement than for rich mixtures. For both fuels the increase in power
output with spark adjustment was quite small over a normal operating range
+of - 10 per cent from 0 at maximum power. Ammonia appears to be slightly

19
more sensitive than iso-octane to spark setting at rich mixtures. For the
same engine speed and compression ratio, reduced manifold pressure produced
the same power output trends due to spark adjustments.
Illustrated in Figure 32 is the effect of spark timing on power output
at the fuel-air equivalence ratio for maximum power output. This data ic for
a compression ratio of 8, an engine speed of 1800 rpm, and a manifold pressure
of 30" of Hg. The optimum timing for ammonia is about 55 degrees before
dead center and for iso-octane about 30 degrees at these operating conditions.
Both fuels show only a modest sensitivity of the same magnitude to spark
+setting over a range of optimum - 10 degrees. Ammonia experiences about a
5 per cent loss in power over this range compared to a 4 per cent loss for
iso-octane over the same range.
5. Engine Oil Analysis
A sample of crankcase oil was analyzed through the courtesy of Chevron
Research Company to determine the effect of using ammonia as a fuel on engine
oil under normal engine operating conditions. Detailed results of the
chemical and spectrochemical analysis are included in the Appendix, Exhibits
I and II. There was no indication that the oil was deteriorating from
operation with ammonia fuel. However, an abnormally high amount of copper
and lead in the oil sample might indicate possible corrosion of a copper-
lead bearing.
....

20
IV. CONCLUSIONS
1. Ammonia can be used successfully as a spark ignition engine fuel and
at presently existing compression ratios, if introduced as a vapor and if
first partly dissociated to hydrogen and nitrogen. Under such circumstances
little engine modification is necessary other than a means for flow control
of the ammonia and adjustment of the spark timing.
2. Maximum experimental power output for ammonia was 72 per cent of that
for iso-octane. This result compares favorably with a theoretically pre-
dicted output, when adjusted for 5 per cent hydrogen dissociation, of 75
per cent.
3. Specific fuel consumption using ammonia is increased by a factor of 2
over that of hydrocarbon when compared at peak power and 2-1/2 times when
compared at maximum economy.
4. Hydrogen concentration in the fuel feed is a critical factor for
auccessful operation on ammonia as fuel. Minimum concentrations appear
to be 4 to 5 per cent by weight at intermediate engine speeds of 1800 rpm.
5. Engine performance rapidly falls if less than minimum concentrations
of hydrogen are used. This seems to relate to the self-generating character
of the ammonia decomposition during the compression and combustion processes.
6. Performance factors such as are influenced by engine speed, spalk timing
and manifold pressure are not far different with ammonia than with hydro-
carbons as long as minimum amounts of hydrogen are inducted as a part of
the fuel flow.

FIGURE 6
21 :
INFLUENCE OF FUEL-AIR RATIOUPON POWER OUTPUT I
L aCOMPRESSION RATIO- 6R.P.M. - 1800MANIFOLD PRESSURE - 30" Hg.
a.1 160
w
(nO OCTANE
cJ 140-w c
a-
0
wu. 100-LLJw
z ON 14
0w
<60 ---- H2 DEFICIENCY
Z 0,6 0.8 ! 1.2 1.4 1,6
FUEL-AIR EQUIVALENCE RATIO

FIGURE 7
22
INFLUENCE OF FUEL-AIR PATIOUPON POWER OUTPUT
COMPRESSION RATIO - 8R.P.M. - 1800MANIFOLD PRESSURE -301 Hg.
wo 160
% OCTANE
c. 140
w
Q120wU.
w Iz 100" c,
4 XNw
I-- ---- H DEFICIENCY4- 4
0.6 O,8 1.0 1.2 1.4 1.6
FUEL-AIR EQUIVALENCE RATIO

FIGURE 8
23
INFLUENCE OF FUEL-AIR RATIOUPON POWER OUTPUT
COMPRESSION RATIO - 10R. P.M. - 1800MANIFOLD PRESSURE - 30" Hg.
cnC':)a. 60- ISO OC TAN~EI
w
cn140C')W0o
120
lI. bUL.
W
z /1< 80
w 60 Ha DEFICIENCY
a 0.6 0.8 1.0 1.2 1.4 1.6
FUEL-AIR EQUIVALENCE RATIO

FIGURE 9 24
INFLUENCE OF FUEL-AIR RATIOUPON POWER OUTPUT
COMPRESSION RATIO - 8R.P.M. - 1300MANIFOLD PRESSURE - 30" Hg.
* 160-
:o - OC TAN1 eCo 140-ILa
C.
a.
> 120.-
U. 100
z4
80
60I-
ZAz0.6 0.8 1.0 1.2 1.4 1.6
FUEL-AIR EQUIVALENCE RATIO

FIGURE 1025~
INFLUENCE OF FUEL-AIR RATIOUPON POWER OUTPUT
COMPRESSION RATIO -8
R. P.M. - 1000MANIFOLD PRESSURE -3081 Hg.
a- 160-
w
(n 140- 0wa-
w120-
wU. 100-LLwz
480-w
w 60
00.6 0.8 1.0 1.2 1.4 1.6
FUEL-AIR EQUIVALENCE RATIO

F IG IU 40%E
INFLUENCE OF FUEL-AIR RATIO 2
UPON POWER OUTPUT
COMPRESSION RATIO - 8R. P.M. - 1800MANIFOLD PRESSURE - 21 Hg.
a-120
U) ~ISO -OCTANf
0.
>80-
U
w 60-z4La
40-
H2 DEFI-CIENCY
O0.6 0.8 1.0 1.2 1.4 .
FUEL-AIR EQUIVALENCE RATIO

FIGURE 1227
COMPARATIVE PERFORMANCE OFAMMONIA AND ISO-OCTANE
NJ
R. P.M. - 1800MANIFOLD PRESSURE - 30" Hg.
CL. 160 - .R. "/0
w ISO-OCTANE 8
140(.n 6,_
w 120
w
wZ AMMONIA
44
0
w<- 60- Ht DEFICIENCY,
z0.6 0.8 1.0 1.2 1.4 1.6
FUEL-AIR EQUIVALENCE RATIO

FIGURE 1328
EFFECT OF ENGINE SPEEDON POWER OUTPUT
COMPRESSION RATIO -8
MANIFOLD PRESSURE -30" H g.
a.160-
uiISO--OCTANE I .~p
S140-
U.) 1000W MMNI
10-L4i 1
U.4
FUEHAI EQIA EC RATI
0.6 0. .-. . .

FIGURE 14
29
EFFECT OF MANIFOLD PRESSUREON POWER OUTPUT
COMPRESSION RATIO - 8R.P.M. - 1800
a-160
SPRESSURE30iw
S140-(I)co
w120 ISO - OCTANE
w
w 100 Aa.
z<80- AMMONIA0
w
w 60- H DEFICIENCY
eb. A
0j V. 90L*o .6 0.8 1.0 12 i.4 1.6z
FUEL -AI R EQUIVALENCE RATIO

FIGURE 15
30
VARIATION OF MAXIMUM POWEROUTPUT WITH COMPRESSION RATIO
R. P.M. - 1800oMANIFOLD PRESSURE - 30" Hg.
co~1801
w
CO 1601 -w
w 140m
w.
zw
00
w
go3mo 6 8 10
COMPRESSION RATIO
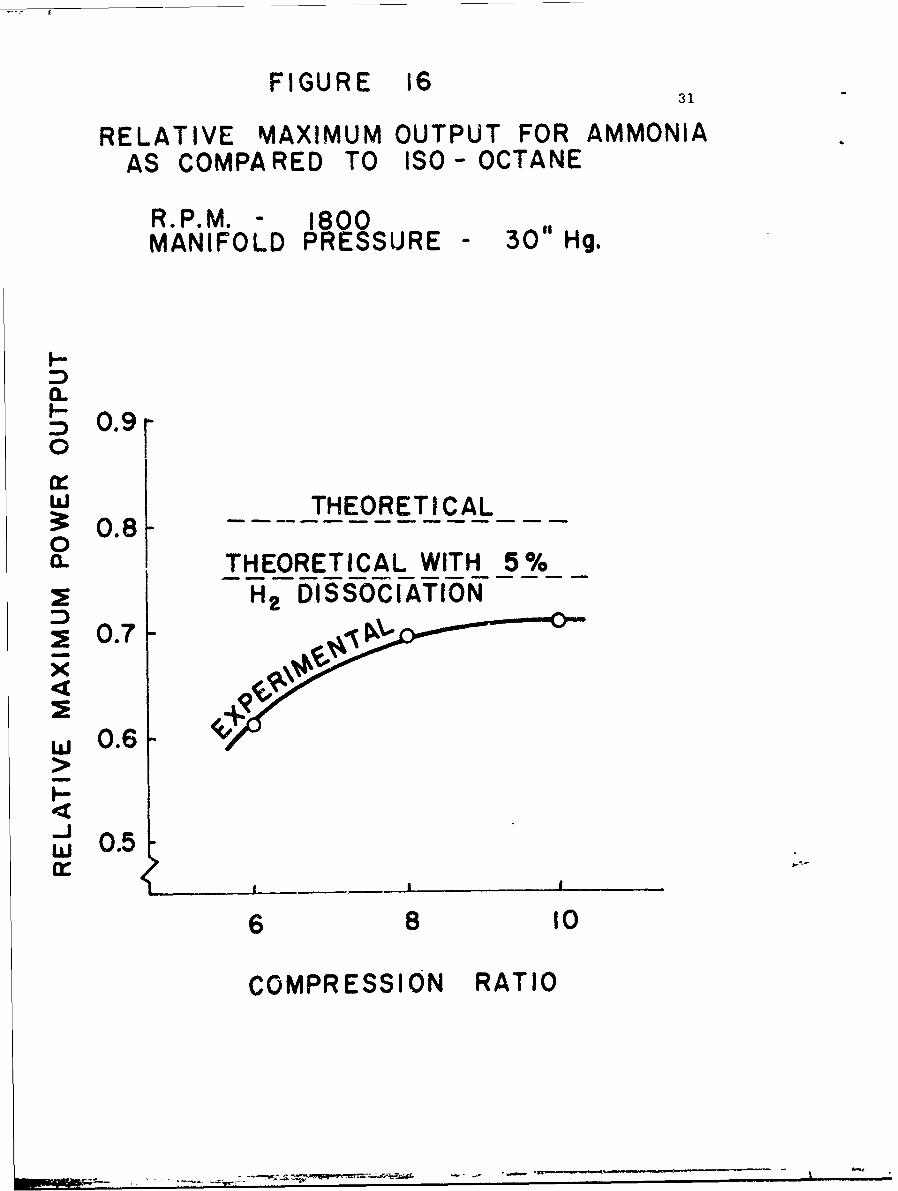
FIGURE 16 31
RELATIVE MAXIMUM OUTPUT FOR AMMONIAAS COMPARED TO ISO - OCTANE
R. P.M. - 1800MANIFOLD PRESSURE - 30" Hg.
I--
-0.9
0
w THEORETICAL? 0.800- THEORETICAL WITH 5%
=E H2 DISSOCIATION
0O.7- X
w 0.6 -
I-
w 0.5
6 8 10
COMPRESSION RATIO
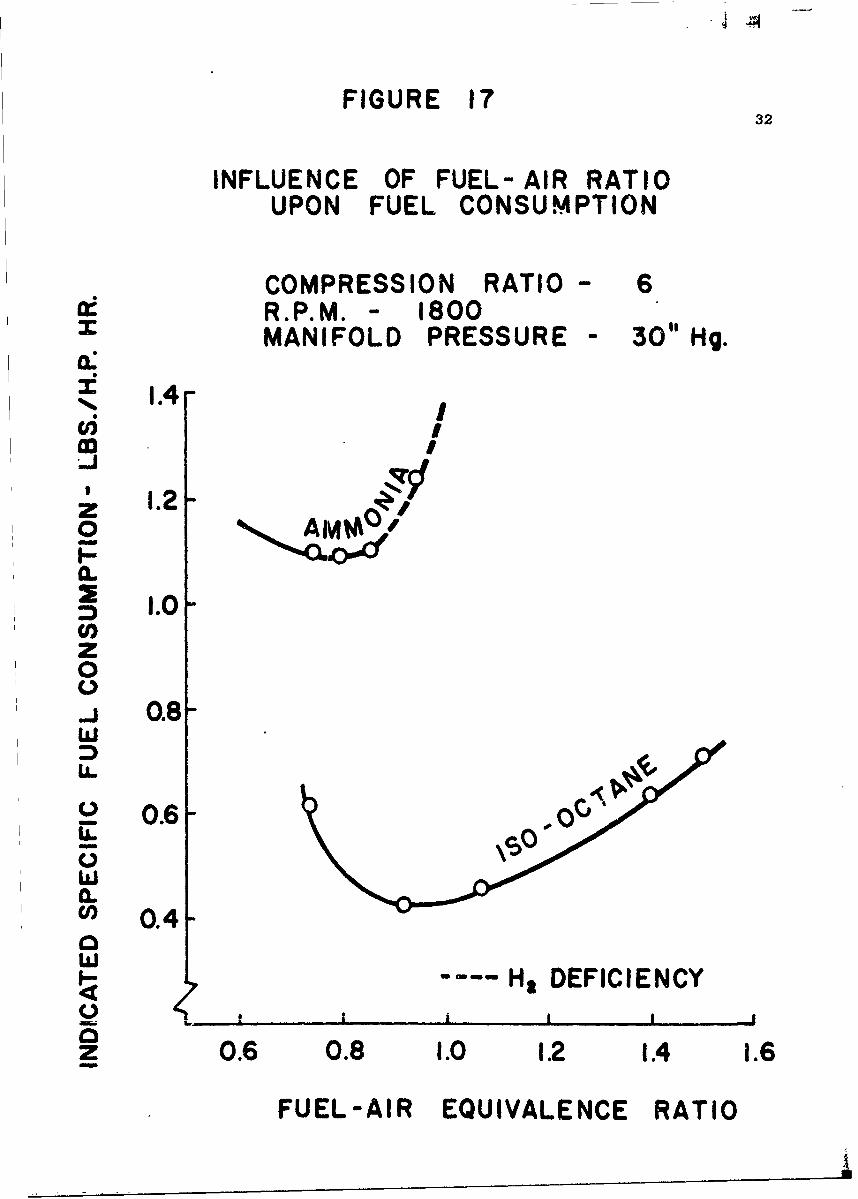
FIGURE 1732
INFLUENCE OF FUEL-AIR RATIOUPON FUEL CONSUMPTION
COMPRESSION RATIO 6R.P.M. - 1800MANIFOLD PRESSURE - 30 Hg.a.:
3! 1.4',
A 1.2N
1.0z0
J 0.8w
.62 0.6- 00Uw0.cl) 0.4-
w9 "--- H, DEFICIENCY
z 0.6 0.8 1.0 1.2 1.4 1.6
FUEL-AIR EQUIVALENCE RATIO

FIGURE 1833 ,5
INFLUENCE OF FUEL-AIR RATIOUPON FUEL CONSUMPTION
COMPRESSION RATIO -8
ce~R. P. M. - 18003: MANIFOLD PRESSURE -30 Hg.
a 1.43!
1.2 /
0
1.0-
0-J 0.8
-0 "6w
owC')
0.4aw
'I "2DEFICIENCY
Z 0.6 0.8 1.0 1.2 1.4 1.6
FUEL-AIR EQUIVALENCE RATIO

FIGURE 1934
INFLUENCE OF FUEL-AIR RATIOUPON FUEL CONSUMPTION
COMPRESSION RATIO - 10R.P.M. - 1800MANIFOLD PRESSURE - 30" Hg.
1.4 "co_J
z .20
co 1.2 3fa.
Z/1.0-0
-J 0.8a
IAL
0.6
w
.
0.4-
w
H2 DEFICIENCY
Z 0.6 0.8 1.0 1.2 1.4 1.6
FUEL-AIR EQUIVALENCE RATIO

FIGURE 2035
INFLUENCE OF FUEL-AIR RATIOUPON FUEL CONSUMPTION
COMPRESSION RATIO - 8R.P.M. - 1300
Iz1 MANIFOLD PRESSURE - 30" Hg.
c'5 1.4..J
0 1.2 0
i-
cn 1.0-zo
S0.80
wIL.
U-S0.6-
"'.4
0-S0.4-
I.L
Z 0.6 0.8 Io 1.2 1.4 1.6FFUEL-AIR EQUIVALEwNCE RATIO
Iiiiiiiim r' o ', - , - ._

FIGURE 2136
INFLUENCE OF FUEL-AIR RATIOUPON FUEL CONSUMPThON
COMPRESSION RATIO - 8R. P.M. - 1000MANIFOLD PRESSURE - 30"Hg.
a:
. 1.4
0J
z 1.2-
[0z0
w
_o 0.6 0
wa.
n 0.4-
w
a
0.6 0.8 1.0 12 1.4 1.6
FUEL-AIR EQUIVALENCE RATIO

FIGURE 22 37
INFLUENCE OF FUEL-AIR RATIOUPON FUEL CONSUMPTION
COMPRESSION RATIO - 8R.P.M.- 1800
3: MANIFOLD PRESSURE- 21" Hg.a:-I 1.4
..J
1.2 1z0a.
2 1.0-C,,z0(o 0.8-iw
o 0.6
a0.4
W Ha DEFICIENCY
0.6 0.8 1.0 1.2 1.4 1.6
FUEL-AIR EPUIVALENCE RATIO

FIGURE 2338
COMPARATIVE FUEL CONSUMPTIONAMMONIA AND ISO-OCTANE
R.P.M. - 1800MANIFOLD PRESSURE 350i Hg.VARIABLE COMPRESSION RATIO
:i1.4 -
z / 1
0C. 6. /
o CR6" ,oI'IAMMONIA
0.8ow
1.0/00
0.8- 10LL
w0.0-1
H2 DEFICIENCY
O06 0.8 1.0 1.2 1.4 1.6zFUEL-AIR EQUIVALENCE RATIO

FIGURE 24 39 )COMPARATIVE FUEL CONSUMPTION
A MONIA AND ISO-OCTANE -VARIABLE MANIFOLD PRESSURE
X COMPRESSION RATIO - 8a: R.P.M. - 1800: 1.4
IMANIFOLD-J PRESSURE
1.2 30"Hg/z0
a-.01
''AMMONIA
z0
0.8w
0O.63d
0
CL ISO-OCTANEc)O.40
Hp DEFICIENCY
O0.6 0.8 1.0 1.2 1.4 1.6aFUEL- AIR EQUIVALENCE RATIO
c -----

FIGURE 2540
COMPARATIVE FUEL CONSUMPTIONAMMONIA AND ISO-OCTANE
VARIABLE ENGINE SPEEDCOMPRESSION RATIO - 8MANIFOLD PRESSURE- 30" Hg.
3:a:
a
_ 1.4 2z
00
1.2
a-
Ur)z00
0. 0.8 -w
U--
0O.6-
w0-U)O0.4-0
w ~-~-H 2 DEFIENCY
O0.6 0.8 1.0 1.2 1.4 1,6
FUEL-AIR EQUIVALENCE RATIO

FIGURE 26 41
FUEL CONSUMPTION OF AMMONIACOMPARED TO ISO-OCTANE
(ISFC AMMONIA/ISFC ISO-OCTANE)
R.P.M. - 1800MANIFOLD PRESSURE 30" Hg.
z 3 .00a-0_ THEORY AT MIN. ISFC2.5 -__wo__ _--- ---
,) 0on 0z0
S 2.0 _-. C-
w THEORY AT MAX. I MEP
wL> 1.5
EXPERIMENTo AT MIN. ISFO
-o AT MAX. WEP
4 6 8 10 12
COMPRESSION RATIO

FIGURE 27 42
INFLUENCE OF COMPRESSION RATIO
ON FUEL CONSUMPTION
R.P.M. - 1800Oi
MANIFOLD PRESSURE -30" Hg.
= EQUIVALENCE RATIO
c-J
2.
a.2 N ~ AMMONIA
.2
""mo, 1.0
w .
La- 0.8
ISO-OCTANE *:.10.
0.4 *: .0
Ha DEFICIENCYw
0-a06 8 10
-COMPRESSION RATIO
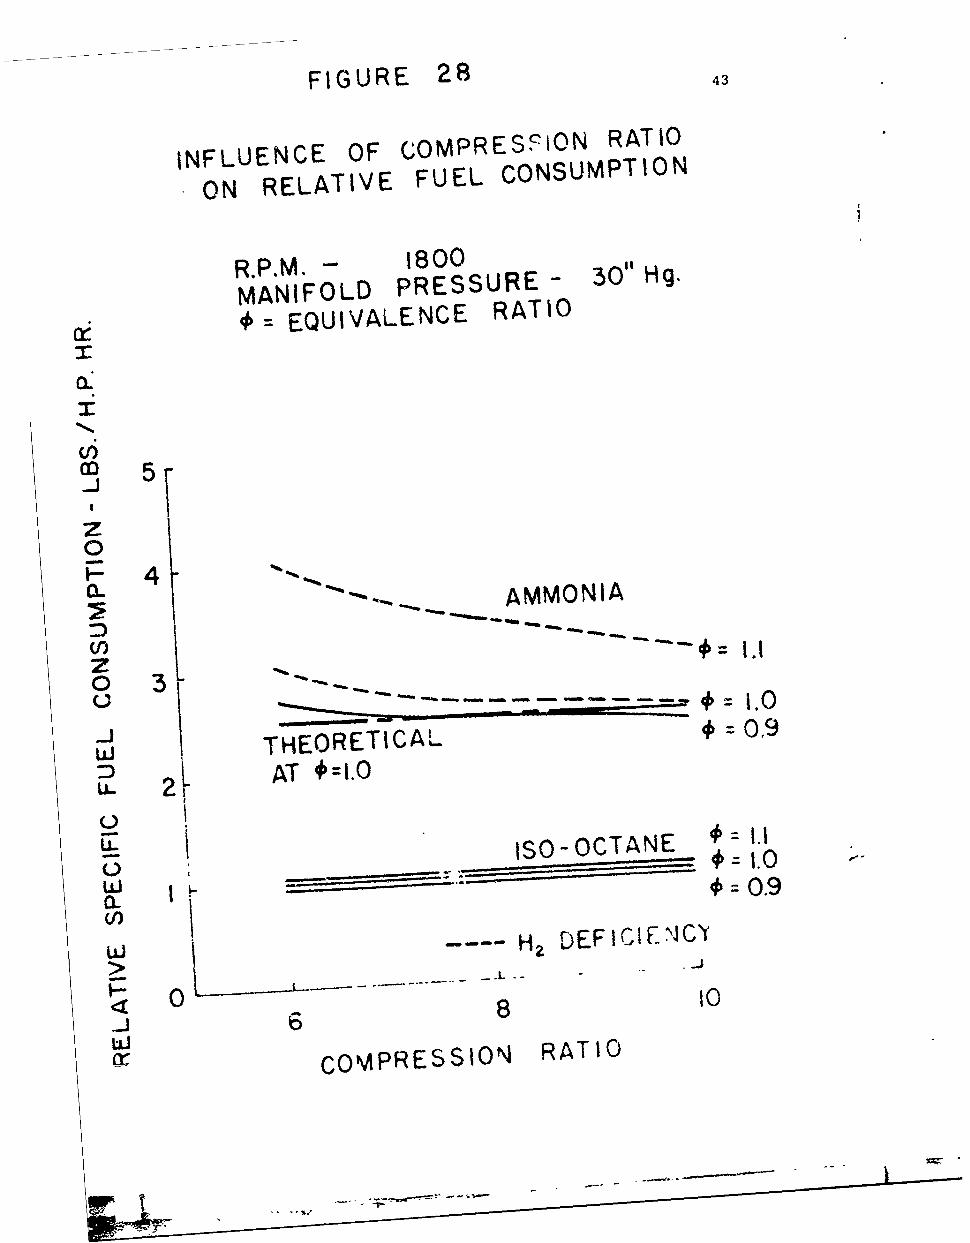
FIGURE 28 4
INFLUENCE OF C;OMPREScI0N RATIO
ON RELATIVE FUEL CONSUMPTION
R.P.M. 1800 31 g
MANIFOLD PRESSURE -30Hg
0= EQUIVALENCE RATIO
Q5
0
.. .--.. AMMONIA
n ~AT #=I.O2
0 ______ ISO OCTANE 1.
W -________
*~1. 0
6 8 t0
Or COMPRESSION4 RATIO

FIGURE 29 44
EFFECT OF PREDISSOCIATION OFAMMONIA ON POWER OUTPUT
COMPRESSION RATIO- 8R. P.M. - 1800MANIFOLD PRESSURE- 30" Hg.
120
IDISSOCIATOR L/4f
100-
CL 80 -
wI6o % H2 bi' 4EIGHT
0.6 0.7 0.8 0.9 1.0 1.1
FUEL-AIR EQUIVALENCE RATIO
imp

FIGURE 3045
INFLUENCE OF SPARK ADVANCE ONPOWER OUTPUT AS A FUNCTIONOF MIXTURE STRENGTH
COMPRESSION RATIO - 8R.P.M. - 1800MANIFOLD PRESSURE - 30" Hg.
zl)a.I 160w. /CI NF-- 340
140 - iwcra-u 120
560w N
U100 -4w %480
zw 80- o SPARK ADVANCE OPTIMIZED0 o0 SPARK ADVANCE FIXED AT MAX. POWER
l..!.- --- H12 DEFICIENCYI,.
0.6 0.8 1.0 1.2 [,4 1.6
FUEL-AIR EQUWALENCE RATIO
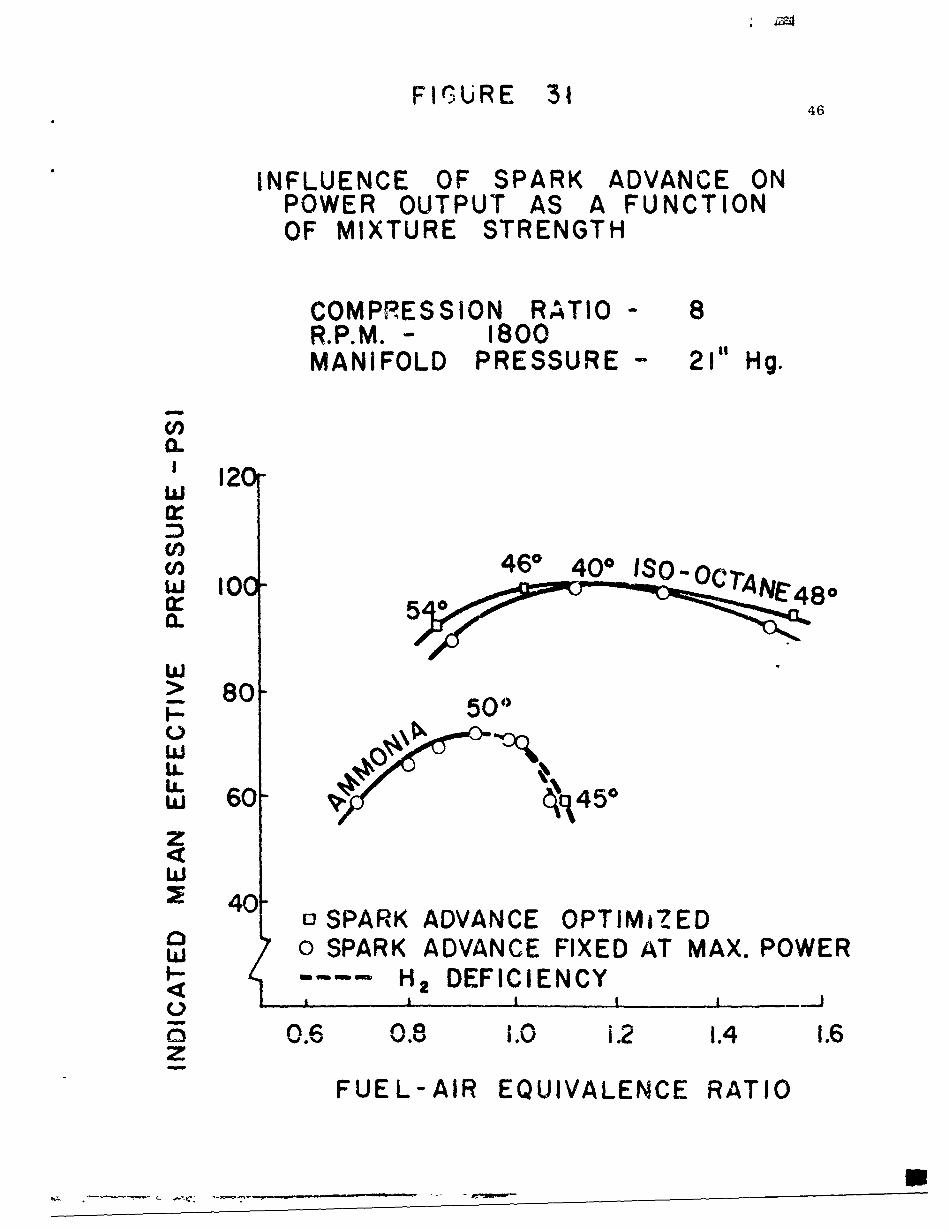
FIGURE 31 46
INFLUENCE OF SPARK ADVANCE ONPOWER OUTPUT AS A FUNCTIONOF MIXTURE STRENGTH
COMPRESSION RATIO 8R.P.M. - 1800MANIFOLD PRESSURE - 21" Hg.
oIOF
0 20
cn
wIlJ
wr 6060~ 4005
w
80O50"
U4
z
=E40oSPARK ADVANCE OPTIMICZED
{3uJ o SPARK ADVANCE FIXED AT MAX. POWER< ---- H2 DEFICIENCY
0.6J~ i.2 1.4 1.6
FUEL-AIR EQUIVALENCE RATIO
SI

FIGURE 32 47
INFLUENCE OF SPARK TIMING ON POWEROUTPUT AT FUEL-AIR EQUIVALENCERATIO FOR MAXIMUM POWER
COMPRESSION RATIO - 8R.P.M. - 1800MANIFOLD PRESSURE - 30 "Hg.
1 160w
,(°)140
w
/ t * .93)L
0 -20 Tw
P.
w 00
z
SPARK TIMING - BTDC
- ~~~~-17 ~ ~ ~ - -

d
48
REFERENCES
1. "Energy Depot Concept", SAE Publication SP-263. Society of Automotive
Engineers, Inc. New York, New York, November 1964.
2. H. K. Newhall, "Calculation of Engine Performance Using Ammonia Fuel,
I. Otto Cycle," University of California, College of Engineering,
Office of Research Services. Technical Report No. 2, Ammonia Fuels
Studies, 1965.
3. "ASTM Manual for Rating Aviation Fuels by Supercharge and Aviation
Methods", American Society for Testing Materials, Philadelphia, Pa.,
1958.

49
ACKNOWLEDGEMENT
The authors gratefully acknowledge contributions by their associates
to the successful compjletion of this experimental investigation.
Messrs. G. James, T. Maguire, S. Samuelson and R. Sutton were instru-
mental in the acquisition of test data. Mr. H. Stewart was responsible for
instrumentation and developed the liquid fuel flow meter. Mr. J. DeCosta
was responsible for maintenance of the mechanical integrety of the engine
and auxillary systems.

50
APPENDIX
!jj The appendix includes the test results obtained from a chemical and
_ :spectrochemical analysis of engine oil and a tabulation of the engine
performance test data. The analysis was performed by Chevron Research
Capany on a gratis basis.
I

51
CHEVRON RESEARCH COMPANYRICHMOND, CALIFORNIA
ANALYSIS OF OIL FROMCPR ENGINE RUN ON FILE 100.01AMMONIA FUFL SEPTEMBER I, 1965
Author - N. R. Parkin
Analysis of a sample of oil from a CFR engine run on ammoniafuel at the University of California is shown in the attachedtable. The total operating time on the oil was 52 hours.The engine ran for 16 hours on isooct'.nie ft-., and ammoniawas the fuel for 36 hours. Super RE. DEL0 Special Oil (SAE 50)was the crankcase lubricant, and botn used and fresh oilsamples were analyzed,
The results show a negligible change in gravity, flash point,visco lity, and neutralization numbers which indicate that theoil is not deteriorating during operation with ammonia fuel.The spectrochemical analysis shows an abnormally high amountof copper and lead in the used oil, indicating the corrosion ofa copper-lead bearing. Apparently, the use of ammonia fuel isresulting in contamination of the oil with products that arecorrosive to copper and lead.
:sIcEnc. - Table

52
OIL ANALYSESOIL FROM AMONIA-FUELED ENGINE
-- Used --- Fresh
- Oil oilGravity, OAPI 25.8 26.2Flash Point, oF 49o 485Viscosity at 1000, S18 1288 1232Viscosity at 2100F, SUS 97.1 94.4Neutralization No., ASTM D 664
pH 7.61 7.22Total Acid No. 1.6 2.Total Base No. 2.3 2.5Carbon Residue, % 1.00 1.03
Coagulated Pentane Insolubles, % < 0.01 < 0.01Coagulated Benzene Insolubles, % < 0.01 < 0.01Calcium, % 0.15.3 o.184
Zinc % I(TypicalZinc, % 0.077 0 08.4(Typical)Phosphorus, % 0.089 O.M09
Spectrochemlcal Analyslsi ppm (Typical)
Aluminum 1.7Barium 5.1Chromium o.4Copper
51Iron 12Magnesium 1.7Molybdenum 1:6Sodium 10Lead 130Silicon
1.7Tin 8.3
CHEVRON RESEARCH COMPANYRRCT)O/ r -AT.Te iA

53TABLE I
Experimental Data, Iso-0ctane
indicated Mean Spar.Manifold Fuel-Air Effective Advance
Comp. Pressure Equivalence Pressure (DegreesRatio RPM (In, of Hg.) Ratio (0) (Psi) BTDC)
10 1800 30 .80 .28 2810 1800 30 .75 1Lo6 2810 1800 30 .86 14' 2810 1800 30 .91 j47 2810 ..8oo 30 .97 152 2810 1800 30 1.10 157 2810 1800 30 1.17 158 2810 1800 30 1.29 156 2810 1800 30 1.44 151 28]0 1800 30 .95 152 28
8 1800 30 1.15 147 348 180o 30 .76 118 348 1800 30 .88 138 348 180C 30 1.46 145 34
6 1800 30 1.o8 136 436 1800 30 1.51 129 436 1800 30 .93 129 436 1800 30 1.4i 1,33 43
8 1300 30 1.09 143 258 1300 30 1,61 124 25S 8 1300 30 1.39 139 258 1300 30 .95 135 25
8 1300 30 .68 59 25
8 1000 30 1.30 137 228 1000 30 1.00 137 228 .000 30 1.13 138 228 1000 30 .70 78 228 1000 30 .75 110 22
8 1000 30 1.54 129 22
8 1800 21 1.13 99 408 1800 21 .87 90 4o8 1803 21 1.11 98 4o8 1800 21 1.28 98 408 1800 21 1.48 92 4o
3-.8 1800 30 1.52 144 4O8 !800 30 1.68 136 468 1800 30 .71 110 568 1800 30 1.82 131 52

54
Indicated Mean SparkManifold Fuel-Air Effective AdvanceComp. Pressure Equivalence Pressure (DegreesRatio RPM (In. of Hg.) Ratio (P) (psi) BTDC)
8 1800 21 1.02 99 468 1800 21 .83 91 548 1800 21 1.55 93 48 C8 1800 21 1.7o 84 53 B8 1800 30 1.14 148 34 18 1800 30 .14 149 30 3.8 1800 30 l.,4 18 25 18 1800 30 .14 143 20 18 1800 30 L14 138 15 18 3800 ?o 1.1h 130 10 18 800 30 1.14 119 5 18 18oo 30 1.14 105 08 1800 30 1.14 91 5 (ATDC)8 1800 30 1.14 148 4o8 1800 30 1.14 143 458 1800 30 1.14 141 508 1800 30 1.14 135 55
*1
?a

55
TABLE I:
Experimental Data, Ammonia
Indicated Mean SparkManifold Fuel-Air Efrective Advance % H2
Comp. Pressure Equivalence Pressure (Degrees Dissoc-Ratio RPM (fn. of Hg.) Ratio (0) (Psi) BTDC) iation
10 1800 30 .59 83 53 5+10 1800 30 .75 ]Do 53 5+10 1800 30 .88 08 53 3.610 1800 30 .89 110 53 3.810 1800 30 .95 114 53 3.310 1800 30 1.01 I"i 53 3.110 1800 30 1.11 10]. 53 2.3
8 1800 30 .65 84 55 5+8 1800 30 .72 93 55 4.88 1800 30 .83 100 55 3.58 1800 30 .93 104 55 3.78 1800 30 1.01 99 55 3.78 1800 30 1.o8 90 55 3.3
6 1800 30 -74 74 55 4.46 1800 30 .80 82 55 4.06 1800 30 .86 85 55 4.2o 1800 30 .95 82 55 3.70 1800 30 1.06 78 55 3.1
8 1300 30 .62 80 55 5+8 1300 30 .74 90 55 5+8 1300 30 .8o 95 55 4.08 1300 30 .0 103 55 4.88 1300 30 .96 104 55 4.88 1300 30 1.03 105 55 4.38 1300 30 1.04 102 55 4.48 1300 30 1.18 99 55 5+8 1300 30 131 89 55 4.6
8 1000 30 .67 82 35 5+8 1000 30 .77 89 35 5+8 1000 30 .89 97 35 5+8 00 30 .98 100 35 5+8 2000 30 1.07 99 35 5+8 1000 30 1.22 93 35 5+
8 1800 21 .70 59 50 5+8 1800 21 .80 65 50 5+8 1800 21 .87 69 50 5+8 1800 21 .93 72 50 5.08 1800 21 .99 70 50 5+8 1800 21 1.01 69 50 5+8 1800 21 LO6 50 4.8

Indicated Mean Spark 5
Manifold Fuei-.Air Effective Advance % H2V Comp. Pressure Equivalence Pressure (Degrees Dissoc-
Ratio RPM (In. of Hg.) Ratio (0) (psi) BTDC) iation8 1800 30 .93 105 55 3.8i8 1800 30 .93 103 50 3.88 1800 30 .93 103 65 3.8
8 1800 30 .93 103 50 3.88 2800 30 .93 100 45 3.88 1800 30 .93 97 40 3.88 1800 30 .93 92 35 3.88 1800 30 .93 84 - 3.88 1800 30 .93 80 25 3.88 1800 30 .93 77 20 3.8
8 1800 30 1.05 101 48 3.78 1800 30 1.o8 94 48 3.5
8 1800 21 1.o6 62 45 4.8
8 1800 30 .79 103 55 5.08 1800 30 .62 79 55 5.08 1800 30 .94 1o6 55 4.o8 ]800 30 .79 100 55 4.08 1800 30 .62 70 55 4.08 L8oo 30 .94 97 55 3.08 18o0 30 1.o4 98 55 3.08 1800 30 .79 89 55 3.08 1800 30 .66 58 55 3.0
8 1800 30 .94 78 55 2.08 1800 30 .79 78 55 2.08 1800 30 .74 54 55 2.08 1800 30 .84 80 55 2.08 1800 30 1.04 75 55 2.0