defining solar energy
TRANSCRIPT

SOLAR ENERGY A New York perspective,
Richard Perezℜ & Thomas Thompsonℑ (Based upon a manuscript developed by the authors for the New York League of Conservation Voters)
EXECUTIVE SUMMARY There is a common misconception that New York doesn’t get enough sun and that solar power is both too expensive and too unreliable to serve NY’s energy needs. The reality is quite different. In fact, from Buffalo to Broadway and from the St. Lawrence Seaway to Montauk Point, solar electric PV power can lower the cost of energy in NYS, eliminate blackouts, strengthen the electric grid, clean the air and jump start NY’s economic might with good, 21st century jobs. Right now, in spite of possessing a surprisingly strong solar resource, NYS is behind other states and even other countries. However, NY still has time to act, through sound government policy that leverages private sector investment, and become one of the world’s leading manufacturers of and markets for solar energy, in all of its forms, but especially in the area of photovoltaics. DEFINING SOLAR ENERGY Solar energy is a broad term that labels the conversion of the radiant energy received from the sun (directly from the solar disk and indirectly from the sky) into forms of energy that can be exploited for human consumption. It is useful to distinguish between two fundamentally different types of solar energy technologies/applications.
• Those which are end-use specific such as domestic hot water production, passive solar heating or daylighting, and
ℜ Research professor University at Albany, Atmospheric Sciences Research Center ℑ Chair New York State Solar Energy Industries Association & Executive Vice-President Atlantis Corporation.

• Those which are universal in nature because they generate electricity – electricity is a universal energy carrier, that can be used, transported, stored and converted to reach virtually any application. These technologies include photovoltaics and concentrating solar power.
After a brief review of both types of applications, we focus largely on the universal type of solar energy. This is because while end-use-specific technologies could be sizeable and profitable, their impact would remain largely confined to their domain of application -- i.e., a moderate overall impact on the NY energy picture. The real story lies in the universal – electricity generating -- technologies which could have a considerable impact on the state’s energy landscape. End-Use-Specific Solar Technologies Hot water production: this is generally what people have in mind when they think of solar energy. This technology uses the energy of the sun to directly or indirectly heat water. It is mainly targeted to residential domestic production, but can be used on a larger scale and at higher operating temperatures to meet institutional, commercial and industrial needs (100 MW of industrial-grade process heat solar collectors are operating today in the world). A lower cost form of this technology is also successfully used for swimming pool heating. The main domestic hot water collector technologies include flat plate systems and evacuated tubes, which in New York have a comparable performance1. Both technologies are proven and mature and could supply 50-60% of the hot water requirements of typical households upstate, and 60-70% downstate, with a payback on the order of 10 years when displacing electric hot
Figure 1: A domestic hot water collector (source NREL Pix Library)
1
A. McNamara, J. Perlman, and R. Perez. "Solar Domestic Hot Water Technologies Assessment". NYSERDA Report 08-09. August 2008. Bright Power, Inc. New York, NY, USA.

water, 12 years propane, 15 years oil and 20 years for natural gas – these numbers, based on late 2007 commodity values, and are getting much better as their prices increase. The number of solar thermal system installations in New York is small and not well documented. Based on national data, it is estimated at a several hundreds to a few thousand residential installations and a smaller number of commercial installations. Deployments in the US and New York pale in comparison with other countries such as Germany, Greece, Turkey, Israel and above all, China, where solar DHW production is common with a cumulative hot water generating capability in excess of 10 gigawatts. While solar thermal system investments are more economical if included during initial construction or substantial renovations, solar thermal retrofits are cost-effective in most parts of NYS. Commercial and industrial building heating: Wall mounted air collectors – a New York industrial specialty -- can be well suited to provide low cost heat to industrial buildings. Under favorable conditions they show a fast return of 5 year against electric heat and 10 years for gas. Designed for retrofit as well as new applications, they can supply 30-40% of the air heating load for industrial buildings with a good southern wall exposure. The technology could conceivably used for residential applications as well, especially if embedded in new construction. At present, the total number of such installations is quite low. However, one of the largest such systems in North America was recently installed by the U.S. Army at the Fort Drum military base in Watertown, NY.
Figure 2: An Industrial Solar Wall Installed at Fort Drum (Photo courtesy of Ron Kamen, Earth Kind Energy)
Passive solar: This form of solar energy takes advantage of the south facing side of buildings to absorb solar heat through appropriately sized windows while minimizing apertures in other orientations. This technology can be low-cost if incorporated in new building design – retrofits are possible in some cases, but would be more expensive, unless part of a planned addition. Passive solar is best used when properly designed with appropriate overhangs to avoid summer heat penetration, high insulation, operable thermal curtains or shutters, and indoor thermal mass that can dampen temperature fluctuations, maintaining warm comfortable temperatures during the day and store solar

heat for several hours. A well insulated house with passive solar in New York State with a good solar exposure (i.e., minimal shading from trees or other structures) could reduce its heating bill by 50% to 65% compared to a similarly sized/priced conventional house. Current deployment in NY is currently marginal: a few hundred to a few thousand houses.
Figure 3: A Passive Solar House in Upstate New York (Photo Richard Perez)
Daylighting: This form of solar energy consists of maximizing the use of direct and indirect solar light (i.e., light from the sun and the sky) to displace artificial light. Of course many of us already use natural light whenever possible, but utilization could be maximized, if incorporated in building design (offices, industry and residence) and/or by making active use of occupancy/light controls and dimmers – daylighting can often be a low cost retrofit, particularly in large one-story commercial spaces. Very low costs can be achieved if daylighting is incorporated at the building design stage. In addition to displacing electrical energy, daylighting has been shown to provide better visual comfort and enhance human productivity. Daylighting with active controls and use of high efficiency lights ([compact] fluorescent and LEDs) could drastically reduce electric light consumption particularly during mid-afternoon peak electrical demand conditions when daylight is plentiful. There are several other end use-specific solar niches such as active solar heating -- an extension of solar DHW (above) that could be used as backup for boiler based systems, or such as solar cooling – still largely under development, but their penetration in the state will probably remain marginal. Finally, industrial process heat from the sun (a higher temperature extension of the DHW technology) could also be used some day to assist energy-related industrial/chemical processes such as the production of hydrogen, with a potentially large, albeit still hypothetical impact.

Universal Solar Technologies There are two leading technologies to produce electricity from the sun
Figure 4: (A) a 100 MW CSP Power plant in Daggett, CA (source NREL PIX Library); (B) a 7 kW residential PV installation (Source AtlantisEnergy); (C) a 700 kW commercial PV installation (Source
SunPower)
A B
C
• Photovoltaics (PV) and, • Concentrating Solar Power (CSP).
Both technologies are mature and backed by solid fast growing industries. Photovoltaics: This is the direct conversion of sunlight into electricity using semi-conductors.

PV generation is highly modular – i.e. the equivalent of a large gigawatt-size power plant can consist of many small and mid-size installations. PV generation is well suited to deliver high value energy near point of use, because it can easily be retrofitted on commercial/residential building roofs, as well as many other suburban and urban spaces: parking-lots, industrial exclusion zones , right of ways , old landfills and toxic dumps, as well as open space. PV technology can also be integrated into the skin of existing and new buildings, in an application known as Building-Integrated-Photovoltaics or BIPV, extracting part of its value from the building envelope material it replaces. PV power plants can be deployed on short notice with decision-to-turnkey operation spanning at most a few months. Although PV have been used, and continue to be used to provide remote power generation, where the power grid does not reach, the great majority of PV systems are now designed to be grid interactive, producing high quality electricity and injecting it to the grid via inverters. PV generation could also be coupled with built-in storage and backup for efficient load management functionality and for maintaining critical loads during emergencies.
Figure 5: A BIPV Installation in New York City (Photo courtesy of AltPower)
There are many different PV technologies evolving today with exciting prospects - -the bulk of the production today, roughly 90%, is derived from crystalline silicon which currently delivers the highest conversion efficiency (now exceeding 20% from sun to electricity) and which has a very long operating life (25-year manufacturer warranties are common place). Other so-called thin film technologies, amorphous silicon, CIGS, etc. are experiencing a very fast growth. These technologies are less expensive but not as efficient. The worldwide production of PV in 2007 reached 3,700 MW, averaging a growth rate of more than 40% during the last 11 years. Projecting a similar “business as usual”, growth in the future, the worldwide production of PV could exceed 300,000 MW by 2020, (i.e., delivering annually the peaking capacity of 300 nuclear power plants).

Many analysts estimate that with such a growth rate, over half of the new electrical generation capacity installed annually in the US in 2025 will be PV. Conversion efficiencies are on a steady increase, with over 20% conversion modules available commercially today – i.e. a 1000 ft.2 residential roof located in upstate New York could pack in 18 kW of power generation, producing over 2,000 kWh per month, that is, well over the typical household consumption.
0
500
1000
1500
2000
2500
00
3500
1987 1989 1991 1993 1995 1997 1999 2001 2003 2005 2007
Steady cost decrease: The continued improvements in both conversion efficiency and manufacturing processes have yielded dramatic cost reductions. Historically, costs have experienced 20% decrease with doubling of production. Lately however, the combined effects of very high worldwide demand, and silicon production bottlenecks2 have kept price declines in check. This trend is not endemic however, and many experts envision a halving in system price by 2015. The current deployment of
2 The current silicon shortage is largely a result of the dot.com boom and bust and has little to do with PV. The silicon industry had not anticipated the rapid growth of PV and was caught off guard after having suffered setbacks in overstating the chip industry growth during the dot.com boom
30
OthersChinaJapanEuropeUS
World PV production (MW)
Source ADEME
Figure 6: Evolution of worldwide PV production since 1987 (R. Perez et al.)
Figure 7: Contrasting PV deployment in Germany and New York (Tom Thompson, 2008)
Germany 2,000 MW
New York 15 MW
PV in NY was 15 MW as of early 2008. This represents only 1/10 of 1 % of the world. In 2007, NYS deployed ½ of 1% of Germany where there is much less sun and a less attractive physical match between demand for energy and solar supply (see below). Concentrating Solar Power: This technology if fundamentally different from flat plate PV energy collection, because it uses concentrated sunlight (via mirrors and or lenses) to generate high temperatures that can be used to produce steam and drive electricity generating turbines. The leading technology consists of parabolic troughs tracking the sun. Other technologies include central receiving towers (surrounded by fields of heliostat mirrors focusing the sun’s light on a single point for yet higher temperatures, and higher efficiencies. Other promising CSP technologies in pre-commercial phase are based on sterling heat engines instead of steam turbines. The solar to electric conversion efficiencies achieved by CSP are currently at the level of the most efficient PV technologies (20%+). One key advantage of the CSP technology is that it is very well suited to operate with built-in thermal storage and can effectively use small amounts of fossil-fuel backup to generate steam if absolutely needed – as such CSP plants can deliver something very close to firm power output favored by utility companies. On the other hand, CSP is not nearly as modular as PV – large open spaces are preferable; unit sizes in the 100s of MW can exploit economies of scale. Also, unlike PV (consisting of flat plate collectors for the most part) CSP can only utilize direct sunlight that can be focused. Therefore these technologies need clear, dry sky conditions to function well. This is OK in the southwestern US, but the climate of New York is not ideal, since nearly half of the collectable solar energy in the state is diffuse – i.e., from the sky and not the sun’s disk. Given the need for open spaces and clear skies, deployment of CSP in New York is not as likely as in the Southwest. However, note that CSP technology could still play a large role for New York’s energy if imported on super grids following solutions which are being envisioned in many parts of the world (e.g., several groups in Europe are considering options to exploit large power plants in the Sahara and Middle East deserts and bring in the power via supernetworks around and/or below the Mediterranean; similar projects linking the southwestern US and the urbanized northeast have also been envisioned on this side of the Atlantic). Current installed capacity: none in New York, but over a GW in the world, with explosive growth prospects ahead. SOLAR POTENTIAL IN NEW YORK Solar is often perceived as a marginal source of energy, largely because it is mostly viewed as a niche application to, e.g., “produce hot water on a sunny day”. However, an objective, rational look at the solar resource (Figure 8) shows that it is, by far, the largest source of energy on earth, and – pending an hypothetical development of containable nuclear fusion (the only other resource of comparable magnitude) the only one capable of

supplying the planet’s growing energy needs for the long haul. Figure 8 shows that New York State, alone, receives substantially more solar energy than is currently consumed by all the countries on earth. Of course solar resource is more abundant in the tropical belts than it is in the temperate regions, but the difference is considerably smaller than most people think. The State of New York receives “only” 35% less solar energy per unit area than the southwestern US deserts. The upstate-downstate solar resource difference is only a few percents.
Figure 8: Comparing the world’s energy resources. Total reserves are shown for the finite resources at right, while annual potential is shown for the renewable resources.
1. S. Heckeroth, Renewables.com, adapted from Christopher Swan (1986): Sun Cell, Sierra Club Press 2. C. Archer & M. Jacobson , Evaluation of Global Wind Power -- Stanford University, Stanford, CA 3. World Energy Council 4. G. Nihous, An Order-of-Magnitude Estimate of Ocean Thermal Energy Conversion Resources, Journal of Energy Resources Technology -- December 2005 -- Volume 127, Issue 4, pp. 328-333 5. R. Whittaker (1975): The Biosphere and Man -- in Primary Productivity of the Biosphere. Springer-Verlag, 305-328. ISBN 0-3870-7083-4. 6. Environmental Resources Group, LLC http://www.erg.com.np/hydropower_global.php 7. MIT/INEL The Future of Geothermal Energy-- Impact of Enhanced Geothermal Systems [EGS] on the U.S. in the 21st Century http://www1.eere.energy.gov/geothermal/egs_technology.html Note that geothermal is treated here as a renewable resource, with a yearly production rate based on projected installed capacity in 40-50 years exploiting current recovery technologies. The resource is indeed finite (since contained within the earth) but its ultimate potential is considerable and has been estimate at several 10,000 TW-yrs. However its exploitation is contingent on capturing the heat reservoirs stored very deep under the earth’s crust and on humanity’s willingness to do so 8. BP Statistical Review of World Energy 2007 9. http://www.wise-uranium.org/stk.html?src=stkd03e
2 – 6 per year2 – 6 per yearWorld energy use16 TW-yrper year
COAL 1,8
Uranium 1,9
900Total reserve
900Total reserve
90-300Total
90-300Total
Petroleum 1,8
240total240total
Natural Gas 1,8
215total215total
WIND1,2
Waves11,30.2-2
25-70per year25-70per year
OTEC1,4
Biomass 1,5
3 -11 per year3 -11 per year
HYDRO 1,63 – 4 per year3 – 4 per year
TIDES 1
SOLAR10
23,000 per year
Geothermal1,70.3 – 2 per year0.3 – 2 per year
© R. Perez et al.
0.3 per year0.3 per year
NEW YORK State Solar 23 TW-yr per year

It is a fact that each square foot in the State of New York receives roughly 130 kWh worth of solar energy per year. Hence, accounting for solar-to-delivered electricity efficiencies achievable with current PV technology, each square foot in New York could generate 20 kWh per year worth of electricity. Bottom line: 0.45% of the State’s surface would be sufficient to generate all the electrical energy used by the New York State today. It is interesting to contrast this area to the total area covered by buildings, parking lots, exclusion zones and roadways, which occupy nearly 3% of the State’s surface. Noting that a substantial fraction of this space could be used to harvest solar energy without modifying (and sometimes even enhancing) its primary use (e.g., parking lot PV canopies) the large scale deployment of PV in the state would require little use of new open spaces. HOW MUCH PV IN NEW YORK AND HOW SOON? 6000 MW of high value “peak shaving” PV: As shown above, the solar resource in New York is quasi limitless. However its actual deployment will depend on the value it brings to the table and the ability of the power grid to absorb it effectively. Like other renewables, such as wind, solar energy is an intermittent energy resource that cannot be controlled at will nor dispatched by utility operators. However, unlike these other renewables, solar is reliably available at times of peak power demand in New York State. This is because peak electrical demand in the large cities of the State is driven by air conditioning demand, and because air conditioning demand peaks are fed by heat waves which are themselves driven by solar gain. Hence the resource that creates the high power demand can also be used to serve that demand via PV generation. This attribute is often referred to as “PV peak shaving” Figure 9 illustrates this capability by comparing the load of New York City on its 2006 peak day to what it would have been, had 1000 MW of PV been deployed in
Figure 9: Peak Day New York City electric Load without PV and with a hypothetical 1,000 MW distributed over its grid.
8000
8500
9000
9500
10000
10500
11000
11500
12000
Load
(MW
)
NYC LOAD
NYC LOAD with 1000 MW PV

the city. On that day, the city experienced rolling blackouts in the borough of Queens when the demand was reaching its peak in mid afternoon. Local deployment of PV generation would have reduced that peak demand, relieved local stress and likely the prevented the rolling blackouts. Combining this capability with the fact that PV plants can deployed very near the center of electrical demand pockets, confers to PV generation the ability to not only displace the highest priced and dirtiest peak electricity generation, but also to reduce the need for infrastructure upgrade, by reducing the power flow towards the load centers, and to enhance the overall security and resiliency of the power grid. It has been shown that 6,000 MW of PV could be deployed in New York State (~20% of the State’s generating capacity) to serve this high value/local generation/grid decongestion objective. It must be stressed that New York, because of its electrical demand profile, is probably one of the best places in the country and the world to take advantage of this capability. The world’s PV deployment leader, Germany, cannot exploit this attribute because their peak demand is not correlated with solar gain – they need power in winter, early morning or at night when the sun is not up. How soon this deployment will happen will largely depend on the will of New York stakeholders (rate payers, tax payers and utilities) to see it happen – see economic discussion below. From a purely physical standpoint the benefits would be immediate with respect to:
- Displacing High Priced Transmission Investments: In looking at potential solutions to our multi-faceted energy challenge, many people offer nuclear power, or even large wind farms as a response. The problem with this strategy is that it requires investment not only in the power station but also in large, new, costly and generally unwanted electric transmission lines to carry the power to the point of use. The inherent value of PV electricity in NYS and many other places is that it generates electric power at the point where electricity is consumed and at the time of the utility peak, thereby displacing the need to invest in transmission lines that would only be needed for a few hours each year to serve peak loads. By combining its peak shaving and localized production attributes, PV deployment would yield power grid decongestion. This allows utility planners to minimize or postpone the need for costly, limited use investments in transmission and distribution upgrades. In this important way, solar PV power is unlike most other energy resources that would have to be piped into load pockets
- Security and Resiliency: Having dispersed localized resources near the points of
use that can relieve highest stress is an important security asset. In addition to stress relief, security would be enhanced by having multiple modular units whose individual failures would never endanger the system as a whole – unlike the failure of a large power line, or that of a large power plant. Many generalized power grid failures are caused by high-demand induced stresses

coincides with a strong probability of high solar resource. The analysis of the massive 2003 power blackout3 in New York and Toronto showed that even a modest solar resource (less tan 500 MW) dispersed around the large cities of the northeast would have averted the heat wave-driven outage at a small fraction of its cost by reducing the northeast electric power grid’s demand, which at the time of the outage had to import over 7,000 MW through overburdened power lines: localized PV generation would have prevented every single successive failure that fed into each other and resulted in the blackout cascade. In addition to passively enhancing grid security, it is also possible to envision active security for dispersed PV generation whereby PV installations large and small, residential and commercial, could easily be designed to operate with localized storage and backup so as to be able to operate in emergency mode when the grid goes down for any reason: be it grid stress, severe weather, or terrorism.
Long term, high PV penetration beyond 6,000MW: Beyond the high-value peak shaving opportunity, high penetration will require storage and infrastructure upgrade. Thus, solar development will have to go hand-in-hand with the development of smart grids and energy demand management practices as well as with the development of storage technologies. No breakthroughs are necessary to carry out such a plan to fruition, just a determined effort to enhance already highly evolved approaches: The storage panoplies which will have to be developed will range for very short term (capacitors, fly wheels, batteries, load demand response) to mid term (e.g., interactive electric/hybrid cars load/backup management), to long term (e.g., flow batteries, hydrogen, compressed air). Note again that Germany, far ahead of us in terms of deployment, is facing this reality today because it cannot exploit PV peak shaving as New York could. Therefore, Germany is fast becoming an expert at developing the appropriate solutions to large scale PV penetration and it is probable that they will subsequently market these solutions to people like us. Given the size of the solar resource compared to all alternatives, logic alone would say that for the long term, even in cloudy New York, solar energy penetration may well be in excess of 50%. It may be early to fully envision such penetration level, but two broad avenues may be envisaged:
• Decentralized – dispersed generation, consisting largely of PV deployed within or near load centers, with local energy management/storage.
• Centralized generation in the planet’s sunny regions – both CSP and PV -- with
large power plants feeding load centers via long distance super-grids. For instance, resources deployed in the US Southwest could feed the US northeast load centers, taking advantage of weather and time shift differences. Another long-term option would be to float PV on part of the nation’s man made
3 Perez R., B. Collins, R. Margolis, T. Hoff, C. Herig J. Williams and S. Letendre, (2005) Solution to the Summer Blackouts – How dispersed solar power generating systems can help prevent the next major outage. Solar Today 19,4, July/August 2005 Issue, pp. 32-35.

hydropower lakes where transmission already exists, and whose combined areas would be much more than enough to generate the nation’s entire electrical needs.
Environmental impact of the resource: the issue of toxicity and environmental footprint of the PV technology is often brought up and should not be ignored. The production of PV uses energy, and as such, has an environmental footprint if this energy is non-renewable, as it will be initially. In the long run however, since, as explained below, PVs and other technologies produce many times their embedded energy over their lifetime, renewable energy could be used entirely in the production chain. The issue of chemical toxicity of PV materials is also a fair question. A fair answer may be to state, that PV production is not much different from glass production, and that after long operating lifetimes, all materials can be recycled almost entirely. Finally, the issue of land occupancy is largely a non-issue in New York since (1) a good part of the solar production could take place on spaces which have already been disturbed, and (2) the total area involved, even at very large penetration levels, is minimal. COST & VALUE Fundamental Value of Solar Energy: Before delving into the short term economic value of solar deployment, it is a good idea to take a step back and look at the long term economic soundness of solar energy. This long term soundness can be simply expressed by one fundamental reality: solar technologies have an energy payback of 4-5 years today and are constantly improving. Therefore, when operated under average conditions these technologies will produce more energy in a few years than is used to construct and install them. With operational lifetimes far exceeding their energy pay-back period, these technologies are, in effect, energy breeders capable of powering themselves into growth for the long term. This is unlike any of the finite resources for which the long term outlook is bleak despite apparently attractive short term economics. Sort term economic realities: The economic reality of PV deployment today is summarized in Table 1. The turnkey cost of a PV installation in 2008 in New York is of the order of $8/Watt. Without incentives, the life-cycle breakeven energy value produced by a PV system would have to be more than 50 cents per kWh, i.e., considerably higher than the current retail price of electricity and almost an order of magnitude higher than wholesale prices achieved with the current New York generation mix of hydro, nuclear, gas and coal. Using the measure of simple payback as a yardstick, it would take almost 100 year for an unincentivized grid-connected PV power plant competing with conventional, polluting generation to pay for itself.

The economic assessment of PV often stops at this point, with an out-of-hand dismissal. Looking deeper into table 1 reveals a different picture. First, with incentives available today in New York, small installations (40 kW and less) would break even at 15-20 cents per kWh, i.e., very close to the current electricity retail range, particularly downstate. Because the PV technology can effectively be deployed on the retail side, PV can already be an economically attractive option today for such installations. This breakeven cost is still substantially higher than wholesale generation. However, a recent study commissioned by the New York Solar Energy Industry Association and the Solar Alliance4 shows that, because PV generates power at times of greatest need, it can capture a wholesale value substantially higher than the average wholesale generation price. Most experts believe that by 2015, PV turnkey costs will be well within the $3-$5 per Watt range. In fact this price range has already been reached in the large Japanese market, and for large, multi-megawatt PV installations recently bid in California. No technological breakthrough will be needed to reach this price range, just a combination of the following factors: an easing of the silicon shortage resulting from the massive current silicon manufacturing build-up worldwide, some supply-demand relief in the hottest markets on the demand side resulting from a leveling of subsidies in maturing markets and from the sustained PV manufacturing growth currently nearing 50% per year. Longer terms prospects (2020-25) call for turnkey system costs at in the range of $2-3/Watt. By 2015 the breakeven cost of PV generation will be respectively 25 cents per kWh without incentives and 8-12 cents with current incentives, and respectively 15 cents and 6-9 cents by 2025, bringing PV substantially below retail rates, even without incentives and close to the present wholesale range. Two key questions arise: (1) What will the retail rates be in 2015 and 2025? (2) What will the incentives be and how will they be justified? The two are closely linked because incentives have been implemented to level the playing field, i.e., to account for the fact that the rates at which electricity is bought and sold today do not yet reflect all the costs involved and all the value PV would bring to the table both from a utility and a ratepayer/taxpayer standpoint. For the utilities, the unaccounted PV value and generation costs are:
• Transmission & Distribution capacity deferral value (because PV provides stress reduction on the power grid at peak time, reducing wear and tear and postponing needed upgrades)
• Loss savings (because of reduced energy transmission losses by producing power near point of use)
4 Perez, R. and T. Hoff, (2008) Energy and Capacity Valuation of PV Power Generation in New York, NYSEIA/Solar-Alliance Publication

• Environmental compliance value (which utilities only pay today for Sox and Nox compliance, but not for green-house gas emissions -- a potentially staggering amount, once the full extent of possible damage will have been internalized)
• Fuel price hedge protection (i.e., the insurance against future commodity price increases, because the solar fuel is free and quasi-limitless – this a potentially large amount as well, given recent price trends all traceable to supply limits in face of increasing demand -- Crude oil prices has been in the news of late, but all energy generation commodities (coal, gas and nuclear fuel) have experienced considerable increase for the very same reason: high demand and finite supply. To get an idea of the rate impact, think that hedging a 5-fold energy-generating commodity price increase between now and 2030 is, alone, worth 30 cents per kWh.
For the ratepayers/tax payers the unaccounted PV value and generation costs are:
• Long-term, system-wide rate protection (from energy commodity price hedging) • Environmental health benefits (from reduced emissions) • Business development opportunities (job and business creation resulting from
solar business development) • Use of in-state resource and reduction of state imports • Power grid security enhancement • Disaster recovery • Reduction of the need to protect conventional energy resource pathways.
These values and costs will directly or indirectly provide value to PV via sustained incentives, conventional rate increases, or other tradable such as Renewable Energy Credits or RECs where the environmental value of renewable electricity is traded independently from its strict energy value on a per kWh basis. From a PV producing standpoint, RECs are equivalent to PV preferential tariff, or feed-in tariffs, available in much of Europe today. Hence the paybacks periods reported for the foreseeable future in Table 1 are likely to be upper limits and could well be considerably shorter.
TABLE 1

2008 2015
Turnkey Cost $7-8/Watt $3-5/WattBreakeven kWh cost no incentives 50 cents/kWh 25 cents per kWhBreakeven kWh cost with incentives* 15-20 cents per kWh 8-12 cents per kWhRetail electricity cost per kWh 10-25 cents per kWh **Wholesale electricity cost per kWh 5-10 cents per kWh + **Solar coincident wholsesale cost per kWh 7-13 cents per kWh + **Simple pay back years no incentives (retail) 30-65 years less than 15 years **Simple pay back yeas with incentives (retail) 9-25 years less than 5 years **Simple pay back years no incentives (wholesale) 60-125 years Less than 30 years **Simple pay back yeas with incentives (wholesale) 20-48 years Less tan 10 years *** Only achievable today in New York for systems smaller than 40 kW
+ Perez, R. and T. Hoff, (2008) Energy and Capacity Valuation of PV Power Generation in New York, NYSEIA/The Solar Alliance Publication�** we are refraining to make future rate projections, noting that current rates do not yet factor in the costs listed below . Threfore the payback period listed above are likely to be shorter
Cost of global warming mitigationAllowance for future commodity cost increase from resource depletionCost of protecting energy supply routesCost of insuring power grid reliability/security for the long term
POLICY MATTERS: LEADING PV MARKET SUCCESS Generally, new technologies involve significant investments of both time and money before they achieve a meaningful impact for society. Sometimes, money can substitute for time, as for example, with R&D budgets that can accelerate the optimization of engineering efficiencies. After engineering efficiencies are maximized however, the next round of significant cost reductions is generally wrung from the economies of scale of mass production. This pattern is also true of solar PV, where the cost of the technology has fallen from $100/watt (effectively $5/kWh) in the early 1970’s to well under $4/watt today. If PV cost reductions are to continue, the role of government policy in spurring market activity is critical to private sector investment decisions. If the solar industry sees a multi-year government commitment to the market, the scale of investment needed to achieve cost reductions will be made. This has been proven. Similarly, it has also been shown that without continued government support now, the cost reductions that come from scaled production in both the manufacturing and service/installation sectors of this market will be stalled. The PV industry got its start in the U.S. in 1953 when Bell Labs, a U.S. company, initiated a PV commercialization effort focused on communications technology. For the next 3 decades, US companies and scientists were the world’s leaders in the industry, pioneering the use of PV in space applications and remote power installations as well as in military and private communications systems. However, beginning in the 1980’s and accelerating in the 1990’s, US companies began dissolving their PV divisions or selling them to European or Asian companies for pennies on the dollar. This move was precipitated by the retreat of US policy support for solar technologies while other countries, notably Germany and Japan, began to implement policies to foster the growth of their solar industry. Today, the U.S. has lost its leadership position, as major corporations such as Sharp, Inc. and Kyocera, Inc., as well as new players such as Q-Cells A.G. of Germany and Sun Tech, Inc. of China have, through smart business savvy

supported by sound government policies, taken the lead. The good news for the U.S. is that it is not too late to adopt policies to create both markets and manufacturing jobs to support the emerging U.S. marketplace. The lessons learned from these other countries is that thoughtful government policies will spur not only the deployment of the technology, but also an industry that is capable of employing tens of thousands of workers. For example, in the early 1990’s, Japan created the first aggressive effort, the 1,000 Solar Roofs program, designed to encourage deployment of PV technology and reduce its costs. By providing consumers with a program of incentives that declined over time, Japan saw the cost of solar technology fall steadily while the number of installations rose dramatically. When the program began in 1994, the installed cost of a PV system was approximately $16/watt. With a government incentive of $7/watt, about 500 systems were installed that year. However, as the market for the technology grew over the next 13 years, system costs fell by almost 75% while the number of installation rose to 70,000 per year. Further, the program yielded both manufacturing and installation cost reductions as the cost of grid power continued to rise. Therefore, the incentives needed to encourage deployment also declined dramatically to less than 5% of what they were when the program began. Today, the Japanese PV market has essentially achieved grid parity and Japan’s corporations have become the world’s leaders in technology manufacturing. On the heels of this success, Germany created its program – 10,000 Solar Roofs. While Japan’s program was focused on installation cost incentives ($/watt), the German program was premised on a mechanism – the Feed In Tariff (FIT) – that paid for the production of energy from the solar system (cents/KWh). The FIT began in the early part of this decade and has resulted in an astounding growth in both the number of systems deployed as well as the amount of energy produced. Mandated by the federal government for a period of 20 years, the German banking system uses this revenue stream as collateral for financing the installation. As such, no up front rebates are paid and both the costs of the incentives and amount of government bureaucracy are minimized. Yet, the results are unprecedented. In the past 5 years, Germany – a country that has only 2/3rds of the solar resource of NYS – has installed approximately 3.5 GW of PV5. This amount of PV offers the peaking capacity equivalent of nearly four nuclear power stations. Further, the PV industry has become an important driver of job growth, especially in the economically–struggling regions of the former East Germany. PV is now responsible for 1% of all German industrial jobs6, employing tens of thousands of people. This is an industry that was virtually non-existent five years ago. Today, most of the European Union and a growing number of Asian countries have adopted FITs and other policies that create mechanisms to foster a sustainable market for the technology as well as a manufacturing base to serve these markets. Once these pieces are in place, the financial markets begin to move in and play the vital role of capitalizing market development. Further, Spain has led the way in mandating that solar be incorporated in new constructions and as part of any major renovations. 5 Solar Industry Magazine. August 2008 6 ISES Magazine, May – June 2008

PILLARS OF PV MARKET DEVELOPMENT It is useful to think of the policy mechanisms needed to create a viable solar market as the pillars that support a building. Essentially, there are four pillars that must be included if a sustainable PV market is to flourish in NYS. They are:
1. Interconnection Rules – This is the part of utility policy that deals with safety. While all electric systems should be treated with great caution, PV systems are inherently the safest electric power systems available. However, until recently, it was very difficult or even illegal to install a PV system on your home and connect it to the NYS electric grid. Today, the NYS PSC has adopted a Standard Interconnection Rule (SIR) that allows relatively easy access to the NYS grid for smaller systems of less than 15 kW. Systems of greater size or that are interconnecting at higher voltage levels require greater due diligence (that can still sometimes be expensive and needlessly time-consuming) but are generally able to interconnect in most places in NYS.
2. Net Metering Laws – Net metering is a policy that allows excess energy production from PV systems on building to flow on to the grid and serve local loads in the area. This policy has nothing to do with safety and is strictly a mechanism for accounting for energy used and energy generated and delivered to the utility system. Essentially, under net metering, if a building owner puts PV on their roof top and the PV system produces power in excess of what the building requires, the PV power goes through the building owner’s electric meter and is delivered to the grid. In the process, the building owner’s meter spins backward, providing a credit that is equal to the retail price of the energy purchased through the meter. Since the NYS grid is most vulnerable to a black out at the time when the sun is shining the most, this policy is actually good for the solar system owner, the utility grid and NYS’s rate payers. This policy is important to PV market development because without it, customers will be required to either spend more money on battery banks or risk losing the value of the power they produce. Until recently, NYS’s net metering law was quite restrictive, limiting net metering to residential and farm buildings and, again, making it illegal for commercial, municipal, church and not-for-profit buildings to net meter. However, during the 2008 legislative session, the NYS legislature passed a comprehensive net metering bill that allows for all buildings to net meter up to 2 MW. Governor Paterson signed the bill in August of 2008.
3. Money – As experience in Japan and Germany has shown, a stable, predictable but declining incentive structure that incorporates the value PV delivers to society (economic development, less public health damage from pollution, etc.) and to the utility grid (avoided blackouts, lower cost of peak power purchases, etc.) can and will yield impressive growth numbers. While nationally-derived FIT policies have been the financial incentive mechanism of choice in the EU and, increasingly Asia, US states have only begun to deploy these strategies, opting instead for rebates that reduce the first cost of PV systems. In NYS, the PSC created a small Systems Benefit Charge (SBC) that is paid by all ratepayers and that serves as the revenue stream for the incentive payment to homeowners who install PV. Administered by the New York State Energy Research and Development

Authority (NYSERDA), this program has paid homeowners a rebate equal to $4/watt, which is a little less than 50% of the system costs. Further, homeowners qualify for a tax credit of $5,000 or 25% of the system costs, whichever is less. In total, over the past 3 years, NYSERDA has provided about $7.5 million of incentives annually to homes and businesses in NYS, resulting in the installation of 2 MW per year.7 The PSC is now moving the funding for this program from the SBC to the Renewable Portfolio Standard (RPS). At press time, the NYS PSC is making decisions on the funding levels for PV through 2011. The proposed budget is expected to be about $40 million, which is a significant increase but likely to be insufficient to achieve Governor Paterson’s goal of 100 MW by 2011. Nevertheless, this moves the funding level in the right direction. The recent New York City 35% real estate tax abatement for PV is also a very important move in the right direction.
4. Solar Power Mandates on New Building and Major Renovations – In addition to providing open access to the grid and financial incentives to encourage development, progressive government policy will mandate the incorporation of solar PV in new construction and in major renovations. While incentives mentioned above will be provided for these actions, the fact is that the cost of incorporating solar thermal and PV is lowest at the time of new construction and government policies that mandate it will ensure that all new buildings have a guaranteed supply of clean energy at a fixed, long term price. Recently, former Vice President Al Gore made a speech articulating a vision of 100% renewables in 10 years. Such a goal cannot be achieved without such mandates. To that end, the state of California, following the example set by Spain and, once again, demonstrating its U.S. state policy leadership, adopted a Green Building Law in July of 2008 that will require solar power systems to be installed in all new constructions.
THE GOAL OF PV PROGRAM DESIGN: GRID PARITY In the U.S., the role of government in this arena has always been to foster the creation and advancement of infant technologies that offer an opportunity to provide great benefits for both human and economic development. Today, the goal of government energy programs is to use public funds to support clean energy technologies in a manner that fosters the creation of sustainable markets. Over time, as the technologies mature and the costs decline, public investment is eliminated and the technology stands on its own, without the need for government support. The idea is that the government support will drive down the costs of the new technology so that it can compete in the marketplace. The point at which the costs of owning and operating a PV system are equal to or less than simply buying polluting power from the utility is known as Grid Parity. What will it take to achieve grid parity and what are the characteristics of public private partnerships that seem to be most successful moving the technology there most quickly? To understand what government program strategies are most effective in advancing PV market growth, there is now more than a decade of PV incentive program history to 7 Source: NYSERDA

review. For a bird’s eye view of where NY stands today, look at Table 2. This table compares the design attributes of NYS’s residential PV program with those of other northeastern states (New Jersey and Massachusetts) as well as those parts of the US and the world where policies have resulted in successful programs, including California, Ontario, Canada and Germany. We also show the size of the PV market in these areas in 2007. The attributes presented here are the basic elements of most PV program designs in the U.S. and around the world. PV program designs generally include a financial component as well as a utility billing/interconnection component. In the US, this attribute is known as Net Metering. In the developed world, PV systems that don’t interconnect to the utility grid are not a primary element of market design for government programs and are not discussed here. However, the greatest PV market growth and the greatest benefit of PV to the world will come from grid connected systems. In general, those programs that are simplest to understand and administer have worked best. A discussion of the grid-connected program design attributes and their use in each market is presented below.
TABLE 2 Solar Attribute
NEW YORK
NEW JERSEY
MASS. CALIF. ONTARIO GERMANY
Net Metering 2 MW 2 MW 2 MW 1 MW 500 kW N/A Federal Tax Credit & Cap
Yes - 30% Yes - 30% Yes – 30%
Yes - 30%
N/A N/A
Accelerated Depreciation
Yes Yes Yes Yes N/A N/A
State Tax Credit & Cap
25% –$5,000
No 15% – $1,000
No N/A N/A
Property Tax Exemption/Abatement
Yes/Yes*
*NY City only
Yes/No No/No No/No No/No No/No
Loan Financing Yes Yes No No No Yes Rebate ($/W), System Cap & Annual Budget
$4/W – 40 kW $5
mil.
$4.10/W – 10 kW
$100 mil.
$2 – 5/W – 5 kW <$5 mil.
<$2/W – 50 kW
$300 mil.
N/A No Cap
N/A No Cap
REC Value & Term
Unk >$.50/kWh – 8 Years
$.03/kWh – 3 Years
Paid as Rebate
N/A N/A
FIT Value & Annual Budget
N/A N/A
N/A N/A
N/A N/A
N/A N/A
$.42/kWh Unk.
>$.70/kWh < $1 Bil
07 Market Size 4.3 MW 16.4 MW 1.4 MW 89 MW >100 MW >1,000 MW
Net Metering: Net metering is a utility agreement that allows excess PV generation to be placed on the grid and used by neighboring power consumers. PV system owners whose PV systems are generating more power than their building is using are able to place that power on the grid by sending it through their meter, effectively spinning their meter backward. Without this rule, system designs and, consequently, market activity are severely constrained. This rule is used almost exclusively in the US (For a discussion of what other countries do, see Feed-In Tariffs below).

In 1997, NYS was one of the first states in the nation to adopt net metering. However, the law was limited to small residential systems and, over time as other states passed more progressive net metering laws, NY’s rule came to be a barrier to the development of the PV market in NYS. For example, only about 20% of the systems installed in NYS are non-residential, where as the national average is 60%8. This year, the NYS legislature passed a more progressive law that puts NY in league with other leading PV states including California and New Jersey. Federal Tax Incentives – Investment Tax Credit & Accelerated Depreciation: These dual tax strategies are available nationwide and only recently provided any benefit to residential tax payers ($2,000/system). However, on its own, this federal incentive strategy has not spurred significant market development unless integrated and corresponding incentive and interconnection programs were implemented at the state level. Further, industry needs a stable, long term commitment to give it both the time and the confidence in the market to make investments that will drive down costs. To date, neither Congress nor the President has secured a long term commitment for this tax credit. As such, it is set to expire by the end of 2008 and the impacts on the US market place are expected to be significant. State Tax Incentives – Income Tax Credits & Property Tax Exemptions/Abatement: To supplement the federal incentives, some states have adopted an additional state income tax benefit for homeowners who install solar PV systems. Here, NYS has been a leader, offering a tax credit of up to $5,000 (capped at 25% of system costs). However, while this can be an important ingredient in making markets work at the state level, it has not been used by other states that have achieved meaningful PV penetration and, by itself, it has not proven to be a market maker in NYS. NYS also exempts the value of a solar system in the calculation of property taxes. Nevertheless, the elimination of this tax is important to removing barriers to PV market growth, but not an important market development tool. Finally, New York City has adopted a property tax abatement strategy that will allow building owners to claim up to $62,000 in tax abatement towards the cost of their PV system (capped at 35%). Low Cost Financing: Given that the defining, limiting characteristic of both energy efficiency and renewable energy technologies is the need to capitalize an upfront investment so that one can capture a stream of benefits overtime, low cost financing can be an important and effective part of a successful PV program design. Essentially, government &/or utilities who have access to lower cost capital use that leverage to buy down the interest rate on loans to consumers who install PV systems. Interestingly, the effectiveness of the loan in spurring the market depends on the availability of other program elements. For example, no loan program is available in California, yet over an order of magnitude more PV was installed there than in NYS. At the other extreme, low cost financing has been very important to Germany’s success, where an order of magnitude more PV was installed in 2007 than in California. This is discussed further in the Feed-In Tariff discussion below. 8 IREC Report: 2007 US Solar Market Trends, Sherwood, pg. 8.

Rebate Amounts, System Size Caps & Annual PV Incentive Budgets: One more successful means of encouraging private sector investment in PV technology in the US is through the provision of cash incentives in the form of after-purchase rebates. Under these rebate schemes, utility ratepayers pay into a fund that provides a rebate for a portion of the installed cost of the system. Typically, installed costs average $8/watt. Rebate amounts range from under $2/watt in California, where ample sunshine and lower installation costs require a lower incentive, to as much as $5/watt in niche markets in Massachusetts. NYS, at $4/watt, has a fairly lucrative rebate amount. However, as a result of its net metering limitations (changed in 2008) and a limited total budget for PV incentives ($5 million/year, though this is increasing), the rebate has been capped at 40 kW, resulting in al low NYS’s total market compared to other states and other countries. Solar Renewable Energy Credits (SREC’s): One of the primary drivers of the development of clean energy is that it is pollution free. As such, one of the benefits of clean energy deployment is cleaner air. A market for Renewable Energy Credits (REC’s) has been created. These credits are traded similarly to the way stocks are traded. Generators must be certified to be credited with REC’s, but simply speaking, for each megawatt-hour (MWh) of PV energy generation, the owner of the system is awarded 1 SREC. The SREC market is immature and at this point, the SREC’s are not easily traded across state lines. Nevertheless, some states, notably New Jersey, have established SREC markets that are working to seed PV market activity. Feed-In Tariff: A Feed-In Tariff (FIT) is a utility rate agreement whereby the owners of PV systems connect those systems directly to the utility grid and receive a payment, funded by all ratepayers, for the power their systems generate and deliver to the grid. All of the power generated is delivered to the grid and then repurchased by the host site for use in the building upon which the system is located. The rate paid for the PV power placed on the grid is generally quite high and this strategy has resulted in the largest and most successful PV markets in the world. For example, in 2006, Ontario, Canada enacted a FIT that paid 42 cents (Canadian) for every kWh generated by a PV system and delivered to the grid. Over the past 2 years, Ontario’s Renewable Energy Standard Offer Program (RESOP) has exceeded all expectations - achieving an excess of 1,000 megawatts of contracted projects - surpassing the 10-year target for renewable energy in the first year of the program! This represents a potential investment of almost $5 billion in new renewable energy supply projects. 9 An even more successful result has been achieved in Germany, the pioneer of the FIT concept as a clean energy development strategy. With a solar resource equivalent to northern Maine, Germany is installing more than 1,000 MW of PV each year. This is greater than the capacity equivalent of one of the Indian Point nuclear plants and by this time in 2009, Germany will have installed more PV capacity than all of the Indian Point plants combined. And while this represents more than a 10 fold increase in the PV 9 Ontario Power Authority Website: http://www.powerauthority.on.ca/sop/Page.asp?PageID=122&ContentID=6555&SiteNodeID=412
deployment success of California, the cost of Germany’s success has been achieved at a fraction of the cost/kWh from the rebate approach used in California. Germany’s FIT is codified in law. As a result, the assured availability of a feed in tariff allows the German banking industry to collateralize the FIT revenue stream, ensuring access to capital needed to buy and install the systems.
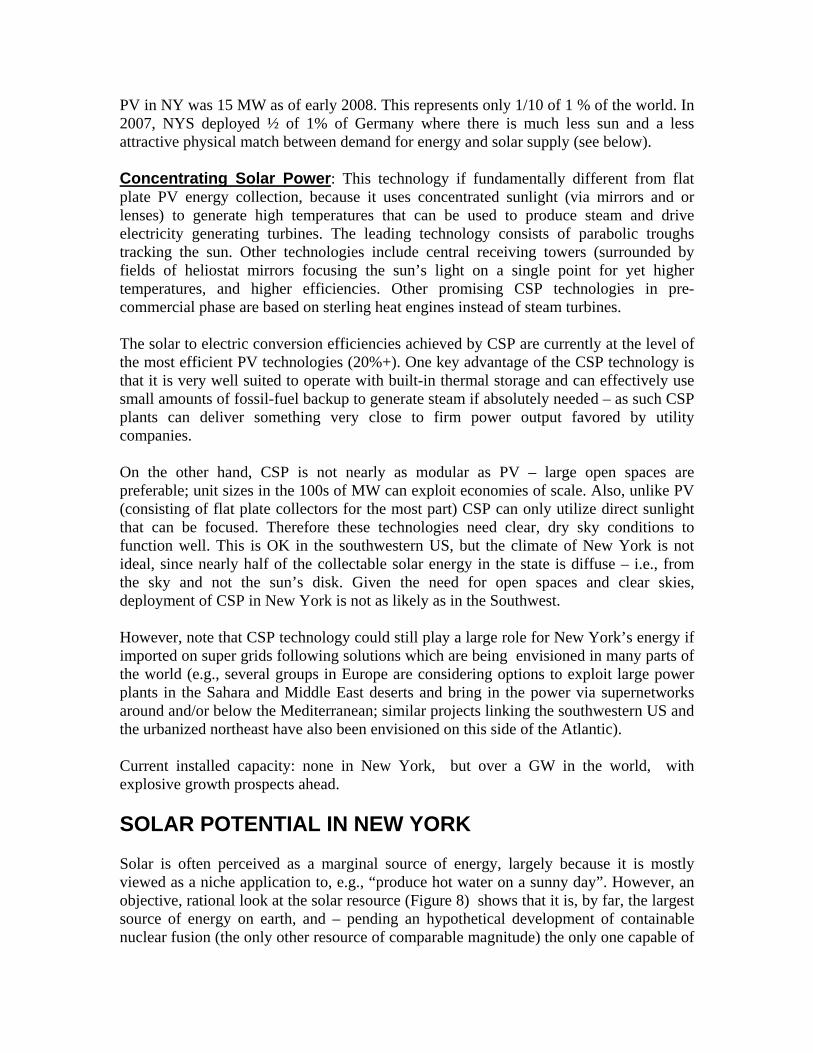
Fig. 10 Rate Impacts of FIT (EEG) on German Utility Bills10 Figure 1 provides a breakdown of cost components required to provide one kWh of electricity to a typical residential utility customer in Germany. The average rate per kWh paid by German utility customer was 20.7 Euro-cents in 2007. The portion of the German FIT (EEG) was 1 Euro-cent per kWh or just under 5% of the costs for a kWh of household electricity in 2007. In 2007, the cost of Germany’s FIT to the average household with an electricity consumption of 3,500 kWh per annum was around 3 Euro per month. However, what is not presented here is the fact that the PV power that was delivered to the German grid was displacing even more expensive power and ultimately resulted in a net savings to the typical German family. Here’s how this works. The market price of electricity is determined by the most expensive power station still needed to satisfy the demand for electricity (merit order). Because priority is given to FIT-generated PV energy, demand for conventional electricity is reduced. As a result, the most expensive power plants are no longer needed to meet demand, and the market price falls accordingly. This effect is also known as the merit order effect. As the market price is the most important price indicator for the electricity market as a whole, the FIT therefore not only leads to considerable price reductions on the market, but should also lead to savings for all customers. This effect has been quantified on the basis of a detailed electricity market model (PowerACE) used by the German government.11 Further, the implementation of the FIT in Germany has allowed German industry to take a dominant 10 Courtesy of German Renewable Energy Association DENA, www.dena.de 11 August 08 Email Interview, Christina Heldwein of the German Renewable Energy Association (DENA)

role in the manufacture of PV technology, resulting job growth and cost savings. Spain offers a similar tariff and is now quickly establishing its leadership position in this global marketplace. The rest of the European Union is now following suit.
California also offers a feed-in tariff, though it differs from the similarly named European "feed-in tariffs. The European model includes an incentive payment for PV generation. Under the feed-in tariffs in California, customers are paid for the cost of generation based on the value of electrical generation to the grid at the time it is generated, but is not intended to embed a subsidy or rebate in the price offering.
The California feed-in tariff allows eligible customer-generators to enter into 10-, 15-, or 20-year standard contracts with their utilities to sell the electricity produced by small renewable energy systems -- up to 1.5 megawatt (MW) -- at time-differentiated market-based prices. The price paid will be based on the CPUC’s market price referent (MPR). Time-of-use adjustments will be applied by each utility and will reflect the increased value of the electricity to the utility during peak periods and its lesser value during off-peak periods. A special, higher-level rate is provided for solar electricity generated between 8 a.m. and 6 p.m.
2007 Market Size: In spite of the policy and financial limitations identified here, New York’s PV market has continued to grow. Still, that growth has been capped by the limited incentive budget. In 2007, NYS installed just over 4 MW of PV. New Jersey, who started it program later than NYS, deployed four times as much. California, which has a more mature program, installed 20 times what NYS did. However, Germany’s FIT resulted in the installation of over 1,000 MW.
REGULATORY POLICY & POLITICAL REALITIES IN THE US In the US, government policy support for PV has reflected the character of the structure of our government. For example, unlike Germany where the delivery of utility service is overseen by national laws, most activity by electric power companies in the United States is regulated at the state level. Therefore, a German type FIT is not achieved simply by passing a single, federal law. Further, US policymakers tend to focus on the use of tax policy to spur market development. As a result, in the US at the federal level, an Investment Tax Credit (ITC) has been the mainstay of the PV industry. Supporting the federal tax incentives are a wide variety of state and local laws and incentives that are necessary to allow connection to the local utility grid or to make an investment in PV financially viable. In the US, there must be state level laws and incentives that are combined with federal support or PV markets don’t exist. For example, in the US, California and New Jersey are the leaders. While many assume that California would lead because of amount of the sun it gets, a thoughtful policy strategy can seed a viable market for the technology as we have seen in Germany . CONCLUDING REMARKS

Encouraging the deployment of end-use specific solar technologies is important because direct utilization of solar energy embodies the highest operating efficiencies, and can be integrated directly with energy conservation: solar hot water production, passive solar heating and daylighting could easily be implemented in most new constructions and retrofitted in many. However the real story for solar in New York lies with solar electricity production, because electricity is not end-use limited and can eventually be used and/or transformed to reach virtually all energy consumption sectors. In this respect the solar potential of the State of New York is very large – less than ½ % of the State’s area could generate all of the electricity consumed by the State. On a planetary scale, solar energy is probably the only resource that is both large enough and acceptable enough carry the growing planet’s demand for the long haul. While long term solar energy prospects are virtually limitless, large scale implementation will require the development of energy transformation and storage infrastructures (a cost, but also a large business opportunity for the Sate). There is however a sizable initial solar deployment opportunity (at least 6,000 megawatt worth) which would provide high value and security to the power grid, without any significant change in infrastructure; This opportunity would be targeted to mitigating summer peak loads in the cities of New York, reducing the risks of outages and the postponing the need for grid and conventional (polluting) peak generation upgrades. Much of the value that PV would bring to New York today cannot be captured directly by PV operators – e.g., the value from displacing green house gases, displacing the emissions from summer peaking units, reducing the need for finite energy imports and building a hedge against their eventual depletion, providing transmission and distribution benefits via stress reduction, and creating more jobs per kWh than other resources. It is important that elected official continue to provide the indirect support that makes up for this lack of accounting at the business level (via, buy-downs through NYSERDA, tax credits depreciation and renewable energy credit trading), while noting that the most successful programs in the world have streamlined this process by removing multiple source complexities and making it simple for users and developers – in France, for instance, one only needs to connect a PV system on the power grid and receive an appropriate feed-in solar tariff bundling all high values as quantified by the country’s regulators. While the physical potential is sound and large and the attributes of solar are perfectly aligned with needs of NYS’s power grid, the existing business and regulatory environment has served to discourage and prevent the installation of PV in NYS. While NYS is making progress, the reality is that all four policies pillars must be addressed for the market to work. In fact, if done properly, the market will blossom. The historically hostile regulatory environment that the PV industry has faced in NYS is changing. NYS’s utilities are also, slowly, coming to understand the potential business opportunities that PV represents as well as the public’s favorable view of utilities that
adopt solar-friendly policies. While NYS’s leaders are in strong support of PV, they are also becoming more sophisticated in their understanding of the policy tools needed to achieve market success. Due to a number of factors – the size of our electric load, the relationship between peak load and available sunshine and the amount of solar energy NYS receives, NYS should be the 2nd largest market for PV in the US. Further, because of these very same factors, NYS should be one of the top 10 markets in the world. As important as this would be for the environment, it is even more important for NYS’s rate payers and our NYS economy. A rapid, large scale deployment strategy could serve to drive down the cost of utility service for all customers/classes while making NYS a world leader in job growth and economic development.