deformation this concept gives a brief idea about the deformations that occur in a ductile material...
TRANSCRIPT

DeformationThis concept gives a brief idea about the deformations that occur in a ductile
material undergoing tensile stress test.
AuthorsParul Goradia
Arijit Lodh
Mentor Prof. P. Pant
Subject: Metallurgy (Mechanical behaviour of materials )

Learning ObjectivesAfter interacting with this Learning Object, the learner will be able to:
• Read the graph on stress and strain curves.
• Identify yield stress given any graph on stress and strain curves.
• Identify strength given any graph on stress and strain curves.
• Compare ductility of material given any graph on stress and strain curves.

Master Layout 1:
5
3
2
4
1
http://www.educationalelectronicsusa.com/p/gravitation_IV.htm
Springa
b
c
dLoad
Displacement
St ress
Strain
Graph 1 Graph 2

1
5
3
2
4
Step 1: T1: Analogy of spring balance
Interactivity type (IO 1/IO 2)
Instruction to learners
Boundary limits & options
Instruction to animators
Results and output
Drag and drop
Drag the load to the spring balance and observe the spring
200 grams, 450 grams, 750 grams and 2 kg stones.
•Stones appear one after another 200 gm. Then 450 gm. then 750 gm. and then 2 kg stone.
•Once the child has placed the load the graph reading starts (graph 1)
•After reading on graph shown then remove button appears and the stone is removed and next stone appears.
•Graph 1:
–As the learner drops the 200 gm stone the first red dot appears. Spring stretches and when stone removed then spring returns to original size (zoomed image)
–As the learner drops the 450 gm stone the 2nd red dot appears. Spring stretches and when stone removed then spring returns to original size. (zoomed image)
–As the learner drops the 750 gm stone the 3rd red dot appears. Spring stretches and when stone removed then spring remains stretched. (zoomed image)
–As the learner drops the 2 kg stone the 4th red dot appears. The spring breaks across the middle. (zoomed image)
Zoomed image of the
spring
Springa
bc
d
Displacement
Graph 1
Load
reading
Remove Stone
New stoneshown here

1
5
3
2
4
Step 2: T1: Analogy of spring balance
Zoomed image of the
springSpring
Strain
Graph 2
Stress
reading
Instruction for the animator Audio narration (if any)
Text to be displayed in the working area
(DT)
• Previous animation is replayed without the interactivity and along with that show graph 2.
• In graph 2:
– As the 200 gm stone is weighed the black line appears till the white dot. Spring stretches and when stone removed then spring returns to original size (zoomed image)
– As the 450 gm stone is weighed the black line appears till the 1st blue dot. Spring stretches and when stone removed then spring returns to original size. (zoomed image)
– As the learner drops the 750 gm stone is weighed the black line appears till the 2nd blue dot. Spring stretches and when stone removed then spring remains stretched. (zoomed image)
– As the 2 kg stone is weighed the black line appears till the red dot. The spring breaks across the middle. (zoomed image)

Master Layout 3:
5
3
2
4
1
http://www.ndt-ed.org/EducationResources/CommunityCollege/Materials/Mechanical/Tensile.htm
http://www.directindustry.com/prod/instron/tensile-compression-testing-machine-18463-41713.html

Master Layout 4:
5
3
2
4
1
http://www.ndt-ed.org/EducationResources/CommunityCollege/Materials/Mechanical/Tensile.htm
http://www.directindustry.com/prod/instron/tensile-compression-testing-machine-18463-41713.html
L3
Stretched 2
L4
Stretched 3
Crack
Fracture
A rodL0
Original
A0
Stretched
L1
A rod L2
Stretched 1
3
1
5
2
4
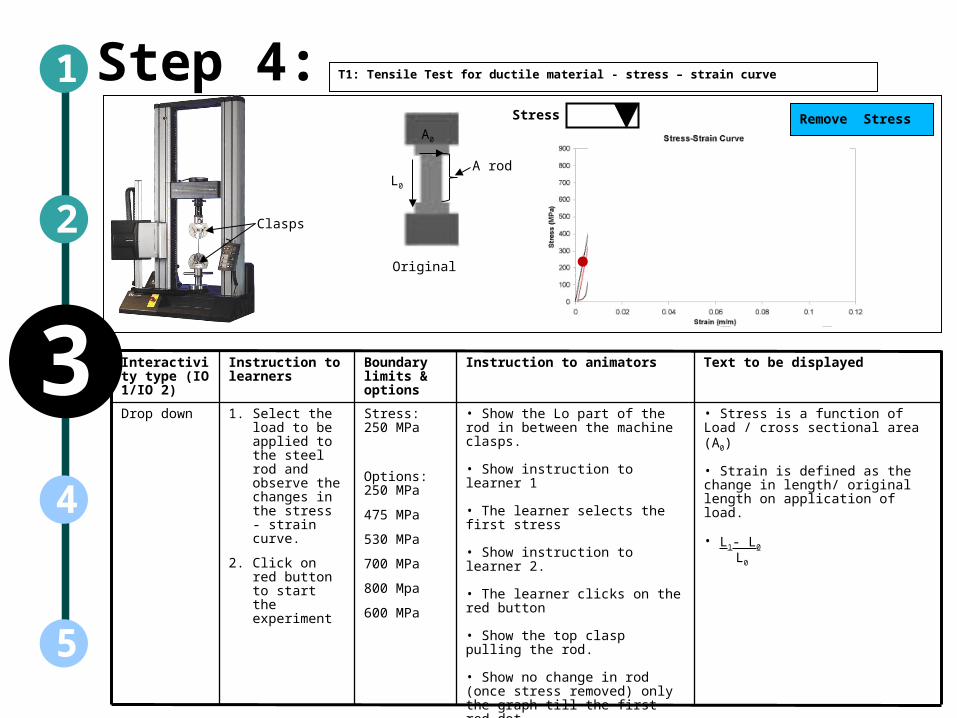
Step 4:
Interactivity type (IO 1/IO 2)
Instruction to learners
Boundary limits & options
Instruction to animators Text to be displayed
Drop down 1. Select the load to be applied to the steel rod and observe the changes in the stress - strain curve.
2. Click on red button to start the experiment
Stress: 250 MPa
Options: 250 MPa
475 MPa
530 MPa
700 MPa
800 Mpa
600 MPa
• Show the Lo part of the rod in between the machine clasps.
• Show instruction to learner 1
• The learner selects the first stress
• Show instruction to learner 2.
• The learner clicks on the red button
• Show the top clasp pulling the rod.
• Show no change in rod (once stress removed) only the graph till the first red dot.
• Stress is a function of Load / cross sectional area (A0)
• Strain is defined as the change in length/ original length on application of load.
• L1- L0
L0
T1: Tensile Test for ductile material - stress – strain curve
Clasps
Stress
A rodL0
Original
A0
Remove Stress
3
1
5
2
4
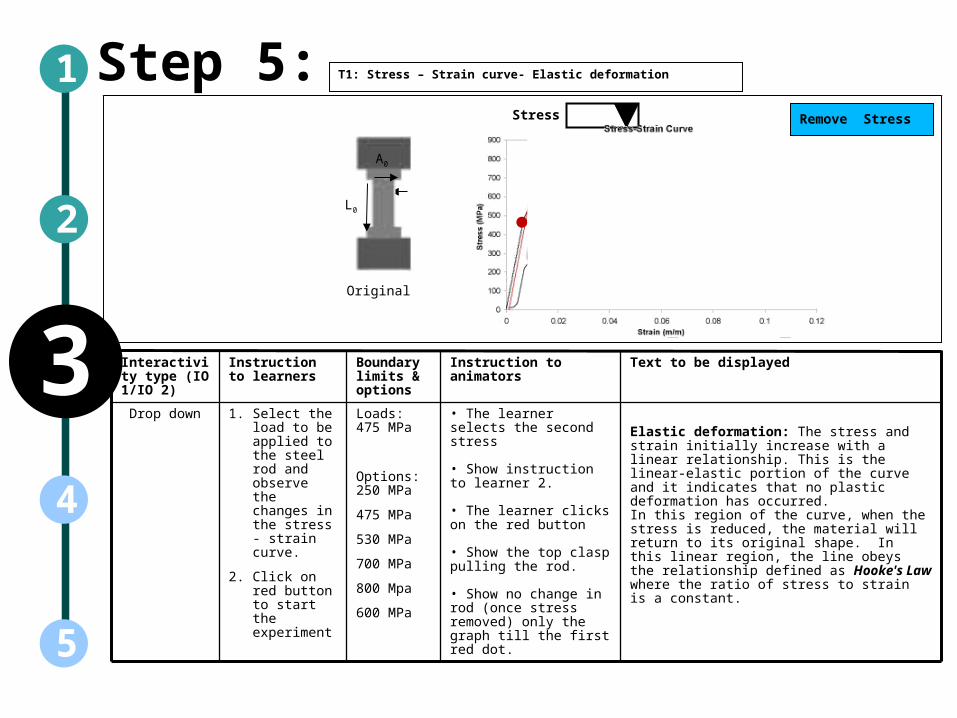
Step 5:
Interactivity type (IO 1/IO 2)
Instruction to learners
Boundary limits & options
Instruction to animators
Text to be displayed
Drop down 1. Select the load to be applied to the steel rod and observe the changes in the stress - strain curve.
2. Click on red button to start the experiment
Loads: 475 MPa
Options: 250 MPa
475 MPa
530 MPa
700 MPa
800 Mpa
600 MPa
• The learner selects the second stress
• Show instruction to learner 2.
• The learner clicks on the red button
• Show the top clasp pulling the rod.
• Show no change in rod (once stress removed) only the graph till the first red dot.
Elastic deformation: The stress and strain initially increase with a linear relationship. This is the linear-elastic portion of the curve and it indicates that no plastic deformation has occurred. In this region of the curve, when the stress is reduced, the material will return to its original shape. In this linear region, the line obeys the relationship defined as Hooke's Law where the ratio of stress to strain is a constant.
T1: Stress – Strain curve- Elastic deformation
Stress
L0
Original
A0
Remove Stress

3
1
5
2
4
Step 6:
Interactivity type (IO 1/IO 2)
Instruction to learners
Boundary limits & options
Instruction to animators
Text to be displayed
Choose Drop down
1. Select the load to be applied to the steel rod and observe the changes in the stress - strain curve.
2. Click on red button to start the experiment
Loads: 530 MPa
Options: 250 MPa
475 MPa
530 MPa
700 MPa
800 Mpa
600 MPa
• The learner selects the third stress load
• Show instruction to learner 2.
• The learner clicks on the red button
• Show the top clasp pulling the rod.
•Show Stretched rod- an increase in the rod by 1 cm (from Lo once stress removed).
•Show the graph till the red dot from previous red dot.
Yield Point and Plastic deformation:In ductile materials, at some point, the stress-strain curve deviates from the straight-line relationship and Law no longer applies as the strain increases faster than the stress.
From this point on in the tensile test, some permanent deformation occurs in the specimen and the material is said to react plastically to any further increase in load or stress.
The material will not return to its original, unstressed condition when the load is removed.
T1: Stress – Strain curve- Plastic deformation
Stress
Stretched
L0
Original
A0
L1
A rod
Remove Stress

3
1
5
2
4
Step 7:
Interactivity type (IO 1/IO 2)
Instruction to learners
Boundary limits & options
Instruction to animators
Text to be displayed
Choose Drop down
1. Select the load to be applied to the steel rod and observe the changes in the stress - strain curve.
2. Click on red button to start the experiment
Loads: 700 MPa
Options: 250 MPa
475 MPa
530 MPa
700 MPa
800 Mpa
600 MPa
• The learner selects the fourth stress load
• Show instruction to learner 2.
• The learner clicks on the red button
• Show the top clasp pulling the rod.
• Show Stretched 1 - an increase in the rod by 1 cm from the stretched rod (L1 once stress removed).
• Show the graph till the red dot from previous red dot.
Yield Point and Plastic deformation:In ductile materials, at some point, the stress-strain curve deviates from the straight-line relationship and Law no longer applies as the strain increases faster than the stress.
From this point on in the tensile test, some permanent deformation occurs in the specimen and the material is said to react plastically to any further increase in load or stress.
The material will not return to its original, unstressed condition when the load is removed.
T1: Stress – Strain curve- Plastic deformation
Stress
Stretched
L2
Stretched 1
L1
A rod
Remove Stress

3
1
5
2
4
Step 8:
Interactivity type (IO 1/IO 2)
Instruction to learners
Boundary limits & options
Instruction to animators
Text to be displayed
Choose Drop down
1. Select the load to be applied to the steel rod and observe the changes in the stress - strain curve.
2. Click on red button to start the experiment
Loads: 800 MPa
Options: 250 MPa
475 MPa
530 MPa
700 MPa
800 Mpa
600 MPa
•The learner selects the fifth stress load
• Show instruction to learner 2.
• The learner clicks on the red button
• Show the top clasp pulling the rod.
• Show Stretched 2- an increase in the rod by 1 cm from the stretched 1 rod (L2 once stress removed).
• Show the graph till the red dot from previous red dot.
•Ultimate Tensile StrengthThe ultimate tensile strength (UTS) or, more simply, the tensile strength, is the maximum engineering stress level reached in a tension test.
•The strength of a material is its ability to withstand external forces without breaking.
T1: Stress – Strain curve – Ultimate tensile stress
Stress
L2
Stretched 1
L3
Stretched 2
Remove Stress

3
1
5
2
4
Step 9:
Interactivity type (IO 1/IO 2)
Instruction to learners
Boundary limits & options
Instruction to animators
Text to be displayed
Choose Drop down
1. Select the load to be applied to the steel rod and observe the changes in the stress - strain curve.
2. Click on red button to start the experiment
Loads: 600 MPa
Options: 250 MPa
475 MPa
530 MPa
700 MPa
800 Mpa
600 MPa
•The learner selects the sixth stress load
• Show instruction to learner 2.
• The learner clicks on the red button
• Show the top clasp pulling the rod.
• Show cracks starting to form (Stretched 3)
•Then show fracture rod.
• Show the graph till the red dot from previous red dot.
•Facture or FailureThe material starts to crack once it has crossed its ultimate tensile strength until the point of complete failure or fracture of the material.
T1: Stress – Strain curve – Ultimate tensile stress
Stress
L3
Stretched 2
L4
Stretched 3
Crack
Fracture
Remove Stress

Master Layout 5:
5
3
2
4
1T1: Stress – Strain curve - New material

Refer master layout 5
3
1
5
2
4
Step 10:
Interactivity type (IO 1/IO 2)
Instruction to learners
Questions Instruction to animators
Results and Output
Choose ( one try)
Read the question and select the correct answer.
What does the red dot in the graph depict?
Options: Yield point, fracture point.
•Show the graph with the two dots.
If yield point is clicked then
Correct! that is the yield point for the given material stress and strain curve.
If incorrect then show ‘ Yield point depicts a change in the curve from a linear elastic curve to a plastic curve. This point onwards strain increases faster than stress. ’
T1: Stress – Strain curve - New material

Refer Master Layout 5
3
1
5
2
4
Step 11:
Interactivity type (IO 1/IO 2)
Instruction to learners
Questions Instruction to animators
Results and Output
Click ( one try)
Read the question and click on the correct area in the graph.
Locate the ultimate tensile strength of this material.
•Show the graph without the yellow dot.
If the learner click in the area of the yellow dot it is correct.
Correct that is the ultimate tensile strength for the given material stress and strain curve.
If the learner click anywhere outside the dot region then show ‘Tensile strength, is the maximum engineering stress level reached in a tension test’
T1: Stress – Strain curve
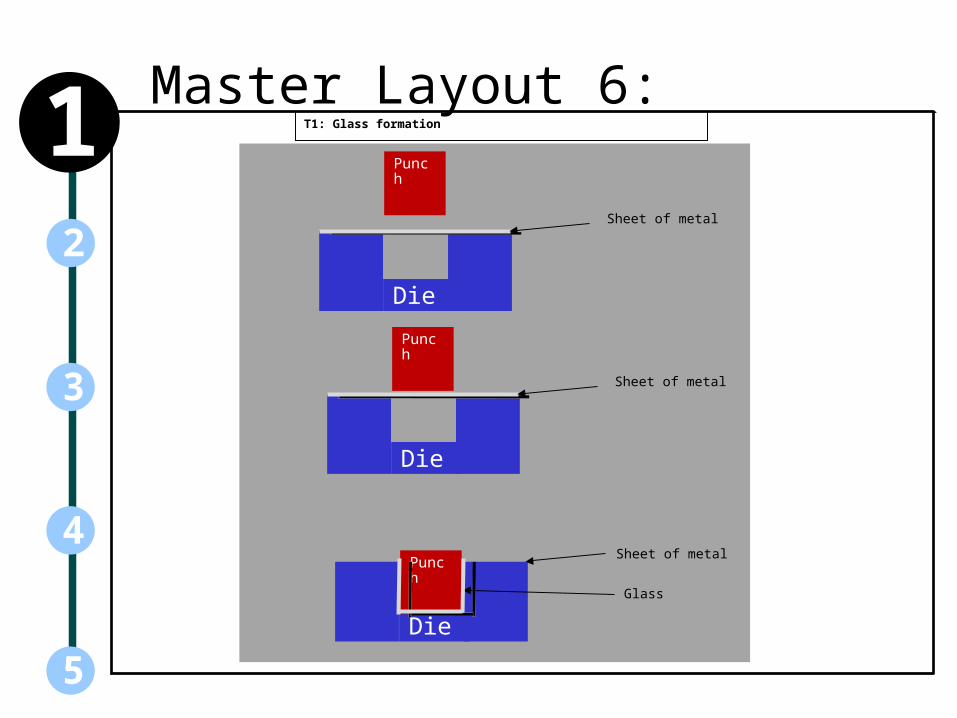
Master Layout 6:
5
3
2
4
1 T1: Glass formation
Die
Punch
Sheet of metal
Die
Punch
Sheet of metal
Die
Punch
Glass
Sheet of metal

3
1
5
2
4
Step 12:
Interactivity type (IO 1/IO 2)
Instruction to learners
Questions Instruction to animators Results and Output
Choose( one try)
Read the question and click on the correct answer
If you are given a sheet of metal to convert to a glass, which deformation would you choose?
Options: Plastic deformation, Elastic deformation.
•Show the sheet of metal.
•If the elastic region is chosen
• Show the punch dropping on the sheet of metal forming the glass.
•Once punch removed show it spring back to the sheet of metal.
•If the plastic region is chosen
• Show the punch dropping on the sheet of metal forming the glass.
•Once punch removed show the glass as it is.
If plastic deformation is clicked then
Correct! In plastic deformation the material changes shape.
If incorrect then show ‘In elastic deformation, when the stress is reduced, the material will return to its original shape’
T1: Glass formation from a sheet of metal
Die
Punch
Sheet of metal

Master Layout 7:
5
3
2
4
1 T1: Slope and stiffness
Strain
Stress
Strain
Stress
Steel springPlastic spring

3
1
5
2
4
Step 12:
Interactivity type (IO 1/IO 2)
Instruction to learners
Questions Instruction to animators
Results and Output
Choose( one try)
Read the question and click on the correct answer
A man applying the same strength to pull both the springs. Which of the springs would be more stiff?
Options: Steel spring, Plastic spring
• show a mans hand on the sides of the springs.
•Show text 1.
•Show the question.
•After learner clicks on the option show the plastic spring stretching a lot (50 mm).
•And the steel spring stretching 1 mm.
•Show the two graphs
1. Stiffness is resistance of a material to elastic deformation.
(Correct answer is steel spring)(If correct then show) ‘You are correct conform your answer by clicking on view the animation.
(If incorrect then show) ‘ You are incorrect clarify your thinking by clicking on view the animation.
T1: Slope and Stiffness
Steel springPlastic spring
View the animation
Strain
Stress Strain
Stress
http://www.go-ride.com/SPD/2-25-x-500--12510000-1105570016.jsp , http://www.fotosearch.com/ITS363/itf272059/

1
5
3
2
4
Instruction for the animator Audio narration (if any)
Text to be displayed in the working area (DT)
• Show the lines in blue with the label. Do not show the red line in the graph.
The higher the slope the higher the stiffness.
The slope of the line in the elastic deformation region is called the modulus of elasticity or Young's modulus.
The modulus of elasticity (E) defines the properties of a material as it undergoes stress, deforms, and then returns to its original shape after the stress is removed.
It is a measure of the stiffness of a given material.
To compute the modulus of elastic , simply divide the stress by the strain in the material.
Step 13: T1: Slope and stiffness
Strain
Stress
σ1
σε1
ε

3
1
5
2
4
Step 14:
Interactivity type (IO 1/IO 2)
Instruction to learners
Questions Instruction to animators
Results and Output and text to be displayed
Choose( one try)
Read the question and click on the correct answer
Which of the following is more ductile?
Options: chalk, silver wire
• Show text 1.
•Show the question.
1. Ductility is the maximum elongation before failure/ fracture.
(Correct answer is silver wire)(If correct then show) ‘You are correct silver wire is more ductile than chalk’
(If incorrect then show) ‘ Chalk breaks faster and is more brittle’
T1: Ductility
Silver wire chalk
Question:
http://www.laventure.net/tourist/cables.htm , http://youngvision.blogspot.com/2009/02/where-chalk-faced-children-play.html

3
1
5
2
4
Step 16:
Interactivity type (IO 1/IO 2)
Instruction to learners
Questions Instruction to animators
Results and Output
Drag and drop
Drag and drop the stress – strain curve its appropriate material.
Options: chalk, silver wire
• graph 1 is for chalk and graph 2 for silver wire.
Correct answer is graph 1 for chalk and graph 2 for silver wire:
If incorrect answer show ‘Try again!’
If correct the show ‘Therefore a material that takes more stress before failure or fracture the higher is its ductility.’
T1: Ductility
Ductility
Ductility

Concepts:
5
3
2
4
1• Stress: Stress is defined as force per unit area. It has the same units as pressure,
and in fact pressure is one special variety of stress. However, stress is a much more complex quantity than pressure because it varies both with direction and with the surface it acts on.
• Strain: Strain is defined as the amount of deformation an object experiences compared to its original size and shape. For example, if a block 10 cm on a side is deformed so that it becomes 9 cm long, the strain is (10-9)/10 or 0.1 (sometimes expressed in percent, in this case 10 percent.) Note that strain is dimensionless.
• Elastic deformation: This type of deformation is reversible. Once the forces are no longer applied, the object returns to its original shape.
• Plastic deformation: This type of deformation is not reversible. However, an object in the plastic deformation range will first have undergone elastic deformation, which is reversible, so the object will return part way to its original shape.
• Fracture: This type of deformation is also not reversible. A break occurs after the material has reached the end of the elastic, and then plastic, deformation ranges. At this point forces accumulate until they are sufficient to cause a fracture. All materials will eventually fracture, if sufficient forces are applied

Concepts:
5
3
2
4
1• Yield point: The first point at which permanent deformation of a stressed
specimen begins to take place. This is a point on the stress-strain curve at which the increase in strain is no longer proportional to the increase in stress.
• Strain: Strength is the ability of a material to resist deformation. The strength of a material is the maximum load (stress) that a material can undergo before failure is apparent.

Analogy / Scenario / Action1
5
3
2
4
•Master layout 1 shows a spring balance measuring stones of different types. Initially as the load increases the displacement increases.
•Then later as the stress increases the strain also increases but the spring comes back to its place.
•Later as more stress increases the strain stays almost the same and the spring does not go to its original shape.
•After more stress is added the spring breaks from the center.

Questionnaire1.
Answers: a) b) c) d)
2.
Answers: a) b) c) d)
3.
Answers: a) b) c) d)
4.
Answers: a) b) c) d)
5.
Answers:
a) b) c) d)
1
5
2
4
3
Links for further reading
Reference websites:http://www.ndt-ed.org/EducationResources/CommunityCollege/Materials/Mechanical/Tensile.htm http://www.engineersedge.com/strength_of_materials.htm http://www.feppd.org/ICB-Dent/campus/biomechanics_in_dentistry/ldv_data/basic.htm http://www.ndt-ed.org/EducationResources/CommunityCollege/Materials/Mechanical/Tensile.htm http://www.feppd.org/ICB-Dent/campus/biomechanics_in_dentistry/ldv_data/basic.htm
Books:Mechanical Metallurgy – George E. Dieter
Research papers:
Summary• Elastic deformation:
• The stress and strain initially increase with a linear relationship.
• In this region of the curve, when the stress is reduced, the material will return to its original shape.
• Yield point: From this point on in the tensile test, some permanent deformation occurs in the specimen.
• Plastic deformation: The material will not return to its original, unstressed condition when the load is removed.
• The ultimate tensile strength (UTS) or, more simply, the tensile strength, is the maximum engineering stress level reached in a tension test.
• Failure/ Fracture: The point at which the material breaks.• Stiffness is resistance of a material to elastic deformation. The higher the elastic slope the higher
the stiffness of the material.• Ductility is the maximum elongation before failure/ fracture.