de_lange__healy_1994_stability_inner_shelf_dredge_spil_mounds_tga
DESCRIPTION
http://www.mtm.ac.nz/images/pdf/publications/De_Lange__Healy_1994_Stability_Inner_Shelf_Dredge_Spil_Mounds_Tga.pdfTRANSCRIPT

Coastal Education & Research Foundation, Inc.
Assessing the Stability of Inner Shelf Dredge Spoil Mounds Using Spreadsheet Applications onPersonal ComputersAuthor(s): Willem De Lange and Terry HealyReviewed work(s):Source: Journal of Coastal Research, Vol. 10, No. 4 (Autumn, 1994), pp. 946-958Published by: Coastal Education & Research Foundation, Inc.Stable URL: http://www.jstor.org/stable/4298287 .
Accessed: 04/12/2012 20:27
Your use of the JSTOR archive indicates your acceptance of the Terms & Conditions of Use, available at .http://www.jstor.org/page/info/about/policies/terms.jsp
.JSTOR is a not-for-profit service that helps scholars, researchers, and students discover, use, and build upon a wide range ofcontent in a trusted digital archive. We use information technology and tools to increase productivity and facilitate new formsof scholarship. For more information about JSTOR, please contact [email protected].
.
Coastal Education & Research Foundation, Inc. is collaborating with JSTOR to digitize, preserve and extendaccess to Journal of Coastal Research.
http://www.jstor.org
This content downloaded by the authorized user from 192.168.82.206 on Tue, 4 Dec 2012 20:27:39 PMAll use subject to JSTOR Terms and Conditions

Journal of Coastal Research 10 4 946-958 Fort Lauderdale, Florida Fall 1994
Assessing the Stability of Inner Shelf Dredge Spoil Mounds Using Spreadsheet Applications on Personal Computers Willem de Lange and Terry Healy
Marine Geosciences Group Department of Earth Sciences
University of Waikato Private Bag 3105
Hamilton, New Zealand
ABSTRACT
DE LANGE, W. and HEALY, T., 1994. Assessing the stability of inner shelf dredge spoil mounds using spreadsheet applications on personal computers. Journal of Coastal Research, 10(4), 946-958. Fort Lau- derdale (Florida), ISSN 0749-0208.
Three methods, viz. the HANDS and ALLISON (1991) method, predictions of sediment threshold, and predictions of sediment transport rate, are used to assess the long term stability of dredge spoil mounds on the inner shelf and compared with available observations of their behaviour. These methods are chosen for simplicity and ease of implementation with a spreadsheet application on a personal computer.
Three main approaches were followed: an evaluation of the annual, and daily limits, of onshore-offshore sediment movement near the spoil mound; a comparison between the theoretical thresholds of sediment motion and the annual wave height and period joint distribution; and an evaluation of sediment transport rates and directions using semi-empirical relationships.
The HANDS and ALLISON (1991) method had the smallest data requirements: mean and standard deviation of the annual significant wave height distribution; and the median grain-size at the mid-point of the shoal zone. Analysis of sediment threshold and comparison with wave climate required data concerning the annual joint wave height and period probability distribution, and sediment textural characteristics. Sediment transport rate calculations required the most detailed information about the site: annual joint wave height and period probability distribution; sediment textural characteristics; and mean unidirectional current velocity.
Using a spreadsheet, it is relatively easy to simulate a range of values (that span the likely conditions) with all three methods, if the necessary data are not available.
All the methods produced predictions consistent with available observations, and all were straightfor- ward to implement within a spreadsheet application. The choice of method depends on the information required, with each method needing different data and providing contrasting but complementary outputs.
ADDITIONAL INDEX WORDS: Sediment transport, threshold of sediment motion.
INTRODUCTION
There is increasing global concern over the en- vironmental impacts of dredge spoil disposal (PALMER and GROSS, 1979; KESTER et al., 1983; MONTGOMERY and LEACH, 1984; NATIONAL RE- SEARCH COUNCIL, 1985; LEE and PEDDICORD, 1988; VAN GEMERT et al., 1988; HEALY et al., 1991; U.S. ENVIRONMENTAL PROTECTION AGENCY and U.S.
ARMY CORPS OF ENGINEERS, 1991). Hence dump grounds are continuing to be extensively moni- tored (HEALY et al., 1988; HARMS, 1989; FOSTER, 1991; HEALY et al., 1991; FOSTER, 1992; HANDS, 1992; WARREN, 1992).
One of the major concerns commonly expressed over the dredge disposal is the fate of the dredge spoil following dumping. With the requirement
of many ports to make environmental impact as- sessments and undertake dredge spoil monitor- ing, there is a need to predict the behaviour of the dredge spoil after dumping. Although this can be evaluated by numerical modelling (viz. SCHEFFNER, 1991), simpler methods on personal computers may permit rapid assessment of a range of disposal options.
Dredging programmes associated with port de- velopment have occurred at the Port of Tauranga, New Zealand's largest port, since the 1960's. Sed- iment dredged from the port area within the har- bour and from the adjacent shipping channel
through the flood and ebb tidal deltas has been dumped offshore. A series of sites from the near- shore zone to the inner shelf, spanning a range of water depths from 4-30 m, has been used (Figure 1).
The aim of this paper is to evaluate three meth- 93005 received and accepted in revision 4 December 1993.
This content downloaded by the authorized user from 192.168.82.206 on Tue, 4 Dec 2012 20:27:39 PMAll use subject to JSTOR Terms and Conditions

Stability of Dredge Spoil Mounds 947
10 Permanent wave recorder
ENTRANCE CHANNEL 20f
CHANNEL <S4 Current meter
\ S4DW Wave recorder
10 RCM4 Current meter with wave shroud . e
10b .....20 RCM4 Current meter
MOUNT ..NEW
ZEALAND MAUNGANUI ... : 10 North Island
. .. ....10.. . STUDY 10 . Auckland
.
AREA
Tauranga.
TA URANGA HARBOUR
0 0.5 1km DEPTHS IN METRES .... . Welingto:
Figure 1. Location map of the dredge spoil dump grounds and instruments discussed in the text.
ods used to predict the likely behaviour of dredge spoil mounds with particular emphasis on their suitability for implementation on personal com- puters using spreadsheet application programs. Data from the Tauranga inner shelf is used to illustrate the method.
Dredge Spoil Disposal at Tauranga Dredge spoil disposal at Tauranga has occurred
at 7 offshore sites (Figure 1). One of the offshore sites (g) was selected to renourish the beach (FOSTER, 1991), while the remaining offshore sites were in deeper water (15-30 m) and located east to northeast of the harbour entrance (FOSTER, 1992). Over time, there has been an offshore pro- gression of successive dump grounds providing a series of dump mounds along a roughly shore- normal transect between 4 m and 30 m water depth.
The dredge spoil consisted largely (> 90%) of fine to medium sand with 1-10% gravel-sized pumice and shell fragments and minimal (< 0.5%) mud. This is compatible with the natural sedi- ments offshore, having a similar textural and bulk mineralogical composition (DAHM and HEALY,
1980; HEALY et al., 1988; HEALY and MCCABE, 1990; WARREN, 1992). Minor differences in com- position are however apparent, which enable ar- eas affected by dredge spoil to be identified by side-scan sonar (HARMS, 1989; FOSTER, 1992). In particular the dredge spoil contains a higher pro- portion of pumice (DAHM and HEALY, 1980; DE LANGE, 1988), and a shell assemblage that con- tains species not normally observed outside es- tuarine environments (GRACE, 1990).
Surveys of the sea floor surrounding the mounds indicate that components of dredge spoil sedi- ments extend beyond the limits of the dump
Journal of Coastal Research, Vol. 10, No. 4, 1994
This content downloaded by the authorized user from 192.168.82.206 on Tue, 4 Dec 2012 20:27:39 PMAll use subject to JSTOR Terms and Conditions

948 de Lange and Healy
grounds (HEALY et al., 1988), particularly be- tween the dump grounds and the harbour en- trance, although it is not always clear whether this is due to sediment movement or off-target dumping. Studies of the oldest spoil mounds in- dicate an onshore movement of fine sand and low density gravel-sized sediment (DAHM and HEALY,
1980; HEALY et al., 1988; HARMS, 1989; HEALY et al., 1991). Further, a tracing experiment using fluorescent sand and repeated bathymetric profile monitoring indicated a clear onshore movement for sediment within the shallowest dump ground (FOSTER, 1991).
Repeated bathymetric surveys of the dump grounds before 1988 demonstrated that the spoil mounds underwent marked volumetric reduc- tions during the first 2 years following disposal, after which they remained relatively static (HEALY et al., 1991). The largest volumetric changes were found to occur on the shoreward side of the mounds. These changes were associated with an accumulation of fine sediment on the adjacent seabed consistent with a shoreward movement of fine sand. Similar behaviour has been observed for the younger mounds in deeper water (FOSTER, 1992).
METHODS OF ASSESSMENT
Two fundamental questions need to be ad- dressed when assessing the placement of dredge spoil mounds:
(1) Will the dredge spoil mounds remain stable? (i.e., can they be anticipated to retain most of their original volume and stay at the same location for more than a few years?); and
(2) What will be the likely fate of material which does not remain within the spoil mound?
Although application of numerical models may be used to answer these questions, simpler methods that could be readily applied to dredge spoil dis- posal sites generally-and could be implemented by spreadsheet applications on personal comput- ers-are a possible alternative.
HANDs and ALLISON (1991) Method
HANDS and ALLISON (1991) present a method for assessing the long term stability of dredge spoil mounds from the cross-shore profile zonation lim- its of HALLERMEIER (1981). A spoil mound lying completely landward of the Hallermeier inner limit (HIL) lies within a zone of active sand transport and may be expected to disperse rapidly; whereas,
a spoil mound lying completely offshore of the Hallermeier outer limit (HOL) may be expected to remain stationary. Mounds between these lim- its lie within a buffer or shoal zone where waves have some influence during a year, and their be- haviour is less predictable.
The Hallermeier limits can be expressed as:
(Q)2
(HIL) 0.03h
>_2-
> 8D (HOL) (1) yg
where
h = water depth (m), w = wave radian frequency (Hz), D = median sediment diameter (m), g = gravitational acceleration (m-sec-2),
= horizontal wave orbital semi-excursion distance (m), given by transitional Lin- ear wave theory as
H 2h=
(2) 2sinh(kh)
where
H = wave height (m), k = wave number (m-'), and
S=s- 1 = (3) P
where
s = relative sediment density, p = sediment density (kg.m-3), and p = fluid density (kg-m-3).
Normally evaluation of HOL requires a knowl- edge of the median sediment diameter character- istic of the shoal zone. This includes all regions where sand-sized sediment may be transported onshore or offshore by high wave energy condi- tions which occur for less than 12 hours a year or an annual probability of 0.137%.
A general guide-line for dredge spoil disposal, suggested by the Shore Protection Manual (SPM, 1984), would not place mounds within the shoal zone. Mounds would only be placed landward of HIL if they were required to be active, or seaward of the HOL if they needed to be stable.
HANDS and ALLISON (1991) considered this to be too restrictive and noted that many spoil mounds are located within the shoal zone. Fol- lowing their approach the stability is determined by plotting two ratios relating the position of the spoil mound to the buffer zone lying between HIL
Journal of Coastal Research, Vol. 10, No. 4, 1994
This content downloaded by the authorized user from 192.168.82.206 on Tue, 4 Dec 2012 20:27:39 PMAll use subject to JSTOR Terms and Conditions

Stability of Dredge Spoil Mounds 949
and HOL, as given by:
HIL - B HOL - B and (4)
HIL HOL
where
HIL = Hallermeier's inner limit, HOL = Hallermeier's outer limit, and B = water depth at the base of the mound.
Predictions of Sediment Threshold
It may be preferable to locate the spoil mound within the shoal zone where the annual proba- bility of transport is higher, than beyond the re- strictive HOL. If the joint wave height and period probability distribution are known, then it is pos- sible to assess the probabilities of sediment move- ment occurring within the shoal zone.
Assuming Linear Wave Theory, the minimum wave height (Hcrit) required to initiate sediment transport for any given wave period may be de- termined from:
Hcrit - ucritT sinh(kh) W
where
ucit = critical orbital velocity at sediment threshold (m-sec-1), and
T = wave period (sec).
The critical orbital velocity at sediment threshold can be evaluated from the relationships of KOMAR and MILLER (1973). These may be expressed as:
Ucrit 0.21Yg
2.3 D < 0.0005 m
(0.46"ygTO25 (rD)075)4/7 D > 0.0005 m
(6)
The combinations of wave height and period cor- responding to the threshold of sediment motion may be compared with the joint wave height and period probability distribution for the site to de- termine the probability of sediment transport oc- curring.
Predictions of Transport Rates
Both methods above consider only wave con- ditions which exceed the threshold of sediment motion. More complicated analyses are required
to assess the influence of additional superimposed currents or specify rates or directions of sediment transport.
Measurements of the wave and current condi- tions in the immediate vicinity of the dump grounds at Tauranga are sparse (Figure 1), com-
prising: a 3 month deployment of an Aanderaa RCM4 current meter (HEALY, 1985); a 3 month
deployment of an Aanderaa RCM4 current meter fitted with a wave shroud (HARMS, 1989); and a 2 month deployment of a combined mooring of an InterOcean S4 current meter and InterOcean S4DW directional wave recorder (FOSTER, 1992; WARREN, 1992). All current meters recorded peak velocities <0.20 m sec-1, and average currents <0.1 m sec-1. The currents can be resolved into a tidal component of <0.1 m sec-1 and a shore parallel residual that is strongly correlated with local winds (BARNETT, 1985; BRADSHAW et al., 1991; FOSTER, 1992). These velocities are too low to entrain most sediment found on the deeper dump grounds, with the exception of low density pumice (DE LANGE et al., 1991). Current velocities are normally less than wave-induced orbital ve- locities, which can exceed sediment threshold (HARMS, 1989; BRADSHAW et al., 1991; WARREN,
1992). The wave-induced bedload sediment transport
rate (Qb) over rippled beds, such as those observed on spoil mounds at Tauranga (HARMS, 1989; FOSTER, 1992; WARREN, 1992), may be given (NIELSEN, 1990) by:
Qb = 0.15owD(O, - 0.02)1-5 (7)
where Or
= ripple crest Shields parameter, given by:
'(8) 777
x11T)
where
i = ripple height (m), X = ripple lenght (m), and 0' = skin friction Shields parameter.
The ratio of the ripple height to the ripple length, or ripple steepness, may be determined from the empirical relationship of NIELSEN (1992), as:
- = 0.342 - 0.34 / 1 (9) X
Journal of Coastal Research, Vol. 10, No. 4, 1994
This content downloaded by the authorized user from 192.168.82.206 on Tue, 4 Dec 2012 20:27:39 PMAll use subject to JSTOR Terms and Conditions
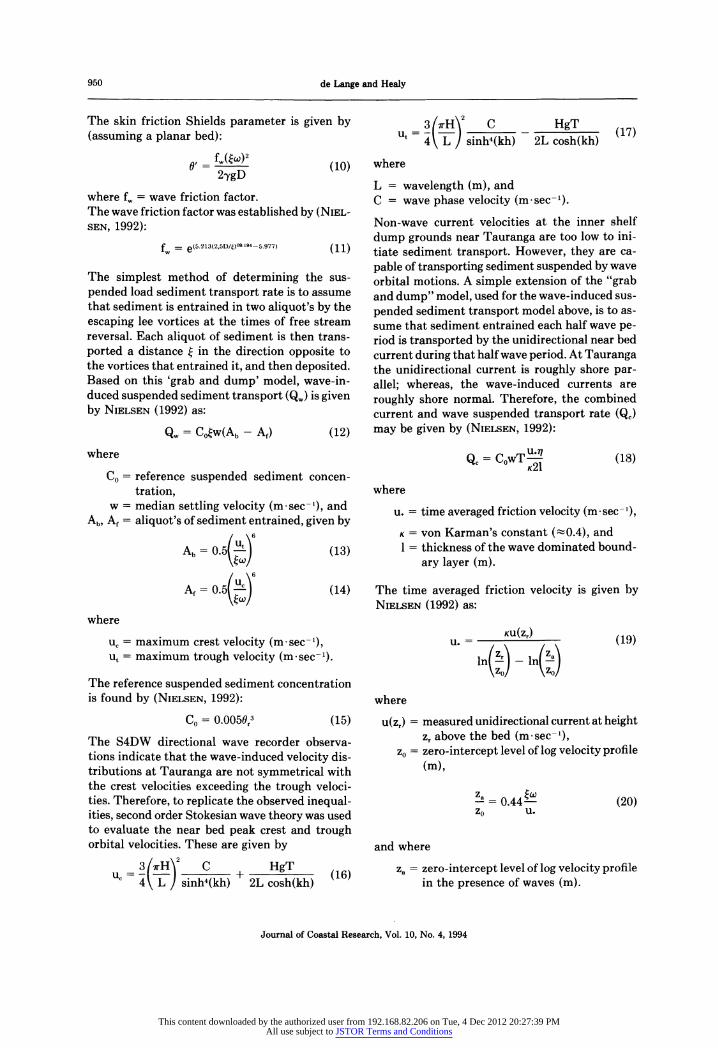
950 de Lange and Healy
The skin friction Shields parameter is given by (assuming a planar bed):
f,( W)2 ' ()2 (10)
2~ygD
where f, = wave friction factor. The wave friction factor was established by (NIEL- SEN, 1992):
fw = e(5.213(2,5D/)09.194- 5.977) (11)
The simplest method of determining the sus- pended load sediment transport rate is to assume that sediment is entrained in two aliquot's by the escaping lee vortices at the times of free stream reversal. Each aliquot of sediment is then trans- ported a distance ? in the direction opposite to the vortices that entrained it, and then deposited. Based on this 'grab and dump' model, wave-in- duced suspended sediment transport (Q,) is given by NIELSEN (1992) as:
QW = C.ow(Ab
- Af) (12)
where
Co = reference suspended sediment concen- tration,
w = median settling velocity (m-sec-'), and Ab, A, = aliquot's of sediment entrained, given by
Ab = 0.5 u
(13) \f /
A, = 0.5 (14)
where
uc = maximum crest velocity (m - sec-1),
ut = maximum trough velocity (m-sec-1).
The reference suspended sediment concentration is found by (NIELSEN, 1992):
Co = 0.005r,3 (15)
The S4DW directional wave recorder observa- tions indicate that the wave-induced velocity dis- tributions at Tauranga are not symmetrical with the crest velocities exceeding the trough veloci- ties. Therefore, to replicate the observed inequal- ities, second order Stokesian wave theory was used to evaluate the near bed peak crest and trough orbital velocities. These are given by
3 -H C HgT (16) U= sinh4(kh) + cg (16) 4 \L) sinh (kh) 2L cosh(kh)
3 xH\ C HgT = 4 L sinh4(kh) 2L cosh(kh) (17)
where
L = wavelength (m), and C = wave phase velocity (m.sec-1).
Non-wave current velocities at the inner shelf dump grounds near Tauranga are too low to ini- tiate sediment transport. However, they are ca-
pable of transporting sediment suspended by wave orbital motions. A simple extension of the "grab and dump" model, used for the wave-induced sus- pended sediment transport model above, is to as- sume that sediment entrained each half wave pe- riod is transported by the unidirectional near bed current during that half wave period. At Tauranga the unidirectional current is roughly shore par- allel; whereas, the wave-induced currents are roughly shore normal. Therefore, the combined current and wave suspended transport rate (Qj) may be given by (NIELSEN, 1992):
Qe = CowT
u (18) K21
where
u. = time averaged friction velocity (m - sec-'),
K = von Karman's constant ( 0.4), and 1 = thickness of the wave dominated bound-
ary layer (m).
The time averaged friction velocity is given by NIELSEN (1992) as:
KU(Z,) u. = (19)
In.
o) -In(
0
\zo) (\zof
where
u(z,) = measured unidirectional current at height z, above the bed (m-sec-1),
zo = zero-intercept level of log velocity profile (m),
= 0.44- (20) Zo U.
and where
za = zero-intercept level of log velocity profilie in the presence of waves (m).
Journal of Coastal Research, Vol. 10, No. 4, 1994
This content downloaded by the authorized user from 192.168.82.206 on Tue, 4 Dec 2012 20:27:39 PMAll use subject to JSTOR Terms and Conditions
Stability of Dredge Spoil Mounds 951
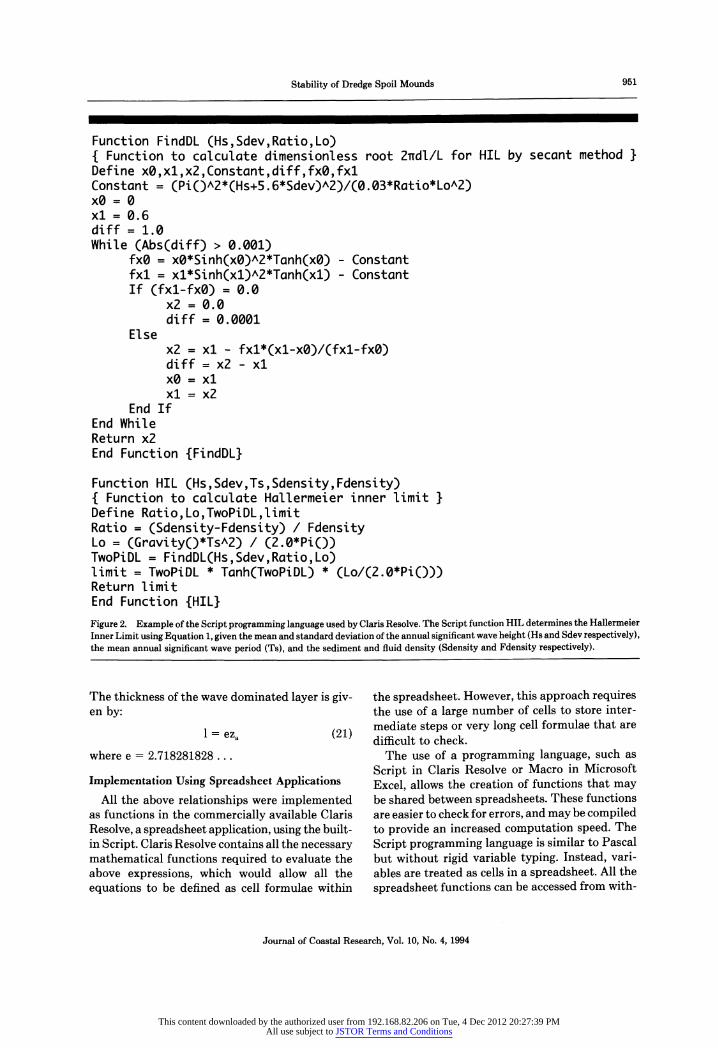
Function FindDL (Hs,Sdev,Ratio,Lo) { Function to calculate dimensionless root 2rdl/L for HIL by secant method } Define xO,xl,x2,Constant,diff,fx0,fxl Constant = (Pi()A2*(Hs+5.6*Sdev)A2)/(0.03*Ratio*Lo^2) xO = 0 xl = 0.6 diff = 1.0 While (Abs(diff) > 0.001)
fx0 = x0*Sinh(x0)A2*Tanh(x0) - Constant fxl = xl*Sinh(xl)A2*Tanh(xl) - Constant If (fxl-fx0) = 0.0
x2 = 0.0 diff = 0.0001
Else x2 = xl - fx1*(xl-xO)/(fx1-fx0) diff = x2 - xl x0 = xl xl = x2
End If End While Return x2 End Function {FindDL}
Function HIL (Hs,Sdev,Ts,Sdensity,Fdensity) { Function to calculate Hallermeier inner limit } Define Ratio,Lo,TwoPiDL,limit Ratio = (Sdensity-Fdensity) / Fdensity Lo = (Gravity()*Ts^2) / (2.0*Pi()) TwoPiDL = FindDL(Hs,Sdev,Ratio, Lo) limit = TwoPiDL * Tanh(TwoPiDL) * (Lo/(2.0*Pi())) Return limit End Function {HIL} Figure 2. Example of the Script programming language used by Claris Resolve. The Script function HIL determines the Hallermeier Inner Limit using Equation 1, given the mean and standard deviation of the annual significant wave height (Hs and Sdev respectively), the mean annual significant wave period (Ts), and the sediment and fluid density (Sdensity and Fdensity respectively).
The thickness of the wave dominated layer is giv- en by:
1 = eza (21)
where e = 2.718281828 ...
Implementation Using Spreadsheet Applications All the above relationships were implemented
as functions in the commercially available Claris Resolve, a spreadsheet application, using the built- in Script. Claris Resolve contains all the necessary mathematical functions required to evaluate the above expressions, which would allow all the equations to be defined as cell formulae within
the spreadsheet. However, this approach requires the use of a large number of cells to store inter- mediate steps or very long cell formulae that are difficult to check.
The use of a programming language, such as
Script in Claris Resolve or Macro in Microsoft
Excel, allows the creation of functions that may be shared between spreadsheets. These functions are easier to check for errors, and may be compiled to provide an increased computation speed. The
Script programming language is similar to Pascal but without rigid variable typing. Instead, vari- ables are treated as cells in a spreadsheet. All the
spreadsheet functions can be accessed from with-
Journal of Coastal Research, Vol. 10, No. 4, 1994
This content downloaded by the authorized user from 192.168.82.206 on Tue, 4 Dec 2012 20:27:39 PMAll use subject to JSTOR Terms and Conditions

952 de Lange and Healy
- . ...I I.. .. II. .. . . .. . .. .. .. .. .. ..I . . .. ... . .I.. ... . . .. - 1.5 o
"
Hands & Allison (1991) Active AA Tauranga 1.0
BB oAG oHB oSI
*SB Nc oNR - 0.5
Probably active SB D AC (HOL-B) 0.0 Stable HOL Aa
Ab -0.5
Ac
-1.0 Ad
e *LB A f 7 -1.5
-2.0 -4.0 -3.5 -3.0 -2.5 -2.0 -1.5 -1.0 -0.5 0.0 0.5 1.0 1.5
(HIL-B) HIL
Figure 3. Locational stability diagram from HANDS and ALLISON (1991) with the Tauranga dump grounds added (a-g). The open symbols indicate sites with active spoil mounds, and the solid symbols represent stable spoil mounds. Sites SB, DN and AC plot within the stable region when the correct wave data are used (HANDS, personal communication, 1991).
in a Script function. Figure 2 is an example of the Script functions used to evaluate the HIL as de- fined by Equation 1.
The Script functions are used within a Claris Resolve spreadsheet in the same manner as the standard spreadsheet functions. Therefore, it is relatively easy to generate a matrix of results for ranges of input conditions. The graphical capa- bilities for the spreadsheet application may then be used to display the results in a more readily assimilated form.
The analyses discussed below were all per- formed on a Macintosh PowerBook 100 notepad computer. None of computations took more than 3 minutes for - 600 combinations of input param- eters.
RESULTS AND DISCUSSION
HANDS and ALLISON (1991) Method An analysis of 2 years' data from the permanent
wave recorder at the entrance to Tauranga Har- bour resulted in a mean annual significant wave height of 0.50 m with a standard deviation of 0.38 m, and a significant wave period of 9.1 sec (DE
LANGE, 1991). The median grain size at the ap- proximate mid-depth of the shoal zone is 0.2 mm (FOSTER, 1992). Assuming quartz density sedi- ment, these correspond to HIL and HOL of 5.5 and 10.2 m respectively.
The stability ratios defined by Equation (4) for the various historical dump grounds at Tauranga (a-g in Figure 1) as well as the original data from HANDS and ALLISON (1991) are plotted in Figure 3. The Tauranga dump grounds lie predominantly outside the shoal zone with only the shallowest dump ground (g) encroaching seaward of the in- ner limit. This is consistent with the finding that the shallowest dump ground was active (FOSTER, 1991), whereas the remainder were essentially sta- ble (HARMS, 1989; FOSTER, 1992).
Both the Hallermeier limits are functions of sediment density. For the typical range of den- sities occurring within the dredge spoil at Tauran- ga (DE LANGE, 1988), there is considerable vari- ation of the limits of the shoal zone (Figure 4a). In particular for pumiceous sediments (1,120-2,370 kg m-3), all the dump grounds lie landward of the HOL; whereas, for iron-sands (mainly titanomag- netite, p. = 4,680 kg m-3), all spoil mounds lie seaward of HOL. Only the HOL is affected by grain diameter. Although the variation is less for changes in grain size than for sediment density, clearly the HOL moves further offshore with de- creasing grain size (Figure 4b). This implies that mounds composed of fine sediment will be active further offshore than mounds composed of coarse sediment.
Therefore, at Tauranga where the dredge spoil
Journal of Coastal Research, Vol. 10, No. 4, 1994
This content downloaded by the authorized user from 192.168.82.206 on Tue, 4 Dec 2012 20:27:39 PMAll use subject to JSTOR Terms and Conditions

Stability of Dredge Spoil Mounds 953
displays a range of sediment densities and grain sizes, repeated application of the HANDS and AL- LISON (1991) method for individual dredge spoil components predicts that low density pumiceous sediments and fine quartzo-felspathic sediments would be active at all dump ground sites; and shell fragments would be active at most sites. This is consistent with the observed rapid onshore move- ment of pumice, and broken and whole bivalve shell material, and slower onshore movement of fine sediment (DAHM and HEALY, 1980; HEALY et al., 1991; FOSTER, 1992).
Predictions of Sediment Threshold
Figure 5 summarizes the combinations of wave height and period corresponding to the threshold of sediment movement for a range of water depths and grain sizes. The grain diameters chosen cor- respond to the boundaries of sand size classes in the Udden-Wentworth classification (MCMANUS, 1988). Clearly, at any given depth and wave pe- riod, progressively higher waves are required to initiate sediment transport as the grain size in- creases. The period associated with the smallest wave height capable of initiating sediment trans- port also increases with depth indicating that swell waves become increasingly important offshore.
Combining the annual joint wave height and period distribution from the permanent wave re- corder site and the sediment median diameters for the dump grounds indicates probabilities of transport that progressively increase from 15% at site f (WARREN, 1992), to 40 % at site e (HARMS, 1989), to >95% at site g (FOSTER, 1991). Further, sediment within the dump grounds (a-f) indicat- ed as stable by the HANDS and ALLISON (1991) method is capable of moving with annual prob- abilities of transport greater than the 0.137 % used to define HOL. However, this approach does not determine whether the mobilized sediment leaves the dump grounds or merely oscillates about a fixed position.
The predicted probabilities of sediment move- ment assume a quartz density. However, the den- sities of the sediments at Tauranga vary between 1,120 and 4,680 kg m-3. As Figure 6 demonstrates for this range of densities, there is a considerable variation in the minimum wave height required to initiate sediment movement for any given wave period. In particular, the probabilities of move- ment of low density grains, such as pumice, are considerably higher than for quartz sediment. Figure 5 also indicates that the fine quartz sand
40
S Outer
35 limit
E 30- Cf
S25 e d
4 20
a- S
15 Inner b C a)
d (kgma
5 uf a Pumice Quartz
Titanomagnetite
1000 1500 2000 2500 3000 3500 4000 4500 5000
Sediment density (kg.m3)
40 b
35 E
30
e 25
- d o 20 (0
ca CL L
a "
E lo0
SSilt Sand g 01 I
0.01 0.1 1 Mean grain diameter (mm)
Figure 4. Changes in the depth of the Hallermeier limits, HIL and HOL, with variations in: (a) sediment density; and (b) mean grain diameter.
in the dredge spoil is more likely to be transported than the medium sand. These predictions are con- sistent with the observed behaviour of spoil mounds at Tauranga.
This method requires the annual joint wave height and probability distribution to be well de- fined, as well as data for the sediment texture within the dumping ground. This is a larger data requirement than needed for the HANDS and AL- LISON (1991) method. Evaluation of sediment threshold also does not provide much useful in- formation about the long term stability of spoil mounds within a dump ground. However, it does indicate that the frequency of sediment motion is an important parameter if turbidity in the im- mediate vicinity of the dump ground is of concern.
Predictions of Sediment Transport Rate
The models for sediment transport rate are con- sistent with the previous methods. They indicate
Journal of Coastal Research, Vol. 10, No. 4, 1994
This content downloaded by the authorized user from 192.168.82.206 on Tue, 4 Dec 2012 20:27:39 PMAll use subject to JSTOR Terms and Conditions

954 de Lange and Healy
62.5 jm 125.0 jm 5-5-4,
5m 10 m
-------150m CDE
,3
-
--20m ,
> 1
0 o" 'I'II '
'1\ 10 12 14 16 18 20 10 12 14 16 18 20
Period (s) Period (s)
0.25 mm 0.5 mm '
- -m
I 02
0 -: 16 1 F- _I 10 12 14 16 18 20 10 1214 1618 20
Period (s) Period (s)
1.0 mm 2.0 mm
5-
--5- 4-
. --.:\
Q)
3-
S 1" . . .----------
-
- - ---- ----
2 _ 2 -\c
1 1 11
10 12 14 16 18 20 10 12 1 16 18 20 Period (s) Period (s)
- --
- . . . . ..-
Period (s) Period (s)
Figure 5. Minimum wave height required to initiate sediment motion for a range of wave periods and water depths corresponding to the range of depths at the Tauranga dump grounds. The grain diameters chosen correspond to the sand-size class boundaries in the Udden-Wentworth particle size classification scheme. A constant quartz density (2,650 kg m-3) is assumed.
high rates of transport per unit width (> 10-5 m2 sec-1) close to shore in depths <6 m for the av- erage annual wave height and period with rates decreasing to almost zero at depths > 10 m (Figure 7). Although measurements of transport rate have not yet been made at Tauranga, the suspended load rate trends match turbidity measurements made along shore normal transects (FOSTER, 1992),
and the bedload transport rates are consistent with the progression of bedforms observed along shore normal transects (WARREN, 1992).
The analysis also indicates that bedload trans- port is directed onshore towards Mt. Maunganui Beach, and suspended sediment transport is shore parallel at most sites. The onshore movement of bedload is consistent with observations of the dis-
Journal of Coastal Research, Vol. 10, No. 4, 1994
This content downloaded by the authorized user from 192.168.82.206 on Tue, 4 Dec 2012 20:27:39 PMAll use subject to JSTOR Terms and Conditions

Stability of Dredge Spoil Mounds 955
5 , I I , I . . I .. . ,
Grain density (kg m-3)
4-122
31 \3
- - 2- --2000 - 4680-
2-
0
6 8 10 12 14 16 18 20 Period (s)
Figure 6. Minimum wave height required to initiate sediment motion for a range of wave periods and sediment grain densities
spanning the observed range at Tauranga. A constant grain diameter of 0.25 mm and water depth of 20 m were used.
persal of dredge spoil and tracers at the various dump grounds. No useful data yet exist to confirm the direction of suspended sediment transport.
Measurements made at the deepest dump ground (f) show that the mean grain diameter and settling velocity following dumping had increased
0.00004
E 0
S-0.00004- 0
M -0.00008 / Qb
- - - Qw
E -0.00012 Qc 61)
-0.00016 ,1 i ' ' i i 0 2 4 6 8 10 12 14
Depth (m)
Figure 7. Bedload (Qb), wave-induced suspended load (Q,) and wave-current interaction suspended load (Qj) sediment trans-
port rates per unit width (m2 sec-1) for a range of depths. A wave height of 0.50 m, wave period of 9.1 sec, sediment density of 2,650 kg m-3, grain diameter of 0.31 mm, settling velocity of 46.5 mm sec-1, and 0.1 m sec- current measured at 1 m above the sea bed were used.
to 0.44 mm and 67.8 mm sec-1 from 0.31 mm and 46.5 mm sec-1 respectively. Figure 8 indicates the increase in bedload transport rates for wave con- ditions exceeding threshold for both the pre-dump
4.503 :::::::::::
.
O0.0000
0.
00
.................. 0 . 0 0 0 0
3.75 3.50 -..... 0.000001
3 .2 5 : :.. .. .... ....:.0•0 0 ...............
• "2.50 - - . ii0.000003
2.25 2.00 - "::'"""""""""""" 0.000004 ~ r"-
................................. . ...... ......... ....... ~ ~ iiiiiii~ii~iiiiiiii~i 0 0 0 0 0
1.75 -
3 .5 0 - - .. ........ ...............
0.000001 1.50 ii~i ~ 1.2 5
0
.0
0 0 0 06.x
1.00 -
0.75 -0.000007 0.50
0.25 I I I I I I I 1 0.000008 5 6 7 8 9 10 11 12 13 14 15
Wave period (s) Figure 8. Increased bedload sediment transport rates per unit width (m2 sec-1) following dredge spoil disposal for a range of wave
height and periods. A sediment density of 2,650 kg m-3, a water depth of 25 m, and 0.1 m sec-' current measured at 1 m above the sea bed were used for both pre- and post-dump conditions. A grain diameter of 0.31 mm and settling velocity of 46.5 mm sec-1 were used for pre-dump conditions. After dumping the respective values were 0.44 mm and 67.8 mm sec-.
Journal of Coastal Research, Vol. 10, No. 4, 1994
This content downloaded by the authorized user from 192.168.82.206 on Tue, 4 Dec 2012 20:27:39 PMAll use subject to JSTOR Terms and Conditions

956 de Lange and Healy
4.00 0% 3.75 3.50 3.25 1%
3.00 2.75 2%
o 2.50 - - S 2.25 - 2.003%
S1.75
1.50. 4%
1.25 1.00 0.75 0.50 0.25 - I I I I 6%
5 6 7 8 9 10 11 12 13 14 15
Period(s)
Figure 9. Joint wave height and period distribution for Tauranga dump ground f. Data were recorded as 3 minute bursts every 3 hours over a 2 month interval by an InterOcean S4DW wave recorder.
and post-dump sediment. At slightly lower energy conditions, there is a decrease in rates because the sediment threshold for the coarser post-dump sediment was not exceeded whereas the pre-dump sediment could move. The suspended load due to wave action (Q,) and current-wave interaction (Q,) displayed similar trends.
Comparing Figure 8 with the measured wave climate at dump ground f (Figure 9) shows that the increases in transport rate occur for wave con- ditions which are not common (large, long period swell). This agrees with the predictions made by the other methods. At slightly lower energy wave conditions, a decrease in sediment transport rate is predicted. However, these conditions are also not common. Without actual transport rate mea- surements to calibrate the analysis, the results are only qualitative but are consistent with obser- vations made at Tauranga.
The equations used in the transport rate cal- culations were developed for quartz density sed- iment spanning a limited range of grain sizes. NIELSEN (1992) demonstrates that several of the relationships may not be applicable to sediment with different densities or shapes that vary mark- edly from spherical. Therefore, transport rates for non-quartz sediments were not calculated. This causes some difficulties due to the presence of pumice and titano-magnetite at Tauranga, but these constituents account for < 15 % of the dredge material so the method is appropriate to the bulk of the sediment.
The HANDS and ALLISON and sediment thresh- old methods both assume that sediment grain size and wave-induced orbital motions are the factors that control locational stability of dredge spoil mounds. However, although wave-induced mo- tions may be responsible for initiating sediment transport, unidirectional currents of various types may determine whether net sediment transport occurs (WRIGHT, 1987; PILKEY et al., 1993). The NIELSEN equations can incorporate these cur- rents; thereby, more closely approximating the real world provided sufficient data are available to adequately define the unidirectional currents present. Without suitable current data, the use of spreadsheet applications allows the rapid simu- lation of a wide range of-possible current condi- tions and re-evaluation as current data become available.
SUMMARY
All the methods used to assess the long term stability of dredge spoil mounds on the inner shelf and within the nearshore zone at Tauranga gave consistent predictions which agreed with avail- able observations. Therefore all methods are con- sidered applicable.
All the methods proved straightforward to im- plement within a spreadsheet application; al- though, the processing time required varied con- siderably between the HANDS and ALLISON (1991) method and the transport rate calculations.
The HANDS and ALLISON (1991) method was
Journal of Coastal Research, Vol. 10, No. 4, 1994
This content downloaded by the authorized user from 192.168.82.206 on Tue, 4 Dec 2012 20:27:39 PMAll use subject to JSTOR Terms and Conditions
Stability of Dredge Spoil Mounds 957
the easiest to apply and gave a good indication of the long term stability of the spoil mounds. This method had the smallest data requirements, needing only the mean and standard deviation of the annual significant wave height distribution and the median grain-size at the mid-point of the shoal zone. However, due to the variation in sed- iment density and grain size within the dredge spoil, it was necessary to repeat the analysis sev- eral times for each of the major components.
Analysis of the sediment threshold and com- parison with the wave climate did not provide significantly more useful data than the HANDS and ALLISON (1991) method for predicting the long term stability of the spoil mounds. However, if the movement of sediment within the dump ground is of concern, sediment threshold data does provide an indication of the frequency of move- ment. This method required data concerning the annual joint wave height and period probability distribution and the sediment textural character- istics of the dredged material and dump ground.
The sediment transport rate calculations show promise but require calibration with field obser- vations to provide quantitative results. The meth- od also required more detailed information about the site including: the annual joint wave height and period probability distribution; the sediment textural characteristics; and the mean unidirec- tional current velocity within the dump ground.
Using a spreadsheet, it is relatively easy to sim- ulate a range of values that span the likely con- ditions if the necessary data are not available.
ACKNOWLEDGEMENTS
The various thesis research projects near Tau- ranga that provide the verifying data in this paper were funded by the Port of Tauranga, Ltd. The Victorian Institute of Marine Sciences, Mel- bourne, Australia is thanked for providing facil- ities for the preparation of this paper.
LITERATURE CITED
BARNETT, A.G., 1985. Overview and Hydrodynamics, Tauranga Harbour Study Parts I & III. Report to the Bay of Plenty Harbour Board.
BRADSHAW, B.E.; HEALY, T.R.; DELL, P.M., and BOLSTAD, W.M., 1991. Inner shelf dynamics on a storm-domi- nated coast east Coromandel New Zealand. Journal of Coastal Research, 7, 11-30.
DAHM, J. and HEALY, T.R., 1980. A Study of Dredge Spoil Dispersion off the Entrance to Tauranga Har- bour. University of Waikato, Report to the Bay of Plenty Harbour Board, 64p.
DE LANGE, W.P., 1988. Wave Climate and Sediment
Transport Within Tauranga Harbour, In the Vicinity of Pilot Bay. D.Phil. Thesis, University of Waikato, 225p.
DE LANGE, W.P., 1991. Wave Climate for No. 1 Reach, Port of Tauranga, Tauranga Harbour. Marine Geo- sciences Group, Department of Earth Sciences, The University of Waikato, September 1991, Report to the Port of Tauranga Ltd., 18p.
DE LANGE, W.P.; MOON, V.G., and HEALY, T.R., 1991. Problems with predicting the transport of pumiceous sediments in the coastal environment. Coastal Sed- iments '91 (New York: ASCE), 990-996.
FOSTER, D., 1992. Environmental Impacts of Recent Dredging and Inner Shelf Spoil Disposal at Tauranga. M.Sc. Thesis, University of Waikato, 230p.
FOSTER, G.A., 1991. Beach Renourishment from a Near- shore Dredge Spoil Dump at Mount Maunganui Beach. M.Sc. Thesis, University of Waikato, 156p.
GRACE, R.V., 1990. Tauranga Dredge Spoil Monitoring Project: Sea-bed Monitoring Sites. Report to Port of Tauranga Ltd.
HALLERMEIER, R.J., 1981. A profile zonation for seasonal sand beaches from wave climate. Coastal Engineer- ing, 4, 253-277.
HANDS, E.B., 1992. Monitoring of Alabama Berms. DRP- 1-08, US Army Engineer Waterways Experiment Sta- tion, 14p.
HANDS, E.B. and ALLISON, M.C., 1991. Mound migration in deeper water and methods of categorizing active and stable depths. Coastal Sediments '91 (New York: ASCE), 1985-1999.
HARMS, C., 1989. Dredge Spoil Dispersion from an In- ner-shelf Mound. M.Phil. Thesis, University of Wai- kato, 177p.
HEALY, T.R., 1985. Field Data Collection Programme and Morphological Study, Tauranga Harbour Study Parts II & V. Report to the Bay of Plenty Harbour Board.
HEALY, T.R.; HARMS, C., and DE LANGE, W.P., 1991. Dredge spoil and inner shelf investigations off Tau- ranga Harbour, Bay of Plenty, New Zealand. Coastal Sediments '91 (New York: ASCE), 2037-2051.
HEALY, T.R. and MCCABE, B., 1990. Physical and Chemical Characteristics of Material to Be Dredged and Dumped as Dredge Spoil. University of Waikato, Report to the Bay of Plenty Regional Council on be- half of Port of Tauranga Ltd., 23p.
HEALY, T.R.; MCCABE, B.; GRACE, R., and HARMS, C., 1988. Environmental Assessment Programme for Tauranga Harbour Dredging and Inner Shelf Spoil Dumping. University of Waikato, Report to the Bay of Plenty Harbour Board, 41p.
HEALY, T.R.; MCCABE, B., and THOMPSON, G., 1991. Environmental Impact Assessment: Channel Deep- ening and Widening Dredging Programme 1991-1992. University of Waikato, Report for Port of Tauranga Ltd., 122p.
KESTER, D.R.; KETCHUM, B.H.; DUEDALL, I.W., and PARK, P.K., 1983. Have the questions concerning dredged material disposal been answered? In: KESTER, D.R.; KETCHUM, B.H.; DUEDALL, I.W., and PARK, P.K. (eds.), Wastes in the Ocean, Volume 2, New York: Wiley, pp. 275-287.
KOMAR, P.D. and MILLER, M.C., 1973. The threshold of
Journal of Coastal Research, Vol. 10, No. 4, 1994
This content downloaded by the authorized user from 192.168.82.206 on Tue, 4 Dec 2012 20:27:39 PMAll use subject to JSTOR Terms and Conditions

958 de Lange and Healy
sediment movement under oscillatory water waves. Journal of Sedimentary Petrology, 43, 1101-1110.
LEE, C.R. and PEDDICORD, R.K., 1988. Decision-making framework for management of dredged material dis- posal. In: SALOMONS, W. and FORSTNER, U. (eds.), Environmental Management of Solid Waste. Berlin: Springer-Verlag, pp. 324-371.
MCMANUS, J., 1988. Grain size determination and in- terpretation. In: TUCKER, M., (ed.), Techniques in Sedimentology. Oxford: Blackwell, pp. 63-85.
MONTGOMERY, R.L. and LEACH, J.W., (eds.), 1984. Dredging and Dredged Material Disposal: Proceed- ings of the Dredging '84 Conference. New York: American Society of Civil Engineers, 2 volumes.
NIELSEN, P., 1990. Appendix E-Part 1: Coastal bottom boundary layers and sediment transport. In: BRUUN, P., (ed.), Port Engineering, Volume 2: Harbor Trans- portation, Fishing Ports, Sediment Transport, Geo- morphology, Inlets, and Dredging. Houston: Gulf Publishing, pp. 560-585.
NIELSEN, P., 1992. Coastal Bottom Boundary Layers and Sediment Transport, Vol. 4. Advanced series on Ocean Engineering, Singapore: World Scientific, 324p.
NATIONAL RESEARCH COUNCIL, 1985. Dredging Coastal Ports: An Assessment of Issues. National Research Council, Washington: National Academy Press, 212p.
PALMER, H.D. and GROSS, M.G., 1979. Ocean Dumping and Marine Pollution: Geological Aspects of Waste
Disposal. Stroudsburg: Dowden, Hutchinson and Ross, 268p.
PILKEY, O.H.; YOUNG, R.S.; RIGGS, S.R.; SMITH, A.W.S.; Wu, H., and PILKEY, W.D., 1993. The concept of shoreface profile of equilibrium: A critical review. Journal of Coastal Research, 9, 255-278.
SCHEFFNER, N.W., 1991. A systematic analysis of dis- posal site stability. Coastal Sediments '91. American Society of Civil Engineers, 2012-2026.
SPM, 1984. Shore Protection Manual. Washington: Coastal Engineering Research Center, U.S. Army, Corps of Engineers.
U.S. ENVIRONMENTAL PROTECTION AGENCY and U.S. ARMY CORPS OF ENGINEERS, 1991. Evaluation of Dredged Material Proposed for Ocean Disposal. Re- port EPA-503/8-91/001.
VAN GEMERT, W.J.TH.; QUAKERNAAT, J., and VAN VEEN, H.J., 1988. Methods for treatment of contaminated dredged sediments. In: SALOMONS, W. and FORSTNER, U. (eds.), Environmental Management of Solid Waste. Berlin: Springer-Verlag, pp. 53-64.
WARREN, S.K., 1992. The Geomechanics and Dispersion of Dredge Spoil Dumped in Open Water on the Inner Shelf, Tauranga, New Zealand. M.Sc. Thesis, Uni- versity of Waikato, 281p.
WRIGHT, L.D., 1987. Shelf-surfzone coupling: Cross-shore transport mechanisms on the shore face. Coastal Sed- iments '87 (New York: ASCE), pp. 25-40.
Journal of Coastal Research, Vol. 10, No. 4, 1994
This content downloaded by the authorized user from 192.168.82.206 on Tue, 4 Dec 2012 20:27:39 PMAll use subject to JSTOR Terms and Conditions