delft university of technology reducing the cover-to
TRANSCRIPT

Delft University of Technology
Reducing the cover-to-diameter ratio for shallow tunnels in soft soils
Vu Minh, Ngan
DOI10.4233/uuid:e35c4735-1f6f-4e4c-b7b8-130f68a7dd02Publication date2016Document VersionFinal published versionCitation (APA)Vu Minh, N. (2016). Reducing the cover-to-diameter ratio for shallow tunnels in soft soils.https://doi.org/10.4233/uuid:e35c4735-1f6f-4e4c-b7b8-130f68a7dd02
Important noteTo cite this publication, please use the final published version (if applicable).Please check the document version above.
CopyrightOther than for strictly personal use, it is not permitted to download, forward or distribute the text or part of it, without the consentof the author(s) and/or copyright holder(s), unless the work is under an open content license such as Creative Commons.
Takedown policyPlease contact us and provide details if you believe this document breaches copyrights.We will remove access to the work immediately and investigate your claim.
This work is downloaded from Delft University of Technology.For technical reasons the number of authors shown on this cover page is limited to a maximum of 10.

Reducing the cover-to-diameter ratio
for shallow tunnels in soft soils


Reducing the cover-to-diameter ratio
for shallow tunnels in soft soils
Proefschrift
ter verkrijging van de graad van doctor
aan de Technische Universiteit Delft,
op gezag van de Rector Magnificus prof. ir. K.C.A.M. Luyben,
voorzitter van het College voor Promoties,
in het openbaar te verdedigen op
maandag 12 september 2016 om 12:30 uur
door
Minh Ngan VU
Civiel ingenieur
Nationale Universiteit van Civiele Techniek, Hanoi, Vietnam,
geboren te Hanoi, Vietnam.
Dit proefschrift is goedgekeurd door de
promotor: prof. ir. J.W. Bosch
copromotor: dr. ir. W. Broere
Samenstelling promotiecommissie:
Rector Magnificus, voorzitter
Prof. ir. J.W. Bosch, Technische Universiteit Delft
Dr. ir. W. Broere, Technische Universiteit Delft
Onafhankelijke leden:
Prof. ir. A.F. van Tol, Technische Universiteit Delft
Prof. dr. T.H. Vo, Hanoi University of Mining and Geology
Prof. dr. -Ing. M. Thewes, Ruhr-Universität Bochum
Prof. dr. ir. A. Bezuijen, Universiteit Gent
Prof. dr. ir. J.G. Rots, Technische Universiteit Delft, reservelid
Overige leden:
Dr. ir. K.J. Bakker, Technische Universiteit Delft
Keywords: tunnelling, stability, tunnel lining, ground movement, volume loss
Printed by: Ipskamp Printing, Enschede
Copyright © 2016 by M.N. VU
ISBN 978-94-028-0028-9
An electronic version of this dissertation is available at
http://repository.tudelft.nl/.
All rights reserved. No part of the material protected by this copyright notice may be
reproduced or utilized in any form or by any means, electronic or mechanical, includ-
ing photocopying, recording or by any information storage and retrieval system, without
written consent from the author.

To Mai Lan, Minh Hang and Chinh Duong

ABSTRACT
Despite the fact that shallow tunnels have the benefits of low short-term construction
costs and long-term operational costs primarily due to the shallow depth of the station
boxes, the limited understanding of shallow tunnelling in soft soils is an obstacle to the
development of shallow tunnels in urban areas. This study carries out a theoretical in-
vestigation of the effects of reducing the cover-to-diameter ratio C /D for shallow tunnels
in soft soils.
In stability analysis, the uplift, face stability and blow-out mechanisms are investigated.
This study investigates interactions between the TBM and surrounding soil in tunnelling
process, the stability of the TBM is not taken into account. The relationship between
the C /D ratio and the required thickness-to-diameter ratio d/D as well as the required
support pressures will be derived in various soils. Ranges of support pressures are also
estimated for the TBM.
Structural analysis is carried out for the variation of deformations and internal forces of
the tunnel lining when reducing the C /D ratio. Since the conventional design models
are not suitable in the case of shallow tunnels a new structural analysis model, which
includes the difference between loads at the top and at the bottom of the tunnel, is pro-
posed. Optimal C /D ratios with various d/D ratios for shallow tunnels in soft soils are
also derived.
With respect to ground movement analysis, this research investigates the areas affected
by shallow tunnelling with a preliminary assessment of the risk of building damage by
investigating surface and subsurface soil displacements. These areas are determined for
different tunnel diameters in various soil types and are then compared to recent studies.
The total volume loss is estimated at the tunnelling face, along the TBM, at the tail and
includes long-term consolidation settlements. By combining empirical models from the
literature and the proposed new models, the volume loss components are estimated
both for short-term construction and for the long-term consolidation effects. This shows
that a no volume loss is feasible in shallow tunnelling with careful control of the support
pressure.
The boundaries of the influence zones in shallow tunnelling are identified and discussed
on the basis of various case studies. The effects of the soil parameters on the influence
areas are also investigated.
From these calculations, the limits and optimal C /D ratios for shallow tunnelling are
deduced and recommendations and solutions for improving the shallow tunnelling pro-
cess are proposed in this dissertation.
vii


ACKNOWLEDGEMENTS
I consider it an honour to work with Prof. Ir Johan W.Bosch and Dr. Ir Wout Broere in
this research. Johan, your speech at the first meeting about PhD studies has been lived
in my mind “You are here not only for your PhD study, the more important achievement
is the improvement of yourself”. It has changed my attitude of the PhD study. I have
a special thank for Wout, who has worked patiently with me-a recruit in tunnelling-not
only for discussing and assessing to my sudden and strange ideas, but also with special
guidance and even English correction. Without your help, I think it would be impossi-
ble to write this acknowledgement. Johan and Wout, your guidance and suggestions in
research process are really wonderful and I would like to express my profound gratitude
and appreciation to you.
The research in this dissertation was supported by the Ministry of Education and Train-
ing of Vietnam (Project 322), Hanoi University of Mining and Geology, Geo-Engineering
Section and Valorisation Centre in Delft University of Technology. I am very grateful for
their support and for the opportunity to carry out this research.
For the period of my PhD study, I am grateful for the time spent with roommates and
colleagues in the GeoEngineering Section. Patrick Arnold, thanks for your kind help not
only on many things in a PhD study such as Latex and Matlab, but also many life prob-
lems. Nor Hazwani Md. Zain, Rafael Rodriguez Ochoa, Rui Rui and Hongfen Zhao who
made me feel comfortable. I will remember the time with colleagues in GeoEngineering
during BBQ, drinking events and especially, football matches between the United Nation
team from Geo-Engineering section and Vietnamese team in TU Delft.
For the Vietnamese community in Delft and in the Netherlands, I cannot find words to
express my gratitude to you. I cannot image how I could live in Delft without you. Thanks
for the help from Chi and Phuong when I first came here. VDFC is a wonderful football
club, I have had many amazing moments in some tournaments.
This work would never been completed and perhaps begun without the support from
my family. I would like to thank my papa, mama and my younger sister, Dieu for your
support. My wife, Mai Lan, thank you so much for your love, support, encouragement
and patience. For my daughter, Minh Hang, it is really happy to see you growing up every
morning. Thanks to my son, Chinh Duong who breathes new life into my research.
ix


CONTENTS
Abstract vii
Acknowledgements ix
1 Introduction 1
1.1 Aims of this research . . . . . . . . . . . . . . . . . . . . . . . . . . . . 3
1.2 Outline of this dissertation . . . . . . . . . . . . . . . . . . . . . . . . . 4
2 Stability analysis of shallow tunnels 7
2.1 Introduction . . . . . . . . . . . . . . . . . . . . . . . . . . . . . . . . 8
2.2 Uplift . . . . . . . . . . . . . . . . . . . . . . . . . . . . . . . . . . . . 9
2.3 Failure body models . . . . . . . . . . . . . . . . . . . . . . . . . . . . 11
2.3.1 Literature review concerning stability of tunnel face . . . . . . . . . 11
2.3.2 Wedge stability model . . . . . . . . . . . . . . . . . . . . . . . . 15
2.4 Blow-out . . . . . . . . . . . . . . . . . . . . . . . . . . . . . . . . . . 21
2.5 Combination analysis . . . . . . . . . . . . . . . . . . . . . . . . . . . . 33
2.6 Conclusion . . . . . . . . . . . . . . . . . . . . . . . . . . . . . . . . . 37
3 Structural analysis of shallow tunnels 41
3.1 Introduction . . . . . . . . . . . . . . . . . . . . . . . . . . . . . . . . 42
3.2 Structural lining design . . . . . . . . . . . . . . . . . . . . . . . . . . . 44
3.2.1 Influence of load and overburden on lining models . . . . . . . . . 44
3.2.2 Influence of ground-lining interaction . . . . . . . . . . . . . . . . 46
3.2.3 A case study of Second Heinenoord Tunnel . . . . . . . . . . . . . 48
3.3 Impacts of overburden on tunnel lining. . . . . . . . . . . . . . . . . . . 52
3.4 Conclusion . . . . . . . . . . . . . . . . . . . . . . . . . . . . . . . . . 58
4 Ground movements and effects on buildings 71
4.1 Introduction . . . . . . . . . . . . . . . . . . . . . . . . . . . . . . . . 72
4.2 Ground movement definitions and risk assessment. . . . . . . . . . . . . 72
4.2.1 Ground movement definitions . . . . . . . . . . . . . . . . . . . . 72
4.2.2 Risk of building damage assessment . . . . . . . . . . . . . . . . . 78
4.3 Effects of the C /D ratio on surface settlement. . . . . . . . . . . . . . . . 80
4.4 Effects of the C /D ratio on subsurface settlement . . . . . . . . . . . . . . 85
4.5 Conclusion . . . . . . . . . . . . . . . . . . . . . . . . . . . . . . . . . 89
5 Volume loss in shallow tunnelling 91
5.1 Introduction . . . . . . . . . . . . . . . . . . . . . . . . . . . . . . . . 92
5.2 Volume loss at the tunnelling face. . . . . . . . . . . . . . . . . . . . . . 93
5.3 Volume loss along the shield . . . . . . . . . . . . . . . . . . . . . . . . 97
xi

xii CONTENTS
5.4 Volume loss behind the shield . . . . . . . . . . . . . . . . . . . . . . . 100
5.4.1 Volume loss at the tail . . . . . . . . . . . . . . . . . . . . . . . . 103
5.4.2 Volume loss due to consolidation . . . . . . . . . . . . . . . . . . 106
5.5 Total volume loss and case studies . . . . . . . . . . . . . . . . . . . . . 110
5.5.1 Total volume loss. . . . . . . . . . . . . . . . . . . . . . . . . . . 110
5.5.2 Case studies . . . . . . . . . . . . . . . . . . . . . . . . . . . . . 115
5.6 Conclusion . . . . . . . . . . . . . . . . . . . . . . . . . . . . . . . . . 119
6 Impact factors of influence zones 121
6.1 Introduction . . . . . . . . . . . . . . . . . . . . . . . . . . . . . . . . 122
6.2 On the variation of influence zones with different categories of damage
risk assessment . . . . . . . . . . . . . . . . . . . . . . . . . . . . . . . 122
6.3 Effects of soil parameters on influence zones . . . . . . . . . . . . . . . . 129
6.4 Conclusion . . . . . . . . . . . . . . . . . . . . . . . . . . . . . . . . . 132
7 Conclusions and Recommendations 135
7.1 Conclusions. . . . . . . . . . . . . . . . . . . . . . . . . . . . . . . . . 136
7.2 Recommendations for future research . . . . . . . . . . . . . . . . . . . 139
Bibliography 141
A Blow-out model 151
A.1 Uniform support pressure . . . . . . . . . . . . . . . . . . . . . . . . . 151
A.2 Linear support pressure with gradient δp . . . . . . . . . . . . . . . . . . 153
B Ground movement 155
List of Symbols 157
Summary 161
Samenvatting 163
Curriculum Vitæ 165

1INTRODUCTION
You are here not only for your PhD study, the more important achievement is the
improvement of yourself.
Johan W.Bosch
Although tunnels are often designed well below foundation level in urban areas, shallow
tunnels have many benefits with regards to the short-term construction costs and the long-
term operational expenses. There are, however, limits to shallow tunnelling in urban areas
with soft soil conditions, which should be investigated and solved. This chapter provides
an overview of the general background to shallow tunnelling, the aims of this research and
the outline of this dissertation.
1

1
2 1. INTRODUCTION
The demand for infrastructure in urban areas is increasing due to economic devel-
opments and the growth of urban populations. Even though the construction costs
are higher, underground infrastructure is a sustainable and safe construction choice for
cities. Tunnels have become an important part of public underground infrastructure all
over the world.
Tunnel boring machines (TBM) are widely used in the construction of underground in-
frastructure in urban areas due to the fact that disturbance at surface level can be re-
duced significantly during the construction and their ability to limit settlements and
damage to existing buildings. In an environment with soft overburden, particularly in
soft Holocene layers, buildings are generally built on pile foundations. The tunnel is of-
ten designed well below the pile tip level. There are two reasons for doing this: to reduce
interaction between the tunnelling process and the piles, and to avoid having to drive
through old abandoned piles that are still present below the streets. This results in rela-
tively deep track tunnels and also in deep station boxes.
When the tunnels are located at more shallow levels, above the pile tip level, this largely
eliminates the impact on the pile bearing capacity due to the ground movement at the
tip of the piles. This then reduces the required depth of the station boxes and therefore
also the construction costs. Other benefits are the low operational cost in the long-term
and the shorter travelling time from the surface to the platforms. Tunnelling in such
conditions is only possible if there are no or hardly any obstacles in the subsurface of
the streets. A shallow tunnel, with a low cover-to-diameter ratio C /D may introduce un-
foreseen or new limits, for example related to the face stability, the lining structure or
ground movements and the subsequent impact on nearby structures. Also, the stability
of the TBM and the tunnelling process may become an issue. For this reason, the focus
of this study is on the impact of shallow tunnelling in soft soils.
Firstly, the properties of the soil around the tunnel have important effects on the tun-
nelling face stability. With a shallow cover, if the support pressures at the tunnelling face
are too small, the tunnelling face will collapse and the soil will move towards the TBM.
When the support pressures are too large, this leads to problems of uplift, blow-out or
fracturing. Furthermore, the relatively large difference between the support pressures
at the top and the bottom of the tunnel and the relatively small bandwidth between the
maximum and minimum support pressures, compared to moderate and deep tunnels,
should be taken into account.
Secondly, reducing the C /D value leads to a change in the overburden load on the tun-
nel lining. A common method used in structural tunnel design has been proposed by
Duddeck and Erdmann (1985). Both his continuum model and the model without a re-
duction in ground pressures at the crown are valid for moderate and deep tunnels with
a depth C ≥ 2D. In shallow tunnels with a C /D ratio of less than 1, the overburden pres-
sure on the crown and the invert is significantly different and the loads, which are used
in Duddeck’s models, will not be realistic.
Thirdly, underground construction in urban areas often leads to negative effects on exist-
ing structures on the surface and on subsurface structures. In fact, considerable damage
to existing buildings due to tunnelling has been seen in many cities. To avoid or limit
such damage, the extent of the area that is influenced by tunnelling should be investi-
gated. Tunnelling usually leads to surface and subsurface settlement caused by ground

1.1. AIMS OF THIS RESEARCH
1
3
movement. Shallow tunnelling is expected to both increase the impact and magnitude
of ground movement to limit the area affected. The combined set of these contrasting
effects should be investigated to estimate the effect of tunnelling on existing structures.
Fourthly, the prediction of surface settlement and ground movement induced by tun-
nelling is based on volume loss, which is the difference between the realized tunnel vol-
ume and the designed tunnel volume. Although some methods for estimating volume
loss during design have been proposed, most are based on experience gained from previ-
ous projects, with a limited understanding of tunnelling processes. In order to optimize
the shallow tunnelling process, the relation between volume loss and machine parame-
ters and tunnelling management needs to be studied.
Besides investigating stability problems and the influence of shallow tunnelling on ex-
isting nearby buildings, protective methods also are effective approaches when seeking
to minimize the negative effects of tunnelling projects in urban areas. These methods
might be applied to improve the tunnelling process, to reinforce surrounding soil and/or
to strengthen existing nearby buildings. These protective methods are often determined
and decided on the basis of the required technical parameters estimated from the impact
analysis of shallow tunnelling.
1.1. AIMS OF THIS RESEARCH
On the basis of the above analysis, the effects and possibilities of shallow tunnelling in
soft soil will be investigated in this dissertation. This identifies the areas that require im-
provement methods for safe shallow tunnelling.
The first aim is to solve the stability problems of shallow tunnelling relating to uplift,
blow out and tunnelling face stability. The limits to the C /D ratio when tunnelling in soft
Holocene layers are investigated by looking into several aspects of shallow tunnelling.
The second target is to solve the structural design problem for shallow tunnels. Since
there are insufficient analysis models for tunnelling with shallow covers, this study pro-
poses a new structural model for shallow tunnels, which will include significant differ-
ences between loads at the top and bottom of the tunnel. From this structural analysis,
optimal C /D ratios can then be derived for various soil parameters and tunnels.
Thirdly, an investigation into the effects of shallow tunnelling on surface buildings with
shallow foundations, deep foundations and pile systems will be carried out. The extent
of influence areas due to tunnelling can be determined with allowable design values for
the preliminary risk assessment.
The next part studies volume loss, which is derived from tunnel boring machine param-
eters and construction management. The relationship between volume loss and the pro-
cess around the tunnelling machines will be investigated. An optimal way of conducting
construction management and establishing possible developments for new tunnelling
machines may be proposed.
The fifth part will provide the discussion on the combination of all the above aspects
of shallow tunnelling. The impact of soil parameters on zones affected by shallow tun-
nelling will be investigated.
In this study, the driveability of the TBM in soft soils, which was studied in Broere et al.
(2007) and Festa (2015), is not included because it is a very different field of expertise and
recent projects show that the driveability issues can be dealt with.

1
4 1. INTRODUCTION
1.2. OUTLINE OF THIS DISSERTATION
Chapter 2 deals with stability issues in tunnelling. Uplift, wedge stability and blow-out
will be investigated. New models for blow-out are presented. The range of the support
pressures depending on C /D ratios and limits is shown.
Chapter 3 investigates the effects of overburden on the tunnel structure. A new model
for the structural analysis of shallow tunnels is introduced to calculate the impact of the
C /D ratio on internal forces and deformations of the lining. Optimal C /D ratios for tun-
nels in various soil are derived.
The next chapter deals with ground movements and the effects on existing nearby build-
ings. These include the relative influence distances from existing buildings to the tunnel
axis and the influence zone on subsurface structures.
Volume loss at the tunnelling face, along the shield, as well as at and behind the tail are
detailed in Chapter 5.
Chapter 6 investigates the combined results and impact factors on the extent of the in-
fluence zones induced by shallow tunnelling.
The final chapter draws conclusions and provides recommendations for optimizing shal-
low tunnelling in soft soil.
An overview of this dissertation and the journal papers it is based on are given in Fig-
ure 1.1.

1.2
.O
UT
LIN
EO
FT
HIS
DIS
SE
RT
AT
ION
1
5
Figure 1.1: Research structure


2STABILITY ANALYSIS OF SHALLOW
TUNNELS
Keeping the tunnel safe and operational during use
Peck, Ralph B
Reducing the cover of shallow (metro) tunnels can lower construction costs by lowering
cost of the station boxes, increase safety and lower operational costs in the long-term. For
bored tunnels there are normally minimal depth requirements stemming from design and
construction. The aim of this chapter is to investigate the effects of the cover-to-diameter
ratio C /D on the stability of tunnelling process. Several models to analyze the tunnel sta-
bility were investigated and were applied for a case study in a typical Dutch soil profile
with soft Holocene soil layers. The range of the support pressures in TBM machines, espe-
cially in EPB, when tunnelling in soft soil is derived for varied C /D ratios in different soil
conditions. On the basis of the analysis results, some design optimizations are proposed
for shallow tunnels in soft soil.
This chapter is based on papers that have been published in ITA WTC 2015 Congress and 41st General Assem-
bly Vu et al. (2015d) and Tunnelling and Underground Space Technology Vu et al. (2015c).
7

2
8 2. STABILITY ANALYSIS OF SHALLOW TUNNELS
2.1. INTRODUCTION
One of the most important requirements of tunnelling in cities is to maintain existing
buildings and infrastructure systems. In the case of tunnelling carried out in urban ar-
eas and especially the historical areas, there may be a risk of damage to buildings, for
instance due to the collapse of the tunnel face and the subsequent surface settlement.
Therefore, it is necessary to control the support pressures at the tunnelling face, around
the TBM and at the tail to prevent unexpected displacements in the surrounding ground
and surface settlements.
In tunnelling, the support pressures should not only be high enough in order to avoid
the ground moving into the excavation chamber but also low enough to prevent fractur-
ing and blow-out. Although recent models in stability analysis for tunnelling can supply
the maximum and minimum support pressures, when tunnelling with a shallow cover
and taking into account a minimum of allowable fluctuation of the support pressures in
practice, there will be a limit C /D ratio for tunnelling in soft soils.
Although that tunnel construction with a shallow cover is technically feasible is shown
for example by the constructions of the Oi Area Tunnel, Japan (Miki et al., 2009), the
Zimmerberg Base Tunnel, Switzerland (Matter and Portner, 2004), or microtunnelling
and pipejacking in soft ground, see Stein (2005), it is not clear to what extent this is true
in soft soils below the water table, as found in many delta areas. Therefore, it is necessary
to prevent the uplift and take into account the pore pressure in calculating the support
pressures.
Numerous authors have looked into the stability of the tunnel in soft soils such as Broms
and Bennermark (1967); Atkinson and Potts (1977); Davis et al. (1980); Kimura and Mair
(1981); Leca and Dormieux (1990); Anagnostou and Kovári (1994); Jancsecz and Steiner
(1994); Chambon and Corté (1994); Broere (2001); Bezuijen and van Seters (2005) and
Mollon et al. (2009a). However, they have not explicitly investigated the stability of very
shallow tunnelling. This chapter looks into several aspects of shallow overburden tun-
nelling and seeks the limits to C /D ratios when tunnelling in soft Holocene layers. Var-
ious geotechnical influences on the tunnel will be studied and the effects of a low C /D
ratio will be modelled. In this study, it is assumed that infiltration influences are min-
imal, as these are not taken into account. This analysis is carried out with a number
of ideal soil profiles which are derived from Amsterdam North-South metro line project
(Gemeente-Amsterdam, 2009), consisting of a single soil type with most important prop-
erties as defined in Table 2.1, where γ is volumetric weight, ϕ is the friction angle, K
is the initial coefficient of lateral earth pressure, c is cohesion, Cs is compression con-
stant, Cswel is swelling constant, ν is Poisson’s ratio and Es is the stiffness modulus of the
ground.
In this chapter, section 2.2 will investigate the failure of uplift and propose requirements
of cover depth as well as the thickness of the tunnel lining. Section 2.3 will study recent
failure models and investigate the wedge models to estimate the relationship between
minimum required support pressures and C /D ratios. In section 2.4, the instability of
tunnels due to blow-out will be studied and models to calculate the maximum required
support pressures are proposed. Section 2.5 is the combination of all aspects on tunnel
stability analysis in order to estimate the relation between required support pressures
and C /D ratios. Conclusions of geotechnical analysis for tunnelling stability are pre-

2.2. UPLIFT
2
9
Figure 2.1: Uplift calculation
sented in Section 2.6.
2.2. UPLIFT
In tunnelling design, failure by uplift should be assessed as a permanent stability assess-
ment. Uplift of bored tunnels is indicated in several studies such as Bakker (2000); NEN-
EN 1997-1 (1997). In offshore industry, there are models of uplift stability for oil and gas
pipeline are proposed by Trautmann et al. (1985); Ng and Springman (1994); White et al.
(2001) which present various sliding blocks and inclined failure surfaces.
In this study, the model with vertical slip surfaces (Figure 2.1) which has a diameter D soil
volume above the circle tunnel is proposed for analysis. Assuming that the ground water
level is at the surface, the tunnel is loaded by the following vertical forces: the weight of
the tunnel G2, the weight of overlaying soil layers G1 and the uplift force G A .
The uplift force G A on the tunnel can be estimated according to the Archimedes’s prin-
Table 2.1: Soil parameters used in design of Amsterdam North-South metro line project (Bosch and Broere,
2009; Gemeente-Amsterdam, 2009)
Soil type γ(kN /m3) ϕ(o ) K (−) c(kN /m2) Cs (−) Cswel (−) ν(−) Es (kN /m2)
Sand 20 35 0.5 - - - 0.2 20000
Clayey sand 17.9 35 0.4 2 - - 0.2 12000
Clay 16.5 33 0.5 7 100 1000 0.15 10000
Organic clay 15.5 20 0.65 5 80 800 0.15 5000
Peat 10.5 20 0.65 5 25 250 0.15 2000

2
10 2. STABILITY ANALYSIS OF SHALLOW TUNNELS
ciple as:
G A = γwπ
4D2 (2.1)
where γw is the volumetric weight of water and D is the diameter of the tunnel.
The weight of the tunnel lining G2 follows from:
G2 ≈πγT Dd (2.2)
where is d is the thickness of the tunnel lining and γT is the weight unit of the tunnel
lining (concrete).
The weight of the soil layers above the tunnel G1 is given by:
G1 ≥ DHγ′−π
8D2γ
′(2.3)
where γ′
is the effective volumetric weight of soil.
In the construction phase, it is assumed that friction between the tunnel lining and sur-
rounding ground is not included in the vertical equilibrium (lower boundaries). If the
uplift force G A is smaller than the total of tunnel weight and the upper soil layers weight,
there will be no uplift of the tunnel (although safety factors have not been included here):
G A ≤G1 +G2 (2.4)
orπ
4γw D2 ≤πγT Dd +DHγ
′−π
8D2γ
′(2.5)
Such that, the required depth of the tunnel can be calculated from:
H ≥πγw D + π
2γ′D −4πγT d
4γ′ (2.6)
From Figure 2.1, the depth of tunnel overburden is:
C = H −D
2(2.7)
From Equation 2.6, the minimum required ratio of C /D can be calculated as:(
C
D
)
mi n
=πγw
4γ,−πdγT
Dγ,−
1
2+π
8(2.8)
Assuming the unit weight of tunnel lining γT = 24kN /m3, the relation between the min-
imum required ratio of C /D and the unit weight of soil for the various thickness-to-
diameter ratios of the tunnel segment d/D is shown in Figure 2.2. For example, for a
reference tunnel in clayey sand (γ = 17.9kN /m3) with d/D = 1/20, the minimum C /D
ratio of 0.41 is found. For the case of d/D = 1/10, the cover C = 0 and therefore the ratio
C /Dmi n = 0 when γ, = 2.92kN /m3. This means that there is no risk of uplift when the
cross section of the tunnel is designed with d/D = 1/10 or including ballast weight to a
similar effect and the soil has a unit weight γ, more than 3kN /m3.
Based on Equation 2.8, Figure 2.3 indicates the required ratio d/D and the minimum
required ratio C /D in various soil types. In these conditions, the minimum ratios d/D
avoiding the uplift are identified as in Table 2.2 in the case of a tunnel with C /D = 0. This
shows that given enough ballast weight, the risk of uplift can be countered even in very
soft soil conditions.

2.3. FAILURE BODY MODELS
2
11
γ,
1 2 3 4 5 6 7 8 9 10
C/D
min
0
1
2
3
4
5
6
7
8
d/D=1/20
d/D=1/18
d/D=1/16
d/D=1/14
d/D=1/12
d/D=1/10
Figure 2.2: Relation between unit weight of soil and the minimum required ratio C /D
Table 2.2: Minimum required d/D
Soil type γ(kN /m3) d/D
Sand 20 0.090
Clayey sand 17.9 0.093
Clay 16.5 0.095
Organic clay 15.5 0.096
Peat 10.5 0.103
2.3. FAILURE BODY MODELS
2.3.1. LITERATURE REVIEW CONCERNING STABILITY OF TUNNEL FACE
In order to evaluate the failure which is related to the stability of the tunnelling face,
Broms and Bennermark (1967) proposed the first model which describes the vertical
opening stability in an undrained cohesive (Tresca) material as can be seen in Figure 2.4.
Their study was carried out by theoretical analysis and experiment observations. The
stability of the tunnelling face is assessed by the stability ratio N , as follows:
N =qs − s
cu+
γ
cu(C +
D
2) (2.9)
where qs is the surface load, C is the overburden, D is the tunnel diameter, cu is the
undrained shear strength of the ground and s is the support pressure. From the labora-
tory test data and observations of tunnels and pipes constructed in soft clay, the opening
face is stable when N is less than 6.
From Equation 2.9, the minimum support pressure smi n for the tunnelling face can be
given by:
smi n = γ(C +D
2)+qs −N cu (2.10)

2
12 2. STABILITY ANALYSIS OF SHALLOW TUNNELS
d/D0 0.02 0.04 0.06 0.08 0.1 0.12 0.14 0.16 0.18 0.2
C/D
min
0
0.2
0.4
0.6
0.8
1
1.2
1.4
1.6
1.8
2
SandClayey sandClayOrganic clayPeat
Figure 2.3: Relation between ratio of d/D and the minimum required ratio C /D
Davis et al. (1980) investigated the stability of two dimensional idealization of a partial
unlined tunnel heading in Tresca material as can be seen in the Figure 2.5 where P is the
distance between the face and the provided support point. Three different mechanisms
of a shallow tunnel are derived for collapse under undrained conditions. In this study,
the vertical opening theory which was presented by Broms and Bennermark (1967) is
used as one of three limit cases.
The influence of the C /D ratio on the stability of the tunnel in the study of Davis et al.
(1980) is shown in Figure 2.6 with the different values of γD/cu ratio for upper and lower
boundaries. For the values of C /D ratio higher than 3, the values of lower and upper
bounds do not change with theγD/cu ratio. The authors also showed that a blow-out will
be a problem in the case of a very shallow tunnel and the failure mechanism is usually
close to the optimum upper bound mechanism.
In their analysis of the stability of the tunnelling face (when P = 0), Davis et al. (1980)
also derived the lower boundary of the stability ratio N for two cases of cylindrical and
spherical stress fields as:
NTC = 2+2ln(2C
D+1) (2.11)
NTC = 4ln(2C
D+1) (2.12)
These results agree with the values of the critical stability ratio NTC in laboratory and
centrifuge tests from the study of Kimura and Mair (1981) on tunnel heading failures in
undrained conditions (Figure 2.7).
Atkinson and Potts (1977) investigated the stability for a circular tunnel in cohessiveless
soil by means of theoretical and experimental methods. Their study based on a upper
boundary by selecting any kinematic collapse mechanism and a statically admissible

2.3. FAILURE BODY MODELS
2
13
Figure 2.4: Unsupported opening in vertical hold (Broms and Bennermark, 1967)
Figure 2.5: A tunnelling model in Davis et al. (1980)
lower boundary on a plane strain model is shown in Figure 2.8. The boundary of the di-
mensionless s/γD ratio is shown in Figure 2.9 in the case of ϕ= 35o . The results of their
experiments agree with the theoretical analysis. Figure 2.9 also shows that the bound-
aries of the support pressures are independent of the C /D ratio. The minimal support
pressure is estimated by the lower boundary conditions, as follows:
smi n =µ
µ2 −1γD (2.13)
where:
µ=1+ sinϕ
1− sinϕ(2.14)
and ϕ is the maximum angle of shearing resistance.
Based on the upper boundary conditions, the maximum support pressure is given by:
smax =γD
4cosϕ
(
1
tanϕ+ϕ−
π
2
)
(2.15)
In order to investigate the stability of the tunnnelling face in cohesive and frictional soils,

2
14 2. STABILITY ANALYSIS OF SHALLOW TUNNELS
Figure 2.6: Upper and lower bound stability ratios for a plane strain unlined tunnel (Davis et al., 1980)
Leca and Dormieux (1990) proposed a stability criterion for the tunnelling face based on
the movement of rigid conical blocks with circular cross-sections (Figure 2.10). The max-
imum and minimum support pressures are derived from three upper boundary solu-
tions (Figure 2.11). Their results presented in Figure 2.9 show that the support pressures
from the upper boundary conditions are independent of the C /D ratio. The support
pressures are derived from these failure mechanisms as following:
s = Ns qs +NγγD (2.16)
where Ns and Nγ are weighting coefficients that depend on the angle α between the axis
of the cone adjacent to the tunnel and the horizontal axis. The minimum or maximum
support pressures depend on the choice of the value of Ns and Nγ.
The results of this criterion were also compared to the experimental results of centrifuge
tests. There is a reasonable agreement between the results of theoretical calculation and
of the centrifuge tests by Chambon and Corté (1994). This comparison shows that the
support pressures from the upper boundary solutions are closer to the real pressures
at failure than the support pressures calculated by the lower boundary solutions. The
authors also concluded that the face stability has little effect from the surcharge qs except
for very shallow tunnels and the failure zone in front of the tunnelling face has the extent
smaller than a long open cut.
Mollon et al. (2009a) presented a failure mechanism to determine the critical collapse
pressures of a pressurized tunnel face based on the kinematic approach of limit analysis
theory. It is a three dimensional multiblock mechanism that improves from the solution
of Leca and Dormieux (1990) (Figure 2.12). The support pressure is estimated as:
s = γDNγ+qs Ns − cNc (2.17)
where Nγ, Ns and Nc are dimensionless coefficients depending on the size and shape
of the mechanism. Their results were compared to and well agreed with the other kine-

2.3. FAILURE BODY MODELS
2
15
TC
TC
Figure 2.7: Critical stability ratio for lined tunnels (Mair and Taylor, 1999)
matic and static approaches as shown in Figure 2.13 for the load factor and the collapse
pressure but there is still a considerable difference between the results of centrifuge tests
and their results in the case of a purely cohesive soil.
2.3.2. WEDGE STABILITY MODEL
The support pressure at the tunnelling face must be higher than or at least equal to the
total of water pressure and horizontal effective soil pressure to avoid collapse. The min-
imum required support pressure is estimated on the basis of this equilibrium condition.
Over the years, many studies have been carried out to determine the minimum required
support pressure. In 1961, Horn developed the first kinematic model including a soil
wedge column based upon the silo theory to access the stability of the tunnelling face.
This model consists of a wedge and overlying prismatic body (Figure 2.14).
Anagnostou and Kovári (1994) developed Horn’s wedge model using the silo theory of
Janssen in drained condition (Figure 2.15). In this model, the vertical surcharge pressure
σ′
v acting on the wedge can be reduced by the shear stresses on the sliding surface. From
the computational analysis, the effects of the shear strength parameter of the ground, the
permeability and the dynamic viscosity of the suspension were taken into account in sta-
bility assessments. It was concluded that the effectiveness of slurry support depends on
the infiltration distance of suspension into the ground. However, these models only deal
with the case of homogeneous soil.
Jancsecz and Steiner (1994) proposed a three-dimensional model that takes into account
the effects of soil arching above the tunnelling face as can be seen in Figure 2.16. The
three-dimensional effect is shown in this model by the three-dimensional earth pres-
sure coefficient K A3 in calculation relating to the support pressure for the stability of the
tunnelling face. In this study, the minimum required support pressure can be calculated
as:
smi n =σ′
h +p = K A3.σ′
v +p (2.18)

2
16 2. STABILITY ANALYSIS OF SHALLOW TUNNELS
Figure 2.8: Model test of Atkinson and Potts (1977).
Figure 2.9: Upper and lower bounds of the support pressure for lined (P = 0) and unlined tunnels (P = ∞)
(Mair and Taylor, 1999)
2.3. FAILURE BODY MODELS
2
17
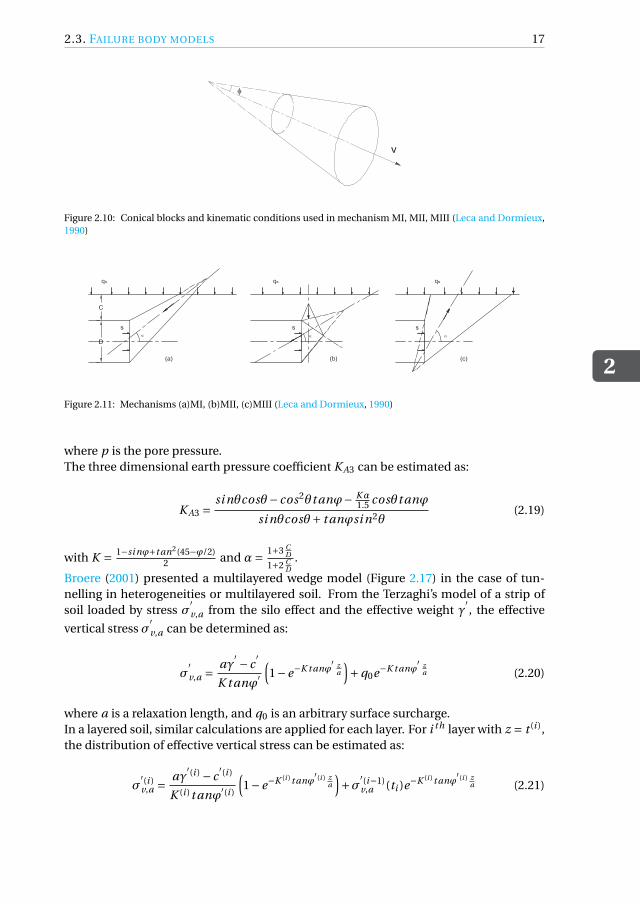
Figure 2.10: Conical blocks and kinematic conditions used in mechanism MI, MII, MIII (Leca and Dormieux,
1990)
Figure 2.11: Mechanisms (a)MI, (b)MII, (c)MIII (Leca and Dormieux, 1990)
where p is the pore pressure.
The three dimensional earth pressure coefficient K A3 can be estimated as:
K A3 =si nθcosθ− cos2θt anϕ− Kα
1.5cosθt anϕ
si nθcosθ+ t anϕsi n2θ(2.19)
with K = 1−si nϕ+t an2(45−ϕ/2)2
and α=1+3 C
D
1+2 CD
.
Broere (2001) presented a multilayered wedge model (Figure 2.17) in the case of tun-
nelling in heterogeneities or multilayered soil. From the Terzaghi’s model of a strip of
soil loaded by stress σ′
v,a from the silo effect and the effective weight γ′, the effective
vertical stress σ′
v,a can be determined as:
σ′
v,a =aγ
′− c
′
K t anϕ′
(
1−e−K t anϕ′ z
a
)
+q0e−K t anϕ′ z
a (2.20)
where a is a relaxation length, and q0 is an arbitrary surface surcharge.
In a layered soil, similar calculations are applied for each layer. For i th layer with z = t (i ),
the distribution of effective vertical stress can be estimated as:
σ′(i )v,a =
aγ′(i ) − c
′(i )
K (i )t anϕ′(i )
(
1−e−K (i )t anϕ′(i ) z
a
)
+σ′(i−1)v,a (ti )e−K (i )t anϕ
′(i ) za (2.21)

2
18 2. STABILITY ANALYSIS OF SHALLOW TUNNELS
Figure 2.12: Multiblock failure mechanism by Mollon et al. (2009b)
In the case of surface loading q0 = 0kN /m2, the effective horizontal stress can be calcu-
lated as:
σ′
h,a =σ′
v,aK =aγ
′− c
′
t anϕ′
(
1−e−K t anϕ′ z
a
)
(2.22)
According to Broere (2001), three possible relaxation length a values can be estimated
based on the applied wedge model:
- Without arching effect: a =∞;
- With two dimensional arching effect: a = R;
- With three dimensional arching: a = R 11+t anθ , where θ is estimated in Jancsecz and
Steiner (1994).
Three possible ways of vertical and horizontal stress distribution along the wedge body
were also proposed by Broere (2001) as can be seen in Figure 2.18. The line 1 and 2 show
the horizontal stress distribution in the case of without and with arching effect. The
dashed line 3 presents the assumed linear distribution with the stress including arching
effect at the top of the tunnel and the stress without arching effect at the bottom of the
tunnel.
By comparing the results of centrifuge tests and different models with and without arch-
ing effect, Broere (2001) indicated that the model with three dimensional arching effect
with coefficient of neutral horizontal effective stress K0 is the best model to determine
the minimal required support pressure in the case of a shallow tunnel. This model is ap-
plied in this study for calculating the minimum support pressure for the tunnel in varied
soil parameters.
Figure 2.19 shows the relation between the effective horizontal pressuresσ′
hand the C /D
ratio based on Equation 2.22 for various tunnel diameters D in varied soil types. For in-
stance, for a reference tunnel with D = 6m in clayey sand and C /D = 0.41, a minimum
support pressure σ′
h= 3.84(kN /m2) is found. It shows that the larger the tunnel diam-

2.3. FAILURE BODY MODELS
2
19
(a) load factor N (b) support pressure
Figure 2.13: Comparison load factor N and support pressures between kinematic and static approaches (Mol-
lon et al., 2010)
Figure 2.14: Sliding mechanism (after Horn 1961)

2
20 2. STABILITY ANALYSIS OF SHALLOW TUNNELS
Figure 2.15: Force model according to Anagnostou and Kovári (Maidl, 2012)
b) Front viewa) Longitudinal section
d) Force on soil wedgec) Top side view
Ground surface
Ground water
Figure 2.16: Three dimensional limit equilibrium model (Jancsecz and Steiner, 1994)
2.4. BLOW-OUT
2
21
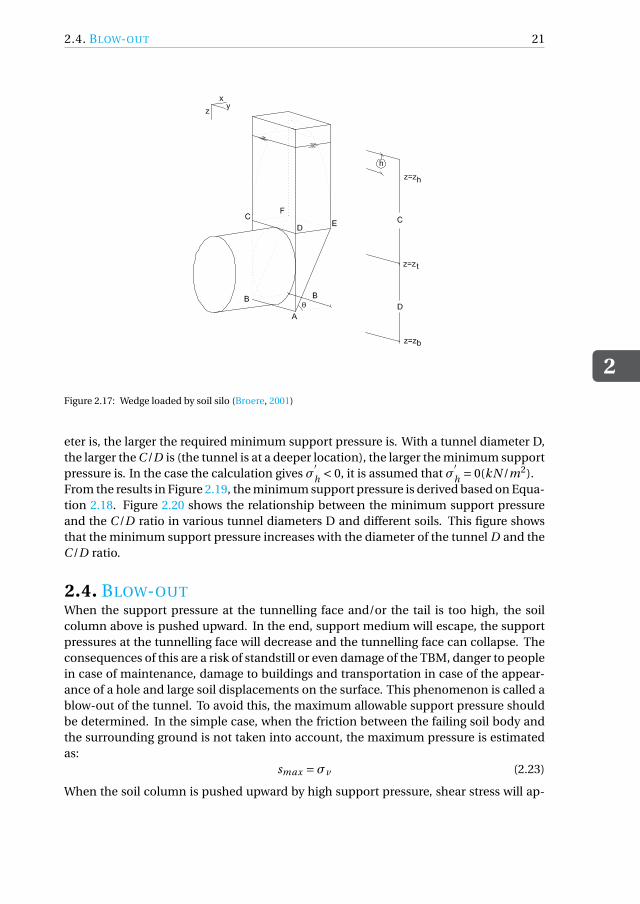
Figure 2.17: Wedge loaded by soil silo (Broere, 2001)
eter is, the larger the required minimum support pressure is. With a tunnel diameter D,
the larger the C /D is (the tunnel is at a deeper location), the larger the minimum support
pressure is. In the case the calculation gives σ′
h< 0, it is assumed that σ
′
h= 0(kN /m2).
From the results in Figure 2.19, the minimum support pressure is derived based on Equa-
tion 2.18. Figure 2.20 shows the relationship between the minimum support pressure
and the C /D ratio in various tunnel diameters D and different soils. This figure shows
that the minimum support pressure increases with the diameter of the tunnel D and the
C /D ratio.
2.4. BLOW-OUT
When the support pressure at the tunnelling face and/or the tail is too high, the soil
column above is pushed upward. In the end, support medium will escape, the support
pressures at the tunnelling face will decrease and the tunnelling face can collapse. The
consequences of this are a risk of standstill or even damage of the TBM, danger to people
in case of maintenance, damage to buildings and transportation in case of the appear-
ance of a hole and large soil displacements on the surface. This phenomenon is called a
blow-out of the tunnel. To avoid this, the maximum allowable support pressure should
be determined. In the simple case, when the friction between the failing soil body and
the surrounding ground is not taken into account, the maximum pressure is estimated
as:
smax =σv (2.23)
When the soil column is pushed upward by high support pressure, shear stress will ap-

2
22 2. STABILITY ANALYSIS OF SHALLOW TUNNELS
Figure 2.18: Three possible distribution of horizontal stress along the wedge sides (Broere, 2001)
pear between the soil column and the surrounding ground. In a more accurate blow-out
model, this shear stress should be taken into account. In the equilibrium condition (Fig-
ure 2.21), the support force is at least equal to the total of the weight of the above soil
column and the shear forces along two vertical sides of the two dimensional rectangu-
lar soil body. Based on this, the maximum support pressure for the tunnel face can be
estimated as (excluding safety factors):
smax =C
(
γ+2c +C Kyγ
′t anϕ
D
)
(2.24)
where Ky is the coefficient of horizontal effective stress.
In the model proposed by Balthaus (1991) (Figure 2.22), the up-lift soil body is modelled
as a wedge shape, which is pushed upward when blow-out occurs. By balancing the
wedge soil body weight G and the support force S, the maximum support pressure can
be estimated. Safety indexes against the blow out were presented:
η=G
S> η1 =
γC(
B ′+C cot(
45o +ϕ/2))
B ′s (zt )> η2 =
γC
s (zt )(2.25)
Because Balthaus’s model activates a large soil body above the tunnel, the calculated re-
sult is somewhat exaggerated. Meanwhile, Broere’s model (Figure 2.21) is probably too
conservative. In practical tunnelling, the support pressure at the tunnelling face often
changes along the vertical axis. In shallow tunnels, the difference between the required
support pressures at the top and the bottom of the tunnel is large. This study proposes
below new blow-out models in order to take this change into account with uniform sup-
port pressures and linear support pressures in which the effect of grouting flows is in-
cluded.
In the model in Figure 2.23, the support pressure s is uniformly distributed on the perime-
ter of the tunnel section at the upper and lower part of the tunnel. The maximum allow-
able support pressure is estimated in the upper part of the tunnel in which the soil body

2.4. BLOW-OUT
2
23
C/D0 0.5 1 1.5 2 2.5 3
σ, h(k
N/m
2)
0
2
4
6
8
10
12
14
16
18
20
D=1D=2D=3D=4D=5D=6D=7D=8D=9D=10
(a) in sand
C/D0 0.5 1 1.5 2 2.5 3
σ, h(k
N/m
2)
-2
0
2
4
6
8
10
12
14
D=1D=2D=3D=4D=5D=6D=7D=8D=9D=10
(b) in clayey sand
C/D0 0.5 1 1.5 2 2.5 3
σ, h(k
N/m
2)
-10
-8
-6
-4
-2
0
2
4
D=1D=2D=3D=4D=5D=6D=7D=8D=9D=10
(c) in clay
C/D0 0.5 1 1.5 2 2.5 3
σ, h(k
N/m
2)
-15
-10
-5
0
5
10
15
D=1D=2D=3D=4D=5D=6D=7D=8D=9D=10
(d) in soft clay
C/D0 0.5 1 1.5 2 2.5 3
σ, h(k
N/m
2)
-14
-12
-10
-8
-6
-4
-2
0
D=1D=2D=3D=4D=5D=6D=7D=8D=9D=10
(e) in peat
Figure 2.19: Relationship between C /D ratio and horizontal stress σ′
hwith varied tunnel diameter D

2
24 2. STABILITY ANALYSIS OF SHALLOW TUNNELS
C/D0 0.5 1 1.5 2 2.5 3
s min
(kN
/m2)
0
50
100
150
200
250
300
350
400
D=1D=2D=3D=4D=5D=6D=7D=8D=9D=10
(a) in sand
C/D0 0.5 1 1.5 2 2.5 3
s min
(kN
/m2)
0
50
100
150
200
250
300
350
400
D=1D=2D=3D=4D=5D=6D=7D=8D=9D=10
(b) in clayey sand
C/D0 0.5 1 1.5 2 2.5 3
s min
(kN
/m2)
0
50
100
150
200
250
300
350
400
D=1D=2D=3D=4D=5D=6D=7D=8D=9D=10
(c) in clay
C/D0 0.5 1 1.5 2 2.5 3
s min
(kN
/m2)
0
50
100
150
200
250
300
350
400
D=1D=2D=3D=4D=5D=6D=7D=8D=9D=10
(d) in organic clay
C/D0 0.5 1 1.5 2 2.5 3
s min
(kN
/m2)
0
50
100
150
200
250
300
350
D=1D=2D=3D=4D=5D=6D=7D=8D=9D=10
(e) in peat
Figure 2.20: Relationship between C /D ratio and minimum support pressures with various tunnel diameter D

2.4. BLOW-OUT
2
25
Figure 2.21: Blow-out model including friction at boundaries (Broere, 2001)
and the shear are taken into account, as follows (see Appendix A):
st ,max = γ(
H −π
8D
)
+2H
D
(
c +1
2HKyγ
′t anϕ
)
(2.26)
where H =C + D2
.
It can be written as:
st ,max =
(
C
D+
1
2
)2
2DKyγ′t anϕ+
(
C
D+
1
2
)
(
γD +2c)
−π
8γD (2.27)
For the lower part of the tunnel, the tunnel weight is taken into account. The allowable
grouting pressure which is shown in Figure 2.23b, can be estimated as following equation
(see Appendix A):
sb,max = γ(
H −π
8D
)
+2H
D
(
c +1
2HKyγ
′t anϕ
)
+γT πd (2.28)
Or
sb,max =
(
C
D+
1
2
)2
2DKyγ′t anϕ+
(
C
D+
1
2
)
(
γD +2c)
+γT πd −π
8γD (2.29)
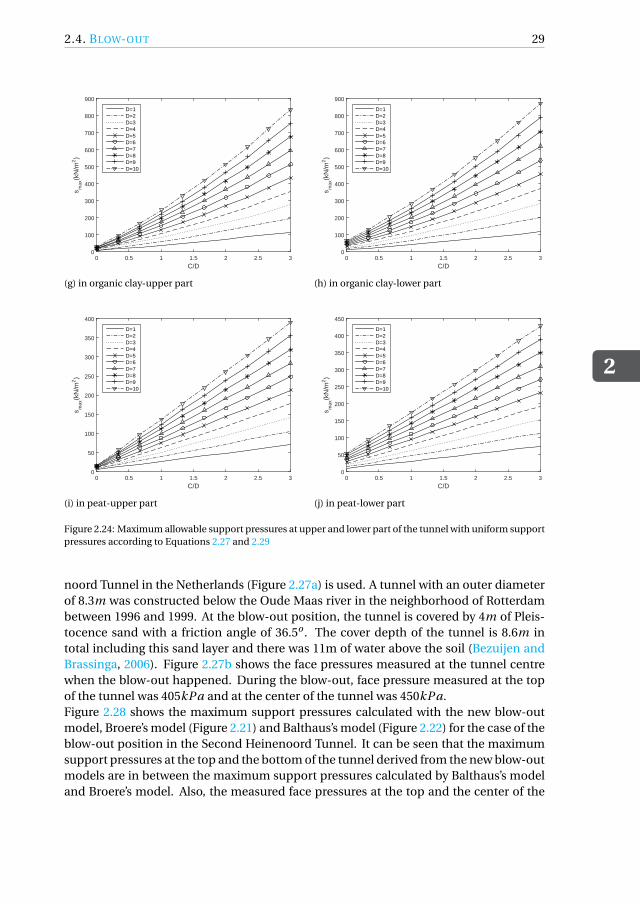
Figure 2.24 presents the relationship between the maximum support pressure st ,max and
sb,max at upper and lower part of the tunnel and the C /D ratio in the range of tunnel di-
ameter D from 1 meter to 10 meters. This figure shows that the higher the ratio of C /D
is, the larger the maximum support pressures are.
The in-situ data (Talmon and Bezuijen, 2005; Bezuijen and Talmon, 2005b) and experi-
mental data (Bezuijen et al., 2006) show that the grouting pressure gradient directly be-
hind the TBM is nearly 20kPa/m at the start of grouting and at the end of the registration
is about 7kPa/m in monitoring. This reduction of the grouting pressure is related to the
consolidation and bleeding of the grout (Bezuijen and Talmon, 2005a). The grout around

2
26 2. STABILITY ANALYSIS OF SHALLOW TUNNELS
Figure 2.22: Calculation model of Balthaus for the safety against blow-out (Balthaus, 1991)
the tunnel is assumed to behave as a Bingham liquid which has a viscosity and a yield
stress. This liquid has a downward movement when more grout is injected through the
upper injection points of the TBM. This downward flow creates a driving force larger
than the yield stress. The pressure gradient, therefore, is smaller than the gradient esti-
mated from the density. To be more accurate with the in-situ data, the gradient of the
grouting movement in the tail void should be taken into account in blow-out analysis.
According to Bezuijen and Talmon (2008), the maximum pressure gradient δp is given
by:
δp =dP
d z= ρg r g −2
τy
dg r(2.30)
where ρg r is the density of the grout, g is the acceleration gravity, τy is the shear strength
of the grout, and dg r is the width of the tail void gap between the tunnel and the sur-
rounding ground.
Figure 2.25 shows the blow-out model including a vertical pressure gradient δp . The
support pressure in the upper part of the tunnel section in Figure 2.25a is given by:
s = s0,t +δp R cosϕ (2.31)
where s0,t is the support pressure at the top of the tunnelling face.
The maximum support pressure at the top of the tunnelling face is given by (see Ap-
pendix A):
s0,t ,max = γ(
H −π
8D
)
+2H
D
(
c +1
2HKyγ
′t anϕ
)
−δp D
4(2.32)
or
s0,t ,max =
(
C
D+
1
2
)2
2DKyγ′t anϕ+
(
C
D+
1
2
)
(
γD +2c)
−π
8γD −
δp D
4(2.33)

2.4. BLOW-OUT
2
27
(a) upper part (b) lower part
Figure 2.23: Blow-out model with uniform support pressure
In the lower part as can be seen in Figure 2.25b, the support pressure in the upper part
of the tunnel section is given by:
s = s0,b −δp R cosϕ (2.34)
where s0,b is the support pressure at the bottom of the tunnelling face.
The maximum support pressure at the bottom of the tunnelling face is given by (see
Appendix A):
s0,b,max = γ(
H −π
8D
)
+2H
D
(
c +1
2HKyγ
′t anϕ
)
+γT πd +δp D
4(2.35)
or
s0,b,max =
(
C
D+
1
2
)2
2DKyγ′t anϕ+
(
C
D+
1
2
)
(
γD +2c)
+γT πd −π
8γD +
δp D
4(2.36)
From Equation 2.33 and 2.36, the maximum support pressures can be estimated de-
pending on the C /D ratio in the case of linearly distributed support pressures. It is as-
sumed that the unit weight of tunnel is γT = 24kN /m3 and the vertical gradient of the
grout a= 7kPa/m. For example, for a reference tunnel with D = 6m and C /D = 0.41
in clayey sand, the maximum support pressures are st ,max = 81,34(kN /m2), sb,max =103,96(kN /m2), s0,t ,max = 70,84(kN /m2) and s0,b,max = 114,46(kN /m2).
The relationship between the maximum support pressures at the upper and lower parts
of the tunnel s0,t ,max and the C /D ratio is shown in Figure 2.26 for tunnels with the diam-
eter D from 1 meter to 10 meters in varied soil. The conclusion reached when analysing
the relationship between the maximum support pressures and the C /D ratio is that the
higher the ratio of C /D is, the larger the maximum support pressures are.
In order to evaluate the new blow-out models, the blow-out case of the Second Heinen-

2
28 2. STABILITY ANALYSIS OF SHALLOW TUNNELS
C/D0 0.5 1 1.5 2 2.5 3
s max
(kN
/m2)
0
500
1000
1500
D=1D=2D=3D=4D=5D=6D=7D=8D=9D=10
(a) in sand-upper part
C/D0 0.5 1 1.5 2 2.5 3
s max
(kN
/m2)
0
200
400
600
800
1000
1200
1400
1600
D=1D=2D=3D=4D=5D=6D=7D=8D=9D=10
(b) in sand-lower part
C/D0 0.5 1 1.5 2 2.5 3
s max
(kN
/m2)
0
200
400
600
800
1000
1200
D=1D=2D=3D=4D=5D=6D=7D=8D=9D=10
(c) in clayey sand-upper part
C/D0 0.5 1 1.5 2 2.5 3
s max
(kN
/m2)
0
200
400
600
800
1000
1200
D=1D=2D=3D=4D=5D=6D=7D=8D=9D=10
(d) in clayey sand-lower part
C/D0 0.5 1 1.5 2 2.5 3
s max
(kN
/m2)
0
200
400
600
800
1000
1200
D=1D=2D=3D=4D=5D=6D=7D=8D=9D=10
(e) in clay-upper part
C/D0 0.5 1 1.5 2 2.5 3
s max
(kN
/m2)
0
200
400
600
800
1000
1200
D=1D=2D=3D=4D=5D=6D=7D=8D=9D=10
(f) in clay-lower part
Figure 2.24: Maximum allowable support pressures at upper and lower part of the tunnel with uniform support
pressures according to Equations 2.27 and 2.29(continue in next page)
2.4. BLOW-OUT
2
29
C/D0 0.5 1 1.5 2 2.5 3
s max
(kN
/m2)
0
100
200
300
400
500
600
700
800
900
D=1D=2D=3D=4D=5D=6D=7D=8D=9D=10
(g) in organic clay-upper part
C/D0 0.5 1 1.5 2 2.5 3
s max
(kN
/m2)
0
100
200
300
400
500
600
700
800
900
D=1D=2D=3D=4D=5D=6D=7D=8D=9D=10
(h) in organic clay-lower part
C/D0 0.5 1 1.5 2 2.5 3
s max
(kN
/m2)
0
50
100
150
200
250
300
350
400
D=1D=2D=3D=4D=5D=6D=7D=8D=9D=10
(i) in peat-upper part
C/D0 0.5 1 1.5 2 2.5 3
s max
(kN
/m2)
0
50
100
150
200
250
300
350
400
450
D=1D=2D=3D=4D=5D=6D=7D=8D=9D=10
(j) in peat-lower part
Figure 2.24: Maximum allowable support pressures at upper and lower part of the tunnel with uniform support
pressures according to Equations 2.27 and 2.29
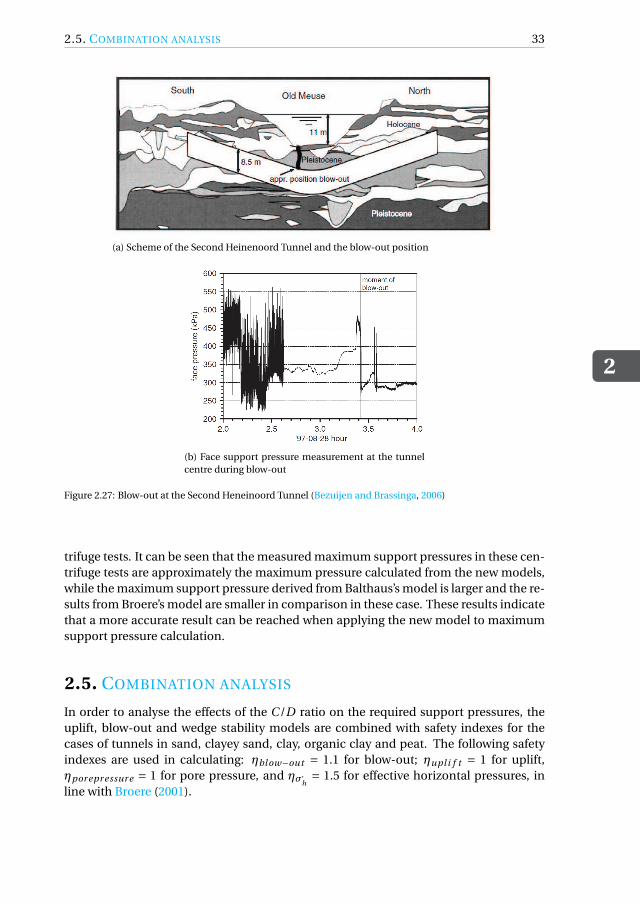
noord Tunnel in the Netherlands (Figure 2.27a) is used. A tunnel with an outer diameter
of 8.3m was constructed below the Oude Maas river in the neighborhood of Rotterdam
between 1996 and 1999. At the blow-out position, the tunnel is covered by 4m of Pleis-
tocence sand with a friction angle of 36.5o . The cover depth of the tunnel is 8.6m in
total including this sand layer and there was 11m of water above the soil (Bezuijen and
Brassinga, 2006). Figure 2.27b shows the face pressures measured at the tunnel centre
when the blow-out happened. During the blow-out, face pressure measured at the top
of the tunnel was 405kPa and at the center of the tunnel was 450kPa.
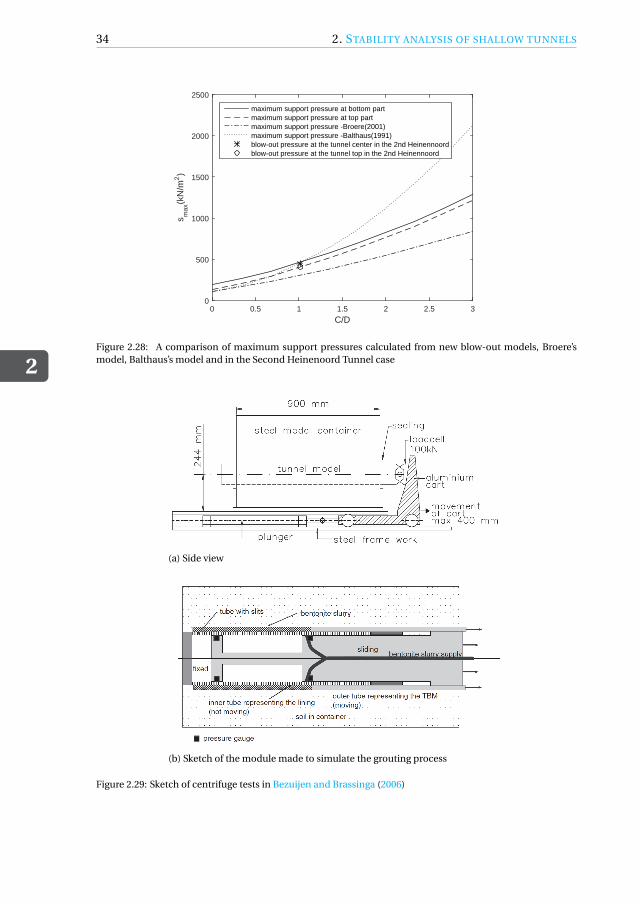
Figure 2.28 shows the maximum support pressures calculated with the new blow-out
model, Broere’s model (Figure 2.21) and Balthaus’s model (Figure 2.22) for the case of the
blow-out position in the Second Heinenoord Tunnel. It can be seen that the maximum
support pressures at the top and the bottom of the tunnel derived from the new blow-out
models are in between the maximum support pressures calculated by Balthaus’s model
and Broere’s model. Also, the measured face pressures at the top and the center of the

2
30 2. STABILITY ANALYSIS OF SHALLOW TUNNELS
(a) upper part (b) lower part
Figure 2.25: Blow-out model with vertical support pressure gradient δp
Table 2.3: Soil parameters used in centrifuge tests (Bezuijen and Brassinga, 2006)
Soil parameters Speswhite clay Sand med. dens.
γwet (kN /m3) 17 19.6
c(kPa) 1 8.3
Friction angle (deg.) 23 37
Dilatancy angle (deg.) - 9
Poisson’s ratio(-) 0.45 0.3
E50(MPa) 0.53 0.4
n(-) - 0.394
Second Heinenoord Tunnels at the blow-out position where C /D ≈ 1 are plotted. It
shows that the measured blow-out face pressures are in the range of calculated maxi-
mum support pressures with the new blow-out model for the lower and upper parts of
the tunnel. The result also confirms the above statement that the maximum support
pressure derived by Balthaus’s model is somewhat exaggerated whereas this pressure es-
timate is too conservative when using Broere’s model.
In order to validate with experimental data, centrifuge tests performed by GeoDelft and
supervised by COB in order to investigate the grouting process (Brassinga and Bezuijen,
2002) are used to compare to the analysis results derived from the new models, Balthaus’s
model and Broere’s model. These centrifuge tests were carried out with a tube repre-
senting a tunnel lining which has an outer diameter of 130mm and an inner diameter of
125mm as can be seen in Figure 2.29. The 25mm tail void in this model was directly filled
by a bentonite slurry. The bentonite pressure was increased until the blow-out occurred
in order to measure the maximum support pressures. The soil parameters used in these
centrifuge tests are shown in Table 2.3. The maximum grouting pressures measured in
these centrifuge tests are shown in Figure 2.30.
The first centrifuge experiment was carried out with a tunnel covered by sand and at

2.4. BLOW-OUT
2
31
C/D0 0.5 1 1.5 2 2.5 3
s max
(kN
/m2)
0
500
1000
1500
D=1D=2D=3D=4D=5D=6D=7D=8D=9D=10
(a) in sand-upper part
C/D0 0.5 1 1.5 2 2.5 3
s max
(kN
/m2)
0
200
400
600
800
1000
1200
1400
1600
D=1D=2D=3D=4D=5D=6D=7D=8D=9D=10
(b) in sand-lower part
C/D0 0.5 1 1.5 2 2.5 3
s max
(kN
/m2)
0
200
400
600
800
1000
1200
D=1D=2D=3D=4D=5D=6D=7D=8D=9D=10
(c) in clayey sand-upper part
C/D0 0.5 1 1.5 2 2.5 3
s max
(kN
/m2)
0
200
400
600
800
1000
1200
D=1D=2D=3D=4D=5D=6D=7D=8D=9D=10
(d) in clayey sand-lower part
C/D0 0.5 1 1.5 2 2.5 3
s max
(kN
/m2)
0
200
400
600
800
1000
1200
D=1D=2D=3D=4D=5D=6D=7D=8D=9D=10
(e) in clay-upper part
C/D0 0.5 1 1.5 2 2.5 3
s max
(kN
/m2)
0
200
400
600
800
1000
1200
D=1D=2D=3D=4D=5D=6D=7D=8D=9D=10
(f) in clay-lower part
Figure 2.26: Maximum allowable support pressures at upper and lower part of the tunnel with linear support
pressures according to Equations 2.33 and 2.36(continue in next page)

2
32 2. STABILITY ANALYSIS OF SHALLOW TUNNELS
C/D0 0.5 1 1.5 2 2.5 3
s max
(kN
/m2)
0
100
200
300
400
500
600
700
800
900
D=1D=2D=3D=4D=5D=6D=7D=8D=9D=10
(g) in organic clay-upper part
C/D0 0.5 1 1.5 2 2.5 3
s max
(kN
/m2)
0
100
200
300
400
500
600
700
800
900
D=1D=2D=3D=4D=5D=6D=7D=8D=9D=10
(h) in organic clay-lower part
C/D0 0.5 1 1.5 2 2.5 3
s max
(kN
/m2)
0
50
100
150
200
250
300
350
400
D=1D=2D=3D=4D=5D=6D=7D=8D=9D=10
(i) in peat-upper part
C/D0 0.5 1 1.5 2 2.5 3
s max
(kN
/m2)
0
50
100
150
200
250
300
350
400
450
D=1D=2D=3D=4D=5D=6D=7D=8D=9D=10
(j) in peat-lower part
Figure 2.26: Maximum allowable support pressures at upper and lower part of the tunnel with linear support
pressures according to Equations 2.33 and 2.36
150g . This centrifuge test represented a large tunnel with a diameter of 18.75m, the tube
was covered by 0.2m saturated sand with the parameters as shown in Table 2.3. The
maximum excess bentonite pressure was measured as 620kPa.
The second and third tests were carried out at 40g and represented a tunnel with di-
ameter D = 5m covered by sand and clay. There was a sand layer of 77.5mm above the
tunnel. A clay layer of 170mm is above this sand layer and 5mm sand layer is on the top.
The water level is at the top of the 5mm sand layer. The result in the second centrifuge
test shows that failure was reached at a pressure of 190kPa. In the third centrifuge ex-
periment with the same condition as the second test, the measured maximum excess
bentonite pressure was of 215kPa.
Figure 2.31 shows a comparison between the analytical results derived from the new
models, Balthaus’s model and Broere’s model for these centrifuge test results. This figure
also shows that the value of maximum support pressure derived by the new model is in
between Balthaus’s model and Broere’s model with the soil conditions used in these cen-
2.5. COMBINATION ANALYSIS
2
33
(a) Scheme of the Second Heinenoord Tunnel and the blow-out position
(b) Face support pressure measurement at the tunnel
centre during blow-out
Figure 2.27: Blow-out at the Second Heneinoord Tunnel (Bezuijen and Brassinga, 2006)
trifuge tests. It can be seen that the measured maximum support pressures in these cen-
trifuge tests are approximately the maximum pressure calculated from the new models,
while the maximum support pressure derived from Balthaus’s model is larger and the re-
sults from Broere’s model are smaller in comparison in these case. These results indicate
that a more accurate result can be reached when applying the new model to maximum
support pressure calculation.
2.5. COMBINATION ANALYSIS
In order to analyse the effects of the C /D ratio on the required support pressures, the
uplift, blow-out and wedge stability models are combined with safety indexes for the
cases of tunnels in sand, clayey sand, clay, organic clay and peat. The following safety
indexes are used in calculating: ηbl ow−out = 1.1 for blow-out; ηupl i f t = 1 for uplift,
ηpor epr essur e = 1 for pore pressure, and ησ,h= 1.5 for effective horizontal pressures, in
line with Broere (2001).
2
34 2. STABILITY ANALYSIS OF SHALLOW TUNNELS
C/D0 0.5 1 1.5 2 2.5 3
s max
(kN
/m2)
0
500
1000
1500
2000
2500
maximum support pressure at bottom partmaximum support pressure at top partmaximum support pressure -Broere(2001)maximum support pressure -Balthaus(1991)blow-out pressure at the tunnel center in the 2nd Heinennoordblow-out pressure at the tunnel top in the 2nd Heinennoord
Figure 2.28: A comparison of maximum support pressures calculated from new blow-out models, Broere’s
model, Balthaus’s model and in the Second Heinenoord Tunnel case
(a) Side view
(b) Sketch of the module made to simulate the grouting process
Figure 2.29: Sketch of centrifuge tests in Bezuijen and Brassinga (2006)

2.5. COMBINATION ANALYSIS
2
35
(a) the 1st centrifuge test result (b) the 2nd centrifuge test result
(c) the 3r d centrifuge test result
Figure 2.30: Measured pressures in centrifuge tests in Bezuijen and Brassinga (2006)
For uplift, safety index ηupl i f t = 1 is applied to Equation 2.8 as:
(
C
D
)
mi n
=
πγw
4γ,g− πdγT
Dγ,g− 1
2+ π
8
ηupl i f t(2.37)
For the minimum support pressure, safety index ησ,h= 1.5 is applied to effective hori-
zontal pressures and ηpor epr essur e = 1 is applied to pore pressure in Equation 2.18 as:
smi n = ησ,hσ
′
h +ηpor epr essur e p (2.38)
For the maximum support pressure, safety index ηbl ow−out = 1.1 is applied to the values
of maximum support pressures derived from blow-out condition :
smax =sbl ow−out
ηbl ow−out(2.39)
where sbl ow−out is the maximum support pressure derived from Equations 2.26, 2.28, 2.32
and 2.35.
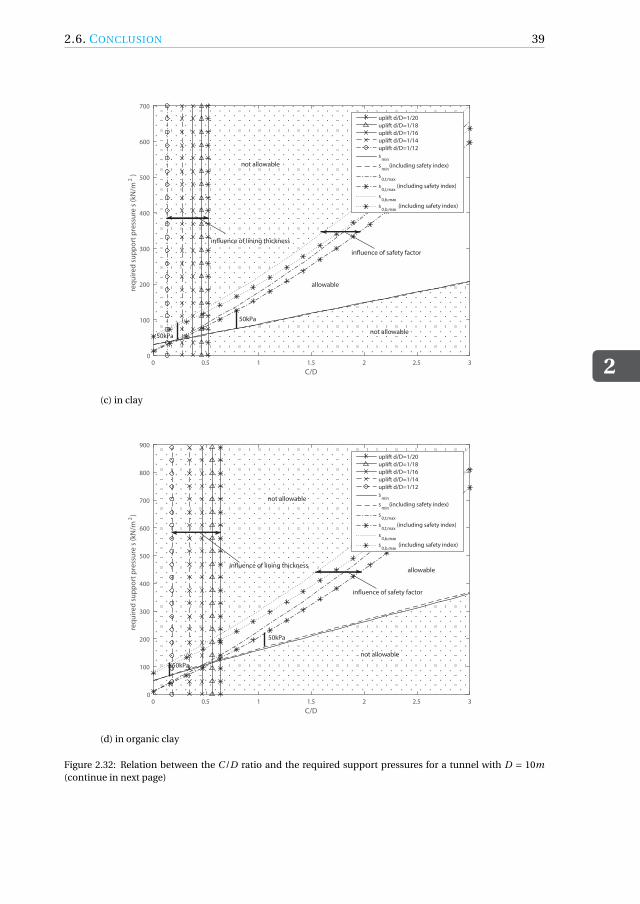
Figure 2.32 shows that tunnels in sand, clayey sand, clay or organic clay can be designed
with very shallow overburden by changing the design of the tunnel segments, in particu-
lar, the value of d/D ratio. Nevertheless, it should be noted that there is often a presence

2
36 2. STABILITY ANALYSIS OF SHALLOW TUNNELS
C/D0 0.5 1 1.5 2 2.5 3
s max
(kN
/m2)
0
500
1000
1500
2000
2500
3000
maximum support pressure at bottom partmaximum support pressure at top partmaximum support pressure -Broere(2001)maximum support pressure -Balthaus(1991)centrifuge test
(a) with the 1st centrifuge test
C/D0 0.5 1 1.5 2 2.5 3
s max
(kN
/m2)
0
100
200
300
400
500
600
700
800
maximum support pressure at bottom partmaximum support pressure at top partmaximum support pressure -Broere(2001)maximum support pressure -Balthaus(1991)centrifuge test
(b) with the 2nd centrifuge test
C/D0 0.5 1 1.5 2 2.5 3
s max
(kN
/m2)
0
100
200
300
400
500
600
700
800
maximum support pressure at bottom partmaximum support pressure at top partmaximum support pressure -Broere(2001)maximum support pressure -Balthaus(1991)centrifuge test
(c) with the 3r d centrifuge test
Figure 2.31: In comparison with the centrifuge tests in Bezuijen and Brassinga (2006)
2.6. CONCLUSION
2
37
of sewage systems and other small infrastructure in the range up to about 4 meters below
the surface. Therefore, for metro tunnels with a diameter in the order of 6 to 7m, a C /D
ratio in the range of 0.5 to 1 is the most shallow practical possibility. In practice, however,
there needs to be a difference between the maximum and minimum pressures for safety
reasons and to be practically workable. Based on Kanayasu et al. (1995) a 50kPa safety
margin seems sufficient, which still allows tunnels with shallow cover in more compe-
tent layers. In Figure 2.32, a vertical bar of 50kPa is included to indicate where the 50kPa
margin is first available (both for the case of safety factors are included and without). It
can be seen in this figure that when tunnelling in sand, clayey sand, clay and organic
clay with a C /D ratio in the range of 0.5 to 1, this condition of a 50kPa safety margin
is satisfied. In the case of a tunnel in peat, Figure 2.32e shows that the tunnel can be
designed theoretically at a very shallow level as the above cases. This would require in-
creasing the weight of the lining (d/D in the order of 1/10 or a similar amount of ballast
in the tunnel) but would leave a small margin only between maximum and minimum
support pressures. This implies that the tunnel cannot be designed with a low C /D ratio
(and should probably not be less than 6) in peat layers if a safety margin is required.
2.6. CONCLUSION
It is concluded that in the case of a tunnel in saturated sand and clay, the ratio of C /D
can be reduced by changing the thickness of the tunnel in order to compensate for the
uplift or by adding ballast weight. However, the design depth of the tunnel should take
into account the existence of utilities and other infrastructure systems. It should also be
noted that in practice, there must be a difference between the maximum support pres-
sure smax and the minimum support pressure smi n to guarantee a safe operation of the
TBM. Therefore, in the case of a tunnel in peat and a 50kPa safety margin, only d/D ra-
tio larger than 1/12 would allow a stable tunnel construction.
Based on the C /D ratio, the range of workable support pressure can be estimated with
the caveat that the results in Figure 2.32 are primarily suitable for tunnelling. With slurry
shields, the infiltration of the support medium may lead to excess pore pressure in front
of the tunnel face and reduce the effective of the support (Broere, 2001; Hoefsloot, 2001).
Therefore, the area of possible support pressure in the case of slurry shields may be
smaller than suggested by Figure 2.32, limiting the range of low C /D ratios that are fea-
sible.

2
38 2. STABILITY ANALYSIS OF SHALLOW TUNNELS
C/D
0 0.5 1 1.5 2 2.5 3
req
uir
ed
su
pp
ort
pre
ssu
re s
(kN
/m2
)
0
200
400
600
800
1000
1200
1400
uplift d/D=1/20
uplift d/D=1/18
uplift d/D=1/16
uplift d/D=1/14
uplift d/D=1/12
smin
smin
(including safety index)
s0,t,max
s0,t,max
(including safety index)
s0,b,max
s0,b,max
(including safety index)
in!uence of safety factor
allowable
in!uence of lining thickness
not allowable
not allowable50kPa
50kPa
(a) in sand
0 0.5 1 1.5 2 2.5 30
100
200
300
400
500
600
700
800
900
1000
C/D
req
uir
ed
su
pp
ort
pre
ssu
re
(kN
/m )
s
uplift d/D=1/20
uplift d/D=1/18
uplift d/D=1/16
uplift d/D=1/14
uplift d/D=1/12
smin
smin
(including safety index)
s0,t,max
s0,t,max
(including safety index)
s0,b,max
s0,b,max
(including safety index)
in!uence of lining thickness
in!uence of safety factor
not allowable
not allowable
allowable
2
50kPa
50kPa
(b) in clayey sand
Figure 2.32: Relation between the C /D ratio and the required support pressures for a tunnel with D = 10m
(continue in next page)
2.6. CONCLUSION
2
39
C/D
0 0.5 1 1.5 2 2.5 3
req
uir
ed
su
pp
ort
pre
ssu
re s
(kN
/m2
)
0
100
200
300
400
500
600
700
uplift d/D=1/20
uplift d/D=1/18
uplift d/D=1/16
uplift d/D=1/14
uplift d/D=1/12
smin
smin
(including safety index)
s0,t,max
s0,t,max
(including safety index)
s0,b,max
s0,b,max
(including safety index)
in!uence of lining thickness
in!uence of safety factor
50kPa
50kPa
allowable
not allowable
not allowable
(c) in clay
C/D
0 0.5 1 1.5 2 2.5 3
req
uir
ed
su
pp
ort
pre
ssu
re s
(kN
/m2
)
0
100
200
300
400
500
600
700
800
900
uplift d/D=1/20
uplift d/D=1/18
uplift d/D=1/16
uplift d/D=1/14
uplift d/D=1/12
smin
smin
(including safety index)
s0,t,max
s0,t,max
(including safety index)
s0,b,max
s0,b,max
(including safety index)
in!uence of safety factor
allowablein!uence of lining thickness
not allowable
not allowable
50kPa
50kPa
(d) in organic clay
Figure 2.32: Relation between the C /D ratio and the required support pressures for a tunnel with D = 10m
(continue in next page)

2
40 2. STABILITY ANALYSIS OF SHALLOW TUNNELS
C/D
0 1 2 3 4 5 6 7 8 9 10
req
uir
ed
su
pp
ort
pre
ssu
re s
(kN
/m2
)
0
500
1000
1500
uplift d/D=1/20
uplift d/D=1/18
uplift d/D=1/16
uplift d/D=1/14
uplift d/D=1/12
uplift d/D=1/10
smin
smin
(including safety index)
s0,t,max
s0,t,max
(including safety index)
s0,b,max
s0,b,max
(including safety index) in!uence of safety factor
not allowable
allowable
in!uence of lining thickness
not allowable50kPa
50kPa
(e) in peat
Figure 2.32: Relation between the C /D ratio and the required support pressures for a tunnel with D = 10m
3STRUCTURAL ANALYSIS OF
SHALLOW TUNNELS
Step by step and the thing is done.
Charles Atlas
In general, studies on structural design for bored tunnels focus on moderate to deep tun-
nels (cover-to-diameter ratio C /D ≥ 2). Such tunnel design methods cannot be used for
shallow situated bored tunnels because the influence of buoyancy is discounted and ac-
tual loads on the tunnel lining are not taken into account properly. This chapter proposes
a new model which has more accurate loads on the tunnel lining combined with finite
element analysis for shallow tunnels. Internal forces and deformations of various shallow
bored tunnels are investigated. The relation between optimal thickness-to-diameter ratio
d/D of tunnel cross-section and cover-to-diameter ratio C /D is also studied.
This chapter is based on a paper under review in International Journal of Geomechanics Vu et al. (2015e).
Table 3.2 and Figure 3.11 to 3.20 have been expanded.
41

3
42 3. STRUCTURAL ANALYSIS OF SHALLOW TUNNELS
3.1. INTRODUCTION
The large diameter driven shield with concrete segments has been common in construc-
tion practice in cities due to the ability to limit settlements and damage to existing build-
ings. The previous chapter indicated the estimate of the C /D ratio in stability analysis
for shallow tunnelling. However, in the next stages, the deformations of the tunnel lining
has a large influence on the settlement on the surface. The structural analysis of the tun-
nel lining, therefore, not only estimates the internal forces and deformations of segment
lining but also investigates the impact of the overburden on the tunnel lining. With these
conditions in mind, this chapter takes a look at the structural design of tunnel linings for
shallow tunnels in soft soils.
Many calculation models have been proposed and developed since 1926 for the tun-
nel design. Schmid (1926) proposed the first analysis method for an elastic continuum.
Schulze and Duddeck (1964) presented a bedded ring model for shallow tunnels with
limited covers. Morgan (1961) proposed an analytical solution using continuum models
which takes into account the elliptical deformation of the tunnel lining. Windels (1966)
further developed the method of Schulze and Duddeck to take into account the sec-
ond order of the series expansion of the analytical solution and the displacement of the
tunnel lining in the construction process. Windels (1967) published a model for a cir-
cular tunnel in an elastic continuum with geometrical non-linearity. Muir Wood (1975)
corrected Morgan (1961) by including the tangential stresses on the model but the ra-
dial deformations due to these stresses were ignored, then this problem was solved by
Muir Wood (1976).
The common method used in practical tunnel design was proposed by Duddeck and
Erdmann (1985). A continuum model (Figure 3.1) and a model without a reduction
of ground pressure at the crown (Figure 3.2) were proposed for shallow tunnels with a
depth H ≤ 2.5D. The continuum model includes the interaction between the soil and
the structure automatically. In the bedded-beam model, the interaction between the
soil and the structure is captured by bedding springs with a suitable applied stiffness.
Duddeck (1988) indicated that the bedded-beam model is suitable to calculate the in-
ternal forces in a shallow tunnel in soft soil. Blom (2002) included effects of longitudinal
joints and soil reaction to estimate the deformations of the tunnel lining.
Based on the models of Duddeck and Erdmann (1985), Oreste (2007) proposed a hyper-
static reaction method to estimate the internal forces in the tunnel lining by using a Fi-
nite Element Method (FEM) framework in the case of tunnels in rock. Although this
model simulates interactions between tunnel lining and surrounding ground through
Winkler springs, only radial pressures are taken into account. A further developed model
presented by Do et al. (2014) includes the tangential pressures. This model also takes into
account the influence of segmental joints, which is indicated in Groeneweg (2007).
Although many models have been studied and developed, most of them focus on moder-
ate and deep tunnels (cover-to-diameter ratio C /D ≥ 2). In the case of shallow tunnels,
especially very shallow tunnels which have a C /D ratio from 0 to 0.5, there has been
little research. This chapter looks into effects of overburden on internal forces and de-
formations of the tunnel lining and seeks the optimal C /D ratio when tunnelling in soft
(Holocene) layers. Firstly, Section 3.2 introduces a new model for structural design for
tunnel lining. In the Section 3.3, the impact of overburden on tunnel lining is investi-

3.1. INTRODUCTION
3
43
Figure 3.1: Plane strain continuum model (Duddeck and Erdmann, 1985)
Figure 3.2: Bedded-beam model for shallow tunnels (Duddeck and Erdmann, 1985)

3
44 3. STRUCTURAL ANALYSIS OF SHALLOW TUNNELS
gated when tunnelling in various soils. Conclusions of structural analysis for shallow
tunnel lining are presented in Section 3.4.
3.2. STRUCTURAL LINING DESIGN
When designing a tunnel in soft soil, the following assumptions are applied in most com-
mon design models (Duddeck and Erdmann, 1985):
- The stress-strain deformations of a cross-section are in plane strain conditions for both
the tunnel lining and the ground;
- The active soil pressures on the tunnel lining are equal to the primary stresses in the
undisturbed ground before tunnelling;
- At the final stage of tunnelling and in the long-term period, the ground will return to
the conditions prior to tunnelling;
- The interaction between ground and tunnel lining is limited to radial and tangential or
only radial springs;
- Ground and tunnel lining are elastic materials.
These assumptions, which these models are based on, are also used in guidelines for
the design of shield tunnel lining (ITA-Group2, 2000) and considered common practice.
However, as e.g. Hashimoto et al. (2002) show the pressures exerted by the soil on the
lining after construction can differ significantly from the primary stresses prior to tun-
nelling, and do not need to revert to this initial state over time, as the weight of the tun-
nel is generally less than the weight of the excavated soil. Duddeck and Erdmann (1985)
already stated that these assumptions are conservative. Nevertheless, these load con-
ditions have become common practice (ITA-Group2, 2000) and experience shows that
with these assumptions a safe lining design is possible. Therefore, in this study, these as-
sumptions are applied to the proposed model and a further review of these assumptions
is outside the scope of this thesis.
3.2.1. INFLUENCE OF LOAD AND OVERBURDEN ON LINING MODELS
For the shallow tunnel, according to Duddeck (1988), a continuum model or a bedded-
beam model without a reduction of ground pressure at the crown should be used in
design. Most of these models in studies of Muir Wood (1975), Einstein and Schwartz
(1979), Duddeck and Erdmann (1985), Möller (2006), Plizzari and Tiberti (2006), and Do
et al. (2014) use a uniform load of vertical pressure on the tunnel lining at upper and
lower parts of the tunnel, which is equal to the overburden pressure (Figure 3.1) as:
σv = γH (3.1)
where γ is the volumetric weight of soil and H is the depth of the tunnel (at spring line
location).
The horizontal pressure on the sides of the tunnel is constant and is given by:
σh = Kσv (3.2)
where K is the earth pressure coefficient.
In shallow tunnels with the C /D ratio less than 2, the pressures at the top and the bottom
of the tunnel lining are significantly different. The loading used in Duddeck’s methods,

3.2. STRUCTURAL LINING DESIGN
3
45
Figure 3.3: Soil pressures on the tunnel lining
therefore, is not applicable in the case of shallow tunnels. To be more accurate, in this
study, the vertical pressures should be calculated at every particular point of the tunnel
cross section.
In the new model proposed in Figure 3.3 for a shallow tunnel with radius R at the depth
H , the vertical soil pressure on the tunnel lining can be estimated as:
σv = γ(H +Rcosθ) (3.3)
where θ is the angle between the element axis and the vertical axis of a tunnel section.
The horizontal soil pressure on the tunnel lining is given by:
σh = Kγ(H +Rcosθ) (3.4)
Figure 3.3 only shows the soil pressures on the tunnel lining. When considering the to-
tal vertical soil pressures, without taking into account the interaction between the tun-
nel lining and surrounding soil, the equilibrium seems not satisfied. In this model, the
interaction between surrounding soil and the tunnel lining is presented via radial and
tangential springs. The radial and tangential interaction forces on the tunnel lining are
not included in this figure. When these forces are taken into account, the equilibrium
condition is satisfied.
Unlike the method of Duddeck and Erdmann (1985) and Blom (2002) for the reduction of
vertical pressures at the lower part of the tunnel, the above assumptions indicate that the
active soil pressures on the tunnel lining are equal to the primary stresses in the undis-
turbed ground before tunnelling. Therefore, there is no reduction of vertical pressures
in the case of a shallow tunnel in this model.
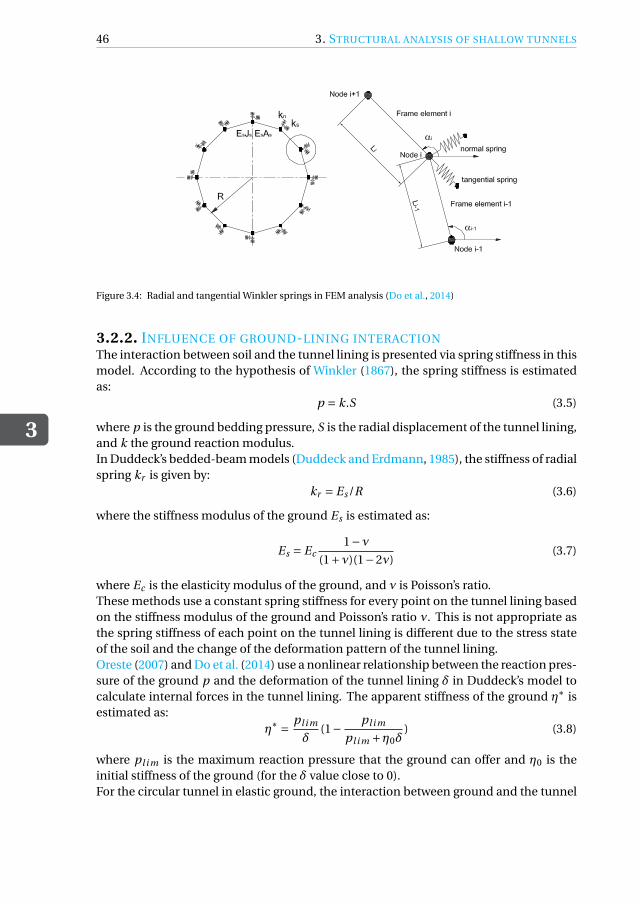
3
46 3. STRUCTURAL ANALYSIS OF SHALLOW TUNNELS
Figure 3.4: Radial and tangential Winkler springs in FEM analysis (Do et al., 2014)
3.2.2. INFLUENCE OF GROUND-LINING INTERACTION
The interaction between soil and the tunnel lining is presented via spring stiffness in this
model. According to the hypothesis of Winkler (1867), the spring stiffness is estimated
as:
p = k.S (3.5)
where p is the ground bedding pressure, S is the radial displacement of the tunnel lining,
and k the ground reaction modulus.
In Duddeck’s bedded-beam models (Duddeck and Erdmann, 1985), the stiffness of radial
spring kr is given by:
kr = Es /R (3.6)
where the stiffness modulus of the ground Es is estimated as:
Es = Ec1−ν
(1+ν)(1−2ν)(3.7)
where Ec is the elasticity modulus of the ground, and ν is Poisson’s ratio.
These methods use a constant spring stiffness for every point on the tunnel lining based
on the stiffness modulus of the ground and Poisson’s ratio ν. This is not appropriate as
the spring stiffness of each point on the tunnel lining is different due to the stress state
of the soil and the change of the deformation pattern of the tunnel lining.
Oreste (2007) and Do et al. (2014) use a nonlinear relationship between the reaction pres-
sure of the ground p and the deformation of the tunnel lining δ in Duddeck’s model to
calculate internal forces in the tunnel lining. The apparent stiffness of the ground η∗ is
estimated as:
η∗ =pl i m
δ(1−
pl i m
pl i m +η0δ) (3.8)
where pl i m is the maximum reaction pressure that the ground can offer and η0 is the
initial stiffness of the ground (for the δ value close to 0).
For the circular tunnel in elastic ground, the interaction between ground and the tunnel

3.2. STRUCTURAL LINING DESIGN
3
47
lining depends on the radius of the tunnel and the ground parameters. The initial radial
ground reaction stiffness ηr,0 is estimated as the following empirical formula (Möller,
2006):
ηr,0 =β1
1+ν
E
R(3.9)
where E is Young’s modulus of the ground and β is a dimensionless factor.
The value of β depends on soil and structural parameters, therefore, it is difficult to de-
termine the exact β value. In conventional studies of Mashimo and Ishimura (2005),
Möller (2006), Plizzari and Tiberti (2006) and Molins and Arnau (2011), the value of β is
taken equal to 1. In Do et al. (2014), the value of β is taken equal to 2 by comparing to
Einstein and Schwart’s method. In this study, the value of β= 2 is used in this analysis to
estimate the impact of the depth of cover on internal forces of the tunnel.
According to Mashimo and Ishimura (2005), Möller (2006), Plizzari and Tiberti (2006),
and Molins and Arnau (2011), the simple relationship between tangential spring stiff-
ness ηs and normal spring stiffness ηn is:
ηs =1
3ηn (3.10)
The maximum radial reaction pressure pn,l i m in Equation 3.8 can be calculated as:
pn,l i m =2ccosφ
1− si nϕ+
1+ si nϕ
1− si nϕ∆σcon f (3.11)
where ∆σcon f is the confining pressure on the tunnel perimeter estimated as:
∆σcon f =σh +σv
2
ν
1−ν(3.12)
Similar as in Do et al. (2014), the maximum shear reaction pressure on the tunnel lining
in Equation 3.8 can be estimated as:
ps,l i m =σh +σv
2t anϕ (3.13)
The stiffness of the radial and tangential springs in each elements of the frame is:
kn,i = η∗n,i
[
Li−1 +Li
2
]
=pn,l i m
δn,i
(
1−pn,l i m
pn,l i m +ηn,0δn,i
)
Li−1 +Li
2(3.14)
ks,i = η∗s,i
[
Li−1 +Li
2
]
=ps,l i m
δs,i
(
1−ps,l i m
ps,l i m +ηs,0δs,i
)
Li−1 +Li
2(3.15)
where Li is the distance between node i th and node (i +1)th (see Figure 3.4).
The radial springs are only active in the compression condition. It means that in the area
where the tunnel moves away from the soil, the radial springs are inactive.

3
48 3. STRUCTURAL ANALYSIS OF SHALLOW TUNNELS
Figure 3.5: Measuring field at Second Heinenoord Tunnel (Broere, 2001)
Figure 3.6: Measuring ring and instrumentation (Bakker, 2003)
3.2.3. A CASE STUDY OF SECOND HEINENOORD TUNNEL
The validation of the new model is carried out with the case study of Second Heinenoord
Tunnel which is presented in Section 2.4. In this project, there were two measurement
locations, one on the North Bank and one on the South Bank of the river Oude Maas
(Figure 3.5). Measurement instruments were installed in all seven elements of a ring in
order to derive the stress distribution in the ring as can be seen in Figure 3.6. Pressure
cells were installed on the outer face of segments with two cells per segment on 7 seg-
ments. During the construction, bending moments and normal forces in the lining were
measured using strain gauges.
On the North Bank, the tunnel axis is located at about 16.25m below the surface. Fig-
ure 3.7 shows a cross-section at the measuring section in North Bank. With the tunnel
diameter of 8.3m, the C /D ratio at this location is approximately 2. The description of
soil layers and soil parameters are shown in Table 3.1.
A back-analysis with 2D FEM Plaxis was carried out as indicated in Bakker (2003). The

3.2. STRUCTURAL LINING DESIGN
3
49
Figure 3.7: Cross-section of the measured location in the North Bank in Second Heinenoord Tunnel (Bakker,
2003)
derived bending moments and normal forces from Plaxis model were compared to the
measured data in the North Bank. Moreover, a 3D model with ANSYS FEM software (Fig-
ure 3.8) was also analyzed in order to derive bending moments in the tunnel lining in
this case (Bakker et al., 2000). In this analysis, the concrete segments were modelled as
solid volume segments. Three rings were modelled using 8100 elements. In this model,
the interaction between the tunnel lining and the surrounding ground was modelled as
linear springs in the radial direction as in Duddeck and Erdmann (1985) with 1418 spring
elements in total. The bending moments were derived with 3 rings and were compared
with the field data.
In order to validate the new model, calculations for the Second Heinenoord case have
been made in order to derive internal forces in the lining. The derived bending mo-
ments and normal forces from the new model are compared to the field data after 330
days and the analytical results from Bakker et al. (2000) as shown in Figure 3.9 and 3.10.
A comparison between the bending moments derived from the new model and the bend-
ing moments from measurement in this project, Duddeck’s model, 2D Plaxis model and
3D ANSYS model from Bakker et al. (2000) is shown in Figure 3.9. This figure shows that
bending moments derived from these models have the same bending moments trend
with the measured data in the field. The bending moment derived from the new model
is close to the moments derived from Duddeck’s model and Bakker’s 3D analysis by AN-
SYS. In comparison with the field data, the highest bending moment observed in the
field data is close to the bending moments in all these models (at the location of 166o on
the cross-section of the tunnel lining). Even though there exists a difference between the
measured bending moment at the sides of the tunnel lining, the highest bending mo-
ment at the top and the bottom of the tunnel lining shows an agreement between the

3
50 3. STRUCTURAL ANALYSIS OF SHALLOW TUNNELS
Table 3.1: Description of layers and soil parameters for the North Bank in Second Heinenoord Tunnel (Bakker,
2000)
Symbol Soil type Top of
layer(m)
N.A.P
γwet (γdr y )
(kN /m3)
cu
(kPa)
c ,
(kPa)
ϕ,
(deg .)
ν (-) Eoed(MPa)
K0
(-)
OA/1/OOB mixture of sand
and clay
+2.50 17.2(16.5) - 3 27 0.34 5.2 0.58
3 sand, local parts of
clay
-1.50 19.5 - 0 35 0.3 26 0.47
2 sand with clay 0-5.75 19 - 0 33 0.31 25 0.47
18 sand, local parts of
clay
-10.00 20.5 - 0 36.5 0.3 40 0.45
32 sand, gravel -17.25 20.5 - 0 36.5 0.3 60 0.5
38A clay, local parts of
sand
-20.75 20.0 140 7 31 0.32 16 0.55
38F sand -25 21 - 0 37.5 0.3 80 0.55
38A clay, local parts of
sand
-26.5 20.0 140 7 31 0.32 16 0.55
Ring 3
Ring 1
Ring 2
Figure 3.8: 3D model of segmental lining in ANSYS FEM analysis in Bakker et al. (2000)

3.2. STRUCTURAL LINING DESIGN
3
51
Orientation (degree)
0 60 120 180 240 300 360
Be
nd
ing
Mo
me
nts
(MN
m)
-0.2
-0.1
0
0.1
0.2
0.3
New model
Duddeck model
Measured moments after 330days
Bakker(2000)(ANSYS FEM)-ring2
Bakker(2003)-plaxi s
Figure 3.9: Validation of bending moments in Second Heinenoord Tunnel
field data and the analytical models.
Figure 3.10 shows a comparison of normal forces between field data and normal forces
derived from Duddeck’s model, Bakker’s 2D Plaxis model and the new model. Overall,
normal forces calculated from these models have the same trend with measured normal
forces in field data. From this figure, it can be seen that the normal force from the new
model is closer to the field data than the results from Duddeck’s model and Bakker’s 2D
Plaxis model, especially at locations at the sides of the tunnel lining, although there still
exists a difference between the analytical results and measured normal forces. It was ex-
plained in Bakker (2003) that the accuracy of the soil pressure gauges on the segments
was unclear and the influence of the grout injection pressure was not taken into account
at the measured time of 330 days. This might also explain the strong variability in the
measurement.
On the basis of this analysis, it is shown that the results derived from the new model have
the same trend as the analysis results from previous numerical models and have a better
agreement with the field data. In this case study with C /D = 2, the difference between
these models is not very large, but for tunnels at shallower locations, the difference are
expected to be larger. Unfortunately, detailed field measurements at shallow overburden
are launching.
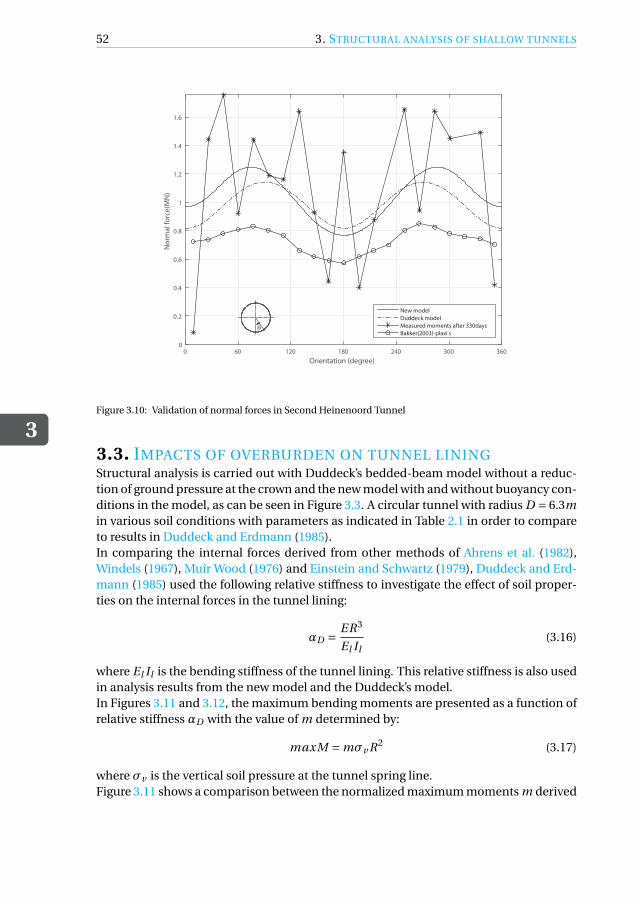
3
52 3. STRUCTURAL ANALYSIS OF SHALLOW TUNNELS
Orientation (degree)
0 60 120 180 240 300 360
No
rma
l fo
rce
(MN
)
0
0.2
0.4
0.6
0.8
1
1.2
1.4
1.6
New model
Duddeck model
Measured moments after 330days
Bakker(2003)-plaxi s
Figure 3.10: Validation of normal forces in Second Heinenoord Tunnel
3.3. IMPACTS OF OVERBURDEN ON TUNNEL LINING
Structural analysis is carried out with Duddeck’s bedded-beam model without a reduc-
tion of ground pressure at the crown and the new model with and without buoyancy con-
ditions in the model, as can be seen in Figure 3.3. A circular tunnel with radius D = 6.3m
in various soil conditions with parameters as indicated in Table 2.1 in order to compare
to results in Duddeck and Erdmann (1985).
In comparing the internal forces derived from other methods of Ahrens et al. (1982),
Windels (1967), Muir Wood (1976) and Einstein and Schwartz (1979), Duddeck and Erd-
mann (1985) used the following relative stiffness to investigate the effect of soil proper-
ties on the internal forces in the tunnel lining:
αD =ER3
El Il(3.16)
where El Il is the bending stiffness of the tunnel lining. This relative stiffness is also used
in analysis results from the new model and the Duddeck’s model.
In Figures 3.11 and 3.12, the maximum bending moments are presented as a function of
relative stiffness αD with the value of m determined by:
maxM = mσv R2 (3.17)
where σv is the vertical soil pressure at the tunnel spring line.
Figure 3.11 shows a comparison between the normalized maximum moments m derived
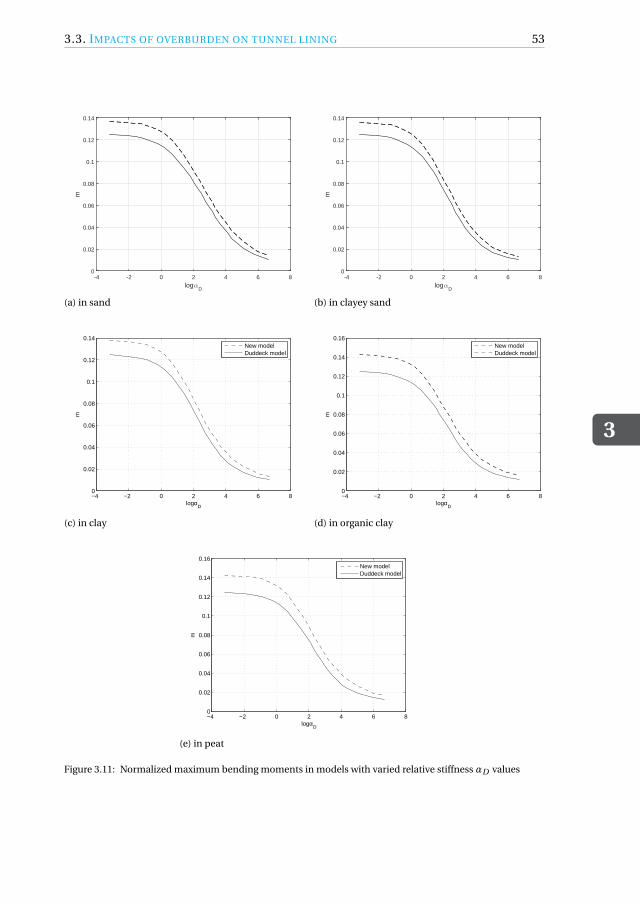
3.3. IMPACTS OF OVERBURDEN ON TUNNEL LINING
3
53
logαD
-4 -2 0 2 4 6 8
m
0
0.02
0.04
0.06
0.08
0.1
0.12
0.14
(a) in sand
logαD
-4 -2 0 2 4 6 8
m
0
0.02
0.04
0.06
0.08
0.1
0.12
0.14
(b) in clayey sand
−4 −2 0 2 4 6 80
0.02
0.04
0.06
0.08
0.1
0.12
0.14
logαD
m
New modelDuddeck model
(c) in clay
−4 −2 0 2 4 6 80
0.02
0.04
0.06
0.08
0.1
0.12
0.14
0.16
logαD
m
New modelDuddeck model
(d) in organic clay
−4 −2 0 2 4 6 80
0.02
0.04
0.06
0.08
0.1
0.12
0.14
0.16
logαD
m
New modelDuddeck model
(e) in peat
Figure 3.11: Normalized maximum bending moments in models with varied relative stiffness αD values

3
54 3. STRUCTURAL ANALYSIS OF SHALLOW TUNNELS
from the new model and Duddeck’s model in varied relative stiffness αD of soil and the
tunnel lining. Overall, the normalized maximum bending moments of the new model
show the same trend as Duddeck’s model but are larger in the values. With the large αD
value corresponding with stiffer ground or more flexible tunnel linings, the normalized
maximum moments m derived from the new model are closer to these moments from
Duddeck’s model.
Figure 3.12 shows the changes of the normalized maximum bending moments m de-
rived from these models with the depth of the tunnel H for tunnelling in sand, clay, or-
ganic clay and peat. With Duddeck’s method, the m value does not change with the
varied depths of the tunnel (m is equal to 0.083 for sand, 0.09 for clayey sand, 0.093
for clay, 0.107 for organic clay and 0.117 for peat). Meanwhile, the m value in the new
model is greater than in Duddeck’s model and becomes constant when the tunnel is at
great depth and close to the m value of Duddeck’s model. In the range of H from 3.15 to
15.75m or C /D from 0 to 2 in the case of shallow tunnels, the m value in the new model
is much higher than the m value in Duddeck’s model. Especially, when tunnels are close
to the surface (at tunnel depth H ≈ 3.15m), the m value in the new model is double that
in Duddeck’s model. This stems from the above analysis of the loading in the tunnel
lining models. In Duddeck’s model, the loading on the tunnel lining is assumed to be
symmetric loading in both the vertical and horizontal axes of the tunnel. This leads to
the maximum bending moments that appear at the top and bottom of the tunnel cross
section and have the same value. In the new model, the loading on the tunnel lining
changes with the depth of a particular point of the tunnel cross-section. Therefore, the
bending moments at the top and at the bottom of the tunnel cross-section are different.
In shallow tunnels, the loading at the bottom of the tunnel lining is significantly greater
than the overburden loadings at the top and the spring line of the tunnel lining. There-
fore, the normalized maximum bending moment in the new model is much greater than
in Duddeck’s model.
One of the most important considerations in tunnel design is the deformation of the
tunnel lining. Figures 3.13 and 3.14 show the changes in maximum radial displacements
in these models at various depths of the tunnel for various types of soil. In Figure 3.13, in
the analysis results obtained from Duddeck’s model, the maximum radial displacement
of the tunnel lining increases linearly with the increase of the tunnel depth. This trend
also appears in the new model with and without buoyancy for moderate and deep tun-
nels (H ≥ 15.75m or C /D ≥ 2). Maximum radial displacement in the new model with
buoyancy is higher than this in Duddeck’s model due to the higher maximum bending
moments as indicated in the above analysis.
Figure 3.14 shows the change in the maximum radial displacement in the case of shallow
tunnels (C /D ≤ 2). Maximum radial displacements in the new model with and without
buoyancy are higher than the maximum radial displacement in Duddeck’s model. In the
analysis results from Duddeck’s model, the maximum radial displacement decreases lin-
early to nearly 0 when the tunnel is close to the surface. Clearly, this is not appropriate
in practical cases. Therefore, it might be risky when applying Duddeck’s model to design
very shallow tunnels.
For very shallow tunnels in sand with C /D = 0÷ 1 or H = 3.15÷ 6.3m, the maximum
radial displacement increases sharply in the buoyancy model and significantly in the

3.3. IMPACTS OF OVERBURDEN ON TUNNEL LINING
3
55
H(m)10 20 30 40 50 60 70 80
m
0
0.02
0.04
0.06
0.08
0.1
0.12
0.14
0.16New modelDuddeck
(a) in sand
H(m)10 20 30 40 50 60 70 80
m
0
0.05
0.1
0.15
0.2
0.25New modelDuddeck
(b) in clayey sand
10 20 30 40 50 60 70 800
0.02
0.04
0.06
0.08
0.1
0.12
0.14
0.16
0.18
H(m)
m
New modelDuddeck
(c) in clay
10 20 30 40 50 60 70 800
0.05
0.1
0.15
0.2
0.25
H(m)
m
New modelDuddeck
(d) in organic clay
10 20 30 40 50 60 70 800
0.05
0.1
0.15
0.2
0.25
H(m)
m
New modelDuddeck
(e) in peat
Figure 3.12: Normalized maximum bending moments in models with varied values of tunnel depth H

3
56 3. STRUCTURAL ANALYSIS OF SHALLOW TUNNELS
H(m)10 20 30 40 50 60 70 80
max
imum
rad
ial d
ispl
acem
ent(
m)
0
0.01
0.02
0.03
0.04
0.05
0.06
0.07Without buoyancyWith buoyancyDuddeck
(a) in sand
H(m)10 20 30 40 50 60 70 80
max
imum
rad
ial d
ispl
acem
ent(
m)
0
0.01
0.02
0.03
0.04
0.05
0.06
0.07
0.08 Without buoyancyWith buoyancyDuddeck
(b) in clayey sand
10 20 30 40 50 60 70 800
0.02
0.04
0.06
0.08
0.1
0.12
0.14
0.16
H(m)
max
imum
rad
ial d
ispl
acem
ent(
m)
Without buoyancyWith buoyancyDuddeck
(c) in clay
10 20 30 40 50 60 70 800
0.02
0.04
0.06
0.08
0.1
0.12
0.14
0.16
H(m)
max
imum
rad
ial d
ispl
acem
ent(
m)
Without buoyancyWith buoyancyDuddeck
(d) in organic clay
10 20 30 40 50 60 70 800
0.01
0.02
0.03
0.04
0.05
0.06
0.07
H(m)
max
imum
rad
ial d
ispl
acem
ent(
m)
Without buoyancyWith buoyancyDuddeck
(e) in peat
Figure 3.13: Maximum radial displacements in models with varied values of tunnel depth H

3.3. IMPACTS OF OVERBURDEN ON TUNNEL LINING
3
57
Table 3.2: Optimal C /D ratios for minimum of maximum lining deformations
Soil typed/D
1/10 1/12 1/14 1/16 1/18 1/20 1/25 1/30 1/35 1/40
Sand 2.05 1.58 1.27 1.07 0.90 0.8 0.66 0.57 0.53 0.48
Clayey sand 0.68 0.35 0.20 0.00 0.00 0.00 0.00 0.00 0.00 0.00
Clay 0.85 0.53 0.32 0.17 0.00 0.00 0.00 0.00 0.00 0.00
Organic clay 2.39 1.67 1.27 0.95 0.68 0.50 0.22 0.00 0.00 0.00
Peat 4.08 3.02 2.32 1.80 1.42 1.14 0.69 0.36 0.18 0.00
model without buoyancy when the tunnel is near the surface. If one compares the two
the maximum radial displacements in the buoyancy model are 2 to 3 times higher than
displacements in the model without buoyancy for tunnelling in sand and clayey sand.
For very shallow tunnels in clay, organic clay and peat, the maximum radial displace-
ments in the buoyancy model are significantly larger compared to these displacements
in the model without buoyancy and in Duddeck’s model. It can be seen that deformation
in cases without buoyancy is closer to Duddeck’s calculation when tunnelling in clay, or-
ganic clay and peat while the deformations in the case with buoyancy are much higher.
The reason for this is that when the tunnel is close to the surface, the relative difference
in the loading on the upper and lower parts of the tunnel lining increases more both for
soil loading and pore pressure.
From the maximum radial displacement lines of the new model given in Figure 3.14, it
can be observed that there are lowest points in both the cases with and without buoy-
ancy. This indicates the existence of an optimal depth for a particular tunnel where
maximum deformation is minimal both with and without buoyancy. For example, in
Figure 3.14a, the optimal depth is estimated at the depth of the tunnel H = 8.5m where
the minimum values of maximum displacements in models with and without buoyancy
are 0.02m and 0.01m, respectively.
Analysing for varied tunnel radii R and the d/D ratio of cross-sections in the new
model with and without buoyancy, Figures 3.15, 3.16, 3.17, 3.18 and 3.19 show the re-
lationship between maximum radial displacements and the C /D ratio. At a particular
value of the C /D ratio, the thinner tunnel cross-section is, and/or the larger the tunnel
radius is, the larger maximum the radial displacement is.
It is interesting to note the existence of a value of the C /D ratio where the maximum
radial displacement is minimum for a particular d/D ratio with varied tunnel radii R in
both cases of with and without buoyancy. For example, in Figure 3.15a for the tunnel
with cross-section d/D = 1/10, the maximum displacement of the tunnel lining reaches
the minimum value when C /D = 2.05 for the models without and with buoyancy. These
optimal values are 1.58 for the tunnel with cross-section d/D = 1/12 in Figure 3.15b, and
0.8 for the tunnel with cross-section d/D = 1/20 in Figure 3.15f.
Based on these analysis results, Table 3.2 summarizes the values of the C /D ratio when
the maximum displacement of the tunnel lining reaches the minimum value for the
models without and with buoyancy with various d/D ratios of the tunnel cross-section
in the case of tunnelling in sand, clay, organic clay and peat.
On the basis of this structural analysis for shallow tunnels in various soils, for varied ge-
ometry of cross-section of the tunnel d/D, an optimal C /D value can be found that gives

3
58 3. STRUCTURAL ANALYSIS OF SHALLOW TUNNELS
a minimum value of the maximum deformation of the tunnel lining. Moreover, uplift
analysis for shallow tunnels in Chapter 2 provides the minimum C /D ratio where ballast
should be used for varied values of d/D. From Table 3.2, the optimal C /D value based
on the structural analysis and uplift analysis for shallow tunnels with or without buoy-
ancy can be determined. In Figures 3.20a, 3.20b, 3.20c, 3.20d and 3.20e, the intersection
between the optimal values of the C /D ratio from structural analysis and uplift analy-
sis shows the situation of a designed shallow tunnel where ballast layers are required
or which value of the d/D ratio should be minimally used in a particular depth of the
tunnel.
3.4. CONCLUSION
Structural design for tunnels has been previously focused on moderate to deep tunnels
(with C /D ≥ 2). The loading on tunnel linings in recent models does not include the
difference of loadings at the top and at the bottom of shallow tunnels. By calculating
the soil pressure at particular points on the cross-section of the tunnel combined with
finite element method for structural analysis, the new model in this study becomes ap-
propriate for tunnels at shallow depths. Structural analysis from the new model shows
that the normalized internal forces and the deformations of the tunnel lining increase
significantly when the tunnel is designed at shallow location with and without taking
buoyancy into account. From the analysis results it follows there is a minimum value of
maximum deformation of the tunnel lining when changing the depth H of the tunnel.
From combined structural analysis with uplift analysis, an optimal C /D ratio for a par-
ticular cross-section d/D ratio in tunnelling without ballast can be derived.

3.4. CONCLUSION
3
59
H(m)4 5 6 7 8 9 10 11 12 13 14 15
max
imum
rad
ial d
ispl
acem
ent(
m)
0
0.005
0.01
0.015
0.02
0.025
0.03
0.035
0.04
0.045without buoyancywith buoyancyDuddeck
(a) in sand
H(m)4 5 6 7 8 9 10 11 12 13 14 15
max
imum
rad
ial d
ispl
acem
ent(
m)
0
0.005
0.01
0.015
0.02
0.025
0.03
0.035
0.04
0.045without buoyancywith buoyancyDuddeck
(b) in clayey sand
4 6 8 10 12 140
0.01
0.02
0.03
0.04
0.05
0.06
0.07
H(m)
max
imum
rad
ial d
ispl
acem
ent(
m)
without buoyancywith buoyancyDuddeck
(c) in clay
4 6 8 10 12 140
0.02
0.04
0.06
0.08
0.1
H(m)
max
imum
rad
ial d
ispl
acem
ent(
m)
without buoyancywith buoyancyDuddeck
(d) in organic clay
4 6 8 10 12 140
0.01
0.02
0.03
0.04
0.05
0.06
0.07
H(m)
max
imum
rad
ial d
ispl
acem
ent(
m)
without buoyancywith buoyancyDuddeck
(e) in peat
Figure 3.14: Maximum radial displacements in models in shallow tunnels

3
60 3. STRUCTURAL ANALYSIS OF SHALLOW TUNNELS
C/D0 0.5 1 1.5 2 2.5
max
imum
rad
ial d
ispl
acem
ent(
m)
0
0.02
0.04
0.06
0.08
0.1
0.12
0.14
0.16
0.18
0.2
R=3-without buoyancyR=4-without buoyancyR=5-without buoyancyR=6-without buoyancyR=3-with buoyancyR=4-with buoyancyR=5-with buoyancyR=6-with buoyancy
(a) d/D = 1/10
C/D0 0.5 1 1.5 2 2.5
max
imum
rad
ial d
ispl
acem
ent(
m)
0
0.02
0.04
0.06
0.08
0.1
0.12
0.14
0.16
0.18
0.2
R=3-without buoyancyR=4-without buoyancyR=5-without buoyancyR=6-without buoyancyR=3-with buoyancyR=4-with buoyancyR=5-with buoyancyR=6-with buoyancy
(b) d/D = 1/12
C/D0 0.5 1 1.5 2 2.5
max
imum
rad
ial d
ispl
acem
ent(
m)
0
0.02
0.04
0.06
0.08
0.1
0.12
0.14
0.16
0.18
0.2
R=3-without buoyancyR=4-without buoyancyR=5-without buoyancyR=6-without buoyancyR=3-with buoyancyR=4-with buoyancyR=5-with buoyancyR=6-with buoyancy
(c) d/D = 1/14
C/D0 0.5 1 1.5 2 2.5
max
imum
rad
ial d
ispl
acem
ent(
m)
0
0.02
0.04
0.06
0.08
0.1
0.12
0.14
0.16
0.18
0.2
R=3-without buoyancyR=4-without buoyancyR=5-without buoyancyR=6-without buoyancyR=3-with buoyancyR=4-with buoyancyR=5-with buoyancyR=6-with buoyancy
(d) d/D = 1/16
C/D0 0.5 1 1.5 2 2.5
max
imum
rad
ial d
ispl
acem
ent(
m)
0
0.02
0.04
0.06
0.08
0.1
0.12
0.14
0.16
0.18
0.2
R=3-without buoyancyR=4-without buoyancyR=5-without buoyancyR=6-without buoyancyR=3-with buoyancyR=4-with buoyancyR=5-with buoyancyR=6-with buoyancy
(e) d/D = 1/18
C/D0 0.5 1 1.5 2 2.5
max
imum
rad
ial d
ispl
acem
ent(
m)
0
0.02
0.04
0.06
0.08
0.1
0.12
0.14
0.16
0.18
0.2
R=3-without buoyancyR=4-without buoyancyR=5-without buoyancyR=6-without buoyancyR=3-with buoyancyR=4-with buoyancyR=5-with buoyancyR=6-with buoyancy
(f) d/D = 1/20
Figure 3.15: Relationship between maximum radial displacements and cover-to-diameter C /D values for mod-
els in with and without buoyancy in varied thickness-to-diameter ratio d/D of the tunnel cross-section in sand.
Vertical lines include the optimal C /D where radial displacement is minimal (continue in next page).

3.4. CONCLUSION
3
61
C/D0 0.5 1 1.5 2 2.5
max
imum
rad
ial d
ispl
acem
ent(
m)
0
0.02
0.04
0.06
0.08
0.1
0.12
0.14
0.16
0.18
0.2
R=3-without buoyancyR=4-without buoyancyR=5-without buoyancyR=6-without buoyancyR=3-with buoyancyR=4-with buoyancyR=5-with buoyancyR=6-with buoyancy
(g) d/D = 1/25
C/D0 0.5 1 1.5 2 2.5
max
imum
rad
ial d
ispl
acem
ent(
m)
0
0.02
0.04
0.06
0.08
0.1
0.12
0.14
0.16
0.18
0.2
R=3-without buoyancyR=4-without buoyancyR=5-without buoyancyR=6-without buoyancyR=3-with buoyancyR=4-with buoyancyR=5-with buoyancyR=6-with buoyancy
(h) d/D = 1/30
C/D0 0.5 1 1.5 2 2.5
max
imum
rad
ial d
ispl
acem
ent(
m)
0
0.02
0.04
0.06
0.08
0.1
0.12
0.14
0.16
0.18
0.2
R=3-without buoyancyR=4-without buoyancyR=5-without buoyancyR=6-without buoyancyR=3-with buoyancyR=4-with buoyancyR=5-with buoyancyR=6-with buoyancy
(i) d/D = 1/35
C/D0 0.5 1 1.5 2 2.5
max
imum
rad
ial d
ispl
acem
ent(
m)
0
0.02
0.04
0.06
0.08
0.1
0.12
0.14
0.16
0.18
0.2
R=3-without buoyancyR=4-without buoyancyR=5-without buoyancyR=6-without buoyancyR=3-with buoyancyR=4-with buoyancyR=5-with buoyancyR=6-with buoyancy
(j) d/D = 1/40
Figure 3.15: Relationship between maximum radial displacements and cover-to-diameter C /D values for
models in with and without buoyancy in varied thickness-to-diameter ratio d/D of the tunnel cross-section
in sand. Vertical lines include the optimal C /D where radial displacement is minimal.

3
62 3. STRUCTURAL ANALYSIS OF SHALLOW TUNNELS
C/D0 0.5 1 1.5 2 2.5
max
imum
rad
ial d
ispl
acem
ent(
m)
0
0.02
0.04
0.06
0.08
0.1
0.12
0.14
0.16
0.18
0.2
R=3-without buoyancyR=4-without buoyancyR=5-without buoyancyR=6-without buoyancyR=3-with buoyancyR=4-with buoyancyR=5-with buoyancyR=6-with buoyancy
(a) d/D = 1/10
C/D0 0.5 1 1.5 2 2.5
max
imum
rad
ial d
ispl
acem
ent(
m)
0
0.02
0.04
0.06
0.08
0.1
0.12
0.14
0.16
0.18
0.2
R=3-without buoyancyR=4-without buoyancyR=5-without buoyancyR=6-without buoyancyR=3-with buoyancyR=4-with buoyancyR=5-with buoyancyR=6-with buoyancy
(b) d/D = 1/12
C/D0 0.5 1 1.5 2 2.5
max
imum
rad
ial d
ispl
acem
ent(
m)
0
0.02
0.04
0.06
0.08
0.1
0.12
0.14
0.16
0.18
0.2
R=3-without buoyancyR=4-without buoyancyR=5-without buoyancyR=6-without buoyancyR=3-with buoyancyR=4-with buoyancyR=5-with buoyancyR=6-with buoyancy
(c) d/D = 1/14
C/D0 0.5 1 1.5 2 2.5
max
imum
rad
ial d
ispl
acem
ent(
m)
0
0.02
0.04
0.06
0.08
0.1
0.12
0.14
0.16
0.18
0.2
R=3-without buoyancyR=4-without buoyancyR=5-without buoyancyR=6-without buoyancyR=3-with buoyancyR=4-with buoyancyR=5-with buoyancyR=6-with buoyancy
(d) d/D = 1/16
C/D0 0.5 1 1.5 2 2.5
max
imum
rad
ial d
ispl
acem
ent(
m)
0
0.02
0.04
0.06
0.08
0.1
0.12
0.14
0.16
0.18
0.2
R=3-without buoyancyR=4-without buoyancyR=5-without buoyancyR=6-without buoyancyR=3-with buoyancyR=4-with buoyancyR=5-with buoyancyR=6-with buoyancy
(e) d/D = 1/18
C/D0 0.5 1 1.5 2 2.5
max
imum
rad
ial d
ispl
acem
ent(
m)
0
0.02
0.04
0.06
0.08
0.1
0.12
0.14
0.16
0.18
0.2
R=3-without buoyancyR=4-without buoyancyR=5-without buoyancyR=6-without buoyancyR=3-with buoyancyR=4-with buoyancyR=5-with buoyancyR=6-with buoyancy
(f) d/D = 1/20
Figure 3.16: Relationship between maximum radial displacements and cover-to-diameter C /D values for
models in with and without buoyancy in varied thickness-to-diameter ratio d/D of the tunnel cross-section
in clayey sand. Vertical lines include the optimal C /D where radial displacement is minimal (continue in next
page).

3.4. CONCLUSION
3
63
C/D0 0.5 1 1.5 2 2.5
max
imum
rad
ial d
ispl
acem
ent(
m)
0
0.02
0.04
0.06
0.08
0.1
0.12
0.14
0.16
0.18
0.2
R=3-without buoyancyR=4-without buoyancyR=5-without buoyancyR=6-without buoyancyR=3-with buoyancyR=4-with buoyancyR=5-with buoyancyR=6-with buoyancy
(g) d/D = 1/25
C/D0 0.5 1 1.5 2 2.5
max
imum
rad
ial d
ispl
acem
ent(
m)
0
0.02
0.04
0.06
0.08
0.1
0.12
0.14
0.16
0.18
0.2
R=3-without buoyancyR=4-without buoyancyR=5-without buoyancyR=6-without buoyancyR=3-with buoyancyR=4-with buoyancyR=5-with buoyancyR=6-with buoyancy
(h) d/D = 1/30
C/D0 0.5 1 1.5 2 2.5
max
imum
rad
ial d
ispl
acem
ent(
m)
0
0.02
0.04
0.06
0.08
0.1
0.12
0.14
0.16
0.18
0.2
R=3-without buoyancyR=4-without buoyancyR=5-without buoyancyR=6-without buoyancyR=3-with buoyancyR=4-with buoyancyR=5-with buoyancyR=6-with buoyancy
(i) d/D = 1/35
C/D0 0.5 1 1.5 2 2.5
max
imum
rad
ial d
ispl
acem
ent(
m)
0
0.02
0.04
0.06
0.08
0.1
0.12
0.14
0.16
0.18
0.2
R=3-without buoyancyR=4-without buoyancyR=5-without buoyancyR=6-without buoyancyR=3-with buoyancyR=4-with buoyancyR=5-with buoyancyR=6-with buoyancy
(j) d/D = 1/40
Figure 3.16: Relationship between maximum radial displacements and cover-to-diameter C /D values for
models in with and without buoyancy in varied thickness-to-diameter ratio d/D of the tunnel cross-section
in clayey sand. Vertical lines include the optimal C /D where radial displacement is minimal.

3
64 3. STRUCTURAL ANALYSIS OF SHALLOW TUNNELS
0 0.5 1 1.5 2 2.50
0.02
0.04
0.06
0.08
0.1
0.12
0.14
0.16
0.18
0.2
C/D
max
imum
rad
ial d
ispl
acem
ent(
m)
R=3−without buoyancyR=4−without buoyancyR=5−without buoyancyR=6−without buoyancyR=3−with buoyancyR=4−with buoyancyR=5−with buoyancyR=6−with buoyancy
(a) d/D = 1/10
0 0.5 1 1.5 2 2.50
0.02
0.04
0.06
0.08
0.1
0.12
0.14
0.16
0.18
0.2
C/D
max
imum
rad
ial d
ispl
acem
ent(
m)
R=3−without buoyancyR=4−without buoyancyR=5−without buoyancyR=6−without buoyancyR=3−with buoyancyR=4−with buoyancyR=5−with buoyancyR=6−with buoyancy
(b) d/D = 1/12
0 0.5 1 1.5 2 2.50
0.02
0.04
0.06
0.08
0.1
0.12
0.14
0.16
0.18
0.2
C/D
max
imum
rad
ial d
ispl
acem
ent(
m)
R=3−without buoyancyR=4−without buoyancyR=5−without buoyancyR=6−without buoyancyR=3−with buoyancyR=4−with buoyancyR=5−with buoyancyR=6−with buoyancy
(c) d/D = 1/14
0 0.5 1 1.5 2 2.50
0.02
0.04
0.06
0.08
0.1
0.12
0.14
0.16
0.18
0.2
C/D
max
imum
rad
ial d
ispl
acem
ent(
m)
R=3−without buoyancyR=4−without buoyancyR=5−without buoyancyR=6−without buoyancyR=3−with buoyancyR=4−with buoyancyR=5−with buoyancyR=6−with buoyancy
(d) d/D = 1/16
0 0.5 1 1.5 2 2.50
0.02
0.04
0.06
0.08
0.1
0.12
0.14
0.16
0.18
0.2
C/D
max
imum
rad
ial d
ispl
acem
ent(
m)
R=3−without buoyancyR=4−without buoyancyR=5−without buoyancyR=6−without buoyancyR=3−with buoyancyR=4−with buoyancyR=5−with buoyancyR=6−with buoyancy
(e) d/D = 1/18
0 0.5 1 1.5 2 2.50
0.02
0.04
0.06
0.08
0.1
0.12
0.14
0.16
0.18
0.2
C/D
max
imum
rad
ial d
ispl
acem
ent(
m)
R=3−without buoyancyR=4−without buoyancyR=5−without buoyancyR=6−without buoyancyR=3−with buoyancyR=4−with buoyancyR=5−with buoyancyR=6−with buoyancy
(f) d/D = 1/20
Figure 3.17: Relationship between maximum radial displacements and cover-to-diameter C /D values for mod-
els in with and without buoyancy in varied thickness-to-diameter ratio d/D of the tunnel cross-section in clay.
Vertical lines include the optimal C /D where radial displacement is minimal(continue in next page).

3.4. CONCLUSION
3
65
0 0.5 1 1.5 2 2.50
0.02
0.04
0.06
0.08
0.1
0.12
0.14
0.16
0.18
0.2
C/D
max
imum
rad
ial d
ispl
acem
ent(
m)
R=3−without buoyancyR=4−without buoyancyR=5−without buoyancyR=6−without buoyancyR=3−with buoyancyR=4−with buoyancyR=5−with buoyancyR=6−with buoyancy
(g) d/D = 1/25
0 0.5 1 1.5 2 2.50
0.02
0.04
0.06
0.08
0.1
0.12
0.14
0.16
0.18
0.2
C/D
max
imum
rad
ial d
ispl
acem
ent(
m)
R=3−without buoyancyR=4−without buoyancyR=5−without buoyancyR=6−without buoyancyR=3−with buoyancyR=4−with buoyancyR=5−with buoyancyR=6−with buoyancy
(h) d/D = 1/30
0 0.5 1 1.5 2 2.50
0.02
0.04
0.06
0.08
0.1
0.12
0.14
0.16
0.18
0.2
C/D
max
imum
rad
ial d
ispl
acem
ent(
m)
R=3−without buoyancyR=4−without buoyancyR=5−without buoyancyR=6−without buoyancyR=3−with buoyancyR=4−with buoyancyR=5−with buoyancyR=6−with buoyancy
(i) d/D = 1/35
0 0.5 1 1.5 2 2.50
0.02
0.04
0.06
0.08
0.1
0.12
0.14
0.16
0.18
0.2
C/D
max
imum
rad
ial d
ispl
acem
ent(
m)
R=3−without buoyancyR=4−without buoyancyR=5−without buoyancyR=6−without buoyancyR=3−with buoyancyR=4−with buoyancyR=5−with buoyancyR=6−with buoyancy
(j) d/D = 1/40
Figure 3.17: Relationship between maximum radial displacements and cover-to-diameter C /D values for mod-
els in with and without buoyancy in varied thickness-to-diameter ratio d/D of the tunnel cross-section in clay.
Vertical lines include the optimal C /D where radial displacement is minimal.

3
66 3. STRUCTURAL ANALYSIS OF SHALLOW TUNNELS
0 0.5 1 1.5 2 2.5 30
0.02
0.04
0.06
0.08
0.1
0.12
0.14
0.16
0.18
0.2
C/D
max
imum
rad
ial d
ispl
acem
ent(
m)
R=3−without buoyancyR=4−without buoyancyR=5−without buoyancyR=6−without buoyancyR=3−with buoyancyR=4−with buoyancyR=5−with buoyancyR=6−with buoyancy
(a) d/D = 1/10
0 0.5 1 1.5 2 2.5 30
0.02
0.04
0.06
0.08
0.1
0.12
0.14
0.16
0.18
0.2
C/D
max
imum
rad
ial d
ispl
acem
ent(
m)
R=3−without buoyancyR=4−without buoyancyR=5−without buoyancyR=6−without buoyancyR=3−with buoyancyR=4−with buoyancyR=5−with buoyancyR=6−with buoyancy
(b) d/D = 1/12
0 0.5 1 1.5 2 2.5 30
0.02
0.04
0.06
0.08
0.1
0.12
0.14
0.16
0.18
0.2
C/D
max
imum
rad
ial d
ispl
acem
ent(
m)
R=3−without buoyancyR=4−without buoyancyR=5−without buoyancyR=6−without buoyancyR=3−with buoyancyR=4−with buoyancyR=5−with buoyancyR=6−with buoyancy
(c) d/D = 1/14
0 0.5 1 1.5 2 2.5 30
0.02
0.04
0.06
0.08
0.1
0.12
0.14
0.16
0.18
0.2
C/D
max
imum
rad
ial d
ispl
acem
ent(
m)
R=3−without buoyancyR=4−without buoyancyR=5−without buoyancyR=6−without buoyancyR=3−with buoyancyR=4−with buoyancyR=5−with buoyancyR=6−with buoyancy
(d) d/D = 1/16
0 0.5 1 1.5 2 2.5 30
0.02
0.04
0.06
0.08
0.1
0.12
0.14
0.16
0.18
0.2
C/D
max
imum
rad
ial d
ispl
acem
ent(
m)
R=3−without buoyancyR=4−without buoyancyR=5−without buoyancyR=6−without buoyancyR=3−with buoyancyR=4−with buoyancyR=5−with buoyancyR=6−with buoyancy
(e) d/D = 1/18
0 0.5 1 1.5 2 2.5 30
0.02
0.04
0.06
0.08
0.1
0.12
0.14
0.16
0.18
0.2
C/D
max
imum
rad
ial d
ispl
acem
ent(
m)
R=3−without buoyancyR=4−without buoyancyR=5−without buoyancyR=6−without buoyancyR=3−with buoyancyR=4−with buoyancyR=5−with buoyancyR=6−with buoyancy
(f) d/D = 1/20
Figure 3.18: Relationship between maximum radial displacements and cover-to-diameter C /D values for
models in with and without buoyancy in varied thickness-to-diameter ratio d/D of the tunnel cross-section
in organic clay. Vertical lines include the optimal C /D where radial displacement is minimal(continue in next
page).

3.4. CONCLUSION
3
67
0 0.5 1 1.5 2 2.5 30
0.02
0.04
0.06
0.08
0.1
0.12
0.14
0.16
0.18
0.2
C/D
max
imum
rad
ial d
ispl
acem
ent(
m)
R=3−without buoyancyR=4−without buoyancyR=5−without buoyancyR=6−without buoyancyR=3−with buoyancyR=4−with buoyancyR=5−with buoyancyR=6−with buoyancy
(g) d/D = 1/25
0 0.5 1 1.5 2 2.5 30
0.02
0.04
0.06
0.08
0.1
0.12
0.14
0.16
0.18
0.2
C/D
max
imum
rad
ial d
ispl
acem
ent(
m)
R=3−without buoyancyR=4−without buoyancyR=5−without buoyancyR=6−without buoyancyR=3−with buoyancyR=4−with buoyancyR=5−with buoyancyR=6−with buoyancy
(h) d/D = 1/30
0 0.5 1 1.5 2 2.5 30
0.02
0.04
0.06
0.08
0.1
0.12
0.14
0.16
0.18
0.2
C/D
max
imum
rad
ial d
ispl
acem
ent(
m)
R=3−without buoyancyR=4−without buoyancyR=5−without buoyancyR=6−without buoyancyR=3−with buoyancyR=4−with buoyancyR=5−with buoyancyR=6−with buoyancy
(i) d/D = 1/35
0 0.5 1 1.5 2 2.5 30
0.02
0.04
0.06
0.08
0.1
0.12
0.14
0.16
0.18
0.2
C/D
max
imum
rad
ial d
ispl
acem
ent(
m)
R=3−without buoyancyR=4−without buoyancyR=5−without buoyancyR=6−without buoyancyR=3−with buoyancyR=4−with buoyancyR=5−with buoyancyR=6−with buoyancy
(j) d/D = 1/40
Figure 3.18: Relationship between maximum radial displacements and cover-to-diameter C /D values for
models in with and without buoyancy in varied thickness-to-diameter ratio d/D of the tunnel cross-section
in organic clay. Vertical lines include the optimal C /D where radial displacement is minimal.

3
68 3. STRUCTURAL ANALYSIS OF SHALLOW TUNNELS
0 1 2 3 4 50
0.05
0.1
0.15
0.2
0.25
0.3
0.35
0.4
C/D
max
imum
rad
ial d
ispl
acem
ent(
m)
R=3−without buoyancyR=4−without buoyancyR=5−without buoyancyR=6−without buoyancyR=3−with buoyancyR=4−with buoyancyR=5−with buoyancyR=6−with buoyancy
(a) d/D = 1/10
0 1 2 3 4 50
0.05
0.1
0.15
0.2
0.25
0.3
0.35
0.4
C/D
max
imum
rad
ial d
ispl
acem
ent(
m)
R=3−without buoyancyR=4−without buoyancyR=5−without buoyancyR=6−without buoyancyR=3−with buoyancyR=4−with buoyancyR=5−with buoyancyR=6−with buoyancy
(b) d/D = 1/12
0 1 2 3 4 50
0.05
0.1
0.15
0.2
0.25
0.3
0.35
0.4
C/D
max
imum
rad
ial d
ispl
acem
ent(
m)
R=3−without buoyancyR=4−without buoyancyR=5−without buoyancyR=6−without buoyancyR=3−with buoyancyR=4−with buoyancyR=5−with buoyancyR=6−with buoyancy
(c) d/D = 1/14
0 1 2 3 4 50
0.05
0.1
0.15
0.2
0.25
0.3
0.35
0.4
C/D
max
imum
rad
ial d
ispl
acem
ent(
m)
R=3−without buoyancyR=4−without buoyancyR=5−without buoyancyR=6−without buoyancyR=3−with buoyancyR=4−with buoyancyR=5−with buoyancyR=6−with buoyancy
(d) d/D = 1/16
0 1 2 3 4 50
0.05
0.1
0.15
0.2
0.25
0.3
0.35
0.4
C/D
max
imum
rad
ial d
ispl
acem
ent(
m)
R=3−without buoyancyR=4−without buoyancyR=5−without buoyancyR=6−without buoyancyR=3−with buoyancyR=4−with buoyancyR=5−with buoyancyR=6−with buoyancy
(e) d/D = 1/18
0 1 2 3 4 50
0.05
0.1
0.15
0.2
0.25
0.3
0.35
0.4
C/D
max
imum
rad
ial d
ispl
acem
ent(
m)
R=3−without buoyancyR=4−without buoyancyR=5−without buoyancyR=6−without buoyancyR=3−with buoyancyR=4−with buoyancyR=5−with buoyancyR=6−with buoyancy
(f) d/D = 1/20
Figure 3.19: Relationship between maximum radial displacements and cover-to-diameter C /D values for
models in with and without buoyancy in varied thickness-to-diameter ratio d/D of the tunnel cross-section
in peat. Vertical lines include the optimal C /D where radial displacement is minimal(continue in next page).

3.4. CONCLUSION
3
69
0 1 2 3 4 50
0.05
0.1
0.15
0.2
0.25
0.3
0.35
0.4
C/D
max
imum
rad
ial d
ispl
acem
ent(
m)
R=3−without buoyancyR=4−without buoyancyR=5−without buoyancyR=6−without buoyancyR=3−with buoyancyR=4−with buoyancyR=5−with buoyancyR=6−with buoyancy
(g) d/D = 1/25
0 1 2 3 4 50
0.05
0.1
0.15
0.2
0.25
0.3
0.35
0.4
C/D
max
imum
rad
ial d
ispl
acem
ent(
m)
R=3−without buoyancyR=4−without buoyancyR=5−without buoyancyR=6−without buoyancyR=3−with buoyancyR=4−with buoyancyR=5−with buoyancyR=6−with buoyancy
(h) d/D = 1/30
0 1 2 3 4 50
0.05
0.1
0.15
0.2
0.25
0.3
0.35
0.4
C/D
max
imum
rad
ial d
ispl
acem
ent(
m)
R=3−without buoyancyR=4−without buoyancyR=5−without buoyancyR=6−without buoyancyR=3−with buoyancyR=4−with buoyancyR=5−with buoyancyR=6−with buoyancy
(i) d/D = 1/35
0 1 2 3 4 50
0.05
0.1
0.15
0.2
0.25
0.3
0.35
0.4
C/D
max
imum
rad
ial d
ispl
acem
ent(
m)
R=3−without buoyancyR=4−without buoyancyR=5−without buoyancyR=6−without buoyancyR=3−with buoyancyR=4−with buoyancyR=5−with buoyancyR=6−with buoyancy
(j) d/D = 1/40
Figure 3.19: Relationship between maximum radial displacements and cover-to-diameter C /D values for
models in with and without buoyancy in varied thickness-to-diameter ratio d/D of the tunnel cross-section
in peat. Vertical lines include the optimal C /D where radial displacement is minimal.

3
70 3. STRUCTURAL ANALYSIS OF SHALLOW TUNNELS
d/D
0
C/D
0
0.5
1
1.5
2
2.5
structural analysis
uplift analysis
1/40 1/18 1/12 1/101/20 1/141/16
1/25
1/30
1/35
require ballast
(a) in sand
d/D
C/D
0
0.1
0.2
0.3
0.4
0.5
0.6
0.7
0.8
0.9
1
structural analysis
uplift analysis
0 1/40 1/18 1/12 1/101/20 1/141/16
1/25
1/30
1/35
require ballast
(b) in clayey sand
00
0.5
1
1.5
d/D
C/D
structural analysis
uplift analysis
require ballast
1/40 1/18 1/12 1/101/20 1/141/16
1/25
1/30
1/35
(c) in clay
00
0.5
1
1.5
2
2.5
d/D
C/D
structural analysis
uplift analysis
1/40 1/18 1/12 1/101/20 1/141/16
1/25
1/30
1/35
require ballast
(d) in organic clay
00
0.5
1
1.5
2
2.5
3
3.5
4
4.5
5
d/D
C/D
structural analysis
uplift analysis
require ballast
1/40 1/18 1/12 1/101/20 1/141/16
1/25
1/30
1/35
(e) in peat
Figure 3.20: Optimal cover-to-diameter ratio C /D values for shallow tunnels

4GROUND MOVEMENTS AND
EFFECTS ON BUILDINGS
Ideas can come from anywhere and at any time. The problem with making mental notes
is that the ink fades very rapidly.
Rolf Smith
Assessing the impact of underground construction on existing structures in urban areas is
an important topic during design. In this chapter, the extent of the zones affected by tun-
nelling is estimated, where existing foundations are influenced based on the investigation
of surface and subsurface settlements. The extent of the areas where building deformation
exceeds allowable settlements is presented, which will provide a preliminary assessment
during design on the risk on existing structures, based on allowable settlement umax and
slope ωmax . A more accurate impact area of shield tunnelling on nearby pile foundations
is proposed.
This chapter is based on papers that have been published in ITA WTC 2016 Congress and 42nd General As-
sembly Vu et al. (2016a) and Tunnelling and Underground Space Technology Vu et al. (2015a). Section 4.2 has
been expanded
71

4
72 4. GROUND MOVEMENTS AND EFFECTS ON BUILDINGS
4.1. INTRODUCTION
Shield tunnelling is often used in constructing underground infrastructure in cities due
to the ability to limit settlements and damage to existing buildings. However, in an ur-
ban environment with soft soil overburden and buildings on pile foundations such as
the North-South Line project in Amsterdam, there is a tendency to design the tunnel
well below the surface and below the pile tip level in order to reduce interaction between
tunnelling process and piles. This results in deep tunnels and deep station boxes. When
the tunnels are located close to the surface and above the pile tip level, this would reduce
the required depth of the station boxes and the construction cost. Moreover, other bene-
fits of shallow tunnels are the low operational cost in the long-term and shorter traveling
time from the surface to the platforms. Still, the tunnels should be constructed in such
a manner that existing buildings are not structurally damaged, which results in a mini-
mum required distance between tunnelling process and existing buildings.
The previous chapters studied the effects of the C /D ratio on the stability when tun-
nelling and the structural deformations of the tunnel linings. These stability and defor-
mations lead to ground movements around the tunnel and settlements on the surface
when tunnelling and have influence on existing buildings. In this chapter, the extent
of the area that is influenced by tunnelling will be investigated with the allowable set-
tlement and slope which are derived from the preliminary risk assessment in order to
determine the limit distance from tunnelling to existing foundations without inducing
too large building deformation. This study takes a look at the ground movements both
at the surface and subsurface when tunnelling in soft soils with deep foundations with
the following targets:
- Define the areas where ground movements remain below the acceptable limits for the
buildings.
- Estimate the effects of the C /D ratio on the extent of this limited ground movement
area.
In this chapter, Section 4.2 introduces background definitions of ground movements and
assessments of risk of building damage induced by bored tunnelling. Section 4.3 esti-
mates the effects of the C /D ratio on surface settlement. The dependence of subsurface
settlements on the C /D ratio is shown in Section 4.4. Conclusions of the impact of shal-
low tunnelling on ground movements and existing buildings are presented in Section 4.5.
4.2. GROUND MOVEMENT DEFINITIONS AND RISK ASSESSMENT
4.2.1. GROUND MOVEMENT DEFINITIONS
SURFACE SETTLEMENTS
According to Mair and Taylor (1999), the components of ground movements due to tun-
nelling are: soil movements at the tunnelling face, ground displacements along the shield
due to the overcutting and the shape of TBM machines, ground movements at the tail be-
hind the shield and consolidation settlements. Figure 4.1 shows the three dimensional
settlement trough on the surface in green field conditions.
From analyzing empirical data of many shield tunnels, Peck (1969) firstly presented the
settlement trough on the surface induced by tunnelling in soft soil as a Gaussian distri-
bution. This is also confirmed by other authors (Cording and Hansmire, 1975; Mair et al.,

4.2. GROUND MOVEMENT DEFINITIONS AND RISK ASSESSMENT
4
73
Figure 4.1: Surface settlement trough induced by tunnelling (Franzius, 2004)
Figure 4.2: Transverse settlement trough due to tunnelling (Peck, 1969)

4
74 4. GROUND MOVEMENTS AND EFFECTS ON BUILDINGS
1993; Ahmed and Iskander, 2010). Even though some studies show that there are some
deviations of the Gaussian distribution in some particular cases (Celestino et al., 2000;
Jacobsz, 2003; Vorster, 2006; Farrell et al., 2012) and in Japan (JSSMFE, 1993), the Gaus-
sian curve is still used widely in research and practical design, especially in the Anglo-
Saxon countries. In this study, the Gaussian curve is used to investigate the ground
movement when tunnelling in order to find the effects on existing structures.
The transverse settlement shape of the ground surface shown in Figure 4.2 as a Gaussian
distribution (Peck, 1969) can be estimated from the maximum settlement Sv,max at the
surface directly above the tunnel location and the trough width i as follows:
sv = Sv,max exp
(
−x2
2i 2
)
(4.1)
The shape of curve is determined by the position of the inflection point i . The width of
the settlement trough depends on the depth of the tunnel z0 and the soil parameters.
O’Reilly and New (1982) gave the relationship:
for cohesive soils:
i = 0.43z0 +1.1 (4.2)
and for granular soils:
i = 0.28z0 −0.1 (4.3)
This relationship was also compared by Mair and Taylor (1999) to the relations for settle-
ment trough width and depth of tunnel axis from many authors and recommended for
practical purposes.
The volume of settlement trough per unit tunnel length can be estimated by:
Vs =p
2πi Sv,max ≃ 2.5i Sv,max (4.4)
For a circular tunnel, Vs is often calculated via the volume loss VL as the percentage of
the notional excavated tunnel volume (Mair et al., 1993):
Vs =VLπD2
4(4.5)
According to Cording and Hansmire (1975), when tunnelling in drained conditions, Vs
is less than the volume loss around the tunnel due to dilation and when tunnelling in
undrained conditions, Vs equals volume loss around the tunnel. In calculation, Vs is
often assumed equal to the volume loss around the tunnel. The volume loss around
tunnel includes volume loss caused by deformations due to face support, passage of the
tunnelling machine and the annular gap grouting (Maidl, 2012). The detailed calculation
of volume loss is presented in Chapter 5.
From Equations 4.4 and 4.5, the maximum transverse settlement can be calculated as:
Sv,max =
√
π
2
VLD2
4i(4.6)
Therefore, the transverse settlement trough can be described as:
sv =
√
π
2
VLD2
4iexp
(
−x2
2i 2
)
(4.7)
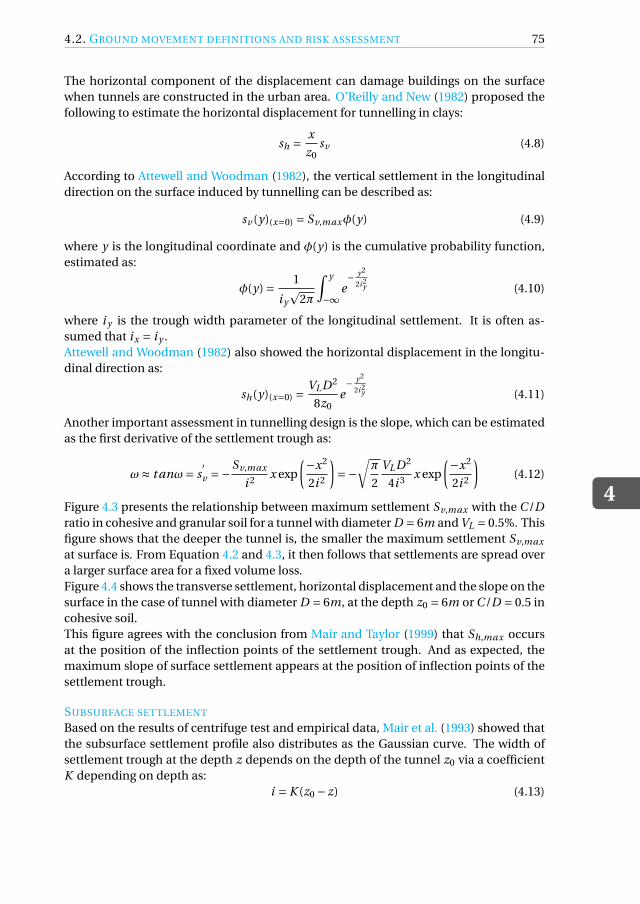
4.2. GROUND MOVEMENT DEFINITIONS AND RISK ASSESSMENT
4
75
The horizontal component of the displacement can damage buildings on the surface
when tunnels are constructed in the urban area. O’Reilly and New (1982) proposed the
following to estimate the horizontal displacement for tunnelling in clays:
sh =x
z0sv (4.8)
According to Attewell and Woodman (1982), the vertical settlement in the longitudinal
direction on the surface induced by tunnelling can be described as:
sv (y)(x=0) = Sv,maxφ(y) (4.9)
where y is the longitudinal coordinate and φ(y) is the cumulative probability function,
estimated as:
φ(y) =1
i y
p2π
∫y
−∞e− y2
2i 2y (4.10)
where i y is the trough width parameter of the longitudinal settlement. It is often as-
sumed that ix = i y .
Attewell and Woodman (1982) also showed the horizontal displacement in the longitu-
dinal direction as:
sh(y)(x=0) =VLD2
8z0e− y2
2i 2y (4.11)
Another important assessment in tunnelling design is the slope, which can be estimated
as the first derivative of the settlement trough as:
ω≈ t anω= s′
v =−Sv,max
i 2x exp
(
−x2
2i 2
)
=−
√
π
2
VLD2
4i 3x exp
(
−x2
2i 2
)
(4.12)
Figure 4.3 presents the relationship between maximum settlement Sv,max with the C /D
ratio in cohesive and granular soil for a tunnel with diameter D = 6m and VL = 0.5%. This
figure shows that the deeper the tunnel is, the smaller the maximum settlement Sv,max
at surface is. From Equation 4.2 and 4.3, it then follows that settlements are spread over
a larger surface area for a fixed volume loss.
Figure 4.4 shows the transverse settlement, horizontal displacement and the slope on the
surface in the case of tunnel with diameter D = 6m, at the depth z0 = 6m or C /D = 0.5 in
cohesive soil.
This figure agrees with the conclusion from Mair and Taylor (1999) that Sh,max occurs
at the position of the inflection points of the settlement trough. And as expected, the
maximum slope of surface settlement appears at the position of inflection points of the
settlement trough.
SUBSURFACE SETTLEMENT
Based on the results of centrifuge test and empirical data, Mair et al. (1993) showed that
the subsurface settlement profile also distributes as the Gaussian curve. The width of
settlement trough at the depth z depends on the depth of the tunnel z0 via a coefficient
K depending on depth as:
i = K (z0 − z) (4.13)

4
76 4. GROUND MOVEMENTS AND EFFECTS ON BUILDINGS
0 2 4 6 8 100
0.01
0.02
0.03
0.04
0.05
0.06
0.07
0.08
C/D
ma
xim
um
se
ttle
me
nt
sm
ax
cohesive soil
granular soil
(m)
Figure 4.3: Relationship between Sv,max and C /D with tunnel diameter D = 6m
0 5 10 15 20−4
−2
0
2
4
6
8
10
12
14
16x 10
−3
x(m)
settlement (m)
transverse settlement
horizontal displacement
slope
−4
−2
0
2
4
6
8
10
12
14
16x 10
−3
slope (m/m)
Figure 4.4: Surface settlement troughs and slope curve due to tunnelling

4.2. GROUND MOVEMENT DEFINITIONS AND RISK ASSESSMENT
4
77
Figure 4.5: The trough width parameter K for the subsurface settlement profiles above the tunnel in clays
(Mair et al., 1993)
with the K value is estimated as:
K =0.175+0.325(1− z/z0)
1− z/z0(4.14)
The trough width parameter K was derived from the analysis of observation data from
the Heathrow Express trial tunnel and the Jubilee Line Express project for the subsurface
settlements above the tunnel in clays as shown in Figure 4.5.
From Equations 4.6, 4.13 and 4.14, the maximum subsurface settlement can be esti-
mated as:Sv,max
R=
√
π
2
VL
0.175+0.325(1− z/z0)
R
z0(4.15)
where R is the tunnel radius.
The normalized maximum settlement against R/(z0−z) is shown in Figure 4.6. The curve
A is derived from Equation 4.13 with K=0.5. Curves B and C are derived from Equa-
tion 4.15 with volume loss VL = 1.4% and R/z0 = 0.1 and 0.06, respectively. This graph
also includes the field data from tunnels constructed in London clay. The plastic solu-
tion given by Taylor (1993) is also used to compare. It shows in this figure that the field
data is in agreement with these methods.
Other studies by Moh et al. (1996), Grant and Taylor (2000) and Jacobsz (2003) based on

4
78 4. GROUND MOVEMENTS AND EFFECTS ON BUILDINGS
(S
/
R(x
10
)
3v,
max
R/(z -z)0
R
Figure 4.6: Subsurface settlement above the tunnel center line (Mair et al., 1993)
Mair et al. (1993) proposed a limited change of K in various kinds of soil. Ahmed and
Iskander (2010) noted that the equation proposed by Mair et al. (1993) to predict subsur-
face settlement and horizontal displacement in clay yields acceptable results in sand as
well from the observation of the displacement inside transparent soil models.
4.2.2. RISK OF BUILDING DAMAGE ASSESSMENT
Assessing the impact of underground construction on existing structures in urban area
is important in design. Many studies have focused on the ground movements around
tunnelling and the settlement trough on the surface but research focused on the ground
movements that affect nearby buildings for a first assessment the stability of the build-
ings and the effect of tunnelling near existing deep foundation has only recently gained
interest in geotechnical studies. The affected area due to tunnelling should be estimated
in order to avoid the impact on the existing foundations.
The response of buildings due to tunnelling has been investigated by many authors
(Rankin, 1988; Boscardin and Cording, 1989; Mair et al., 1996; Franzius, 2004; Netzel,

4.2. GROUND MOVEMENT DEFINITIONS AND RISK ASSESSMENT
4
79
Table 4.1: Typical values of maximum building slope and settlement for damage risk assessment (Rankin, 1988)
Risk Cat-
egory
Maximum slope of
building
Maximum settlement
of building (mm)
Description of risk
1 Less than 1/500 Less than 10 Negligible; superficial damage unlikely
2 1/500 - 1/200 10-50 Slight; possible superficial damage which
is unlikely to have structural significance
3 1/200 - 1/50 50-75 Moderate; expected superficial damage
and possible structural damage to build-
ings, possible damage to relatively rigid
pipelines
4 Greater than 1/50 Greater than 75 High; expected structural damage to
buildings. Expected damage to rigid
pipelines, possible damage to other
pipelines
Table 4.2: Relationship between category of damage and limiting tensile strain (after Boscardin and Cording
(1989))
Category of damage Normal degree of severity Limiting tensile strain (%)
0 Negligible 0-0.05
1 Very slight 0.05-0.075
2 Slight 0.075-0.15
3 Moderate* 0.16-0.3
4 to 5 Severe and very severe >0.3*Note: Boscardin and Cording (1989) describe the damage corresponding to the tensile strain in the range 0.015− 0.3%as moderate to severe. However, none of the cases quoted by them exhibit severe damage for this range of strains. There is
therefore no evidence to suggest that tensile strains up to 0.3% will result in severe damage.
2009; Giardina, 2013). Table 4.1 shows the value of maximum slope and settlement for
the building with a category damage risk assessment proposed by Rankin (1988). The
Limiting Tensile Strain Method proposed by Boscardin and Cording (1989) has been
widely used in design. This method has four steps: prediction of the greenfield move-
ment; projection of greenfield ground movement on the building; determination of in-
duced building strains and classification of damage related to strain levels. The category
of damage and the relationship with limiting tensile strain are shown in Table 4.2. Bur-
land (1995) presented a damage category chart for horizontal strain and deflection ratio
in the case of L/H = 1 in line with the damage category in Table 4.2 in Figure 4.7.
Mair et al. (1996) proposed a three stage methodology for the assessment of risk of build-
ing damage induced by bored tunnelling as followings:
- Stage 1 - Preliminary Assessment: A building has a negligible risk of damage when its
settlement less than 10mm. It can be checked with an additional assessment with slope
exceeding 1/500.
- Stage 2 - Second Stage Assessment: The maximum tensile strain is calculated with the
green field conditions. Buildings are assumed to have no stiffness and follow the green
field settlement trough. The possible damage category is derived.
- Stage 3 - Detailed Evaluation: Detailed evaluation is carried out for buildings classified
in Stage 2 at risk of category 3 or greater. The calculation is carried out for structural
continuity, foundations and soil-structure interaction. If the building remains in dam-
age category 3 or greater, protective methods will be required.
The Eurocode 7 (NEN-EN 1997-1, 1997) also indicates limiting values for structural de-

4
80 4. GROUND MOVEMENTS AND EFFECTS ON BUILDINGS
Figure 4.7: Damage category chart for L/H = 1, hogging mode (Burland, 1995)
formations and foundation movements. In order to prevent the occurrence of a service-
ability limit state in open framed structures, infilled frames and load bearing or contin-
uous brick walls, the maximum acceptable relative rotations are in the range from about
1/2000 to about 1/300. For many structures in general, a maximum relative rotation of
1/500 is acceptable. An ultimate limit state of the relative rotation is about 1/150. For set-
tlements, the Eurocode 7 indicates that for total settlements up to 50mm are acceptable
and larger settlements can be acceptable if the relative rotations remain within accept-
able limits.
In this study, the value for category 1 in Table 4.1 which is the lowest damage category
to the building is used, setting the maximum slope of building ωmax = 1/500 and max-
imum settlement of building umax = 10mm. These allowable values are also applied in
the preliminary assessment in the three stage methodology for the assessment of risk
of building damage induced by bored tunnelling indicated in Mair et al. (1996) and Bur-
land et al. (2001) and in the acceptable range of the Eurocode 7. The influence of building
stiffness and the difference between sagging and hogging zones of the settlement trough
in this risk assessment is, therefore, not taken into account in this study.
4.3. EFFECTS OF THE C /D RATIO ON SURFACE SETTLEMENT
In designing a tunnel under existing structures, it is necessary to determine the extent
to which the building is influenced by the tunnel. The theoretical influence zone is of-
ten presented via the distance from the surface building with shallow foundation to the
tunnel axis. In this study, the relationship between the C /D ratio and this distance is
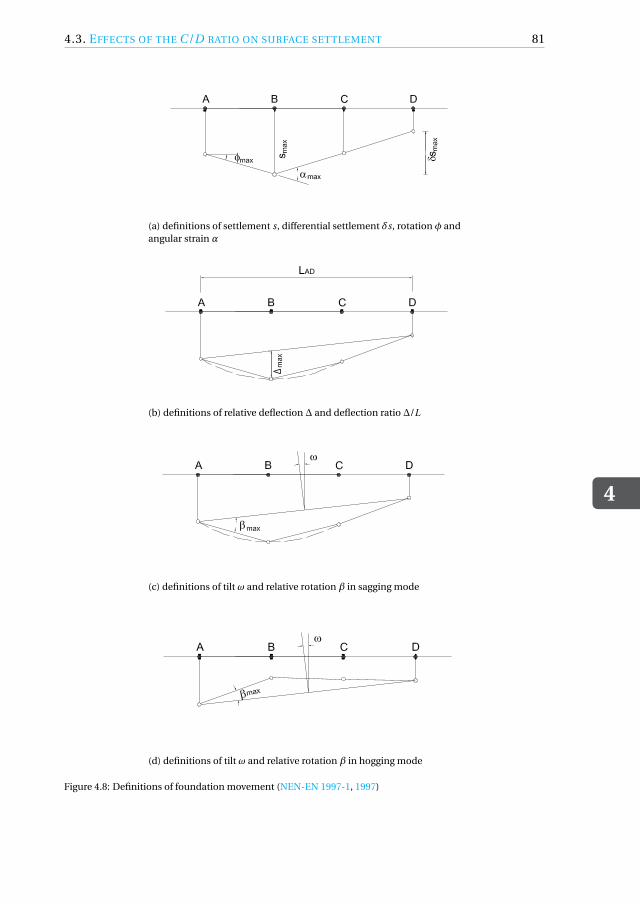
4.3. EFFECTS OF THE C /D RATIO ON SURFACE SETTLEMENT
4
81
(a) definitions of settlement s, differential settlement δs, rotation φ and
angular strain α
(b) definitions of relative deflection ∆ and deflection ratio ∆/L
(c) definitions of tilt ω and relative rotation β in sagging mode
(d) definitions of tilt ω and relative rotation β in hogging mode
Figure 4.8: Definitions of foundation movement (NEN-EN 1997-1, 1997)

4
82 4. GROUND MOVEMENTS AND EFFECTS ON BUILDINGS
Figure 4.9: Tunnel and existing surface buildings
estimated when the surface settlement reaches the allowable settlement umax = 10mm
and allowable slope ωmax = 1/500 corresponding with the risk category 1 in table 4.1.
Figure 4.9 illustrates this problem. The relation between the maximum allowable settle-
ment umax and the horizontal distance to the tunnel centre line x is given by:
umax = Sv,max exp
(
−x2
2i 2
)
=
√
π
2
VLD2
4iexp
(
−x2
2i 2
)
(4.16)
Solving this equation, the distance x from the building to tunnel axis corresponding with
settlement umax is:
x =
√
−2i 2 ln(umax
Sv,max) =
√
−2i 2 ln(umax i 4
p2
VLD2pπ
) (4.17)
Figure 4.10 shows the relationship between x/D and C /D ratios in the case of a tunnel
with diameter D = 6m in cohesive soil for various volume loss VL with the allowable set-
tlement umax = 10mm. The area inside the curve represents the zone where allowable
settlements are exceeded and the tunnel is too close to the building. This unsafe area is
also determined for particular values of VL . This figure indicates that for larger volume
loss, larger distances x and C /D ratios are required. With C /D and x/D inside the un-
safe area for volume loss VL = 0.5%, the surface settlement is larger than umax . On the
boundary of this area, the surface settlement equals umax . In the case of VL = 0.5%, it
also shows that with C /D ratio more than 1.25 the surface settlement is always less than
umax . With x/D from 0.522 to 0.57 or x from 3.1 to 3.4m there are two values of C /D ratio
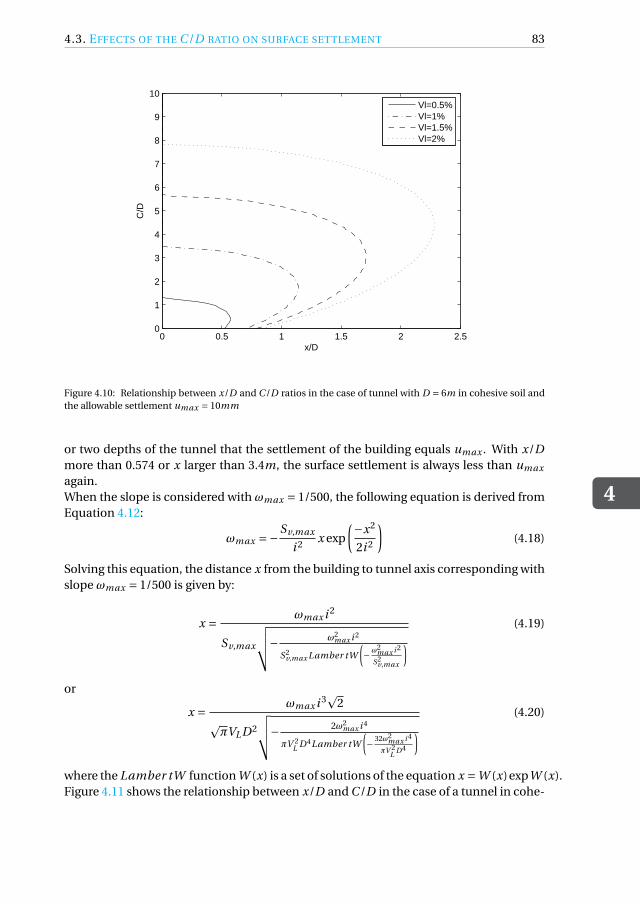
4.3. EFFECTS OF THE C /D RATIO ON SURFACE SETTLEMENT
4
83
0 0.5 1 1.5 2 2.50
1
2
3
4
5
6
7
8
9
10
x/D
C/D
Vl=0.5%Vl=1%Vl=1.5%Vl=2%
Figure 4.10: Relationship between x/D and C /D ratios in the case of tunnel with D = 6m in cohesive soil and
the allowable settlement umax = 10mm
or two depths of the tunnel that the settlement of the building equals umax . With x/D
more than 0.574 or x larger than 3.4m, the surface settlement is always less than umax
again.
When the slope is considered with ωmax = 1/500, the following equation is derived from
Equation 4.12:
ωmax =−Sv,max
i 2x exp
(
−x2
2i 2
)
(4.18)
Solving this equation, the distance x from the building to tunnel axis corresponding with
slope ωmax = 1/500 is given by:
x =ωmax i 2
Sv,max
√
√
√
√
− ω2max i 2
S2v,max Lamber tW
(
−ω2
max i 2
S2v,max
)
(4.19)
or
x =ωmax i 3
p2
pπVLD2
√
√
√
√
− 2ω2max i 4
πV 2L
D4Lamber tW
(
−32ω2
max i 4
πV 2L
D4
)
(4.20)
where the Lamber tW function W (x) is a set of solutions of the equation x =W (x)expW (x).
Figure 4.11 shows the relationship between x/D and C /D in the case of a tunnel in cohe-

4
84 4. GROUND MOVEMENTS AND EFFECTS ON BUILDINGS
0 0.1 0.2 0.3 0.4 0.5 0.6 0.70
0.5
1
1.5
x/D
C/D
D=2−allowable settlement 0.01mD=2−allowable slope angle 1/500D=3−allowable settlement 0.01mD=3−allowable slope angle 1/500
(a) D = 2 and 3m
0 0.1 0.2 0.3 0.4 0.5 0.6 0.70
0.5
1
1.5
x/D
C/D
D=4−allowable settlement 0.01mD=4−allowable slope angle 1/500D=5−allowable settlement 0.01mD=5−allowable slope angle 1/500
(b) D = 4 and 5m
0 0.1 0.2 0.3 0.4 0.5 0.6 0.70
0.5
1
1.5
2
2.5
3
3.5
4
4.5
5
x/D
C/D
D=6−allowable settlement 0.01mD=6−allowable slope angle 1/500D=7−allowable settlement 0.01mD=7−allowable slope angle 1/500
(c) D = 6 and 7m
0 0.1 0.2 0.3 0.4 0.5 0.6 0.7 0.8 0.90
0.5
1
1.5
2
2.5
3
3.5
4
4.5
5
x/D
C/D
D=8−allowable settlement 0.01mD=8−allowable slope angle 1/500D=9−allowable settlement 0.01mD=9−allowable slope angle 1/500
(d) D = 8 and 9m
Figure 4.11: Relationship between x/D and C /D with various tunnel diameter D in cohesive soil and VL = 0.5%
sive soil with allowable settlement of the building umax = 10mm and the allowable slope
ωmax = 1/500 and VL = 0.5% for various tunnel diameters D based on Equations 4.17
and 4.19. In this figure, it can be seen that the smaller the tunnel diameter D is, the
smaller the unsafe area due to allowable settlement umax is for a given volume loss VL .
In this case when the diameter D = 2 and 3m, the unsafe settlement area due to allow-
able settlement umax disappears altogether. Therefore, there exists a value of D that
Sv,max ≤ umax for any values of x and C . The settlement is maximum at the location
directly above the tunnel axis x = 0 and solving Equation 4.6 for Sv,max = umax yields the
diameter D0 where the maximum settlement is always less than umax , irregardless of the
cover. These D0 values are shown in Table 4.3. This table shows that this phenomenon
only occurs for tunnels at the diameters that are more applicable to microtunnelling
than TBM bored tunnels. This table also shows that the D0 value in the case of tun-
nelling in cohesive soils is significantly larger than in the case of tunnelling in granular
soils with the same volume loss VL .

4.4. EFFECTS OF THE C /D RATIO ON SUBSURFACE SETTLEMENT
4
85
Table 4.3: Diameter D0 value
Volume loss VL (%) Diameter D0(m)
Cohesive soil Granular soil
0.05 17.7 8.15
0.01 10.28 3.58
0.015 7.64 1.79
0.02 6.24 0
0.5 3.42 0
1 2.25 0
2 1.51 0
In Figure 4.11, when the tunnel diameter D is larger than 7m, the unsafe area where
the slope ωmax in governing always falls inside the area due to allowable settlement. It
means that with VL = 0.5%, in cohesive soil, and the tunnel diameter larger than 7m, the
allowable slope ωmax need not be assessed.
4.4. EFFECTS OF THE C /D RATIO ON SUBSURFACE SETTLEMENT
When tunnelling in urban areas, tunnels are sometimes designed below or near exist-
ing deep foundations. Therefore, the impact of subsurface settlement on foundations
should be investigated. The previous section takes only surface settlements into ac-
count. In the case of deep foundations, the settlement and slope assessments are similar
as in the case of surface settlement but assessed at the foundation depth Lp . In pile sys-
tems, the most important assessment is the ground movement at the tip of the pile due
to its effect on the bearing capacity of the pile (NEN-EN 1997-1, 1997). In general, the as-
sumption here is that the pile settles as much as the soil at the pile tip level. This implies
fully end-bearing piles. It is assumed that for piles which are only partially end-bearing,
the model presented here is conservative. Figure 4.12 shows the situation that the tunnel
is constructed near a pile.
As indicated in Section 4.2.1, the subsurface settlement profile distributes as the Gaus-
sian curve with the trough width as in Equation 4.13 and 4.14. Applying these values in
Equations 4.16 and 4.18, the distance x from the building to tunnel axis corresponding
with subsurface settlement umax and subsurface slope ωmax are determined.
Figure 4.13 shows the safe and unsafe areas in the case of a tunnel with diameter D = 6m,
and the pile foundation with depth Lp = 6m based on Equation 4.15 with VL = 0.5%. The
unsafe area also includes the zone where the pile tip would geometrically fall inside the
tunnel. According to Dias and Bezuijen (2015), the interaction is largest when the tunnel
is below the pile tips. This area is also indicated in Figure 4.13 as an area that needs spe-
cial attention. From Equation 4.17, the(
CD
)
0value such that settlement at the tip of the
pile is always less than umax for any distance to the tunnel centre line x can be estimated
as:
(
C
D
)
0
=0.65Lp
D+
√
π
8
VLD
umax−
1
2(4.21)

4
86 4. GROUND MOVEMENTS AND EFFECTS ON BUILDINGS
Figure 4.12: Tunnel and existing subsurface structures
x/D
0 0.1 0.2 0.3 0.4 0.5 0.6
C/D
0
0.5
1
1.5
2
2.5
3
maximum settlement umax
=0.01m
safe
pay attention
intersection line between tunnel lining and pile
unsafe
Figure 4.13: Relationship between C /D and x/D in the case of tunnel with D = 6m, and the depth of pile
Lp = 6m with VL = 0.5%

4.4. EFFECTS OF THE C /D RATIO ON SUBSURFACE SETTLEMENT
4
87
x/D
0 0.1 0.2 0.3 0.4 0.5 0.6 0.7
C/D
0
0.5
1
1.5
2
2.5
3
Lp
=6m
Lp
=8m
Lp
=10m
Lp
=12m
unsafe
safe
Figure 4.14: Relationship between C /D and x/D in the case of tunnel with D = 6m with various Lp with
VL = 0.5%
In Figure 4.13, the(
CD
)
0value equals 2.03. It also shows that for x/D from 0.32 to 0.57,
there are two values of C /D such that the settlement can reach umax . With x/D more
than 0.57, the settlement at the pile tip is always less than umax .
Figure 4.14 presents the safe and unsafe areas for various pile lengths Lp in the case of
a tunnel with D = 6m and VL = 0.5%. It is interesting to note that for various pile length
there exists a(
xD
)
0value such that the settlement of the pile tip is always less than umax ,
which is independent of the C /D ratio. In this case(
xD
)
0= 0.57. From Equation 4.17, the
value of(
xD
)
0can be estimated via the distance x0 from the building to tunnel centre axis
as (see Appendix B):
x0 =VLD2pπ
umax 4p
2e≈ 0.19
VLD2
umax(4.22)
Figure 4.15 shows the unsafe area of ground movement for the tunnel with D = 6m and
various umax /VL and C /D ratios. With particular values of C /D ratios, the smaller the
umax /VL ratio is, the larger the unsafe area of ground movements is. Meanwhile, when
the tunnel becomes deeper with the increase of C /D ratios , the unsafe area is wider.
Figure 4.16 shows unsafe areas for different D with VL = 0.5%. With the same C /D ratio,
the unsafe area increases with increasing tunnel diameter. With a moderate or deep tun-
nel the surface settlement or settlement near the surface is small. As mentioned above,
there is a distance x0 for a particular tunnel diameter D that the settlement due to tun-
nelling is always less than umax .
Figure 4.17 compares the safe areas as indicated by Kaalberg et al. (2005) and this study.
Kaalberg et al. (2005) carried out a data analysis of a trial test at the Second Heinenoord

4
88 4. GROUND MOVEMENTS AND EFFECTS ON BUILDINGS
0 0.5 1 1.5 2 3.5
3
2.5
2
1.5
1
0.5
0
x/D
z/D
umax
/VL
=0.2m
umax
/VL
=0.4m
umax
/VL
=1m
umax
/VL
=2m
Figure 4.15: Ground movement area for tunnel with D = 6m in cohesive soil
0 0.5 1 2.5
2
1.5
1
0.5
0
x/D
z/D
D=6m
D=8m
D=10m
Figure 4.16: Ground movement area for tunnel in cohesive soil with VL = 0.5%

4.5. CONCLUSION
4
89
Figure 4.17: Safe zones in comparing with Kaalberg et al. (2005)
tunnel where 63 driven piles, 90 surface settlement points, 29 subsurface points, and 11
inclinometers were measured over a period of 2 years in order to estimate the impact of
tunnelling on piles and pile toes. They also concluded that the safe distance between
the piles and tunnels should be more than 0.5D for varying volume loss. Meanwhile, the
safe area derived from this study depends on the distance, volume loss and the designed
allowable settlement of the building. This figure shows that the larger the allowable set-
tlement is, the closer the piles can be near the tunnel.
The unsafe zone A, as indicated by Kaalberg et al. (2005), mostly overlaps the zone where
umax /VL ≥ 0.4m and the intermediate zone B overlaps the zone where 0.04m ≤ umax /VL ≤0.4m. This indicates that the approach followed in this chapter and the results in the Fig-
ures 4.14 and 4.15 can be used to estimate the safe zone also for different combinations
of tunnel diameter, cover and soil conditions.
4.5. CONCLUSION
Based on the investigation into surface and subsurface settlement, the extent of safe
and unsafe areas due to tunnelling are presented, which will provide a preliminary as-
sessment for the design on the risk of damage for existing structures with an allowable
settlement umax and slope ωmax . For the surface settlement assessment, it shows that
the smaller the tunnel diameter D is, the smaller the unsafe area with an allowable set-
tlement umax is for a given volume loss VL . This study derives a D0 value such that for
D less than D0 the surface settlement is always less than the allowable settlement umax .
It is also found that with large diameter D, the assessment of allowable slope ωmax need
not be taken into account. For the subsurface settlement, the analysis derives influence
zones induced by shallow tunnelling based on allowable settlements umax , volume loss
VL and tunnel diameter D. It is also shown that the unsafe area is larger when the C /D
ratio increases. There exists a minimum distance x0 for a particular D that for larger
distances from existing structures the settlement is always less than umax . Depending
4
90 4. GROUND MOVEMENTS AND EFFECTS ON BUILDINGS
on the allowable settlement umax of the building, designers can determine the influence
zones of shield tunnelling on surface buildings or on deep or pile foundations.

5VOLUME LOSS IN SHALLOW
TUNNELLING
The best way to have a good idea is to have a lot of ideas.
Linus Pauling
Although volume loss has an important effect in estimating the ground movements due
to tunnelling in the design stage, this parameter is often determined by experience. This
makes it difficult to estimate the impact on volume loss when changing project parameters
like soil conditions, depth of the tunnel or sensitivity of the surroundings. This chapter in-
vestigates the relationship between volume loss and cover-to-diameter C /D ratio in shal-
low tunnelling. Based on a number of (empirical) relations from literature, such as the
stability number method and an analysis of the bentonite and grout flows, volume loss at
the face, along the shield and at the tail is determined. Long-term volume loss behind the
shield is also estimated by means of consolidation. In this way a band width of achievable
volume loss for future projects is derived.
This chapter is based on a paper that has been published in Tunnelling and Underground Space Technology
Vu et al. (2016b).
91

5
92 5. VOLUME LOSS IN SHALLOW TUNNELLING
5.1. INTRODUCTION
Tunnelling often leads to settlements of the soil surface due to over-excavation, soil re-
laxation and inefficient tail void filling. The magnitude of volume loss is influenced by
tunnelling management, characteristics of the tunnelling machines, and the geotechni-
cal conditions. In predictions of surface settlement (Peck, 1969) and subsurface settle-
ment (Mair et al., 1993), the volume loss is often determined by engineering experience
and data from previous cases. This makes it difficult to correctly assess the volume loss
for a future project under radically different conditions like a shallow depth of the tunnel
and/or very different soil parameters. A ground movement analysis in Chapter 4 shows
the important role of volume loss for settlement calculations and in predicting the ef-
fects on existing buildings induced by tunnelling. Especially for (very) shallow tunnels
near building foundations, the impact of changes in volume loss is large. This chapter
aims to estimate the volume loss when tunnelling with limited C /D ratios (i.e. less than
1) in various soils with a focus on slurry shield tunnelling.
On the basis of the studies by Attewell and Farmer (1974), Cording and Hansmire (1975)
and Mair and Taylor (1999), the volume loss in the tunnelling progress can be estimated
by the sum of the following components as shown in Figure 5.1:
- Volume loss at the tunnelling face (in Section 5.2): soil movement towards the excava-
tion chamber as a result of movement and relaxation ahead of the face, depending on
the applied support pressures at the tunnelling face;
- Volume loss along the shield (in Section 5.3): the radial ground loss around the tunnel
shield due to the moving soil into the gap between the shield and surrounding soil, which
can be caused by overcutting and shield shape. The bentonite used in the tunnelling face
flows into the gap, while the grout used in the shield tail also flows in the opposite direc-
tion. Due to the drop of bentonite and grout flow pressures in a constrained gap, soil can
still move into the cavity when the soil pressure is larger than the bentonite pressure or
grout pressure;
- Volume loss at the tail (in Section 5.4): when precast segments are placed, the advance
of the shield results an annular cavity between the segments and surrounding soil. Grout
is used in order to prevent surrounding soil moving into the gap. Volume loss at the tail
depends on applied grouting pressure at the tail and proper volume control, where high
grout volume and pressure may lead to local heave and low volume to increase settle-
ments as indicated in Figure 5.1;
- Volume loss behind the shield tail due to consolidation (in Section 5.4): in this void
along the tunnel lining, grout consolidates and forms a grout cake, and the stress changes
induced in the soil may lead to long-term consolidation settlements in soil volume above
the tunnel. Other causes of volume loss are shrinkage of grout and long-term lining de-
formations. However, their contributions to the total volume loss are small comparing
to the above factors.
The total volume loss VL in tunnelling progress can be given as:
VL =VL, f +VL,s +VL,t +VL,c (5.1)
where VL, f is volume loss at the tunnelling face, VL,s is volume loss along the shield, VL,t
is volume loss at the tail, and VL,c is volume loss due to consolidation.
To illustrate the impact of the different contributions in different soil conditions, esti-

5.2. VOLUME LOSS AT THE TUNNELLING FACE
5
93
Figure 5.1: Volume loss components
mates are made for a number of ideal soil profiles consisting of a single soil type with
most important properties as defined in Table 2.1.
5.2. VOLUME LOSS AT THE TUNNELLING FACE
When tunnelling, the soil ahead of the excavation chamber generally has the trend to
move into the cavity which is created by the tunnelling machine. The soil volume mov-
ing towards the face depends on the applied support pressures and can be controlled by
adjusting the support pressures. In the stability analysis for tunnelling in undrained co-
hesive soil, the stability number N proposed by Broms and Bennermark (1967) is widely
used. By studying the relationship between this stability number N and volume loss at
tunnelling face, Attewell et al. (1986), Mair et al. (1982), Mair (1989), Macklin (1999) and
Dimmock and Mair (2007) presented a method to determine the expected volume loss
based on observed data.
The stability number N is given by Equation 2.9 with qs = 0(kN /m) in the case of green
field:
N =γ (C +D/2)− s
cu
In shallow tunnelling, the support pressure at the tunnelling face should be high enough
to avoid the collapse to the excavation chamber but also limited to prevent blow-out and
fracturing. Firstly, the required support pressure must be higher than or at least equal
to the total of water pressure and horizontal effective soil pressure taking into account
three dimensional arching effects. The wedge model, which was studied by Anagnostou
and Kovári (1994), Jancsecz and Steiner (1994) and Broere (2001), is commonly applied

5
94 5. VOLUME LOSS IN SHALLOW TUNNELLING
0.4 0.6 0.8 1 1.2 1.4 1.6 1.8 20
50
100
150
200
250
300
350
400
450
C/D
supp
ort p
ress
ure(
kN/m
2 )
s
min
s0,t,max
s0,b,max
sfracturing
Figure 5.2: The range of support pressures at the tunnelling face of a tunnel with a diameter D = 6m in clay
to determine the minimum support pressure smi n . In the case of shallow tunnelling,
from Equation 2.18 the minimum support pressure smi n can be derived from the wedge
model, as follows:
smi n =σ,h+p =σ,
v K A3 +p = γ,zK A3 +p (5.2)
where p is pore pressure.
Secondly, the maximum support pressures are often estimated as to avoid blow-out with
the maximum support pressure at the top of the tunnel s0,t ,max and the maximum sup-
port pressure at the bottom of the tunnel s0,b,max and fracturing. According to Vu et al.
(2015d), the maximum support pressures in the case of blow-out are given by Equa-
tions 2.32 and 2.35 in Chapter 2.
In normally consolidated soil, according to Mori et al. (1991), the maximum pressure in
the case of fracturing is presented as:
s f =σ,v K +p + cu (5.3)
However, field data show that the higher allowable support pressures are often applied
in the tunnelling face, according to NEN-3650 (2012) and reports by BTL (Boren van Tun-
nels en Leidingen), in the Netherlands. Therefore, the support pressures boundaries are
determined with the minimum support pressure and the maximum support pressure in
the case of blow-out as indicated in Equations 2.32 and 2.35 above.
Figure 5.2 shows the relationship between the required support pressures and the C /D
ratio with the tunnel diameter D = 6m in clay. We will elaborate the calculation method
for these conditions and present overall results for different diameters and soil condi-
tions later in Figure 5.10. Only C /D ratios larger than 0.4 are studied, as less cover would

5.2. VOLUME LOSS AT THE TUNNELLING FACE
5
95
C/D0.4 0.6 0.8 1 1.2 1.4 1.6 1.8 2
N
0
0.2
0.4
0.6
0.8
1
1.2
1.4
1.6
1.8
2
with smin
with s0,t,max
with sfracturing
Figure 5.3: The range of stability number N for a tunnel with a diameter D = 6m in clay
lead to unreasonable large volume loss, and the upper 3 to 4 meter of soil in urban areas
are often taken up by various utilities and therefore would not be available for tunnelling.
The support pressures calculated here are the minimum support pressure from a wedge
model and the maximum support pressures for fracturing and blow-out at the top and
the bottom of the tunnel.
Figure 5.3 shows the calculated stability number N for these support pressures. Since
the applied support pressures are derived from the wedge stability model, fracturing
and blow-out conditions, N values in this figure are smaller than 2. It means that the
tunnelling face is stable with these support pressures.
O’Reilly (1988) indicated that a relation exists between the volume loss at tunnelling face
VL, f and the load factor LF , which is estimated by the ratio of working stability number
N and the stability number at collapse NTC , as follows:
LF =N
NTC(5.4)
where NTC is estimated from Equations 2.11 and 2.12 as:
For 0 ≤C /D ≤ 1:
NTC = 2+2ln
(
2C
D+1
)
For 1 ≤C /D ≤ 1.8:
NTC = 4ln
(
2C
D+1
)
Figure 5.4 shows the relationship between the load factor LF and the C /D ratio. The load

5
96 5. VOLUME LOSS IN SHALLOW TUNNELLING
C/D0.4 0.6 0.8 1 1.2 1.4 1.6 1.8 2
LF
0
0.1
0.2
0.3
0.4
0.5
0.6
with smin
with s0,t,max
with sfracturing
Figure 5.4: Relationship between load factor LF and C /D ratio for a tunnel with diameter D = 6m in clay
factor is less than 0.6 for the minimum support pressure and has the trend of reducing
when the C /D ratio increases. This means that the tunnel becomes safer with regards to
estimating the support pressures when the C /D ratio becomes larger.
From the analysis of case history data of the load factor LF and the volume loss at the
tunnelling face (Figure 5.5), Macklin (1999) presented a formula to calculate the volume
loss at the tunnelling face VL, f as:
VL, f (%) = 0.23e4.4LF (5.5)
Equation 5.5 can be used to convert the load factor LF to the volume loss VL, f estimates,
which leads to Figure 5.6. This shows the range of volume loss at the tunnelling face
VL, f with various C /D ratios for a tunnel with D = 6m in clay. In shallow tunnels with
0.4 ≤C /D ≤ 1 the range of possible volume loss VL, f is large, ranging from 0.12% to 3.1%.
This means that if tunnelling uses the minimum pressure in the excavation chambers,
the volume loss VL, f will increase significantly. Meanwhile, the volume loss VL, f in the
case of 1 ≤ C /D ≤ 2 ranges from 0.27% to 1.05%. The difference in volume loss VL, f
between the minimum pressure and maximum pressures due to blow-out and fracturing
is clearly reduced. Therefore, in the case of very shallow tunnels (C /D ≤ 1) the support
pressures applied at the tunnelling face should be kept near to the maximum pressure
in order to avoid increasing the volume loss.

5.3. VOLUME LOSS ALONG THE SHIELD
5
97
Figure 5.5: Volume loss VL and load factor LF (Macklin, 1999)
5.3. VOLUME LOSS ALONG THE SHIELD
The diameter of the cutting wheel in front of the TBM is often larger than the diame-
ter of the shield. This leads to an overcut when tunnelling (Figure 5.7). Also, the TBM
is often tapered, which creates a gap between the shield skin and the surrounding soil.
Additional gapping can also occur when the TBM moves in curves as indicated in Festa
et al. (2015). In this study, the effect of curves is not included. This gap is often filled
by bentonite, which flows from the tunnelling face and/or grout which comes from the
shield tail. In practice, the grout and bentonite pressures are often larger than the verti-
cal soil pressure at the tunnelling face and tail. From the observation of Bezuijen (2007),
there are three possible bentonite and grout flows that can occur along the shield when
tunnelling. Firstly, the bentonite flows from the tunnelling face to the tail and pushes the
grout at the joint between the tail and the TBM. Secondly, the grout flows from the tail to
the tunnelling face and pushes the bentonite away. Thirdly, the grout flows from the tail
to the tunnelling face and the bentonite also flows in the opposite direction. The flows
of bentonite and grout are also simulated in Nagel and Meschke (2011). In shallow tun-
nelling, due to the possibility of blow-out and fracturing, there is a limitation of applied
grout and bentonite pressures at the tunnelling face and the tail.

5
98 5. VOLUME LOSS IN SHALLOW TUNNELLING
C/D0.4 0.6 0.8 1 1.2 1.4 1.6 1.8 2
Vl(%
)
0
0.5
1
1.5
2
2.5
3
3.5
with smin
with s0,t,max
with s0,b,max
with sfracturing
Figure 5.6: Volume loss at tunnelling face for a tunnel with diameter D = 6m in clay
Figure 5.7: Bentonite and grout flows along the shield and lining segments

5.3. VOLUME LOSS ALONG THE SHIELD
5
99
Table 5.1: Input parameters of tunnel boring machine
Diameters of shield D 6,8 and 10m
Length-to-diameter P/D ratio of the shield 1
Reduction of shield diameter a 0.2%
Overcutting hover cut 0.015m
Shear strength of grout τg r outy 1.6kPa
Shear strength of bentonite τbentoni tey 0.8kPa
distance from tail (m)
0 1 2 3 4 5 6
gro
ut
pre
ssu
re (
kN/m
2)
0
20
40
60
80
100
120
140
grout pressure
bentonite pressure
soil pressure
smin
sfracturing
s0,t,max
VL=0.7% VL=0.64%
VL=0.56%
Figure 5.8: Bentonite and grout pressures along a shield with D = 6m in clay
According to Bezuijen (2007), both liquids, the grout in the shield tail and the bentonite
applied at the tunnelling face are assumed to behave as the Bingham liquids, such that
the yield stress is governing in the flow behaviour. The flow pressures in grout and ben-
tonite reduce along the shield as in Figure 5.7. The reduction of grout pressure along the
shield is given by:
∆p =∆x
w jτy (5.6)
where ∆p is the change of the pressure due to flow, ∆x is a length increment along the
TBM, w j is the joint width between the tunnel and the surrounding soil and τy is a shear
strength of the grout around the TBM.
In this section, the volume loss along the shield is calculated with input parameters as
indicated in Table 5.1 with the following approach. As an example, the calculation is car-
ried out case of tunnel with D = 6m and C /D = 0.75 in clay. Figure 5.8 shows the change
of grout pressure and bentonite pressure along the shield. It is assumed that when the
grout pressure and bentonite pressure are less than the vertical soil pressure, the soil is
moving into the cavity. The volume loss is estimated as the void volume that is filled by

5
100 5. VOLUME LOSS IN SHALLOW TUNNELLING
soil. The volume loss will not occur if the grout pressure and the bentonite pressure are
larger than the vertical soil pressure. In that case, the gap along the shield is assumed to
be completely filled by grout and bentonite. From this figure, the volume loss along the
shield depends on the bentonite pressure, which is applied at the tunnelling face and
the grout pressure at the tail. When the bentonite and grout pressures are equal to the
minimum required pressure as calculated in previous section, the volume loss will be
maximal. On the other hand, when the maximum allowable pressures are applied, there
is no volume loss along the shield under these assumptions.
In order to investigate the effect of grout pressure on the shield in different soils, we
assume the bentonite pressure applied at the tunnelling face is the average of the min-
imum support pressure and the maximum support pressure for fracturing. Figure 5.9
shows the change of volume loss with different tunnel diameters in various soils. When
the C /D ratio increases, the range of the volume loss along the shield VL,s is larger. With
a particular C /D ratio of the tunnel, the larger the tunnel diameter is, the smaller the
volume loss VL,s is with the constant overcut parameter of the shield. In the case of tun-
nelling in sand, the upper boundary of the volume loss VL,s increases nearly linearly with
the C /D ratio from 0.4 to 0.8, then becomes almost constant when the C /D ratio in-
creases whereas the lower boundary reduces linearly when the C /D ratio increases. This
also appears in the cases of tunnelling in clay and organic clay. At this point, basically,
the entire annulus is filled by the surrounding soil, leading to a maximum attainable
volume loss along the tail. In the case of tunnelling in peat, in the range of this anal-
ysis with 0.4 ≤ C /D ≤ 2, the upper boundary of the volume loss VL,s lightly rises and
the lower boundary linearly decreases. It is noted that the maximum upper boundary
volume loss along the shield VL,s is the same for a given tunnel diameter. Regardless of
soil conditions, for a tunnel with D = 6m, it follows that VL,s,max = 0.7%, with D = 8m,
VL,s,max = 0.57% and with D = 10m, VL,s,max = 0.5%.
Figure 5.10 shows the boundary of the volume loss along the shield VL,s in relationship
with C /D ratios for different tunnel diameters in different soils. The upper boundary for
0.4 ≤ C /D ≤ 0.6 corresponds to the case of tunnelling in peat in all three tunnel diam-
eters. When tunnelling with 0.6 ≤ C /D ≤ 1, the upper boundary is given by tunnelling
in organic clay and when tunnelling with the C /D ratio larger than 1, the upper bound-
ary becomes constant and depends on the tunnel diameter D. The maximum volume
loss along the shield VL,s is about 0.7% for D = 6m, VL,s,max = 0.57% for D = 8m and
VL,s,max = 0.5% for D = 10m. For the lower boundary, there is a decreasing trend of the
minimum volume loss along the shield VL,s when the C /D ratio increases. In the case of
D = 6m the maximum VL,s of the lower boundary is about 0.47% when C /D = 0.5. The
maximum volume loss along the shield VL,s of the lower boundary is about 0.38% with
D = 8m and 0.32% with D = 10m when C /D = 0.5. When C /D = 2, VL,s,max = 0.2% for
D = 6m, VL,s,max = 0.13% for D = 8m and VL,s,max = 0.09% for D = 10m.
5.4. VOLUME LOSS BEHIND THE SHIELD
When precast segments are placed, the advance of the shield results in an annular cav-
ity between the segments and the surrounding soil due to the shape of the TBM and
the overcut as discussed above. Grout is injected rapidly in order to prevent the sur-

5.4. VOLUME LOSS BEHIND THE SHIELD
5
101
C/D
0.2 0.4 0.6 0.8 1 1.2 1.4 1.6 1.8 2
vo
lum
e lo
ss(%
)
0
0.1
0.2
0.3
0.4
0.5
0.6
0.7
D=8
D=10
D=6
(a) in sand
C/D
0.2 0.4 0.6 0.8 1 1.2 1.4 1.6 1.8 2
vo
lum
e lo
ss (
%)
0.1
0.2
0.3
0.4
0.5
0.6
0.7
D=8
D=10
D=6
(b) in clayey sand
C/D
0.4 0.6 0.8 1 1.2 1.4 1.6 1.8 2
vo
lum
e lo
ss(%
)
0.1
0.2
0.3
0.4
0.5
0.6
0.7
D=8
D=10
D=6
(c) in clay
C/D
0.4 0.6 0.8 1 1.2 1.4 1.6 1.8 2
vo
lum
e lo
ss(%
)
0.25
0.3
0.35
0.4
0.45
0.5
0.55
0.6
0.65
0.7
D=8
D=10
D=6
(d) in organic clay
C/D
0.4 0.6 0.8 1 1.2 1.4 1.6 1.8 2
vo
lum
e lo
ss(%
)
0.4
0.45
0.5
0.55
0.6
0.65
0.7
D=8
D=10
D=6
(e) in peat
Figure 5.9: Volume loss along the shield in various soils

5
102 5. VOLUME LOSS IN SHALLOW TUNNELLING
C/D
0.4 0.6 0.8 1 1.2 1.4 1.6 1.8 2
vo
lum
e lo
ss(%
)
0.2
0.25
0.3
0.35
0.4
0.45
0.5
0.55
0.6
0.65
0.7
lower boundary
upper boundary
in peat
in sand
in clay
(a) D = 6m
C/D
0.4 0.6 0.8 1 1.2 1.4 1.6 1.8 2
vo
lum
e lo
ss(%
)
0.1
0.15
0.2
0.25
0.3
0.35
0.4
0.45
0.5
0.55
0.6
lower boundary
upper boundary
in peat
in sand
in clay
(b) D = 8m
C/D
0.4 0.6 0.8 1 1.2 1.4 1.6 1.8 2
vo
lum
e lo
ss(%
)
0.05
0.1
0.15
0.2
0.25
0.3
0.35
0.4
0.45
0.5
lower boundary
upper boundary
in peat
in sand
in clay
(c) D = 10m
Figure 5.10: Volume loss along the shield with different tunnel diameters

5.4. VOLUME LOSS BEHIND THE SHIELD
5
103
rounding soil to move into the gap. It is assumed that the void is filled by the grout. The
injected grout pressure induces the loading on the soil around the tunnel lining. This
might lead to immediate displacements and long-term consolidation of the soil. These
are two components of the volume loss behind the shield: the volume loss at the tail and
the volume loss due to consolidation.
5.4.1. VOLUME LOSS AT THE TAIL
When the grout is injected with high pressures at the tail, the ground around the tun-
nel will be deformed. In order to estimate the surface settlement induced by tunnelling,
there are some analytical solutions proposed by Sagaseta (1988); Verruijt (1997); Strack
(2002) based on cavity expansion and taking the influence of a free surface into account.
However, the effect of the range of support pressures has not taken into account in these
methods and resulting solutions, for instance expressed as a Laurent series expansion
in the case of Verruijt (1997), require an increasing number of terms for a stable numer-
ical integration if the distance between free surface and tunnel reduces. On the other
hand, the cavity expansion developed for the case of a cavity in infinite medium has
been implemented in tunnelling studies by Taylor (1993); Yu (2013) and results in far
more elegant and practical solution for a first estimate of the effect of grout pressures on
soil stresses and deformations around the TBM. To determine the effect of grouting at
the tail on volume loss at the tail and consolidation, in this study, the cavity expansion
method for tunnelling, which is proposed by Yu (2013), is therefore applied as a sim-
plified method. In this cavity-expansion theory, it is assumed that the soil around the
tunnel is a Tresca medium. The stresses in the soil and the settlement at the surface can
be calculated by the cavity-expansion theory. According to Yu (2013), the plastic zone
will deform around the tunnel wall, as can be seen in Figure 5.11, with the radius Rp of
the plastic zone estimated from the following equation:
Rp =D
2exp
( p0−sY
− k1+k
k
)
(5.7)
where p0 is the pre-tunnelling pressure; k = 1 or 2 corresponding to cylindrical or spheri-
cal cavity models; Y = 2cu or −2cu corresponding to the case of contraction or expansion
of the tunnel.
Similar to Yu (2013) and Taylor (1993), the pre-tunnelling pressure p0 can be estimated
as:
p0 = γ
(
C +D
2
)
(5.8)
The soil displacement us in the elastic zone is given by:
us =−Y r
2(k +1)G
(
Rp
r
)1+k
(5.9)
where r is the distance from the calculated point to the tunnel centre and G = E/2(1+ν)
is the shear modulus of soil.
The soil displacement us in the plastic zone is given by:
us =−Y
2(k +1)G
(
D
2r
)k D
2exp
(
(1+k)(p0 − s)
kY−1
)
(5.10)

5
104 5. VOLUME LOSS IN SHALLOW TUNNELLING
Figure 5.11: Deformations around a shallow tunnel at the tail
In this case, the effect of grouting pressures at the tail is analysed with a cylindrical cavity
model and is calculated with the minimum and maximum support pressures. Thus, in
Equation 5.7, k equals 1.
It can be assumed that the volume loss around the tunnel due to grouting at the tail
equals the volume of ground settlement at the surface. In order to identify the contri-
bution of soil deformation at the tail on the total volume loss, the displacement of the
ground surface is estimated. According to assumptions in Yu (2013), the tunnel will col-
lapse when the plastic zone expands to the ground surface. It means that when the tun-
nel is stable, the radial displacement of ground us at the surface is in the elastic zone and
can be calculated with Equation 5.9. It should be noted that the risk of fracturing is not
taken into account in this theory.
The surface settlement at the tail can be estimated from:
ut = us sinθ (5.11)
where θ is the angle between the calculated point to the tunnel centre and the horizontal
axis (see Figure 5.11).
The volume loss at the tail VL,t can be estimated as:
VL,t =Vs,t
π(D/2)2(5.12)
where Vs,t is the volume of the surface settlement due to grouting pressures at the tail
(see Figure 5.11).

5.4. VOLUME LOSS BEHIND THE SHIELD
5
105
C/D
0.4 0.6 0.8 1 1.2 1.4 1.6 1.8 2
vo
lum
e lo
ss a
t th
e t
ail
VL
,t(%
)
-1.2
-1
-0.8
-0.6
-0.4
-0.2
0
0.2
0.4lower boundary for D=10m
lower boundary for D=8mlower boundary for D=6m
upper boundary for D=10m
upper boundary for D=8m
upper boundary for D=6m
(a) in sand
C/D
0.4 0.6 0.8 1 1.2 1.4 1.6 1.8 2
vo
lum
e lo
ss a
t th
e t
ail
VL
,t(%
)
-1
-0.5
0
0.5lower boundary for D=10m
lower boundary for D=8mlower boundary for D=6m
upper boundary for D=10m
upper boundary for D=8m
upper boundary for D=6m
(b) in clayey sand
C/D
0.4 0.6 0.8 1 1.2 1.4 1.6 1.8 2
vo
lum
e lo
ss a
t th
e t
ail
VL
,t(%
)
-2
-1.5
-1
-0.5
0
0.5
1
lower boundary for D=10m
lower boundary for D=8mlower boundary for D=6m
upper boundary for D=10m
upper boundary for D=8m
upper boundary for D=6m
(c) in clay
C/D
0.4 0.6 0.8 1 1.2 1.4 1.6 1.8 2
vo
lum
e lo
ss a
t th
e t
ail
VL
,t(%
)
-2
-1
0
1
2
3
4
lower boundary for D=10m
lower boundary for D=8m
lower boundary for D=6m
upper boundary for D=10m
upper boundary for D=8m
upper boundary for D=6m
(d) in organic clay
C/D
0.4 0.6 0.8 1 1.2 1.4 1.6 1.8 2
vo
lum
e lo
ss a
t th
e t
ail
VL
,t(%
)
0
20
40
60
80
100
120
140
160
180
lower boundary for D=10m
lower boundary for D=8m
lower boundary for D=6m
upper boundary for D=10m
upper boundary for D=8m
upper boundary for D=6m
(e) in peat
Figure 5.12: Volume loss at the tail with different tunnel diameters in various soils

5
106 5. VOLUME LOSS IN SHALLOW TUNNELLING
Figure 5.12 shows the boundaries of the volume loss at the tail VL,t in various soils for
tunnels with D = 6,8 and 10m with the range of the support pressures from the vertical
soil stress to the maximum support pressure at the top of the tunnel derived from Equa-
tion 2.32. The figure shows that the larger the tunnel diameter is, the larger the range of
volume loss VL,t is. When the support pressure equals the vertical soil stress at the top
of the tunnel lining, there is a contraction in the cavity and this leads to positive values
of the lower boundary of volume loss at the tail. When a high support pressure is used,
the cavity will expand. The negative volume loss VL,t values indicate that the soil above
the tunnel lining is pushed upward and there might be heave at the ground surface. In
practice, this heave might not be observed because the settlement due to volume loss at
the tunnelling face and along the shield could be larger. When a high support pressure is
applied at the tail, a heave can occur in order to compensate the volume loss at the tun-
nelling face and along the TBM as can be seen in Figures 5.12a, 5.12b, 5.12c and 5.12d.
However, in the case of very shallow tunnelling, there is no heave due to the small margin
in the range of allowable support pressures as indicated in Figure 2.32. In Figure 5.12e,
when tunnelling in peat, the volume loss at the tail is positive with a high value, espe-
cially in the case of a tunnel diameter D = 10m. It means that shallow tunnelling with a
large diameter in peat might be difficult due to the large expected volume loss. This con-
clusion coincides with the conclusion indicated in Section 2.5 for the range of support
pressure for shallow tunnelling in peat with low C /D ratios.
Figure 5.13 shows the dependence of VL,t values on soils in various tunnel diameters.
When tunnelling in peat, the range of VL,t values is significantly large compared to tun-
nelling in sand, clay and organic clay, especially in the case of tunnels with large diame-
ters as indicated above.
5.4.2. VOLUME LOSS DUE TO CONSOLIDATION
For the volume loss due to consolidation, in the cavity behind the tail, two consolidation
processes occur along the tunnel lining. Firstly, the newly injected grout is consolidat-
ing and forms a consolidated grout cake in the cavity along the tunnel lining (Talmon
and Bezuijen, 2009). In the case of tunnelling in clay, the consolidation in grout might
not occur (Bezuijen and AM, 2005) and the length of liquid grout on the lining is much
longer. Although the grout pressure decreases along the lining, the injected grout may
flow along 2 to 3 following segments and the appearance of the grout cake will prevent
the movement of the soil above. It is often assumed that there is no volume loss in the
grout consolidating. The other volume loss is due to the subsequent shrinkage of grout,
which is estimated at about 0.06 to 0.1 percent of the grout volume (NEN-EN 1992-1-1,
1992; ACI-506R-05, 2005; Han et al., 2007). However, the contribution of this volume loss
to the total volume loss is small comparing to the other volume losses. This volume loss,
therefore, is not taken into account in this study.
The second process is the consolidation of the soil volume above the tunnel behind the
tail. When grout is applied at the tail, the soil stress in the above soil volume will change.
This will induce consolidation in the long term behind the tail. The volume loss due to
consolidation VL,c is derived from the consolidation settlement of the soil volume above
tunnel lining. In the case of tunnelling in sand, consolidation of soil will probably not
occur or be minimal. For tunnels in clay or peat, this may be a notable contribution.
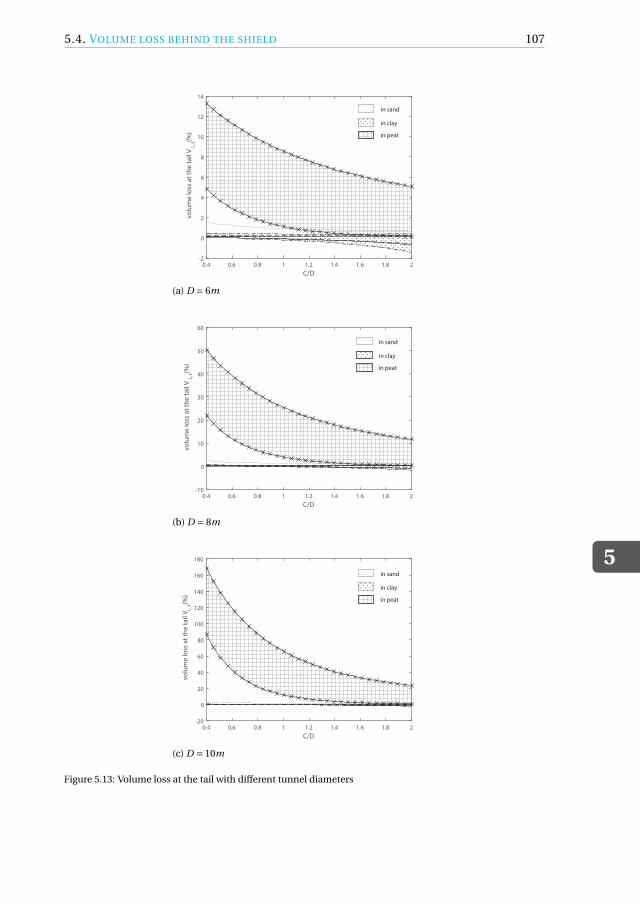
5.4. VOLUME LOSS BEHIND THE SHIELD
5
107
C/D
0.4 0.6 0.8 1 1.2 1.4 1.6 1.8 2
vo
lum
e lo
ss a
t th
e t
ail
VL
,t(%
)
-2
0
2
4
6
8
10
12
14
in peat
in sand
in clay
(a) D = 6m
C/D
0.4 0.6 0.8 1 1.2 1.4 1.6 1.8 2
vo
lum
e lo
ss a
t th
e t
ail
VL
,t(%
)
-10
0
10
20
30
40
50
60
in peat
in sand
in clay
(b) D = 8m
C/D
0.4 0.6 0.8 1 1.2 1.4 1.6 1.8 2
vo
lum
e lo
ss a
t th
e t
ail
VL
,t(%
)
-20
0
20
40
60
80
100
120
140
160
180
in peat
in sand
in clay
(c) D = 10m
Figure 5.13: Volume loss at the tail with different tunnel diameters
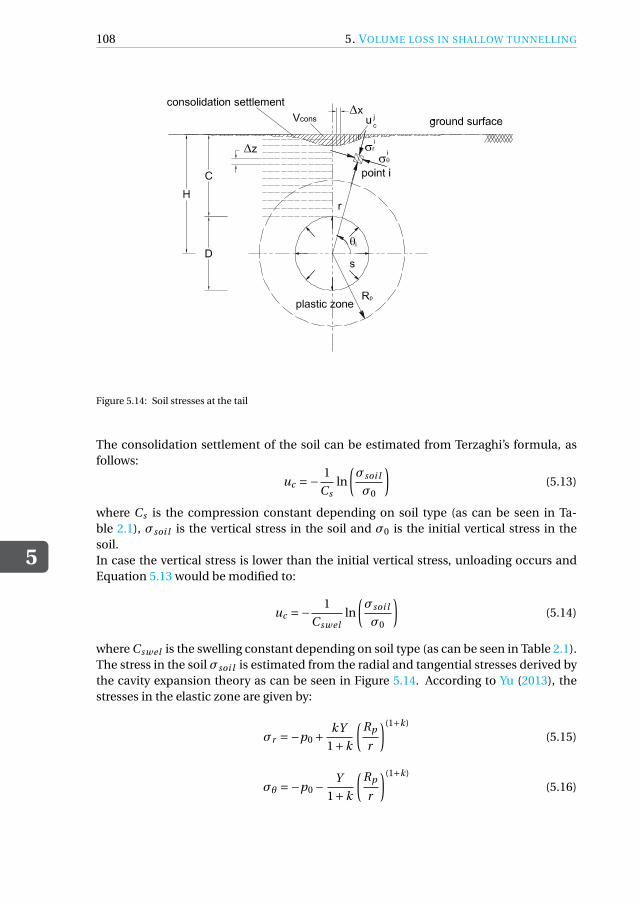
5
108 5. VOLUME LOSS IN SHALLOW TUNNELLING
Figure 5.14: Soil stresses at the tail
The consolidation settlement of the soil can be estimated from Terzaghi’s formula, as
follows:
uc =−1
Csln
(
σsoi l
σ0
)
(5.13)
where Cs is the compression constant depending on soil type (as can be seen in Ta-
ble 2.1), σsoi l is the vertical stress in the soil and σ0 is the initial vertical stress in the
soil.
In case the vertical stress is lower than the initial vertical stress, unloading occurs and
Equation 5.13 would be modified to:
uc =−1
Cswelln
(
σsoi l
σ0
)
(5.14)
where Cswel is the swelling constant depending on soil type (as can be seen in Table 2.1).
The stress in the soil σsoi l is estimated from the radial and tangential stresses derived by
the cavity expansion theory as can be seen in Figure 5.14. According to Yu (2013), the
stresses in the elastic zone are given by:
σr =−p0 +kY
1+k
(
Rp
r
)(1+k)
(5.15)
σθ =−p0 −Y
1+k
(
Rp
r
)(1+k)
(5.16)

5.4. VOLUME LOSS BEHIND THE SHIELD
5
109
distance to the tunnel axis(m)0 50 100 150 200 250 300
cons
olid
atio
n se
ttlem
ent(
m)
-0.025
-0.02
-0.015
-0.01
-0.005
0
0.005
lower boundary support pressureupper boundary support pressure
Figure 5.15: Consolidation settlement troughs when tunnelling in clay with D = 10m and C /D = 1
where σr and σθ are the radial and tangential stresses as shown in Figure 5.14.
In the plastic zone, the stresses are given by:
σr =−p0 +kY
1+k+kY ln
Rp
r(5.17)
σθ =−p0 −Y
1+k+kY ln
Rp
r(5.18)
In order to estimate the consolidation settlement, the soil volume above the tunnel lin-
ing is divided into n layers. The final consolidation settlement is derived by summing
deformations of these layers, which are calculated by Equations 5.13 and 5.14.
The final consolidation settlement is given by:
ujc =
n∑
i=1
u( j ,i )c ∆z (5.19)
where u( j ,i )c and ∆z(i ) are the deformation due to consolidation and the depth of the i th
layer at the j th location along the surface.
Figure 5.15 shows settlement troughs in the case of tunnelling in clay with a diameter
D = 10m and the ratio of C /D = 1, as an example. It can be seen that a heave and a set-
tlement can occur depending on what particular support pressure is applied.
By integrating the final consolidation settlements over the surface, the volume of con-
solidation settlement at the surface Vcons can be estimated as:
Vcons =m∑
j=1
u( j )c ∆x (5.20)
5
110 5. VOLUME LOSS IN SHALLOW TUNNELLING
where ∆x is a length increment along the surface consolidation settlement and m is the
increment number.
The volume loss due to consolidation settlement is then estimated as:
VL,c =Vcons
π(D/2)2(5.21)
Figure 5.16 shows the relationship between the consolidation volume loss VL,c and the
C /D ratio for tunnels with different diameters in clay, organic clay and peat. With 0.4 ≤C /D ≤ 1.3 in the case of tunnelling in clay and 0.4 ≤ C /D ≤ 1.7 in the case of tunnelling
in organic clay, it can be seen that the maximum support pressure applied at the tail
can lead to a heave on the surface. The volume loss due to consolidation VL,c when
maximum support pressure is applied becomes smaller than when minimum support
pressure is applied. An example shown in Figure 5.15 shows that the volume of consol-
idation settlement Vcons when applying lower boundary of support pressure is smaller
than the value of Vcons when applying the maximum support pressure. When the tunnel
is located at a deeper level, the volume loss VL,c when applying the maximum support
pressure is higher than the volume loss VL,c in the case of applying minimum support
pressure.
The dependence of the volume loss due to consolidation VL,c on soil type is shown in
Figure 5.17 for tunnels with diameters D = 6, 8, and 10m. It can be seen that the volume
loss VL,c in the case of tunnelling in peat is much higher compared to tunnelling in clay
and organic clay.
5.5. TOTAL VOLUME LOSS AND CASE STUDIES
5.5.1. TOTAL VOLUME LOSS
From Equation 5.1, the total volume loss is derived by summing the volume loss of tun-
nelling face, along the shield, at the tail and due to consolidation. Figures 5.18 and 5.19
show the total volume loss in the case of shallow tunnelling in sand and clayey sand. It
can be seen that the range of the total volume loss decreases with the increase of the
C /D ratio and the tunnel diameter D. In the case of a C /D ratio from 0.4 to 1, a volume
loss in shallow tunnelling of less than 0.5% can be achieved with the condition of careful
monitoring. The highest expected volume loss in this range of the C /D ratio is about
3.7% for tunnelling in sand and 5% for tunnelling in clayey sand when less optimal but
still stable support and grout pressures are applied. When the C /D ratio larger than 1,
the maximum volume loss is less than 1.5% with the range of support pressures in this
study. These figures also show that a result of no volume loss can be achieved when tun-
nelling with C /D ≥ 2.
Figure 5.20 shows the relationship between the total volume loss VL and C /D ratios when
tunnelling in clay. The total volume loss VL when tunnelling has just finished (not taking
into account the consolidation) is shown in Figure 5.20a. It can be seen that a total vol-
ume loss VL less than 0.5% after tunnelling is feasible even with C /D ≤ 1. This figure also
shows that for very shallow tunnelling with C /D ≤ 0.6, a tunnel with a large diameter has
a larger range of expected volume loss. With deeper tunnelling when 1 ≤ C /D ≤ 2, the
maximum value of the total volume loss reduces and becomes less than 2%.
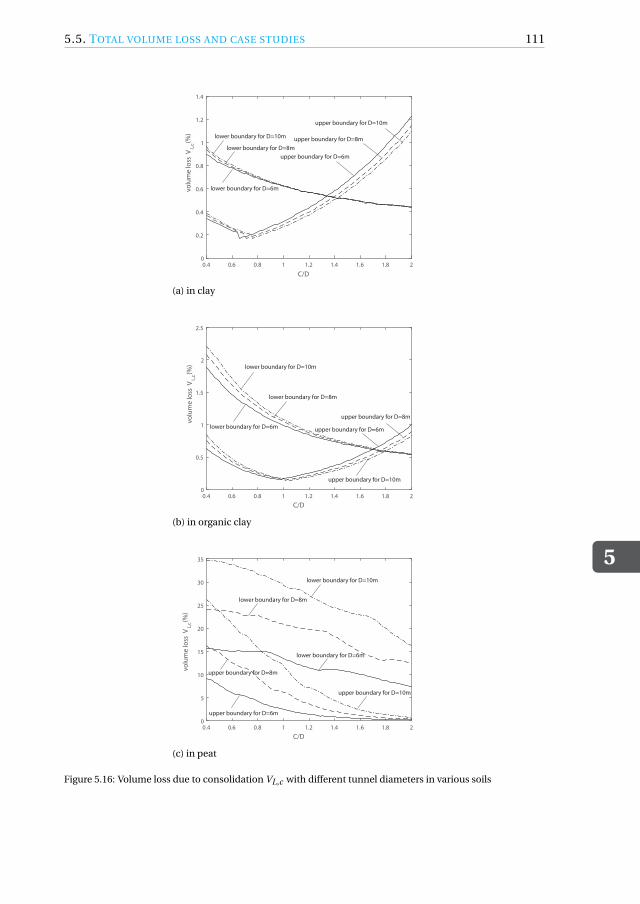
5.5. TOTAL VOLUME LOSS AND CASE STUDIES
5
111
0.4 0.6 0.8 1 1.2 1.4 1.6 1.8 20
0.2
0.4
0.6
0.8
1
1.2
1.4
upper boundary for D=10m
upper boundary for D=8m
upper boundary for D=6m
lower boundary for D=8m
lower boundary for D=10m
lower boundary for D=6mvo
lum
e lo
ss V
L,c
(%)
C/D
(a) in clay
0.4 0.6 0.8 1 1.2 1.4 1.6 1.8 20
0.5
1
1.5
2
2.5
upper boundary for D=10m
lower boundary for D=10m
lower boundary for D=8m
lower boundary for D=6m
upper boundary for D=8m
upper boundary for D=6m
vo
lum
e lo
ss V
L,c
(%)
C/D
(b) in organic clay
0.4 0.6 0.8 1 1.2 1.4 1.6 1.8 20
5
10
15
20
25
30
35
upper boundary for D=10m
lower boundary for D=10m
lower boundary for D=8m
lower boundary for D=6m
upper boundary for D=8m
upper boundary for D=6m
vo
lum
e lo
ss V
L,c
(%)
C/D
(c) in peat
Figure 5.16: Volume loss due to consolidation VL,c with different tunnel diameters in various soils

5
112 5. VOLUME LOSS IN SHALLOW TUNNELLING
0.4 0.6 0.8 1 1.2 1.4 1.6 1.8 20
2
4
6
8
10
12
14
16
in peat
in clay
in organic clay
vo
lum
e lo
ss V
L,c
(%)
C/D
(a) D = 6m
0.4 0.6 0.8 1 1.2 1.4 1.6 1.8 20
0.5
1
1.5
2
2.5
3
3.5
4
4.5
5
in peat
in clay
in organic clay
(b) D = 6m (in detailed)
0.4 0.6 0.8 1 1.2 1.4 1.6 1.8 20
5
10
15
20
25
in peat
in clay
in organic clay
vo
lum
e lo
ss V
L,c
(%)
C/D
(c) D = 8m
0.4 0.6 0.8 1 1.2 1.4 1.6 1.8 20
0.5
1
1.5
2
2.5
3
3.5
4
4.5
5
in peat
in clay
in organic clay
(d) D = 8m (in detailed)
0.4 0.6 0.8 1 1.2 1.4 1.6 1.8 20
5
10
15
20
25
30
35
in peat
in clay
in organic clay
vo
lum
e lo
ss V
L,c
(%)
C/D
(e) D = 10m
0.4 0.6 0.8 1 1.2 1.4 1.6 1.8 20
0.5
1
1.5
2
2.5
3
3.5
4
4.5
5
in peat
in clay
in organic clay
(f) D = 10m (in detailed)
Figure 5.17: Volume loss due to consolidation VL,c with various tunnel diameters

5.5. TOTAL VOLUME LOSS AND CASE STUDIES
5
113
C/D
0.4 0.6 0.8 1 1.2 1.4 1.6 1.8 2
tota
l vo
lum
e lo
ss(%
)
0
0.5
1
1.5
2
2.5
3
3.5
4
upper boundary for D=10m
upper boundary for D=8m
upper boundary for D=6m
lower boundary for D=10m
lower boundary for D=8m
lower boundary for D=6m
Figure 5.18: Total volume loss for tunnelling in sand with various diameter D
C/D
0.4 0.6 0.8 1 1.2 1.4 1.6 1.8 2
tota
l vo
lum
e lo
ss(%
)
0
0.5
1
1.5
2
2.5
3
3.5
4
4.5
5
5.5
upper boundary for D=10m
upper boundary for D=8m
upper boundary for D=6m
lower boundary for D=10m
lower boundary for D=8m
lower boundary for D=6m
Figure 5.19: Total volume loss for tunnelling in clayey sand with various diameter D

5
114 5. VOLUME LOSS IN SHALLOW TUNNELLING
C/D
0.4 0.6 0.8 1 1.2 1.4 1.6 1.8 2
tota
l vo
lum
e lo
ss(%
)
0
0.5
1
1.5
2
2.5
3
3.5
4
4.5
5
5.5
upper boundary for D=10m
upper boundary for D=8m
upper boundary for D=6m
lower boundary for D=10m
lower boundary for D=8m
lower boundary for D=6m
(a) not including consolidation of soil layers above the tunnel
C/D
0.4 0.6 0.8 1 1.2 1.4 1.6 1.8 2
tota
l vo
lum
e lo
ss(%
)
0
1
2
3
4
5
6
lower boundary for D=10m
upper boundary for D=10m
upper boundary for D=8m
upper boundary for D=6m
lower boundary for D=8m
lower boundary for D=6m
(b) including consolidation of soil layers above the tunnel
Figure 5.20: Total volume loss for tunnelling in clay with various diameter D

5.5. TOTAL VOLUME LOSS AND CASE STUDIES
5
115
Figure 5.20b shows the total volume loss VL for tunnelling with various diameters D = 6,8
and 10m in clay including consolidation of soil layers above the tunnel. It also follows
that the lower the C /D ratio is, the larger the range of volume loss is. The total vol-
ume loss of tunnelling in clay would be at maximum about 6% with D = 10m, 5.5% with
D = 8m and 5% with D = 6m when C /D = 0.4. The lower boundary corresponding with
the minimum support pressure applied has a reducing trend when the C /D ratio in-
creases. This means there might be a larger volume loss when the tunnel becomes shal-
lower. At the upper boundary of the total volume loss, corresponding with the maximum
support pressure applied, the final volume loss of tunnelling with D = 6m can reach just
over 0% after consolidation has been taken into account.
5.5.2. CASE STUDIES
Tables 5.2 and 5.3 show a summary of volume loss in case histories for tunnelling in
sand and clay with the C /D ratio less than 2. In Table 5.2, there are two case studies the
Ayshire Joint Drainage Scheme and WNTDC Lumb Brook Sewer, derived from the study
of O’Reilly and New (1982) and three case studies Second Heinenoord Tunnel, Botlek
Railway Tunnel and Sophia Railway Tunnel, derived from Netzel (2009). Table 5.3 shows
volume loss data from various projects all over the world including Madrid Metro Ex-
tension, Heathrow Express Trail Tunnel, Waterloo, Garrison Dam test tunnel, Baulos 25,
Barcelona Subway and London Transport Experimental Tunnel.
The data in Table 5.2 are plotted in Figure 5.21a in order to compare the volume loss de-
rived from this analysis to field data in the case of shallow to medium deep tunnelling
in sand. It can be seen that most of field data falls in the boundaries of volume loss in
Figure 5.21a.
Figure 5.21b shows the validation of the calculated volume loss to the field data in Ta-
ble 5.3 in the case of shallow tunnelling in clay. It also shows that all the field data is in
agreement with the boundaries of volume loss derived in this study. Only the Madrid
Metro Extension which is known as a successful tunnelling project has one data point
below the lower boundary of volume loss for a low C /D ratio.
The agreement between derived boundaries of volume loss in sand and clay and field
data shows that the approach of estimating volume loss in this study can successfully
predict volume loss in shallow tunnelling.

5
116 5. VOLUME LOSS IN SHALLOW TUNNELLING
C/D
0.4 0.6 0.8 1 1.2 1.4 1.6 1.8 2
tota
l vo
lum
e lo
ss(%
)
0
0.5
1
1.5
2
2.5
3
3.5
4
Ayrshire Joint Drainage Scheme
WNTDC Lumb Brook Sewer
Second Heinenoord Tunnel
Botlek Railway Tunnel
Sophia Railway Tunnel
lower boundary for D=10m
lower boundary for D=8m
lower boundary for D=6m
upper boundary for D=10m
upper boundary for D=8m
upper boundary for D=6m
(a) in sand
C/D
0.4 0.6 0.8 1 1.2 1.4 1.6 1.8 2
tota
l vo
lum
e lo
ss(%
)
0
0.5
1
1.5
2
2.5
3
3.5
4
4.5
5
5.5
Madrid Metro Extension
Heathrow Express Trail Tunnel
Waterloo
Garrison Dam test tunnel
Baulos 25
Barcelona Subway
London Transport experimental tunnel
lower boundary for D=10m
lower boundary for D=8m
lower boundary for D=6m
upper boundary for D=10m
upper boundary for D=6m
upper boundary for D=8m
(b) in clay
Figure 5.21: Validation for volume loss in shallow tunnelling
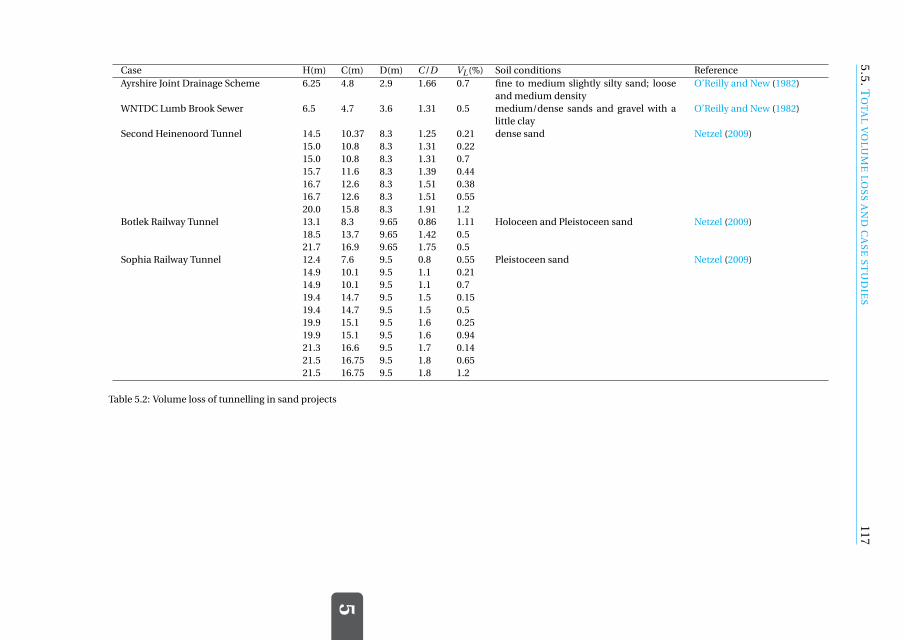
5.5
.T
OT
AL
VO
LU
ME
LO
SS
AN
DC
AS
ES
TU
DIE
S
5
11
7
Case H(m) C(m) D(m) C /D VL (%) Soil conditions Reference
Ayrshire Joint Drainage Scheme 6.25 4.8 2.9 1.66 0.7 fine to medium slightly silty sand; loose
and medium density
O’Reilly and New (1982)
WNTDC Lumb Brook Sewer 6.5 4.7 3.6 1.31 0.5 medium/dense sands and gravel with a
little clay
O’Reilly and New (1982)
Second Heinenoord Tunnel 14.5 10.37 8.3 1.25 0.21 dense sand Netzel (2009)
15.0 10.8 8.3 1.31 0.22
15.0 10.8 8.3 1.31 0.7
15.7 11.6 8.3 1.39 0.44
16.7 12.6 8.3 1.51 0.38
16.7 12.6 8.3 1.51 0.55
20.0 15.8 8.3 1.91 1.2
Botlek Railway Tunnel 13.1 8.3 9.65 0.86 1.11 Holoceen and Pleistoceen sand Netzel (2009)
18.5 13.7 9.65 1.42 0.5
21.7 16.9 9.65 1.75 0.5
Sophia Railway Tunnel 12.4 7.6 9.5 0.8 0.55 Pleistoceen sand Netzel (2009)
14.9 10.1 9.5 1.1 0.21
14.9 10.1 9.5 1.1 0.7
19.4 14.7 9.5 1.5 0.15
19.4 14.7 9.5 1.5 0.5
19.9 15.1 9.5 1.6 0.25
19.9 15.1 9.5 1.6 0.94
21.3 16.6 9.5 1.7 0.14
21.5 16.75 9.5 1.8 0.65
21.5 16.75 9.5 1.8 1.2
Table 5.2: Volume loss of tunnelling in sand projects

5
11
85
.V
OL
UM
EL
OS
SIN
SH
AL
LO
WT
UN
NE
LL
ING
Case H(m) C(m) D(m) C /D VL (%) Soil conditions Reference
Madrid Metro Extension 10.3 5.9 8.88 0.66 0.54 stiff clay Melis et al. (2002)
12.43 8 8.88 0.9 0.87
14.61 10.17 8.88 1.15 0.6
15.7 11.26 8.88 1.27 0.84
16.12 11.68 8.88 1.32 0.83
16.7 12.27 8.88 1.38 0.5
19.23 14.79 8.88 1.67 0.58
Heathrow Express Trail Tunnel 21 16.67 8.66 1.9 1.15 London clay Bowers et al. (1996)
Waterloo 11.7 8.45 6.5 1.3 1.1 London clay Harris et al. (1994)
Garrison Dam Test Tunnel 11 8.25 5.5 1.5 0.9 clay-shale and lignite Peck (1969)
Baulos 25 8.45 5.2 6.5 0.8 1.8 Frankfurt clay Macklin (1999)
Barcelona Subway 10 6 8 0.75 1.2 red and brown clay with some gravel Ledesma and Romero (1997)
London Transport Experimental Tun-
nel
10 7.9 4.15 1.91 1 dense sandy gravel overlain with made
ground of soft clay with sand and gravel
O’Reilly and New (1982)
Table 5.3: Volume loss of tunnelling in clay projects

5.6. CONCLUSION
5
119
5.6. CONCLUSION
Volume loss is a major parameter in the calculation of ground movement by tunnelling.
The range of attainable volume loss can be estimated by combining stability analysis at
tunnelling face, along and behind the shield. In this theoretical study, it is found that in
the case of tunnelling with C /D ≤ 1, the volume loss at the tunnelling face has a major
impact in total volume loss.
The volume loss along the shield can be optimized by selecting optimal bentonite and
grout pressures applied at tunnelling face and tail. The proposed calculation method
estimates attainable upper and lower boundaries of volume loss along the shield for a
particular tunnel.
This paper also presents methods to identify the volume loss behind the shield. The vol-
ume loss at the tail when tunnelling in peat has a large impact, especially in the case of
shallow tunnels (C /D ≤ 1). The volume loss behind the tail was estimated by the volume
loss due to shrinkage of grout and consolidation of above soil volume. The volume loss
due to consolidation depends on the surrounding soil and the C /D ratio.
The total volume losses for tunnelling in sand, clayey sand and clay are derived and have
a good agreement with case studies. Overall, the range of volume loss increases when
tunnelling with shallower overburden. By controlling the applied support pressure at
the tunnelling face and tail, the volume loss can be minimized. Still, a direct volume
loss around 1% is a reasonable minimum for very shallow tunnels (C /D = 0.4) where for
deeper tunnels no volume loss should be attainable. If pressure control is less optimal
but still controlled, a direct volume loss up to 5.5% is not unreasonable to expect for very
shallow tunnels.
Analysis also shows that consolidation after the TBM has passed can contribute consid-
erably to the final surface settlements and can be of this same order as direct volume
loss effects in clay and even larger in very soft soils like peat. This effect, however, is
more pronounced in deeper tunnels, where it could easily double the direct volume loss.


6IMPACT FACTORS OF INFLUENCE
ZONES
Now this is not the end. It is not even the beginning of the end. But it is, perhaps, the end
of the beginning.
Winston Churchill
The extent of the zone influenced by tunnelling majorly depends on the amount of over-
excavation and stress changes induced in the soil, normally represented as a value of vol-
ume loss. This chapter combines the upper and lower estimates of volume loss for differ-
ent soil conditions and cover-to-diameter ratios in order to identify the zones around the
tunnel influenced by tunnelling. These zones are dealt with risk categories of damage of
existing buildings in order to identify whether applying mitigating methods or taking ad-
ditional control measures during tunnelling would be needed for a safe and damage-free
tunnel construction. Effects of soil parameters on the influence zones are also investigated
to identify their impact and quantity of the requirements for mitigating measures.
This chapter is based on a paper under review in Tunnelling and Underground Space Technology Vu et al.
(2015b).
121

6
122 6. IMPACT FACTORS OF INFLUENCE ZONES
6.1. INTRODUCTION
One of the obstacles in the development of shallow tunnels in urban areas is the high
risk of damage on existing nearby buildings. Although the areas where nearby structures
are impacted were estimated in the studies of Kaalberg et al. (2005) and Selemetas et al.
(2005), which are based on analyses of empirical data, theoretical understanding on the
extent of influence zones induced by tunnelling is still limited. Chapter 2 investigates
the stability of tunnelling when reducing the C /D ratio and shows the limitations on
the range of the support pressure and the depth of the tunnel. Chapter 3 studies on the
structural deformation and tunnel lining parameters and derives the optimal depth of
the tunnel. In the analysis of ground movement in Chapter 4, the dependence of ground
movement on the volume loss and the impact of shallow tunnelling on buildings are de-
rived. The boundaries of volume loss in shallow tunnelling investigated in Chapter 5
depend on the support pressure, TBM machine parameters and the long-term consol-
idation. From these analyses, further study can be carried out by combining the the
boundaries of volume loss in Chapter 5 and the influence zones in Chapter 4 in order to
derive the boundaries of influence zones.
In this chapter, the impact of the range of volume loss in shallow tunnelling on ground
movement and buildings is investigated in Section 6.2 with different categories of dam-
age risk assessment and is also compared to some existing shallow tunnelling cases.
When shallow tunnelling in urban areas, in order to reduce the influence of tunnelling on
the buildings, ground improvement techniques are often applied. In Section 6.3, effects
of soil parameters on the relative influence distance x/D induced by shallow tunnelling
is also studied to identify possible ground improvement methods.
6.2. ON THE VARIATION OF INFLUENCE ZONES WITH DIFFER-
ENT CATEGORIES OF DAMAGE RISK ASSESSMENT
In order to estimate the impact of volume loss and the variation of the extent of the
zones affected by tunnelling in relation to the different damage categories, allowable
settlement values umax = 10, 50 and 75mm corresponding to the transitions between
categories I, II, and III of damage risk assessment in Table 4.1 are applied. The analysis
is carried out in the cases of tunnelling with diameters D = 6,8, and 10m.
Figure 6.1 shows the boundaries of relative influence distances from the tunnel axis
to surface buildings x/D and the C /D ratio in these categories of damage risk assess-
ment. In this figure, depending on the relative influence distances x/D, it is indicated
whether additional ground improvement and/or careful monitoring control is required,
or it should be possible to tunnel safely without additional measures. These relative in-
fluence distances are estimated for the three above risk categories.
Figure 6.2 shows the effects of tunnel diameters on the relative influence distances due to
tunnelling in clay for risk category I. In the case of C /D = 0.4 (the lowest C /D ratio value
in this study), if buildings are at a relative influence distance x/D less than 0.8, ground
treatment should be implemented. When the C /D ratio ranges from 0.8 to 2, careful
monitoring is required during the tunnelling progress. In the case of C /D ratios larger
than 1, surface buildings will normally deform less than umax = 10mm. As long as the
TBM is properly operated, from this figure, it can also be seen that even if the buildings

6.2. ON THE VARIATION OF INFLUENCE ZONES WITH DIFFERENT CATEGORIES OF DAMAGE
RISK ASSESSMENT
6
123
x/D
0 0.2 0.4 0.6 0.8 1 1.2 1.4 1.6 1.8
C/D
2
1. 8
1. 6
1. 4
1. 2
1
0. 8
0. 6
0. 4
lower boundary-catergory I
lower boundary-catergory II
lower boundary-catergory III
upper boundary-catergory I
I, II, III:
safe
I: care
II, III: safe
I: additional
II, III: safe
I: additional
II: care
III: safe
I: additional
II,III: care
(a) D=6m
x/D
0 0.2 0.4 0.6 0.8 1 1.2 1.4 1.6 1.8 2
C/D
2
1. 8
1. 6
1. 4
1. 2
1
0. 8
0. 6
0. 4
lower boundary-catergory I
lower boundary-catergory II
lower boundary-catergory III
upper boundary-catergory I
upper boundary-catergory II
I: care
II, III: safe
I, II, III:
safe
I,II: care
III: safe
I: additional
II,III: care
II: additional
(b) D=8m
x/D
0 0.5 1 1.5 2 2.5
C/D
2
1. 8
1. 6
1. 4
1. 2
1
0. 8
0. 6
0. 4
lower boundary-catergory I
lower boundary-catergory II
lower boundary-catergory III
upper boundary-catergory I
upper boundary-catergory II
upper boundary-catergory III
I: care
II, III: safe
I, II, III:
safe
I: additional
II: additional
III: additional
I,II: care
III: safe
II,III: care
(c) D=10m
Figure 6.1: Relative influence distances due to tunnelling in clay with Risk Categories I,II,III
additional: require additional ground improvement; care: require careful control; safe: safe area with allowable
settlement

6
124 6. IMPACT FACTORS OF INFLUENCE ZONES
x/D
0 0.5 1 1.5 2 2.5
C/D
2
1. 5
1
0. 5
D=6m
D=8m
D=10m
safe
care
additional
Figure 6.2: Relative influence distances due to tunnelling in clay for risk category I with various tunnel diame-
ter D
are directly above the tunnel, ground improvement methods may not be necessary for
tunnelling with an allowable settlement umax = 10mm with the C /D ratio larger than 1.
However, when the relative influence distance x/D is less than 2, careful control is nec-
essary.
In order to apply these results to shallow tunnelling, they should be compared to data ob-
served from existing tunnelling cases. The validation of the impact of shallow tunnelling
on ground movement in soft soils is shown in Figure 6.3 for relative influence distances
from the tunnel axis to the existing surface buildings. The observed settlement data in
shallow tunnelling cases described in Table 6.1 are taken from surface settlement trough
data. Since there is only a small number of existing tunnels which have C /D values lower
than 2 and detailed surface settlement monitoring data in order to validate, the discus-
sion here will provide recommendations for future shallow tunnelling.
- In Figure 6.3, the cases with observed settlements of more than 10mm are derived from
measuring points at or nearby the vertical axis of the tunnel where the surface settle-
ments reach the maximum values as indicated in Chapter 4. Settlements further away
from the tunnel axis in these projects, but still in the zone requiring attention are equal
or less than 10mm.
- Settlements of approximate 10mm are almost always recorded in the zone indicating
special care for projects where ground improvement methods were used and in the nor-
mally safe areas in the case of the Frankfurt and Heathrow tunnels, which were con-
structed without ground improvement.

6.2. ON THE VARIATION OF INFLUENCE ZONES WITH DIFFERENT CATEGORIES OF DAMAGE
RISK ASSESSMENT
6
125
x/D
0 0.5 1 1.5 2 2.5
C/D
2
1. 8
1. 6
1. 4
1.2
1
0. 8
0. 6
0. 4
observed settlement 10mm
observed settlement larger than 10mm
observed settlement less than 10mm
D=6m
D=8m
D=10m
B9: Barcelona 9
BS: Barcelona Subway
F: Frankfurt
MME: Madrid Metro Extention
MUL5: the new Milan Underground Line 5
RHA: Ramsgate Habour Approach tunnel
SHT: Second Heinenoord TunnelHETT: Heathrow Express Trial Tunnel
RHARHA RHA
BSBS BSBS
MME MMEMME
MUL5MUL5 MUL5
B9B9B9FF F
HETTHETT HETT
SHTSHT SHT
safecare
additional
Figure 6.3: Comparison of relative influence distances to shallow tunnelling cases
- For settlements less than 10mm, there are two observed cases, namely the Barcelona
Subway and the Madrid Metro Extension, where ground improvement methods were ap-
plied and followed with careful monitoring.
In the areas that additional measures are needed, Ramsgate Habour Approach tunnel
was constructed by Perforex pre-vaulting method combined with the fiberglass ground
improvement methods (Bloodworth, 2002). This tunnel has a C /D ratio of 0.41, but is
not strictly a bored tunnel.

6
12
66
.I
MP
AC
TF
AC
TO
RS
OF
INF
LU
EN
CE
ZO
NE
S
Tunnel D(m) C /D u(mm)x(m) x/D Construction
method
Soil type Ground improvement Reference
Barcelona Line 9 9.4 1.63 10 10.8 1.149 EPB machine Miocene material jet grouting, Gens et al. (2011)
9.4 1.63 11.1 10.7 0.7 compensation,
9.4 1.63 17.9 7.2 0.47 structural jacking
9.4 1.63 14.9 6.85 0.45
9.4 1.63 20.58 3.34 0.22
9.4 1.63 22.37 0.06 0
Barcelona Subway 8 0.75 0.24 17.4 2.2 - Stiff clay with gravel jet grouting Ledesma and Romero (1997)
8 0.75 0.34 15.41 1.93
8 0.75 1.3 6.5 0.83
8 0.75 1.5 8.5 1.06
8 0.75 10 4 0.5
8 0.75 23.4 0 0
Frankfurt 6.5 1.65 3.0 19.27 2.965 Shield with Frankfurt clay marl - Rowe and Kack (1983)
6.5 1.65 4.85 16.11 2.479 bolted
6.5 1.65 7.8 12.82 1.972 concrete
6.5 1.65 10 10.5 1.615 segments
6.5 1.65 12.8 9.652 1.48
6.5 1.65 20.9 6.433 0.99
6.5 1.65 28.6 3.257 0.5
6.5 1.65 32.1 0 0
Heathrow Express 8.5 1.735 0.91 27.64 3.25 Open face Stiff clay - Deane and Bassett (1995)
Trial Tunnel 8.5 1.735 2.83 18.87 2.22
8.5 1.735 5.82 14.98 1.76
8.5 1.735 8.19 13.22 1.56
8.5 1.735 10 12 1.41
8.5 1.735 12.54 10.85 1.28
8.5 1.735 16.54 8.93 1.05
8.5 1.735 18.71 8.29 0.9
8.5 1.735 26.65 6.33 0.74
8.5 1.735 34.34 3.97 0.47
8.5 1.735 36.66 2.92 0.34
8.5 1.735 38.84 1.04 0.12
Table 6.1: Distance x to tunnel center axis corresponding to settlement umax = 10mm in shallow tunnelling cases (continue in next page)

6.2
.O
NT
HE
VA
RIA
TIO
NO
FIN
FL
UE
NC
EZ
ON
ES
WIT
HD
IFF
ER
EN
TC
AT
EG
OR
IES
OF
DA
MA
GE
RIS
KA
SS
ES
SM
EN
T
6
12
7
Tunnel D(m) C /D u(mm)x(m) x/D Construction
method
Soil type Ground improvement Reference
Madrid Metro 8.88 1.12 0.57 17.2 1.94 EPB machine Stiff Tertiary layers - Gonzalez and Sagaseta (2001)
Extension 8.88 1.12 1.4 17 1.9
8.88 1.12 2.15 12.6 1.4
8.88 1.12 4.63 11.9 1.4
8.88 1.12 4.85 7.34 0.83
8.88 1.12 7.38 4.56 0.51
8.88 1.12 8.72 2.76 0.31
8.88 1.12 10 0 0
Milan Underground 6.7 1.59 0.322 21 3.134 EPB machine coarse-grained soil Grout injection Fargnoli et al. (2013)
Line 5 6.7 1.59 1.611 14.95 2.231
6.7 1.59 10 6.6 0.985
6.7 1.59 21 0 0
Ramsgate Habour 11 0.41 0.72 14.51 1.32 Perforex Weathered Chalk fiberglass Bloodworth (2002)
Approach tunnel 11 0.41 1.66 17.5 1.6 pre-vaulting
11 0.41 1.87 11 1 method
11 0.41 2.65 14.1 1.29
11 0.41 4.8 7.4 0.67
11 0.41 8.9 10.5 1
11 0.41 10 4 0.364
11 0.41 11.9 0 0
11 0.41 12.5 6.8 0.62
11 0.41 13.1 3.5 0.32
Second Heinenoord 8.3 1.91 1.41 29.2 3.52 Slurry machine Cohesive Holocene - Netzel (2009)
Tunnel 8.3 1.91 3 18.77 2.26 layers and sandy
8.3 1.91 5.26 14.56 1.76 Pleistocene layers
8.3 1.91 10 10.87 1.31
8.3 1.91 15.1 8.87 1.07
8.3 1.91 21.8 6.26 0.75
8.3 1.91 26.4 4.154 0.5
8.3 1.91 29.3 2 0.241
8.3 1.91 30.1 0 0
Table 6.1: Distance x to tunnel center axis corresponding to settlement umax = 10mm in shallow tunnelling cases

6
128 6. IMPACT FACTORS OF INFLUENCE ZONES
x/D
0 0.5 1 1.5 2
z/D
3
2. 5
2
1. 5
1
0. 5
0
lower boundary
upper boundary
(a) D=6m
x/D
0 0.5 1 1.5 2
z/D
3
2. 5
2
1. 5
1
0. 5
0
lower boundary
upper boundary
(b) D=8m
x/D
0 0.5 1 1.5 2
z/D
3
2. 5
2
1. 5
1
0. 5
0
lower boundary
upper boundary
(c) D=10m
Figure 6.4: Influence zones when shallow tunnelling in clay
In the investigation of subsurface influence zones, Figure 6.4 shows the boundaries
of the subsurface zones influenced by tunnelling in clay in the cases of C /D = 0.5,1,1.5
and 2 with diameters D = 6,8, and 10m and an allowable settlement umax = 10mm in
risk category I. In this zone, which is determined by lower and upper boundaries, careful

6.3. EFFECTS OF SOIL PARAMETERS ON INFLUENCE ZONES
6
129
0 0.5 1 1.5
2.5
2
1.5
1
0.5
0
x/D
z/D
umax
=10mm
umax
=20mm
umax
=25mm
umax
=35mm
2035
observed
movements in mm
Figure 6.5: Comparison of shallow tunnelling influence zones for the Barcelona Line 9 case
control and monitoring is required when tunnelling. If subsurface structures appear in
the zone from lower boundaries to tunnel axis, ground improvement methods are nec-
essary. The area outside from the upper boundaries is safe for subsurface structures. It is
shown that the larger the tunnel diameter is, the larger the influence zone is. Addition-
ally, when the tunnel becomes shallower with a smaller C /D ratio, the influence zone
reduces, the careful control area becomes smaller and the unsafe area becomes larger.
From this analysis, designers can decide the C /D ratio for a particular tunnel with or
without adding ground improvement methods to prevent unexpected deformations of
existing buildings.
Figure 6.5 shows the validation for the subsurface influence zone in the Barcelona 9 case
with C /D ≈ 1.6 and D = 9.4m at the level −9.5m (z/D ≈ 1). The observed settlement of
20mm at the distance x/D ≈ 0.6 is on the analysis graph. The maximum settlement of
subsurface curve is 35mm at the tunnel axis.
6.3. EFFECTS OF SOIL PARAMETERS ON INFLUENCE ZONES
In order to identify the method and quantity of ground improvement that should be
applied when tunnelling, the impacts of soil parameters on relative influence distances
x/D are investigated. In this study, the effects of the cohesion c, the friction angle φ and
the modulus of elasticity E on boundaries of influence zones are studied.
Figure 6.6 shows the dependence of the relative influence distance x/D on the cohesion
c in the case of tunnelling with D = 6m in soil with friction angle ϕ = 35o and elasticity

6
130 6. IMPACT FACTORS OF INFLUENCE ZONES
x/D
0 0.2 0.4 0.6 0.8 1 1.2 1.4 1.6 1.8
C/D
2
1. 5
1
0. 5
c=0kN/m2
,φ=35o
,E=12000kN/m2
c=7kN/m2
,φ=35o
,E=12000kN/m2
c=16kN/m2
,φ=35o
,E=12000kN/m2
c=21kN/m2
,φ=35o
,E=12000kN/m2
Figure 6.6: Effect of cohesion c on relative influence distance x/D in the case of tunnelling with D = 6m
modulus E = 12000kN /m2. When the cohesion c increases, the unsafe relative distance
x/D decreases. Moreover, it can also be seen that the gaps between lower boundaries
are larger than the gaps between upper boundaries. Based on this analysis, in the case
of tunnelling with a small C /D ratio, increasing the value of the cohesion c can be an ef-
fective method in order to reduce the relative influence distance x/D. When the value of
the cohesion c is approximate 21kN /m2, the lower boundary becomes 0 with C /D = 0.4.
It means that if ground treatment methods can improve the cohesion to 21kN /m2, the
risk of settlements more than 10mm can be limited, but with careful control on grouting
and support pressure still needed.
The effect of the friction angle ϕ on the relative influence distance x/D is shown in Fig-
ure 6.7. In this analysis, the friction angle ϕ is assessed in the range from 20o to 58o ,
which corresponds to the maximum friction angle of a grouted soil (Fujita et al., 1998)
for a tunnel in soil with cohesion c = 7kN /m2 and elasticity modulus E = 12000kN /m2.
It can be seen that when the friction angle ϕ increases, the relative influence distance
x/D becomes smaller. However, due to the limitation of increasing of the friction angle
ϕ further, a relative influence distance x/D will remain. Based on these results, increas-
ing the friction angle ϕ can be a useful method to reduce the relative influence distance
x/D.
Figure 6.8 shows an opposite impact of increasing the modulus of elasticity E on the
relative influence distance x/D due to tunnelling for a tunnel in soil with cohesion c =7kN /m2 and friction angle ϕ = 33o . This figure shows that the higher the value of the
elasticity modulus E is, the larger the relative influence distance x/D is. This is due to
the increasing heave at the tail, which leads to more compensation of the settlement of

6.3. EFFECTS OF SOIL PARAMETERS ON INFLUENCE ZONES
6
131
x/D
0 0.2 0.4 0.6 0.8 1 1.2 1.4 1.6 1.8 2
C/D
2
1. 8
1. 6
1. 4
1. 2
1
0. 8
0. 6
0. 4
c=7kN/m2
,φ=20o
,E=12000kN/m2
c=7kN/m2
,φ=32.7o
,E=12000kN/m2
c=7kN/m2
,φ=45.3o
,E=12000kN/m2
c=7kN/m2
,φ=58o
,E=12000kN/m2
Figure 6.7: Effect of friction angle ϕ on relative influence distance x/D in the case of tunnelling with D = 6m
x/D
0 0.2 0.4 0.6 0.8 1 1.2 1.4 1.6 1.8 2
C/D
2
1. 8
1. 6
1. 4
1. 2
1
0. 8
0. 6
0. 4
c=7kN/m2
,φ=33o
,E=5000kN/ m2
c=7kN/m2
,φ=33o
,E=10000kN/m2
c=7kN/m2
,φ=33o
,E=15000kN/m2
c=7kN/m2
,φ=33o
,E=20000kN/m2
Figure 6.8: Effect of modulus of elasticity E on relative influence distance x/D in the case of tunnelling with
D = 6m

6
132 6. IMPACT FACTORS OF INFLUENCE ZONES
x/D
0 0.2 0.4 0.6 0.8 1 1.2 1.4 1.6 1.8 2
C/D
2
1. 8
1. 6
1. 4
1. 2
1
0. 8
0. 6
0. 4
c=0kN/m2
,φ=35o
,E=20000kN/m2
c=2.33kN/m2
,φ=30o
,E=15000kN/m2
c=4.67kN/m2
,φ=25o
,E=10000kN/m2
c=7kN/m2
,φ=20o
,E=5000kN/ m2
Figure 6.9: Combination influence of soil parameters on relative influence distance x/D in the case of tun-
nelling with D = 6m
tunnelling and a reduction of the total volume loss. However, in practice, when increas-
ing the cohesion c value and friction angle ϕ value, the modulus of elasticity E of the soil
also increases. In this case, it follows that the volume loss at the tunnelling face can be
reduced but it is difficult to compensate any settlement at the tail.
Figure 6.9 shows the relationship between the C /D ratio and the relative influence dis-
tance x/D in the case of shallow tunnelling with diameter D = 6m with the combination
of changing all above soil parameters. With a given distance from the existing buildings
to the tunnel axis, required soil parameters can be estimated in order to achieve settle-
ments less than a given allowable settlement. It can be seen that although increasing
stiffness and strength has opposite impacts on the width of the influence zone, the com-
bination of these effects can lead to a reduction of the influence zone. On the basis of
this analysis, designers can choose suitable ground improvement methods and identify
quantities of ground treatment, for example, jet grouting, soil mixing and other mitigat-
ing measures.
6.4. CONCLUSION
By combining the upper and lower estimates of volume loss and ground movement anal-
ysis, the boundaries of influence zones induced by shallow tunnelling are derived both
for surface and subsurface in this chapter. The combination of influence zones with
different categories of risk damage assessment is investigated in order to identify the
zones where mitigating measures should be applied or careful monitoring is needed. Al-

6.4. CONCLUSION
6
133
though there is a small number of existing case studies, it is a good agreement between
the analysis results and observed data. In order to allow tunnelling in areas, which are
deemed to lead to too large surface settlements without additional measures (unsafe
zones), this chapter also shows that by improving soil properties, the boundaries of in-
fluence zones can be controlled. This analysis provides a theoretical basis to identify the
mitigating methods and the required quantity of soil improvement with the aim of safe
and damage-free tunnel construction.


7CONCLUSIONS AND
RECOMMENDATIONS
A good traveler has no fixed plans, and is not intent on arriving.
Lao Tzu
This dissertation investigates the effects of reducing the C /D ratio and estimates the limit
and/or optimal C /D ratio for shallow tunnelling in soft soils. Moreover, a theoretical ba-
sis for protective methods is proposed in order to optimize the tunnelling process. This
chapter synthesizes conclusions on the effects of shallow tunnelling and provides recom-
mendations for further research.
135

7
136 7. CONCLUSIONS AND RECOMMENDATIONS
7.1. CONCLUSIONS
Tunnels in urban areas are often designed well below the surface in order to reduce
the effects on nearby structures. This leads to increased construction costs because of
deep station boxes. Despite benefits such as lower construction costs and shorter travel-
ling time between the surface and platforms, what limits understanding of shallow tun-
nelling effects is a barrier to the development of shallow tunnels in cities. This study
firstly investigates the effects of reducing the C /D ratio and estimates the limits and/or
optimal C /D ratio for shallow tunnelling in soft soils. Based on this study, recommenda-
tions and solutions for improving the shallow tunnelling process have been proposed.
Reducing the C /D ratio of a shallow tunnel leads to many effects on the stability and
ground movements in the tunnelling process, the deformations of the tunnel lining and
the effects on existing nearby buildings.
Stability analysis
In the stability analysis for shallow tunnelling in this study, the range of the support pres-
sures has been estimated for various types of soils and C /D ratios. It is found that it is
possible to tunnel with a very low C /D ratio in sand, clayey sand, clay, or organic clay
by changing the thickness of the tunnel lining or by adding ballast weight. In the case
of tunnelling in peat, due to limitations in control of the margin between maximum and
minimum support pressures, a tunnel lining with the d/D ratio larger than 1/12 would
allow stable tunnel construction. The stability analysis for uplift has shown that it is pos-
sible to tunnel in sand, clayey sand, clay, organic clay but in the case of tunnelling in peat
deep cover or ballast layer is required.
In this dissertation, new models for blow-out calculations, which are more accurate
when applied to shallow tunnels, were proposed. The significant difference between
the required support pressures at the top, the spring line of tunnel and the bottom of the
tunnel in the case of shallow tunnels is taken into account. The new models in this study
are divided into the uniform support pressures and the linear support pressures at the
upper and the lower parts of the tunnel lining. The latter case includes the effect of the
reducing pressure in grouting flows. A comparison to a case study and centrifuge results
shows a good agreement between the maximum support pressures derived from the new
models and field and experimental data. Comparing to the recent models for the maxi-
mum support pressure due to blow-out, it is concluded that while the calculated result
in Balthaus’s model is somewhat exaggerated due to activating a large soil body above
the tunnel, Broere’s model is probably too conservative. The new models can avoid the
risk of blow-out at the top of the tunnel where only a thin soil layer above the tunnel is
present while higher support pressures can be used at the spring line and the bottom in
order to reduce the potential volume loss.
Structural analysis
The structural analysis in this study investigates the impact of cover on the tunnel lining
when the C /D ratio reduces. From this analysis, the change of the maximum bending
moments and deformations of the lining sections is estimated. An optimal C /D ratio for
a particular cross-section d/D ratio in tunnelling without ballast can be derived in vari-
ous soils by combining the structural analysis with the uplift analysis.
Commonly used models in the structural analysis for tunnels were proposed by Dud-
deck and Erdmann (1985). These models are only suitable for moderate and deep tun-

7.1. CONCLUSIONS
7
137
nels with C /D ≥ 2 as they assume a symmetric load on the tunnel lining. In the case of
shallow tunnels, the relative difference between the load at the top and the bottom of
the tunnel is significant. A new model proposed for calculating the internal forces and
deformations of the tunnel lining in this study is suitable in the case of shallow tunnels.
This model takes into account the change of the load on the tunnel lining in each par-
ticular point of the tunnel section. The analysis results derived from the new model for
a case study of Second Heinenoord Tunnel show an agreement with field data and other
numerical analysis. When the tunnel is at a deeper location, the internal forces and de-
formations of the tunnel lining calculated by this new model come close to the results by
Duddeck’s model.
Comparing to Duddeck’s model, while Duddeck’s model uses a symmetric load at the
top and the bottom and only radial springs for the soil-structure interaction and the
same stiffness for the springs, the new model takes into account the radial and tangen-
tial interaction between structure and soil and can show the difference of the soil load at
the top and the bottom of the tunnel. Moreover, the normalized internal forces and the
deformations of the tunnel lining in the structural analysis by Duddeck’s model become
smaller when the tunnel is designed at shallow locations, while these values increase sig-
nificantly in the case of with and without taking buoyancy in the new models. From the
structural analysis with the new models, it is also found that there is a minimum value of
the maximum deformations of the tunnel lining when changing the depth H of tunnels.
Ground movements
Tunnelling introduces ground movements which can lead to damage on existing nearby
buildings. In order to assess the impact of tunnelling, the ground movements around
the tunnel are investigated in this study. The ground movement analysis is carried out
with the first risk category as proposed by Rankin (1988) and for the preliminary stage
of risk assessment with the allowable settlement umax = 10mm and the allowable slope
wmax = 1/500 according to Mair et al. (1996). On the basis of this theoretical analysis,
the extent of the influence zones induced by shallow tunnelling were estimated.
This study proposes two models for assessing the impact of tunnelling on existing build-
ings for surface and subsurface settlements. From the extent of the influence zones,
designers can easily identify if existing buildings are in the zones affected by tunnelling
as a preliminary assessment. The influence zones for the subsurface settlement were
also derived by assessing the ground movements of subsurface structures, such as the
ground movements at the tip of piles.
The calculation models in this study can be applied to the preliminary assessment in
the three stage methodology of building damage risk assessment proposed by Mair et al.
(1996) and Burland et al. (2001). The allowable values of settlement and slope in this
study are adaptable with Eurocode 7. Comparing to Kaalberg et al. (2005) which indi-
cates that the safe distance between the piles and tunnels should be more than 0.5D
for various volume losses, the results in this study show that the extent of the influence
zones induced by tunnelling depends on the value of the umax /VL ratio. The unsafe zone
A, as indicated by Kaalberg et al. (2005), mostly overlaps the zone where umax /VL ≥ 0.4m
and the intermediate zone B overlaps the zone where 0.04m ≤ umax /VL ≤ 0.4m. This in-
dicates that the safe area derived from this study depends on the distance, volume loss
and the designed allowable settlement of the buildings and the approach followed in this

7
138 7. CONCLUSIONS AND RECOMMENDATIONS
dissertation can be used to estimate the safe zone also for different combinations of tun-
nel diameter, cover and soil conditions.
Volume loss
The analysis of ground movements in Chapter 4 shows that the extent of zones affected
by shallow tunnelling depends on the volume loss in the tunnelling process. The volume
loss in the tunnelling process includes the volume loss at the tunnelling face, along the
shield, at the tail and behind the shield due to the long-term consolidation settlement.
The upper and lower boundaries of volume loss are estimated for all these components
in this study.
In design, the value of volume loss is often taken from experience. No detailed calcula-
tion of volume loss along and behind the shield has been published yet. There is only a
method to calculate the volume loss at the tunnelling face by Macklin (1999) and Dim-
mock and Mair (2007) based on project data of tunnelling in London clay. This study
used this method in calculating the volume loss at the tunnelling face.
The volume loss along the shield is estimated from the shape of the TBM in Loganathan
(2011) or by numerical analysis in Nagel and Meschke (2011). For the volume loss behind
the shield, only the consolidation and the cake formation in grout behind the shield have
been investigated by Talmon and Bezuijen (2009). In this study, a model for calculating
the volume loss along the shield is developed based on the study of Bezuijen and Talmon
(2008) on the grout flow along the TBM. It is shown that the volume loss along the shield
not only depends on the shape of the overcutting of the TBM but also on the support
pressures at the tunnelling face and the tail. For the volume loss at the tail, a method to
calculate the surface settlement due to the support pressures is proposed based on the
cavity-expansion theory by Yu (2013). This also indicates that a high support pressure
can create heave at the tail in order to compensate to the total settlement. In calculating
the value of volume loss behind the tail, a method for estimating the long-term consoli-
dation settlement is proposed. Based on this method, the effect of consolidation on the
total volume loss is also derived.
From these models, volume loss estimated in this study is not only for the short-term in
the tunnelling process (at the tunnelling face, along the TBM and at the tail), but also
for the long-term consolidation settlement. The addition of consolidation settlement on
the volume loss has been studied in more detail in this dissertation. From a comparison
to field data, it shows that the approach proposed in this study can predict the volume
loss when shallow tunnelling.
It is also shown that controlling the applied support pressure at the tunnelling face and
tail can minimize the total volume loss. From the volume loss boundaries, a direct vol-
ume loss around 1% is the feasible volume loss for a very shallow tunnel with C /D = 0.4,
for deeper tunnels, no volume loss can be achievable. The boundaries of total volume
loss are also derived for both short-term tunnelling and long-term consolidation in this
study.
Influence zones
Applying the boundaries of volume loss to the ground movement analysis, the bound-
aries of the zones affected by shallow tunnelling are derived. On the basis of this analysis
results, designers can assess damages on existing nearby buildings induced by shallow
tunnelling.
7.2. RECOMMENDATIONS FOR FUTURE RESEARCH
7
139
The boundaries of influence zones are derived with different categories of damage risk
assessment. The effects of soil parameters on the extent of the zones affected by shallow
tunnelling is also investigated in this study. With existing nearby buildings and a given
tunnel design, the required soil parameters are estimated in order to reach allowable
settlements and slopes. These results, therefore, can be a theoretical basis for estimating
the amount of ground improvement needed in the case of tunnelling in soft clay or peat
by for example, permeation grouting and soil mixing.
Some case studies of shallow tunnelling with C /D ≤ 2 are used to corroborate the extent
of influence zones induced by tunnelling and the application of ground improvement
methods. However, the number of case studies is still small, especially the number of
cases with C /D ≤ 1 available. Therefore, these results are a first recommendation for the
design of very shallow tunnels in the future only.
In tunnel construction, the quantity of ground improvement has a large contribution to
the total cost. However, there are only recommendations for ground improvement or
reinforcement in tunnelling based on experience and success in prior projects but little
theoretical background for ground improvement in order to reduce the impact of tun-
nelling. Based on the impact analysis of soil parameters on the extent of zones affected
by tunnelling, this study shows a first theoretical analysis for estimating the quantity of
ground improvement that should be used in tunnelling in order to achieve the allowable
settlements and slopes.
7.2. RECOMMENDATIONS FOR FUTURE RESEARCH
In order to improve our understanding on shallow tunnelling, the following areas should
be further studied:
Stability analysis
The model in the uplift analysis in this study is a safe model which does not include soil
friction when the soil volume above the tunnel moves. A more detailed analysis could
include this effect.
Structural analysis
This dissertation investigates the impact of overburden on the tunnel lining. However,
the grouting pressure at the tail is often larger than the soil stress, and as the result, the
tunnel lining segments at the tail will experience larger loads due to the construction
process. Also, the impact of grouting pressures on the lining at the stage of construction
at the tail should be investigated.
Although underground structures are safer than surface structures in earthquakes, there
is still a risk for shallow tunnels. Case studies have been shown that shallow tunnels
seem to be vulnerable and unsafer comparing to deep tunnels. Moreover, in the case of
very shallow tunnels, dynamic surface loading due to vehicles also has a large impact
on the tunnel lining. Therefore, other loads such as seismic and dynamic surface load-
ing in the case of very shallow tunnel should be studied. As mentioned in Chapter 3,
the new model uses well established and commonly used design assumptions for the
loads acting on the tunnel lining. However, these assumptions are deemed conservative
and further study is recommended to improve these assumptions based on physical ev-
idence and measurements.
Ground movements
7
140 7. CONCLUSIONS AND RECOMMENDATIONS
As indicated in Chapter 5, this study focused on the preliminary stage of risk assessment
of damage on buildings due to tunnelling. More detailed assessment of the next two
steps in Mair et al. (1996) and Burland et al. (2001) should be studied such as the extent
of the sagging and hogging influence zones when reducing the C /D ratio and the impact
of the building stiffness.
Volume loss
The method of calculating the volume loss at the tunnelling face by Macklin (1999) in
this dissertation is based on the data analysis of tunnelling projects in London clay. The
volume loss at the tunnelling face in sand, soft clay, and peat should be investigated from
other projects in order to have more accurate results.
Overcutting and the shape of the TBM also affect the volume loss along the shield. In the
case of shallow tunnels which have a thin overburden, as the friction between soil and
TBM is small, the TBM could reduce the difference of the diameter between the TBM
and lining and the amount of overcutting. Therefore, an innovation of the TBM for shal-
low tunnelling could be investigated.
The occurrence of heave at the tail can compensate for the total settlement and reduce
the total volume loss. However, while the support pressure is assumed as a uniform sup-
port pressure at the tail in volume loss calculation in this dissertation, it changes along
the tunnel section in practice. A more detailed calculation for the influence of the change
of support pressure at the tail should be investigated.
In the study on the impact of the long-term consolidation settlement on volume loss,
only the final consolidation settlement is taken into account. The impact of the time in-
dependence of consolidation settlement should be studied.
Influence zones
This study investigated the effects of soil parameters on the boundaries of volume loss.
However, there is hardly any literature on estimating the quantity of grout that needs to
be injected into soils for improvement, which has a large contribution to construction
cost. Therefore, a further study on the effect and estimate of grouting to improve the soil
should be carried out.
Although many problems are listed for further study, this dissertation is the first investi-
gation of the impact of reducing the C /D ratio for shallow tunnels in soft soil. The models
and results in this study supply more understanding on the effects of shallow tunnelling
in soft soils and will help designers optimize shallow tunnelling in the future.

BIBLIOGRAPHY
ACI-506R-05 (2005). ACI-506R.Guide to Shotcrete. American Concrete Institute, Farm-
ington Hills, USA.
Ahmed, M. and Iskander, M. (2010). Analysis of tunneling-induced ground movements
using transparent soil models. Journal of Geotechnical and Geoenvironmental Engi-
neering, 137(5):525–535.
Ahrens, H., Lindner, E., et al. (1982). Zur dimensionierung von tunnelausbauten nach"
empfehlungen zur berechnung von tunneln im lockergestein, 1980". Bautechnik,
59(8&9).
Anagnostou, G. and Kovári, K. (1994). The face stability of slurry-shield-driven tunnels.
Tunnelling and Underground Space Technology, 9(2):165–174.
Atkinson, J. and Potts, D. (1977). Stability of a shallow circular tunnel in cohesionless
soil. Geotechnique, 27(2):203–215.
Attewell, P. and Farmer, I. (1974). Ground disturbance caused by shield tunnelling in a
stiff, overconsolidated clay. Engineering Geology, 8(4):361–381.
Attewell, P. and Woodman, J. (1982). Predicting the dynamics of ground settlement and
its derivitives caused by tunnelling in soil. Ground Engineering, 15(8).
Attewell, P. B., Yeates, J., and Selby, A. R. (1986). Soil movements induced by tunnelling
and their effects on pipelines and structures. Methuen, Inc., New York, NY.
Bakker, K. (2003). Structural design of linings for bored tunnels in soft ground. Heron,
48(1):33–64.
Bakker, K., Leendertse, W., Jovanovic, R., and van Oosterhout, G. (2000). Monitoring:
Evaluation of stresses in the lining of the second heinenoord tunnel. Geotechnical
Aspects of Underground Construction in Soft Ground. Balkema, Tokyo, Japan, pages
197–202.
Bakker, K. J. (2000). Soil retaining structures: development of models for structural anal-
ysis. PhD thesis, Delft University of Technology.
Balthaus, H. (1991). Tunnel face stability in slurry shield tunnelling. In Proceeding
12th International Conference on Soil Mechanics and Foundation Engineering, Rio de
Janeiro, 13–18 August 1989 V2, P775–778, volume 28, page A391. Pergamon.
Bezuijen, A. (2007). Bentonite and grout flow around a tbm. In Underground Space–
The 4th Dimension of Metropolises, Proceedings of the World Tunnel Congress 2007 and
33rd ITA/AITES Annual General Assembly, Prague, May 2007, page 383. CRC Press.
141

142 BIBLIOGRAPHY
Bezuijen, A. and AM, T. (2005). Grout properties and their influence on back fill grout-
ing. Geotechnical aspects of underground construction in soft ground. Amsterdam:
Balkema, pages 187–93.
Bezuijen, A. and Brassinga, H. E. (2006). Blow-out pressures measured in a centrifuge
model and in the field. Tunnelling: a decade of progress: GeoDelft 1995-2005, page
143.
Bezuijen, A. and Talmon, A. (2005a). Grout the foundation of a bored tunnel. Tunnelling.
A Decade of Progress. GeoDelft 1995-2005, page 95.
Bezuijen, A. and Talmon, A. (2005b). Monitoring and modelling during tunnel construc-
tion. Tunnelling. A Decade of Progress. GeoDelft 1995-2005, page 61.
Bezuijen, A. and Talmon, A. (2008). Processes around a tbm. In Proceedings of the 6th In-
ternational Symposium on Geotechnical Aspects of Underground Construction in Soft
Ground (IS-Shanghai 2008), pages 10–12.
Bezuijen, A., Talmon, A., Joustra, J., and Grote, B. (2006). Pressure gradients and muck
properties at the face of an epb. Proceeding of Geotechnical aspects of underground
construction in soft ground, pages 195–201.
Bezuijen, A. and van Seters, A. (2005). The stability of a tunnel face in soft clay. Tun-
nelling. A Decade of Progress. GeoDelft 1995-2005, page 149.
Blom, C. B. M. (2002). Design philosophy of concrete linings for tunnels in soft soils. PhD
thesis, Delft University of Technology.
Bloodworth, A. G. (2002). Three-dimensional analysis of tunnelling effects on structures
to develop design methods. PhD thesis, University of Oxford.
Boscardin, M. D. and Cording, E. J. (1989). Building response to excavation-induced
settlement. Journal of Geotechnical Engineering, 115(1):1–21.
Bosch, J. W. and Broere, W. (2009). Small incidents, big consequences. leakage of a build-
ing pit causes major settlement of adjacent historical houses. amsterdam north-south
metro line project. In Safe Tunnelling for the City and Environment: ITA-AITES World
Tunnel Congress, 23-28 May 2009, Budapest, Hungary. Hungarian Tunneling Associa-
tion.
Bowers, K., Hiller, D., and New, B. (1996). Ground movement over three years at the
heathrow express trial tunnel. In Proceedings of the international symposium on
geotechnical aspects of underground construction in soft ground, London, pages 557–
562.
Brassinga, H. and Bezuijen, A. (2002). Modelling the grouting process around a tun-
nel lining in a geotechnical centrifuge. In Proceedings of the International Confer-
ence on Soil Mechanics and Geotechnical Engineering, volume 2, pages 1455–1458. AA
BALKEMA PUBLISHERS.
BIBLIOGRAPHY 143
Broere, W. (2001). Tunnel Face Stability & New CPT Applications. PhD thesis, Delft Uni-
versity of Technology.
Broere, W., Faassen, T., Arends, G., and van Tol, A. (2007). Modelling the boring of curves
in (very) soft soils during microtunnelling. Tunnelling and underground space tech-
nology, 22(5):600–609.
Broms, B. B. and Bennermark, H. (1967). Stability of clay at vertical openings. Journal of
Soil Mechanics & Foundations Div.
Burland, J. (1995). Assessment of risk of damage to buildings due to tunnelling and exca-
vation. Imperial College of Science, Technology and Medicine.
Burland, J. B., Standing, J. R., and Jardine, F. M. (2001). Building response to tunnelling:
case studies from construction of the Jubilee Line Extension, London, volume 200.
Thomas Telford.
Celestino, T., Gomes, R., and Bortolucci, A. A. (2000). Errors in ground distortions due
to settlement trough adjustment. Tunnelling and Underground Space Technology,
15(1):97–100.
Chambon, P. and Corté, J.-F. (1994). Shallow tunnels in cohesionless soil: stability of
tunnel face. Journal of Geotechnical Engineering.
Cording, E. J. and Hansmire, W. (1975). Displacements around soft ground tunnels. In
5th Pan American Congress on Soil Mechanics and Foundation Engineering, volume 4,
pages 571–633, Buenos Aires.
Davis, E., Gunn, M., Mair, R., and Seneviratne, H. (1980). The stability of shallow tunnels
and underground openings in cohesive material. Geotechnique, 30(4).
Deane, A. and Bassett, R. (1995). The heathrow express trial tunnel. Proceedings of the
ICE-Geotechnical Engineering, 113(3):144–156.
Dias, T. G. S. and Bezuijen, A. (2015). Data analysis of pile tunnel interaction. Journal of
Geotechnical and Geoenvironmental Engineering, 141(12):04015051.
Dimmock, P. S. and Mair, R. J. (2007). Estimating volume loss for open-face tunnels in
london clay. Proceedings of the ICE-Geotechnical Engineering, 160(1):13–22.
Do, N. A., Dias, D., Oreste, P., and Djeran-Maigre, I. (2014). A new numerical approach to
the hyperstatic reaction method for segmental tunnel linings. International Journal
for Numerical and Analytical Methods in Geomechanics.
Duddeck, H. (1988). Guidelines for the design of tunnels. Tunnelling and Underground
Space Technology, 3(3):237–249.
Duddeck, H. and Erdmann, J. (1985). Structural design models for tunnels in soft soil.
Underground Space;(United States), 9.

144 BIBLIOGRAPHY
Einstein, H. H. and Schwartz, C. W. (1979). Simplified analysis for tunnel supports. Jour-
nal of Geotechnical and Geoenvironmental Engineering, 105(ASCE 14541).
Fargnoli, V., Boldini, D., and Amorosi, A. (2013). Tbm tunnelling-induced settlements in
coarse-grained soils: The case of the new milan underground line 5. Tunnelling and
Underground Space Technology, 38:336–347.
Farrell, R., Klar, A., Mair, R., et al. (2012). Tunnels in sands: the effect of size, depth and
volume loss on greenfield displacements. Géotechnique, 62(5):385–399.
Festa, D. (2015). On the Interaction between a Tunnel Boring Machine and the Surround-
ing Soil. TU Delft, Delft University of Technology.
Festa, D., Broere, W., and Bosch, J. (2015). Kinematic behaviour of a tunnel boring ma-
chine in soft soil: Theory and observations. Tunnelling and Underground Space Tech-
nology, 49:208–217.
Franzius, J. N. (2004). Behaviour of buildings due to tunnel induced subsidence. PhD
thesis, University of London.
Fujita, Y., Ishimaru, R., Hanai, S., and Suenaga, Y. (1998). Study on internal friction angle
and tensile strength of plain concrete. Proceedings of fracture mechanics of concrete
structures FRAMCOS, 3:325–334.
Gemeente-Amsterdam (2009). Geotechnical base report alternative design deep stations
and risk assessment bored tunnel. Technical report, Projectbureau Noord/Zuidlijn.
Gens, A., Di Mariano, A., and Yubero, M. (2011). Epb tunneling in deltaic deposits: obser-
vations of ground movements. In 7th International Symposium Geotechnical Aspects
of Underground Construction in Soft Ground.
Giardina, G. (2013). Modelling of settlement induced building damage. PhD thesis, Ph.
D. thesis, Delft Univ. of Technology, Delft, Netherlands.
Gonzalez, C. and Sagaseta, C. (2001). Patterns of soil deformations around tunnels. ap-
plication to the extension of madrid metro. Computers and Geotechnics, 28(6):445–
468.
Grant, R. and Taylor, R. (2000). Tunnelling-induced ground movements in clay. Proceed-
ings of the ICE-Geotechnical Engineering, 143(1):43–55.
Groeneweg, T. (2007). Shield driven tunnels in ultra high strength concrete: reduction of
the tunnel lining thickiness. PhD thesis, MSc Thesis, Delft University of Technology,
The Netherlands.
Han, Y.-w., Zhu, W., Zhong, X.-c., and Jia, R. (2007). Experimental investigation on
backfill grouting deformation characteristics of shield tunnel in sand. Underground
Space—The, 4:303–306.

BIBLIOGRAPHY 145
Harris, D., Mair, R., Love, J., Taylor, R., and Henderson, T. (1994). Observations of ground
and structure movements for compensation grouting during tunnel construction at
waterloo station. Geotechnique, 44(4):691–713.
Hashimoto, T., Nagaya, J., Konda, T., and Tamura, T. (2002). Observation of lining pres-
sure due to shield tunneling. Geotechnical aspects of underground construction in soft
ground, IS-Toulouse, pages 119–124.
Hoefsloot, F. (2001). Waterspanningen voor het boor- front: een eenvoudig geohydrolo-
gisch model. Geotechniek oktober, pages 26–33.
ITA-Group2 (2000). Guidelines for the design of shield tunnel lining. Tunnelling and
Underground Space Technology, 15(3):303–331.
Jacobsz, S. W. (2003). The effects of tunnelling on piled foundations. PhD thesis, Univer-
sity of Cambridge.
Jancsecz, S. and Steiner, W. (1994). Face support for a large mix-shield in heterogeneous
ground conditions. In Tunnelling’94. Papers presented at seventh International Sym-
posium ’Tunnelling’94’, held 5-7 July 1994, London.
JSSMFE (1993). Underground Construction in Soft Ground in Japan. Japanese Society of
Soil Mechanics and Foundation Engineering.
Kaalberg, F., Teunissen, E., Van Tol, A., and Bosch, J. (2005). Dutch research on the impact
of shield tunnelling on pile foundations. In Proceeding of the International Conference
on Soil Mechanics and Geotecnical Engineering, volume 16, page 1615. AA Balkema.
Kanayasu, S., Kubota, I., and Shikibu, N. (1995). Stability of face during shield tunneling–
a survey of japanese shield tunneling. Underground Construction in Soft Ground,
pages 337–343.
Kimura, T. and Mair, R. (1981). Centrifugal testing of model tunnels in soft clay. In Pro-
ceedings of the 10th international conference on soil mechanics and foundation engi-
neering, pages 319–322. ISSMFE: International Society for Soil Mechanics and Foun-
dation Engineering.
Leca, E. and Dormieux, L. (1990). Upper and lower bound solutions for the face stability
of shallow circular tunnels in frictional material. Géotechnique, 40(4):581–606.
Ledesma, A. and Romero, E. (1997). Systematic backanalysis in tunnel excavation prob-
lems as a monitoring technique. In Proceedings of the International Conference on Soil
Mechanics and Foundation Engineering- International Society for Soil Mechanics and
Foundation Engineering, volume 3, pages 1425–1428. AA Balkema.
Loganathan, N. (2011). An innovative method for assessing tunnelling-induced risks to
adjacent structures. New York: Parsons Brinckerhoff Inc. One Penn Plaza New York.
Macklin, S. (1999). The prediction of volume loss due to tunnelling in overconsolidated
clay based on heading geometry and stability number. Ground engineering, 32(4):30–
33.
146 BIBLIOGRAPHY
Maidl, B. (2012). Mechanised shield tunnelling. Wilhelm Ernst & Sohn, Verlag für Ar-
chitektur und technische Wissenschaffen GmbH & Company KG.
Mair, R. (1989). Discussion leader’s report on session 9: Selection of design parameters
for underground construction. In Proceedings of the 12th International Conference on
Soil Mechanics and Foundation Engineering, Rio de, volume 5, pages 2891–2893.
Mair, R., Gunn, M., and O’Reilly, M. (1982). Ground movement around shallow tunnels
in soft clay. Tunnels & Tunnelling International, 14(5).
Mair, R. and Taylor, R. (1999). Theme lecture: Bored tunnelling in the urban environ-
ment. of XIV ICSMFE [131], pages 2353–2385.
Mair, R., Taylor, R., and Bracegirdle, A. (1993). Subsurface settlement profiles above tun-
nels in clays. Geotechnique, 43(2).
Mair, R., Taylor, R., and Burland, J. (1996). Prediction of ground movements and assess-
ment of risk of building damage due to bored tunnelling. In Fourth International Sym-
posium of International Conference of Geotechnical Aspects of on Underground Con-
struction in Soft Ground, pages 713–718. AA Balkema.
Mashimo, H. and Ishimura, T. (2005). Numerical modelling of the behavior of shield
tunnel lining during assembly of a tunnel ring. Earth, 60(80.0):100–0.
Matter, J. and Portner, J. (2004). Successful grouting for the zimmerberg base tunnel.
Tunnelling and Underground Space Technology, 19:504–505.
Melis, M., Medina, L., and Rodríguez, J. M. (2002). Prediction and analysis of subsidence
induced by shield tunnelling in the madrid metro extension. Canadian Geotechnical
Journal, 39(6):1273–1287.
Miki, K., Yokomizo, F., Ueda, H., Hino, Y., and Yamamoto, H. (2009). Development of con-
struction method for a road underpass at intersection. In Proceedings of 2009 World
Tunnel Congress. Budapest.
Moh, Z., Ju, D. H., and Hwang, R. (1996). Ground movements around tunnels in soft
ground. In Proc. Int. Symposium on Geotechnical Aspects of Underground Construc-
tions in Soft Ground. London: Balkema, pages 725–730.
Molins, C. and Arnau, O. (2011). Experimental and analytical study of the structural re-
sponse of segmental tunnel linings based on an in situ loading test.: Part 1: Test con-
figuration and execution. Tunnelling and Underground Space Technology, 26(6):764–
777.
Möller, S. C. (2006). Tunnel induced settlements and structural forces in linings. Univ.
Stuttgart, Inst. f. Geotechnik.
Mollon, G., Dias, D., and Soubra, A.-H. (2009a). Face stability analysis of circular tunnels
driven by a pressurized shield. Journal of geotechnical and geoenvironmental engi-
neering, 136(1):215–229.

BIBLIOGRAPHY 147
Mollon, G., Dias, D., and Soubra, A.-H. (2009b). Probabilistic analysis and design of cir-
cular tunnels against face stability. International Journal of Geomechanics, 9(6):237–
249.
Mollon, G., Phoon, K. K., Dias, D., and Soubra, A.-H. (2010). Validation of a new 2d failure
mechanism for the stability analysis of a pressurized tunnel face in a spatially varying
sand. Journal of Engineering Mechanics, 137(1):8–21.
Morgan, H. (1961). A contribution to the analysis of stress in a circular tunnel. Geotech-
nique, 11(1):37–46.
Mori, A., Tamura, M., Kurihara, K., and Shibata, H. (1991). A suitable slurry pressure in
slurry-type shield tunneling. Proc Tunnelling ’91, London, pages 361–369.
Muir Wood, A. (1975). The circular tunnel in elastic ground. Geotechnique, 25(1):115–
127.
Muir Wood, A. (1976). Discussion: The circular tunnel in elastic ground. Geotechnique,
26(1):231–237.
Nagel, F. and Meschke, G. (2011). Grout and bentonite flow around a tbm: Compu-
tational modeling and simulation-based assessment of influence on surface settle-
ments. Tunnelling and Underground Space Technology, 26(3):445–452.
NEN-3650 (2012). NEN 3650-2012 nl Eisen voor buisleidingsystemen.
NEN-EN 1992-1-1, C. E. (1992). Design of concrete structures - part 1-1 : General rules
and rules for buildings. European Prestandard ENV, 1.
NEN-EN 1997-1, C. E. (1997). Eurocode 7 geotechnical design - part 1: General rules.
European Prestandard ENV, 1.
Netzel, H. D. (2009). Building response due to ground movements. TU Delft, Delft Uni-
versity of Technology.
Ng, C. and Springman, S. (1994). Uplift resistance of buried pipelines in granular mate-
rials. In Centrifuge, volume 94, pages 753–758.
O’Reilly, M. (1988). Evaluating and predicting ground settlements caused by tunnelling
in london clay. In Tunnelling, volume 88, pages 231–241.
O’Reilly, M. and New, B. (1982). Settlements above tunnels in the united kingdom-their
magnitude and prediction. Technical report, Institution of Mining and Metallurgy.
Oreste, P. (2007). A numerical approach to the hyperstatic reaction method for the
dimensioning of tunnel supports. Tunnelling and underground space technology,
22(2):185–205.
Peck, R. B. (1969). Deep excavations and tunnelling in soft ground. In Proc. 7th Int. Conf.
on SMFE, pages 225–290.

148 BIBLIOGRAPHY
Plizzari, G. and Tiberti, G. (2006). Steel fibers as reinforcement for precast tunnel seg-
ments. Tunnelling and Underground Space Technology, 21(3):438–439.
Rankin, W. (1988). Ground movements resulting from urban tunnelling: predictions and
effects. Geological Society, London, Engineering Geology Special Publications, 5(1):79–
92.
Rowe, R. and Kack, G. (1983). A theoretical examination of the settlements induced by
tunnelling: four case histories. Canadian Geotechnical Journal, 20(2):299–314.
Sagaseta, C. (1988). Analysis of undrained soil deformation due to ground loss. Geotech-
nique, 38(4).
Schmid, H. (1926). Statische Probleme des Tunnel-und Druckstollenbaues und ihre gegen-
seitigen Beziehungen. Springer.
Schulze, H. and Duddeck, H. (1964). Spannungen in schildvorgetriebenen tunneln.
Beton-und Stahlbetonbau, 59(8):169–175.
Selemetas, D., Standing, J., and Mair, R. (2005). The response of full-scale piles to tun-
nelling. In Proceedings of the 5th International Symposium on Geotechnical Aspects of
Underground Construction in Soft Ground, pages 763–769. Taylor and Francis.
Stein, D. (2005). Trenchless technology for installation of cables and pipelines. Stein &
Partner Bochum, Germany.
Strack, O. E. (2002). Analytic solutions of elastic tunneling problems. PhD thesis, Delft
University of Technology.
Talmon, A. and Bezuijen, A. (2005). Grouting the tail void of bored tunnels: the role
of hardening and consolidation of grouts. In Geotechnical Aspects of Underground
Construction in Soft Ground: Proceedings of the 5th International Symposium TC28.
Amsterdam, the Netherlands, 15-17 June 2005, page 319. Taylor & Francis US.
Talmon, A. and Bezuijen, A. (2009). Simulating the consolidation of tbm grout at noord-
plaspolder. Tunnelling and Underground Space Technology, 24(5):493–499.
Taylor, R. (1993). Prediction of clay behaviour around tunnels using plasticity solutions.
In Predictive Soil Mechanics: Proceedings of the Wroth Memorial Symposium Held at
St. Catherine’s College, Oxford, 27-29 July 1992, page 449. Thomas Telford.
Trautmann, C. H., O’Rourke, T. D., and Kulhawy, F. H. (1985). Uplift force-displacement
response of buried pipe. Journal of Geotechnical Engineering, 111(9):1061–1076.
Verruijt, A. (1997). A complex variable solution for a deforming circular tunnel in an
elastic half-plane. International Journal for Numerical and Analytical Methods in Ge-
omechanics, 21(2):77–89.
Vorster, T. E. B. (2006). The effects of tunnelling on buried pipes. PhD thesis, University of
Cambridge.

BIBLIOGRAPHY 149
Vu, M. N., Broere, W., and Bosch, J. W. (2015a). Effects of cover depth on ground move-
ments induced by shallow tunnelling. Tunnelling and Underground Space Technology,
50:499–506.
Vu, M. N., Broere, W., and Bosch, J. W. (2015b). Estimating the influence zones induced
by shallow tunnelling. In under review in Tunnelling and Underground Space Technol-
ogy.
Vu, M. N., Broere, W., and Bosch, J. W. (2015c). The impact of shallow cover on stability
when tunnelling in soft soils. Tunnelling and Underground Space Technology, 50:507–
515.
Vu, M. N., Broere, W., and Bosch, J. W. (2015d). The impact of shallow cover on tunnelling
in soft soil. In Kolic, D., editor, ITA WTC 2015 Congress and 41st General Assembly.
Vu, M. N., Broere, W., and Bosch, J. W. (2015e). Structural analysis for shallow tunnels in
soft soil. In under review in International Journal of Geomechanics.
Vu, M. N., Broere, W., and Bosch, J. W. (2016a). Effects of cover depth on ground move-
ments induced by shallow tunnelling. In ITA WTC 2016 Congress and 42nd General
Assembly.
Vu, M. N., Broere, W., and Bosch, J. W. (2016b). Volume loss in shallow tunnelling. Tun-
nelling and Underground Space Technology, 59:77–90.
White, D., Barefoot, A., and Bolton, M. (2001). Centrifuge modelling of upheaval buckling
in sand. International Journal of Physical Modelling in Geotechnics, 1(2):19–28.
Windels, R. (1966). Spannungstheorie zweiter ordnung für den teilweise gebetteten
kreisring. Die Bautechnik, 43:265–274.
Windels, R. (1967). Kreisring im elastischen kontinuum. Der Bauingenieur Bd, 42:429.
Winkler, E. (1867). Theory of elasticity and strength. Dominicus Prague.
Yu, H.-S. (2013). Cavity expansion methods in geomechanics. Springer Science & Business
Media.


ABLOW-OUT MODEL
A.1. UNIFORM SUPPORT PRESSURE
Figure A.1: Uniform support pressure at the upper part of the tunnel
The weight of soil layers above the tunnel is given by:
G1 = DHγ−π
8D2γ (A.1)
where H =C + D2
.
In Figure 2.23 and 2.25, the weight of the tunnel lining is estimated as:
G2 ≈πγT Dd (A.2)
151

152 A. BLOW-OUT MODEL
Figure A.2: Uniform support pressure at the lower part of the tunnel
The shear forces between soil column and the surrounding soil are:
2τy = 2
(
C +D
2
)[
c +1
2
(
C +D
2
)
Kyγ′t anϕ
]
(A.3)
The total vertical support force is given by:
Sv =∫π
0dϕ
∫R
0s sinϕdr = Ds (A.4)
From the equilibrium condition at the upper part of the tunnel, the total vertical sup-
port force equals the sum of the soil body weight and the shear forces between the soil
column above the tunnel and surrounding ground. We have:
Sv =G1 +2τ (A.5)
Or:
Ds = γ
[(
C +D
2
)
D −π
8D2
]
+2
(
C +D
2
)[
c +1
2
(
C +D
2
)
Kyγ′t anϕ
]
(A.6)
From this, the uniform support pressure at the upper part can be estimated as:
st ,max = s0,t = γ′(
H −π
8D
)
+2H
D
(
c +1
2HKyγ
′t anϕ
)
(A.7)
At the lower part of the tunnel in Figure A.2, the soil body weight, the shear forces be-
tween the soil column and the surrounding ground, and the weight of the tunnel are
taken into account. Therefore, the equilibrium condition can be shown as:
Sv =G1 +GT +2τ (A.8)

A.2. LINEAR SUPPORT PRESSURE WITH GRADIENT δp 153
Or:
Ds = γ
[(
C +D
2
)
D −π
8D2
]
+2
(
C +D
2
)[
c +1
2
(
C +D
2
)
Kyγ′t anϕ
]
+γT πDd (A.9)
From this, the maximum uniform supporting pressure at the lower part of the tunnel can
be estimated as:
sb,max = s0,b = γ(
H −π
8D
)
+2H
D
(
c +1
2HKyγ
′t anϕ
)
+γT πd (A.10)
A.2. LINEAR SUPPORT PRESSURE WITH GRADIENT δp
Figure A.3: Linear support pressure at the upper part of the tunnel
At upper part of the tunnel section in Figure A.3 (0 ≤ϕ≤π), support pressure on the
upper part of the tunnel section is given by:
s = s0,t +δp R cosϕ (A.11)
where δp is the vertical pressure gradient and s0,t is the support pressure at the top of
the tunnel face.
The total vertical support force can be estimated by:
Sv =∫π
0dϕ
∫R
0(s0,t +δp R cosϕ)sinϕdr = Ds0,t +δp
D2
4(A.12)
From the vertical equilibrium condition at the upper part of the tunnel, the total vertical
support force equals the sum of the weight of soil column above the tunnel and the shear
forces between the soil column and the surrounding ground. We have:
Ds0,t +δpD2
4= γ
[(
C +D
2
)
D −π
8D2
]
+2
(
C +D
2
)[
c +1
2
(
C +D
2
)
Kyγ′t anϕ
]
+δpD2
4(A.13)

154 A. BLOW-OUT MODEL
Figure A.4: Linear support pressure at the lower part of the tunnel
From this, the maximum support pressure at the top of the tunnel face can be estimated
as:
s0,t ,max = γ(
H −π
8D
)
+2H
D
(
c +1
2HKyγ
′t anϕ
)
−δp D
4(A.14)
Support pressure at the lower part of the tunnel in Figure A.4 with −π≤ϕ≤ 0 is given by:
s = s0,b +δp R cosϕ (A.15)
where s0,b is the support pressure at the bottom of the tunnelling face.
The total vertical support force at the lower part of the tunnel is estimated as:
Sv =∫π
0dϕ
∫R
0(s0,b +δp R cosϕ)sinϕdr = Ds0,b −δp
D2
4(A.16)
At the lower part of the tunnel, besides the soil body weight and the shear forces between
the soil column and the surrounding ground, the weight of the tunnel is also taken into
account. Therefore, the vertical equilibrium condition is shown as:
Ds0,b−δpD2
4= γ
[(
C +D
2
)
D −π
8D2
]
+2
(
C +D
2
)[
c +1
2
(
C +D
2
)
Kyγ′t anϕ
]
+γT πDd−δpD2
4(A.17)
From this, the maximum support pressure at the bottom of the tunnelling face is esti-
mated as:
s0,b,max = γ(
H −π
8D
)
+2H
D
(
c +1
2HKyγ
′t anϕ
)
+δp D
4(A.18)

BGROUND MOVEMENT
In Equation 4.17, the distance x from the building to tunnel axis with a given settlement
umax is:
x =
√
−2i 2 ln(umax
Sv,max) =
√
−2i 2 ln(umax i 4
p2
VLD2pπ
)
With A = umax 4p
2
VL D2pπ
, Equation 4.17 becomes:
x =√
−2i 2 ln(Ai ) (B.1)
In Figure 4.14, the distance x value is equal to x0 when the first derivative of x equals 0:
x ′ =1
2
−4i ln(Ai )−2i√
−2i 2 ln(Ai )= 0 (B.2)
Solving Equation B.2 yields:
i =1
Ap
e(B.3)
and from Equation B.3 and B.1, the distance x0 follows as:
x0 =
√
−2
(
1
Ap
e
)2
ln
(
A1
Ap
e
)
=1
Ap
e=
VLD2pπ
umax 4p
2e≈ 0.19
VLD2
umax(B.4)
155


LIST OF SYMBOLS
General
c cohesion
cu undrained shear strength of the ground
C cover depth
Cs compression constant
Cswel swelling constant
d thickness of the tunnel lining
D diameter of the tunnel
Es stiffness modulus of the ground
g acceleration of gravity
H , z0 depth of the tunnel
K coefficient of lateral earth pressure
R radius of the tunnel
γ soil volumetric weight
γ′
g effective volumetric weight of soil
γw volumetric weight of water
γT weight unit of the tunnel lining (concrete)
ν Poisson’s ratio
ϕ,φ friction angle
Stability analysis
a relaxation length
dg r width of the tail void gap
G1 weight of the soil layers above the tunnel
G2 weight of the tunnel
G A uplift force
K A3 three dimensional earth pressure coefficient
K0 coefficient of neutral horizontal effective stress
N stability ratio
NTC critical stability ratio
Ns ,Nγ Leca & Dormieux weighting coefficients
Nc Mollon’s coefficient
157
158 LIST OF SYMBOLS
p pore pressure
qs surface load
q0 arbitrary surface surcharge in Broere’s model
s support pressure
smi n minimum support pressure
smax maximum support pressure
st ,max maximum allowable uniform support pressure at the top of the tunnel
sb,max maximum allowable uniform support pressure at the bottom of the tun-
nel
s0,t ,max maximum allowable linear support pressure at the top of the tunnel
s0,b,max maximum allowable linear support pressure at the bottom of the tunnel
δp vertical pressure gradient
ηbl ow−out safety index for blow-out
ηupl i f t safety index for uplift
ηpor epr essur e safety index for pore pressure
ησ,h
safety index for effective horizontal pressures
ρg r the density of the grout
τy shear strength of the grout
Structural analysis
E Young’s modulus of the ground
Es stiffness modulus of the ground
Ec elasticity modulus of the ground
El Il normal stiffness of the tunnel lining
k ground reaction modulus (spring stiffness)
ks stiffness of tangential spring
kr stiffness of radial spring
kn,i stiffness of radial spring in each element
ks,i stiffness of tangential spring in each element
p ground bedding pressure
pl i m maximum reaction pressure
S radial displacement of tunnel lining
φ angle between the element axis and the vertical axis of a tunnel section
αD relative stiffness
β dimensionless factor for the ground reaction modulus in the Oreste’s
model
η∗ apparent stiffness of the ground
ηn,0 radial ground reaction modulus
ηs ,ηn stiffness of tangential and radial (normal) springs

LIST OF SYMBOLS 159
Ground movement analysis
D0 diameter where for D less than D0 the surface settlement is always less
than the allowable settlement umax
i width of the settlement trough
K trough width parameter
Lp pile length
sh horizontal displacement
sv transverse settlement of the ground surface
Sv,max maximum transverse settlement of the ground surface
sv (y)(x=0) vertical settlement in the longitudinal direction
sh(y)(x=0) horizontal settlement in the longitudinal direction
umax maximum allowable settlement
VL volume loss
Vs volume of settlement trough
x distance from tunnel axis to existing building
x0 distance from tunnel axis to existing building where settlement is always
less than umax
ω slope or ground distortion
ωmax maximum allowable slope
Volume loss analysis
a reduction of shield diameter
G shear modulus of soil
hover cut overcutting width
k constant corresponding to cylindrical or spherical models
LF load factor
p0 pre-tunnelling pressure
Rp plastic zone radius
r distance from the assessment point to the tunnel centre
s f maximum fracturing pressures
st ai l grout pressure in the tail
uc consolidation settlement at the surface
us soil displacement in the elastic/plastic zone
ut surface settlement at the tail
Vcons volume of consolidation settlement at the surface
VL, f volume loss at tunnelling face
VL,s volume loss along the shield
VL,t volume loss at the tail
VL,c volume loss due to consolidation

160 LIST OF SYMBOLS
w j joint width between the tunnel and the soil
∆p change of the pressure due to flow
∆x length increment
σr radial stress in cavity expansion theory
σθ tangential stress in cavity expansion theory
σsoi l stress in the soil
σ0 initial stress in the soil
τy , τg r outy shear strength of the grout around the TBM
τbentoni tey shear strength of bentonite

SUMMARY
In urban areas, tunnels are often constructed well below the surface to minimize dam-
age to existing nearby buildings. This comes with deep station boxes and increases the
construction costs. Although shallow tunnels have many benefits because of the lower
short-term construction costs and the long-term operational costs, the limitations in the
understanding of shallow tunnelling in soft soils form obstacles to development in urban
areas.
This study investigates the impact of reducing the C /D ratio of shallow tunnels in soft
soils in relation to the following issues: stability, structure, ground movement and effects
on existing buildings and volume loss. From this, the limit and/or optimal C /D ratio for
shallow tunnelling is derived and recommendations and/or solutions for improving the
shallow tunnelling process have been proposed.
Firstly, the stability analysis for shallow tunnelling was carried out on the basis of the
uplift, face stability and blow-out mechanisms. The relationships between the C /D ratio
and the required d/D ratio and required support pressures were investigated with vari-
ous soils. Related models in the literature were applied and new models were proposed
and compared. The ranges of support pressures were estimated for TBM machines, es-
pecially for EPB. It was found that in the case of shallow tunnelling in peat, a tunnel
lining with a d/D ratio larger than 1/12 would allow stable tunnel construction.
Secondly, structural analysis investigated the effect on deformations and the internal
forces of the tunnel lining when the C /D ratio was decreased. Since recent models in
tunnel design are only applied for moderate and deep tunnels with C /D ≥ 2, a new struc-
tural analysis model for shallow tunnels, which includes the different loads at the top and
at the bottom of the tunnel, was proposed and validated with a case study. The variation
in internal forces and deformations of the tunnel lining was analyzed when reducing the
C /D ratio. The results showed that a significant difference between the new models and
the existing models lies in the increasing of the maximum deformations of the tunnel
lining in the cases of very shallow tunnels. It also derived optimal C /D ratios with var-
ious d/D ratios for shallow tunnels in soft soils. These values were combined with the
results of stability analysis in order to derive optimal C /D and d/D values.
Tunnelling leads to ground movement not only on the surface but also in the subsurface.
Such movements might lead to the damage of existing nearby buildings. This research
investigated the affected areas of the shallow tunnelling and the relationship between
these areas and the C /D values. Two analysis models were proposed to estimate the af-
fected areas for the preliminary assessment of the risk of building damage. The affected
areas were derived with different tunnel diameters in various soil types and were com-
pared with recent studies.
The next part of this study studied volume loss due to shallow tunnelling. The total vol-
ume loss was estimated at the tunnelling face, along the TBM, at the tail and with long-
term consolidation settlement. At the tunnelling face, the method of Macklin (1999),
161

162 SUMMARY
which was derived from case study analysis, was applied. A new calculation method was
proposed based on the research of Bezuijen and Talmon (2008) on grouting flows along
the TBM. At the tail, an analysis model based on cavity-expansion theory was presented.
A calculation for estimating the volume loss attributed to long-term consolidation set-
tlement was also carried out. From these analyses, boundaries for volume loss induced
by shallow tunnelling were derived both for short-term construction and for long-term
consolidation and compared to case studies. This showed that in the case of very shallow
tunnelling, no volume loss is feasible with a very careful control of support pressure.
In the fifth part of this study, the boundaries of the affected areas were derived by com-
bining the ground movement analysis and volume loss for surface and subsurface dis-
placements and was then discussed with the case studies. The effect of soil parameters
was also investigated in order to estimate the required soil strength for stable tunnelling.
The investigation when reducing the C /D ratio in this study provides more understand-
ing on the effects of shallow tunnelling in soft soils and will help designers to optimize
shallow tunnelling in the future.

SAMENVATTING
Tunnels in stedelijk gebied worden veelal ver beneden maaiveld aangelegd, om schade
aan bestaande bebouwing te beperken. Dit resulteert in diepe stations en hoge bouw-
kosten. Hoewel ondiepe tunnels vele voordelen bieden gezien de lagere bouwkosten en
de lagere operationele kosten, leidt de beperkte kennis over het boren van ondiepe tun-
nels in slappe grond tot obstakels bij de inzet in stedelijk gebied.
Dit onderzoek richt zich op de invloed van het verminderen dan de C /D verhouding
van ondiepe tunels in slappe grond met aandacht voor de volgende aspecten: stabiliteit,
constructie, zettingen en de invloed op bestaande bebouwing en volumeverliezen. Op
basis hiervan zijn de limitaties en de optimale C /D verhouding voor ondiepe tunnels af-
geleid en oplossingen voor het verbeteren van het ondiepe boorproces voorgesteld.
Ten eerste is het evenwicht van ondiepe tunnels beschouwd met betrekking tot opdrij-
ven, frontstabiliteit en blow-out. De relatie tussen de C /D verhouding en de benodigde
d/D verhouding en de benodigde steundrukken is onderzocht voor verschillende grond-
soorten. Hierbij zijn zowel bestaande modellen toegepast als nieuwe modellen ontwik-
keld. De bandbreedte van toelaatbare steundrukken is afgeschat voor tunnelboormachi-
nes, met name voor gronddrukbalansschilden. Het is aangetoond dat voor een ondiepe
tunnel in veen een tunnelmantel met een d/D verhouding groter dan 1/12 tot een sta-
bile tunnelconstructie zal leiden.
Ten tweede is op basis van constructieleer het effect van deformaties en de interne krach-
ten op de tunnelmantel bepaald voor afnemende C /D verhoudingen. Aangezien recente
ontwikkelde modellen voor het ontwerp van tunnelmantels ontwikkeld zijn voor mid-
deldiepe tot diepe tunnels met C /D ≥ 2, is een nieuw model voorgesteld dat rekening
houdt met verschillende belastingen aan boven- en onderzijde van de tunnel. De ver-
andering van de interne krachten en deformaties van de tunnelmantel is beschouwd bij
afnemende C /D verhouding. De resultaten laten zien dat een significant verschil tussen
de nieuwe en bestaande modellen de toenemende maximum deformaties van de tun-
nelmantel bij zeer ondiepe tunnels is. Tevens zijn de optimale C /D verhoudingen voor
verschillende d/D verhoudingen voor tunnels in slappe grond bepaald. Deze waarden
zijn gecombineerd met de resultaten van de evenwichtsbeschouwingen om tot optimale
C /D en d/D waarden te komen.
Het boren van tunnels leid niet alleen tot grondverplaatsingen aan maaiveld maar ook in
de ondergrond. Deze verplaatsingen kunnen tot schade aan nabijgelegen bestaande be-
bouwing leiden. Dit onderzoek heeft de invloedszone van ondiepe tunnels onderzocht
en het verband tussen deze zones en de C /D verhouding. Twee modellen zijn opgesteld
om de invloedszone af te schatten en een eerste inschatting te maken van de kans op
gebouwschade. De invloedszones zijn afgeleid voor verschillende tunneldiameters in
verschillende grondslag en vergeleken met recente projecten.
Het volgende deel van dit onderzoek heeft zich gericht om het volumeverlies door on-
diepe boren van tunnels. Het totale volumeverlies is geschat aan het graaffront, langs
163

164 SAMENVATTING
het tunnelschild, nabij de staartspleet en ten gevolge van lage duur consolidate. Bij het
graaffront is de methode van Macklin (1999), welke op basis van projectervaringen was
afgeleid, toegepast. Een nieuwe berekeningsmethode is voorgesteld op basis van onder-
zoek van Bezuijen and Talmon (2008) naar stroming van grout langs de tunnelborma-
chine. Voor de volumeverliezen bij de staartspleet is een nieuw model op basis van cavity
expansion opgesteld en tevens is voor de volumeverliezen ten gevolge van consolidatie
een nieuw model voorgesteld. Op basis van deze analyse zijn onder- en bovengrenzen
aan de verwachte volumeverliezen bij ondiepe tunnels bepaald, zowel tijdens de bouw
als ten gevolge van lange termijn consolidatie. Deze analyse laat zien dat bij het zeer
ondiep boren van tunnels een nul volumeverlies haalbaar is met zeer nauwkeurige con-
trole van de steundrukken.
In het vijfde deel van dit onderzoek zijn de grenzen van de invloedszones afgeleid door
de resultaten van de zettingsberekeningen en de volumeverlies-berekeningen te com-
bineren, zowel aan maaiveld als in de ondergrond. De resultaten zijn vergeleken met
praktijkmetingen. Daarnaast is de invloed van grondeigenschappen onderzocht om een
schatting van de benodigde sterkte van de grond voor een stabiel boorproces te geven.
Dit onderzoek naar het reduceren van de C /D verhouding heeft meer inzicht in de ef-
fecten van ondiep tunnelboren in slappe grond opgeleverd en zal ontwerpers helpen bij
het optimaliseren van toekomstige ondiepe tunnels.

CURRICULUM VITÆ
Minh Ngan Vu was born on the 4th of November 1982 in Hanoi, Vietnam. He started
his Civil Engineering study at National University of Civil Engineering in Vietnam in
September 2000. He graduated in March 2005. He began his M.Sc. course on civil engi-
neering in 2005 and obtained the M.Sc. degree in 2008 on bridge and tunnel construc-
tion. In that period, he also worked in a construction company on several road and
bridge projects in Vietnam.
In October 2009, he started as a lecturer in Hanoi University of Mining and Geology.
Since February 2012, he has worked at Faculty of Civil Engineering and Geoscience in
Delft University of Technology on the topic of shallow tunnelling in soft soils.
165