deliverable d2.1.3 quality estimation for dissemination - qt21.eu
TRANSCRIPT
FP7-ICT Coordination and Support Action (CSA) QTLaunchPad (No. 296347)
Preparation and Launch of a Large-scale Action for Quality Translation Technology
Deliverable D2.1.3Quality Estimation for
Dissemination
Authors: Lucia Specia, Kashif Shah (University of Sheffield)Eleftherios Avramidis (DFKI)
Ergun Bicici (DCU)
Abstract. We present benchmarking experiments for the intrinsic and extrinsic evaluation ofan extended version of our open source framework for machine translation quality estimationQUEST, which is described in D2.1.2. We focus on the application of quality predictions fordissemination by estimating post-editing effort. As an extrinsic task, we use quality predictionsto rank alternative translations from multiple MT systems according to their estimated quality.Additionally, we experiment with a small dataset annotated for quality labels with different levelsof granularity in a attempt to predict our multidimensional quality metric (MQM) scores.
Copyright c© 2013 University of Sheffield
ProjectDelivery DateContractual DateNatureReviewed ByWeb linksDissemination
QTLaunchPad No. 296347November 4, 2013October 31, 2013DeliverableJosef van Genabith (DCU)http://www.qt21.eu/launchpad/Public

Grant agreement no. 296347Project acronym QTLaunchPadProject full title Preparation and Launch of a Large-scale Action for Quality
Translation TechnologyFunding scheme Coordination and Support ActionCoordinator Prof. Hans Uszkoreit (DFKI)Start date, duration 1 July 2012, 24 monthsDistribution PublicContractual date of delivery 31 October 2013Actual date of delivery 4 November 2013Deliverable number D2.1.3Deliverable title Quality Estimation for DisseminationType ReportStatus and version V-1Number of pages 32Contributing partners USFD, DCU, DFKIWP leader USFDTask leader USFDAuthors Lucia Specia, Kashif Shah, Ergun Bicici, Eleftherios
AvramidisEC project officer Aleksandra Wesolowska
The partners in QTLaunchPad are:
Deutsches Forschungszentrum fur Kunstliche Intelligenz(DFKI), GermanyDublin City University (DCU), IrelandInstitute for Language and Speech Processing, R.C. Athena(ILSP/ATHENA RC), GreeceThe University of Sheffield (USFD), United Kingdom
For copies of reports, updates on project activities and other QTLaunchPad-related infor-mation, contact:
DFKI GmbHQTLaunchPadDr. Aljoscha Burchardt [email protected] 91c Phone: +49 (30) 23895-183810559 Berlin, Germany Fax: +49 (30) 23895-1810
Copies of reports and other material can also be accessed via http://www.qt21.eu/launchpad
c© 2013, The Individual AuthorsNo part of this document may be reproduced or transmitted in any form, or by any means,electronic or mechanical, including photocopy, recording, or any information storage andretrieval system, without permission from the copyright owner.
Executive Summary
Deliverable D2.1.3 describes work on Task 2.1: Quality Estimation Baseline and Ex-tensions. It benchmarks an extended implementation of an open source framework fordeveloping quality estimation models to be used within QTLaunchPad and beyond whichis reported in D2.1.2.
Experiments using this implementation on a number of datasets annotated with qualityscores given by humans for post-editing effort provide reference values for quality esti-mation in the dissemination scenario. The experiments with intrinsic evaluation highlightthe relevance of feature selection techniques and the fact that, although a small subsetof features seem to perform well for most datasets, this set can be complemented byother features that are more or less relevant for optimal performance depending on thedataset. As extrinsic evaluation, we experiment with different methods for ranking alter-native translation for a given source sentence, produced by different machine translationsystems. We show that the results for the different methods can vary considerably depend-ing on how the labelling of the training instances has been performed: using absolute orrelative quality scores.
Contents
1 Introduction 21.1 Relevance to QTLaunchPad . . . . . . . . . . . . . . . . . . . . . . . . 3
1.1.1 WP2 description . . . . . . . . . . . . . . . . . . . . . . . . . . 31.1.2 Relation to other workpackages . . . . . . . . . . . . . . . . . . 3
2 Benchmark 62.1 Datasets . . . . . . . . . . . . . . . . . . . . . . . . . . . . . . . . . . . 62.2 Algorithms and settings . . . . . . . . . . . . . . . . . . . . . . . . . . . 72.3 Feature sets . . . . . . . . . . . . . . . . . . . . . . . . . . . . . . . . . 92.4 Evaluation metrics . . . . . . . . . . . . . . . . . . . . . . . . . . . . . 92.5 Results . . . . . . . . . . . . . . . . . . . . . . . . . . . . . . . . . . . . 9
2.5.1 Selected features . . . . . . . . . . . . . . . . . . . . . . . . . . 102.5.2 Information retrieval and readability features . . . . . . . . . . . 12
2.6 Predicting MQM . . . . . . . . . . . . . . . . . . . . . . . . . . . . . . 162.6.1 Experiments and results . . . . . . . . . . . . . . . . . . . . . . 17
3 Ranking translations 203.1 Datasets . . . . . . . . . . . . . . . . . . . . . . . . . . . . . . . . . . . 203.2 Ranking using absolute score predictions . . . . . . . . . . . . . . . . . . 21
3.2.1 Algorithms and settings . . . . . . . . . . . . . . . . . . . . . . 223.2.2 Feature sets . . . . . . . . . . . . . . . . . . . . . . . . . . . . . 223.2.3 Evaluation metrics . . . . . . . . . . . . . . . . . . . . . . . . . 223.2.4 Results . . . . . . . . . . . . . . . . . . . . . . . . . . . . . . . 23
3.3 Ranking using pairwise classification . . . . . . . . . . . . . . . . . . . . 263.3.1 Algorithms and settings . . . . . . . . . . . . . . . . . . . . . . 263.3.2 Feature sets . . . . . . . . . . . . . . . . . . . . . . . . . . . . . 263.3.3 Evaluation metrics . . . . . . . . . . . . . . . . . . . . . . . . . 273.3.4 Results . . . . . . . . . . . . . . . . . . . . . . . . . . . . . . . 28
1
Chapter 1
Introduction
Quality Estimation (QE) has several applications in the context of Machine Translation(MT), including both the use of translations for inbound and outbound purposes. In thisreport we focus on QE for outbound purposes, i.e. a dissemination scenario. In this sce-nario, a judgement on the quality of translations has to take into account at least boththe fluency and adequacy of such translations, and in some cases, it has to conform styleguides. This is different from other intended uses of translation, for gisting purposes,where meeting the adequacy criterion often suffices. We address the dissemination sce-nario by building and evaluating quality estimation models on data annotated for post-editing effort.
Our datasets are labelled in different ways, either having professional translators pro-viding estimates on how much effort they think it would be necessary to fix the ma-chine translations ([1-4],[1-5] ranges), or having professional translators actually fixingthe translations and measuring the edit distance (or percentage of edits) between the rawmachine translation and its post-edited version.
We build models for these datasets using the most recent version of QUEST, ourframework for quality estimation (D2.1.2) and evaluate them intrinsically, according tostandard metrics for prediction error (Chapter 2), and extrinsically, within a task of rank-ing multiple alternative translations for the same source sentence (Chapter 3). For theformer, we build on our previous benchmark presented in D2.1.1, for an earlier and sim-pler version of QUEST, by adding new, advanced features, and new datasets that havebeen released recently. For the latter, we attempt to address the problem from differentperspectives, both in terms of approaches and datasets. In addition to datasets labelledwith absolute scores for post-editing effort for each translation, we include a dataset la-belled with relative scores comparing up to five alternative translations for each sourcesentence.
2
CHAPTER 1. INTRODUCTION 3
1.1 Relevance to QTLaunchPad
Deliverable D2.1.3 is intended to provide experiments with the extended version of QT-LaunchPad’s quality estimation software, QUEST, for dissemination purposes. Bench-marking experiments were performed to confirm that the whole pipeline from featureextraction to model evaluation works well and can be used in a practical application, suchas the ranking of alternative translations for the same source text. The focus of this reportis in describing such experiments.
1.1.1 WP2 description
The aim of Work Package 2 is to provide methods, software and reference results forquality estimation of machine translation, as well as for the use of quality predictions inpractical applications. More specifically, the objectives of this WP are:
1. Investigate and expand current QE methods for dissemination purposes to distin-guish among at least three types of translations: (i) translations that are good enoughto be left untouched by human post-editors (but possibly still revised); (ii) transla-tions which require further effort (post-editing) to be published; and (iii) trans-lations that should better be discarded, as they require more effort from humantranslators to correct them than what is involved in manual translation from scratch.
2. Use QE in a novel way to guide the development of translation systems: in contrastto the usual development cycles, where the goal is to improve the global quality ofthe MT system as a whole, the aim is to expand the set of translations which aregood enough for dissemination.
1.1.2 Relation to other workpackages
An advanced framework for quality estimation such as QUEST can be customised to esti-mate specific aspects of quality mostly through the use of different features and annotationlabels. To a lesser extent, learning algorithms can also support this customisation: stan-dard classification and regression algorithms can be used to predict discrete or continuousabsolute quality scores depending on the type of annotation, or ranking algorithms can beused for predictions on relative quality.
This design facilitates the very important connection between the methods and soft-ware developed in WP2 and WP1: Quality Barriers and Quality Metrics. On the onehand, the multidimensional quality metrics (MQM) designed in WP1 have helped:
• Identify relevant features for QE, e.g. features focusing on specific types of errorscommon in translations, such as inconsistent use of terminology. During the devel-opment of this new version of QUEST, the core issue types from MQM have been
CHAPTER 1. INTRODUCTION 4
studied with the aim of identifying gaps in the list of existing features that could becovered by new features to be added to the framework (Section ??).
• Define appropriate quality labels for QE, i.e. whether estimating a few quality cat-egories (e.g. bad, medium, high quality) is enough or more fine-grained categoriesare necessary, or whether the global quality metric defined in WP1 can be directlyestimated. Preliminary experiments investigating this matter are presented in thisreport. These will be further developed as part of the shared task in WP5.
• Prepare corpora that can be used to train and test QE models that represent specificquality requirements relevant in the context of QTLaunchPad. Preliminary experi-ments with existing, small scale corpora are presented in this report. These will befurther developed as part of the shared task in WP5.
On the other hand, QE will help quality metrics designed in WP1 by providing:
• A method to sample large datasets for manual evaluation/quality assurance suchthat one can focus on instances with specific ranges of quality (e.g. top or bottom10%), and
• Methods to partially automate manual error annotation by providing algorithms toautomatically measure or approximate linguistic characteristics relevant to certainissue types in MQM, e.g. counting incorrect capitalisation or number agreementissues, both of which affect the fluency of the translations. These algorithms areeffectively those used for feature extraction: in practice each feature value can beused on their own as qualitative indicators, or as features combined through ma-chine learning algorithms to predict a more quantitative global quality score (pos-sibly such as the main global quality metric in WP1). Section (Section ??) presentsa list of issue types for which features already exist or are in the process of beingimplemented.
Finally, QUEST as a software package will be essential to the shared task to be or-ganised as part of WP5 Test of Infrastructure Setup in Shared Task. This sharedtask will involve having quality estimation systems submitted by participants external toQTLaunchPad, who will be competing in the task of predicting overall quality scores,rankings of translations, and word-level error annotation. QUEST will be released asthe “baseline system” for the shared-task participants, and will serve as a basis uponwhich more advanced systems can be developed. We will encourage any improvementson QUEST by participants to be integrated into the existing version and made available tothe public.
Main dependencies involving this deliverable As mentioned above, one of the goalsfor WP2 is to apply the quality estimation software developed QUEST to build models

CHAPTER 1. INTRODUCTION 5
from corpora annotated with issue types in MQM (WP1). However, since the corpusproduced so far (TQ Error Corpus, D1.2.1) is not large enough for quality estimationand while larger corpora are under development in the project (e.g. for the shared task inWP5), we have started experimenting with external data annotated with similar issue typesas those offered by MQM by industry collaborators, such as WeLocalize. We presentsome preliminary experiments in this report.
Chapter 2
Benchmark
In this section we benchmark QUEST on several datasets annotated for post-editing ef-fort using feature selection and learning algorithms known to perform well in the task.Most of these datasets have also been benchmarked in D2.1.1, but some with fewer fea-tures: WMT12 and EAMT11 (fr-en). Three new datasets were added: TRACE, LIG andWMT13. We kept the other datasets here for comparison purposes.
2.1 Datasets
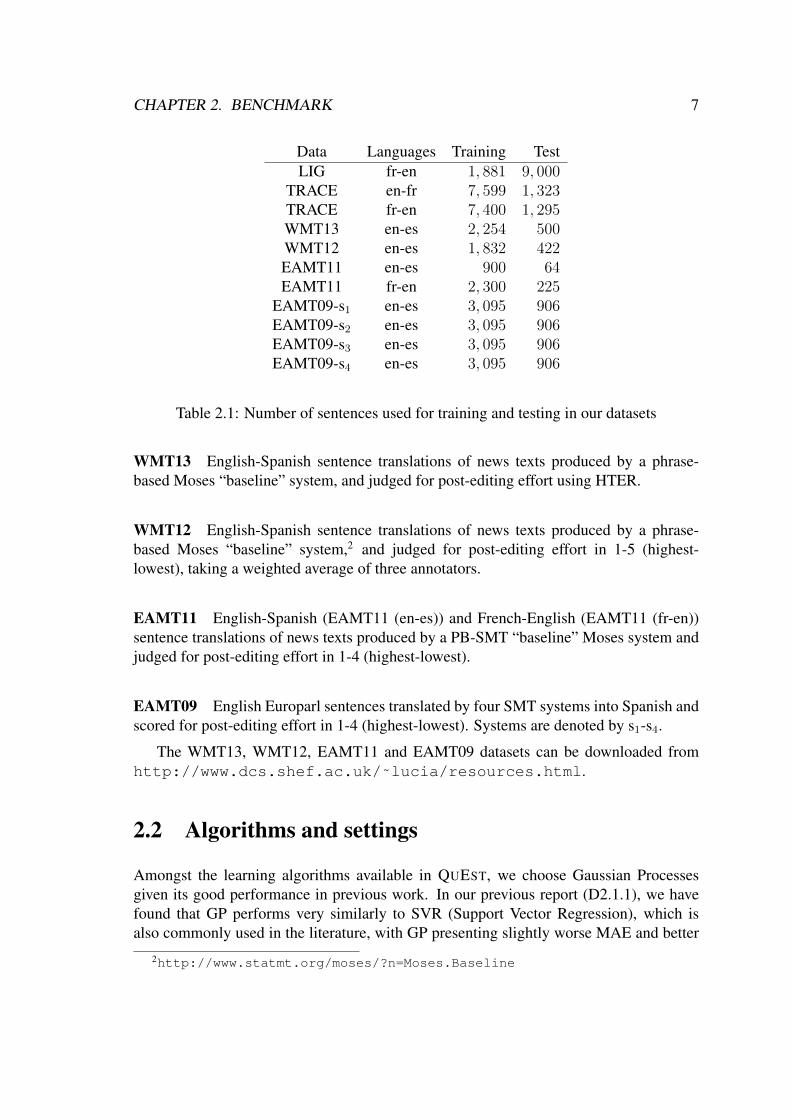
All datasets used in the experiments are available for download.1 Statistics about thesedatasets are shown in Table 2.1.
TRACE English-French (en-fr) and French-English (fr-en) sentence translations pro-duced by two MT systems: a rule-based system (Reverso) and LMSI’s statistical MTsystem [Wisniewski et al., 2013]. English-French contain a mixture of data from TedTalks, WMT news, SemEval-2 Cross-Lingual Word Sense Disambiguation, and trans-lation requests from Softissimo’s online translation portal (the Reverso system), whichcan be thought of as user-generated content. The French-English data contains sentencesfrom the OWNI – a free French online newspaper, Ted Talks and translation requestsfrom Softissimo’s online translation portal. All translations have been post-edited and theHTER scores are used as quality labels. For each language pair, 1, 000 translations havepost-edited by two translators independently. We concatenated these in our datasets.
LIG French-English sentence translations of news texts produced by a customised ver-sion of a phrase-based Moses system by the LIG group [Potet et al., 2012].
1http://www.dcs.shef.ac.uk/˜lucia/resources.html
6
CHAPTER 2. BENCHMARK 7
Data Languages Training TestLIG fr-en 1, 881 9, 000
TRACE en-fr 7, 599 1, 323TRACE fr-en 7, 400 1, 295WMT13 en-es 2, 254 500WMT12 en-es 1, 832 422EAMT11 en-es 900 64EAMT11 fr-en 2, 300 225
EAMT09-s1 en-es 3, 095 906EAMT09-s2 en-es 3, 095 906EAMT09-s3 en-es 3, 095 906EAMT09-s4 en-es 3, 095 906
Table 2.1: Number of sentences used for training and testing in our datasets
WMT13 English-Spanish sentence translations of news texts produced by a phrase-based Moses “baseline” system, and judged for post-editing effort using HTER.
WMT12 English-Spanish sentence translations of news texts produced by a phrase-based Moses “baseline” system,2 and judged for post-editing effort in 1-5 (highest-lowest), taking a weighted average of three annotators.
EAMT11 English-Spanish (EAMT11 (en-es)) and French-English (EAMT11 (fr-en))sentence translations of news texts produced by a PB-SMT “baseline” Moses system andjudged for post-editing effort in 1-4 (highest-lowest).
EAMT09 English Europarl sentences translated by four SMT systems into Spanish andscored for post-editing effort in 1-4 (highest-lowest). Systems are denoted by s1-s4.
The WMT13, WMT12, EAMT11 and EAMT09 datasets can be downloaded fromhttp://www.dcs.shef.ac.uk/˜lucia/resources.html.
2.2 Algorithms and settings
Amongst the learning algorithms available in QUEST, we choose Gaussian Processesgiven its good performance in previous work. In our previous report (D2.1.1), we havefound that GP performs very similarly to SVR (Support Vector Regression), which isalso commonly used in the literature, with GP presenting slightly worse MAE and better
2http://www.statmt.org/moses/?n=Moses.Baseline
CHAPTER 2. BENCHMARK 8
RMSE. This follows from the optimisation objective: GPs use a quadratic loss (the log-likelihood of a Gaussian) compared to SVR which penalises absolute margin violations.
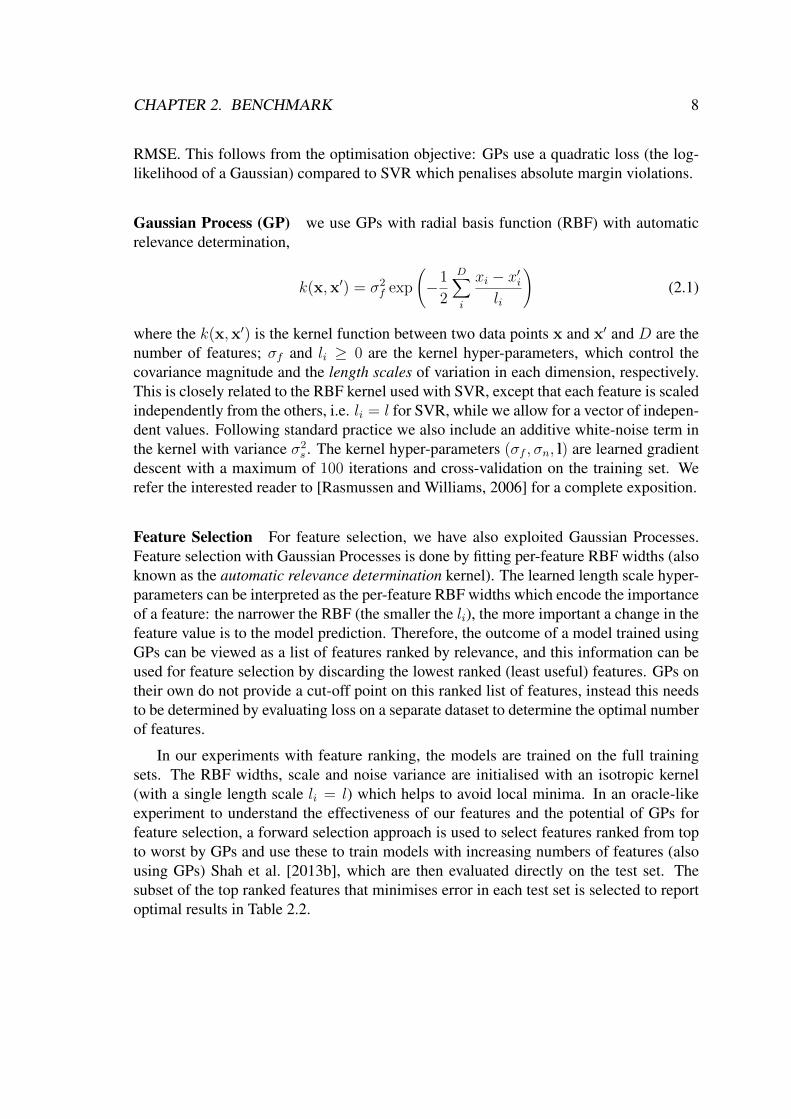
Gaussian Process (GP) we use GPs with radial basis function (RBF) with automaticrelevance determination,
k(x,x′) = σ2f exp
(−1
2
D∑i
xi − x′ili
)(2.1)
where the k(x,x′) is the kernel function between two data points x and x′ and D are thenumber of features; σf and li ≥ 0 are the kernel hyper-parameters, which control thecovariance magnitude and the length scales of variation in each dimension, respectively.This is closely related to the RBF kernel used with SVR, except that each feature is scaledindependently from the others, i.e. li = l for SVR, while we allow for a vector of indepen-dent values. Following standard practice we also include an additive white-noise term inthe kernel with variance σ2
s . The kernel hyper-parameters (σf , σn, l) are learned gradientdescent with a maximum of 100 iterations and cross-validation on the training set. Werefer the interested reader to [Rasmussen and Williams, 2006] for a complete exposition.
Feature Selection For feature selection, we have also exploited Gaussian Processes.Feature selection with Gaussian Processes is done by fitting per-feature RBF widths (alsoknown as the automatic relevance determination kernel). The learned length scale hyper-parameters can be interpreted as the per-feature RBF widths which encode the importanceof a feature: the narrower the RBF (the smaller the li), the more important a change in thefeature value is to the model prediction. Therefore, the outcome of a model trained usingGPs can be viewed as a list of features ranked by relevance, and this information can beused for feature selection by discarding the lowest ranked (least useful) features. GPs ontheir own do not provide a cut-off point on this ranked list of features, instead this needsto be determined by evaluating loss on a separate dataset to determine the optimal numberof features.
In our experiments with feature ranking, the models are trained on the full trainingsets. The RBF widths, scale and noise variance are initialised with an isotropic kernel(with a single length scale li = l) which helps to avoid local minima. In an oracle-likeexperiment to understand the effectiveness of our features and the potential of GPs forfeature selection, a forward selection approach is used to select features ranked from topto worst by GPs and use these to train models with increasing numbers of features (alsousing GPs) Shah et al. [2013b], which are then evaluated directly on the test set. Thesubset of the top ranked features that minimises error in each test set is selected to reportoptimal results in Table 2.2.
CHAPTER 2. BENCHMARK 9
2.3 Feature sets
As feature sets, we consider our subset of 17 baseline features, and all features availablein QuEst, with or without feature selection. In other words, for each dataset we build thefollowing systems:
• BL: 17 baseline features that performed well across languages in previous work andwere used as baseline in the WMT12-13 QE tasks.
• AF: All features available for the dataset, including both black-box, glass-box,pseudo-reference, and advanced linguistic features, as described in D2.1.2, whenavailable.
• FS: Feature selection for automatic ranking and selection of top features from setAF using Gaussian Processes.
2.4 Evaluation metrics
Mean Absolute Error (MAE) and Root Mean Squared Error (RMSE) are used to evaluatethe models. Evaluation against the human rankings is done using the Kendall’s τ correla-tion [Bojar et al., 2013], where a pair is concordant, c, if the ordering agrees, discordant,d, if their ordering disagrees, and neither concordant nor discordant if their rankings areequal.
MAE =
∑Ni=1 |H(si)− V (si)|
N
RMSE =
√∑Ni=1(H(si)− V (si))2
N
where:
N = |S| is the number of test instances,
H(si) is the predicted score for si,
V (si) is the human score for si,
2.5 Results
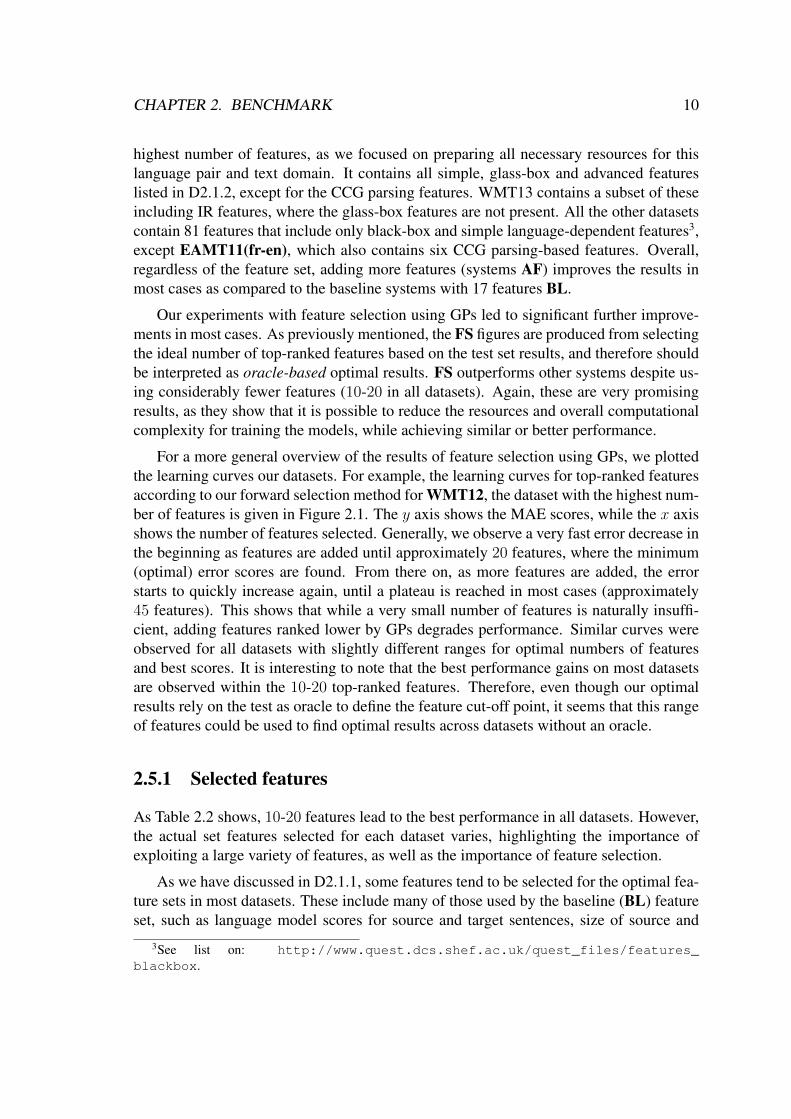
The results with Gaussian Process as learning algorithm and the oracle-based feature se-lection process are given in Table 2.2. We note that WMT12 is the dataset with the
CHAPTER 2. BENCHMARK 10
highest number of features, as we focused on preparing all necessary resources for thislanguage pair and text domain. It contains all simple, glass-box and advanced featureslisted in D2.1.2, except for the CCG parsing features. WMT13 contains a subset of theseincluding IR features, where the glass-box features are not present. All the other datasetscontain 81 features that include only black-box and simple language-dependent features3,except EAMT11(fr-en), which also contains six CCG parsing-based features. Overall,regardless of the feature set, adding more features (systems AF) improves the results inmost cases as compared to the baseline systems with 17 features BL.
Our experiments with feature selection using GPs led to significant further improve-ments in most cases. As previously mentioned, the FS figures are produced from selectingthe ideal number of top-ranked features based on the test set results, and therefore shouldbe interpreted as oracle-based optimal results. FS outperforms other systems despite us-ing considerably fewer features (10-20 in all datasets). Again, these are very promisingresults, as they show that it is possible to reduce the resources and overall computationalcomplexity for training the models, while achieving similar or better performance.
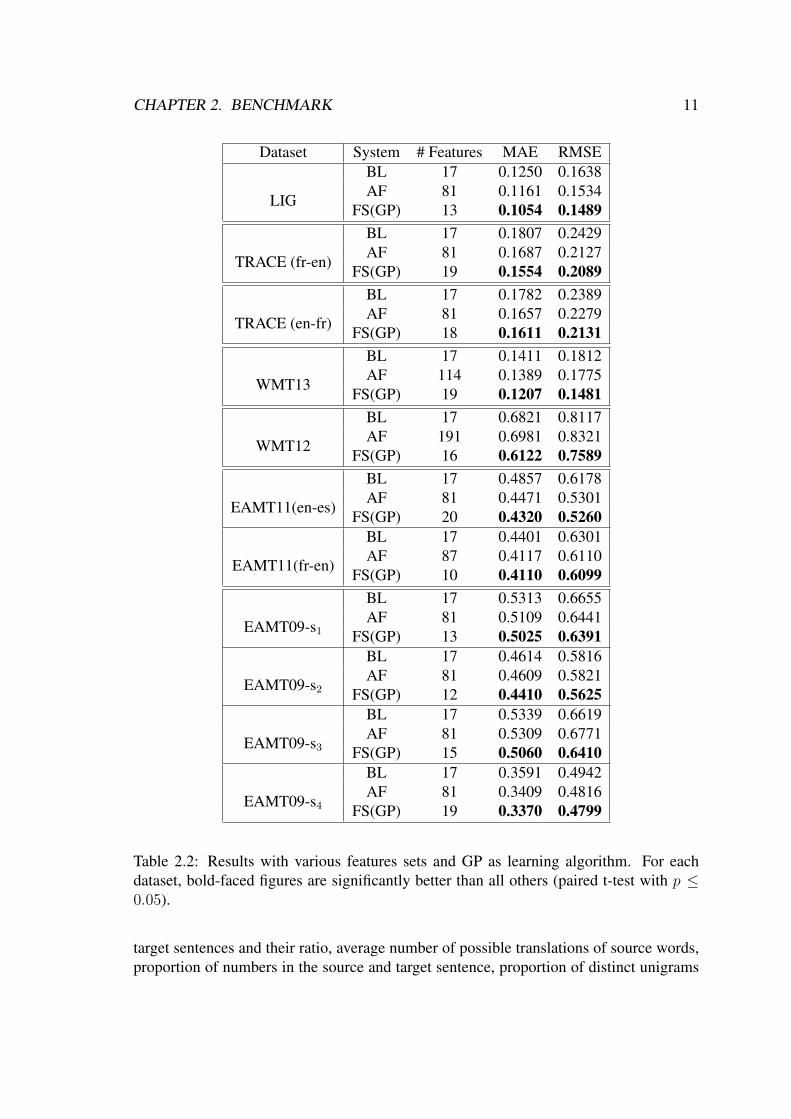
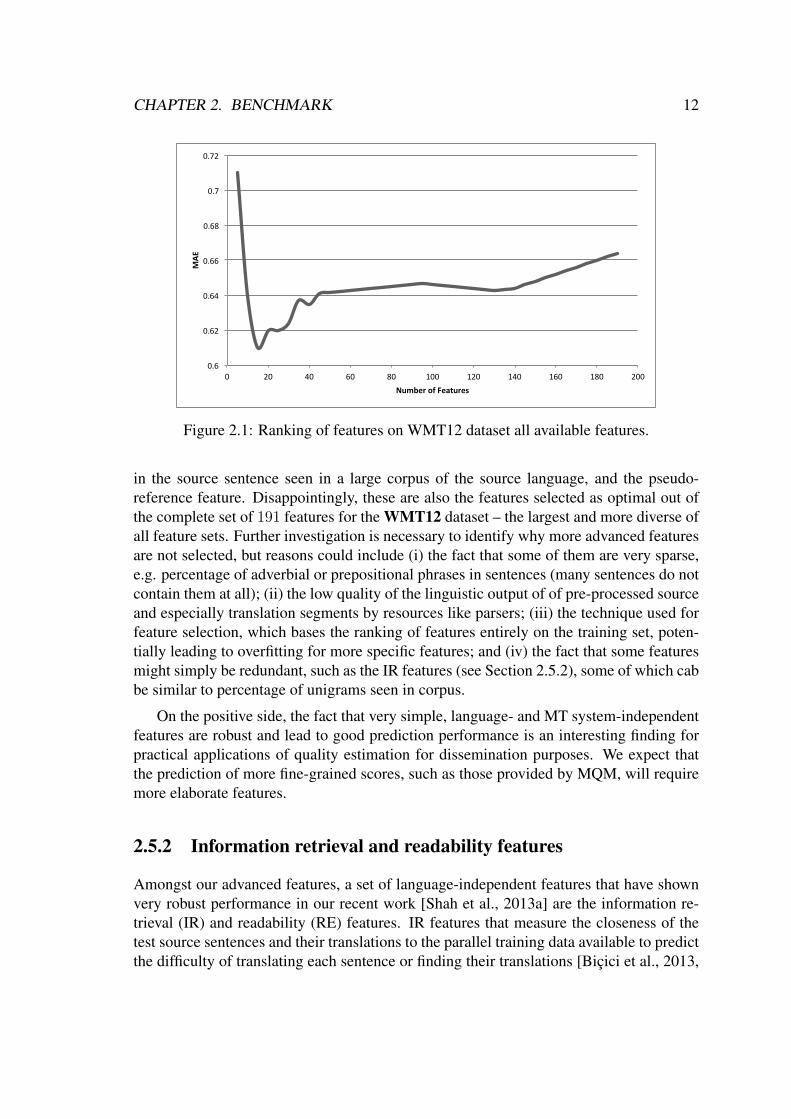
For a more general overview of the results of feature selection using GPs, we plottedthe learning curves our datasets. For example, the learning curves for top-ranked featuresaccording to our forward selection method for WMT12, the dataset with the highest num-ber of features is given in Figure 2.1. The y axis shows the MAE scores, while the x axisshows the number of features selected. Generally, we observe a very fast error decrease inthe beginning as features are added until approximately 20 features, where the minimum(optimal) error scores are found. From there on, as more features are added, the errorstarts to quickly increase again, until a plateau is reached in most cases (approximately45 features). This shows that while a very small number of features is naturally insuffi-cient, adding features ranked lower by GPs degrades performance. Similar curves wereobserved for all datasets with slightly different ranges for optimal numbers of featuresand best scores. It is interesting to note that the best performance gains on most datasetsare observed within the 10-20 top-ranked features. Therefore, even though our optimalresults rely on the test as oracle to define the feature cut-off point, it seems that this rangeof features could be used to find optimal results across datasets without an oracle.
2.5.1 Selected features
As Table 2.2 shows, 10-20 features lead to the best performance in all datasets. However,the actual set features selected for each dataset varies, highlighting the importance ofexploiting a large variety of features, as well as the importance of feature selection.
As we have discussed in D2.1.1, some features tend to be selected for the optimal fea-ture sets in most datasets. These include many of those used by the baseline (BL) featureset, such as language model scores for source and target sentences, size of source and
3See list on: http://www.quest.dcs.shef.ac.uk/quest_files/features_blackbox.
CHAPTER 2. BENCHMARK 11
Dataset System # Features MAE RMSE
LIG
BL 17 0.1250 0.1638AF 81 0.1161 0.1534
FS(GP) 13 0.1054 0.1489
TRACE (fr-en)
BL 17 0.1807 0.2429AF 81 0.1687 0.2127
FS(GP) 19 0.1554 0.2089
TRACE (en-fr)
BL 17 0.1782 0.2389AF 81 0.1657 0.2279
FS(GP) 18 0.1611 0.2131
WMT13
BL 17 0.1411 0.1812AF 114 0.1389 0.1775
FS(GP) 19 0.1207 0.1481
WMT12
BL 17 0.6821 0.8117AF 191 0.6981 0.8321
FS(GP) 16 0.6122 0.7589
EAMT11(en-es)
BL 17 0.4857 0.6178AF 81 0.4471 0.5301
FS(GP) 20 0.4320 0.5260
EAMT11(fr-en)
BL 17 0.4401 0.6301AF 87 0.4117 0.6110
FS(GP) 10 0.4110 0.6099
EAMT09-s1
BL 17 0.5313 0.6655AF 81 0.5109 0.6441
FS(GP) 13 0.5025 0.6391
EAMT09-s2
BL 17 0.4614 0.5816AF 81 0.4609 0.5821
FS(GP) 12 0.4410 0.5625
EAMT09-s3
BL 17 0.5339 0.6619AF 81 0.5309 0.6771
FS(GP) 15 0.5060 0.6410
EAMT09-s4
BL 17 0.3591 0.4942AF 81 0.3409 0.4816
FS(GP) 19 0.3370 0.4799
Table 2.2: Results with various features sets and GP as learning algorithm. For eachdataset, bold-faced figures are significantly better than all others (paired t-test with p ≤0.05).
target sentences and their ratio, average number of possible translations of source words,proportion of numbers in the source and target sentence, proportion of distinct unigrams
CHAPTER 2. BENCHMARK 12
0.6$
0.62$
0.64$
0.66$
0.68$
0.7$
0.72$
0$ 20$ 40$ 60$ 80$ 100$ 120$ 140$ 160$ 180$ 200$
MAE
$
Number$of$Features$
Figure 2.1: Ranking of features on WMT12 dataset all available features.
in the source sentence seen in a large corpus of the source language, and the pseudo-reference feature. Disappointingly, these are also the features selected as optimal out ofthe complete set of 191 features for the WMT12 dataset – the largest and more diverse ofall feature sets. Further investigation is necessary to identify why more advanced featuresare not selected, but reasons could include (i) the fact that some of them are very sparse,e.g. percentage of adverbial or prepositional phrases in sentences (many sentences do notcontain them at all); (ii) the low quality of the linguistic output of of pre-processed sourceand especially translation segments by resources like parsers; (iii) the technique used forfeature selection, which bases the ranking of features entirely on the training set, poten-tially leading to overfitting for more specific features; and (iv) the fact that some featuresmight simply be redundant, such as the IR features (see Section 2.5.2), some of which cabbe similar to percentage of unigrams seen in corpus.
On the positive side, the fact that very simple, language- and MT system-independentfeatures are robust and lead to good prediction performance is an interesting finding forpractical applications of quality estimation for dissemination purposes. We expect thatthe prediction of more fine-grained scores, such as those provided by MQM, will requiremore elaborate features.
2.5.2 Information retrieval and readability features
Amongst our advanced features, a set of language-independent features that have shownvery robust performance in our recent work [Shah et al., 2013a] are the information re-trieval (IR) and readability (RE) features. IR features that measure the closeness of thetest source sentences and their translations to the parallel training data available to predictthe difficulty of translating each sentence or finding their translations [Bicici et al., 2013,
CHAPTER 2. BENCHMARK 13
Bicici, 2013]. For the top 5 retrieved instances, we compute:
• IR score over the source sentence or its translation
• BLEU scores over source sentence or its translation
• F1 scores over source sentence or its translation [Bicici, 2011]
Readability (RE) features are simple features that are aimed to represent the difficulty oftranslating a sentence:
• LIX readability score 4 for source and target sentences
• Average number of characters in source and target words and their ratios
In our previous work, we observed that in many cases the performance of these fea-tures alone is superior to that of baseline features, and depending on the score to be pre-dicted, they can outperform the set of all features. Therefore, in this section, we specif-ically evaluate the contribution of these features to the prediction performance in twodatasets: EAMT09 and WMT13.
In what follows, ALL indicates the complete feature set, as AF in Section 2.5, withoutincluding the IR/RE features. We use Support Vector Regression (SVR) as the learningalgorithm with the following parameters: C = 3.25, γ = 0.0001, ε = 0.1 optimisedvia grid search. We experiment with predicting two types of scores: F1 scores [Biciciand Yuret, 2011, Bicici, 2011] and post-editing effort (PEE) scores, i.e., [1-4] scores forEAMT09, or HTER scores for WMT13. F1 is calculated as follows:
2× P ×RP +R
where P is the precision and R is the recall over n-gram features (1–5-grams) of themachine translation compared to the reference translation. Its implementation is providedis part of QUEST. F1 has been shown to correlate better with human judgements thanTER [Bicici and Yuret, 2011, Callison-Burch et al., 2011].
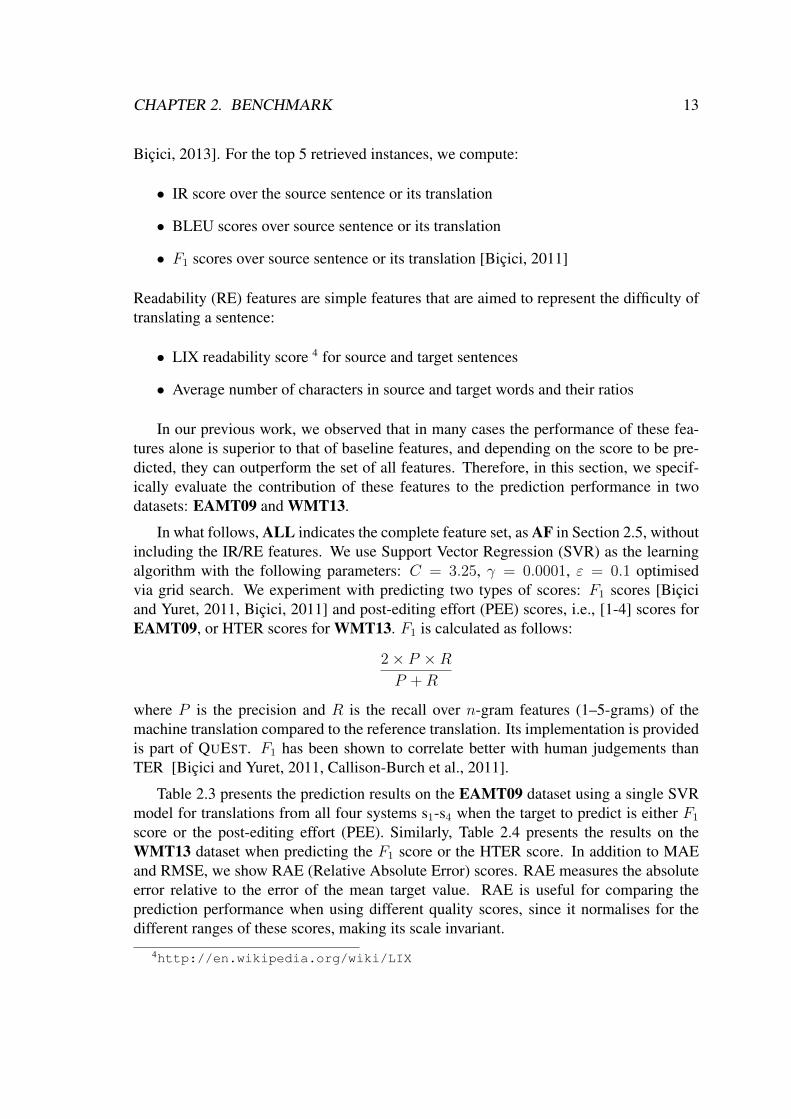
Table 2.3 presents the prediction results on the EAMT09 dataset using a single SVRmodel for translations from all four systems s1-s4 when the target to predict is either F1
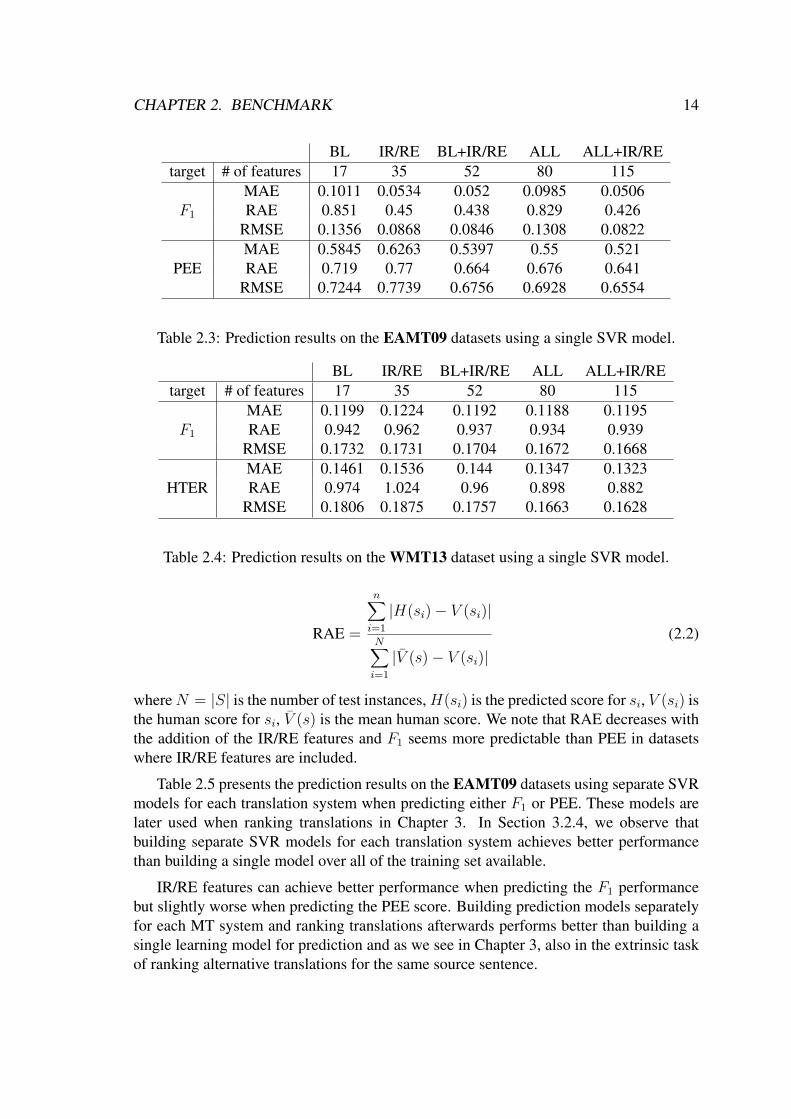
score or the post-editing effort (PEE). Similarly, Table 2.4 presents the results on theWMT13 dataset when predicting the F1 score or the HTER score. In addition to MAEand RMSE, we show RAE (Relative Absolute Error) scores. RAE measures the absoluteerror relative to the error of the mean target value. RAE is useful for comparing theprediction performance when using different quality scores, since it normalises for thedifferent ranges of these scores, making its scale invariant.
4http://en.wikipedia.org/wiki/LIX
CHAPTER 2. BENCHMARK 14
BL IR/RE BL+IR/RE ALL ALL+IR/REtarget # of features 17 35 52 80 115
F1
MAE 0.1011 0.0534 0.052 0.0985 0.0506RAE 0.851 0.45 0.438 0.829 0.426
RMSE 0.1356 0.0868 0.0846 0.1308 0.0822
PEEMAE 0.5845 0.6263 0.5397 0.55 0.521RAE 0.719 0.77 0.664 0.676 0.641
RMSE 0.7244 0.7739 0.6756 0.6928 0.6554
Table 2.3: Prediction results on the EAMT09 datasets using a single SVR model.
BL IR/RE BL+IR/RE ALL ALL+IR/REtarget # of features 17 35 52 80 115
F1
MAE 0.1199 0.1224 0.1192 0.1188 0.1195RAE 0.942 0.962 0.937 0.934 0.939
RMSE 0.1732 0.1731 0.1704 0.1672 0.1668
HTERMAE 0.1461 0.1536 0.144 0.1347 0.1323RAE 0.974 1.024 0.96 0.898 0.882
RMSE 0.1806 0.1875 0.1757 0.1663 0.1628
Table 2.4: Prediction results on the WMT13 dataset using a single SVR model.
RAE =
n∑i=1
|H(si)− V (si)|
N∑i=1
|V (s)− V (si)|(2.2)
whereN = |S| is the number of test instances,H(si) is the predicted score for si, V (si) isthe human score for si, V (s) is the mean human score. We note that RAE decreases withthe addition of the IR/RE features and F1 seems more predictable than PEE in datasetswhere IR/RE features are included.
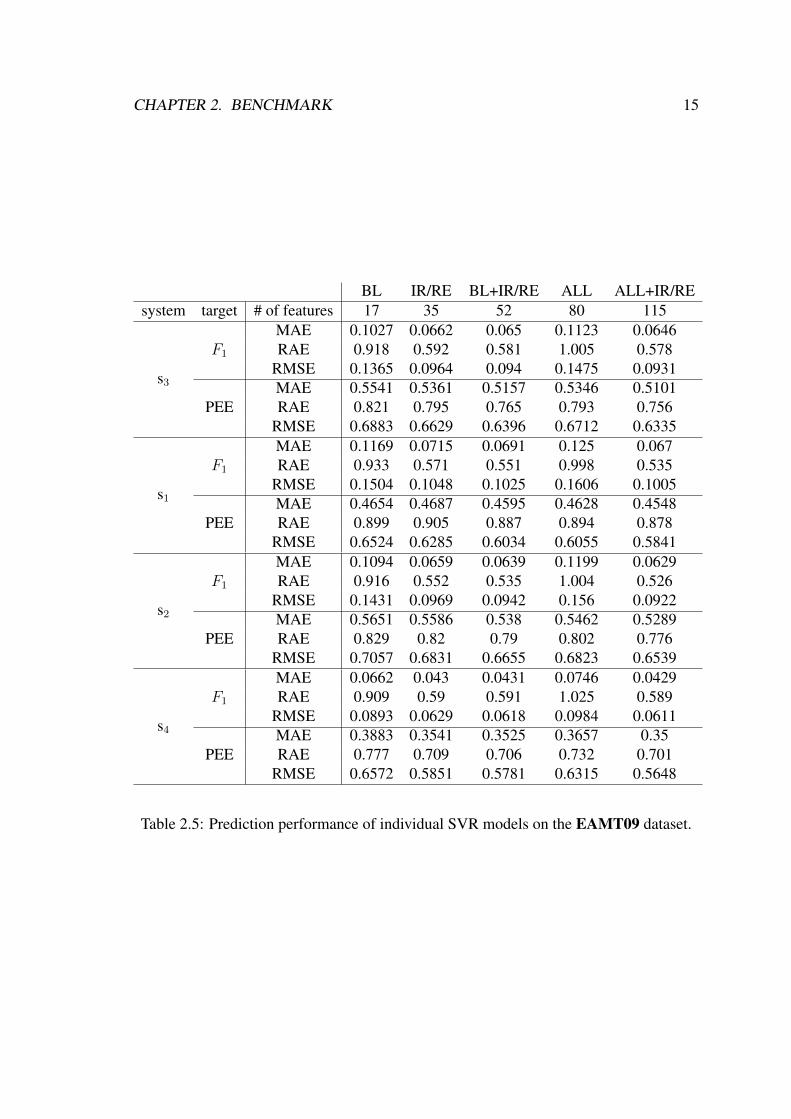
Table 2.5 presents the prediction results on the EAMT09 datasets using separate SVRmodels for each translation system when predicting either F1 or PEE. These models arelater used when ranking translations in Chapter 3. In Section 3.2.4, we observe thatbuilding separate SVR models for each translation system achieves better performancethan building a single model over all of the training set available.
IR/RE features can achieve better performance when predicting the F1 performancebut slightly worse when predicting the PEE score. Building prediction models separatelyfor each MT system and ranking translations afterwards performs better than building asingle learning model for prediction and as we see in Chapter 3, also in the extrinsic taskof ranking alternative translations for the same source sentence.
CHAPTER 2. BENCHMARK 15
BL IR/RE BL+IR/RE ALL ALL+IR/REsystem target # of features 17 35 52 80 115
s3
F1
MAE 0.1027 0.0662 0.065 0.1123 0.0646RAE 0.918 0.592 0.581 1.005 0.578
RMSE 0.1365 0.0964 0.094 0.1475 0.0931
PEEMAE 0.5541 0.5361 0.5157 0.5346 0.5101RAE 0.821 0.795 0.765 0.793 0.756
RMSE 0.6883 0.6629 0.6396 0.6712 0.6335
s1
F1
MAE 0.1169 0.0715 0.0691 0.125 0.067RAE 0.933 0.571 0.551 0.998 0.535
RMSE 0.1504 0.1048 0.1025 0.1606 0.1005
PEEMAE 0.4654 0.4687 0.4595 0.4628 0.4548RAE 0.899 0.905 0.887 0.894 0.878
RMSE 0.6524 0.6285 0.6034 0.6055 0.5841
s2
F1
MAE 0.1094 0.0659 0.0639 0.1199 0.0629RAE 0.916 0.552 0.535 1.004 0.526
RMSE 0.1431 0.0969 0.0942 0.156 0.0922
PEEMAE 0.5651 0.5586 0.538 0.5462 0.5289RAE 0.829 0.82 0.79 0.802 0.776
RMSE 0.7057 0.6831 0.6655 0.6823 0.6539
s4
F1
MAE 0.0662 0.043 0.0431 0.0746 0.0429RAE 0.909 0.59 0.591 1.025 0.589
RMSE 0.0893 0.0629 0.0618 0.0984 0.0611
PEEMAE 0.3883 0.3541 0.3525 0.3657 0.35RAE 0.777 0.709 0.706 0.732 0.701
RMSE 0.6572 0.5851 0.5781 0.6315 0.5648
Table 2.5: Prediction performance of individual SVR models on the EAMT09 dataset.
CHAPTER 2. BENCHMARK 16
2.6 Predicting MQM
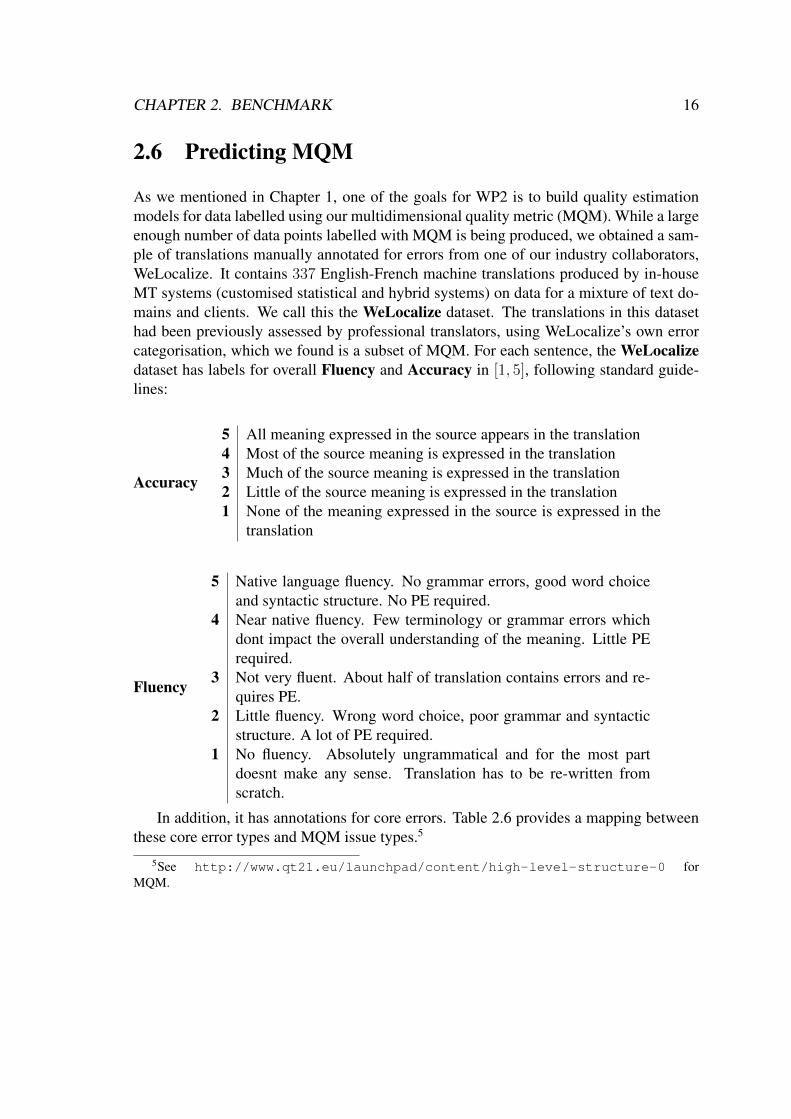
As we mentioned in Chapter 1, one of the goals for WP2 is to build quality estimationmodels for data labelled using our multidimensional quality metric (MQM). While a largeenough number of data points labelled with MQM is being produced, we obtained a sam-ple of translations manually annotated for errors from one of our industry collaborators,WeLocalize. It contains 337 English-French machine translations produced by in-houseMT systems (customised statistical and hybrid systems) on data for a mixture of text do-mains and clients. We call this the WeLocalize dataset. The translations in this datasethad been previously assessed by professional translators, using WeLocalize’s own errorcategorisation, which we found is a subset of MQM. For each sentence, the WeLocalizedataset has labels for overall Fluency and Accuracy in [1, 5], following standard guide-lines:
Accuracy
5 All meaning expressed in the source appears in the translation4 Most of the source meaning is expressed in the translation3 Much of the source meaning is expressed in the translation2 Little of the source meaning is expressed in the translation1 None of the meaning expressed in the source is expressed in the
translation
Fluency
5 Native language fluency. No grammar errors, good word choiceand syntactic structure. No PE required.
4 Near native fluency. Few terminology or grammar errors whichdont impact the overall understanding of the meaning. Little PErequired.
3 Not very fluent. About half of translation contains errors and re-quires PE.
2 Little fluency. Wrong word choice, poor grammar and syntacticstructure. A lot of PE required.
1 No fluency. Absolutely ungrammatical and for the most partdoesnt make any sense. Translation has to be re-written fromscratch.
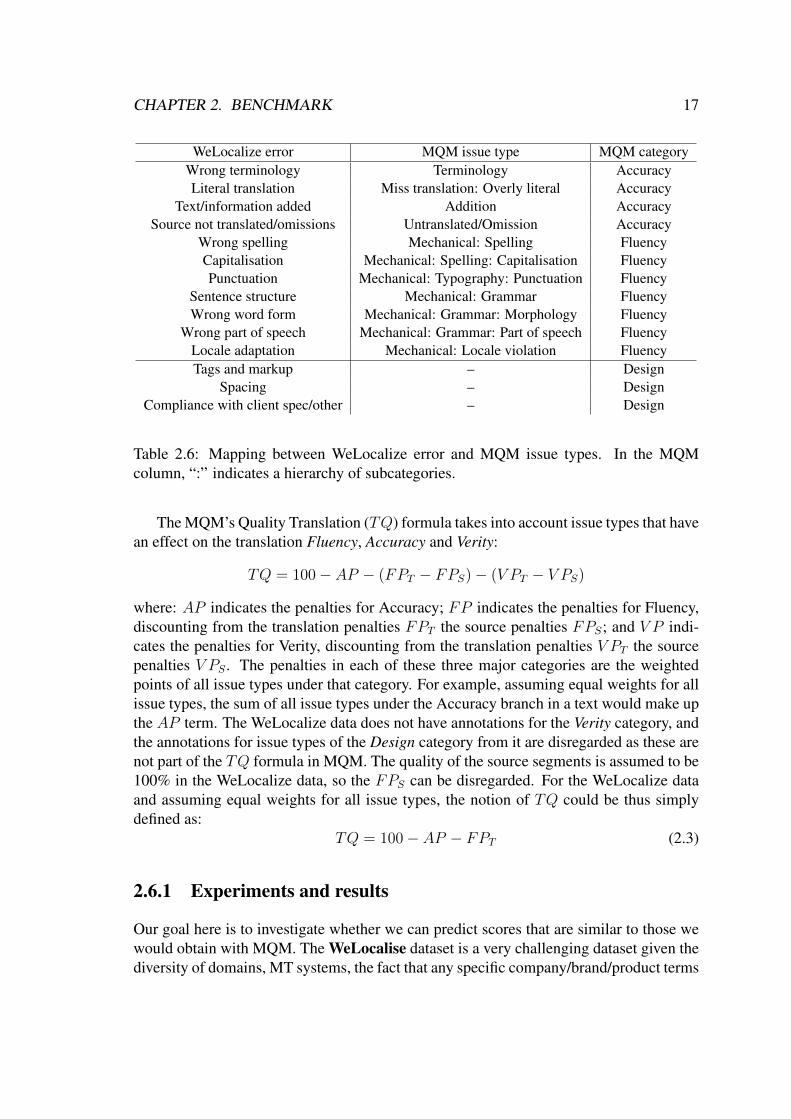
In addition, it has annotations for core errors. Table 2.6 provides a mapping betweenthese core error types and MQM issue types.5
5See http://www.qt21.eu/launchpad/content/high-level-structure-0 forMQM.
CHAPTER 2. BENCHMARK 17
WeLocalize error MQM issue type MQM categoryWrong terminology Terminology AccuracyLiteral translation Miss translation: Overly literal Accuracy
Text/information added Addition AccuracySource not translated/omissions Untranslated/Omission Accuracy
Wrong spelling Mechanical: Spelling FluencyCapitalisation Mechanical: Spelling: Capitalisation FluencyPunctuation Mechanical: Typography: Punctuation Fluency
Sentence structure Mechanical: Grammar FluencyWrong word form Mechanical: Grammar: Morphology Fluency
Wrong part of speech Mechanical: Grammar: Part of speech FluencyLocale adaptation Mechanical: Locale violation FluencyTags and markup – Design
Spacing – DesignCompliance with client spec/other – Design
Table 2.6: Mapping between WeLocalize error and MQM issue types. In the MQMcolumn, “:” indicates a hierarchy of subcategories.
The MQM’s Quality Translation (TQ) formula takes into account issue types that havean effect on the translation Fluency, Accuracy and Verity:
TQ = 100− AP − (FPT − FPS)− (V PT − V PS)
where: AP indicates the penalties for Accuracy; FP indicates the penalties for Fluency,discounting from the translation penalties FPT the source penalties FPS; and V P indi-cates the penalties for Verity, discounting from the translation penalties V PT the sourcepenalties V PS . The penalties in each of these three major categories are the weightedpoints of all issue types under that category. For example, assuming equal weights for allissue types, the sum of all issue types under the Accuracy branch in a text would make upthe AP term. The WeLocalize data does not have annotations for the Verity category, andthe annotations for issue types of the Design category from it are disregarded as these arenot part of the TQ formula in MQM. The quality of the source segments is assumed to be100% in the WeLocalize data, so the FPS can be disregarded. For the WeLocalize dataand assuming equal weights for all issue types, the notion of TQ could be thus simplydefined as:
TQ = 100− AP − FPT (2.3)
2.6.1 Experiments and results
Our goal here is to investigate whether we can predict scores that are similar to those wewould obtain with MQM. The WeLocalise dataset is a very challenging dataset given thediversity of domains, MT systems, the fact that any specific company/brand/product terms
CHAPTER 2. BENCHMARK 18
have been anonymised (replaced by ’x’, e.g.) and that we do not have access to the dataand resources used to build their translation systems, such as source and target trainingcorpora to build language models for QUEST. Therefore, we used existing resources forEnglish-French translations based on the news domain (the same resources as used for theTRACE dataset). We randomly split the 337 instances in 251 for training and 86 for test.
The features we use are the same as those described previously in this section:
• BL: 17 baseline features.
• AF: All features available for the dataset, which in this case are all black-box andsimple linguistic features, plus the pseudo-reference feature, totalling 80 features.
In addition to predicting the given WeLocalize accuracy and fluency scores, whichare already major categories in MQM, we attempt with a few variants of target scores toinvestigate prediction error at different levels of granularity and slight variants of accuracyand fluency notions. All of these scores are scaled into [0, 1], so they can be thought of as“percentages” (as in the TQ score) and such that the error of our prediction models usingthese labels can be compared against each other:
• W-Accuracy: the original accuracy scores given by the WeLocalize translator.
• W-Fluency: the original fluency scores given by the WeLocalize translator.
• W-TQ: translation quality score made up from applying the WeLocalize Accuracyand Fluency given scores to Equation 2.3.
• MQM-TQ: translation quality score made up from actually summing up all is-sue types under the Fluency and Accuracy categories in MQM using the mappingshowed in Table 2.6 and applying the terms to Equation 2.3.
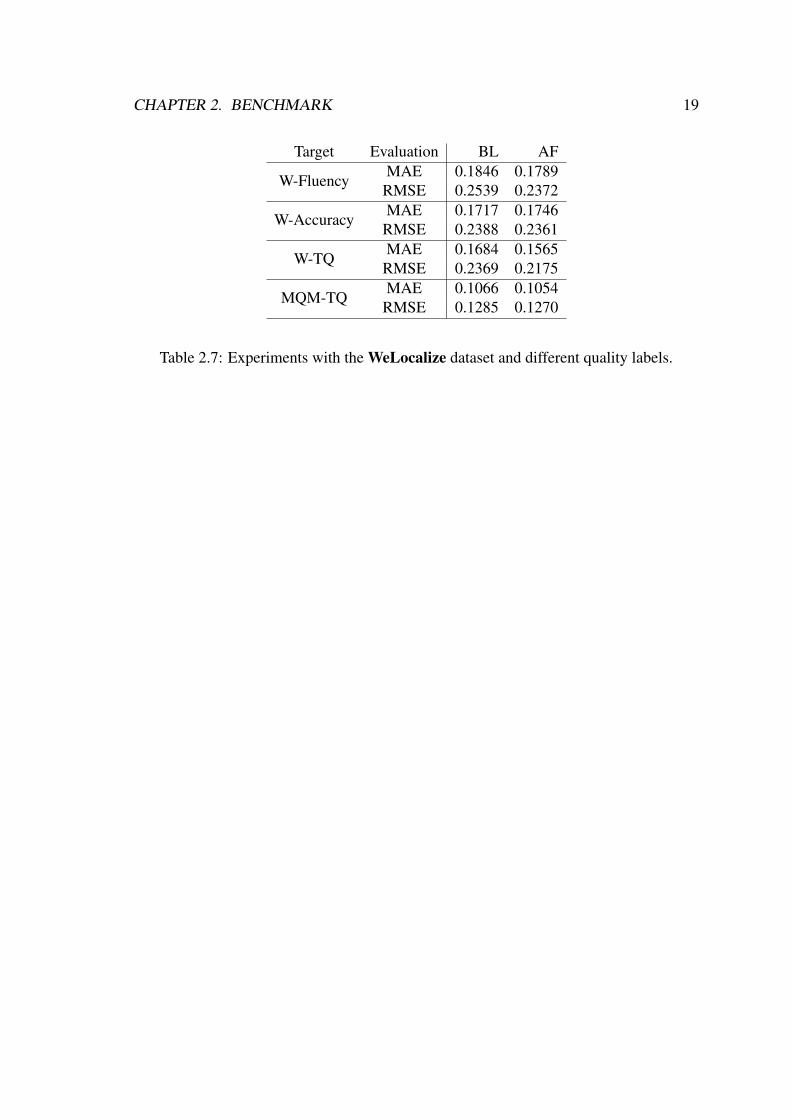
Results are reported in 2.7. Overall, the AF feature set, which includes the pseudo-reference feature, performs better. The average deviations between predicted and truescores of 15-17% in MAE are surprisingly low (and therefore, positive) considering howchallenging this dataset is. The most interesting outcome of this experiment was to ob-serve that by mapping error counts given by the professional translators into the MQMmetric (MQM-TQ target label) the prediction error is significantly lower than by takingthe more subjective fluency/adequacy judgements given by the same translators. In otherwords, by going from more fine-grained errors (or issue types) and generalising themthrough a single quality metric, such as TQ in MQM, as opposed to directly assigning anoverall quality score to each segment, we can most likely get more reliable quality labels,and therefore, also more reliable quality predictors.
CHAPTER 2. BENCHMARK 19
Target Evaluation BL AF
W-FluencyMAE 0.1846 0.1789
RMSE 0.2539 0.2372
W-AccuracyMAE 0.1717 0.1746
RMSE 0.2388 0.2361
W-TQMAE 0.1684 0.1565
RMSE 0.2369 0.2175
MQM-TQMAE 0.1066 0.1054
RMSE 0.1285 0.1270
Table 2.7: Experiments with the WeLocalize dataset and different quality labels.
Chapter 3
Ranking translations
Whereas research on quality estimation has recently focused on predicting absolutesingle-sentence quality scores, for certain applications an absolute score may not be nec-essary. In this chapter we look at the problem from a different perspective. Our goal isto achieve comparative quality estimation by contrasting the output of several translationsystems against each other, given the same input. The outcome of this process is a rankingof alternative translations based on their predicted quality. This can be thought of as anextrinsic way of assessing quality predictions for the task of MT system selection.
We present two sets of methods to learn this ranking from examples annotated witheither absolute or relative (rankings) scores, and apply these methods to perform a qual-ity ranking of several alternative translation outputs of the same source sentence on twodatasets.
3.1 Datasets
The experiments were performed on three datasets for which multiple machine transla-tions were available for each source sentence:
EAMT09 English Europarl sentences translated by four SMT systems into Spanish andscored for post-editing effort (PEE) in 1-4 (highest-lowest). Systems are denoted by s1-s4. These are the same datasets as used in Chapter 2, with the same splits for trainingand test: 3, 095 for training, and 906 for testing. To contextualise the problem of rankingtranslations in this dataset, Table 3.1 shows figures obtained by computing automaticevaluation metric (BLEU, NIST and F1) for machine translations from each system, aswell as figures obtained for an oracle-based selection of the best translation among thefour systems by ranking these alternatives based on different sentence scores (PEE, BLEUand F1).
20

CHAPTER 3. RANKING TRANSLATIONS 21
System BLEU NIST F1
s1 0.3795 8.0731 0.3723s2 0.3450 7.7003 0.3361s3 0.3145 7.7044 0.3137s4 0.1910 6.1628 0.2148oracle PEE 0.3678 7.9997 0.3574oracle BLEU 0.4132 8.4734 0.4014oracle F1 0.4130 8.4962 0.4020
Table 3.1: Automatic evaluation metric scores (BLEU, NIST and F1) for automatic trans-lations in each system of the EAMT09 dataset, and for oracle-based selection of besttranslation among four systems based on different sentence scores (PEE, BLEU and F1).
WMT13-rank(de-en) A set of up to five alternative German-English sentence trans-lations of Europarl and news texts produced by different MT systems (rule-based, sta-tistical, etc.) for each source sentence and ranked for quality by humans. This was theoutcome of the manual evaluation of the translation task from WMT08 until WMT12.7, 098 source sentences and 32, 922 translations are used for training (WMT09-WMT12datasets), while 365 source sentences and 1, 810 translations are used for test (WMT08dataset). This dataset was used in the WMT13 shared task on quality estimation: Task 1.2Selecting Best Translation.
WMT13-rank(en-es) Same as the above, but for English-Spanish sentence translations.4, 592 source sentences and 22, 447 translations are used for training (WMT09-WMT12datasets), while 264 source sentences and 1, 315 translations are used for test (WMT08dataset).
3.2 Ranking using absolute score predictions
A simple approach to rank multiple MT translations for each source sentence is to treatthese various translations independently by:
• Pooling all variants together, for all source sentences, and building a single predic-tion model for all MT systems; or
• Building an individual prediction model for all translations from each MT system.
In both cases, the score predicted for each alternative translation of a given source sen-tence can then be used to rank these alternatives. This is a particularly appealing ap-proach when training instances are labelled with absolute scores, which is the case for the

CHAPTER 3. RANKING TRANSLATIONS 22
EAMT09 datasets. We use this approach with both the EAMT09 and WMT13 datasets,but for the latter we adopt the simplistic strategy of treating relative 5-way rankings as ab-solute scores in [1, 5] (best-worst). For example, a sentence ranked 1st would be assignedscore of 1 (best possible). We also predict F1 scores based on reference translations,which is a somewhat less naıve strategy for the 5-way ranked data.
3.2.1 Algorithms and settings
In all experiments in this Section with use Support Vector Regression (SVR) as the learn-ing algorithm with the following parameters: C = 3.25, γ = 0.0001, ε = 0.1, obtainedvia grid search with cross-validation on the training set.
We experiment with two variants of quality labels to predict: F1 scores computedbased on the reference translations (available at training time), and absolute scores: [1−4]for EAMT09 and [1− 5] for WMT13 datasets. For simplicity, we refer to these as “PEEscores”.
3.2.2 Feature sets
In order to make the results as comparable as possible across datasets, we only use featuresthat are available for both datasets:
• AF, which here corresponds to the standard set 80 black-box and simple language-dependent features described in Section 2.5 plus the information retrieval and read-ability features described in Section 2.5.2.
• BL, which corresponds to the 17 baseline features described in Section 2.3.
3.2.3 Evaluation metrics
The evaluation metrics depend on the type of experiment. Our first experiment (1-besttranslation) looks at the set of translations ranked as first for each source sentence by ourmethods (e.g., 906 translations for the EAMT09 datasets) and computes standard BLEU,NIST and F1 scores on this dataset against reference translations, and also computes ac-curacy: the percentage of source sentences for which both humans and ranker modelagreed on the first-ranked translation.
The second set of experiments (correlation with human judgements) measures howwell the rankers and humans agree on the overall ranking of translations for each sourcesentence, but looking at these translations two-by-two, in pairs. For that, we use Kendall’sτ correlation coefficient:

CHAPTER 3. RANKING TRANSLATIONS 23
τ =c− dc+ d
(3.1)
where c is number of concordant pairs (human and ranker agree), and d is number ofdiscordant pairs (human and ranker disagree). Ties in the human rankings, which are veryfrequent in the EAMT09 dataset, are ignored. i.e., not considered neither as concordantnor as discordant.
3.2.4 Results
1-best translation
Table 3.2 presents the 1-best translation results for the EAMT09 dataset using a singleSVR model. We rank the translations from each system in this dataset based on thepredictions produced by a single, pooled model to obtain the best translations for eachsource sentence. In case of ties, we randomly pick one among the equally scoring systemoutputs. As a baseline, we compute accuracy best-system, which is the percentage ofsource sentences for which the best system on average (s1) actually provides the besttranslation. This mimics a “majority class” baseline. The results show that the AF featuresets significantly outperform the baseline features. Table 3.3 presents the results whenusing individual SVR models built for each SMT system. Although not presented inthese results, we have also obtained results on IR+RE feature sets
Target Evaluation BL AFF1 BLEU 0.3660 0.4066
PEE BLEU 0.3654 0.3909F1 NIST 7.9036 8.413
PEE NIST 7.9367 8.229F1 F1 0.3611 0.3958
PEE F1 0.3562 0.3831F1 accuracy 0.7208 0.7528
PEE accuracy 0.7097 0.7804F1 accuracy best-system 0.5287 0.4989
PEE accuracy best-system 0.4768 0.5751
Table 3.2: 1-best translation results for the EAMT09 datasets predicting F1 or PEE scoresusing a single SVR model. Results in bold face significantly improve over the BL fea-tures.
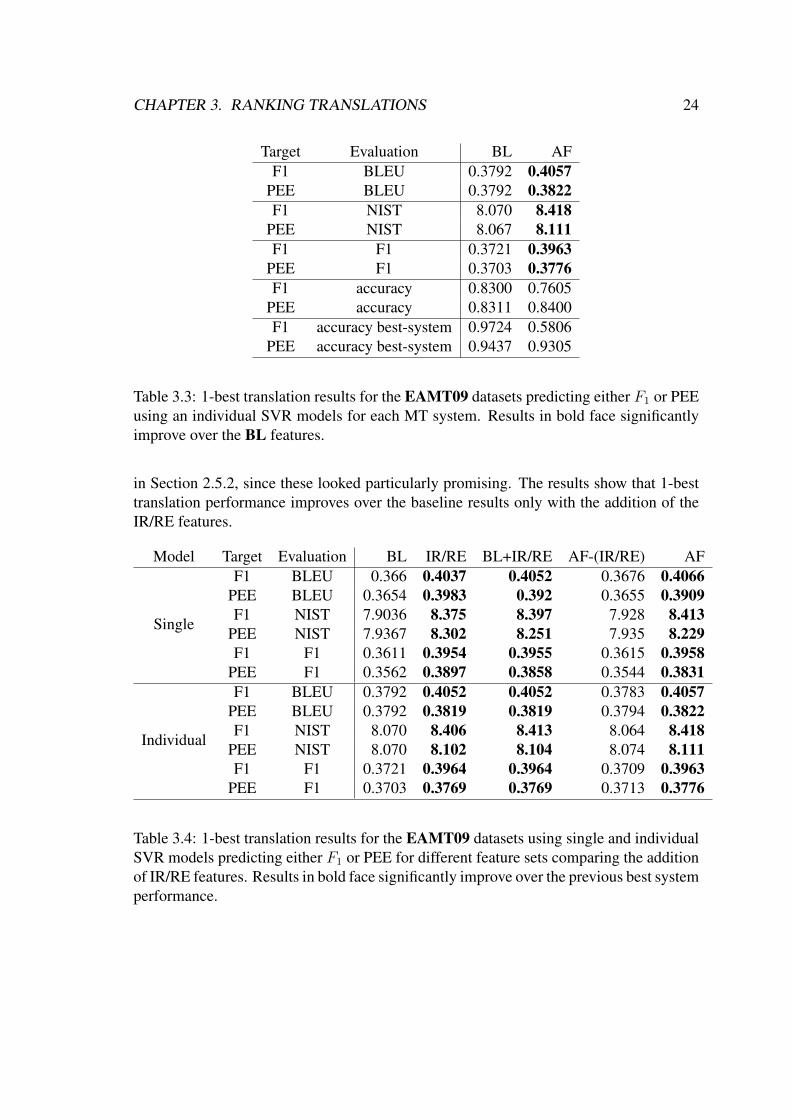
For this particular dataset with single and individual SVR models, in Table 3.4 wealso look at the performance improvement from the addition of IR/RE features described
CHAPTER 3. RANKING TRANSLATIONS 24
Target Evaluation BL AFF1 BLEU 0.3792 0.4057
PEE BLEU 0.3792 0.3822F1 NIST 8.070 8.418
PEE NIST 8.067 8.111F1 F1 0.3721 0.3963
PEE F1 0.3703 0.3776F1 accuracy 0.8300 0.7605
PEE accuracy 0.8311 0.8400F1 accuracy best-system 0.9724 0.5806
PEE accuracy best-system 0.9437 0.9305
Table 3.3: 1-best translation results for the EAMT09 datasets predicting either F1 or PEEusing an individual SVR models for each MT system. Results in bold face significantlyimprove over the BL features.
in Section 2.5.2, since these looked particularly promising. The results show that 1-besttranslation performance improves over the baseline results only with the addition of theIR/RE features.
Model Target Evaluation BL IR/RE BL+IR/RE AF-(IR/RE) AF
Single
F1 BLEU 0.366 0.4037 0.4052 0.3676 0.4066PEE BLEU 0.3654 0.3983 0.392 0.3655 0.3909F1 NIST 7.9036 8.375 8.397 7.928 8.413
PEE NIST 7.9367 8.302 8.251 7.935 8.229F1 F1 0.3611 0.3954 0.3955 0.3615 0.3958
PEE F1 0.3562 0.3897 0.3858 0.3544 0.3831
Individual
F1 BLEU 0.3792 0.4052 0.4052 0.3783 0.4057PEE BLEU 0.3792 0.3819 0.3819 0.3794 0.3822F1 NIST 8.070 8.406 8.413 8.064 8.418
PEE NIST 8.070 8.102 8.104 8.074 8.111F1 F1 0.3721 0.3964 0.3964 0.3709 0.3963
PEE F1 0.3703 0.3769 0.3769 0.3713 0.3776
Table 3.4: 1-best translation results for the EAMT09 datasets using single and individualSVR models predicting either F1 or PEE for different feature sets comparing the additionof IR/RE features. Results in bold face significantly improve over the previous best systemperformance.
CHAPTER 3. RANKING TRANSLATIONS 25
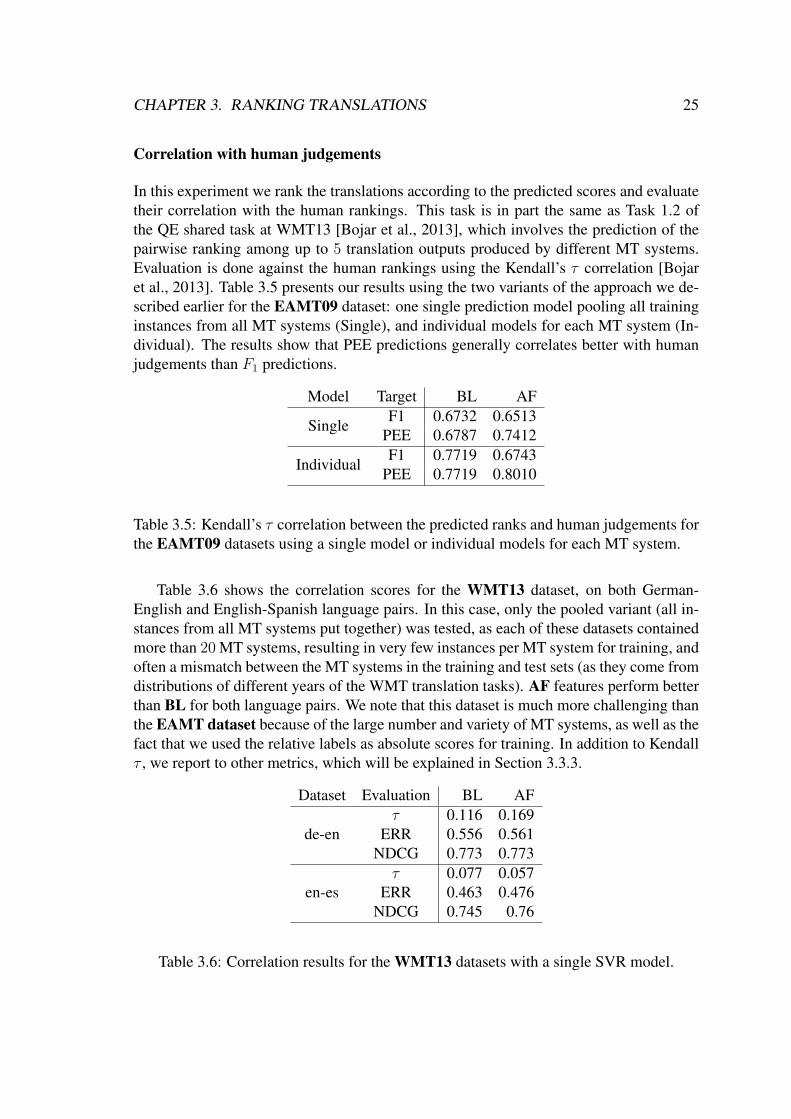
Correlation with human judgements
In this experiment we rank the translations according to the predicted scores and evaluatetheir correlation with the human rankings. This task is in part the same as Task 1.2 ofthe QE shared task at WMT13 [Bojar et al., 2013], which involves the prediction of thepairwise ranking among up to 5 translation outputs produced by different MT systems.Evaluation is done against the human rankings using the Kendall’s τ correlation [Bojaret al., 2013]. Table 3.5 presents our results using the two variants of the approach we de-scribed earlier for the EAMT09 dataset: one single prediction model pooling all traininginstances from all MT systems (Single), and individual models for each MT system (In-dividual). The results show that PEE predictions generally correlates better with humanjudgements than F1 predictions.
Model Target BL AF
SingleF1 0.6732 0.6513
PEE 0.6787 0.7412
IndividualF1 0.7719 0.6743
PEE 0.7719 0.8010
Table 3.5: Kendall’s τ correlation between the predicted ranks and human judgements forthe EAMT09 datasets using a single model or individual models for each MT system.
Table 3.6 shows the correlation scores for the WMT13 dataset, on both German-English and English-Spanish language pairs. In this case, only the pooled variant (all in-stances from all MT systems put together) was tested, as each of these datasets containedmore than 20 MT systems, resulting in very few instances per MT system for training, andoften a mismatch between the MT systems in the training and test sets (as they come fromdistributions of different years of the WMT translation tasks). AF features perform betterthan BL for both language pairs. We note that this dataset is much more challenging thanthe EAMT dataset because of the large number and variety of MT systems, as well as thefact that we used the relative labels as absolute scores for training. In addition to Kendallτ , we report to other metrics, which will be explained in Section 3.3.3.
Dataset Evaluation BL AF
de-enτ 0.116 0.169
ERR 0.556 0.561NDCG 0.773 0.773
en-esτ 0.077 0.057
ERR 0.463 0.476NDCG 0.745 0.76
Table 3.6: Correlation results for the WMT13 datasets with a single SVR model.
CHAPTER 3. RANKING TRANSLATIONS 26
3.3 Ranking using pairwise classification
Here we present some experiments with pairwise classification, where we already modelthe task as a ranking problem, taking advantage of powerful binary classification methods.Contrary to the previous experiments, machine learning is trained by using quality labelsprovided by annotators as ranks, not as absolute scores.
3.3.1 Algorithms and settings
The training was mainly done with logistic regression, which optimises a logistic func-tion to predict values in the range between zero and one [Cameron, 1998]. The logisticfunction is fitted using the Newton-Raphson algorithm to iteratively minimize the leastsquares error computed from training data [Miller, 2002].
Experiments are repeated with two variants of Logistic Regression concerning internalfeatures treatment: Stepwise Feature Set Selection [Hosmer, 1989] and L2-Regularization[Lin et al., 2007]. We also provide indicative results with Naıve Bayes and k-nearestNeighbours (knn).
Binary classifier decisions were weighed with the classification confidence in order toavoid the generation of ties as suggested in [Avramidis, 2013].
For the EAMT09 dataset, the individual quality scores given by the annotators foreach alternative translation are converted into a ranking so that only relative quality islearnt.
3.3.2 Feature sets
The experiments contain the following features sets:
• BL: 17 baseline features, as before.
• PCFG: parsing-based features (counts of all node labels, parse log-likelihood andthe number of the n-best parse trees generated).
• BL+PCFG: Combination of both of the above.
The reason for different feature sets, as compared to those used in previous experi-ments, is that for pairwise modelling where alternative translations are directly comparedat training time, many of QUEST features are not applicable. These are the features thatrely – at least to some extent – on the source sentence, which in this case are exactlythe same. In other words, the features values would be the same (same source sentence)for instances that are technically different (different translations). In addition, rankingapproaches arguably become less effective as the number of features increase.

CHAPTER 3. RANKING TRANSLATIONS 27
3.3.3 Evaluation metrics
Kendall’s tau measures the correlation between two ranking lists on a segment level bycounting concordant or discordant pairwise comparisons. We apply ties penalization of[Callison-Burch et al., 2008] which follows these steps:
• Pairwise ties in the human-annotated test set are excluded from the calculations, asties are considered to form uncertain samples that cannot be used for evaluation.
• For each remaining pairwise comparison, where human annotation has not resultedin a tie, every tie on the machine-predicted rankings is penalized by being countedas a discordant pair.
Normalized Discounted Cumulative Gain (NDCG) includes a discount, which refersto the fact that the rank scores are weighted by a decreasing function of the rank i of theitem.
DCGp =p∑
i=1
2reli − 1
log2(i+ 1)(3.2)
In our case, we consider that relevance of each rank (reli) is inversely proportional to itsrank index.
NDCG divides the DCG by the Ideal Discounted Cumulative Gain (IDCG), the maximumpossible DCG until position p. Then, NDGC is defined as:
NDCGp =DCGp
IDCGp
(3.3)
The Expected Reciprocal Rank (ERR) has been suggested as an improvement of NDCGin order to better model the fact that the likelihood a user examines the translation at ranki is dependent on how satisfied the user was with the translations observed previously inthe ranking list [Chapelle et al., 2009], introducing the so-called user cascade model. Theprobability of relevance is here given by
Ri =2reli − 1
2relimax
(3.4)
and given that the user stops at position r, this forms the calculation of ERR as:
ERR =n∑
r=1
1
r
r=1∏i=1
(1−Ri)Rr (3.5)
Classification Accuracy (CA) refers to the performance of the machine learning mech-anism itself, before the pairwise comparisons are converted into a full ranking list. Itcounts the number of succesful pairwise decisions taken, against their actual values givenby the humans, over the test set.
CHAPTER 3. RANKING TRANSLATIONS 28
3.3.4 Results
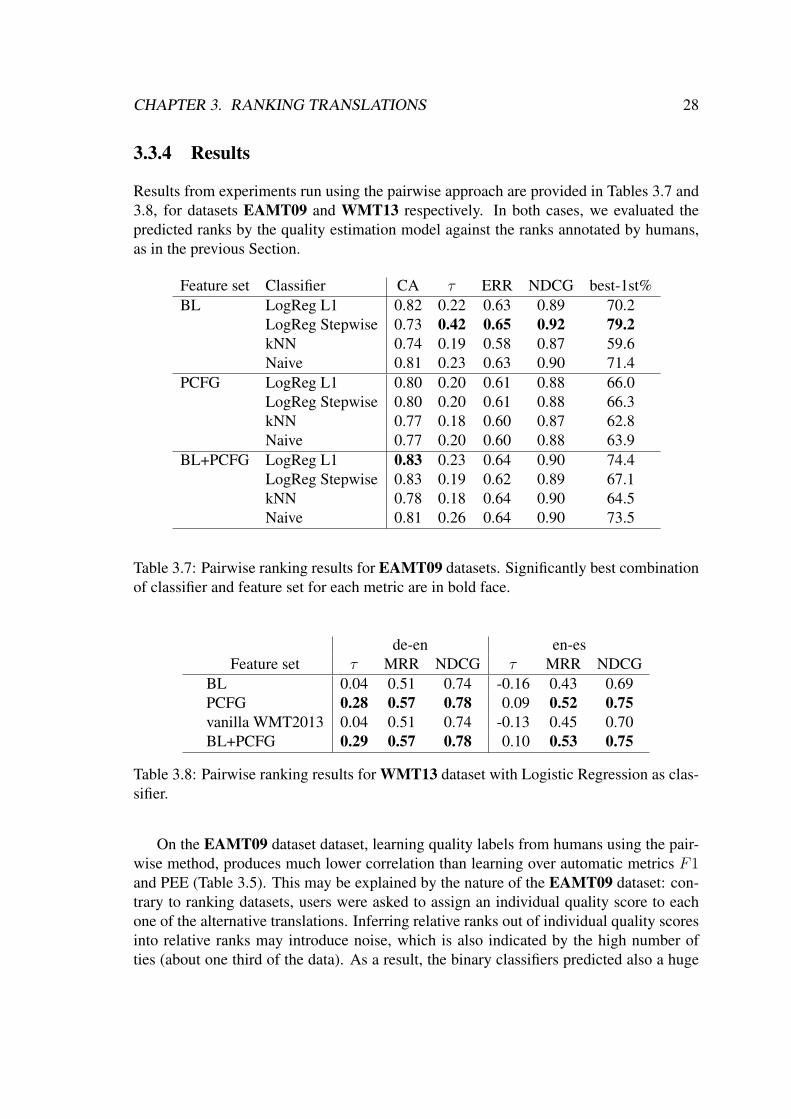
Results from experiments run using the pairwise approach are provided in Tables 3.7 and3.8, for datasets EAMT09 and WMT13 respectively. In both cases, we evaluated thepredicted ranks by the quality estimation model against the ranks annotated by humans,as in the previous Section.
Feature set Classifier CA τ ERR NDCG best-1st%BL LogReg L1 0.82 0.22 0.63 0.89 70.2
LogReg Stepwise 0.73 0.42 0.65 0.92 79.2kNN 0.74 0.19 0.58 0.87 59.6Naive 0.81 0.23 0.63 0.90 71.4
PCFG LogReg L1 0.80 0.20 0.61 0.88 66.0LogReg Stepwise 0.80 0.20 0.61 0.88 66.3kNN 0.77 0.18 0.60 0.87 62.8Naive 0.77 0.20 0.60 0.88 63.9
BL+PCFG LogReg L1 0.83 0.23 0.64 0.90 74.4LogReg Stepwise 0.83 0.19 0.62 0.89 67.1kNN 0.78 0.18 0.64 0.90 64.5Naive 0.81 0.26 0.64 0.90 73.5
Table 3.7: Pairwise ranking results for EAMT09 datasets. Significantly best combinationof classifier and feature set for each metric are in bold face.
de-en en-esFeature set τ MRR NDCG τ MRR NDCG
BL 0.04 0.51 0.74 -0.16 0.43 0.69PCFG 0.28 0.57 0.78 0.09 0.52 0.75vanilla WMT2013 0.04 0.51 0.74 -0.13 0.45 0.70BL+PCFG 0.29 0.57 0.78 0.10 0.53 0.75
Table 3.8: Pairwise ranking results for WMT13 dataset with Logistic Regression as clas-sifier.
On the EAMT09 dataset dataset, learning quality labels from humans using the pair-wise method, produces much lower correlation than learning over automatic metrics F1and PEE (Table 3.5). This may be explained by the nature of the EAMT09 dataset: con-trary to ranking datasets, users were asked to assign an individual quality score to eachone of the alternative translations. Inferring relative ranks out of individual quality scoresinto relative ranks may introduce noise, which is also indicated by the high number ofties (about one third of the data). As a result, the binary classifiers predicted also a huge
CHAPTER 3. RANKING TRANSLATIONS 29
feature description βabsolute difference between nymber of tokens between source and target nor-malised by source length
8.77
number of mismatched quotation marks 7.11
average number of translations per source word in the sentence (thresholdin giza: prob > 0.1) weighted by the inverse frequency of each word in thesource corpus
-4.59
percentage of distinct bigrams seen in the corpus (in all quartiles) -0.25
number of tokens in target -0.17
source sentence perplexity without end of sentence marker 0.13
weighted average number of translations per source word in the sentence -0.09
number of tokens in the source sentence 0.07
average number of translations per source word in the sentence (threshold ingiza: prob> 0.5) weighted by the frequency of each word in the source corpus
-0.05
average number of translations per source word in the sentence (thresholdin giza: prob > 0.2) weighted by the inverse frequency of each word in thesource corpus
0.02
Table 3.9: The contribution of each feature when comparing two translations, as given bythe beta coefficients of the best-performing Logistic Regression model
amount of contradictory pairwise decisions, resulting into ties. These ties were in the endeliminated by weighing with the classification confidence, as explained earlier, but thisis still indicative of the lower learning capability over such a test set. The results are theopposite for the WMT13 dataset (Table 3.6): building a pairwise ranker performs sig-nificantly better than building models to predict absolute scores, for precisely the samereasons: having ranks as quality labels is bound to perform better with ranking-basedmodels.
The best performing feature set for EAMT09 dataset is the baseline feature set, ascompared with introducing parsing features, which consist the best performing featureset for the WMT13 ranking dataset. The reason for this may be that, when translatingEnglish to Spanish, there are less syntax issues that would be captured by a parser, aswhen translating German to English. Variable performance of MT systems and parsersbetween language pairs may also have played a role here.
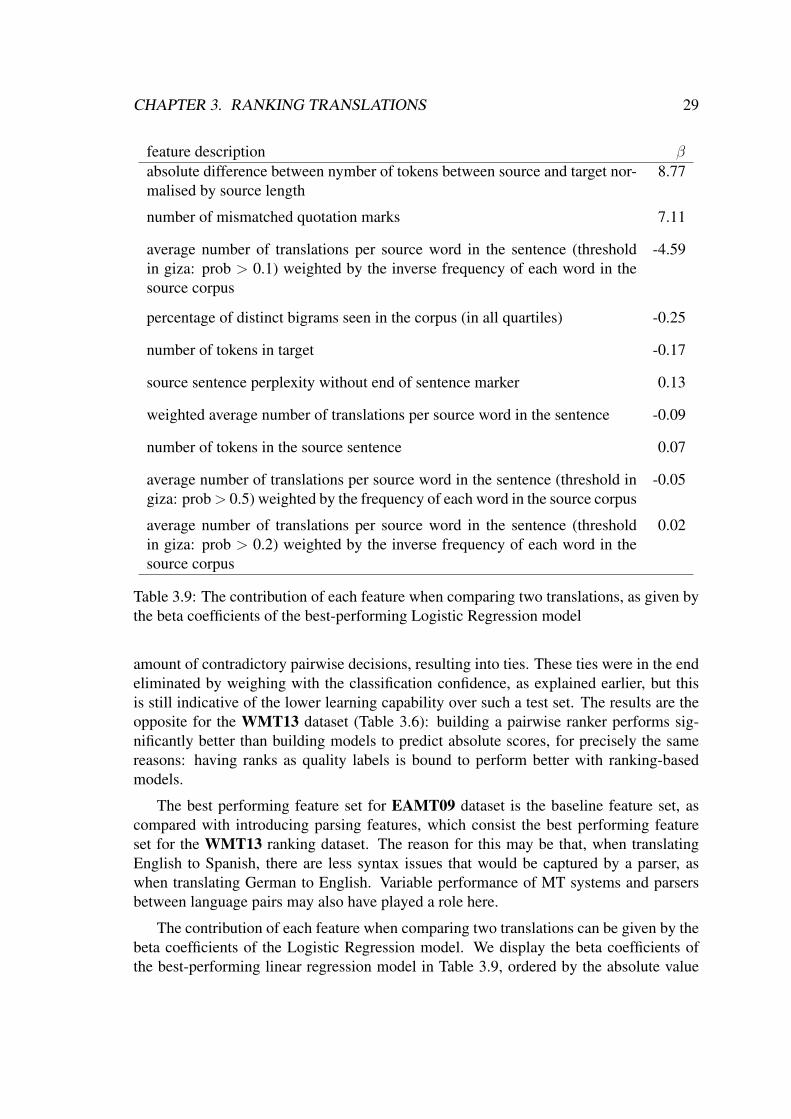
The contribution of each feature when comparing two translations can be given by thebeta coefficients of the Logistic Regression model. We display the beta coefficients ofthe best-performing linear regression model in Table 3.9, ordered by the absolute value

CHAPTER 3. RANKING TRANSLATIONS 30
of the coefficient. Apparently, the highest importance for the comparisons is given by thedifference on the number of tokens between source and target, the number of mismatchedquotation marks and the average number of possible translations per source word in thesentence. It must be noted that the importance of these features is closely related to howwell each feature can describe the difference between the MT systems involved, given theevaluated sentences. It is therefore dependant on the comparable flaws/advantages of theparticipating MT systems and particular characteristics of the text being analysed.

Bibliography
E. Avramidis. Sentence-level ranking with quality estimation. Machine Translation (MT),28(Special issue on Quality Estimation):1–20, 2013.
E. Bicici. The Regression Model of Machine Translation. PhD thesis, Koc University,2011. Supervisor: Deniz Yuret.
E. Bicici. Referential translation machines for quality estimation. In Proceedings of theEighth Workshop on Statistical Machine Translation, Sofia, Bulgaria, August 2013.Association for Computational Linguistics.
E. Bicici and D. Yuret. RegMT system for machine translation, system combination,and evaluation. In Proceedings of the Sixth Workshop on Statistical Machine Transla-tion, pages 323–329, Edinburgh, Scotland, July 2011. Association for ComputationalLinguistics. URL http://www.aclweb.org/anthology/W11-2137.
E. Bicici, D. Groves, and J. van Genabith. Predicting sentence translation quality usingextrinsic and language independent features. Machine Translation, pages 1–22, 2013.ISSN 0922-6567. doi: 10.1007/s10590-013-9138-4.
O. Bojar, C. Buck, C. Callison-Burch, C. Federmann, B. Haddow, P. Koehn, C. Monz,M. Post, R. Soricut, and L. Specia. Findings of the 2013 Workshop on StatisticalMachine Translation. In WMT13, pages 1–44, Sofia, 2013.
C. Callison-Burch, C. Fordyce, P. Koehn, C. Monz, and J. Schroeder. Further Meta-Evaluation of Machine Translation. In Proceedings of the Third Workshop on Statisti-cal Machine Translation, pages 70–106, Columbus, Ohio, June 2008. Association forComputational Linguistics.
C. Callison-Burch, P. Koehn, C. Monz, and O. F. Zaidan. Findings of the 2011 Workshopon Statistical Machine Translation. In Proceedings of the Sixth Workshop on StatisticalMachine Translation, Edinburgh, England, July 2011. Association for ComputationalLinguistics.
A. Cameron. Regression analysis of count data. Cambridge University Press, Cam-bridge UK; New York NY USA, 1998. ISBN 9780521632010. URL http://www.worldcat.org/title/regression-analysis-of-count-data/oclc/38738914\&referer=brief\_results.
31
BIBLIOGRAPHY 32
O. Chapelle, D. Metlzer, Y. Zhang, and P. Grinspan. Expected reciprocal rank for gradedrelevance. In Proceeding of the 18th ACM conference on Information and knowledgemanagement - CIKM ’09, page 621, New York, New York, USA, Nov. 2009. ACMPress. ISBN 9781605585123. doi: 10.1145/1645953.1646033. URL http://dl.acm.org/citation.cfm?id=1645953.1646033.
D. Hosmer. Applied logistic regression. Wiley, New York [u.a.], 8th edition,1989. ISBN 9780471615538. URL http://www.worldcat.org/title/applied-logistic-regression/oclc/632798395\&referer=brief\_results.
C.-J. Lin, R. C. Weng, and S. S. Keerthi. Trust region Newton methods for large-scalelogistic regression. In Proceedings of the 24th international conference on Machinelearning - ICML ’07, pages 561–568, New York, New York, USA, June 2007. ACMPress. ISBN 9781595937933. doi: 10.1145/1273496.1273567. URL http://dl.acm.org/citation.cfm?id=1273496.1273567.
A. Miller. Subset Selection in Regression. Chapman & Hall, London, 2nd edition, 2002.ISBN 978-1584881711.
M. Potet, E. Esperanca-Rodier, L. Besacier, and H. Blanchon. Collection of a largedatabase of french-english smt output corrections. In LREC, pages 4043–4048, 2012.
C. E. Rasmussen and C. K. Williams. Gaussian processes for machine learning, volume 1.MIT press Cambridge, MA, 2006.
K. Shah, E. Avramidis, E. Bicici, and L. Specia. Quest - design, implementation andextensions of a framework for machine translation quality estimation. Prague Bull.Math. Linguistics, 100:19–30, 2013a.
K. Shah, T. Cohn, and L. Specia. An Investigation on the Effectiveness of Features forTranslation Quality Estimation. In Proceedings of MT Summit XIV, pages 167–174,2013b.
G. Wisniewski, A. K. Singh, N. Segal, and F. Yvon. Design and analysis of a large corpusof post-edited translations: Quality estimation, failure analysis and the variability ofpost-edition. In Machine Translation Summit (MT Summit 2013), pages 117–124, Nice,France, 2013.