deliverable - dlr portalelib.dlr.de/93001/1/sensum_d6.1_final.pdf · modul modis urban land cover...
TRANSCRIPT

FP7-SPACE-2012-1 / 312972
Deliverable Page 1 / 116
Framework to integrate Space-based and in-situ sENSing for dynamic vUlnerability and recovery Monitoring
FP7-SPACE-2012-1 Collaborative Project 312972
Deliverable
Deliverable
Reference data base
D6.1
Workpackage 6 Status (F=Final, D=Draft) F
File name SENSUM_D6.1_FINAL
Dissemination Level (PU=Public; RE=Restricted; CO=Confidential) CO

FP7-SPACE-2012-1 / 312972
Deliverable Page 2 / 116
Document Control Page
Version Date Comments
1.0 13/12/2014 First Draft (internal revision)
2.0 17/12/2014 Second Draft (for external revision)
3.0 08/01/2014 Final version
Authors
Name Institution
Martin Klotz DLR-DFD
Hannes Taubenböck DLR-DFD
Christian Geiß DLR-DFD
Deliverable Leader Name Dr Hannes Taubenböck
Institution DLR-DFD
Keywords Exposure, earth observation, land cover, global urban maps, data availability, high-resolution optical remote sensing, validation

FP7-SPACE-2012-1 / 312972
Deliverable Page 3 / 116
Table of Contents
Document Control Page .................................................................................................... 2
Glossary of Terms .............................................................................................................. 6
Executive Summary ........................................................................................................... 9
Introduction ...................................................................................................................... 10
1.1Mapping elements at risk on various spatial scales: Capabilities of Remote Sensing .....12
1.2Global data inventory: Data-rich vs. data-poor countries ........................................... 14
Set-up of a multi-source reference database ................................................................ 17
2.1 Objectives ................................................................................................................ 17
2.2 Database structure and data naming conventions ................................................... 18
2.3 Pre-processing ......................................................................................................... 19
Reference data base: Content ........................................................................................ 21
3.1 Global scale ............................................................................................................. 22
3.1.1 Global Land Cover (GLC) .................................................................................. 22
3.1.2 GlobCover (GLOBC) .......................................................................................... 23
3.1.3 Global Rural Urban Mapping Project (GRUMP)................................................. 23
3.1.4 History Database of the Global Environment (HYDE) ........................................ 24
3.1.5 Global Impervious Surface Area (IMPSA) .......................................................... 24
3.1.6 DMSP-OLS Nighttime Lights (LITES) ................................................................ 25
3.1.7 MODIS Land Cover (MODIS) ............................................................................ 25
3.1.8 MODIS Urban Land Cover (MODUL) ................................................................ 26
3.1.9 Vector Map Level 0 (VMAP0) ............................................................................ 26
3.1.10 Global Human Settlement Layer (GHSL) ......................................................... 27
3.1.11 Global Urban Footprint (GUF) .......................................................................... 28
3.1.12 LandScan (LSCAN) ......................................................................................... 30
3.2 Regional scale .......................................................................................................... 30
3.2.1 Corine Land Cover (CLC) .................................................................................. 31

FP7-SPACE-2012-1 / 312972
Deliverable Page 4 / 116
3.2.2 European Urban Atlas (UA) ............................................................................... 31
3.2.3 Urban footprint classifications (UFP) ................................................................. 32
3.2.4 European Soil Sealing (SSEAL) ........................................................................ 33
3.3 Local scale ............................................................................................................... 34
3.3.1 3D city models ................................................................................................... 34
3.3.2 2D building classifications .................................................................................. 35
3.3.3 Open StreetMap ................................................................................................ 35
Conclusion ....................................................................................................................... 37
References cited .............................................................................................................. 39
Appendix 1 – Metadata: Global Land Cover .................................................................. 48
Appendix 2 – Metadata: Globcover ................................................................................ 52
Appendix 3 – Metadata: Global Rural Urban Mapping Project .................................... 57
Appendix 4 – Metadata: History Database of the Global Environment ....................... 61
Appendix 5 – Metadata: Global Impervious Surface Area ............................................ 64
Appendix 6 – Metadata: DMSP-OLS Nighttime Lights .................................................. 68
Appendix 7 – Metadata: MODIS Land Cover ................................................................. 71
Appendix 8 – Metadata: MODIS Urban Land Cover ...................................................... 75
Appendix 9 – Metadata: Vector Map Level 0.................................................................. 79
Appendix 10 – Metadata: Global Human Settlement Layer .......................................... 83
Appendix 11 – Metadata: Global Urban Footprint ......................................................... 87
Appendix 12 – Metadata: LandScan ............................................................................... 91
Appendix 13 – Metadata: Corine Land Cover ................................................................ 94
Appendix 14 – Metadata: European Urban Atlas .......................................................... 98
Appendix 15 – Metadata: Urban Footprint Classifications ......................................... 102
Appendix 16 – Metadata: European Soil Sealing ........................................................ 105
Appendix 17 – Metadata: 3D city models ..................................................................... 108
Appendix 18 – Metadata: 2D building classification ................................................... 111
Appendix 19 – Metadata: Open StreetMap .................................................................. 114

FP7-SPACE-2012-1 / 312972
Deliverable Page 5 / 116
Index of Tables
Tab. 1 Hierarchical folder structure of the reference database and scheme for data naming conventions ........................................................................................................................ 20 Tab. 2 Comparative validation of the urban footprint masks generated by fully-automated processing for four global test sites (Esch et al., 2013)...................................................... 30
Illustration Index
Fig. 1 Holistic framework conceptualizing hazard, vulnerability and risk with a special focus (red contour) on various types of vulnerability components that can be directly (green) or indirectly (orange) derived using remote sensing (Taubenböck et al., 2008) ..................... 13 Fig. 2 Overview of database contents, status, spatial coverage and availability to project SENUM partners ................................................................................................................ 21 Fig. 3 GHSL data coverage in August 2012 (Pesaresi et al., 2013) ................................... 28 Fig. 4 Schematic overview of the stepwise hierarchical land cover classification (Taubenböck et al., 2012) .................................................................................................. 33 Fig. 5 Overview of reference datasets with regard to thematic/spatial resolution, reference year and spatial coverage .................................................................................................. 38

FP7-SPACE-2012-1 / 312972
Deliverable Page 6 / 116
Glossary of Terms
2DBC 2D Building Classification
3DCM 3D City Model
AOI Area of interest
CAIAG Central Asian Institute for Applied Geosciences, KG
CLC Corine Land Cover
DCW Digital Chart of the World
DEM Digital Elevation Model
DLR German Aerospace Center, DE
DMSP Defence Meteorological Satellite Programme
DoW Description of Work
DSM Digital Surface Model
DTM Digital Terrain Model
EC European Commission
EC European Commission
EEA European Environment Agency
EO Earth Observation
ERS European Remote Sensing satellite
ESA European Space Agency
EUCENTRE European Centre for Training and Research in Earthquake Engineering, IT
GFZ German Research Centre for Geosciences, DE
GHSL Global Human Settlement Layer
GLC Global Land Cover 2000

FP7-SPACE-2012-1 / 312972
Deliverable Page 7 / 116
GLOBC Globcover
GRUMP Global Rural Urban Land Cover
GUF Global Urban Footprint
HYDE History Database of the Global Environment
ICAT ImageCat Ltd., UK
IGEES Institute for Geology and Earthquake Engineering, TJ
IMAGE Integrated Model to Assess the Global Environment
IMPSA Global Impervious Surface Area
IRS-P6 Indian Remote Sensing Satellite P6
IS Impervious Surfaces
ISS Initial Soil Sealing
JRC Joint Research Center
JRC Joint Research Center
LIDAR Light Detection And Ranging
LITES DMSP-OLS Nighttime Lights
LSCAN Landscan
MERIS Medium Resolution Imaging Spectrometer
MODIS MODIS Urban Land Cover
MODIS Moderate Resolution Imaging Spectroradiometer
MODUL MODIS Urban Land Cover
MURBANDY Monitoring Urban Dynamics
NGDC National Geophysical Data Centers
NGI Norwegian Geotechnical Institute, NO
NIMA National Intelligence and Mapping Agency
NOAA National Oceanic and Atmospheric Administration

FP7-SPACE-2012-1 / 312972
Deliverable Page 8 / 116
OLS Operation Linescan System
ORNL Oak Ridge National Laboratory
OSM Open StreetMap
ROC Receiver Operating Characteristics
SAR Synthetic Aperture Radar
SEDAC Socioeconomic Data and Applications Center
SSE Soil Sealing Enhancement Data
SSEAL European Soil Sealing
SVDD Support Vector Data Description
SVM Support Vector
TDX TanDEM-X
TPC Tactical Pilotage Charts
TSX TerraSAR-X
UA Urban Atlas
UCAM University of Cambridge, UK
UFP Urban Footprint Classification
UN United Nations
UNDP United Nations Development Programme
USGS United States Geological Service
UTM Universal Transverse Mercator
VGI Volunteered Geographic Information
VMAP0 Vector Map Level 0
WGS84 World Geodetic System 1984
WP Work Package

FP7-SPACE-2012-1 / 312972
Deliverable Page 9 / 116
Executive Summary
This report highlights the high potential of earth observation for consistent and objective monitoring of elements at risk at various spatial scales. The product portfolio of EO derived geo-products ranges from global low resolution land cover datasets to high resolution spatially accurate building inventories on a local scale. Despite the importance of adequate data for a comprehensive risk analysis as a critical factor affecting the constraints and requirements for the scientific community, end-users, stakeholders and policy makers, an immense discrepancy exists between data-rich countries of the developed world where extensive geospatial information is available, and less-developed data-poor countries. While data-poor countries mainly rely on international efforts to provide low resolution land cover / use maps of global coverage, significant international efforts to provide geo-products of medium to high resolution on a regional scale have only been undertaken in data-rich countries of the developed world such as Europe in the past.
With regard to user-oriented product generation in project SENSUM, a multi-scale and multi-source reference database has been set up to systematically screen available products with regard to data availability for the three project test sites of strongly differing data availability: Cologne (data-rich), Izmir (intermediate), Isfara/Batken (data-poor). At a later stage, these data will serve as a reference to evaluate and document the capabilities and limitations of the proposed products and range them with regard to the current GMES product portfolio. From the final database content, it becomes clear that data-poor countries of Central Asia mainly rely on coarse resolution products of global coverage which, however, provide multi-categorical thematic detail. In contrast, medium and high resolution datasets are spatially restricted to the European test sites due to trans-European mapping efforts initiated there. However, two currently developed global products – namely DLR’s Global Urban Footprint as well as JRC’s Global Human Settlement Layer – will be a major leap forward regarding the derivation of high resolution and accurate reference data for human exposures on a global scale – as they will provide consistent and geometrically detailed land cover information at unprecedented spatial resolutions. Furthermore, a viable option for future research and applications is presented, namely Volunteered Geographical Information (VGI) by crowd-sourcing of extensive mapping communities such as the Open StreetMap project.
However, as remote sensing methods alone cannot provide all information needed for a comprehensive vulnerability and risk estimation, especially when political or socio-economical vulnerability is considered, the call for future research is on the integration of EO and in-situ data. Furthermore, the higher-ranking goal of activities in project SENSUM should address potentials for integration of the proposed products and methodologies in the GMES service offer, particularly envisaging the future expansion of the existing GMES service and product offer to further non-European countries.

FP7-SPACE-2012-1 / 312972
Deliverable Page 10 / 116
Introduction
When talking about the disaster management in an international context the response to major events is mostly reactive rather than proactive (Peduzzi, 2006). This phenomenon is mainly linked to peoples’ perception and understanding of risk, also because common conceptualizations of different scientific communities are inconsistent, causing misunder-standing in a research field needing multidisciplinary approaches to cope with the far-reaching effects of natural disasters. Thus, risk assessment remains a challenge of multi-layered analysis of individual indicators, in the ideal case representing the complete range of components contributing to hazards and vulnerability (Taubenböck et al., 2008). The United Nations (UN, 1991) and the United Nations Development Programme (2004) define the term risk as the following equation:
Risk = Hazard × Vulnerability (1) With regard to this definition, risk is a result from a combination of the hazard and the vari-ous components defining vulnerability. Other authors (e.g., Bohle, 2001) state that the conceptual idea of risk shows an internal and an external side: The internal side describes the vulnerability component which relates to the capacity to foresee, cope with and recover from the impact of a natural hazard, and the external side relating to the hazard compo-nent specifies the type and intensity of the event. In this regard, the risk for a particular system (e.g., a city or an urban population) can be described on the basis of the two fac-tors: Hazard, i.e. a potentially damaging event, phenomenon or human activity, which fea-tures a certain probability of occurrence, intensity, frequency, location and spatial extent, and vulnerability, which characterizes the degree of susceptibility of the elements at risk and thus the degree of exposure (UN/ISDR 2004). Examples for natural hazards are earthquakes, floods, droughts, tropical storms or volcanic eruptions, with some of them causing secondary threats such as landslides, fires or tsunamis (Joyce et al., 2009). The second essential component is vulnerability, which still presents an ill-structured term in today’s scientific community as it is both hard to define but also essential to measure for a comprehensive risk analysis. Nevertheless, several authors such as White et al. (2005) try to further refine the general understanding of vulnerability:
Vulnerability = Exposure × Susceptibility / Coping Capacity (2) Thus, vulnerability is described as the combination of the exposure, and the susceptibility as a stressor of the system and the coping capacity as the potential of the system to de-crease the impact of the hazard (Taubenböck et al., 2008). Exposure is defined as the de-gree, duration and/or extent in which a system is in contact with, or subject to, perturbation (Adger, 2006; Kasperson et al., 2005) but can also be seen as the amount of human activi-ty at a certain location (e.g., stock of infrastructure or housing) (Geiß & Taubenböck, 2012). A definition that is exhaustively used for the term exposure in the earthquake and landslide risk community describes elements at risk, which are understood as objects potentially ad-versely affected such as people, properties, infrastructure or economic activities (Geiß &

FP7-SPACE-2012-1 / 312972
Deliverable Page 11 / 116
Taubenböck, 2012). Thus, the determination of potential losses from damaging events within in context of state-of-the-art seismic risk models such as HAZUS (FEMA, 2010), OpenQuake (GEM, 2011) or RiskScape (RiskScape, 2012) is supported by combining hazard parameters but also quantified and characterized exposed elements and their as-sessed vulnerability. Despite the unclear definition of the term exposure, it can be seen that it is of crucial importance for a comprehensive risk understanding and analysis as it presents an essential component for a comprehensive risk assessment. However, to due to the large-scale extent of human activities on our planet, today’s scientific community still lacks the tools and methodologies to capture the entity of elements at risk on a global scale, especially with enhanced thematic and geometric detail. Nevertheless, remote sens-ing is a promising tool that enables both the capturing of physical elements at risk over various spatial scales and the quantification and analysis of indicators relating to these ex-posed elements (Taubenböck et al., 2008). Thus it provides an indispensable tool for fu-ture mapping of exposure by providing the following key features:
Access to information that is non-intrusive, objective and consistent around the globe;
Access to historical information that can be compared to the current situation;
Large-scale coverage of human systems (e.g., urban areas);
Access to an information technology for which there is long-term continuity (i.e. decades) for the future.
Therefore, this report focusses on the capabilities of remote sensing for the mapping of elements at risk. With regard to EU-FP-7 project SENSUM, a multi-source and multi-scale reference database of EO-derived exposure datasets has been set up to showcase, test and validate the capabilities of earth observation services and products on various spatial scales. Employing low, medium and high resolution satellite data, as well as radar data and diverse modelling and information extraction approaches, remote sensing products are put forward which map the spatial distribution of the indicators in the outline. These range from global or regional large-scale land cover datasets that can be used as a first approximation of human and physical exposure to local datasets presenting small-scale physical features of exposed systems such as buildings or streets. With regard to these products, a better understanding of each data set’s strength and weakness is provided.
The following subsections give a brief but comprehensive introduction to the capabilities of remote sensing for exposure mapping on various spatial scales with a special focus on the situation in data-poor countries. Chapter 2 and 3 describe the multi-source and multi-scale reference data base that contains various exposure datasets collected for the SENSUM test sites in Germany, Turkey and Kyrgyzstan. Finally, a general conclusion is drawn from the specific capabilities of remote sensing for multi-scale exposure mapping and the data availability in data-rich and data-poor counties.

FP7-SPACE-2012-1 / 312972
Deliverable Page 12 / 116
1.1 Mapping elements at risk on various spatial scales: Capabilities of Remote Sensing
In terms of an integrative and comprehensive risk analysis, the issue of an appropriate data collection is widely recognized (Birkmann, 2006; Ehrlich et al., 2010; Geiß & Taubenböck, 2012). With regard to geo-risk research in particular, remote sensing is widely utilized as a contributing tool for hazard-related analysis (e.g., Fu et al., 2004; Stramando et al., 2005; Philip, 2010) as well as vulnerability-centred assessments in each phase of the disaster management cycle (e.g., Taubenböck et al., 2008, 2009; Ehrlich et al., 2010; Deichmann et al., 2011), i.e. pre-event reduction (mitigation) and readiness (preparedness) as well as post-event response and recovery. For the report at hand, the main focus is laid upon remote sensing for exposure mapping in the pre-event phase of a disaster as a promising tool for an economical, up-to-date and independent data collection (Dech, 1997; Mueller et al., 2006, Chiroiu et al., 2006; Esch et al., 2009; Guo, 2010). However, it is crucial to first understand the capabilities as well as the limitations of remote sensing capturing the various types of vulnerability involved in a comprehensive risk analysis.
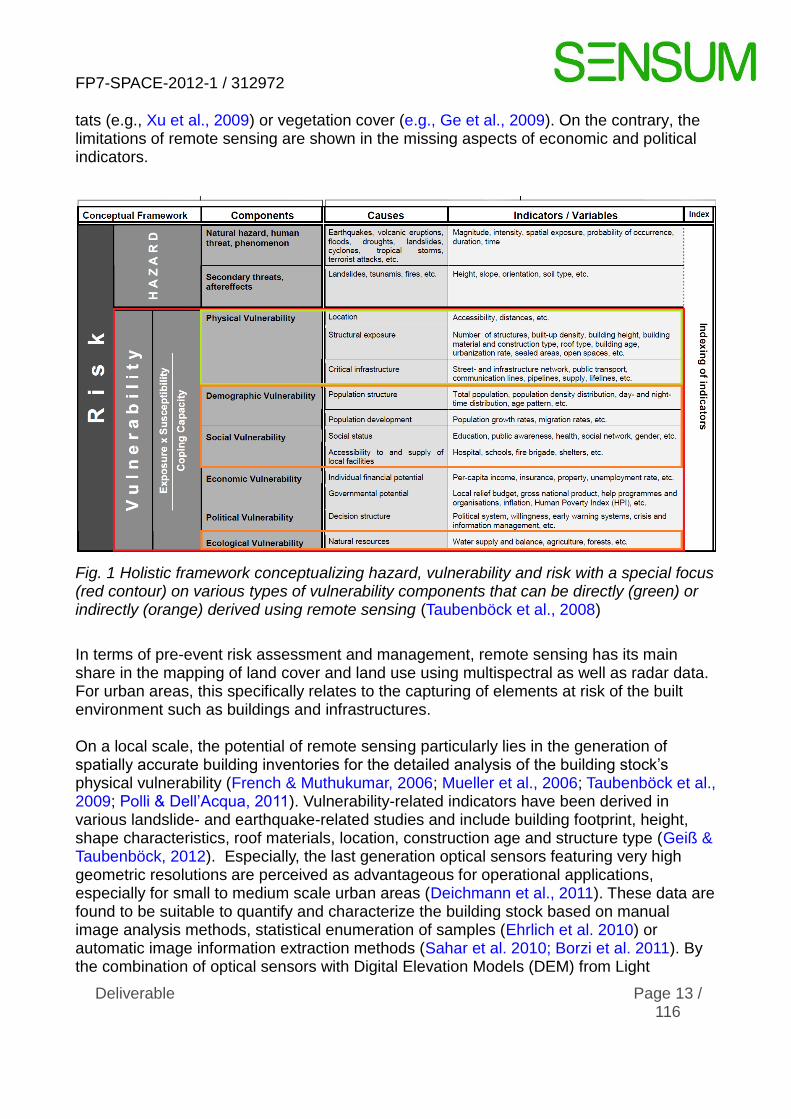
Following this outline, remote sensing enables the analysis of various indicators related to exposure. Taubenböck et al. (2008) present a conceptual meta-framework as an outline to identify and showcase the capabilities of EO in this regard. Components specifying vulner-ability include the physical, demographic, social, economic, ecological and political aspects contributing and adding up to the holistic conceptual idea (Figure 1). Based on the exam-ple system “urban landscape”, vulnerability indicators are derived from various remote sensing datasets ranging from high to medium resolution optical satellite data as well as radar data to map elements at risk. Indicators derived are for example, land cover, built-up densities, accessibility, population, density, building age, urbanization rates or even the approximation of the spatial distribution of after-effects like landslides or tsunami prone ar-eas in the case of an earthquake. Recapitulating the presented EO-derived indicators, the capabilities and limitations of earth observation are summarized. The assessment clearly highlights the capabilities of EO for derivation of physical vulnerability components due to the characteristic of remote sensing measuring the physical face of the earth’s surface. The applicability of remote sensing for the mapping of structural exposure has been well established in the scientific literature by several authors (e.g., Polli and Dell’Acqua, 2011; French and Muthukumar, 2006; Mueller et al., 2006; Ehrlich and Zeug, 2008; Taubenböck et al., 2009). However, until today, novel studies have been undertaken to develop multi-disciplinary synergies between remote sensing, geographic information science and other fields of research. For example, based on earth observation and ancillary data several au-thors have tried to indirectly derive indicators of regional demographic vulnerability such as regional population inventories (e.g., Aubrecht et al., 2012) or social vulnerability on county level (e.g., Zeng et al., 2011) by the application of regionalization techniques or dasymetric mapping. Furthermore, several studies approaching aspects of social vulnerability by the use of remote sensing data (e.g., Wurm and Goebel, 2010; Goebel & Wurm, 2010; Taubenböck et al., 2009) have been undertaken, however, always depending on spatially aggregated ancillary data such as population statistics or socioeconomic variables. Recent applications also try to assess ecologic vulnerability such as the mapping of wildlife habi-
FP7-SPACE-2012-1 / 312972
Deliverable Page 13 / 116
tats (e.g., Xu et al., 2009) or vegetation cover (e.g., Ge et al., 2009). On the contrary, the limitations of remote sensing are shown in the missing aspects of economic and political indicators.
Fig. 1 Holistic framework conceptualizing hazard, vulnerability and risk with a special focus (red contour) on various types of vulnerability components that can be directly (green) or indirectly (orange) derived using remote sensing (Taubenböck et al., 2008)
In terms of pre-event risk assessment and management, remote sensing has its main share in the mapping of land cover and land use using multispectral as well as radar data. For urban areas, this specifically relates to the capturing of elements at risk of the built environment such as buildings and infrastructures. On a local scale, the potential of remote sensing particularly lies in the generation of spatially accurate building inventories for the detailed analysis of the building stock’s physical vulnerability (French & Muthukumar, 2006; Mueller et al., 2006; Taubenböck et al., 2009; Polli & Dell’Acqua, 2011). Vulnerability-related indicators have been derived in various landslide- and earthquake-related studies and include building footprint, height, shape characteristics, roof materials, location, construction age and structure type (Geiß & Taubenböck, 2012). Especially, the last generation optical sensors featuring very high geometric resolutions are perceived as advantageous for operational applications, especially for small to medium scale urban areas (Deichmann et al., 2011). These data are found to be suitable to quantify and characterize the building stock based on manual image analysis methods, statistical enumeration of samples (Ehrlich et al. 2010) or automatic image information extraction methods (Sahar et al. 2010; Borzi et al. 2011). By the combination of optical sensors with Digital Elevation Models (DEM) from Light

FP7-SPACE-2012-1 / 312972
Deliverable Page 14 / 116
Detection And Ranging (LIDAR) measurements seismic building vulnerability can be determined with high accuracies (Borfecchia et al., 2010) whereas the combination of optical and synthetic aperture radar (SAR) data has proven useful for the retrieval of crucial physical parameters such as building footprint or height (Polli & Dell’Acqua, 2011). Beyond, very high and high resolution remote sensing data, also medium resolution data is suited to characterize homogeneous built-up areas. In this manner, Pittore and Wieland (2012) and Wieland et al. (2012) use these EO data in combination with information from a ground-based omnidirectional imaging system to determine the physical vulnerability of the building inventory.
On the regional and global scale, remote sensing derived geo-products only approximate the inventory of elements at risk in their spatial extent and abundance by mapping and modelling approaches of land cover or related spatial attributes such as night-time illumi-nation (e.g., Elvidge et al., 2009) or fractions of impervious surfaces (e.g., Elvidge et al, 2007). Thus, remote sensing applications that use low to medium resolution data on this scale are limited to the mapping of large-scale human and physical exposure. In this re-gard, various multi-scale geospatial information layers and approaches to model and as-sess situation-specific physical and human exposure are presented by Aubrecht et al. (2012) and validated by Pottere and Schneider (2009) as well as Pottere et al. (2009). Fur-thermore, large-scale remote sensing derived land cover maps are commonly used as a basis for the disaggregation process of demographic or socioeconomic variables (Eicher & Brewer, 2001; Mennis & Hultgren, 20006; Langford, 2007) and resulting geo-products range from national to global coverage. These are frequently used as a first approximation of exposed assets in the context of sampling approaches.
From this brief introduction it can be seen that remote sensing has a high potential for the consistent and objective capturing of elements at risk at various spatial scales. It needs to be further stressed that EO enables access to an information technology for which there is long-term continuity for the future. In this regard, it is referred to the report “Deliverable 2.1 - Present day and future remote sensing data” of this project which highlights technical specifications of current and - in particular - future remote sensing missions holding poten-tial for disaster management and geo-risk research. Although EO data has been widely employed for exposure mapping in the past, further research and process automation of information extraction is on demand to derive geo-information products and services of global assets at the required geometric and thematic detail. However, it needs to be stressed that EO-based methods and data, cannot alone provide all information needed for a holistic vulnerability and risk estimation, especially when structural, functional and so-cio-economical vulnerability is considered. Particularly, as data availability varies spatially, the integration for in-situ data (e.g., expert-driven or by crowd sourcing) should be consid-ered in future research, especially on data-poor regions of the less developed countries.
1.2 Global data inventory: Data-rich vs. data-poor countries
Over the past decade, countries across the world – both rich and poor – have witnessed thousands of major natural disasters. Thus, data and information needs of various users
FP7-SPACE-2012-1 / 312972
Deliverable Page 15 / 116
involved in the disaster management cycle (preparedness, early warning, response, re-covery) have never been greater. Major natural hazards emphasize the need for a sys-tematic and consistent data basis in support of disaster management with particular em-phasis on the availability of exposure data at sufficient geometric and thematic detail. De-spite the importance of adequate data for a comprehensive risk analysis as a critical factor affecting the constraints and requirements of the scientific community, end-users, stake-holders and policy makers an immense discrepancy between data-rich countries of the developed world where extensive geospatial information is available and less-developed data-poor countries exists. Thus, this report focuses on the set-up of a multi-scale refer-ence data base with special attention to data availability in data-poor countries. At a later stage the solutions developed in the framework of this project will be systematically com-pared to existing global or regional products to suggest possible synergies especially suit-able for applications outside Europe. On the European continent, several international efforts have been undertaken to provide local and regional geo-products of trans-European coverage. Early strategic discussions among European member countries and the main EU institutions responsible for environmental policy, reporting and assessment have underlined an increasing need for quantitative information on the state of the environment based on timely, quality-assured data, concerning in particular land cover and land use (EEA, 2012b). A prime example for the efforts currently underway is provided by the European Copernicus programme (Copernicus, 2013) and its precursor, the Global Monitoring for Environment and Security (GMES) programme as a joint initiatives of the European Commission (EC), the European Space Agency (ESA) and the European Environment Agency (EEA). GMES has delivered and will further provide accurate, timely and easily accessible information to improve the management of the environment, understand and mitigate the effects of climate change and ensure civil security (ESA, 2013). Prominent example services and products established in the context of the GMES/Copernicus land monitoring service are the pan-European CORINE Land Cover (EEA, 2006 & 2012a), the European Urban Atlas (EC, 2012) or the European Soil Sealing layer (EEA, 2010). These products of regional coverage are now freely available and feature medium spatial resolutions between 20m and 100m of high thematic detail and thus, crucial information for an adequate determination of exposure on a regional or even local scale.
On the contrary, less developed countries lack the financial resources, institutional frame-works and technical know-how for the provision of regional or even local exposure da-tasets at sufficient geometric and thematic resolution. Thus, a comprehensive risk analysis is often prevented by the lack of an adequate data basis. Despite their often presumably high vulnerability to natural hazards, data-poor countries usually rely on international ef-forts undertaken on a global scale that aim at mapping exposure-related land cover for an approximation of human exposure as the only data basis of large-scale coverage and low geometric resolution. Examples of such global land cover datasets include ESA’s (2010 & 2011) GlobCover (GLOBC) product, the EC’s Global Land Cover (GLC) (EC, 2003) or the Unite States’ National Oceanic and Atmospheric Administration’s Global Impervious Sur-face Area (IMPSA) dataset (Elvidge, 2007). With regard to the project at hand, three test sites have been selected to showcase the capabilities of remote sensing in the context of

FP7-SPACE-2012-1 / 312972
Deliverable Page 16 / 116
exposure mapping as well as to develop methods and solutions for comprehensive and transferrable risk assessment adjusted to the data availability in both data-rich and data-poor counties. These test sites with regard to a preliminary assessment of data availability highlight the decisive discrepancy between data-rich und data-poor regions:
Cologne (Germany): Cologne features extensive, high-resolution dataset coverage including besides major GMES products, cadastral mapping, high-resolution ortho-photos and 3D LiDAR data.
Izmir (Turkey): Turkey shows intermediate characteristics between data-rich and data-poor countries.
Cross-border area between Isfara and Batken (Kyrgyzstan/Tajikistan): Despite its presumably high vulnerability, only global low resolution datasets are available for this region, therefore making it an example of a data-poor test site.

FP7-SPACE-2012-1 / 312972
Deliverable Page 17 / 116
Set-up of a multi-source reference database
The following subsections of this report briefly describe the technical set-up of the multi-scale and multi-source reference database that contains exposure datasets on various spatial scales. First, the objectives of the data base set-up in the general project context are reviewed. Second, the technical database structure and data naming conventions are described, and third, the undertaken pre-processing steps are highlighted. 2.1 Objectives
Classifications derived from remote sensing data are in essence only close approximations of reality and are adversely affected by pre-determined constraints such as spatial resolution or evolution of the land surface. Furthermore, they are often subject to human-induced errors, e.g., due to inadequate processing, precision of measurement, or sampling schemes. To obtain a certain degree of confidence associated with the solutions and geo-information products developed in the context of project SENSUM, user-oriented product development is dependent upon the known accuracy of the data. For the spatial data this involves the assessment of the resulting products with respect to thematic quality and accuracy whereas for the tools and methodologies developed this also includes the validity and robustness of the applied algorithms. In this regard, a multi-scale and multi-source reference database was set up to systematically range the generated products into the range of existing operational map products, especially with regard to the current GMES product portfolio and to evaluate and document the capabilities and limitations of the products and software solutions. Based on these steps the remote sensing products derived will be clearly defined. The higher-ranking goal of the activity is evaluating the potential integration of the proposed products and methodologies in the GMES service offer, particularly envisaging the future expansion of the GMES service and product offer to further non-European data-poor countries.
Thus, with regard to the project at hand, the main objectives of the database set-up can be summarized as follows:
Provision of reference data for systematic cross-validation to statistically test the methodologies used in the project, specifically with regard to geometric and thematic accuracy requirements;
Provision of reference data for the assessment of the accuracy of EO-based mapping products as well as the in-situ sensed data;
Provision of reference data for resulting SENSUM products to comparatively define the product specifications; especially with regard to data from GMES projects or other relevant spatial products;
Gathering and preparation extensive spatial reference data to highlight discrepancies of data availability between data-rich and data-poor countries;

FP7-SPACE-2012-1 / 312972
Deliverable Page 18 / 116
Showcasing the general capabilities of remote sensing in the context of mapping ele-ments at risk.
2.2 Database structure and data naming conventions
The database records are arranged in a straight forward hierarchical folder structure (Table 1) for easy access of contents and platform-independent data handling. Data is provided on test site-level for data across all scales, i.e. spatial coverage ranging from global to regional to local, and on country level for all global datasets. Thus, the following hierarchical database levels are incorporated:
Level 1: Differentiation between country and test site level;
Level 2: Differentiation between specific countries and test sites, respectively;
Level 3: Differentiation between types of data (geodata, metadata and mapping folders);
Level 4: Differentiation between spatial scales of data (coverage);
Level 5: Differentiation between specific datasets;
All spatial data feature the basic vector and raster format in can be used with any commercial or open-source GIS software (e.g., ESRI ArcGIS and ArcView, QGIS, SAGA GIS). The specific file formats incorporated in the data base are:
.pdf: For metadatasheets associated with each dataset collected;
.tif: For raster datasets
.shp: For vector datasets including test site AOIs (folder mapping)
Data naming follows the presented hierarchical folder structure in order to unambiguously identify each record in the database. For this purpose each folder level features a distinct key. Data names result from stringing together these codes separated by an underscore (“_”) following the hierarchical structure of the folder system. For global and regional data a suffix is appended to each filename describing the reference year of the dataset, for local data the particular feature class is appended, e.g., “buildings”. For a clear understanding of the file naming convention some examples are given below:
Global Human Settlement Layer for test site cologne: T_CGN_GD_GLO_GHSL__2013
Mapping file for Turkey: C_TUR_MP
Metadata-sheet for Open StreetMap data for the test site Isfara / Batken: T_IBA_GD_LOC_OSM___2013_buildings

FP7-SPACE-2012-1 / 312972
Deliverable Page 19 / 116
Metadata for each datasets contain crucial information on the technical specifications of each product for end-users. Thus, metadata-sheets have been incorporated threefold: (1) They are contained by the reference data base following the hierarchical folder structure presented, (2) they are appended at the end of this report, and (3) metadata for each product will be populated on the project’s geo-network under the following URL: http://lhotse21.gfz-potsdam.de/geonetwork/srv/eng/main.home. The sheets contain essential information and attributes (bold) of each layer structured into four sections:
General Information: Dataset name, originator, online resource (URL), abstract, reference (literature), availability (commercial/free), and information on the originator’s data policy;
Data properties: Format, original projection, Reference year / time period, spatial resolution, thematic resolution, and incorporated layers;
Database records / coverage: Information on spatial level of coverage, filename, Universal Transverse Mercator Zone of each record and its and extent of coverage (in geographic coordinates);
Legend: Gridcode and corresponding thematic class;
Additional information: Main sensors, ancillary data employed, literature references with regard to methodology and previous validation efforts; quicklook of the dataset;
2.3 Pre-processing
As indicated earlier all data sets have been reprojected from their native projection to a Universal Transverse Mercator (UTM) projection of the World Geodetic System 1984 (WGS84) standard to account for a comparable and consistent data basis. Furthermore, data have been clipped to the extents of the project’s areas of interest (AOI) on test site level, and to the countries’ administrative boundaries on country level.

FP7-SPACE-2012-1 / 312972
Deliverable Page 20 / 116
Tab. 1 Hierarchical folder structure and file naming scheme of the reference database
LEVEL 1 LEVEL 2 LEVEL 3 LEVEL 4 LEVEL 5
Key Folder Key Folder Key Folder Key Folder Key Folder
T
Testsite
CGN
IZM
IBN
Cologne
Izmir
Isfara / Batken
MP Mapping
MD
GD
Metadata
Geodata
GLO
Global
GHSL_ Global Human Settlement Layer
GLC__ Global Land Cover
GLOBC Globcover
GRUMP Global Rural Urban Mapping Project
GUF__ Global Urban Footprint
HYDE History Database of the Global Environment
IMPSA Impervious Surface Area
LITES DMSP-OLS Nighttime Lights
MODIS MODIS Land Cover
MODUL MODIS Urban Land Cover
VMAP0 Vector Map Level 0
REG
Regional
CLC__ CORINE Land Cover
SSEAL European Soil Sealing
UA___ Urban Atals
UFP__ Urban footprint classifcations
LOC
Local
3DCM_ 3D city model
2DBC_ 2D building classification
OSM__ Open StreetMap
C
Country
GER
TUR
KTJ
Germany
Turkey
Kyrgyzstan / Tajikistan
MP Mapping
MD
GD
Metadata
Geodata
GLO
Global
GHSL_ Global Human Settlement Layer
GLC__ Global Land Cover
GLOBC Globcover
GRUMP Global Rural Urban Mapping Project
GUF__ Global Urban Footprint
HYDE History Database of the Global Environment
IMPSA Impervious Surface Area
LITES DMSP-OLS Nighttime Lights
MODIS MODIS Land Cover
MODUL MODIS Urban Land Cover
VMAP0 Vector Map Level 0
FP7-SPACE-2012-1 / 312972
Deliverable Page 21 / 116
Reference data base: Content
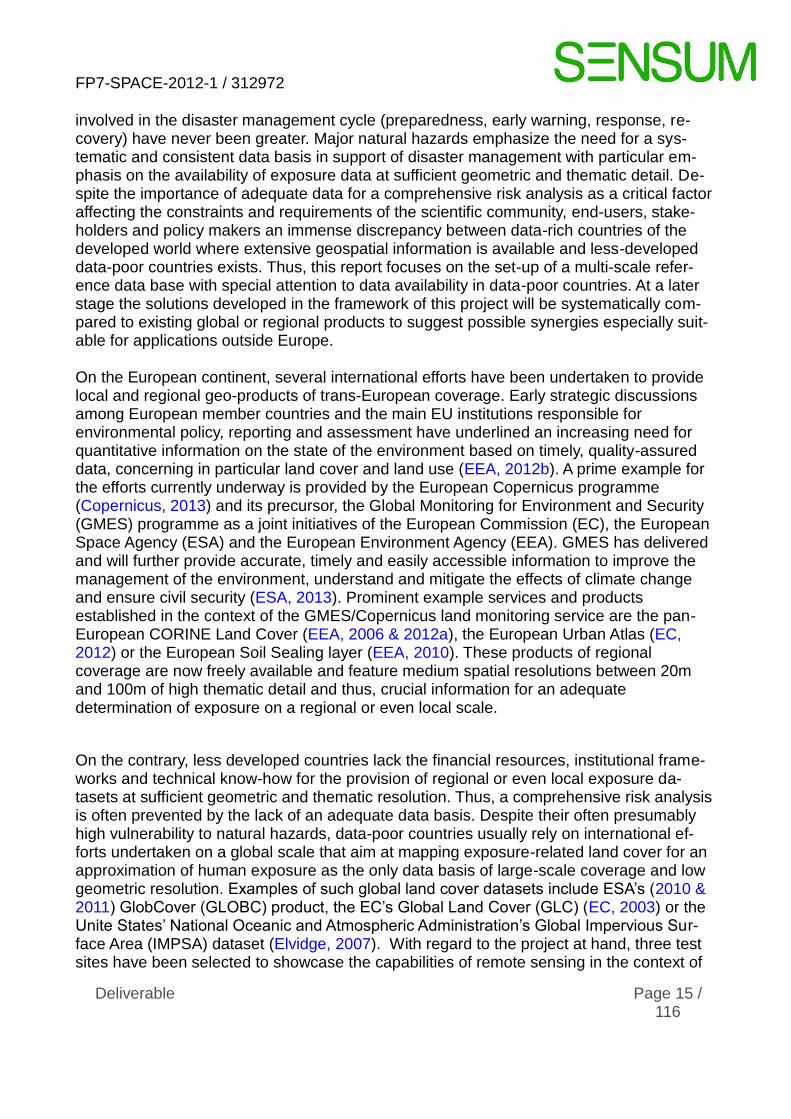
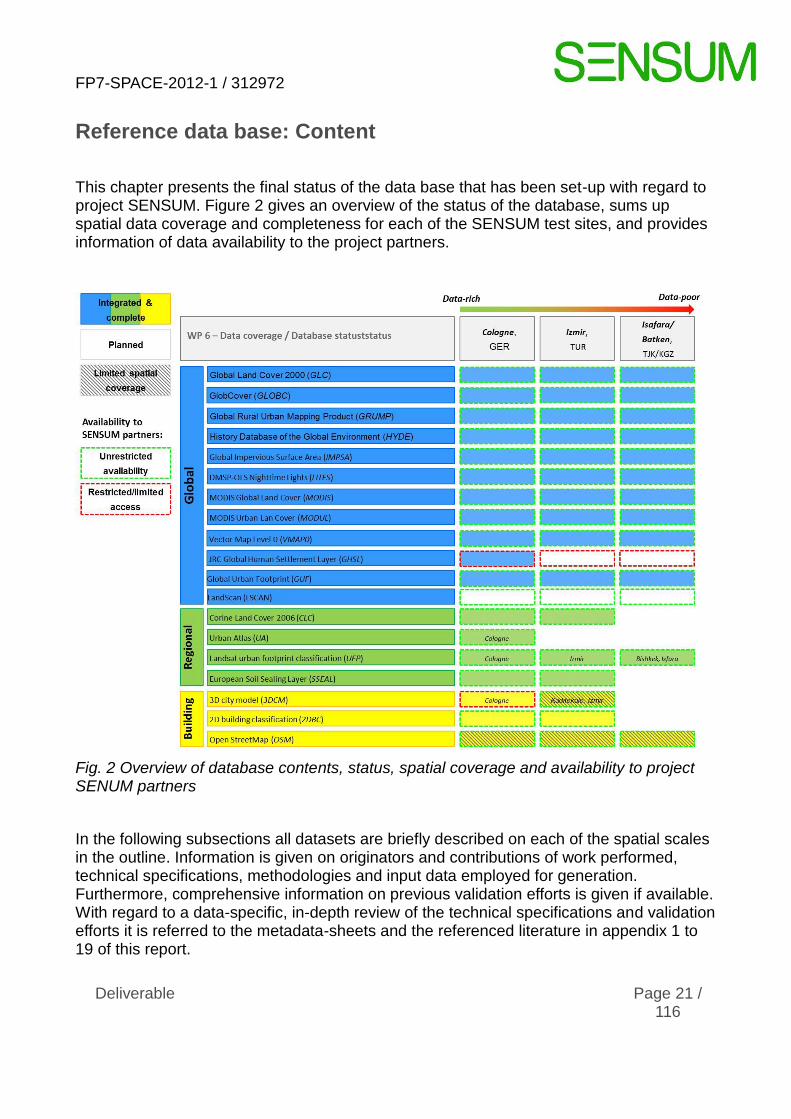
This chapter presents the final status of the data base that has been set-up with regard to project SENSUM. Figure 2 gives an overview of the status of the database, sums up spatial data coverage and completeness for each of the SENSUM test sites, and provides information of data availability to the project partners.
Fig. 2 Overview of database contents, status, spatial coverage and availability to project SENUM partners
In the following subsections all datasets are briefly described on each of the spatial scales in the outline. Information is given on originators and contributions of work performed, technical specifications, methodologies and input data employed for generation. Furthermore, comprehensive information on previous validation efforts is given if available. With regard to a data-specific, in-depth review of the technical specifications and validation efforts it is referred to the metadata-sheets and the referenced literature in appendix 1 to 19 of this report.

FP7-SPACE-2012-1 / 312972
Deliverable Page 22 / 116
3.1 Global scale
On the global scale several efforts have been undertaken since the millennium to provide land cover / use maps of global coverage with a particular focus on mapping urban areas (Potere & Schneider, 2009). In this regards, international research groups from both government and academia have produced remote sensing derived geo-products that may provide valuable input to vulnerability-related research in the context of this project. These large-scale global products are especially important as they present the almost only data source for systematic risk analysis in data-poor countries and thus, can be seen as first approximation of human exposure. Potere and Schneider (2009) and Potere et al. (2009) give a thorough review of some of the described products of which several build upon each other including Vector Map Level 0 (VMAP0), Global Land Cover (GLC), the History Database of the Global Environment (HYDE), the Global Impervious Surface Area (IMPSA), MODIS Land Urban Land Cover (MODUL), Globcover (GLOBC), the Global Rural Urban Mapping Project (GRUMP), DMSP-OLS Nighttime Lights (LITES), and Landscan, quantitatively comparing the datasets by pairwise comparison and thus, achieving a relative accuracy assessment. However, absolute accuracies of these global and regional data sets are more difficult to assess and a stronger understanding of each map’s strength and weakness is still on demand.
3.1.1 Global Land Cover (GLC)
The Global Land Cover 2000 has been initiated by the European Commission’s Joint Re-search Center (JRC) and developed under its coordination through a joint cooperation of 30 research groups around the world (JRC, 2003). The database contains two levels of land cover information – a detailed, regionally optimized land cover data base for each continent and a less thematically detailed global legend that harmonizes regional legends into one consistent global product. The datasets are derived from daily data from the VEGETATION sensor on-board SPOT-4 plus data from region specific-sensors including the Defence Meteorological Satellite Program’s Operation Linescan Sensor (DMSP-OLS) or ESA’s European Remote Sensing (ERS) satellites. The land cover inventory covers a range of 22 thematic classes including one for artificial surfaces and associated areas at a geometric resolution of 30 arcseconds (ca. 1km). The map was derived applying a “re-gionally tuned” supervised classification method on combinations of multispectral and mul-ti-temporal EO data (Bartholome & Belward, 2005). Due to its long-time existence the GLC product has been thoroughly tested in previous val-idation efforts. Mayoux et al. (2006) analysed the classification accuracy using ground ob-servations, previously generated land cover maps and high-resolution satellite imagery for stratified random sampling of reference datasets stating a global overall accuracy of 68.8 percent. Giri et al. (2005) further conducted a comparative analysis of GLC and MODIS land cover to determine class-specific spatial agreement and disagreement, respectively. Based on a harmonized legend they e.g., find percent agreements of 93.3 percent for ur-ban lands. Potere et al. (2009) support these findings by stating strong agreements be-

FP7-SPACE-2012-1 / 312972
Deliverable Page 23 / 116
tween these datasets in a relative inter-map comparison. Furthermore, Potere and Schneider (2009) conduct an absolute accuracy assessment with regard to 140 Landsat derived urban extent maps stating an overall accuracy of 97 percent of the GLC product for urban areas.
3.1.2 GlobCover (GLOBC)
GlobCover is a global land cover product that has been first published in 2005 and updat-ed in 2009 under the lead of ESA with contributions from various institutional partnerships including JRC and EEA. With a spatial resolution of approximately 300m it provided the very first medium resolution global land cover in 2005 (ESA, 2010). Like GLC it features 22 thematic land cover classes, one dedicated to artificial surfaces and associated areas de-fined as pixels having an urban area percentage of greater than 50 percent. GlobCover employs automated land cover classification by a sequential execution of regional stratifi-cation, spectral clustering, and rule-based class labelling using data from the Medium Resolution Imaging Spectrometer (MERIS) on-board ENVISAT (ESA, 2011) in addition to data such as GLC for classification refinement. ESA (2011) has validated the GlobCover product by setting up a reference dataset of ran-dom points collected from various external information sources (e.g., Google Earth, Virtual Earth, Open StreetMap, SPOT-4 VEGETATION, etc.) and state and overall thematic accu-racy of 70.7 percent. Potere & Schneider (2009) determine higher overall accuracies ex-ceeding 96 percent for urban areas and a strong agreement with JRC’s GLC dataset using intermap comparison and contingency tables. In contrast, focusing on the thematic do-mains forest and cropland and comparing classification results to in-situ data Fritz et al. (2011) found an overall accuracy of only 58 percent.
3.1.3 Global Rural Urban Mapping Project (GRUMP)
The Global Rural-Urban Mapping Project’s Urban Extent layer which was last updated in 1995 is a low resolution map presenting binary (presence/absence) information on the ex-istence of global / rural extents (SEDAC, 2013). It was elaborated by the Columbia Univer-sity’s Socioeconomic Data and Applications Center (SEDAC). The project utilized the Na-tional Oceanic and Atmospheric Administration’s DMSP-OLS night-time light product from the reference period1994 to 1995 data to detect stable human settlements. Furthermore, ancillary data is provided by Digital Chart of the World’s (DCW) populated places inventory for initial localization points to map human settlements at a scale of 1:1,000,000 (SEDAC, 2013). In addition to that, for areas of inadequate to low electrical power sources the urban extents were extrapolated using a population-area ratio. In this context, e.g., tactical pilot-age charts (TPC) have been used for the delineation of urban areas for the African and South American continents. In their investigations, Potere and Schneider (2009) as well as Potere et al. (2009) found overall accuracy of 84 percent for GRUMP – the lowest for all datasets assessed – featuring very high errors of commission and low inter-map agree-ment to other global products.

FP7-SPACE-2012-1 / 312972
Deliverable Page 24 / 116
3.1.4 History Database of the Global Environment (HYDE)
Originally, the History Data Base of the Global Environment was created to test and vali-date the Integrated Model to Assess the Global Environment (IMAGE) to gain confidence on the predictive power of the model with regard to future environmental changes (Klein Goldewijk, 2001). In its essence, HYDE presents gridded time series of population and land use including fractions of urban areas measured in in square kilometres per gridcell for the last 12,000 years. The product is derived using historical national and subnational populations numbers, national level cropland estimates as well as satellite-based maps from the SPOT-4 VEGETATION sensors (VEGA2000 database). Historical population, cropland and pasture statistics are derived using specific time-dependent allocation algo-rithms to create spatially explicit maps, which are fully consistent on a very coarse geomet-ric grid resolution of 5 arcminutes (ca. 10km), and cover the period 10,000 B.C. to 2005 A.D. (Klein Goldewijk et al., 2011). In this context, HYDE presents a well-established data-base helping to advance understanding of global and regional biodiversity changes, spa-tiotemporal development of urbanized areas as well as climate change consequences in-duced by significant structural development and increasing human activity (Klein Goldewijk et al., 2005).
Although being first published around 2000, no in-depth validation efforts have been undertaken so far due to the lack of global ground truth information. However, Klein Goldewijk et al. (2005) address the issue of uncertainties of the modelling outputs associated with regard to quality of the employed input data, particularly of the utilized land use estimates. Potere and Schneider (2009) use a threshold of 50 percent derived from receiver operating characteristics (ROC) curves for urban area fractions to create a binary layer of urban extent and assess its absolute accuracy with regard to 140 Landsat derived maps of urban extent. From this, they state an absolute global accuracy of 96.9 percent with medium producer’s and user’s accuracies.
3.1.5 Global Impervious Surface Area (IMPSA)
The Global Impervious Surface Area dataset presented the first global inventory of spatial distribution and density of impervious surfaces (Elvidge et al., 2007). At a spatial resolution of 30 arcseconds (ca. 1km) it presents the aerial percentage of impervious surface coverage per gridcell. For product generation, it mainly uses coarse resolution input data such as the DMSP-OLS Nighttime Lights Time Series from the reference years 2000 and 2001 as well as the LandScan 2004 gridded population database in addition to a 30m impervious surface area reference dataset derived from multispectral Landsat data for the United States and provided by the United States Geological Survey (USGS) for testing. The impervious surface area is basically calculated by means of the two input datasets described according to the following equation developed through empirical regression (Elvidge et al., 2007):

FP7-SPACE-2012-1 / 312972
Deliverable Page 25 / 116
IMPSA = 0.0795 * (DMSP-OLS radiance) + 0.00688 (LandScan population count) (3)
Schneider and Potere (2009) thresholded IMPSA at 20% to derive absolute accuracy measures of 97.5% and low errors of commission and omission. In addition to that Elvidge et al. (2007) found a significant correlation between the United States reference data and IMPSA, however, state a moderate over-classification in states of small but highly urban-ized areas (urban hotpsots). 3.1.6 DMSP-OLS Nighttime Lights (LITES)
The Defence Meteorological Satellite Program’s (DMSP) satellites have been in operation since 1972 with digital archives of the National Geophysical Data Center (NGDC) dating back to 1992. The Operation Linescan Sensor (OLS) records time series monitoring the intensity of stable lights of the earth’s surface and thus provides useful for measuring sta-ble human settlements and spatiotemporal urbanization through this indicator (Elvidge et al., 2009). Over the past two decades several night-time light products have been derived, one of them being a global cloud-free coverage especially designed to detect changes of human emitted lighting and thus, spatial urbanization. Although featuring a very coarse resolution of roughly 2.7 km the dataset has been widely employed in modelling the spatial distribution of population or human activity and has been used as input for other global land cover products such as MODIS Land Cover, GLC, GRUMP or IMPSA (Potere et al., 2009). Since LITES is basically a product presenting a non-obtrusive measurement of stable lights thematic validation is not applicable. However, Elvidge et al. (2009) state shortcom-ings in terms of urban mapping due technical specifications such as the coarse geometric resolution, lack of on-board calibration and in-flight gain changes, limited data recording / download capabilities and spectral features. Potere and Schneider (2009) and Potere et al. (2009) do not include the data in their systematic validation efforts as they have not been designed for urban mapping but only provide input to other global datasets such as IMPSA.
3.1.7 MODIS Land Cover (MODIS)
The MODIS Land Cover Type is provided by the USGS at no cost and global coverage (USGS, 2013). It is updated annually and contains five classification schemes based on data of the Moderate Resolution Imaging Spectrometer (MODIS) on-board the National Aeronautics and Space Administration’s Terra and Aqua satellites. Its primary legend established in the context of the International Geosphere Biosphere Programme (IGBP) identifies 17 land cover classes, one dedicated to urban and built-up areas. The data is provided in its native sinusoidal projection of geographic coordinates at a geometric resolution of 15 arcseconds (ca. 500m) and has been derived from EO data based on a supervised decision-tree classification method using multispectral and thermal input data

FP7-SPACE-2012-1 / 312972
Deliverable Page 26 / 116
as well as ancillary such as Landsat or Geocover 2000 imagery for training an classification refinement (Friedl et al., 2010). Results from a cross-validation conducted by Friedl et al. (2010) indicate an overall thematic accuracy of 75 percent with a relatively wide range of class-specific accuracies. For a specific validation of the class “urban and built-up” it is referred to Schneider et al. (2009 & 2010) and the next section.
3.1.8 MODIS Urban Land Cover (MODUL)
Due to its widespread application in past academic research the individual MODIS Urban Land Cover class is described separately here. The global map of urban extent was pro-duced by Annemarie Schneider at the University of Wisconsin-Madison, in partnership with Mark Friedl at Boston University (Schneider et al, 2009 & 2010). The higher-ranking goal of this project was to produce an up-to-date, spatially consistent, and seamless map of ur-ban, built-up and settled areas of the earth’s land surface for the years 2001 and 2002. In this context urban, areas are defined as places that are dominated by the built environ-ment which include a mix of human-made surfaces and materials, and ‘dominated’ implies aerial coverage greater than or equal to 50 percent of a pixel. Like the original land cover product MODUL used remotely sensed daytime multispectral MODIS data of 500m geo-metric resolution and 30m resolution Landsat reference maps. The data is processed through a sequential execution of region-specific stratification of eco-regions, decision tree classification based on training data from manual interpretation, Google Earth and Landsat, and posteriori exploitation of class membership functions for classification optimization, especially in arid and semi-arid regions (Schneider et al., 2010).
Using reference maps of urban extent from 140 cities around the globe the produced da-taset yields an overall per pixel accuracy of 93 percent (Kappa=0.65) and a high level of agreement on the city level (R²=0.90) (Schneider et al., 2010). Overall, MODIS provides the strongest agreements among the eight urban maps under study. Furthermore, Potere and Schneider (2009) find high agreement between JRC’s Global Land Cover and MOD-UL as well as the highest overall agreement of MODUL with the other urban maps under study through inter-map comparison.
3.1.9 Vector Map Level 0 (VMAP0)
The Vector Map Level 0 database represents the fifth edition of The Digital Chart of the World (DCW) which has been originally developed by the National Imagery and Mapping Agency (NIMA) of the United States to support navigational and military applications (NI-MA, 1995). Although some updates of the 1997 version of the data have been produced featuring increased mapping scales VMAP0 is still the only data set made fully available to the public. The VMAP0 database provides worldwide coverage of vector-based geospatial

FP7-SPACE-2012-1 / 312972
Deliverable Page 27 / 116
data which can be viewed at 1:1,000,000 scale. It consists of geographic, attribute, and textual vector data including major road and rail networks, hydrologic drainage systems, utility networks (cross-country pipelines and communication lines), major airports, eleva-tion contours, coastlines, international boundaries and populated places with an index of geographic names and their urban extent (Danko, 1992). VMAP0 was created by digitizing a large collection of maps and navigational charts over 30 years between 1950 and 1979. However, VMAP0’s urban polygons are sometimes poorly geolocated. Nevertheless, be-cause VMAP0 was the first comprehensive global dataset, it was used as part of the input stream for GLC, GRUMP, HYDE and LandScan. Only few studies have been undertaken to measure the accuracy of the urban extent layer. For example, Potere and Schneider (2009) find only low to low agreements with other global products due to low user accuracies (38 percent) and significant under-classification in this regard (Potere et al., 2009).
3.1.10 Global Human Settlement Layer (GHSL)
JRC’s Global Human Settlement Layer is an innovative high resolution dataset of urban land cover reaching geometric resolutions between 0.5 and 10m (JRC, 2013). As an on-going project of the European Commission since 2010, JRC has developed a novel ap-proach to map, analyse and monitor human settlements and their spatiotemporal evolution in an automated manner. Until August 2012, the dataset covered parts of Europe, South America, Asia and Africa for a total mapped surface of more than 24.3 million km² spread over 1.3 billion people (figure 1) (Pesaresi et al., 2013).The GHSL automatic image infor-mation extraction workflow integrates multi-resolution (0.5m-10m), multi-platform, multi-sensor (PAN, multispectral), and multi-temporal image data such as SPOT-4/5, Quickbird, Ikonos or airborne sensors (JRC, 2012). Ancillary data used as reference and classifica-tion refinement are provided by Landsat-7, the Open StreetMap project (OSM, 2013), MODIS land cover and Landscan (Pesaresis et al., 2013). The layer features five distinct thematic classes, namely “not built-up outside settlements”, “green areas outside settle-ments and larger green spaces”, “not built-up inside settlements”, “green inside city”, and “built-up”. This legend results from the particular processing workflow of fully automatic image information extraction, classification, and generalization based on textural and mor-phological image features: The initial pre-processing steps (correction of positional accu-racy and cloud detection) of the raw (uncalibrated) very high resolution optical data is fol-lowed by a detailed feature extraction workflow deriving both textural as well as morpho-logical features from the input imagery. Subsequently, adaptive learning based on these features and information fusion is applied for classification to identify five distinct classes. Finally, based on the multi-class results, a multi-scale spatial generalization based on morphological features is employed in order to derive a binary settlement layer with the higher ranking goal to manage the trade-off between the precision and the computational cost (Pesaresis et al., 2013).
In first validation efforts, JRC (2012) uses a manual validation protocol by the use of a sys-tematic grid procedure and visual comparison of the corresponding gridcell to pan-

FP7-SPACE-2012-1 / 312972
Deliverable Page 28 / 116
sharpened high resolution optical EO imagery. They find total accuracies of 90% ± 4.9, with region specific values of 90.8% ± 3.9 (Brazil) and 94% ± 6 (China). Furthermore Pe-saresi et al. (2013) rank the input data with regard to the sensor type and input bands used to test sensor-specific performance of the classifier with regard to a high resolution build-ing mask. In this, they find top performances for sensors featuring a 1m to 2.5m spatial resolution and for the panchromatic, green, red and near-infrared bands.
Fig. 3 GHSL data coverage in August 2012 (Pesaresi et al., 2013)
3.1.11 Global Urban Footprint (GUF)
Based on the German space missions TerraSAR-X (TSX) and TanDEM-X (TDX) two coverages of the entire land-mass for 2011 and 2012 have been acquired. In this context, the German Aerospace Center (DLR) has developed a pixel-based classification approach aiming to globally extract urban and non-urban structures from single-look radar imagery. The intended Global Urban Footprint is– like the GHSL – another innovative binary classification of urban and non-urban areas at global scale based on single polarized images acquired in Stripmap mode at an unprecedented geometric resolution of 12m. Considering the challenges of a global urban footprint production, the algorithm is currently further investigated for the potential to improve the classification performance by substituting the presented threshold-based technique by a machine-learning approach (Esch et al., 2012). A detailed description of the employed methodology is given in the next section.
The semi-automatic classification approach consists of a sequential execution of two pro-cessing steps. First, pre-processing is conducted to provide additional texture information to highlight highly textured image regions, typically representing highly structured, hetero-geneous built-up areas (thus, taking advance of specific characteristics of urban SAR data

FP7-SPACE-2012-1 / 312972
Deliverable Page 29 / 116
showing strong scattering due to double bounce effects in these areas). In particular, the pre-processing focuses on the analysis of local speckle characteristics in order to provide this texture layer (referred to as ‘speckle divergence’). The analysis of the local image het-erogeneity by means of the coefficient of variation is an established and straightforward approach to define the local development of speckle in SAR data. Highly textured land-scapes such as urban areas showing a heterogeneous mix of objects within small areas lead to an increase of directional, non-Gaussian backscatter. Hence, the texture for such landscapes typically results in comparably high values. In a second step, this information is used along with the original intensity information to automatically extract the urbanized areas, based on a fully unsupervised image analysis technique. The main concept of this approach is a two stage procedure: First, a set of optimal thresholds for every specific scene is automatically determined by making use of the Jensen-Shannon divergence. These thresholds are then used to train a two-class classifier, which is based on support vector data description (SVDD) following principles of support vector machines (SVM). More details of this methodology are presented in Esch et al. (2010, 2011, 2012 & 2013). The result is a binary mask delineating ‘urbanized‘ from ‘non-urbanized’ areas, a so called urban footprint classification. In the context of area-wide urban area classification, it needs to be stressed, that the term ‘urban footprint’ is widely used in literature and basically re-fers to the spatial extent of urbanized areas on a regional scale; however, it is a fuzzy defi-nition. From a physical point of view, the classification algorithm on radar data detects high reflectance values (scattering centres) in areas with a comparatively high texture measure. The high reflectance is mainly caused by vertical, man-made structures, such as buildings, cars, street signs, etc. In turn, flat, smooth areas such as streets, runways etc. are not in-cluded at this stage. These ‘urban seeds’ are starting point for a subsequent densification for areal detection of urbanized areas based on the condition of high ‘speckle divergence’. Thus, highly structured areas of these impervious surfaces will be included in the urban footprint classification (Taubenböck et al. 2012).
Due to the GUF being a new and innovative project still in the progress of algorithm re-finement relatively few studies have been carried out towards absolute accuracy assess-ment of the resulting products. Taubenböck et al. (2011) conducted a pattern based accu-racy assessment using a high resolution 3-dimensional city model for the test site Padang, Indonesia. Comparison to a sole building inventory reveals over-classification due to the classification of small non-urbanized structures due to the characteristics of the classifica-tory described above. By adding streets and other impervious surface areas to the refer-ence mask higher overall accuracies (79.84 percent) and user accuracies (65.3 percent) are obtained, thus, leading to the conclusion that the classification derived rather resem-bles a settlement mask than a building inventory. Using pattern-based regression analysis with regard to building density the further find shows an increasing over-classification with increasing built-up densities. Furthermore, Esch et al. (2013) list absolute accuracy measures including the overall classification accuracy and the Kappa index for five test sites in table 2.

FP7-SPACE-2012-1 / 312972
Deliverable Page 30 / 116
Tab. 2 Comparative validation of the urban footprint masks generated by fully-automated processing for four global test sites (Esch et al., 2013)
Test site Overall Accuracy [%] Kappa
Bueno Aires, Argentina 94.8 0.883
Munich, Germany 95.8 0.911
Nairobi, Kenya 96.2 0.757
Padang, Indonesia 96.4 0.767
3.1.12 LandScan (LSCAN)
LandScan is a commercial global population distribution dataset providing information in gridded format produced by the Oak Ridge National Laboratory (ORNL). Using an innova-tive approach with Geographic Information Systems (GIS) and remote sensing, ORNL's LandScan dataset is today one of the best known and tested databases regarding spatial population distribution (ORNL, 2013) and data has been widely applied for modelling the spatial distribution of human assets at risk (Dobson et al., 2000). At 30 arcseconds (ca. 1 km) spatial resolution, LandScan is so far the highest resolution global population dataset available representing the ambient population averaged over 24 hours. It uses high resolu-tion EO imagery from sensors such as SPOT as well as various additional data sources such as EO derived land cover products, roads and populated places (VMAP0), digital ter-rain models (DTM), DMSP-OLS Nighttime Lights, vector shorelines of the world, as well as national and subnational population statistics for disaggregation through a multivariate dasymetric modelling approach (Dobson et al., 2000). For the United States, the first 3-arcseconds (ca. 90m) population grid has already been developed and ongoing efforts are being undertaken to increase spatial resolution also outside the U.S. (Bhaduri et al., 2002). To verify and validate the modelling approach Dobson et al. (2000) quantify the corre-spondence with highest resolution census counts for the South western United States (87.8 percent) and Israel (91 percent) with 100 percent of all mapped areas displaying less than a ten percent difference with respect to the reference data in both countries.
3.2 Regional scale
Data availability on a regional scale clearly reveals the discrepancy between data-rich and data-poor countries. On the European continent, several international efforts have been undertaken to provide regional geo-products of trans-European coverage, a prime example being the Copernicus/GMES (Copernicus, 2013) joint initiatives of the EC, ESA, EEA and other partners from research, academia and industry. These programmes have delivered and will further provide accurate, timely and easily accessible information of medium spatial resolution in the disaster management context (ESA, 2013). Prominent examples such as the CORINE Land Cover (CLC), the European Urban Atlas (UA) or the European Soil Sealing are listed below in combination with DLR’s own efforts of mapping regional urban footprints of sample cities. Except for DLR products the regional data is only available for European member states excluding aerial coverage in Central Asia.
FP7-SPACE-2012-1 / 312972
Deliverable Page 31 / 116
3.2.1 Corine Land Cover (CLC)
The pan-European CORINE Land Cover database provides a unique and comparable da-ta base of seamless land cover and land use information for Europe based on satellite re-mote sensing images on a scale of 1:100,000 for the years 1990, 2000 and 2006 (EEA, 2006 & 2012). The most recent update for the year 2006 that is now available at a 100m geometric resolution was completed in 2010 and comprises 44 land use classes of which two correspond to urban fabric (continuous and discontinuous) covering the spatial extent of all European member states. With the regard to the multi-temporal approach, also area-wide regional land use change maps were obtained (DLR, 2011). The main data source for the production of the dataset were two European coverages of the IMAGE 2006 dataset comprised of imagery acquired by SPOT-4, SPOT-5 and the Indian Remote Sensing satel-lite P6 (IRS-P6) for the reference time period 2005 to 2007. Land cover derivation is based on techniques of computer-aided photointerpretation and manual digitizing in a GIS envi-ronment.
While the absolute evaluation of CLC 2006 accuracy is still under investigation, CLC 2000 was found to be 85 percent thematically correct (EEA, 2006). Furthermore, stratified ran-dom sampling was used for validating CLC change between the 2000 and 2006 versions. The obtained 87.8% ± 3.3 overall accuracy was found satisfying (EEA, 2012). A fuzzy method was used by Perez-Hoyos et al. (2012) for an inter-map comparison of CLC, MODIS, GLC and GLOBC to establish affinity or proximity between classes in a more ro-bust way by fuzzy harmonization of land cover legends. Using a Boolean overall agree-ment measure the product was found to have good coincidence (57 percent) with the JRC’s global land cover – the best agreement of all product pairs.
3.2.2 European Urban Atlas (UA)
Featuring a more differentiated urban detail, the Urban Atlas provides pan-European hot spot mapping of urban functional areas, on the basis of repeatedly and homogenously processed data for larger European cities exceeding 100,000 inhabitants (Seifert, 2009; EEA, 2012) and claims for itself to be the first large-scale geo-data set ever produced op-erationally from higher resolution optical satellite data. Produced by EEA the detailed da-tabase provides land cover and land use information for 117 European cities. It encom-passes 22 urban thematic classes and four non-urban classes with a minimum mapping unit for all classes of 0.25 ha (EEA, 2012). Information on impervious surfaces (IS), i.e. surfaces impenetrable by water as such as sidewalks, driveways, rooftops and parking lots as indicator for urban functional land use, are aggregated in five classes on building block level, ranging from discontinuous very low (<10% IS), low (>10-30% IS), medium (>30-50% IS) and dense (>50-80% IS) urban fabric to continuous urban fabric (> 80% IS) (Geiß et al., 2011). The dataset is produced from high resolution optical EO data from sensors such as SPOT, ALOS and QuickBird in addition to ancillary data such as topographic maps, com-mercial navigation data presenting the road network, the degree of soil sealing and other datasets from manual digitising following pre-determined mapping rules as well as auto-mated object-based image classification (EEA, 2012).
FP7-SPACE-2012-1 / 312972
Deliverable Page 32 / 116
The minimum thematic accuracy was determined as 80 percent for all classes and at 85 percent for the class “artificial areas” (EEA, 2012). SIRS (2011) assessed the accuracy of the delivered products for 21 cities by stratified sampling of control points. Validation through local experts reached accuracies ranging between 86 and 99 percent (class “artifi-cial areas”), 87 and 98 percent (“rural” classes), and 86 and 98 percent (overall). In con-trast, Geiß et al. (2012) compare the urban fabric fractions with cadastral reference data for the city of Munich using regression analysis finding a general over-classification by the urban atlas with an only moderate correlation (r=0.629).
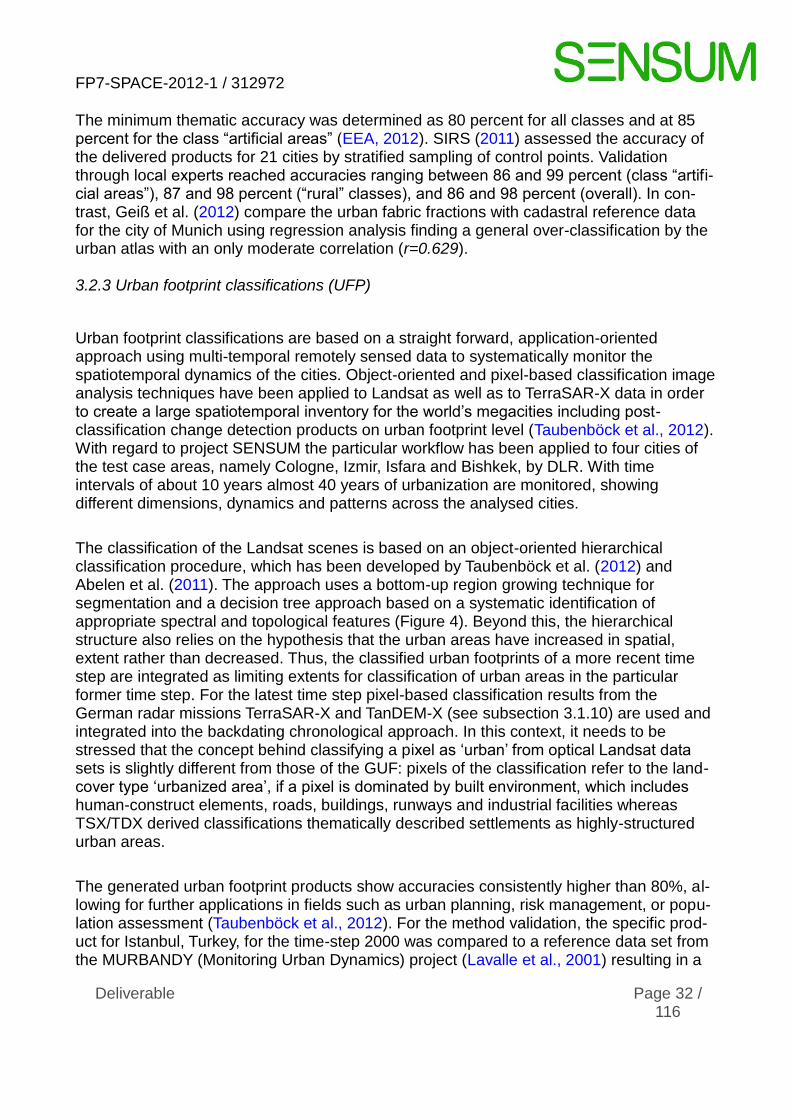
3.2.3 Urban footprint classifications (UFP)
Urban footprint classifications are based on a straight forward, application-oriented approach using multi-temporal remotely sensed data to systematically monitor the spatiotemporal dynamics of the cities. Object-oriented and pixel-based classification image analysis techniques have been applied to Landsat as well as to TerraSAR-X data in order to create a large spatiotemporal inventory for the world’s megacities including post-classification change detection products on urban footprint level (Taubenböck et al., 2012). With regard to project SENSUM the particular workflow has been applied to four cities of the test case areas, namely Cologne, Izmir, Isfara and Bishkek, by DLR. With time intervals of about 10 years almost 40 years of urbanization are monitored, showing different dimensions, dynamics and patterns across the analysed cities.
The classification of the Landsat scenes is based on an object-oriented hierarchical classification procedure, which has been developed by Taubenböck et al. (2012) and Abelen et al. (2011). The approach uses a bottom-up region growing technique for segmentation and a decision tree approach based on a systematic identification of appropriate spectral and topological features (Figure 4). Beyond this, the hierarchical structure also relies on the hypothesis that the urban areas have increased in spatial, extent rather than decreased. Thus, the classified urban footprints of a more recent time step are integrated as limiting extents for classification of urban areas in the particular former time step. For the latest time step pixel-based classification results from the German radar missions TerraSAR-X and TanDEM-X (see subsection 3.1.10) are used and integrated into the backdating chronological approach. In this context, it needs to be stressed that the concept behind classifying a pixel as ‘urban’ from optical Landsat data sets is slightly different from those of the GUF: pixels of the classification refer to the land-cover type ‘urbanized area’, if a pixel is dominated by built environment, which includes human-construct elements, roads, buildings, runways and industrial facilities whereas TSX/TDX derived classifications thematically described settlements as highly-structured urban areas.
The generated urban footprint products show accuracies consistently higher than 80%, al-lowing for further applications in fields such as urban planning, risk management, or popu-lation assessment (Taubenböck et al., 2012). For the method validation, the specific prod-uct for Istanbul, Turkey, for the time-step 2000 was compared to a reference data set from the MURBANDY (Monitoring Urban Dynamics) project (Lavalle et al., 2001) resulting in a
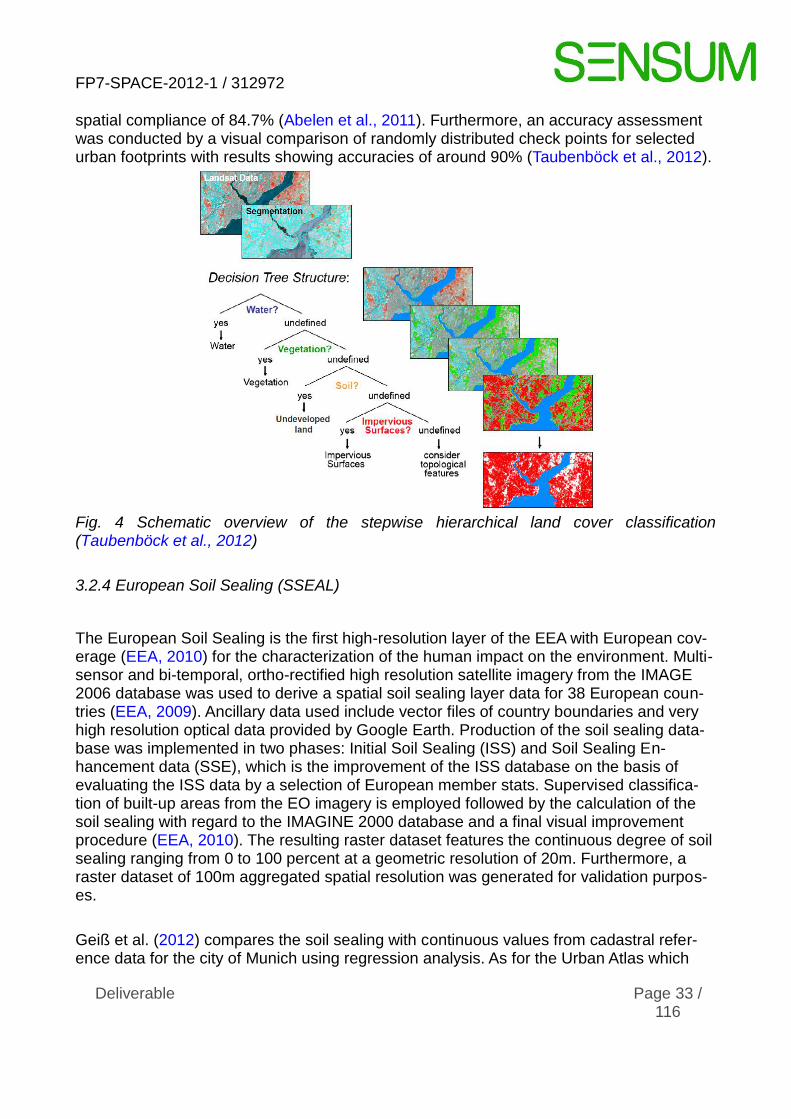
FP7-SPACE-2012-1 / 312972
Deliverable Page 33 / 116
spatial compliance of 84.7% (Abelen et al., 2011). Furthermore, an accuracy assessment was conducted by a visual comparison of randomly distributed check points for selected urban footprints with results showing accuracies of around 90% (Taubenböck et al., 2012).
Fig. 4 Schematic overview of the stepwise hierarchical land cover classification (Taubenböck et al., 2012)
3.2.4 European Soil Sealing (SSEAL)
The European Soil Sealing is the first high-resolution layer of the EEA with European cov-erage (EEA, 2010) for the characterization of the human impact on the environment. Multi-sensor and bi-temporal, ortho-rectified high resolution satellite imagery from the IMAGE 2006 database was used to derive a spatial soil sealing layer data for 38 European coun-tries (EEA, 2009). Ancillary data used include vector files of country boundaries and very high resolution optical data provided by Google Earth. Production of the soil sealing data-base was implemented in two phases: Initial Soil Sealing (ISS) and Soil Sealing En-hancement data (SSE), which is the improvement of the ISS database on the basis of evaluating the ISS data by a selection of European member stats. Supervised classifica-tion of built-up areas from the EO imagery is employed followed by the calculation of the soil sealing with regard to the IMAGINE 2000 database and a final visual improvement procedure (EEA, 2010). The resulting raster dataset features the continuous degree of soil sealing ranging from 0 to 100 percent at a geometric resolution of 20m. Furthermore, a raster dataset of 100m aggregated spatial resolution was generated for validation purpos-es.
Geiß et al. (2012) compares the soil sealing with continuous values from cadastral refer-ence data for the city of Munich using regression analysis. As for the Urban Atlas which

FP7-SPACE-2012-1 / 312972
Deliverable Page 34 / 116
uses the soil sealing as input variable, a consistent over-classification is obvious resulting in an only slightly stronger correlation (r=0.707). Furthermore, EEA (2010) state a 85 per-cent overall accuracy with regard to a building reference layer, however, emphasizing sig-nificant commission errors (> 50 percent) in line with the findings by Geiß et al. (2012).
3.3 Local scale
On the local scale, the availability of high resolution exposure data on building level mainly relies on individual mapping efforts of research institutions, academia and the industry due to data costs and the technical know-how required – even for data rich countries. Thus, the focus of this section is on the derivation of high resolution 2-dimensional and 3-dimensional building inventories derived by DLR. A viable option for future research and application is volunteered geographic information (VGI) provided by crowd-sourcing of extensive mapping communities such as the Open StreetMap project (Haklay & Weber, 2008; OSM, 2013).
3.3.1 3D city models
For accuracy assessment on a per-building scale two 3D city models have been generated by DLR from high resolution EO data following two distinct methodological approaches: (1) a large-scale 3-dimensional building inventory for Cologne was derived from morphological processing of airborne LIDAR data in addition to a (2) 3D building classification covering the densely built-up Gecekondu area of Kadifekale (Izmir) based on manual digitizing using VHR optical imagery and systematic height estimation from Cartosat-1 digital surface models. (1) Digital surface models (DSMs) support the classification of urban structures beyond
two-dimensional classifications. Using the approach presented by Wurm et al. (2011) a large-scale 3D city model was extracted for the test site cologne. LIDAR derived DSM data are segmented using iterative threshold estimation to extract outlines of individual buildings from elevation data. In a second step, median height values are derived for each building footprint by spatial aggregation based on the elevation information con-tained in the LIDAR data were assigned to each building (Wurm et al., 2011). The methodology is suited to extract the urban structure on the level of individual buildings and the results can be utilised as 3D city model for the purpose of decision-making, ur-ban planning and risk analyses. Wurm et al. (2011) find the following accuracy values for the derived 3D city model with regard to ordnance survey data: A total accuracy of 96.08 and a Kappa value of 0.754 for the building outlines as well as a strong correla-tion (R²=0.81; 31.447 observations) to reference building heights.
(2) In the case of Izmir’s Gecekondu area Kadifekale, building footprints were extracted by
manual digitising based on the cognitive perception of the interpreter. This method features shortcomings in terms of repeatability and consistent quality in and across cities. However, in contrast to automated extraction of building objects which is difficult

FP7-SPACE-2012-1 / 312972
Deliverable Page 35 / 116
to apply in high-density urban areas, this form of visual interpretation provides a flexible approach when following a standardised digitising protocol. Thus, the high spatial resolution (0.5m) and multispectral information provided by Worldview-2 imagery employed allowed for the straight-forward derivation of one polygon per building (Taubenböck & Kraff, 2013). The building inventory was subsequently supplemented by building heights derived from high resolution (5m) digital surface models provided by the Indian stereo sensor Cartosat-1. The specific workflow followed is based on a straight-forward processing procedure of semi-global matching for derivation of digital surface models (D’Angelo et al., 2010) and a morphological filtering approach (Haralick, 1987) to derive absolute object heights. For this dataset no accuracy assessment has been performed so far.
3.3.2 2D building classifications
By employing an object-based, multi-level and hierarchical classification procedure using very high resolution optical satellite imagery, a high-detail building classification was generated to showcase the capabilities of remote sensing for semi-automatically mapping physical elements on building level. As input data a high geometric resolution (0.6m in panchromatic band, 2.5m for multi-spectral bands) multi-spectral Quickbird scene of the central urban area of Izmir was utilized. The workflow has been developed based on IKONOS and Quickbird data for the megacities Istanbul, Turkey, and Hyderabad, India, with a particular focus on high class accuracies and stable transferability by fast and easy adjustments on varying urban structures or sensor characteristics (Taubenböck et al., 2010). The method was validated against a building mask representing ground reference data for Istanbul. The spatial comparison shows an overall accuracy exceeding 83 percent for all thematic classes and equally high user (84.3 percent) and producer accuracies (82.4 per-cent) for the housing classifications. For Hyderabad, a visual verification was conducted with 200 control points randomly sampled in each thematic class. The overall accuracy was found to be consistently high (85.2 percent) with good user (82.6 percent) and pro-ducer (79.4 percent) accuracies (Taubenböck et al., 2010). For project purposes and trans-ferability testing, Quickbird data for Izmir have been employed to derive the building mask for the central urban area of Izmir. For initial validation, a visual verification of the building classification was conducted that yields an overall accuracy of more than 87 percent (pro-ducer accuracy: 85.33 percent; user accuracy: 87.25 percent).
3.3.3 Open StreetMap
The Open StreetMap project (OSM) is a knowledge collective that provides user-generated street maps, building footprints, points of interest and other base-level geo-graphic information objects. In the context of detailed urban mapping, crowdsourcing of geospatial data using informal social networks and web technology has gained attention in the past decade. Although the accuracy, availability, and completeness of volunteered ge-

FP7-SPACE-2012-1 / 312972
Deliverable Page 36 / 116
ographical information (VGI) depend on the individual mappers (Haklay & Weber, 2013), stepwise improvement of the overall data quality is promoted by a self-controlling mecha-nism of mutual quality control and error reporting within the user community. Thus, OSM presents a valuable and cost-effective data source as an open source effort to map the world’s streets, roads, railway, waterways, place locations and natural environment, espe-cially in data-poor countries. Complete street maps can be used to weight population dis-tribution within a given spatial unit- such as a postal code (Haklay, 2010). However, the streets in Open StreetMap are rarely fully neither consistent nor complete due to local in-terest and activities of mappers. However, providing both land use and infrastructure in-formation on building level a large global data basis has been compiled since 2004 (OSM, 2013). Haklay et al. (2010) attempts a first quality assessment of OSM road network data against Ordnance Survey data for the United Kingdom (England and Scotland) finding that OSM data can be fairly accurate with approximately 80 percent overlap with motorways.

FP7-SPACE-2012-1 / 312972
Deliverable Page 37 / 116
Conclusion
This report showcases the high potential of earth observation for the consistent and objective monitoring of elements at risk at various spatial scales. The product portfolio of EO derived geo-products ranges from global low resolution land cover datasets or related spatial attributes such as night-time illumination or fractions of impervious surfaces as a first approximation of the elements at risk, to a generation of high resolution spatially accurate building inventories for the detailed analysis of the building stock’s physical vulnerability. Despite the importance for adequate data for a comprehensive risk analysis as a critical factor affecting the constraints and requirements for the scientific community, end-users, stakeholders and policy makers, an immense discrepancy exists between data-rich countries of the developed world where extensive geospatial information is available and less-developed data-poor countries. While data-poor countries mainly rely on international efforts to provide low resolution land cover / use maps of global coverage with a particular focus on mapping urban areas as the only data basis available for disaster management, several international efforts have been undertaken to provide geo-products - a prime example being the Copernicus/GMES offer of trans-European coverage – on a regional scale. The availability of high resolution exposure data on building level mainly relies on specific and focussed individual mapping efforts of research institutions, academia and the industry providing the financial resources, data inventories and technical know-how required.
With regard to user-oriented product generation in project SENSUM, a multi-scale and multi-source reference database has been set up to systematically screen available products with regard to data availability for three test sites of strongly differing data availability: Cologne (data-rich), Izmir (intermediate), Isfara/Batken (data-poor). At a later stage these data will serve as a reference to evaluate and document the capabilities and limitations of the proposed products and range them with regard to the current GMES product portfolio and software solutions. Figure 5 comprehensively displays the collected data inventory with regard to thematic/spatial resolution, reference year and spatial coverage. It becomes clear that data-poor countries of Central Asia mainly rely on coarse resolution products of global coverage which, however, provide multi-categical thematic detail. In contrast, medium and high resolution datasets are spatially restricted to the European test sites due to the trans-European mapping efforts initiated there. However, two currently developed global products – namely DLR’s Global Urban Footprint as well as JRC’s Global Human Settlement Layer – will be a major leap forward regarding the derivation of high resolution and accurate reference data for human exposures on a global scale – as they will provide consistent and geometrically detailed land cover information on unprecedented spatial resolutions. Furthermore, a viable option for future research and applications is volunteered geographic information (VGI) provided by crowd-sourcing of extensive mapping communities such as the Open StreetMap project.

FP7-SPACE-2012-1 / 312972
Deliverable Page 38 / 116
Fig. 5 Overview of reference datasets with regard to thematic/spatial resolution, reference year and spatial coverage
Finally, it needs to be stressed that future EO missions will provide new opportunities and data continuity for a wide range of geo-risk investigations. However, as remote sensing methods alone cannot provide all information needed for a comprehensive vulnerability and risk estimation, especially when political or socio-economical vulnerability is considered, the call for future research is on the integration of EO and in-situ data. Furthermore, the higher-ranking goal of activities in project SENSUM should address potentials for integration of the proposed products and methodologies in the GMES service offer, particularly envisaging the future expansion of the GMES services and product offer to further non-European data-poor countries.
GLC (2000)GLOBC (2009)
GRUMP (1995)
HYDE (2005)
IMPSA (2000)
LITES (2012)
MODIS (2012)
MODUL(2001)
VMAP0(1997)
GHSL (2013)
GUF (12m)
LandScan (2011)
CLC (2006)
UA (2006)
UFP (2012)
SSEAL (2006)
3DCM (2011)
2DBC (2009)OSM (2013)
0
10
20
30
40
50
0.1 1 10 100 1000 10000
The
mat
ic r
eso
luti
on
(n
o. c
lass
es)
Spatial resolution (m)
all test sites
additional: Cologne, Izmir
additional: only Cologne

FP7-SPACE-2012-1 / 312972
Deliverable Page 39 / 116
References cited
Aubrecht, C., Özceylan, D., Steinnocher, K., Freire, S. (2012) Multi-level geospatial modeling of human exposure patterns and vulnerability indicators. In: Taubenböck, H., Post, J., Strunz, G. (eds.) Remote sensing contributing to mapping earthquake vulnerability and effects. Special Issue in Natural Hazards.
Bartholome, E., Belward, S. (2005) GLC2000: a new approach to global land cover mapping from Earth observation data. International Journal of Remote Sensing, 26, 2005.
Bhaduri, B.L., Bright, E.A., Coleman, P.R., and Dobson, J.E. 2002. LandScan: Locating People is What Matters. Geoinformatics Vol. 5, No. 2, pp. 34-37.
Birkmann, J. (2006) Indicators and criteria for measuring vulnerability: theoretical bases and requirements. In: Birkmann, J. (ed) Measuring vulnerability to natural hazards. United Nations University Press, New York, 55–77.
Borfecchia, F., Pollino, M., De Cecco, L., Lugari, A., Martini, S., La Porta, L., Ristoratore, E., Pascale C (2010) Active and passive remote sensing for supporting the evaluation of the urban seismic vulnerability. Italian Journal of Remote Sensing, 42,129–141.
Borzi, B., Dell’Acqua, F., Faravelli, M., Gamba, P., Lisini, G., Onida, M., Polli, D. (2011) Vulnerability study on a large industrial area using satellite remotely sensed images. Bulletin of Earthquake Engineering, 9, 675–690.
Chiroiu, L., Adams, B., Saito, K. (2006) Advanced techniques in modeling, response and recovery. In: Oliveira, C.S., Roca, A., Goula, X. (eds.) Assessing and managing earthquake risk. Springer, Dordrecht, 427–448.
Copernicus (2013) Copernicus – The European EO programme. Available at: http://www.copernicus.eu/ [Accessed 8 Dec 2013].
D’Angelo, Uttenthaler, A., Carl, S., BArner, F., and Reinartz, P. (2010) Automatic generation high quality DSM based on IRS-P5 Cartosat-1 stereo data. In: ESA Living Planet Symposium, Bergen, 28 June – 2 July 2010. Bergen: ESA.
Danko, D.M. (1992) The Digital Chart of the World Project. Photogrammetric Engineering and Remote Sensing, 58, 1125–1128.
Dech, S. (1997) Anwendung der Satellitenfernerkundung. Von der geowissenschaftlichen Forschung zum operationellem Einsatz. DLR Forschungsbericht, 97, 52.
Deichmann, U., Ehrlich, D., Small, C., Zeug, G. (2011) Using high resolution satellite data for the identification of urban natural disaster risk. Global Facility for Disaster Reduction and Recovery, Washington, DC.
DLR (2011) Corine Land Cover – Germany. Available at:

FP7-SPACE-2012-1 / 312972
Deliverable Page 40 / 116
http://www.corine.dfd.dlr.de/intro_en.html [Accessed 14 Jun 2013].
Dobson, J. E., E. A. Bright, P. R. Coleman, R. C. Durfee, B. A. Worley. 2000. "A Global Population database for Estimating Populations at Risk", Photogrammetric Engineering & Remote Sensing Vol. 66, No. 7, July, 2000.
EEA (2006) Corine land cover database passes accuracy test. Available at: http://www.eea.europa.eu/highlights/Ann1151398593 [Accessed 14 Jun 2013].
Ehrlich, D., Zeug, G. (2008) Assessing disaster risk of building stock. Methodology based on earth observation and geographical information systems. JRC scientific and technical reports. European Commission Joint Research Centre, Institute for the Protection and Security of the Citizens.
Ehrlich, D., Zeug. G., Gallego, J., Gerhardinger, A., Caravaggi, I., Pesaresi, M. (2010) Quantifying the building stock from optical high-resolution satellite imagery for assessing disaster risk. Geocarto International, 25(4), 281–293.
Eicher, C.L., Brewer, C.A. (2001) Dasymetric mapping and areal interpretation interpolation: implementation and evaluation. Cartography and Geographic Information Science, 28, 125-138.
Elvidge, C., Tuttle, B.T., Sutton, P.C., Baugh, K.E., Howard, A.T., Milesi, C., Budhendra, B.L., Ramakrishna, N. (2007).Global distribution and density of constructed impervious surfaces. Sensors, 7,1962−1979.
Elvidge, C.D., Erwin, E.H., Baugh, K.E., Ziskin, D., Tuttle, B.T., Ghosh, T., Sutton, P.C. (2009) Overview of DMSP nighttime lights and future possibilities. In Proceedings of the 7th International Urban Remote Sensing Conference, Shanghai, China, 20–22 May 2009.
Esch, T., Dech, S., Roth, A., Schmidt, M., Taubenböck, H., Heldens, W., Thiel, M., Wurm, M., Klein, D. (2009) Monitoring and assessment of urban environments using space-borne earth observation data. In: Kreck, A., Rumor, M., Zlatanova, S., Fendel, E. (eds) Urban and regional data management. Taylor & Francis Group, London, 385–398.
Esch, T., Marconcini, M., Felbier, A., Roth, A., Heldens, W., Huber, M., Schwinger, M., Müller, A. (2013): Urban Footprint Processor – Fully automated processing chain generating settlement masks from global data of the TanDEM-X mission. Geoscience and Remote Sensing Letters, Special Stream EORSA2012. Submitted.
Esch, T., Schenk, A. Ullmann, T., Thiel, M. Roth, A., Dech, S. (2011): Characterization of Land Cover Types in TerraSAR-X Images by Combined Analysis of Speckle Statistics and Intensity Information. IEEE Transactions on Geoscience and Remote Sensing, 49, 1911-1925.
Esch, T., Taubenböck, H., Roth, A., Heldens, W., Felbier, A., Thiel, M., Schmidt, M., Müller, M., Müller, A., Dech, S. (2012) TanDEM-X mission—new perspectives for the inventory and monitoring of global settlement patterns. Journal of Applied Remote Sensing, 6, 061702.

FP7-SPACE-2012-1 / 312972
Deliverable Page 41 / 116
Esch, T., Thiel, M., Schenk, A., Roth, A., Müller, A., Dech, S. (2010): Delineation of Urban Footprints From TerraSAR-X Data by Analyzing Speckle Characteristics and Intensity Information. IEEE Transactions on Geoscience and Remote Sensing, 48, 905-916.
European Commission (EC) (2012) Mapping Guide –for a European Urban Atlas. Available at ec.europa.eu/regional_policy/tender/pdf/2012066/annexe2.pdf Accessed 14 Jun 2013.
European Environment Agency (EEA) (1994) CORINE Land Cover – Part 1: Methodology. Available at: http://www.eea.europa.eu/publications/COR0-part1 Accessed: 4 Dec 2013.
European Environment Agency (EEA) (2000) CORINE land cover technical guide. Available at: http://www.eea.europa.eu/publications/tech40add Accessed: 4 Dec 2013.
European Environment Agency (EEA) (2006) Corine land cover database passes accura-cy test. Available at: http://www.eea.europa.eu/highlights/Ann1151398593 Accessed 14 Jun 2013 [Accessed: 4 Dec 2013]
European Environment Agency (EEA) (2009) EEA-FTSP-Sealing Enhancement – DeliveryReport: EuropeanMosaic. Available at: http://www.eea.europa.eu/data-and-maps/data/eea-fast-track-service-precursor-on-land-monitoring-degree-of-soil-sealing#tab-additional-information [Accessed 5 Dec 2013]
European Environment Agency (EEA) (2010) European validation of GMES FTS Soil Sealing Enhancement data. Available at: http://www.eea.europa.eu/data-and-maps/data/eea-fast-track-service-precursor-on-land-monitoring-degree-of-soil-sealing#tab-additional-information [Accessed 5 Dec 2013]
European Environment Agency (EEA) (2012a) Corine Land Cover 2006 seamless vector layer. Available at: http://www.eea.europa.eu/data-and-maps/data/corine-land-cover-2006-raster-2 [Accessed: 4 Dec 2013]
European Environment Agency (EEA) (2012b) Implementation and achievements of CLC2006. Available at: http://www.eea.europa.eu/data-and-maps/data/corine-land-cover-2006-raster-2#tab-documents Accessed: 4 Dec 2013.
European Space Agency (ESA) (2010) GlobCover 2009 Product Description Manual. Available at: http://dup.esrin.esa.it/files/p68/GLOBCOVER2009_Product_Description_Manual_1.0.pdf Accessed: 4 Oct 2013.
European Space Agency (ESA) (2011) Product Description and Validation Report. Avail-able: http://due.esrin.esa.int/globcover/LandCover2009/GLOBCOVER2009_Validation_Report_2.2.pdf Accessed 4 Oct 2013.
FEMA (2010) HAZUS—MH MR5. Multi-hazard loss estimation methodology—earthquake model. Technical manual. Department of Homeland Security, Emergency Preparedness and Response Directorate. Washington D.C.
FP7-SPACE-2012-1 / 312972
Deliverable Page 42 / 116
French S.P., Muthukumar, S. (2006) Advanced technologies for earthquake risk inventories. Journal of Earthquake Engineering, 10, 207–236.
Friedl, M. A., Sulla-Menashe, D., Tan, B., Schneider, A., Ramankutty, N., Sibley, A., and Huang, X. (2010). MODIS Collection 5 global land cover: Algorithm refinements and characterization of new datasets. Remote Sensing of Environment, 114, 168–182.
Fritz, S., See, L., McCallum, I., Schill, C., Obersteiner, M., van der Velde, M., Bottcher, H., Havlik, P., Achard, F. (2011) Highlighting continued uncertainty in global land cover maps for the user community. Environmental Research Letters, 6, 044005 (6pp).
Fu, B., Ninomiya, Y., Lei, X., Toda, S., Awata, Y. (2004) Mapping active fault associated with the 2003 Mw 6.6 Bam (SE Iran) earthquake with ASTER 3D images. Remote Sensing of Environment, 92, 153–157.
Ge, Y., Xu, J., Liu, Q., Yao, Y., Wang, R. (2009) Image interpretation and statistical analysis of vegetation damage caused by the Wenchuan earthquake and related secondary disasters. Journal of Applied Remote Sensing, 3:031660.doi:10.1117/1.3141726.
Geiß, C., Taubenböck, H. (2012) Remote sensing contributing to assess earthquake risk: from a literature review towards a roadmap. Natural Hazards, doi: 10.1007/s11069-012-0322-2.
Geiß, C., Taubenböck, H. (2012) Remote sensing contributing to assess earthquake risk: from a literature review towards a roadmap. Natural Hazards, 1-42. doi: 10.1007/s11069-012-0322-2.
Geiß, C., Wurm, M., Taubenböck, H., Heldens, W., Esch, T. (2011) Comparison of select-ed impervious surface products derived from remote sensing data. In: Proceedings of the JURSE 2011. Presented at the JURSE 2011, Munich.
GEM (2011) Global earthquake model. Available at http://www.globalquakemodel.org/. [Accessed 4 Dec 2013].
Giri, C., Zhu, Z.L, Reed, B. (2005) A comparative analysis of the Global Land Cover 2000 and MODIS land cover data sets, Remote Sensing of Environment, 94, 123–132.
Goebel, J., Wurm, M. (2010) Räumliche Unterschiede im Armutsrisiko in Ost- und Westdeutschland. In: Krause, P., Ostner, I. (eds.) Leben in Ost- und Westdeutschland, 2010, Campus, S. 673-692.
Guo, H. (2010) Understanding global natural disasters and the role of earth observation. International Journal of Digital Earth, 3, 221–230.
Haklay, M., and Weber, P. (2008) OpenStreetMap: User-Generated Street Maps. IEEE Pervasive Computing, 7, 12-18.
Haklay. M. (2010) How good is volunteered geographical information? A comparative study of OpenStreetMap and Ordnance Survey datasets. Environment and Planning B: Planning and Design 2010, 37, 682-703.

FP7-SPACE-2012-1 / 312972
Deliverable Page 43 / 116
Haralick, R.M., Stanley, S.R., and Zhumang, X. (1987) Image Analysis Using Mathemati-cal Morphology. IEEE Transactions on pattern analysis and machine intelligence, 9, 532-550.
Joint Research Center (JRC) (2012) A Global Human Settlement Layer from Optical High Reolution Imagery. JRC Scientific and Policy Report EUR 25662 EN.
Joint Research Centre (JRC) (2003) Global Land Cover 2000 database. Available at: http://bioval.jrc.ec.europa.eu/products/glc2000/glc2000.php Accessed 27 Sept 2013.
Joyce, K.E., Belliss, S.E., Samsonov, S.V., McNeill, S.J., Glassey, P.J. (2009) A review of the status of satellite remote sensing and image processing techniques for mapping natural hazards and disasters. Progress in Physical Geography, 33, 183–207.
Kasperson, R. E., Dow, K., Archer, E. Caceres, D., Downing, T., Elmqvist, T., Eriksen, S., Folke, C., Han, G., Iyengar, K., Vogel, C., Wilson, K., and Ziervogel, G. (2005) Vulnerable people and places, In: Hassan, R., Scholes, R., Ash, N. (eds) Ecosystems and Human Well-being: current state and trends. Washington D. C., 2005, Island Press, 143–164.
Klein Goldewijk, K. (2001) Estimating global land use change over the past 300 years: The HYDE database. Global Biochemical Cycles, 15, 417-433.
Klein Goldewijk, K. (2005) Three centuries of global population growth: A spatial referenced population (density) database for 1700-2000. Population and Environment, 26, 343-367.
Klein Goldewijk, K. , Beusen, A., de Vos, M., van Drecht, G. (2011) The HYDE 3.1 spatially explicit database of human induced land use change over the past 12,000 years. Global Ecology and Biogeography, 20, 73-86.
Langford, M., Higgs, G., Radcliffe, J., White, S. (2008) Urban population distribution models and service accessibility estimation. Computers, Environment and Urban Systems, 32, 66-80.
Lavalle, C., Demicheli, L., Turchini, M., Casals-Carrasco, P., Niederhuber, M. (2001) Monitoring mega cities: The MURBANDY/MOLAND approach. Development in Practice, 11, 2 & 3, 350–357.
Mayaux, P., Hugh, E., Gallego, J., Strahle, A.H., Herold, M., Agrawal, S., Naumov, S., De Miranda, E.E., Di Bella, C.M., Ordoyne, C., Kopin, Y., Roy, P.S. (2006) Validation of the Global Land Cover 2000 Map. IEEE Transactions on Geoscience and Remote Sensing, 44, 1728-1739.
Mennis, J., Hultgren, T. (2006) Intelligent daysmetric mapping and its application to aeal interpolation. Cartography and Geographic Information Science, 33, 179-194.
Mueller, M., Segl, K., Heiden, U., Kaufmann, H. (2006) Potential of high-resolution satellite data in the context of vulnerability of buildings. Natural Hazards, 38, 247–258.
Mueller, M., Segl, K., Heiden, U., Kaufmann, H. (2006) Potential of high-resolution satellite data in the context of vulnerability of buildings. Natural Hazards, 38, 247–258.

FP7-SPACE-2012-1 / 312972
Deliverable Page 44 / 116
National Imagery and Mapping Agency (NIMA) (1995) MIL-PRF-89039 Performance specification Vector Smart Map (VMap) Level 0. Available at: http://earth-info.nga.mil/publications/specs/printed/89039/PRF_8903.PDF [Accessed: 4 Dec 2013]
Oak Ridge National Laboratory (ORNL) (2013) LandScan™ Available at: http://web.ornl.gov/sci/landscan/index.shtml [Accessed 4 Dec 2013]
Open StreetMap (OSM) (2013) The Open StreetMap Project. Available at: http://www.openstreetmap.org [Accessed 5 Dec 2013]
Peduzzi, P. (2006) The disaster risk index: overview over a quantitative approach. In: Birkmann, J. (ed) Measuring vulnerability to natural hazards—towards disaster resilient societies. New York, 2006, United Nations University, 171–181.
Pérez-Hoyos, A., García-Haro, F.J., San-Miguel-Ayanz, J. (2012) Conventional and fuzzy comparisons of large scale land cover products: Application to CORINE, GLC2000, MODIS and GlobCover in Europe. ISPRS Journal of Photogrammetry and Remote Sensing, 74, 185-201.
Pesaresi, M., Guo, H., Blaes, X., Ehrlich, D., Ferri, S., Gueguen, L., Kalkia, M., Kauffmann, M., Kemper, T., Lu, L., Marin-Herrera., M.A., Ouzounis, G.K., Scavazzon, M., Soille, P., Syrris, V., Zanchetta, L. (2013) A Global Human Settlement Layer from optical HR/VHR RS data: concept and first results. IEEE Journal Of Selected Topics In Applied Earth Observations And Remote Sensing, 6, 2102-2131.
Philip, G. (2010) Remote sensing data analysis for mapping active faults in the northwestern part of Kangara Valley, NW Himalaya, India. International Journal of Remote Sensing, 28(21), 4745–4761.
Pittore, M., Wieland, M. (2019) Towards a rapid probabilistic seismic vulnerability assessment using satellite and ground-based remote sensing. Natural Hazards, doi: 10.1007/s11069-012-0475-z, 2012.
Polli, D., Dell’Acqua, F. (2011) Fusion of optical and SAR data for seismic vulnerability mapping of buildings. In: Prasad, S., Bruce, L.M., Chanussot, J. (eds) Optical remote sensing. Advances in signal processing and exploitation techniques. Springer, Heidelberg, 329–341.
Potere, D., Schneider, A. (2009) Comparison of global urban maps, In: Global mapping of Human Settlement, In: Gamba, P. and M. Herold (Eds.), Global Mapping of Human Settlements: Experiences, Data Sets, and Prospects, Taylor and Francis, Boca Raton, FL.
Potere, D., Schneider, A., Angel, S., Civco, D.L. (2009) Mapping urban areas on a global scale: which of the eight maps now available is more accurate? International Journal of Remote Sensing, 30, 6531-6558.
Pozzi, F., Balk, D., Yetman, Nelson, G., Deichmann, U., Nelson, A. (2004) Methodologies to Improve Global Population Estimates in Urban and Rural Area. Proceedings of 24th annual ESRI User Conference. 24th Annual ESRI International User Conference, San

FP7-SPACE-2012-1 / 312972
Deliverable Page 45 / 116
Diego, California, 9-13 Aug 2004.
RiskScape (2012) Easy-to-use multi-hazard impact and risk assessment tool. Available at http://www.globalquakemodel.org/. [Accessed 21 Nov 2013].
Sahar, L., Muthukumar, S., French, P. (2010) Using aerial imagery and GIS in automated building footprint extraction and shape recognition for earthquake risk assessment of urban inventories. IEEE Transactions in Geoscience and Remote Sensing, 48, 3511–3520.
Schneider, A., Friedl, M.A., Potere, D. (2009) A new map of global urban extent from MODIS data. Environmental Research Letters, 4, article 044003.
Schneider, A., Friedl, M.A., Potere, D. (2010) Monitoring urban areas globally using MODIS 500m data: New methods and datasets based on urban ecoregions. Remote Sensing of Environment, vol. 114, p. 1733-1746.
Schneider, A., Friedl, M.A., Potere, D. (2010) Monitoring urban areas globally using MODIS 500m data: New methods and datasets based on urban ecoregions. Remote Sensing of Environment, vol. 114, p. 1733-1746.
Seifert, F.M. (2009) Improving Urban Monitoring towards a European Urban Atlas. In: Gamba, P., Herold, M. (eds.), Global Mapping of Human Settlement. Experiences, Data sets, and Prospects, 2009, pp. 231-250.
Socioeconomic Data and Applications Center (SEDAC) (2013): Global Rural-Urban Mapping Project (GRUMP), v1. Available at: http://sedac.ciesin.columbia.edu/data/collection/grump-v1 [Accessed 4 Oct 2013]
Stramondo, S., Moro, M., Tolomei, C., Cinti, F.R., Doumaz, F. (2005) InSAR surface displacement field and fault modelling for the 2003 Bam earthquake (southeastern Iran). Journal of Geodynamics, 40, 347–353.
Systèmes d'Information à Référence Spatiale (SIRS) (2011) Urban Atlas – Delivery of land use/cover maps of major European agglomerations – Final report (V 2.0). Available at: http://ec.europa.eu/regional_policy/tender/pdf/2012066/urban_atlas_final_report_112011.pdf [Accessed 5 Dec 2013]
Taubenböck, H., Esch, T., Felbier, A., Roth, A., Dech, S. (2011) Pattern-based accuracy assessment of an urban footprint classification using TerraSAR-X data. IEEE Geoscience and Remote Sensing Letters, 8, 278-282.
Taubenböck, H., Esch, T., Felbier, A., Wiesner, M., Roth, A., and Dech, S. (2012) Monitoring urbanization in mega cities from space. Remote Sensing of the Environment, 117, 162-176.
Taubenböck, H., Esch, T., Wurm, M., Roth, A., and Dech, S. (2010) Object-based feature extraction using high spatial resolution satellite data of urban areas. Journal of Spatial Science, 55, 117-132.
FP7-SPACE-2012-1 / 312972
Deliverable Page 46 / 116
Taubenböck, H., Kraff, N.J. (2013) The physical face of slums: a structural comparison of slums in Mumbai, India, based on remotely sensed data. Journal of Housing and the Built Environment, doi: 10.1007/s10901-013-9333-x.
Taubenböck, H., Post, J., Roth, A., Zosseder, K., Strunz, G., Dech, S. (2008) A conceptual vulnerability and risk framework as outline to identify capabilities of remote sensing. Natural Hazards and Earth System Sciences, 8, 409–420.
Taubenböck, H., Wurm, M., Setiadi, N., Gebert, N., Roth, A., Strunz, G., Birkmann, J., Dech, S. (2009) Integrating remote sensing and social science. Urban Remote Sensing Event, 2009, 1-7, doi: 10.1109/URS.2009.5137506.
Taubenböck. H., Goseberg, N., Setiadi, N., Lämmel, G., Moder, F., Oczipka, M., Klüpfel, H., Wahl, R., Schlurmann, T., Strunz, G., Birkmann, J., Nagel, K., Siegert, F., Lehmann, F., Dech, S., Gress, A., Klein, R. (2009) ‘‘Last-Mile’’ preparation for a potential disaster—interdisciplinary approach towards tsunami early warning and an evacuation information system for the coastal city of Padang, Indonesia. Natural Hazards and Earth System Sciences, 9, 1509–1528.
United Nations (UN) (1991): Mitigating Natural Disasters: Phenomena, Effects, and Options: a Manual for Policy Makers and Planners, New York: UNDRO (United Nations Disaster Relief Organization).
United Nations Office for Disaster Risk Reduction (UN/ISDR) (2004) Living with risk: a global review of disaster reduction initiatives. United Nations/International Strategy for Disaster Reduction, Geneva, Switzerland, UN Publications.
United States Geological Survey (USGS) (2013) Land Cover Type Yearly L3 Global 500 m SIN Grid – MCD12Q1. Available at: https://lpdaac.usgs.gov/products/modis_products_table/mcd12q1 [Accessed 15 Dec 2013].
White, P., Pelling, M., Sen, K., Seddon, D., Russell, S., Few, R. (2005) Disaster risk reduction: a development concern. A scoping study on links between disaster risk reduction, poverty and development. Department for International Development.
Wieland, M., Pittore, M., Parolai, S., Zschau, J., Moldobekov, B., Begaliev, U. (2012) Estimating building inventory for rapid seismic vulnerability assessment: towards an integrated approach based on multisource imaging. Soil Dynamics and Earthquake Engineering, 36, 70–83.
Wurm, M., Goebel, J., Wagner, G.G. (2010) Integration raumrelevanter Indikatoren in sozial- und verhaltenswissenschaftliche Analysen. In: Taubenböck, H. und Dech, S. (eds.) Fernerkundung im urbanen Raum, 2010 , Darmstadt: Wissenschaftliche Buchgesellschaft, S.153-162.
Wurm, M., Taubenböck, H., Schardt, M., Esch, T., and Dech, S. (2011) Object-based image information fusion using multisensor earth observation data over urban areas. International Journal of Image and Data Fusion, 2, 121-147.
Xu, W., Dong, R., Wang, X., Ouyang, Z., Li, Z., Xiao, Y., Zhang, J. (2009) Impact of China’s

FP7-SPACE-2012-1 / 312972
Deliverable Page 47 / 116
May 12 earthquake on Giant Panda habitat in Wenchuan County. Journal of Applied Remote Sensing, doi:10.1117/1.3153916.
Zeng, J., Zhu, Z.Y., Zhang, J.L., Ouyang, T.P., Qiu, S.F., Zou, Y., Zeng, T. (2011) Social vulnerability assessment of natural hazards on county-scale using high spatial resolution satellite imagery: a case study in the Luogang district of Guangzhou, South China. Environmental Earth Science, 65, 173–182.

FP7-SPACE-2012-1 / 312972
Deliverable Page 48 / 116
Appendix 1 – Metadata: Global Land Cover
Global Land Cover 2000 (GLC)
Originator EC Joint Research Centre (JRC)
Online Resource http://bioval.jrc.ec.europa.eu/products/glc2000/glc2000.php
Abstract (Originator)
GLC is a global land cover database for the year 2000 (GLC2000) produced by an international partnership of 30 research groups coordinated by the European Commission's Joint Research Centre. The database contains two levels of land cover information—detailed, regionally optimized land cover legends for each continent and a less thematically detailed global legend that harmonizes regional legends into one consistent product. The land cover maps are all based on
daily data from the VEGETATION sensor on‐board SPOT 4, though mapping of some regions involved use of data from other Earth observing sensors to resolve specific issues. Detailed legend definition, image classification and map quality assurance were carried out region by region. The global product was made through aggregation of these. The database is designed to serve users from science programmes, policy
makers, environmental convention secretariats, non‐governmental organizations and development‐aid projects. The regional and global data are available free of charge for all non‐commercial applications from http://www.gvm.jrc.it/glc2000 (Bartholome & Belward, 2005).
Reference Bartholome, E., Belward, S. (2005) GLC2000: a new approach to global land cover mapping from Earth observation data. In-ternational Journal of Remote Sensing, 26, 2005.
Availability (commercial/free)
Free
Data policy Data is available free of charge for non-commercial use, provided it is properly referenced (see the copyright note). COPYRIGHT NOTICE This World Wide Web site includes information, the software and media on which it is operated or contained (individually and collectively the "Information"), which is made available by the European Commission (the "Commission"). The Information on this World Wide Web site is made available in or-der to enhance public knowledge concerning the activities of the Eu-ropean Communities. The Information has been supplied by Commis-sion staff, and/or by companies or organisations (in this specific case, the partners of the GLC2000 project) involved in research and devel-

FP7-SPACE-2012-1 / 312972
Deliverable Page 49 / 116
opment activities and/or in the Commission's programmes (the "In-formation Suppliers"). All title and intellectual property rights, includ-ing, but not limited to, trademarks, copyrights in and to the infor-mation, and any copies thereof in whatever form, are owned by the Information Suppliers, and/or by the Commission, and/or by other par-ties, and are protected by the applicable laws. Any trademarks or names being used are for editorial purposes only, and to the benefit of the trademark owner, with no intention of infringing upon that trade-mark. Except where otherwise noted, all site contents are: © Europe-an Communities. All rights reserved.
Data Properties
Format Raster
Original Projection WGS84 – Geographic
Reference year / time period
2000/2001
Spatial resolution / scale
988m (at equator with native geographic projection (32’’))
Thematic resolution 22 thematic classes
Layers [Unit] (bold = integrated into reference database)
The Global Land Cover dataset - Harmonisation of all the regional products, into a full resolution global product, with a generalised legend Regional Land Cover datasets - The classification of these windows have been produced by regional GLC2000 partners, with a regionally specific legend, to provide as much detail as possible
Database records / coverage
Country / Testsite, Filename UTM Zone Extent (West bound, East bound, South bound, North bound)
Cologne, GER T_CGN_GD_GLO_GLC___2000.tif
32 N 6.272704, 7.699752, 50.600379, 51.414145
Germany C_GER_GD_GLO_GLC___2000.tif
32 N 5.871619, 15.038113, 47.269858, 55.056525
Izmir, TUR T_IZM_GD_GLO_GLC___2000.tif
35 N 26.979952, 27.488149, 38.181742, 38.578724
Turkey C_TUR_GD_GLO_GLC___2000.tif
35 N 25.665137, 44.834988, 35.815426, 42.106657
Isfana/Batken, KG/TJK/UZB T_IBA_GD_GLO_GLC___2000.tif
42 N 68,724826, 71.514132, 39.607297, 40.697646
Kyrgyzstan/Tajikistan/Uzbekistan C_KTJ_GD_GLO_GLC___2000.tif
42 N 55.997775, 80.283181, 36.671966, 45.571107
Legend
GRIDCODE CLASS 1 Tree Cover, broadleaved, evergreen 2 Tree Cover, broadleaved, deciduous, closed 3 Tree Cover, broadleaved, deciduous, open

FP7-SPACE-2012-1 / 312972
Deliverable Page 50 / 116
4 Tree Cover, needle-leaved, evergreen 5 Tree Cover, needle-leaved, deciduous 6 Tree Cover, mixed leaf type 7 Tree Cover, regularly flooded, fresh water 8 Tree Cover, regularly flooded, saline water, 9 Mosaic: Tree cover / Other natural vegetation 10 Tree Cover, burnt 11 Shrub Cover, closed-open, evergreen 12 Shrub Cover, closed-open, deciduous 13 Herbaceous Cover, closed-open 14 Sparse Herbaceous or sparse Shrub Cover 15 Regularly flooded Shrub and/or Herbaceous Cover 16 Cultivated and managed areas 17 Mosaic: Cropland / Tree Cover / Other natural vegetation 18 Mosaic: Cropland / Shrub or Grass Cover 19 Bare Areas 20 Water Bodies 21 Snow and Ice 22 Artificial surfaces and associated areas
Additional Information
Sensors SPOT4-Vegetation (VEGA 2000 database)
Ancillary data ERS radar images, DMSP-OLS Nighttime Lights
Methodology (Reference)
Bartholome, E., Belward, S. (2005) GLC2000: a new approach to global land cover mapping from Earth observation data. International Journal of Remote Sensing, 26, 2005. European Commission, Joint Research Centre (2003) Global Land Cover 2000 database. Available at: http://bioval.jrc.ec.europa.eu/products/glc2000/glc2000.php Accessed 27 Sept 2013.
Validation (Reference) Giri, C., Zhu, Z.L, Reed, B. (2005), A comparative analysis of the Global Land Cover 2000 and MODIS land cover data sets, Remote Sensing of Environment, 94, 123–132. Mayaux, P., Hugh, E., Gallego, J., Strahle, A.H., Herold, M., Agrawal, S., Naumov, S., De Miranda, E.E., Di Bella, C.M., Ordoyne, C., Kopin, Y., Roy, P.S. (2006) Validation of the Global Land Cover 2000 Map. IEEE Transactions on Geoscience and Remote Sensing, 44, 1728-1739. Potere, D., Schneider, A. (2009) Comparison of global urban maps, In: Global mapping of Human Settlement, In: Gamba, P. and M. Herold (Eds.), Global Mapping of Human Settlements: Experiences, Data Sets, and Prospects, Taylor and Francis, Boca Raton, FL.

FP7-SPACE-2012-1 / 312972
Deliverable Page 51 / 116
Potere, D., Schneider, A., Angel, S., Civco, D.L. (2009) Mapping urban areas on a global scale: which of the eight maps now available is more accurate? International Journal of Remote Sensing, 30, 6531-6558.
Quicklook (Example: Cologne)

FP7-SPACE-2012-1 / 312972
Deliverable Page 52 / 116
Appendix 2 – Metadata: Globcover
Globcover
Originator European Space Agency (contributions: JRC, EEA, FAO, GOFC-GOLD, IGBP, UNEP)
Online Resource
http://due.esrin.esa.int/globcover/
Abstract (Originator)
In 2008, the ESA-GlobCover 2005 project delivered to the international community the very first 300-m global land cover map for 2005 as well as bimonthly and annual MERIS (Medium Resolution Imaging Spectrometer Instrument) Fine Resolution (FR) surface reflectance mosaics. The ESA-GlobCover 2005 project, carried out by an international consortium, started in April 2005 and relied on very rich feedback and comments from a large partnership including end-users belonging to international institutions (JRC, FAO, EEA, UNEP, GOFC-GOLD and IGBP) in addition to ESA internal assessment. The ESA-GlobCover 2005 deliverables clearly demonstrated the possibility to develop an automated service, from the level 1B imagery to the final land cover map, including all the pre-processing steps and the classification process. In 2010, the GlobCover chain was run by ESA and the Université Catholique de Louvain (UCL) in order to produce bimonthly and annual MERIS FR mosaics for the year 2009 and to derive a new global land cover map from this time series of ME RIS FR 2009 mosaics. The objective was to deliver the set of GlobCover 2009 products during the year 2010, thus demonstrating the operational service provided by the developed GlobCover chain. The GlobCover 2009 products are the following:
Bimonthly GlobCover 2009 MERIS FR surface reflectance mosaics (6 products a year): The bimonthly MERIS FR mosaics are computed every 2 months and provide the average surface reflectance values in 4 MERIS bands, calculated from all valid observations of this 2 months period. They cover the following periods: January-February 2009, March-April 2009, May-June 2009, July-August 2009, September-October 2009 and November-December 2009;
Annual GlobCover 2009 MERIS FR surface reflectance mosaic (1 product a year): The annual MERIS FR mosaic is computed by averaging the surface reflectance values over the whole year. It covers the period between the 1st of January 2009 and the 31st of December 2009;
GlobCover 2009 land cover map (1 product a year): The land cover map is derived by an automatic and regionally-tuned classification of a time series of global MERIS FR mosaics for the year 2009. The global land cover map counts 22 land cover classes defined with the United Nations (UN) Land Cover Classification System (LCCS). (European Space Agency 2011)
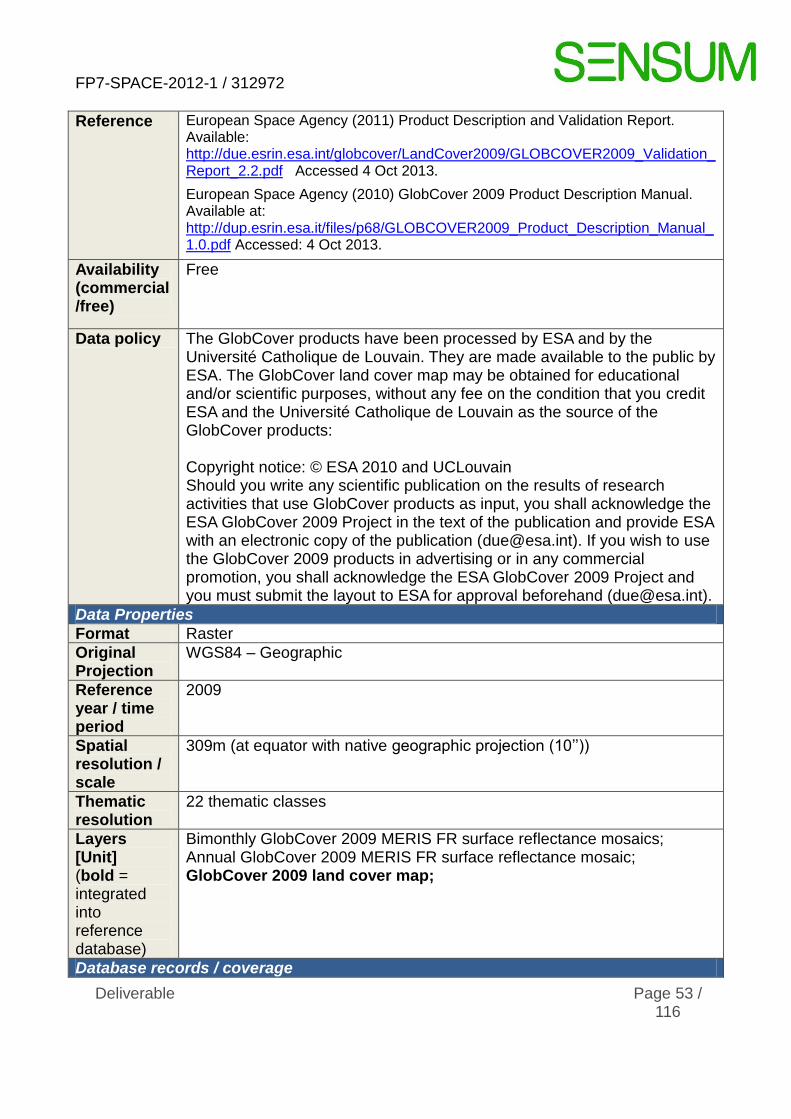
FP7-SPACE-2012-1 / 312972
Deliverable Page 53 / 116
Reference European Space Agency (2011) Product Description and Validation Report. Available: http://due.esrin.esa.int/globcover/LandCover2009/GLOBCOVER2009_Validation_Report_2.2.pdf Accessed 4 Oct 2013.
European Space Agency (2010) GlobCover 2009 Product Description Manual. Available at: http://dup.esrin.esa.it/files/p68/GLOBCOVER2009_Product_Description_Manual_1.0.pdf Accessed: 4 Oct 2013.
Availability (commercial/free)
Free
Data policy The GlobCover products have been processed by ESA and by the Université Catholique de Louvain. They are made available to the public by ESA. The GlobCover land cover map may be obtained for educational and/or scientific purposes, without any fee on the condition that you credit ESA and the Université Catholique de Louvain as the source of the GlobCover products: Copyright notice: © ESA 2010 and UCLouvain Should you write any scientific publication on the results of research activities that use GlobCover products as input, you shall acknowledge the ESA GlobCover 2009 Project in the text of the publication and provide ESA with an electronic copy of the publication ([email protected]). If you wish to use the GlobCover 2009 products in advertising or in any commercial promotion, you shall acknowledge the ESA GlobCover 2009 Project and you must submit the layout to ESA for approval beforehand ([email protected]).
Data Properties
Format Raster
Original Projection
WGS84 – Geographic
Reference year / time period
2009
Spatial resolution / scale
309m (at equator with native geographic projection (10’’))
Thematic resolution
22 thematic classes
Layers [Unit] (bold = integrated into reference database)
Bimonthly GlobCover 2009 MERIS FR surface reflectance mosaics; Annual GlobCover 2009 MERIS FR surface reflectance mosaic; GlobCover 2009 land cover map;
Database records / coverage

FP7-SPACE-2012-1 / 312972
Deliverable Page 54 / 116
Country / Testsite, Filename UTM Zone Extent (West bound, East bound, South bound, North bound)
Cologne, GER T_CGN_GD_GLO_GLOBC_2009.tif
32 N 6.272704, 7.699752, 50.600379, 51.414145
Germany C_GER_GD_GLO_GOBLC_2009.tif
32 N 5.871619, 15.038113, 47.269858, 55.056525
Izmir, TUR T_IZM_GD_GLO_GLOBC_2009.tif
35 N 26.979952, 27.488149, 38.181742, 38.578724
Turkey C_TUR_GD_GLO_GLOBC_2009.tif
35 N 25.665137, 44.834988, 35.815426, 42.106657
Isfana/Batken, KG/TJK/UZB T_IBA_GD_GLO_GLOBC_2009.tif
42 N 68,724826, 71.514132, 39.607297, 40.697646
Kyrgyzstan/Tajikistan/Uzbekistan C_KTJ_GD_GLO_GLOBC_2009.tif
42 N 55.997775, 80.283181, 36.671966, 45.571107
Legend
GRIDCODE CLASS 11 Post-flooding or irrigated croplands (or aquatic) 14 Rainfed croplands 20 Mosaic cropland (50-70%) / vegetation (grassland/shrubland/forest) (20-50%) 30 Mosaic vegetation (grassland/shrubland/forest) (50-70%) / cropland (20-50%) 40 Closed to open (>15%) broadleaved evergreen or semi-deciduous forest (>5m) 50 Closed (>40%) broadleaved deciduous forest (>5m) 60 Open (15-40%) broadleaved deciduous forest/woodland (>5m) 70 Closed (>40%) needleleaved evergreen forest (>5m) 90 Open (15-40%) needleleaved deciduous or evergreen forest (>5m) 100 Closed to open (>15%) mixed broadleaved and needleleaved forest (>5m) 110 Mosaic forest or shrubland (50-70%) / grassland (20-50%) 120 Mosaic grassland (50-70%) / forest or shrubland (20-50%) 130 Closed to open (>15%) (broadleaved or needleleaved, evergreen or deciduous)
shrubland (<5m) 140 Closed to open (>15%) herbaceous vegetation (grassland, savannas or
lichens/mosses) 150 Sparse (<15%) vegetation 160 Closed to open (>15%) broadleaved forest regularly flooded (semi-permanently or
temporarily) - Fresh or brackish water 170 Closed (>40%) broadleaved forest or shrubland permanently flooded - Saline or
brackish water 180 Closed to open (>15%) grassland or woody vegetation on regularly flooded or
waterlogged soil - Fresh, brackish or saline water 190 Artificial surfaces and associated areas (Urban areas >50%) 200 Bare areas 210 Water bodies 220 Permanent snow and ice 230 No data (burnt areas, clouds,…)
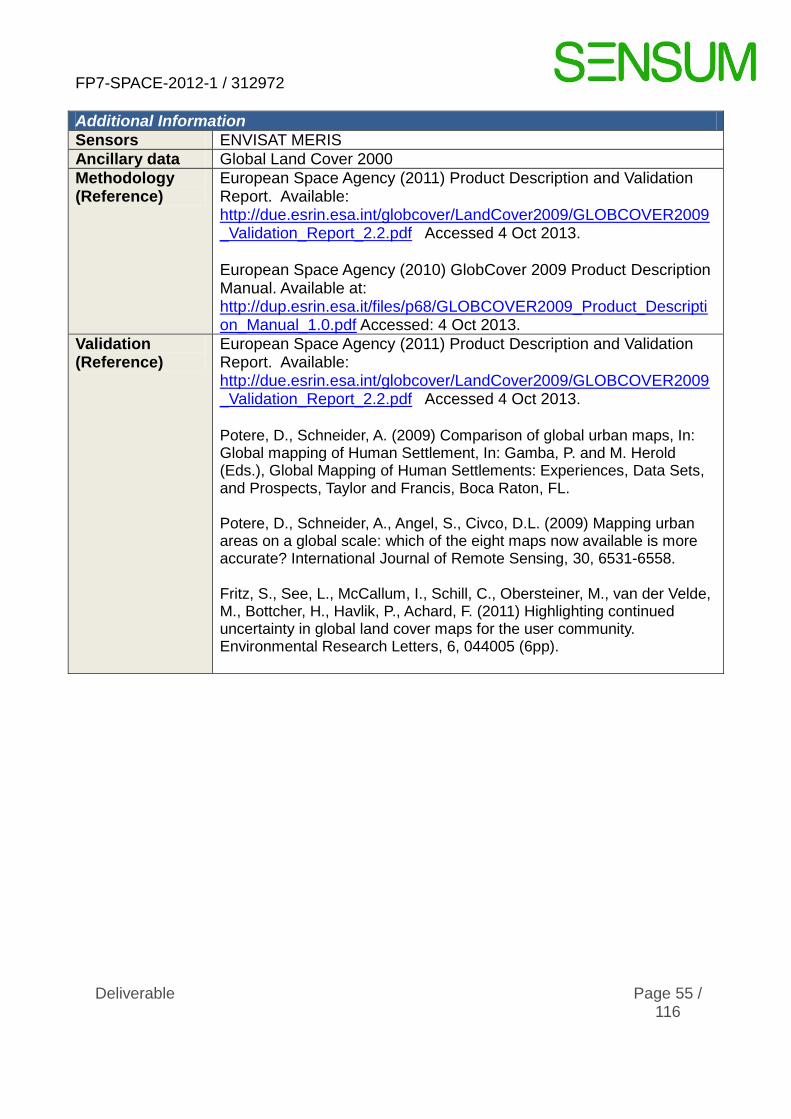
FP7-SPACE-2012-1 / 312972
Deliverable Page 55 / 116
Additional Information
Sensors ENVISAT MERIS
Ancillary data Global Land Cover 2000
Methodology (Reference)
European Space Agency (2011) Product Description and Validation Report. Available: http://due.esrin.esa.int/globcover/LandCover2009/GLOBCOVER2009_Validation_Report_2.2.pdf Accessed 4 Oct 2013. European Space Agency (2010) GlobCover 2009 Product Description Manual. Available at: http://dup.esrin.esa.it/files/p68/GLOBCOVER2009_Product_Description_Manual_1.0.pdf Accessed: 4 Oct 2013.
Validation (Reference)
European Space Agency (2011) Product Description and Validation Report. Available: http://due.esrin.esa.int/globcover/LandCover2009/GLOBCOVER2009_Validation_Report_2.2.pdf Accessed 4 Oct 2013. Potere, D., Schneider, A. (2009) Comparison of global urban maps, In: Global mapping of Human Settlement, In: Gamba, P. and M. Herold (Eds.), Global Mapping of Human Settlements: Experiences, Data Sets, and Prospects, Taylor and Francis, Boca Raton, FL. Potere, D., Schneider, A., Angel, S., Civco, D.L. (2009) Mapping urban areas on a global scale: which of the eight maps now available is more accurate? International Journal of Remote Sensing, 30, 6531-6558. Fritz, S., See, L., McCallum, I., Schill, C., Obersteiner, M., van der Velde, M., Bottcher, H., Havlik, P., Achard, F. (2011) Highlighting continued uncertainty in global land cover maps for the user community. Environmental Research Letters, 6, 044005 (6pp).

FP7-SPACE-2012-1 / 312972
Deliverable Page 56 / 116
Quicklook (Example: Cologne)

FP7-SPACE-2012-1 / 312972
Deliverable Page 57 / 116
Appendix 3 – Metadata: Global Rural Urban Mapping Project
Global Rural-Urban Mapping Project
Originator Center for International Earth Science Information Network (CIESIN), Columbia University; International Food Policy Research Institute (IFPRI); The World Bank; Centro Internacional de Agricultura Tropical (CIAT)
Online Resource http://sedac.ciesin.columbia.edu/data/collection/grump-v1
Abstract (Originator)
GRUMPv1 consists of eight global data sets: population count grids, population density grids, urban settlement points, urban-extents grids, land/geographic unit area grids, national boundaries, national identifier grids, and coastlines. All grids are provided at a resolution of 30 arc-seconds (~1km), with population estimates normalized to the years 2000, 1995, and 1990. All eight data sets are available for download as global products, and the first five data sets are also available as continental, regional, and national subsets. The population density and population count grids build on SEDAC’s Gridded Population of the World, Version 3 data set (GPWv3), which does not distinguish between urban and rural areas. GRUMPv1 identifies urban areas based in part on observations of lights at night collected by a series of Department of Defence meteorological satellites over several decades. The night-light data were carefully processed by the U.S. National Geophysical Data Center (NGDC) in Boulder, Colorado. SEDAC then used these and other supplementary data to develop an urban-rural “mask,” or urban extents grid, which identifies those areas of the Earth’s land surface that appear to be urbanized. GRUMPv1 also includes a geo-referenced database of urban settlements with populations greater than 5,000 persons that may be downloaded in both tabular and shapefile formats. (SEDAC, 2013)
Reference Socioeconomic Data and Applications Center (SEDAC) (2013): Global Rural-Urban Mapping Project (GRUMP), v1. Available at: http://sedac.ciesin.columbia.edu/data/collection/grump-v1 Accessed 4 Oct 2013.
Availability (commercial/free)
Free
Data policy Copyrights and Permissions CIESIN has a diversity of resources it makes available to its users. These resources include CIESIN-created data, services, and tools that reside only at CIESIN, and the resources of third parties who share a common interest with CIESIN who have graciously granted CIESIN the right to make their resources available to CIESIN users as well. In addition, CIESIN provides links to sites worldwide that house data,

FP7-SPACE-2012-1 / 312972
Deliverable Page 58 / 116
information and products that may be of interest to CIESIN users. Because the rights accompanying any particular resource depend on the particular copyright holder involved, you should carefully review the permission statement included under each resource when you are interested in using the resource in any way (other than for viewing) via CIESIN's host. CIESIN-Created Materials Users are free to copy CIESIN-authored materials for personal and non-commercial use as long as content is not altered, and copyright ownership by CIESIN is acknowledged. All other rights are reserved. Data, information, and tools residing at CIESIN may be copied. All other rights are reserved. Third Party Materials Accessible Through CIESIN's Network CIESIN and its data providers permit users to download and/or copy search results, but not the database itself (or portions of it) that is being searched. With other third party materials accessible through this site, each copyright holder has granted CIESIN permission to post the work on CIESIN's computer network. Any other use by users accessing CIESIN's computer network is subject to applicable copyright laws. Check under the materials you want to access to determine what the rights are.
Data Properties
Format Raster
Original Projection WGS84 – UTM Coordinates
Reference year / time period
1990, 1995, 2000
Spatial resolution / scale
927 (at equator with native geographic projection (30’’))
Thematic resolution Binary
Layers [Unit] (bold = integrated into reference database)
Urban Extents Grid (1995) Settlement Points (1990, 1995, 2000) Population Density Grid (1990, 1995, 2000) Population Count Grid (1990, 1995, 2000) Nationla Identifier Grid (1990, 1995, 2000) National Administrative Boundaries (1990) Land and Geographic Unit Area Grids (1990) Coastlines (2000)
Database records / coverage
Country / Testsite, Filename UTM Zone Extent (West bound, East bound, South bound, North bound)
Cologne, GER T_CGN_GD_GLO_GRUMP_1995.tif
32 N 6.272704, 7.699752, 50.600379, 51.414145
Germany C_GER_GD_GLO_GRUMP_1995.tif
32 N 5.871619, 15.038113, 47.269858, 55.056525
Izmir, TUR 35 N
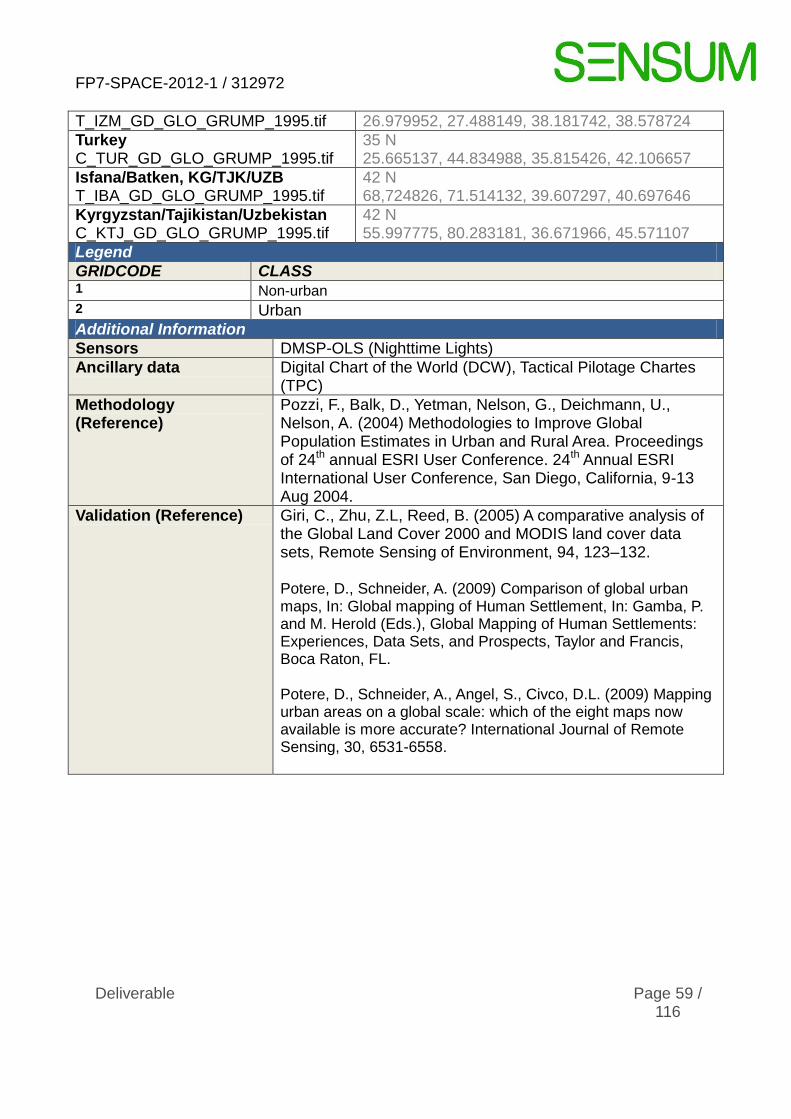
FP7-SPACE-2012-1 / 312972
Deliverable Page 59 / 116
T_IZM_GD_GLO_GRUMP_1995.tif 26.979952, 27.488149, 38.181742, 38.578724
Turkey C_TUR_GD_GLO_GRUMP_1995.tif
35 N 25.665137, 44.834988, 35.815426, 42.106657
Isfana/Batken, KG/TJK/UZB T_IBA_GD_GLO_GRUMP_1995.tif
42 N 68,724826, 71.514132, 39.607297, 40.697646
Kyrgyzstan/Tajikistan/Uzbekistan C_KTJ_GD_GLO_GRUMP_1995.tif
42 N 55.997775, 80.283181, 36.671966, 45.571107
Legend
GRIDCODE CLASS 1 Non-urban
2 Urban
Additional Information
Sensors DMSP-OLS (Nighttime Lights)
Ancillary data Digital Chart of the World (DCW), Tactical Pilotage Chartes (TPC)
Methodology (Reference)
Pozzi, F., Balk, D., Yetman, Nelson, G., Deichmann, U., Nelson, A. (2004) Methodologies to Improve Global Population Estimates in Urban and Rural Area. Proceedings of 24th annual ESRI User Conference. 24th Annual ESRI International User Conference, San Diego, California, 9-13 Aug 2004.
Validation (Reference) Giri, C., Zhu, Z.L, Reed, B. (2005) A comparative analysis of the Global Land Cover 2000 and MODIS land cover data sets, Remote Sensing of Environment, 94, 123–132. Potere, D., Schneider, A. (2009) Comparison of global urban maps, In: Global mapping of Human Settlement, In: Gamba, P. and M. Herold (Eds.), Global Mapping of Human Settlements: Experiences, Data Sets, and Prospects, Taylor and Francis, Boca Raton, FL. Potere, D., Schneider, A., Angel, S., Civco, D.L. (2009) Mapping urban areas on a global scale: which of the eight maps now available is more accurate? International Journal of Remote Sensing, 30, 6531-6558.

FP7-SPACE-2012-1 / 312972
Deliverable Page 60 / 116
Quicklook (Example: Cologne)

FP7-SPACE-2012-1 / 312972
Deliverable Page 61 / 116
Appendix 4 – Metadata: History Database of the Global Environment
History Database of the Global Environment (HYDE)
Originator PBL Netherlands Environmental Assessment Agency
Online Resource
http://themasites.pbl.nl/tridion/en/themasites/hyde/landusedata/landcover/index-2.html
Abstract (Originator)
HYDE presents (gridded) time series of population and land use for the last 12,000 years. It also presents various other indicators such as GDP, value added, livestock, agricultural areas and yields, private consumption, greenhouse gas emissions and industrial production data, but only for the last century. Historical population, cropland and pasture statistics are combined with satellite information and specific allocation algorithms (which change over time) to create spatially explicit maps, which are fully consistent on a 5′ longitude/ latitude grid resolution, and cover the period 10,000 bc to ad 2005 (Klein Goldewijk et al., 2011).
Reference Klein Goldewijk, K. , Beusen, A., de Vos, M., van Drecht, G. (2011) The HYDE 3.1 spatially explicit database of human induced land use change over the past 12,000 years. Global Ecology and Biogeography, 20, 73-86.
Availability (commercial/free)
Free
Data policy Copyright
Unless stated otherwise, the Creative Commons (BY) licence generally
applies to the contents of our website. This licence entails the free use (copying, distribution and/or presentation) of any of the PBL publications and derived work, on the precondition of stating the original author – in this case: PBL Netherlands Environmental Assessment Agency. Whenever derived work is used, the user may not give the impression that the PBL Netherlands Environmental Assessment Agency automatically subscribes to the content of such work. Not included in the Creative Commons licence are the photographs on our website, as PBL does not hold those copyrights.
Data Properties
Format Raster
Original Projection
WGS84 - Geographic
Reference year / time period
2005 (10.000 B.C. – 2005 A.D.)
Spatial resolution / scale
9000m (at equator with native geographic projection (5’))
Thematic resolution
Continuous (urban area (km²) per gridcell)

FP7-SPACE-2012-1 / 312972
Deliverable Page 62 / 116
Layers [Unit] (bold = integrated into reference database)
Population POPC: population counts, in inhabitants/gridcell POPD: population density, inhabitants/km2 per gridcell RURC: rural population counts, in inh/gridcell URBC: urban population counts, in inh/gridcell UOPP: urban area, in km2/gridcell Land use CROP: cropland area, in km2/gridcell GRAS: pasture area, in km2/gridcell
Database records / coverage
Country / Testsite, Filename UTM Zone Extent (West bound, East bound, South bound, North bound)
Cologne, GER T_CGN_GD_GLO_HYDE_2005.tif
32 N 6.272704, 7.699752, 50.600379, 51.414145
Germany C_GER_GD_GLO_HYDE_2005.tif
32 N 5.871619, 15.038113, 47.269858, 55.056525
Izmir, TUR T_IZM_GD_GLO_GLC_HYDE_2005.tif
35 N 26.979952, 27.488149, 38.181742, 38.578724
Turkey C_TUR_GD_GLO_HYDE_2005.tif
35 N 25.665137, 44.834988, 35.815426, 42.106657
Isfana/Batken, KG/TJK/UZB T_IBA_GD_GLO_HYDE_2005.tif
42 N 68,724826, 71.514132, 39.607297, 40.697646
Kyrgyzstan/Tajikistan/Uzbekistan C_KTJ_GD_GLO__HYDE_2005.tif
42 N 55.997775, 80.283181, 36.671966, 45.571107
Legend
GRIDCODE CLASS - Continuous data: urban area (km2/gridcell) -
Additional Information
Sensors SPOT4-Vegetation (VEGA 2000 database)
Ancillary data GLC2000, National and subnational land use statistics, national and subnational population data
Methodology (Reference)
Klein Goldewijk, K. (2001) Estimating global land use change over the past 300 years: The HYDE database. Global Biochemical Cycles, 15, 417-433. Klein Goldewijk, K. (2005) Three centuries of global population growth: A spatial referenced population (density) database for 1700-2000. Population and Environment, 26, 343-367. Klein Goldewijk, K. , Beusen, A., de Vos, M., van Drecht, G. (2011) The HYDE 3.1 spatially explicit database of human induced land use change over the past 12,000 years. Global Ecology and Biogeography, 20, 73-86.

FP7-SPACE-2012-1 / 312972
Deliverable Page 63 / 116
Validation (Reference)
Potere, D., Schneider, A. (2009) Comparison of global urban maps, In: Global mapping of Human Settlement, In: Gamba, P. and M. Herold (Eds.), Global Mapping of Human Settlements: Experiences, Data Sets, and Prospects, Taylor and Francis, Boca Raton, FL. Potere, D., Schneider, A., Angel, S., Civco, D.L. (2009) Mapping urban areas on a global scale: which of the eight maps now available is more accurate? International Journal of Remote Sensing, 30, 6531-6558.
Quicklook (Example: Cologne)

FP7-SPACE-2012-1 / 312972
Deliverable Page 64 / 116
Appendix 5 – Metadata: Global Impervious Surface Area
Global Impervious Surface Area
Originator National Oceanic and Atmospheric Administration (NOAA)
Online Resource http://ngdc.noaa.gov/eog/dmsp/download_global_isa.html
Abstract (Originator)
The Global Impervious Surface Area (IMPSA) presents the first global inventory of the spatial distribution and density of constructed impervious surface area (ISA). Examples of ISA include roads, parking lots, buildings, driveways, sidewalks and other manmade surfaces. While high spatial resolution is required to observe these features, the product is at one km2 resolution and is based on two coarse resolution indicators of ISA. Inputs into the product include the brightness of satellite observed night-time lights and population count. The reference data used in the calibration were derived from 30 meter resolution ISA estimates of the USA from the U.S. Geological Survey. Nominally the product is for the years 2000-01 since both the night-time lights and reference data are from those two years. It was found that 1.05% of the United States land area is impervious surface (83,337 km2 ) and 0.43% of the world's land surface (579,703 km2 ) is constructed impervious surface. China has more ISA than any other country (87,182 km2 ), but has only 67 m2 of ISA per person, compared to 297 m2 per person in the USA. Hydrologic and environmental impacts of ISA begin to be exhibited when the density of ISA reaches 10% of the land surface. An examination of the areas with 10% or more ISA in watersheds finds that with the exception of Europe, the majority of watershed areas have less than 0.4% of their area at or above the 10% ISA threshold (Elvidge et al., 2007).
Reference Elvidge, C., Tuttle, B.T., Sutton, P.C., Baugh, K.E., Howard, A.T., Milesi, C., Budhendra, B.L., Ramakrishna, N. (2007) Global distribution and density of constructed impervious surfaces. Sensors, 7,1962−1979.
Availability (commercial/free)
Free
Data policy Copyright Notice
As required by 17 U.S.C. 403, third parties producing copyrighted works consisting predominantly of the material produced by U.S. government agencies must provide notice with such work(s) identifying the U.S. Gov-ernment material incorporated and stating that such material is not subject to copyright protection within the United States. The information on gov-ernment web pages is in the public domain and not subject to copyright protection within the United States unless specifically annotated otherwise (copyright may be held elsewhere). Foreign copyrights may apply.

FP7-SPACE-2012-1 / 312972
Deliverable Page 65 / 116
Data Properties
Format Raster
Original Projection WGS84 – Geographic
Reference year / time period
2000/2001
Spatial resolution / scale
927m (at equator with native geographic projection (30’’))
Thematic resolution
Continuous (impervious surface (%))
Layers [Unit] (bold = integrated into reference database)
Global Impervious Surface Area (IMPSA)
Database records / coverage
Country / Testsite, Filename UTM Zone Extent (West bound, East bound, South bound, North bound)
Cologne, GER T_CGN_GD_GLO_IMPSA_2000.tif
32 N 6.272704, 7.699752, 50.600379, 51.414145
Germany C_GER_GD_GLO_ IMPSA_2000.tif
32 N 5.871619, 15.038113, 47.269858, 55.056525
Izmir, TUR T_IZM_GD_GLO_ IMPSA_2000.tif
35 N 26.979952, 27.488149, 38.181742, 38.578724
Turkey C_TUR_GD_GLO_ IMPSA_2000.tif
35 N 25.665137, 44.834988, 35.815426, 42.106657
Isfana/Batken, KG/TJK/UZB T_IBA_GD_GLO_ IMPSA_2000.tif
42 N 68,724826, 71.514132, 39.607297, 40.697646
Kyrgyzstan/Tajikistan/Uzbekistan C_KTJ_GD_GLO_ IMPSA_2000.tif
42 N 55.997775, 80.283181, 36.671966, 45.571107
Legend
GRIDCODE CLASS
- Continuous data: impervious surface (%) -
Additional Information
Sensors DMSP-OLS Nighttime Lights, LandScan
Ancillary data US Impervious Surface Model (30m)
Methodology (Reference)
Elvidge, C., Tuttle, B.T., Sutton, P.C., Baugh, K.E., Howard, A.T., Milesi, C., Budhendra, B.L., Ramakrishna, N. (2007).Global distribution and density of constructed impervious surfaces. Sensors, 7,1962−1979.
Validation (Reference)
Elvidge, C., Tuttle, B.T., Sutton, P.C., Baugh, K.E., Howard, A.T., Milesi, C., Budhendra, B.L., Ramakrishna, N. (2007).Global

FP7-SPACE-2012-1 / 312972
Deliverable Page 66 / 116
distribution and density of constructed impervious surfaces. Sensors, 7,1962−1979. Potere, D., Schneider, A. (2009) Comparison of global urban maps, In: Global mapping of Human Settlement, In: Gamba, P. and M. Herold (Eds.), Global Mapping of Human Settlements: Experiences, Data Sets, and Prospects, Taylor and Francis, Boca Raton, FL. Potere, D., Schneider, A., Angel, S., Civco, D.L. (2009) Mapping urban areas on a global scale: which of the eight maps now available is more accurate? International Journal of Remote Sensing, 30, 6531-6558.

FP7-SPACE-2012-1 / 312972
Deliverable Page 67 / 116
Quicklook (Example: Cologne)
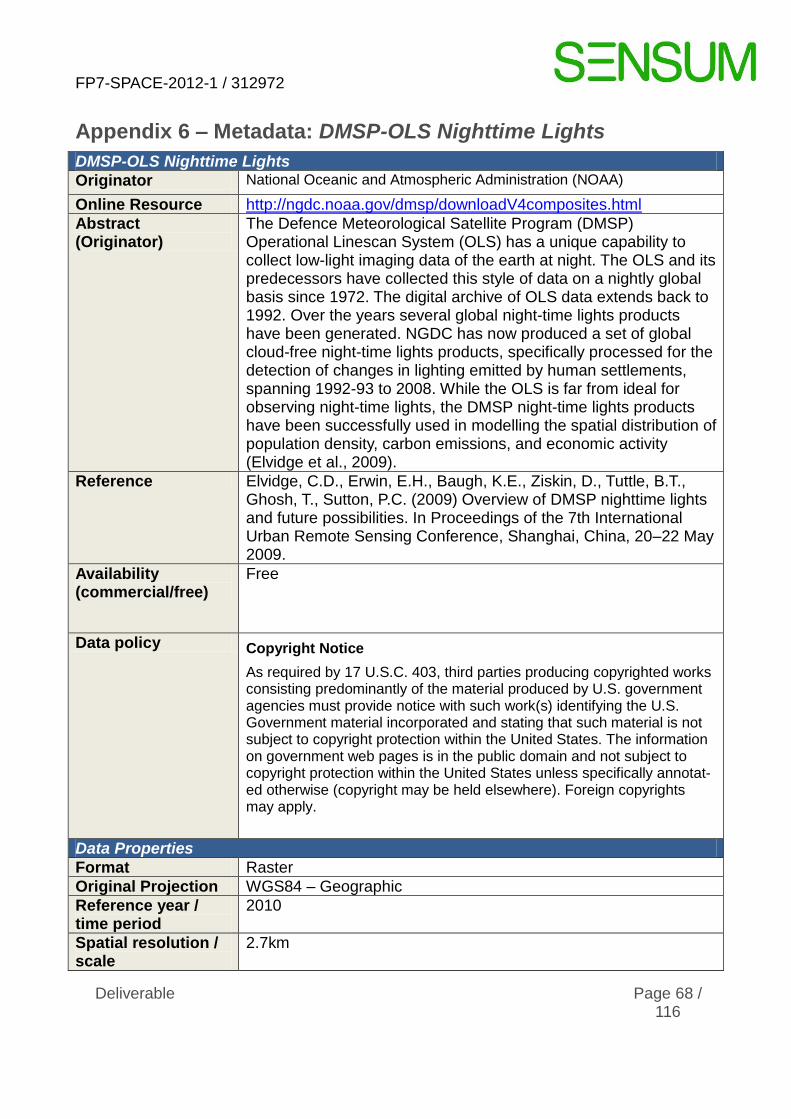
FP7-SPACE-2012-1 / 312972
Deliverable Page 68 / 116
Appendix 6 – Metadata: DMSP-OLS Nighttime Lights
DMSP-OLS Nighttime Lights
Originator National Oceanic and Atmospheric Administration (NOAA)
Online Resource http://ngdc.noaa.gov/dmsp/downloadV4composites.html
Abstract (Originator)
The Defence Meteorological Satellite Program (DMSP) Operational Linescan System (OLS) has a unique capability to collect low-light imaging data of the earth at night. The OLS and its predecessors have collected this style of data on a nightly global basis since 1972. The digital archive of OLS data extends back to 1992. Over the years several global night-time lights products have been generated. NGDC has now produced a set of global cloud-free night-time lights products, specifically processed for the detection of changes in lighting emitted by human settlements, spanning 1992-93 to 2008. While the OLS is far from ideal for observing night-time lights, the DMSP night-time lights products have been successfully used in modelling the spatial distribution of population density, carbon emissions, and economic activity (Elvidge et al., 2009).
Reference Elvidge, C.D., Erwin, E.H., Baugh, K.E., Ziskin, D., Tuttle, B.T., Ghosh, T., Sutton, P.C. (2009) Overview of DMSP nighttime lights and future possibilities. In Proceedings of the 7th International Urban Remote Sensing Conference, Shanghai, China, 20–22 May 2009.
Availability (commercial/free)
Free
Data policy Copyright Notice
As required by 17 U.S.C. 403, third parties producing copyrighted works consisting predominantly of the material produced by U.S. government agencies must provide notice with such work(s) identifying the U.S. Government material incorporated and stating that such material is not subject to copyright protection within the United States. The information on government web pages is in the public domain and not subject to copyright protection within the United States unless specifically annotat-ed otherwise (copyright may be held elsewhere). Foreign copyrights may apply.
Data Properties
Format Raster
Original Projection WGS84 – Geographic
Reference year / time period
2010
Spatial resolution / scale
2.7km

FP7-SPACE-2012-1 / 312972
Deliverable Page 69 / 116
Thematic resolution Continuous (Average light DN x percent frequency of light detection)
Layers [Unit] (bold = integrated into reference database)
Average Visible, Stable Lights & Cloud Free Coverages Average Lights x Pct
Database records / coverage
Country / Testsite, Filename UTM Zone Extent (West bound, East bound, South bound, North bound)
Cologne, GER T_CGN_GD_GLO_LITES_2010.tif
32 N 6.272704, 7.699752, 50.600379, 51.414145
Germany C_GER_GD_GLO_LITES_2010.tif
32 N 5.871619, 15.038113, 47.269858, 55.056525
Izmir, TUR T_IZM_GD_GLO_LITES_2010.tif
35 N 26.979952, 27.488149, 38.181742, 38.578724
Turkey C_TUR_GD_GLO_LITES_2010.tif
35 N 25.665137, 44.834988, 35.815426, 42.106657
Isfana/Batken, KG/TJK/UZB T_IBA_GD_GLO_LITES_2010.tif
42 N 68,724826, 71.514132, 39.607297, 40.697646
Kyrgyzstan/Tajikistan/Uzbekistan C_KTJ_GD_GLO_LITES_2010.tif
42 N 55.997775, 80.283181, 36.671966, 45.571107
Legend
GRIDCODE CLASS
- Continuous data: urban area (Average light DN x percent frequency of light detection) -
Additional Information
Sensors DMSP-OLS F18
Ancillary data
Methodology (Reference)
Elvidge, C.D., Erwin, E.H., Baugh, K.E., Ziskin, D., Tuttle, B.T., Ghosh, T., Sutton, P.C. (2009) Overview of DMSP nighttime lights and future possibilities. In Proceedings of the 7th International Urban Remote Sensing Conference, Shanghai, China, 20–22 May 2009.
Validation (Reference) Elvidge, C.D., Erwin, E.H., Baugh, K.E., Ziskin, D., Tuttle, B.T., Ghosh, T., Sutton, P.C. (2009) Overview of DMSP nighttime lights and future possibilities. In Proceedings of the 7th International Urban Remote Sensing Conference, Shanghai, China, 20–22 May 2009. Potere, D., Schneider, A. (2009) Comparison of global urban maps, In: Global mapping of Human Settlement, In: Gamba, P. and M. Herold (Eds.), Global Mapping of Human Settlements: Experiences, Data Sets, and Prospects, Taylor and Francis, Boca Raton, FL. Potere, D., Schneider, A., Angel, S., Civco, D.L. (2009) Mapping

FP7-SPACE-2012-1 / 312972
Deliverable Page 70 / 116
urban areas on a global scale: which of the eight maps now available is more accurate? International Journal of Remote Sensing, 30, 6531-6558.
Quicklook (Example: Cologne)

FP7-SPACE-2012-1 / 312972
Deliverable Page 71 / 116
Appendix 7 – Metadata: MODIS Land Cover
MODIS Land Cover
Originator United States Geological Survey (USGS)
Online Resource https://lpdaac.usgs.gov/products/modis_products_table/mcd12q1
Abstract (Originator)
The MODIS Land Cover Type product contains five classification schemes, which describe land cover properties derived from observations spanning a year’s input of Terra- and Aqua-MODIS data. The primary land cover scheme identifies 17 land cover classes defined by the International Geosphere Biosphere Programme (IGBP), which includes 11 natural vegetation classes, 3 developed and mosaicked land classes, and three non-vegetated land classes. The MODIS Terra + Aqua Land Cover Type Yearly L3 Global 500 m SIN Grid product incorporates five different land cover classification schemes, derived through a supervised decision-tree classification method: Land Cover Type 1: IGBP global vegetation classification scheme Land Cover Type 2: University of Maryland (UMD) scheme Land Cover Type 3: MODIS-derived LAI/fPAR scheme Land Cover Type 4: MODIS-derived Net Primary Production (NPP) scheme Land Cover Type 5: Plant Functional Type (PFT) scheme
Reference United States Geological Survey (USGS) (2013) Land Cover Type Yearly L3 Global 500 m SIN Grid – MCD12Q1. Available at: https://lpdaac.usgs.gov/products/modis_products_table/mcd12q1 [Ac-cessed 15 Dec 2013].
Availability (commercial/free)
Free
Data policy MODIS Data Redistribution Policy MODIS data and products acquired through the LP DAAC have no restrictions on subsequent use, sale, or redistribution. MODIS Data Pricing Policy MODIS data and products are available at no charge from the LP DAAC.
Data Properties Data Properties
Format Raster
Original Projection Clarke66 – Geographic sinusoidal
Reference year / time period
2012
Spatial resolution / ~500m

FP7-SPACE-2012-1 / 312972
Deliverable Page 72 / 116
scale
Thematic resolution IGBP: 17 thematic classes
Layers [Unit] (bold = integrated into reference database)
Land Cover Type 1: IGBP global vegetation classification scheme Land Cover Type 2: University of Maryland (UMD) scheme Land Cover Type 3: MODIS-derived LAI/fPAR scheme Land Cover Type 4: MODIS-derived Net Primary Production (NPP) scheme Land Cover Type 5: Plant Functional Type (PFT) scheme
Database records / coverage
Country / Testsite, Filename UTM Zone Extent (West bound, East bound, South bound, North bound)
Cologne, GER T_CGN_GD_GLO_MODUL_2002.tif
32 N 6.272704, 7.699752, 50.600379, 51.414145
Germany C_GER_GD_GLO_MODUL_2002.tif
32 N 5.871619, 15.038113, 47.269858, 55.056525
Izmir, TUR T_IZM_GD_GLO_MODUL_2002.tif
35 N 26.979952, 27.488149, 38.181742, 38.578724
Turkey C_TUR_GD_GLO_MODUL_2002.tif
35 N 25.665137, 44.834988, 35.815426, 42.106657
Isfana/Batken, KG/TJK/UZB T_IBA_GD_GLO_MODUL_2002.tif
42 N 68,724826, 71.514132, 39.607297, 40.697646
Kyrgyzstan/Tajikistan/Uzbekistan C_KTJ_GD_GLO_MODUL_2002.tif
42 N 55.997775, 80.283181, 36.671966, 45.571107
Legend
GRIDCODE CLASS 0 Water
1 Evergreen Needleleaf forest
2 Evergreen Broadleaf forest 3 Deciduous Needleleaf forest
4 Deciduous Broadleaf forest
5 Mixed forest
6 Closed shrublands
7 Open shrublands
8 Woody savannas
9 Savannas
10 Grasslands
11 Permanent wetlands
12 Croplands
13 Urban and built-up 14 Cropland/Natural vegetation mosaic
15 Snow and ice
16 Barren or sparsely vegetated
254 Unclassified
FP7-SPACE-2012-1 / 312972
Deliverable Page 73 / 116
255 Fill Value
Additional Information
Sensors MODIS
Ancillary data Landsat training data, Geocover 2000
Methodology (Reference) Friedl, M. A., Sulla-Menashe, D., Tan, B., Schneider, A., Ramankutty, N., Sibley, A., and Huang, X. (2010). MODIS Collection 5 global land cover: Algorithm refinements and characterization of new datasets. Remote Sensing of Environment, 114, 168–182.
Validation (Reference) Friedl, M. A., Sulla-Menashe, D., Tan, B., Schneider, A., Ramankutty, N., Sibley, A., and Huang, X. (2010). MODIS Collection 5 global land cover: Algorithm refinements and characterization of new datasets. Remote Sensing of Environment, 114, 168–182. Potere, D., Schneider, A. (2009) Comparison of global urban maps, In: Global mapping of Human Settlement, In: Gamba, P. and M. Herold (Eds.), Global Mapping of Human Settlements: Experiences, Data Sets, and Prospects, Taylor and Francis, Boca Raton, FL. Potere, D., Schneider, A., Angel, S., Civco, D.L. (2009) Mapping urban areas on a global scale: which of the eight maps now available is more accurate? International Journal of Remote Sensing, 30, 6531-6558.
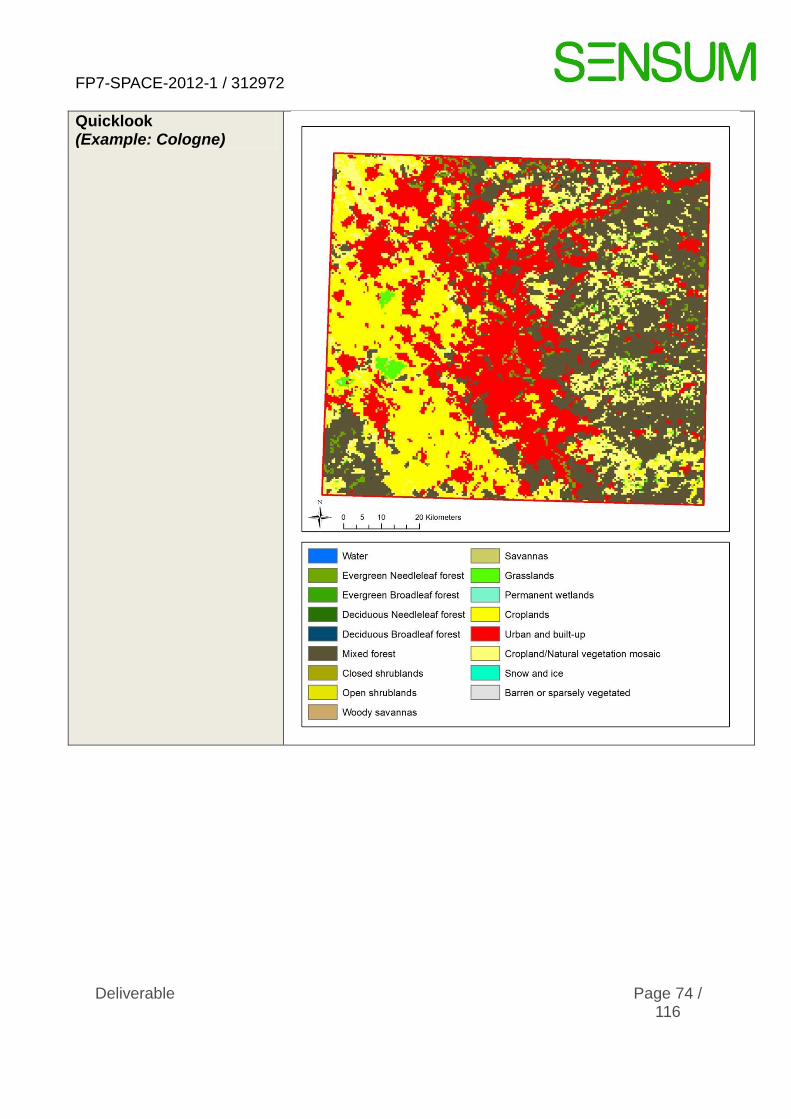
FP7-SPACE-2012-1 / 312972
Deliverable Page 74 / 116
Quicklook (Example: Cologne)

FP7-SPACE-2012-1 / 312972
Deliverable Page 75 / 116
Appendix 8 – Metadata: MODIS Urban Land Cover
MODIS Urban Land Cover
Originator Center for Sustainability and the Global Environment (SAGE), Uni-versity of Wisconsin-Madison
Online Resource http://sage.wisc.edu/people/schneider/research/data_readme.html
Abstract (Originator)
The MODIS 500-m global map of urban extent was produced by Annemarie Schneider at the University of Wisconsin-Madison, in partnership with Mark Friedl at Boston University and the MODIS Land Group. The goal of this project was generate a current, consistent, and seamless circa 2001-2002 map of urban, built-up and settled areas for the Earth’s land surface. This work builds on previous mapping efforts using Moderate Resolution Imaging Spectroradiometer (MODIS) data at 1-km spatial resolution (Schneider et al., 2003; 2005), which was included as part of the MODIS Collection 4 (C4) Global Land Cover Product (Friedl et al., 2002). The map described serves as the first stage in the development of a comprehensive database of urban land surface characteristics for 2001-2010. The intended audience for the MODIS 500-m map of urban extent is primarily the academic research community working at regional to global scales on questions (Schneider et al., 2009 & 2010).
Reference Schneider, A., Friedl, M.A., Potere, D. (2009) A new map of global urban extent from MODIS data. Environmental Research Letters, 4, article 044003.
Schneider, A., Friedl, M.A., Potere, D. (2010) Monitoring urban areas glob-ally using MODIS 500m data: New methods and datasets based on urban ecoregions. Remote Sensing of Environment, vol. 114, p. 1733-1746.
Availability (commercial/free)
Free
Data policy We are happy to offer the data free of charge, but we ask that you cite the following publications when you utilize the data: Schneider, A., M. A. Friedl and D. Potere (2009) A new map of global urban extent from MODIS data. Environmental Research Letters, volume 4, article 044003. Schneider, A., M. A. Friedl and D. Potere (2010) Monitoring urban areas globally using MODIS 500m data: New methods and datasets based on urban ecoregions. Remote Sensing of Environment, vol. 114, p. 1733-1746. All comments, questions and concerns should be directed to:

FP7-SPACE-2012-1 / 312972
Deliverable Page 76 / 116
Annemarie Schneider Assistant Professor, Center for Sustainability and the Global Environment, Nelson Institute for Environmental Studies and Department of Geography University of Wisconsin-Madison 1710 University Avenue, Room 264, Madison, Wisconsin 53726 USA [email protected]
Data Properties
Format Raster
Original Projection
Clarke66 – Geographic sinusoidal
Reference year / time period
2001/2002
Spatial resolution / scale
~500m
Thematic resolution
Class “Urban and built-up” from MODIS land cover IGBP classification
Layers [Unit] (bold = integrated into reference database)
MODIS 500-m map of global urban extent
Database records / coverage
Country / Testsite, Filename UTM Zone Extent (West bound, East bound, South bound, North bound)
Cologne, GER T_CGN_GD_GLO_MODUL_2002.tif
32 N 6.272704, 7.699752, 50.600379, 51.414145
Germany C_GER_GD_GLO_MODUL_2002.tif
32 N 5.871619, 15.038113, 47.269858, 55.056525
Izmir, TUR T_IZM_GD_GLO_MODUL_2002.tif
35 N 26.979952, 27.488149, 38.181742, 38.578724
Turkey C_TUR_GD_GLO_MODUL_2002.tif
35 N 25.665137, 44.834988, 35.815426, 42.106657
Isfana/Batken, KG/TJK/UZB T_IBA_GD_GLO_MODUL_2002.tif
42 N 68,724826, 71.514132, 39.607297, 40.697646
Kyrgyzstan/Tajikistan/Uzbekistan C_KTJ_GD_GLO_MODUL_2002.tif
42 N 55.997775, 80.283181, 36.671966, 45.571107
Legend
GRIDCODE CLASS 13 Urban and built-up
Additional Information
Sensors MODS
Ancillary data -
Methodology Schneider, A., Friedl, M.A., Potere, D. (2009) A new map of global ur-

FP7-SPACE-2012-1 / 312972
Deliverable Page 77 / 116
(Reference) ban extent from MODIS data. Environmental Research Letters, 4, article 044003.
Schneider, A., Friedl, M.A., Potere, D. (2010) Monitoring urban areas globally using MODIS 500m data: New methods and datasets based on urban ecoregions. Remote Sensing of Environment, vol. 114, p. 1733-1746
Validation (Reference)
Schneider, A., Friedl, M.A., Potere, D. (2009) A new map of global ur-ban extent from MODIS data. Environmental Research Letters, 4, article 044003.
Schneider, A., Friedl, M.A., Potere, D. (2010) Monitoring urban areas globally using MODIS 500m data: New methods and datasets based on urban ecoregions. Remote Sensing of Environment, vol. 114, p. 1733-1746 Potere, D., Schneider, A., Angel, S., Civco, D.L. (2009) Mapping urban areas on a global scale: which of the eight maps now available is more accurate? International Journal of Remote Sensing, 30, 6531-6558.

FP7-SPACE-2012-1 / 312972
Deliverable Page 78 / 116
Quicklook (Example: Cologne)
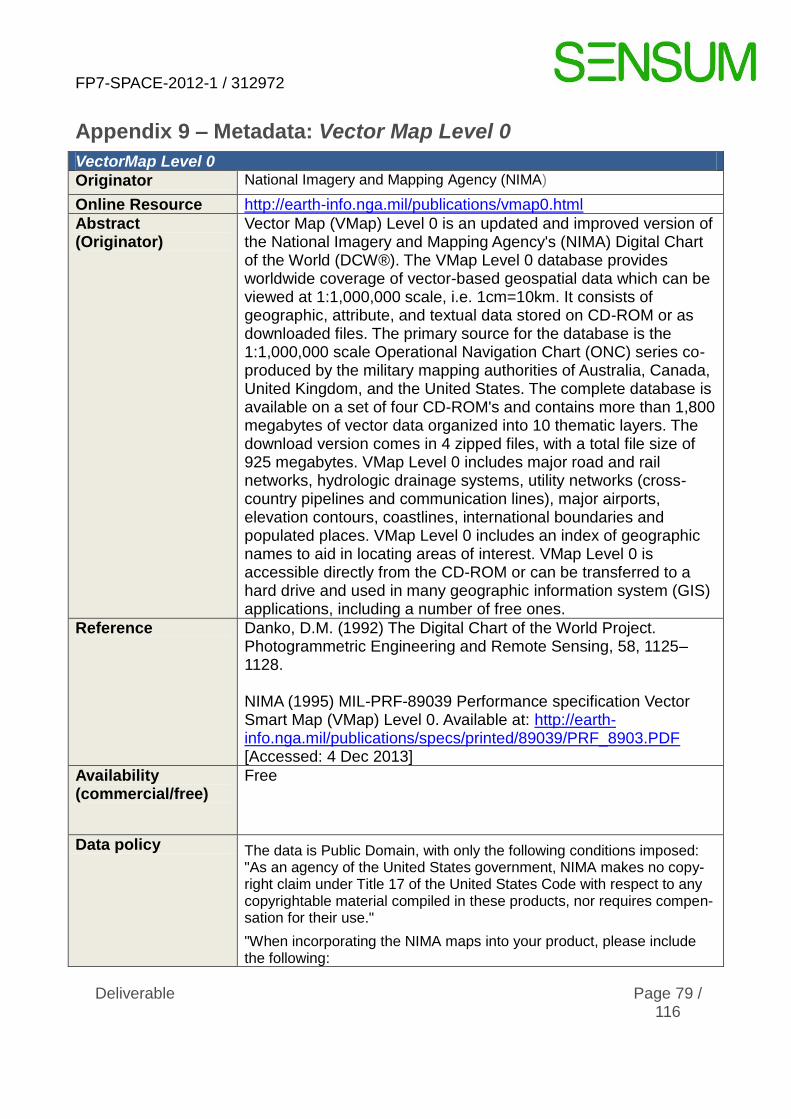
FP7-SPACE-2012-1 / 312972
Deliverable Page 79 / 116
Appendix 9 – Metadata: Vector Map Level 0
VectorMap Level 0
Originator National Imagery and Mapping Agency (NIMA)
Online Resource http://earth-info.nga.mil/publications/vmap0.html
Abstract (Originator)
Vector Map (VMap) Level 0 is an updated and improved version of the National Imagery and Mapping Agency's (NIMA) Digital Chart of the World (DCW®). The VMap Level 0 database provides worldwide coverage of vector-based geospatial data which can be viewed at 1:1,000,000 scale, i.e. 1cm=10km. It consists of geographic, attribute, and textual data stored on CD-ROM or as downloaded files. The primary source for the database is the 1:1,000,000 scale Operational Navigation Chart (ONC) series co-produced by the military mapping authorities of Australia, Canada, United Kingdom, and the United States. The complete database is available on a set of four CD-ROM's and contains more than 1,800 megabytes of vector data organized into 10 thematic layers. The download version comes in 4 zipped files, with a total file size of 925 megabytes. VMap Level 0 includes major road and rail networks, hydrologic drainage systems, utility networks (cross-country pipelines and communication lines), major airports, elevation contours, coastlines, international boundaries and populated places. VMap Level 0 includes an index of geographic names to aid in locating areas of interest. VMap Level 0 is accessible directly from the CD-ROM or can be transferred to a hard drive and used in many geographic information system (GIS) applications, including a number of free ones.
Reference Danko, D.M. (1992) The Digital Chart of the World Project. Photogrammetric Engineering and Remote Sensing, 58, 1125–1128. NIMA (1995) MIL-PRF-89039 Performance specification Vector Smart Map (VMap) Level 0. Available at: http://earth-info.nga.mil/publications/specs/printed/89039/PRF_8903.PDF [Accessed: 4 Dec 2013]
Availability (commercial/free)
Free
Data policy The data is Public Domain, with only the following conditions imposed: "As an agency of the United States government, NIMA makes no copy-right claim under Title 17 of the United States Code with respect to any copyrightable material compiled in these products, nor requires compen-sation for their use."
"When incorporating the NIMA maps into your product, please include the following:
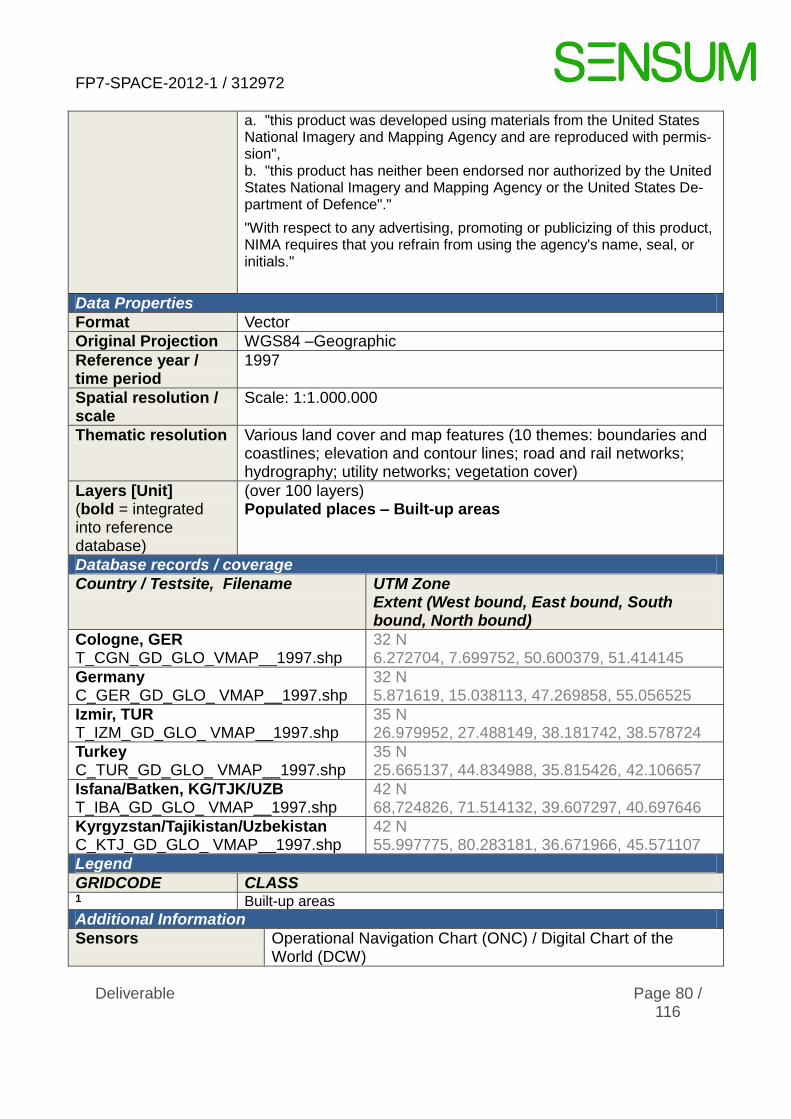
FP7-SPACE-2012-1 / 312972
Deliverable Page 80 / 116
a. "this product was developed using materials from the United States National Imagery and Mapping Agency and are reproduced with permis-sion", b. "this product has neither been endorsed nor authorized by the United States National Imagery and Mapping Agency or the United States De-partment of Defence"."
"With respect to any advertising, promoting or publicizing of this product, NIMA requires that you refrain from using the agency's name, seal, or initials."
Data Properties
Format Vector
Original Projection WGS84 –Geographic
Reference year / time period
1997
Spatial resolution / scale
Scale: 1:1.000.000
Thematic resolution Various land cover and map features (10 themes: boundaries and coastlines; elevation and contour lines; road and rail networks; hydrography; utility networks; vegetation cover)
Layers [Unit] (bold = integrated into reference database)
(over 100 layers) Populated places – Built-up areas
Database records / coverage
Country / Testsite, Filename UTM Zone Extent (West bound, East bound, South bound, North bound)
Cologne, GER T_CGN_GD_GLO_VMAP__1997.shp
32 N 6.272704, 7.699752, 50.600379, 51.414145
Germany C_GER_GD_GLO_ VMAP__1997.shp
32 N 5.871619, 15.038113, 47.269858, 55.056525
Izmir, TUR T_IZM_GD_GLO_ VMAP__1997.shp
35 N 26.979952, 27.488149, 38.181742, 38.578724
Turkey C_TUR_GD_GLO_ VMAP__1997.shp
35 N 25.665137, 44.834988, 35.815426, 42.106657
Isfana/Batken, KG/TJK/UZB T_IBA_GD_GLO_ VMAP__1997.shp
42 N 68,724826, 71.514132, 39.607297, 40.697646
Kyrgyzstan/Tajikistan/Uzbekistan C_KTJ_GD_GLO_ VMAP__1997.shp
42 N 55.997775, 80.283181, 36.671966, 45.571107
Legend
GRIDCODE CLASS 1 Built-up areas
Additional Information
Sensors Operational Navigation Chart (ONC) / Digital Chart of the World (DCW)

FP7-SPACE-2012-1 / 312972
Deliverable Page 81 / 116
Ancillary data -
Methodology (Reference)
Danko, D.M. (1992) The Digital Chart of the World Project. Photogrammetric Engineering and Remote Sensing, 58, 1125–1128. NIMA (1995) MIL-PRF-89039 Performance specification Vector Smart Map (VMap) Level 0. Available at: http://earth-info.nga.mil/publications/specs/printed/89039/PRF_8903.PDF [Accessed: 4 Dec 2013]
Validation (Reference) Potere, D., Schneider, A., Angel, S., Civco, D.L. (2009) Mapping urban areas on a global scale: which of the eight maps now available is more accurate? International Journal of Remote Sensing, 30, 6531-6558.

FP7-SPACE-2012-1 / 312972
Deliverable Page 82 / 116
Quicklook (Example: Cologne)

FP7-SPACE-2012-1 / 312972
Deliverable Page 83 / 116
Appendix 10 – Metadata: Global Human Settlement Layer
Global Human Settlement Layer
Originator EC Joint Research Center (JRC)
Online Resource http://ghslsys.jrc.ec.europa.eu/
Abstract (Originator)
The Global Human Settlement Layer (GHSL) is developed and maintained by the Joint Research Centre, the European Commission's in house science service. The GHSL proposes a new way to map, analyse, and monitor hu-man settlements and the urbanization in the 21st century. GHSL integrates several available sources reporting about the global human settlement phe-nomena, with new information extracted from available remotely sensed (RS) imageries. So far, the GHSL is the largest and most complete known experiment on automatic image information retrieval using high and very high remotely sensed image data input. The GHSL automatic image infor-mation extraction workflow integrates multi-resolution (0.5m-10m) multi-platform, multi-sensor (pan, multispectral), and multi-temporal image data. The GHSL is an evolutionary system, with the aim of stepwise improving completeness and accuracy of the global human settlement description by offering free services of image information retrieval in the frame of collabora-tive and derived-contents sharing agreements (JRC, 2012).
Reference JRC (2013) Global Human Settlement Layer. Available at:
http://ghslsys.jrc.ec.europa.eu/ Accessed 14 Jun 2013.
Availability (commercial/free)
n/a (under development)
Data policy General Copyright Notice
© European Union, 1995-2012 Reuse is authorised, provided the source is acknowledged. The reuse policy of the European Commission is implemented by a Decision of 12 December 2011. The general principle of reuse can be subject to conditions which may be specified in individual copyright notices. Therefore users are advised to refer to the copyright notices of the individual websites maintained under Europa and of the individual documents. Reuse is not applicable to documents subject to intellec-tual property rights of third parties.
Data Properties
Format Raster
Original Projection
ETRS89 – Geographic (LAEA)
Reference year / Depending on HR optical data availability (e.g., 2003-2009 for SPOT-

FP7-SPACE-2012-1 / 312972
Deliverable Page 84 / 116
time period 5)
Spatial resolution / scale
0.5-10m
Thematic resolution
Binary (classes 0-20 “Non-urban” / classes 30-50 “urban”)
Layers [Unit] (bold = integrated into reference database)
Primary information: - Built-up area (BUarea) - Built-up scale (BUscale) Secondary information:
- TileSurface in m²: It is the surface of the spatial unit calculated from the projection and scale parameters;
- BuiltUpSurface in m²: total surface built-up in the specific spatial unit calculated as sum of BUarea;
- BuiltUpPercent percent of built-up surface in the specific spatial unit. It is calculated as BuiltUpSurface divided by TileSurface;
- AverageSurfaceOfBuildings in m2. The average size of buildings expressed as average surface of building footprint candidates in the specific spatial unit calculated as sum of BuiltUpPercent times BUScale;
- BuildingNumber. This is the number of built-up structures estimat-ed in the specific spatial unit from the sum of BuiltUpPercent times BUScale.
Database records / coverage
Country / Testsite, Filename UTM Zone Extent (West bound, East bound, South bound, North bound)
Cologne, GER T_CGN_GD_GLO_GHSL__2013.tif
32 N 6.272704, 7.699752, 50.600379, 51.414145
Germany C_GER_GD_GLO_GHSL__2013.tif
32 N 5.871619, 15.038113, 47.269858, 55.056525
Izmir, TUR T_IZM_GD_GLO_GHSL__2013.tif
35 N 26.979952, 27.488149, 38.181742, 38.578724
Isfana/Batken, KG/TJK/UZB T_IBA_GD_GLO_GHSL__2013.tif
42 N 68,724826, 71.514132, 39.607297, 40.697646
Legend
GRIDCODE CLASS 0 No data 10 Not built-up outside settlements 20 Green areas outside settlements and larger green spaces 30 Not built-up inside settlements 40 Green inside city 50 Built-up

FP7-SPACE-2012-1 / 312972
Deliverable Page 85 / 116
Additional Information
Sensors Various optical sensors in the range of 0.5-10m spatial resolution (e.g., SPOT (4 and 5), CBERS-2B, RapidEye (2 and 4), WorldView (1 and 2), GeoEye-1,QuickBird-2, IKONOS-2, and airborne sensors, etc.)
Ancillary data Landsat maps, Open StreetMap, MODIS Land Cover, LandScan
Methodology (Reference)
Joint Research Center (2012) A Global Human Settlement Layer from Optical High Resolution Imagery. JRC Scientific and Policy Report EUR 25662 EN. Pesaresi, M., Guo, H., Blaes, X., Ehrlich, D., Ferri, S., Gueguen, L., Kalkia, M., Kauffmann, M., Kemper, T., Lu, L., Marin-Herrera., M.A., Ouzounis, G.K., Scavazzon, M., Soille, P., Syrris, V., Zanchetta, L. (2013) A Global Human Settlement Layer from optical HR/VHR RS data: concept and first results. IEEE Journal Of Selected Topics In Applied Earth Observations And Remote Sensing, 6, 2102-2131.
Validation (Reference)
Joint Research Center (2012) A Global Human Settlement Layer from Optical High Reolution Imagery. JRC Scientific and Policy Report EUR 25662 EN. Pesaresi, M., Guo, H., Blaes, X., Ehrlich, D., Ferri, S., Gueguen, L., Kalkia, M., Kauffmann, M., Kemper, T., Lu, L., Marin-Herrera., M.A., Ouzounis, G.K., Scavazzon, M., Soille, P., Syrris, V., Zanchetta, L. (2013) A Global Human Settlement Layer from optical HR/VHR RS data: concept and first results. IEEE Journal Of Selected Topics In Applied Earth Observations And Remote Sensing, 6, 2102-2131.

FP7-SPACE-2012-1 / 312972
Deliverable Page 86 / 116
Quicklook (Example: Cologne)

FP7-SPACE-2012-1 / 312972
Deliverable Page 87 / 116
Appendix 11 – Metadata: Global Urban Footprint
Global Urban Footprint
Originator German Aerospace Center (DLR), German Remote Sensing Data Center (DFD)
Online Resource n/a
Abstract (Originator)
Based on the German space missions TSX and TDX two coverages of the entire land-mass for 2011 and 2012 have been acquired. In this context, DLR has developed a pixel-based classification approach aiming to globally extract urban and non-urban structures from single radar imagery. The intended “global urban footprint” will be a binary classification of urban and non-urban areas at global scale based on single polarized images acquired in Stripmap mode with a resolution of approximately 3 × 3 m. Considering the challenges of a global urban footprint production, the algorithm is currently further investigated for the potential to improve the classification performance by substituting the presented threshold-based technique by a machine-learning
approach (Esch et al., 2012).
Reference Esch, T., Taubenböck, H., Roth, A., Heldens, W., Felbier, A., Thiel, M., Schmidt, M., Müller, M., Müller, A., Dech, S. (2012) TanDEM-X mission—new perspectives for the inventory and monitoring of global settlement patterns. Journal of Applied Remote Sensing, 6, 061702.
Esch, T., Thiel, M., Schenk, A., Roth, A., Müller, A., Dech, S. (2010): Delineation of Urban Footprints From TerraSAR-X Data by Analyzing Speckle Characteristics and Intensity Information. IEEE Transactions on Geoscience and Remote Sensing, 48, 905-916.
Esch, T., Schenk, A. Ullmann, T., Thiel, M. Roth, A., Dech, S. (2011): Characterization of Land Cover Types in TerraSAR-X Images by Combined Analysis of Speckle Statistics and Intensity Information. IEEE Transactions on Geoscience and Remote Sensing, 49, 1911-1925.
Esch, T., Marconcini, M., Felbier, A., Roth, A., Heldens, W., Huber, M., Schwinger, M., Müller, A. (2013): Urban Footprint Processor – Fully automated processing chain generating settlement masks from global data of the TanDEM-X mission. Geoscience and Remote Sensing Letters, Special Stream EORSA2012. Submitted.

FP7-SPACE-2012-1 / 312972
Deliverable Page 88 / 116
Availability (commercial/free)
n/a (under development)
Data policy n/a
Data Properties
Format Raster
Original Projection WGS84 – UTM Coordinates
Reference year / time period
2011/2012
Spatial resolution / scale
12m
Thematic resolution Binary
Layers [Unit] (bold = integrated into reference database)
Global Urban Footprint, 12m
Database records / coverage
Country / Testsite, Filename UTM Zone Extent (West bound, East bound, South bound, North bound)
Cologne, GER T_CGN_GD_GLO_GLC___2000.tif
32 N 6.272704, 7.699752, 50.600379, 51.414145
Germany C_GER_GD_GLO_GLC___2000.tif
32 N 5.871619, 15.038113, 47.269858, 55.056525
Izmir, TUR T_IZM_GD_GLO_GLC___2000.tif
35 N 26.979952, 27.488149, 38.181742, 38.578724
Isfana/Batken, KG/TJK/UZB T_IBA_GD_GLO_GLC___2000.tif
42 N 68,724826, 71.514132, 39.607297, 40.697646
Legend
GRIDCODE CLASS 0 Non-Urban
1 Urban
Additional Information
Sensors TerraSAR-X / TanDEM-X
Ancillary data
Methodology (Reference)
Esch, T., Taubenböck, H., Roth, A., Heldens, W., Felbier, A., Thiel, M., Schmidt, M., Müller, M., Müller, A., Dech, S. (2012) TanDEM-X mission—new perspectives for the inventory and monitoring of global settlement patterns. Journal of Applied Remote Sensing, 6, 061702.
Esch, T., Thiel, M., Schenk, A., Roth, A., Müller, A., Dech, S. (2010): Delineation of Urban Footprints From TerraSAR-X

FP7-SPACE-2012-1 / 312972
Deliverable Page 89 / 116
Data by Analyzing Speckle Characteristics and Intensity Information. IEEE Transactions on Geoscience and Remote Sensing, 48, 905-916.
Esch, T., Schenk, A. Ullmann, T., Thiel, M. Roth, A., Dech, S. (2011): Characterization of Land Cover Types in TerraSAR-X Images by Combined Analysis of Speckle Statistics and Intensity Information. IEEE Transactions on Geoscience and Remote Sensing, 49, 1911-1925.
Esch, T., Marconcini, M., Felbier, A., Roth, A., Heldens, W., Huber, M., Schwinger, M., Müller, A. (2013): Urban Footprint Processor – Fully automated processing chain generating settlement masks from global data of the TanDEM-X mission. Geoscience and Remote Sensing Letters, Special Stream EORSA2012. Submitted.
Validation (Reference) Taubenböck, H., Esch, T., Felbier, A., Roth, A., Dech, S. (2011) Pattern-based accuracy assessment of an urban footprint classification using TerraSAR-X data. IEEE Geoscience and Remote Sensing Letters, 8, 278-282.

FP7-SPACE-2012-1 / 312972
Deliverable Page 90 / 116
Quicklook (Example: Cologne)

FP7-SPACE-2012-1 / 312972
Deliverable Page 91 / 116
Appendix 12 – Metadata: LandScan
LandScan
Originator Oak Ridge National Laboratory (ORNL)
Online Resource http://web.ornl.gov/sci/landscan/index.shtml
Abstract (Originator)
Using an innovative approach with Geographic Information System and Remote Sensing, ORNL's LandScan™ is the community standard for global population distribution. At approximately 1 km resolution (30" X 30"), LandScan is the finest resolution global population distribution data available and represents an ambient population (average over 24 hours). The LandScan algorithm, an R&D 100 Award Winner, uses spatial data and imagery analysis technologies and a multi-variable dasymetric modelling approach to disaggregate census counts within an administrative boundary. Since no single population distribution model can account for the differences in spatial data availability, quality, scale, and accuracy as well as the differences in cultural settlement practices, LandScan population distribution models are tailored to match the data conditions and geographical nature of each individual country and region (ORNL, 2013).
Reference ORNL (2013) LandScan™ Available at: http://web.ornl.gov/sci/landscan/index.shtml [Accesse:4 Dec 2013]
Availability (commercial/free)
Commercial
Data policy © UT BATTELLE, LLC. Developed under Prime Contract No. DE-AC05-00OR22725 with the U.S. Department of Energy. The U.S. Government has certain rights herein.
This product was made utilizing the LandScan High Resolution global Population Data Set copyrighted by UT-Battelle, LLC, op-erator of Oak Ridge National Laboratory under Contract No. DE-AC05-00OR22725 with the United States Department of Ener-gy. The United States Government has certain rights in this Data Set. Neither UT-BATTELLE, LLC NOR THE UNITED STATES DEPARTMENT OF ENERGY, NOR ANY OF THEIR EMPLOY-EES, MAKES ANY WARRANTY, EXPRESS OR IMPLIED, OR ASSUMES ANY LEGAL LIABILITY OR RESPONSIBILITY FOR THE ACCURACY, COMPLETENESS, OR USEFULNESS OF THE DATA SET.
Data Properties
Format Raster
Original Projection WGS84 - Geographic

FP7-SPACE-2012-1 / 312972
Deliverable Page 92 / 116
Reference year / time period
2010-2012
Spatial resolution / scale
927m (at equator with native geographic projection (30’’))
Thematic resolution Continuous (ambient population per gridcell)
Layers [Unit] (bold = integrated into reference database)
Landscan (number of people per cell)
Database records / coverage
Country / Testsite, Filename UTM Zone Extent (West bound, East bound, South bound, North bound)
Cologne, GER T_CGN_GD_GLO_LSCAN_2012.tif
32 N 6.272704, 7.699752, 50.600379, 51.414145
Germany C_GER_GD_GLO_LSCAN_2012.tif
32 N 5.871619, 15.038113, 47.269858, 55.056525
Izmir, TUR T_IZM_GD_GLO_LSCAN_2012.tif
35 N 26.979952, 27.488149, 38.181742, 38.578724
Turkey C_TUR_GD_GLO_LSCAN_2012.tif
35 N 25.665137, 44.834988, 35.815426, 42.106657
Isfana/Batken, KG/TJK/UZB T_IBA_GD_GLO_LSCAN_2012.tif
42 N 68,724826, 71.514132, 39.607297, 40.697646
Kyrgyzstan/Tajikistan/Uzbekistan C_KTJ_GD_GLO_LSCAN_2012.tif
42 N 55.997775, 80.283181, 36.671966, 45.571107
Legend
GRIDCODE CLASS
- Continuous data: ambient population per gridcell -
Additional Information
Sensors EO derived land cover from various sensors (e.g., MODIS, Landsat, AVHRR, ALI, SPOR, etc.)
Ancillary data Various: EO derived land cover (MODIS, Landsat, AVHRR, ALI, SPOR), roads and populated places (VMAP0) VMAP0, Digital terrain models, DMSP-OLS Nighttime Lights, World Vector shorelines (WVS)
Methodology (Reference) Dobson, J. E., E. A. Bright, P. R. Coleman, R. C. Durfee, B. A. Worley. 2000. "A Global Population database for Estimating Populations at Risk", Photogrammetric Engineering & Remote Sensing Vol. 66, No. 7, July, 2000. Bhaduri, B.L., Bright, E.A., Coleman, P.R., and Dobson, J.E. 2002. LandScan: Locating People is What Matters. Geoinformatics Vol. 5, No. 2, pp. 34-37.
Validation (Reference) Potere, D., Schneider, A. (2009) Comparison of global urban maps, In: Global mapping of Human Settlement, In: Gamba, P. and M. Herold (Eds.), Global Mapping of

FP7-SPACE-2012-1 / 312972
Deliverable Page 93 / 116
Human Settlements: Experiences, Data Sets, and Prospects, Taylor and Francis, Boca Raton, FL.
Quicklook (Example: Cologne)
-

FP7-SPACE-2012-1 / 312972
Deliverable Page 94 / 116
Appendix 13 – Metadata: Corine Land Cover
Corine Land Cover
Originator European Environment Agency (EEA)
Online Resource http://www.eea.europa.eu/data-and-maps/data/corine-land-cover-2006-clc2006-100-m-version-12-2009
Abstract (Originator)
The pan-European CORINE Land Cover (CLC)database provides a unique and comparable data base of seamless land cover and land use information for Europe based on satellite remote sensing images on a scale of 1:100,000 for the years 1990, 2000 and 2006. The most recent update was completed in 2010 and comprises 44 land use classes of which two correspond to urban fabric (continuous and discontinuous). With the regard to the multi-temporal approach, also area-wide regional land use change maps were obtained. The main data source for the production of the da-taset were two European coverages of the Image 2006 dataset acquired by SPOT 4, SPOT 5 and IRS-P6 satellites from 2005 to 2007 provided by ESA. Land cover derivation was based on techniques of computer-aided photointerpretation and manual digit-izing. While the evaluation of CLC 2006 accuracy is still under investigation, CLC 2000 was found to be 85 % thematically correct (EEA, 2006 & 2012).
Reference EEA (2006) Corine land cover database passes accuracy test. Available at: http://www.eea.europa.eu/highlights/Ann1151398593 Accessed 14 Jun 2013 [Accessed: 4 Dec 2013]
EEA (2012) Corine Land Cover 2006 seamless vector layer. Available at: http://www.eea.europa.eu/data-and-maps/data/corine-land-cover-2006-raster-2 [Accessed: 4 Dec 2013]
Availability (commercial/free)
Free
Data policy EEA standard re-use policy: unless otherwise indicated, re-use of content on the EEA website for commercial or non-commercial purposes is permitted free of charge, provided that the source is acknowledged (http://www.eea.europa.eu/legal/copyright). Copyright holder: European Environment Agency (EEA).
Data Properties
Format Raster
Original Projection ETRS89 – Geographic (LAEA)
Reference year / time period
2006
Spatial resolution / scale
100m
Thematic 44 thematic classes

FP7-SPACE-2012-1 / 312972
Deliverable Page 95 / 116
resolution
Layers [Unit] (bold = integrated into reference database)
CLC 2006 – 100m CLC 2006 – 250m
Database records / coverage
Country / Testsite, Filename UTM Zone Extent (West bound, East bound, South bound, North bound)
Cologne, GER T_CGN_GD_REG_CLC___2006.tif
32 N 6.272704, 7.699752, 50.600379, 51.414145
Germany C_GER_GD_REG_CLC___2006.tif
32 N 5.871619, 15.038113, 47.269858, 55.056525
Izmir, TUR T_IZM_GD_REG_CLC___2006.tif
35 N 26.979952, 27.488149, 38.181742, 38.578724
Turkey C_TUR_GD_REG_CLC___2006.tif
35 N 25.665137, 44.834988, 35.815426, 42.106657
Legend
GRIDCODE CLASS 21 Continuous urban fabric 22 Discontinuous urban fabric 23 Industrial or commercial units 24 Road and rail networks and associated land 25 Port areas 26 Airports 27 Mineral extraction sites 28 Dump sites 29 Construction sites 30 Green urban areas 31 Sport and leisure facilities 32 Non-irrigated arable land 33 Permanently irrigated land 34 Rice fields 35 Vineyards 36 Fruit trees and berry plantations 37 Olive groves 38 Pastures 39 Annual crops associated with permanent crops 40 Complex cultivation patterns 41 Land principally occupied by agriculture, with significant areas of natural
vegetation 42 Agro-forestry areas 43 Broad-leaved forest 44 Coniferous forest 45 Mixed forest 46 Natural grasslands 47 Moors and heathland 48 Sclerophyllous vegetation

FP7-SPACE-2012-1 / 312972
Deliverable Page 96 / 116
49 Transitional woodland-shrub 50 Beaches, dunes, sands 51 Bare rocks 52 Sparsely vegetated areas 53 Burnt areas 54 Glaciers and perpetual snow 55 Inland marshes 56 Peat bogs 57 Salt marshes 58 Salines 59 Intertidal flats 60 Water courses 61 Water bodies 62 Coastal lagoons 63 Estuaries 64 Sea and ocean 255 no data
Additional Information
Sensors IMAGE 2006 (SPOT 4 / 5, IRS P6 LISS3)
Ancillary data Statistical data, thematic maps, topographic maps
Methodology (Reference)
EEA (1994) CORINE Land Cover – Part 1: Methodology. Available at: http://www.eea.europa.eu/publications/COR0-part1 Accessed: 4 Dec 2013. EEA (2012) Implementation and achievements of CLC2006. Available at: http://www.eea.europa.eu/data-and-maps/data/corine-land-cover-2006-raster-2#tab-documents Accessed: 4 Dec 2013. EEA (2000) CORINE land cover technical guide. Available at: http://www.eea.europa.eu/publications/tech40add Accessed: 4 Dec 2013.
Validation (Reference) EEA (2012) Implementation and achievements of CLC2006. Available at: http://www.eea.europa.eu/data-and-maps/data/corine-land-cover-2006-raster-2#tab-documents Accessed: 4 Dec 2013. Pérez-Hoyos, A., García-Haro, F.J., San-Miguel-Ayanz, J. (2012) Conventional and fuzzy comparisons of large scale land cover products: Application to CORINE, GLC2000, MODIS and GlobCover in Europe. ISPRS Journal of Photogrammetry and Remote Sensing, 74, 185-201.
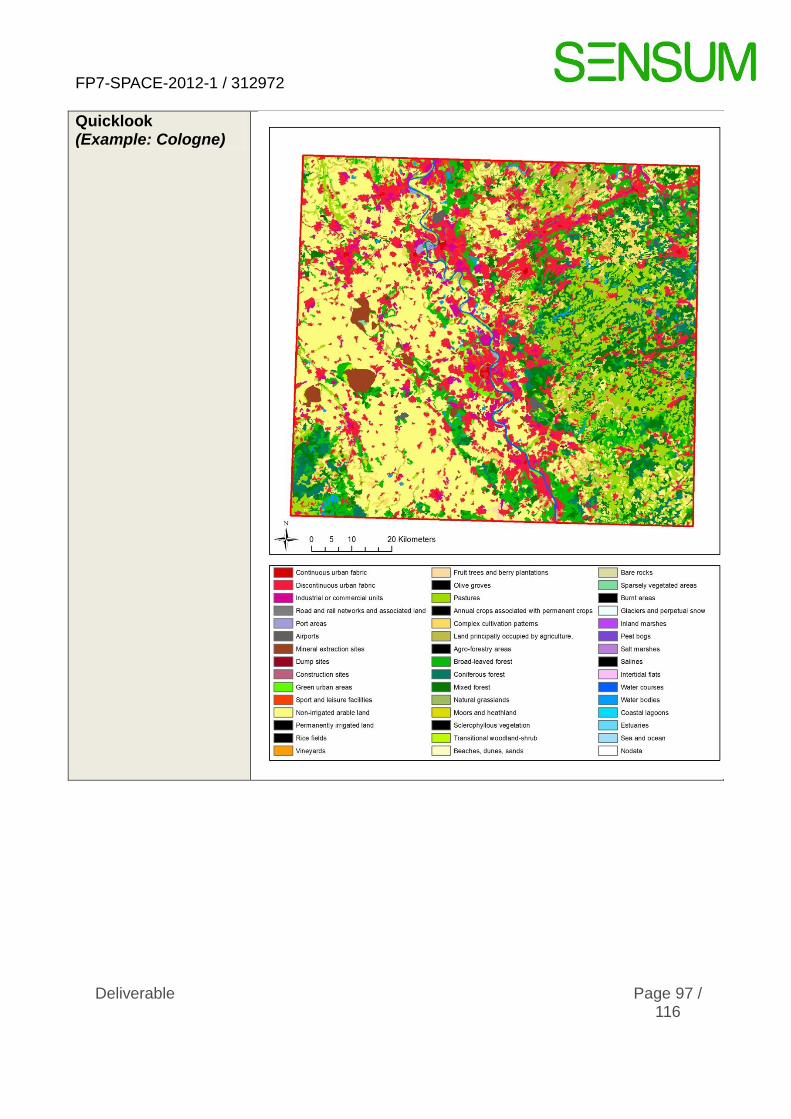
FP7-SPACE-2012-1 / 312972
Deliverable Page 97 / 116
Quicklook (Example: Cologne)
FP7-SPACE-2012-1 / 312972
Deliverable Page 98 / 116
Appendix 14 – Metadata: European Urban Atlas
European Urban Atlas
Originator European Environment Agency (EEA)
Online Resource
http://www.eea.europa.eu/data-and-maps/data/urban-atlas#tab-methodology
Abstract (Originator)
The European Urban Atlas is part of the local component of the GMES/Copernicus land monitoring services. It provides reliable, inter-comparable, high-resolution land use maps for 305 Large Urban Zones and their surroundings (more than 100.000 inhabitants as defined by the Urban Au-dit) for the reference year 2006. The GIS data can be downloaded together with a map for each urban area
It was created to fill a gap in the knowledge about land use in European cit-ies. The Urban Audit, a data collection of indicators on cities and their sur-roundings, showed that although a wide variety of socio-economic data is available for cities, inter-comparable land use data did not exist. To facilitate more evidence-based policy-making, the European Urban Atlas was designed to compare land use patterns amongst major European cities, and hence to benchmarking cities in Europe. It uses images from satellites to create reliable and comparable high-resolution maps of urban land in a cost-efficient manner. The Urban Atlas is aimed at everyone who wants to compare a city in one country in Europe with a city in another country. It provides relevant data for analysis related to transport, environment and land use.
The Urban Atlas has a legend designed to capture urban land use, including low density urban fabric, and a resolution that is 100 times higher than CORINE land cover. The maps of the Hague and Torino show how Urban Atlas brings cities and urban fringes into focus thanks to its superior resolution. The higher resolution in combination with the street network allows for a wide range of ad-ditional analyses such as proximity to green space or train stations. The Urban Atlas provides a far more accurate picture of urban sprawl in the fringe of urban zones.
The Urban Atlas is a joint initiative of the European Commission Directorate-General for Regional Policy and the Directorate-General for Enterprise and In-dustry with the support of the European Space Agency and the European Envi-ronment Agency. The Urban Atlas was executed by the French company Sys-tèmes d’Information à Référence Spatiale (SIRS), who was awarded a contract through an open call for tender.(EC, 2012)
Reference EC (2012) Mapping Guide –for a European Urban Atlas. Available at ec.europa.eu/regional_policy/tender/pdf/2012066/annexe2.pdf Accessed 14 Jun 2013.
Availability (commercial/free)
Free

FP7-SPACE-2012-1 / 312972
Deliverable Page 99 / 116
Data policy EEA standard re-use policy: unless otherwise indicated, re-use of content on the EEA website for commercial or non-commercial purposes is permitted free of charge, provided that the source is acknowledged (http://www.eea.europa.eu/legal/copyright). Copyright holder: Directorate-General Enterprise and Industry (DG-ENTR), Directorate-General for Regional Policy.
Data Properties
Format Raster
Original Projection
ETRS89 – Geographic (LAEA)
Reference year / time period
2005-2007
Spatial resolution / scale
1:10 000; MinMU = 0.25 ha Geographic projection / Reference
Thematic resolution
22 thematic urban classes
Layers [Unit] (bold = integrated into reference database)
European Urban Atlas Cologne
Database records / coverage
Country / Testsite, Filename UTM Zone Extent (West bound, East bound, South bound, North bound)
Cologne, GER T_CGN_GD_REG_UA____2005.tif
32 N 6.272704, 7.699752, 50.600379, 51.414145
Legend
GRIDCODE CLASS 11100 Continuous Urban Fabric (S.L. > 80%) 11210 Discontinuous Dense Urban Fabric (S.L. : 50% - 80%) 11220 Discontinuous Medium Density Urban Fabric (S.L. : 30% - 50%) 11230 Discontinuous Low Density Urban Fabric (S.L. : 10% - 30%) 11240 Discontinuous Very Low Density Urban Fabric (S.L. < 10%) 11300 Isolated Structures 12100 Industrial, commercial, public, military and private units 12210 Fast transit roads and associated land 12220 Other roads and associated land 12230 Railways and associated land 12300 Port areas 12400 Airports 13100 Mineral extraction and dump sites 13300 Construction sites 13400 Land without current use 14100 Green urban areas

FP7-SPACE-2012-1 / 312972
Deliverable Page 100 / 116
14200 Sports and leisure facilities 20000 Agricultural + Semi-natural areas + Wetlands 30000 Forests 40000 Wetlands 50000 Water bodies
Additional Information
Sensors HR optical, e.g., SPOT, ALOS, Quickbird
Ancillary data Topographic and cartographic maps at different scales, commercial navigation data for the road network, degree of sealing for classes 11 based on GMES FTS (Fast Track Service) Soil Sealing Layer specifications, other data (local digital/paper maps, Google Earth, Bing, etc.)
Methodology (Reference)
EC (2012) Mapping Guide –for a European Urban Atlas. Available at ec.europa.eu/regional_policy/tender/pdf/2012066/annexe2.pdf Accessed 14 Jun 2013.
Validation (Reference)
Geiß, C., Wurm, M., Taubenböck, H., Heldens, W., Esch, T. (2011) Compar-ison of selected impervious surface products derived from remote sensing data. In: Proceedings of the JURSE 2011. Presented at the JURSE 2011, Munich. SIRS - Systèmes d'Information à Référence Spatiale (2011) Urban Atlas – Delivery of land use/cover maps of major European agglomerations – Final report (V 2.0). Available at: http://ec.europa.eu/regional_policy/tender/pdf/2012066/urban_atlas_final_report_112011.pdf [Accessed 5 Dec 2013]

FP7-SPACE-2012-1 / 312972
Deliverable Page 101 / 116
Quicklook (Example: Cologne)

FP7-SPACE-2012-1 / 312972
Deliverable Page 102 / 116
Appendix 15 – Metadata: Urban Footprint Classifications
Urban Footprint
Originator German Aerospace Center
Online Resource -
Abstract (Originator)
Urban footprint classifications are based on a straight forward, application-oriented approach using multi-temporal remotely sensed data to systematically monitor the spatiotemporal dynamics of the world's cities. Object-oriented and pixel-based classification image analysis techniques are applied to Landsat as well as to TerraSAR-X data in order to define urbanized areas of cities at different points of time. Subsequently post-classification change detection is performed on urban footprint level. With time intervals of about 10 years almost 40 years of urbanization are monitored, showing different dimensions, dynamics and patterns across the analysed cities. The generated urban footprint products show accuracies consistently higher than 80%, allowing for further applications in fields such as urban planning, risk management, or population assessment (Taubenböck et al., 2012).
Reference Taubenböck, H., Esch, T., Felbier, A., Wiesner, M., Roth, A., and Dech, S. (2012) Monitoring urbanization in mega cities from space. Remote Sensing of the Environment, 117, 162-176.
Availability (commercial/free)
n/a
Data policy n/a
Data Properties
Format Vector
Original Projection WGS84 – UTM Coordinates
Reference year / time period
Data dependent; usually (ca. 1975, ca. 1990, ca. 2000, ca. 2010)
Spatial resolution / scale
30/60m
Thematic resolution 4 temporal classes
Layers [Unit] (bold = integrated into reference database)
Urban footprint change detection product Urban footprint classification
Database records / coverage
Country / Testsite, Filename UTM Zone Extent (West bound, East bound,

FP7-SPACE-2012-1 / 312972
Deliverable Page 103 / 116
South bound, North bound)
Cologne, GER T_CGN_GD_REG_UFP___Cologne.shp
32 N 6.62, 7.20, 50.70, 51.15
Izmir, TUR T_IZM_GD_ REG_UFP___Izmir.tif
35 N 26.98, 27.37, 38.22, 38.58
Isfana/Batken, KG/TJK/UZB T_IBA_GD_ REG_UFP___Bishkek.tif T_IBA_GD_ REG_UFP___Isfara.tif
42 N 74.26 , 74.90, 42.60, 40.43 70.46, 70.95, 39.93, 40.25
Legend
GRIDCODE CLASS 1975 Built-up 1975 1990 Built-up 1990 2000 Built-up 2000 2010 Built-up 2010
Additional Information
Sensors Landsat MSS, TM, ETM+, TerraSAR-X
Ancillary data -
Methodology (Reference)
Taubenböck, H., Esch, T., Felbier, A., Wiesner, M., Roth, A., and Dech, S. (2012) Monitoring urbanization in mega cities from space. Remote Sensing of the Environment, 117, 162-176.
Validation (Reference) Taubenböck, H., Esch, T., Felbier, A., Wiesner, M., Roth, A., and Dech, S. (2012) Monitoring urbanization in mega cities from space. Remote Sensing of the Environment, 117, 162-176.

FP7-SPACE-2012-1 / 312972
Deliverable Page 104 / 116
Quicklook (Example: Cologne)

FP7-SPACE-2012-1 / 312972
Deliverable Page 105 / 116
Appendix 16 – Metadata: European Soil Sealing
European Soil Sealing
Originator European Environment Agency
Online Resource http://www.eea.europa.eu/data-and-maps/data/eea-fast-track-service-precursor-on-land-monitoring-degree-of-soil-sealing
Abstract (Originator)
Soil Sealing (or imperviousness) is the first high-resolution Land Monitor-ing layer of the EEA with European coverage. Its main use is the charac-terisation of the human impact on the environment. Multi-sensor and bi-temporal, orthorectified satellite imagery (IMAGE2006) was used to de-rive soil sealing data covering 38 countries of Europe. Production of the soil sealing database was implemented in two phases: (1) Initial Soil Sealing (ISS) and (2) Soil Sealing Enhancement data (SSE), which is the improvement of the ISS database on the basis of evaluation of ISS data by some Member States. The main deliverable was a raster dataset of continuous degree of soil sealing ranging from 0 - 100% in full spatial resolution (20 m x 20 m) with the associated metadata. A derived product, a raster dataset of con-tinuous degree of soil sealing ranging from 0 - 100% in aggregated spa-tial resolution (100 m x 100 m) in European projection was validated.
According to the descriptive statistics, 6.5 % of the European terri-tory is covered by 1 ha cells including sealing (any percent be-tween 1-100), and the total sealed surface is 1,8 %. Built-up co-vers 0.5 % of Europe (if the sealing threshold is 80%) or 2.5% (with 30% threshold) (EEA, 2010).
Reference EEA (2010) European validation of GMES FTS Soil Sealing Enhance-ment data. Available at: http://www.eea.europa.eu/data-and-maps/data/eea-fast-track-service-precursor-on-land-monitoring-degree-of-soil-sealing#tab-additional-information [Accessed 5 Dec 2013]
Availability (commercial/free)
Free
Data policy EEA standard re-use policy: unless otherwise indicated, re-use of content on the EEA website for commercial or non-commercial purposes is permitted free of charge, provided that the source is acknowledged (http://www.eea.europa.eu/legal/copyright). Copyright holder: European Environment Agency (EEA).
Data Properties
Format Raster
Original Projection ETRS89 – Geographic (LAEA)
Reference year / time period
2006
Spatial resolution / scale
20m / 100m
Thematic resolution Continuous (Percentage of soil sealing per gridcell)
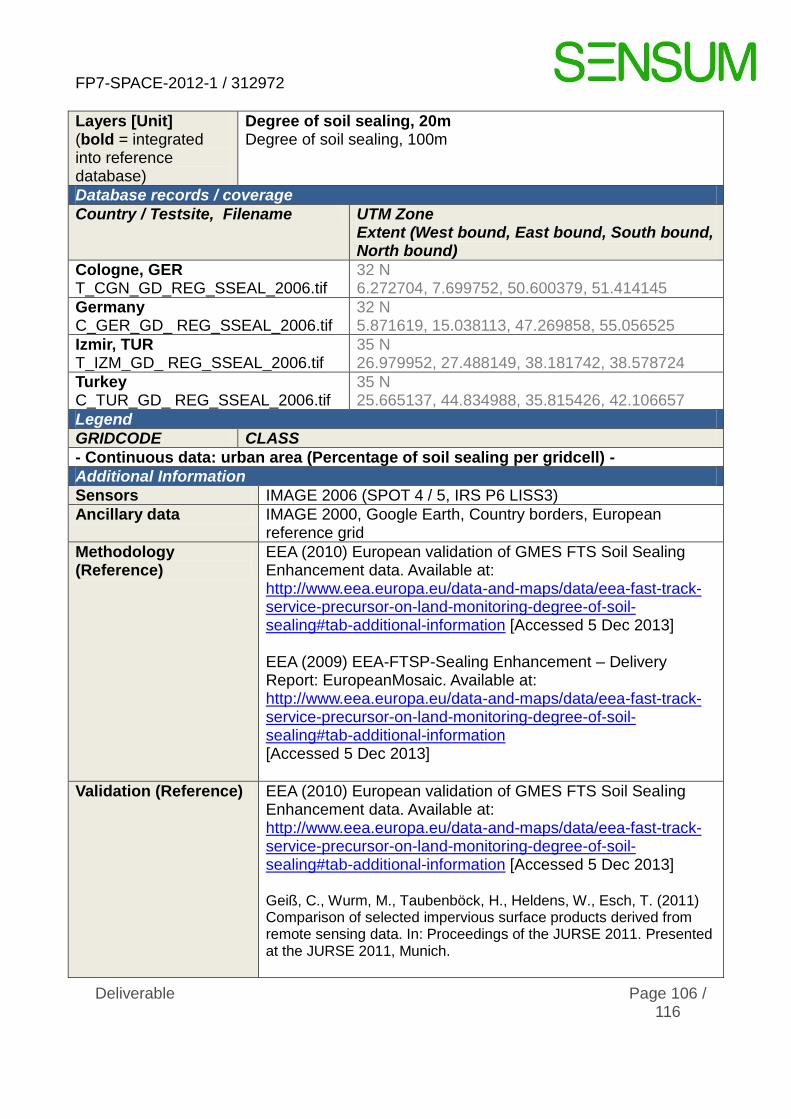
FP7-SPACE-2012-1 / 312972
Deliverable Page 106 / 116
Layers [Unit] (bold = integrated into reference database)
Degree of soil sealing, 20m Degree of soil sealing, 100m
Database records / coverage
Country / Testsite, Filename UTM Zone Extent (West bound, East bound, South bound, North bound)
Cologne, GER T_CGN_GD_REG_SSEAL_2006.tif
32 N 6.272704, 7.699752, 50.600379, 51.414145
Germany C_GER_GD_ REG_SSEAL_2006.tif
32 N 5.871619, 15.038113, 47.269858, 55.056525
Izmir, TUR T_IZM_GD_ REG_SSEAL_2006.tif
35 N 26.979952, 27.488149, 38.181742, 38.578724
Turkey C_TUR_GD_ REG_SSEAL_2006.tif
35 N 25.665137, 44.834988, 35.815426, 42.106657
Legend
GRIDCODE CLASS
- Continuous data: urban area (Percentage of soil sealing per gridcell) -
Additional Information
Sensors IMAGE 2006 (SPOT 4 / 5, IRS P6 LISS3)
Ancillary data IMAGE 2000, Google Earth, Country borders, European reference grid
Methodology (Reference)
EEA (2010) European validation of GMES FTS Soil Sealing Enhancement data. Available at: http://www.eea.europa.eu/data-and-maps/data/eea-fast-track-service-precursor-on-land-monitoring-degree-of-soil-sealing#tab-additional-information [Accessed 5 Dec 2013] EEA (2009) EEA-FTSP-Sealing Enhancement – Delivery Report: EuropeanMosaic. Available at: http://www.eea.europa.eu/data-and-maps/data/eea-fast-track-service-precursor-on-land-monitoring-degree-of-soil-sealing#tab-additional-information [Accessed 5 Dec 2013]
Validation (Reference) EEA (2010) European validation of GMES FTS Soil Sealing Enhancement data. Available at: http://www.eea.europa.eu/data-and-maps/data/eea-fast-track-service-precursor-on-land-monitoring-degree-of-soil-sealing#tab-additional-information [Accessed 5 Dec 2013] Geiß, C., Wurm, M., Taubenböck, H., Heldens, W., Esch, T. (2011) Comparison of selected impervious surface products derived from remote sensing data. In: Proceedings of the JURSE 2011. Presented at the JURSE 2011, Munich.

FP7-SPACE-2012-1 / 312972
Deliverable Page 107 / 116
Quicklook (Example: Cologne)

FP7-SPACE-2012-1 / 312972
Deliverable Page 108 / 116
Appendix 17 – Metadata: 3D city models
3D building model
Originator German Aerospace Center (DLR), German Remote Sensing Data Center (DFD)
Online Resource n/a
Abstract (Originator)
For accuracy assessment on a per-building scale two 3D city models have been produced: (1) a large-scale 3-dimensional building inventory of the metropolitan area of Cologne derived from LIDAR measurements and (2) 3D building classification covering the Gecekondu area of Kadifekale (Izmir) based on manual digitizing using VHR optical imagery and systematic height estimation from Cartosat-1 digital surface models.
Reference Wurm, M., Taubenböck, H., Schardt, M., Esch, T., and Dech, S. (2011) Object-based image information fusion using multi-sensor earth observation data over urban areas. International Journal of Image and Data Fusion, 2, 121-147.
D’Angelo, Uttenthaler, A., Carl, S., BArner, F., and Reinartz, P. (2010) Automatic generation high quality DSM based on IRS-P5 Cartosat-1 stereo data. In: ESA Living Planet Symposium, Bergen, 28 June – 2 July 2010. Bergen: ESA. Taubenböck, H., Kraff, N.J. (2013) The physical face of slums: a structural comparison of slums in Mumbai, India, based on remotely sensed data. Journal of Housing and the Built Environment, doi: 10.1007/s10901-013-9333-x.
Haralick, R.M., Stanley, S.R., and Zhumang, X. (1987) Image Analy-sis Using Mathematical Morphology. IEEE Transactions on pattern analysis and machine intelligence, 9, 532-550.
Availability (commercial/free)
3D city model Cologne: n/a 3D city model Kadifekale, Izmir: free
Data policy n/a
Data Properties
Format Vector
Original Projection WEGS84 – UTM Coordinates
Reference year / time period
Cologne: 2010, Izmir: 2012
Spatial resolution / scale
0.5-1m
Thematic resolution 1 thematic class: buildings incl. building height information

FP7-SPACE-2012-1 / 312972
Deliverable Page 109 / 116
Layers [Unit] (bold = integrated into reference database)
3D city model Cologne 3D city model Kadifekale, Izmir
Database records / coverage
Country / Testsite, Filename UTM Zone Extent (West bound, East bound, South bound, North bound)
Cologne, GER T_CGN_GD_LOC_3DCM__buildings.shp
32 N 6.81, 7.10, 50.83, 51.01
Izmir, TUR T_IZM_GD_LOC_3DCM__buildings.shp
35 N 27.147, 27.156, 38.410, 38.420
Legend
GRIDCODE CLASS 1 Buildings
Additional Information
Sensors LIDAR, Worldview-2, Cartosat-1
Ancillary data -
Methodology (Reference) Wurm, M., Taubenböck, H., Schardt, M., Esch, T., and Dech, S. (2011) Object-based image information fusion using multi-sensor earth observation data over urban areas. International Journal of Image and Data Fusion, 2, 121-147.
D’Angelo, Uttenthaler, A., Carl, S., BArner, F., and Reinartz, P. (2010) Automatic generation high quality DSM based on IRS-P5 Cartosat-1 stereo data. In: ESA Living Planet Symposium, Bergen, 28 June – 2 July 2010. Bergen: ESA. Taubenböck, H., Kraff, N.J. (2013) The physical face of slums: a structural comparison of slums in Mumbai, India, based on remotely sensed data. Journal of Housing and the Built Environment, doi: 10.1007/s10901-013-9333-x. Haralick, R.M., Stanley, S.R., and Zhumang, X. (1987) Image Analysis Using Mathematical Morphology. IEEE Transactions on pattern analysis and machine intelligence, 9, 532-550.
Validation (Reference) Wurm, M., Taubenböck, H., Schardt, M., Esch, T., and Dech, S. (2011) Object-based image information fusion using multi-sensor earth observation data over urban areas. International Journal of Image and Data Fusion, 2, 121-147.
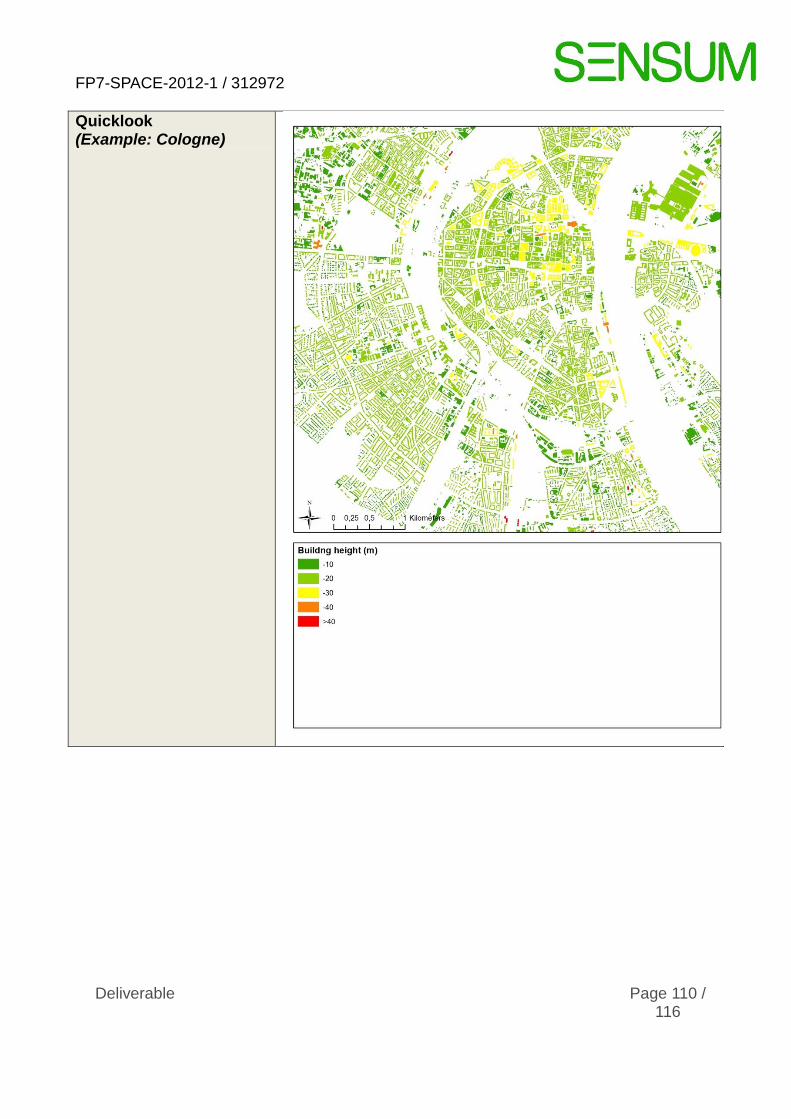
FP7-SPACE-2012-1 / 312972
Deliverable Page 110 / 116
Quicklook (Example: Cologne)

FP7-SPACE-2012-1 / 312972
Deliverable Page 111 / 116
Appendix 18 – Metadata: 2D building classification
2D building classification
Originator German Aerospace Center (DLR), German Remote Sensing Data Center (DFD)
Online Resource -
Abstract (Originator)
Urban morphology is characterized by a complex and variable coexistence of diverse, spatially and spectrally heterogeneous objects. Built-up areas are among the most rapidly changing and expanding elements of the landscape. Thus, remote sensing becomes an essential field for up-to-date and area-wide data acquisition, especially in explosively sprawling cities of developing countries. The urban heterogeneity requires high spatial resolution image data for an accurate geometric differentiation of the small-scale physical features. The dataset provided presents a high-detail building classification of the central urban area of Izmir derived by an object-based, multi-level, hierarchical classification framework combining shape, spectral, hierarchical and contextual information for the extraction of urban features. The particular focus is on high class accuracies and stable transferability by fast and easy adjustments on varying urban structures or sensor characteristics. The framework is based on a modular concept following a chronological workflow from a bottom-up segmentation optimization to a hierarchical, fuzzy-based decision fusion top-down classification. The workflow has been developed on IKONOS data for the megacity Istanbul, Turkey. For project purposes and transferability testing Quickbird data for Izmir has been employed to derive a highly detailed building mask. The validation of the building classification shows an overall accuracy of more than 87 percent (Taubenböck et al., 2010).
Reference Taubenböck, H., Esch, T., Wurm, M., Roth, A., and Dech, S. (2010) Object-based feature extraction using high spatial resolution satellite data of urban areas. Journal of Spatial Science, 55, 117-132.
Availability (commercial/free)
Available to project SENSUM partners
Data policy n/a
Data Properties

FP7-SPACE-2012-1 / 312972
Deliverable Page 112 / 116
Format Vector
Original Projection WGS84 – UTM Coordinates
Reference year / time period
2009
Spatial resolution / scale
0.61m
Thematic resolution 1 thematic class: buildings
Layers [Unit] (bold = integrated into reference database)
Building classification
Database records / coverage
Country / Testsite, Filename UTM Zone Extent (West bound, East bound, South bound, North bound)
Izmir, TUR T_IZM_GD_LOC_2DBC__Buildings.shp
35 N 27.10, 27.194, 38.27, 38.45
Legend
GRIDCODE CLASS 1 Buildings
Additional Information
Sensors Quickbird
Ancillary data -
Methodology (Reference) Taubenböck, H., Esch, T., Wurm, M., Roth, A., and Dech, S. (2010) Object-based feature extraction using high spatial resolution satellite data of urban areas. Journal of Spatial Science, 55, 117-132.
Validation (Reference) Taubenböck, H., Esch, T., Wurm, M., Roth, A., and Dech, S. (2010) Object-based feature extraction using high spatial resolution satellite data of urban areas. Journal of Spatial Science, 55, 117-132.

FP7-SPACE-2012-1 / 312972
Deliverable Page 113 / 116
Quicklook (Example: Izmir)

FP7-SPACE-2012-1 / 312972
Deliverable Page 114 / 116
Appendix 19 – Metadata: Open StreetMap
Open StreetMap
Originator The Open StreetMap Project
Online Resource http://www.openstreetmap.org
Abstract
The OpenStreetMap project is a knowledge collective that provides user-generated street maps. In the context of detailed urban mapping, crowdsourcing of geospatial data using informal social networks and web technology has gained attention in the past decade. Although the accuracy, availability, and completeness of volunteered geographical information (VGI) depend on the individual mappers, Open StreetMap (OSM) presents a valuable and cost-effective data source. Providing both land use and infrastructure information on building level – a large global database exists (OSM, 2013; Haklay & Weber, 2013; Haklay, 2010).
Reference OSM (2013) The Open StreetMap Project. Available at: http://www.openstreetmap.org [Accessed 5 Dec 2013]
Haklay, M., and Weber, P. (2008) OpenStreetMap: User-Generated Street Maps. IEEE Pervasive Computing, 7, 12-18.
Haklay. M. (2010) How good is volunteered geographical information? A comparative study of OpenStreetMap and Ordnance Survey datasets. Environment and Planning B: Planning and Design 2010, 37, 682-703.
Availability (commercial/free)
Free
Data policy OpenStreetMap is open data, licensed under the Open Data Commons Open Database License (ODbL).
Users are free to copy, distribute, transmit and adapt our data, as long as you credit OpenStreetMap and its contributors. If you alter or build upon our data, you may distribute the result only under the same licence. The full legal code explains your rights and respon-sibilities.
The cartography in our map tiles, and our documentation, are li-censed under the Creative Commons Attribution-ShareAlike 2.0 license (CC BY-SA).
Data Properties
Format Vector
Original Projection WGS84 - Geographic
Reference year / time period
2004-2013
Spatial resolution / scale Depending on mapping scale

FP7-SPACE-2012-1 / 312972
Deliverable Page 115 / 116
Thematic resolution Various primary features (e.g., Aerialway. Aeroway. Amenity, Barrier, Boundary, Building, Craft, Emergency, Geological, Highway, Historic, Landuse, Leisure, Man Made, Military, Natural, Offices, Places)
Layers [Unit] (bold = integrated into reference database)
Buildings
Database records / coverage
Country / Testsite, Filename UTM Zone Extent (West bound, East bound, South bound, North bound)
Cologne, GER T_CGN_GD_LOC_OSM___buildings.shp
32 N 6.272, 7.699, 50.600, 51.414
Germany C_GER_GD_LOC_OSM___ buildings.shp
32 N 5.871, 15.038, 47.269, 55.056
Izmir, TUR T_IZM_GD_GLO_LOC_OSM___buildings.shp
35 N 26.979, 27.488, 38.181, 38.578
Turkey C_TUR_GD_LOC_OSM___ buildings.shp
35 N 25.665, 44.834, 35.815, 42.106
Isfana/Batken, KG/TJK/UZB T_IBA_GD_LOC_OSM___ buildings.shp
42 N 68,724, 71.514, 39.607, 40.697
Kyrgyzstan/Tajikistan/Uzbekistan C_KTJ_GD_LOC_OSM___ buildings.shp
42 N 55.997, 80.283, 36.671, 45.571
Legend
GRIDCODE CLASS 1 Building
Additional Information Sensors -
Ancillary data out-of-copyright satellite imagery & maps, ordnance survey data, GPS, etc.
Methodology (Reference) Haklay, M., and Weber, P. (2008) OpenStreetMap: User-Generated Street Maps. IEEE Pervasive Computing, 7, 12-18. OSM (2013) The Open StreetMap Project. Available at: http://www.openstreetmap.org [Accessed 5 Dec 2013]
Validation (Reference) Haklay. M. (2010) How good is volunteered geographical information? A comparative study of OpenStreetMap and Ordnance Survey datasets. Environment and Planning B: Planning and Design 2010, 37, 682-703.

FP7-SPACE-2012-1 / 312972
Deliverable Page 116 / 116
Quicklook (Example: Cologne)