delivering quality care through effective nursing ... · pdf filedelivering quality care...
TRANSCRIPT

Agenda item 23.6
1
Delivering Quality Care Through
Effective Nursing Establishments.
Suzanne Hinchliffe - Chief Nurse
Agenda item 23.6
2
Index
Page Number
Executive Summary 3
Chapter 1 - Introduction 10
Chapter 2 - National Changes and Nurse Staffing, Patient 13
Outcomes, Experience and Quality
Chapter 3 - Benefits Realisation of Appropriate Staffing 18
Chapter 4 - Current Blueprint and temporary Staffing 22
Chapter 5 - Patient Acuity and Dependency Monitoring 25
Chapter 6 - Results of the LTH Acuity 2013 Review 26
Chapter 7 - Clinical Areas not Included in the Review - Implications 34
Chapter 8 - Limiting factors and Considerations 36
Chapter 9 - Realising the Investment 42
References 43
Appendices 1 - 10 47

Agenda item 23.6
3
Executive Summary
1.0 Introduction
The impact of nursing, midwifery and care staffing capacity and capability on the quality of care
experienced by patients, and on patient outcomes and experience has been well documented, with
multiple studies linking low staffing levels to poorer patient outcomes, and to increased mortality
rates.
Nursing staff are the primary deliverers of 24/7 health-care within the multidisciplinary team in the
majority of clinical settings and clinical specialities. There are currently no nationally agreed
standards or guidelines for the number of nurses required to deliver care safely, to meet
fundamental care needs, to prevent complications, to avoid unnecessary deaths and to deliver care
to a recognised level of quality (except in a few specialist areas such as intensive care).
In December 2010 the Royal College of Nursing (RCN) released two publications: ‘Guidance on safe
nurse staffing levels in the UK (RCN, 2010)’; and a policy position titled ‘Evidence-based nurse
staffing levels’(RCN, 2010). These publications do not set targets for Nurse staffing per bed, but they
do set out the essential elements for planning and reviewing nurse staffing.
Within Leeds Teaching Hospitals (LTH) the last comprehensive review of ward staffing
establishments occurred in 2010. This used an evidence based approach, Safer Nursing Care Tool,
(AUKUH); this resulted in some movement between wards but no investment additional funding to
support the reported deficit of 71.23 wte (whole time equivalent) registered staff and 130.19 wte
un-registered staff.
In England, demonstrating sufficient staffing is one of the six essential standards that all health care
providers (both within and outside of the NHS) must meet to comply with Care Quality Commission
(CQC) regulation. Furthermore, appropriate staffing levels will be a core requirement for all
organisations in the new CQC Inspectorate Monitoring.
The quality agenda demands that the effects of short staffing witnessed at NHS hospitals such as
Mid Staffordshire should not be allowed to happen again.
Compassion in Practice (NHSCB 2012). This emphasises the need for:
• Achieving evidence-based, patient need-driven staffing levels in all care settings.
• A twice yearly public Board level discussion to ratify and agree nurse staffing levels.
• Monthly reports to the Trust Board.
• Supervisory 0.4 wte Ward Manager/Team Leader time as a minimum.
• Required and actual staffing displayed on clinical ward areas.
2.0 Acuity Review
This report outlines the 2013/14 review which provides information on the evaluated nurse staffing
establishments for 69 of the adult in-patient wards at LTH. In an attempt to describe the areas that
require investment outwith those in the Safer Nursing Care Tool run, the staffing has been
benchmarked against the various standards and professional guidance that is available.
Agenda item 23.6
4
These being :
ICU’s / HDU’s – using the Intensive Care Society’s Standards 2013
Paediatrics – using the Royal College of Nursing Skill Mix In Children’s Wards 2012
Maternity – Birthrate Plus 2007 - pending revised modelling for future staffing
The audit includes the following indicators: acuity & complexity of nursing care, occupied bed-days,
rate of throughput of patients to reflect length of stay in hospital.
Within the tool the patient acuity descriptors have been based on 5 groups:
Level 0: patient receiving standard ward careLevel 1a: acute care (unstable patient)
Level 1b: basic nursing care (significantly dependant)
Level 2: HDU level unstable patients
Level 3: ITU level ventilated patients
The wards these patients are cared for on are aligned to base, specialist, high dependency and
intensive care each with an associated skill mix:
60/40 for Base Wards,
67/33 for Specialist Wards
80/20 for HDU & ITU areas.
3.0 Findings
The overall high level assessment is that the nurse staffing levels are not to the level required to
provide quality care to the patients, and that investment is required in all Clinical Service Units
(CSU’s). There are significant shortfalls in the medical and older people’s wards, and in a number of
the specialist wards, with the skill mix in these areas being below the expected range for these more
complex patients.
This is further compounded by the impact of maternity leave within ward teams, which is not
currently factored into the ward-establishments, and which, for registered staff runs at an average
of 3.33% which equates to 131 wte and for all staff equates to 164 wte at a cost of £5,284,035 ‘lost’
to the wards, and the relatively poor fill-rate by NHS-Professionals for temporary staff (50%) to
support both this and the staff lost to sickness absence.
The NHS Alliance, following the Francis report and many others (NCB, 2012; Francis, 2013; Berwick,
2013; Keogh, 2013) recommend a minimum ratio of 1 registered nurse to every 8 patients as a
minimum to provide the fundamentals of care to patients. This has been modelled to understand
the investment that would be required to provide this to the patients within the base wards.
There is ample evidence available to demonstrate the improvements seen in nurse productivity and
patient outcomes of improved nurse staffing (Krueger et al 2013), these being:
Reduction in failure to respond
Decreased length of stay
Reduced levels of post-operative sepsis
Reduced incidence of MRSA / CPI

Agenda item 23.6
5
Reduced re-admission to ICU’s
A positive correlation between staffing levels and in-hospital mortality
Increased appraisal rates
Reduced staff turnover
Improved patient satisfaction
Improved staff satisfaction
The Maternity, Paediatric and Critical Care requirements have also been captured, and investment is
required in varying amounts by these specialities to bring them to a position that is in line with
national recommendations and guidance.
Whilst it is recognised there is some room for improvement in nurse sickness absence levels, and
that deployment may release some nurses back into the workforce, this is marginal when set against
the investment the wards require.
Effective clinical leadership and management of the ward team is essential for building a well-
motivated team, and a work-place culture that strives to provide consistently high quality care
(person-centred, safe and effective care). A large component of this is effective communication and
co-ordination of care. The current ward establishments strive to allow for 0.4wte of the ward
managers’ time to be supervisory (the minimum level recommended), however, due to the low
nursing establishments, this is frequently not possible.
The recommendation that the Ward Leader should be 100% supervisory (Francis, 2013) has been
considered as part of the review, however, the primary focus of this investment is to improve the
ward nursing establishments, and achieving this will ensure the Ward Leader has 0.4 wte
consistently.
4.0 Review Recommendations
The summary of the options reviewed are described in the table at the end of the executive
summary.
In considering the evidence based review undertaken, it is proposed that investment is made into
the nurse staffing establishments in LTH, and that this takes a phased approach over 30 months
based on the ability to recruit the numbers of both registered and un-registered staff required, and
on the need to provide a leadership development programme for the Ward Managers/ Team
Leaders.
Option 3 is recommended, therefore a total investment of £14,006,985 is proposed. This would
achieve:
Base wards staffed at a level of the minimum of 1:8
Specialist areas staffed to the level suggested in the Safer Nursing Care Tool audit
Maternity Services, Paediatrics and Critical Care meeting current national recommendations
/ guidance
The creation of a limiting ‘Maternity Pool’
This is based on the growing body of evidence that to provide basic safe, effective, quality care to
patients, the ratio of RNs (Registered Nurses) to patients should be no less than 1 RN to 8 patients,

Agenda item 23.6
6
and the level of care required by our patients should be reflected in the numbers of nurses available
to provide that care.
The areas for investment would be prioritised based on an assessment that would include:
Areas where staffing affects the flow of patients through the organisation – ‘pinch points’
Areas where cancelled operations have a direct correlation to staffing
Areas where full bed complement may fluctuate due to staffing
Wards that have been staffed as base wards but due to the nature of their patients should
be specialist wards
Wards that are already in the ‘concerned’ zone
5.0 Recruitment
A plan to recruit the staff required to fill current vacancies, to manage turnover, and to recruit the
staff that will result from the investment is in place and is actively being managed.
The numbers of staff to be recruited is a realistic objective and has been achieved before, albeit not
in a climate where the competition for staff is as fierce as it currently is. Therefore a number of key
areas are being targeted, these include:
Taking interview panels to local universities, a number have been approached and are very
keen to work with LTH
Open Days for Band 5’s with interview panels, where CSU’s will showcase their services,
these are being planned for regular intervals throughout the year with off-site accessible
venues being sought, and will provide a ‘one stop shop’ approach.
Aiming a recruitment campaign to attract nurses whose registration has lapsed back into
nursing - Return to Practice.
Overseas recruitment
Retention strategies
6.0 Realising the Investment
To determine the return on this investment for patients in LTH, a range of baseline data, focussed on
the measures described above, will be taken in January 2014 on the 13/14 year to date activity
figures.
Expectations against the above indicators are to be developed which will be attributed on a sliding
scale basis from Quarter 4 2014/15. This takes into account the lead time for recruitment, supply
and for the critical mass to start to make an impact.
It is proposed that alternate month measures will be taken across the areas for investment, and that
these will be tracked through the Ward and Workforce Health Checks, all of which the LTH Board
have sight of quarterly.

Agenda item 23.6
7
Options for Investment
Option Includes Cost Advantages Disadvantages Preferred Option
1 The current funded nursing establishment moving to 20% uplift, 0.4 wte supervisory leadership time for the ward leaders and the application of the skill mix parameters described in section 2.0 of the executive summary.
£6,996,853 Would provide an uplift in staffing across all wards included in the data collection.
No evidence base to the staffing improvements.
Does not meet the minimal staffing levels of 1:8 on the base wards.
Does not include the application of national guidance / recommendations for critical care, maternity and paediatrics.
Does not provide any support for maternity leave absence.
Does not provide 0.8 wte supervisory leadership time for ward leaders.
X
2 Evaluated nurse staffing establishments for 69 of the adult in-patient wards from the findings of the recent AUKUH acuity audit.
Includes 22% uplift, 0.4 wte supervisory leadership time for the ward leaders and the application of the skill mix parameters described in section 2.0 of the executive summary.
£6,442,837 Provides an evidence base to the suggested investment for the wards included in the acuity data collection.
Does not meet the minimal staffing levels of 1:8 on the base wards.
Does not include the application of national guidance / recommendations for critical care, maternity and paediatrics.
Does not provide any support for maternity leave absence.
Does not provide 0.8 wte supervisory leadership time for ward wards leaders.
X

Agenda item 23.6
8
Option Includes Cost Advantages Disadvantages Preferred Option
3 Provides the minimal staffing levels of 1:8 on base wards.
Evaluated nurse staffing establishments for speciality adult in-patient wards from the findings of the recent AUKUH acuity audit.
Includes meeting the national guidance / recommendations for critical care, maternity and paediatrics.
Includes 22% uplift, 0.4 wte supervisory leadership time for the ward leaders, £500,000 towards the support of maternity leave absence and the application of the skill mix parameters described in section 2.0 of the executive summary.
£14,006,985 Provides an evidence base to the suggested investment for the wards included in the acuity data collection.
Meets the requirements of the national guidance / recommendations for critical care, maternity and paediatrics.
Provides support (though limited) to the maternity leave absence.
Does not provide for the LTH aspiration of 0.8 wte supervisory leadership time for the ward leaders which would expedite realising the benefits in section 3.
Insufficient support to the maternity leave absence, £500,000 against an average loss to service of £5,284,035, 9.6% of the total loss to service. This would however be transient.
√
4 Provides all of the above in option 3 and meets the LTH aspiration for 0.8wte supervisory leadership time for the ward leaders
£15,506,985 Provides all of the above in option 3 and meets the LTH aspiration of 0.8 wte supervisory leadership time for the ward leaders, which will assist in maximising the productivity of the improved staffing.
Insufficient support to the maternity leave absence, £500,000 against an average loss to service of £5,284,035, 9.6% of the total loss to service. This would however be transient.
X
5 Provides all of the above in option 3 & 4 and meets the full requirement of maternity leave absence support.
£20,291,020 This provides the most optimum workforce plan for nursing.
Cost delivery period would need to be extended from 30 months.
X
Agenda item 23.6
9
Chapter 1
Introduction
1.0 Introduction
Nursing staff are the primary deliverers of healthcare within the multi-professional team in
the majority of acute care settings, and play a critical role in securing high quality care and
excellent outcomes for patients.
There has been much debate about whether there should be defined staffing ratios in the
NHS. Jane Cummings, Chief Nursing Officer for England suggests that this misses the point
and the goal should be the right staff, with the right skills, in the right place at the right time.
There is an acceptance that no single ratio or formula can calculate the answers to such
complex questions. The right answer will differ across and within organisations, and
reaching it requires the use of evidence, evidence based tools, the exercise of professional
judgement and a truly multi-professional approach. Above all, it requires openness and
transparency, within organisations and with patients and the public.
This paper is the start of that journey for Leeds Teaching Hospitals (LTH) and provides
information on the evaluated nurse staffing establishments for 69 of the adult in-patient
wards at LTH which includes the wards within the Clinical Service Units of:
Acute Medicine (this includes all the elderly care wards)
Cardio-Respiratory
Neurosciences
Chapel Allerton
Digestive Diseases
Head and Neck
Hepato-renal
Leeds Cancer Centre (the majority of wards, for some of the chemotherapy units the
tool used is not appropriate)
Trauma and Related Services
Those areas excluded from the current review were Theatres, Emergency Care
Departments, Maternity, Paediatrics and Critical Care and this was due to the tool being
unsuitable for use in those areas. Work is being undertaken over the next three months to
apply suitable tools to the Paediatric, Maternity and Emergency Care Departments.
Within LTH, there has been limited investment into nurse staffing in recent years, with the
last review undertaken in 2010 using the AUKUH tool resulting in some movement between
wards, but no investment to respond to a reported deficit of 71.23 wte registered staff and
130.19 wte unregistered staff equating to, a financial investment of £5.2 million. Maternity
staffing received a £1.3m investment in 2012.

Agenda item 23.6
10
Ensuring we have the right staff, with the right skills in the right place is Action Area 5 within
Compassion in Practice (NHSCB 2012). This emphasises the need for:
Achieving evidence-based, patient need-driven staffing levels in all care settings .
A twice yearly public Board level discussion to ratify and agree nurse staffing levels.
This has begun within LTH with the Board receiving information about nurse staffing
levels at the September 2013 (Appendices 1 and 2) Board and subsequently at the
December 2013 Workforce Sub-Committee of the Board. The outcome of the recent
acuity review having being received at the Trust Board time out in December 2013
and to the Finance & Investment Committee in January is set to be formally received
at the January Trust Board 2014.
Monthly reports to the Trust Board.
Supervisory 0.4 wte Ward Manager/Team Leader time as a minimum.
Required and actual staffing displayed on clinical ward areas.
In addition to the Board overview, a number of recent reviews, reports and strategies (NCB,
2012; Francis, 2013; Berwick, 2013; Keogh, 2013) have called for openness and transparency
at ward level, asking for agreed staffing levels and actual staffing levels, together with roles,
being obviously displayed on the wards for patients, families and visitors. LTH is in the
process of rolling out a variety of patient safety information at ward level of which staffing,
as described above, will form one element. This will be available late January 2014.
1.1 General Factors Influencing Nurse Staffing
The national picture influencing the increased requirement for healthcare and therefore
nurses is well documented and includes:
The ageing population’s impact on inpatient dependency and acuity; and the impact
of this is being felt currently, the centre for Workforce Intelligence (CFWI, 2013)
suggests this will be the most significant factor influencing the nursing workforce,
with not only higher proportion of aging people but also higher numbers with
cardiovascular disease and diabetes, both being a consequence of today’s higher
obesity levels.
Rapid throughput and shorter patient-stays; but of a greater complexity and acuity.
Patients with low acuity are no longer found within our acute wards.
Decreasing Registered Nurse (RN) direct-care time and the corresponding rise in
support worker direct care time.
New roles within the workplace; e.g. Band 4 Assistant Practitioner positions.
Change in the nursing skill mix.
The Francis report.
New technologies and treatments.
Changes to pathway delivery i.e. integrated care models.
Changing commissions.
National Performance measures and CQUIN.

Agenda item 23.6
11
Public expectations regarding quality.
Fiscal position and investment.
1.2 The Leeds Health Picture
The most recent information from Public Health England (2013), seen in appendix 3,
demonstrates that of the 32 indicators seen to influence the health of the local population,
Leeds is significantly worse in 17, not significantly worse than the average in 11 and
significantly better than the average in 4 of them. The highlights of which are described
below, and suggests no reduction in the level of healthcare that will be required by the
population.
The health of people in Leeds is generally worse than the England average. Deprivation is
higher than average and about 31,000 children live in poverty. Life expectancy for both men
and women is lower than the England average.
Life expectancy is 12.4 years lower for men and 8.2 years lower for women in the most
deprived areas of Leeds than in the least deprived areas.
Over the last 10 years, all cause mortality rates have fallen. Early death rates from cancer
and from heart disease and stroke have fallen but remain worse than the England average.
In Year 6, 19.7% of children are classified as obese, levels of teenage pregnancy, GCSE
attainment and breast feeding are worse than the England average.
Estimated levels of adult 'healthy eating', smoking obesity are worse than the England
average. The estimated level of adult physical activity is better than the England average.
Rates of sexually transmitted infections and smoking related deaths are worse than the
England average. The rates of statutory homelessness and violent crime are better than
average.

Agenda item 23.6
12
Chapter 2
National Changes, Nurse Staffing and Regulation
2.0 National Changes
A patients’ right to be cared for by appropriately qualified and experienced staff in safe
environments is enshrined within the National Health Service (NHS) Constitution, and the
NHS Act 1999 makes explicit the board’s corporate accountability for quality. Nurses’
responsibilities regarding safe staffing are also stipulated by the Nursing and Midwifery
Council (NMC), covering every RN in the UK.
In England, demonstrating sufficient staffing is one of the six essential standards that all
health care providers (both within and outside of the NHS) must meet to comply with Care
Quality Commission (CQC) regulation. Furthermore, appropriate staffing levels will be a core
requirement for all organisations in the new CQC Inspectorate Monitoring.
Attention is now focussed more sharply than ever on staffing. Public expectation and the
quality agenda demand that the effects of short staffing witnessed at NHS hospitals such as
Mid Staffordshire should not be allowed to happen again. Inadequate staffing is identified
by coroners’ reports and inquiries as a key factor. The Health Select Committee 2009 report
states: ‘inadequate staffing levels have been major factors in undermining patient safety in
a number of notorious cases’. In one year the National Patient Safety Agency (NPSA)
recorded more than 30,000 patient safety incidents related to staffing problems.
Whilst Boards of organisations have always been ultimately responsible for the quality of
care they provide, and for the outcomes they achieve, this has never been so overt as is
currently the case following the Mid Staffordshire NHS Foundation Trust Public Inquiry
(2013), and the subsequent reviews by Professor Sir Bruce Keogh into 14 trusts with
elevated mortality rates, Don Berwick’s review into patient safety, and the Cavendish review
into the role of healthcare assistants and support workers (2013).
The impact of nursing, midwifery and care staffing capacity and capability on the quality of
care experienced by patients, and on patient outcomes and experience has been well
documented, with multiple studies linking low staffing levels to poorer patient outcomes,
and increased mortality rates, a snapshot is provided in Table 1 later in this paper.
These reviews bring this body of information to the fore and have reinforced it by the
examples witnessed where poor outcomes have been linked to poor nurse to patient ratios,
for example in Prof. Sir Bruce Keogh’s review, a positive correlation was found between
inpatient to staff ratios and higher hospital standardised mortality ratios (HSMRs), (Keogh,
2013).
As described earlier Trust Boards have been charged with understanding and reviewing their
nurse staffing levels at a minimum of twice yearly, to ensure all are sighted on the
importance of nurse to patient ratios and that these are appropriate for the acuity and

Agenda item 23.6
13
dependency of the patients in their care. This will inevitably change over time as the
population changes as described earlier are brought to bear, but this ensures a progressive
understanding and planned investment over time where the reviews suggest this.
Supporting the reviews mentioned above, including Compassion in Practice (2012), and the
RCN document, Breaking Down Barriers (2009) stress the importance of Ward Leaders
having supervisory status to maximise the outcomes of care. A minimum advisory level of
0.4wte for ward managers has been set to reflect this.
The quality and patient safety agenda is now more prominent than ever before, with
multiple initiatives across the UK aimed at raising standards of care. There has been a shift
away from process indicators and audit and a movement towards assuring quality through
tighter regulation of both the people and systems delivering care, and the monitoring of the
effectiveness of that care through the measurement of patient outcomes. This has been
evolving in LTH and the Board have received evidence of this in the developing Ward Health
Check Reports.
There are excellent examples of ‘real-time’ measures of patient outcomes/experience being
used to shape services. Unfortunately, there is currently a paucity of good quality and
comparable data to support the financial and productivity gain in the UK.
Examples of evidence to support the impact of the investment in nurse staffing levels may
be found below.

Agenda item 23.6
14
TABLE 1.0
Processes / outcomes Sources
Saving lives
Reduction in mortality Tourangeau et al (2006)
Dall et al (2009)
Correlation between nurse staffing levels and mortality Rafferty et al (2006)
Correlation between nurse ratio and hospital standardised mortality rates
Dr Foster (2009)
Improving health and improving quality of life
Lower rates of medication errors and wound infections McGillis Hall et al (2004)
Lower rates of pressure ulcers, hospital admissions, urinary tract infections, weight loss and deterioration in ability to perform activities of daily living
Horn et al (2005)
Improved mental and physical functioning, reduction in depression
Markle-reid et al (2006)
Smoking cessation University of Ottawa Heart
Institute (2007)
Cost effective care
Reduction in length of stay Kane et al (2007) Needleman et
al (2002)
Reduced length of stay and adverse events avoided can lead to net cost savings
Needleman et al (2006)
Process of care
Reduction in waiting times CAN (2009)
Improvement in patient experience and perception of health care
Rafferty et al (2006)
Contribution to wider economy
Increasing the number of RNs per patient has an estimated value of US$60,000 per additional full-time equivalent positive in avoided medical costs and improved national productivity (US)
Dall et al (2009)
Source: The socioeconomic case for nursing: RCN submission to the Prime Minister’s
Commission on Nursing and Midwifery (RCN 2009)

Agenda item 23.6
15
This building body of evidence, led the Safe Staffing Alliance, whose members are senior
expert nurses, to issue an unprecedented warning in May 2013 that patient care is unsafe
on wards where each nurse is looking after more than 8 patients. This is also the figure that
is being championed by the various patient groups and has been publicly supported by the
NHS Confederation and both Professor Don Berwick ad Sir Robert Francis:
…we call managers’ and senior leaders’ attention to existing research on proper staffing
which includes, but is not limited, to conclusions about ratios. For example, recent work
suggests that operating a general medical-surgical hospital ward with fewer that one
registered nurse per eight patients, plus the nurse in charge, may increase safety risks
substantially. This ratio is by no means to be interpreted as ideal or sufficient standards;
indeed, higher acuity doubtless requires more generous staffing. We cite this as only one
example of scientifically grounded evidence on staffing that leaders have a duty to
understand and consider when they take actions adapted to their local context. (Berwick
Report 2013)
2 .1 Nurse Staffing and Nurse Outcomes
There is a wealth of evidence that shows the effect that inadequate staffing levels have on
nurses and nursing.
Having insufficient nursing staff relative to the nursing workload to be delivered leads to
increased pressure, stress, higher levels of burnout, lower job satisfaction (Sheward et al.,
2005) and a greater inclination to leave (described as nurse ‘outcomes’ in some of the
literature).
The evidence for this was presented in the interim NHS Health and well-being review –
known as the Boorman report (2009), where it demonstrated the relationship between staff
wellbeing and absence, turnover, agency spend, patient satisfaction, MRSA rates (in acute
trusts) and mortality rates.
The report concludes: “Healthier staff, teams that are not disrupted by sickness, or where
staff are not under undue stress, and lower turnover rates all contribute both to the quality
of care given to patients and to patient satisfaction.
By contrast, where staff are unhappy and unhealthy, where there are high sickness rates,
high turnover and high levels of stress, there are likely to be poorer outcomes and poorer
patient experience” (p.49 Boorman, 2009)).
This downward spiral is not only costly to the individual nurses caught in the cycle, but is
costly to the health service in terms of:
• sickness absence costs
• turnover costs
• ill-health retirement

Agenda item 23.6
16
• agency and back cover staff absence and unfilled vacancies.
For LTH this can be seen in the Ward Workforce Health Check (appendices 1 & 2), where the
wards in question have an average sickness absence rate 1.2% higher than the LTH average.
For registered and un registered nurse turnover, the average expected for a large teaching
hospital would be in the region of 11%, as can be seen in appendix 4 for the high pressure,
high patient volume Clinical Service Units the turnover of both registered and unregistered
staff far exceeds this figure.
The evidence suggests that with an improvement in nurse to patient ratios there would be a
decrease in this figure, thereby keeping more of our experienced staff in post.
2.2 Safe Staffing - Regulation
The NMC Code sets out a nurse’s responsibility to report staffing levels that they believe put
patient care at risk. They are expected to:
Act without delay if they believe that they, a colleague, or anyone else may be
putting someone at risk.
Inform someone in authority if they experience problems that prevent them from
working within this Code or other nationally agreed standards.
Report their concerns in writing if problems in the environment of care are putting
people at risk.
Care providers also have a duty to patient safety, and as such are expected to be able to
demonstrate that they have carried out a needs analysis and risk assessment as the basis for
deciding safe staffing levels, and furthermore to demonstrate that they have appropriate
systems in place to enable effective maintenance of staffing levels (Guidance on safe nurse
staffing levels in the UK, RCN, 2010:18).
Agenda item 23.6
17
Chapter 3
Benefits Realisation of Appropriate Staffing for LTH
3.0 Productivity and care opportunities
3.1 Patient safety
Staffing capacity and capability can have a profound impact on patient safety. Berwick’s
recent review into patient safety emphasised the role of Boards and leaders of provider
organisations in relation to staffing capacity and capability, stating that they should take
responsibility for ensuring that clinical areas are adequately staffed in ways that take
account of varying levels of patient acuity and dependency, and that are in accordance with
scientific evidence about adequate staffing, (Berwick 2013).
One study estimated that an increase of 1 RN full time equivalent per patient day could save
5 lives per 1000 patients in intensive care, 5 lives per 1000 medical patients, and 6 per 1000
surgical patients, (Kane et al 2007).
Patients need care every day of the week, evidence shows that the limited availability of
some services at weekends can have a detrimental impact on outcomes for patients,
including raising the risk of mortality, (Freemantle et al, 2013). Therefore appropriate
nursing, midwifery and care staffing capacity and capability, together with other clinical
staff, needs to be sustained 24 hours a day, 7 days of week, to maintain patient care and
protect patient safety. Krueger et al (2013), in discussing the complexity and multivariate
nature of nurse related variables that impact on patient outcomes, illustrate how levels of
staffing consistently have the most positive influence overall. In presenting a meta-analysis
of American data they showed, for example, how nurse staffing was found to have effects
on failure to rescue, length of patient stay, and on levels of postoperative sepsis, and how
higher numbers of qualified nurses correlated positively to reduced incidence of MRSA
(2013:122-124). Nurse patient ratios were found to determine multiple patient outcomes.
In ICU environments, previous research has shown nurse staffing to be associated with
patients probability of survival, decubiti, central line associated blood stream infections,
inadequate care for the ventilated patient, failure to rescue, ventilator associated
pneumonia (VAP), and, catheter associated urinary tract infections. Robert et al (2000)
showed a link between nurse patient ratios and primary blood stream infections, and
Whitman et al (2002) added to the body of literature on staffing in ICUs by finding a link
between poor staffing levels and both falls and medication errors in cardiac ICU. Improved
staffing can also prevent re-admission to ICUs once patients have been transferred to lower
dependency units, (Diya et al, 2011). This study also found a positive correlation between
staffing levels of in-hospital mortality.
Furthermore, lower staffing levels increase the late onset of VAP, and that more that 20% of
all ICU acquired infections could be prevented. Hugonnet et al (Critical Care,11:R80, 2007),

Agenda item 23.6
18
and Shortell et al (Medical Care, 32:508-525, 1994) also found that staffing and culture was
significantly associated with lower rates of risk adjusted length of stay, nurse turnover and
provider rated quality of care.
Additionally, studies also signal better care when staffing is richer, identified through
reduced errors of omission or delayed care. The extent to which this impacts on patient care
include patient ambulation, maintaining nutrition, missed medications, hand washing,
intravenous site care, patient reassessment, and patient turning. (Dubois et all, International
Journal for Quality in Healthcare, April 2011).
3.2 Staff satisfaction and staff retention – a knowledge workforce
It has also been hypothesised that improved levels of staffing will positively impact on levels
of staff burnout, sickness and absenteeism. Knudson (2013:C8) and Garret (2008) discuss
how optimal levels of staffing can both improve nursing retention and reduce nurse
burnout, and improve patient satisfaction and outcomes, with the two being inextricably
linked. US nurses were found to report four times the average rate of job dissatisfaction
than other US workers, and nurses often cope with stress and burnout through
absenteeism. This causes both short and long term staff shortages, and culminates in a high
turnover. North et al (2013:419) discuss how high turnover is inconsistent with nursing as a
‘knowledge workforce’. This in turn adversely impacts upon a raft of patient outcomes, as
staff have unrealistic expectations placed on them, they are fatigued, and the quality of care
delivered to patients suffers.
3.3 Cost effective care
High impact nursing and midwifery actions identified by the England CNO also focus on the
savings and improvements that would result from preventing avoidable problems such as:
pressure ulcers, urinary tract infections, and falls (NHS Institute for Innovation and
Improvement 2009). A study by Van den Heede et al (2010) found that savings could be
made by increasing staffing levels in a postoperative cardiac unit, and that staffing was a
significantly more cost effective investment than other cardiovascular interventions. These
studies illustrate both improvements in cost effectiveness, and more importantly, in patient
safety and net gains.
In England, the message regarding improvement and efficiency, which underlies many of the
productivity improvements proposed, is that quality needs to be the organising principle of
the NHS at the same time as efficiency savings are made. A number of the recommended
interventions are identified as ‘potential high impact changes’, and they focus on financial
savings delivered through improving the efficacy and efficiency of care. For example,
enhancing recovery from elective surgery by improving pre-, intra-, and post-operative care
of patients.

Agenda item 23.6
19
Similarly, much of the discussion around ‘safer care’ (for example in the NHS 2010-15 five-
year plan) centres on avoidable complications and adverse events. An example given is that
deep vein thrombosis is responsible for 25,000 hospital deaths per year in England alone.
North et al found that in post-surgical patients, staffing was linked to pneumonia rates (for
example they cite a study that showed how a 10% increase in qualified staff nurses could
result in a 9.5% decrease in the likelihood of a patient acquiring pneumonia. A further study
also illustrated how this 10% increase in appropriate staffing resulted in a decrease in
pressure ulcers by 2%, falls by 3% and UTIs by less than 1% (2008:1200-1201). Yang
(2003:149) echoes this argument, stating that nurse workload is the most powerful
predictor of healthcare acquired infections, and arguing that patient outcomes are strongly
correlated to the organizational structure. Examples of positive relationships include
workload and UTIs, falls, complaints, pressure ulcers and respiratory infections.
Liu et al (2012) add weight to these findings by further verifying these causal relationships,
and by broadening the outcomes to include unplanned extubation, near and actual
medication errors.
3.4 Patient Satisfaction
Nurse workload (determined largely by staffing levels) has been found to have a direct
impact on levels of patient satisfaction (Aalto et al, 2009). Curry (2013) reiterates this
sentiment, stating on behalf of the RCN that the ‘friends and families test’, while a useful
indicator, is inadequate because in order to understand patient experience then staffing
levels have to be explicitly understood.
The pertinent point to note is that a great many of these initiatives, widely recognised as not
only improving care but also reducing costs, rely on the provision of good quality nursing
care.
‘Avoidable complications’ are only avoidable if effective nursing care is consistently
delivered.

Agenda item 23.6
20
3.1 The impact for LTH
Processes / outcomes Impact
Saving lives
Increase of 1 RN FTE per patient day An increase of 1 RN full time equivalent per patient day could save:
5 lives per 1000 patients in intensive care,
5 lives per 1000 medical patients,
6 per 1000 surgical patients, (Kane et al 2007).
Avoid harm
Appropriate ICU staffing Reduction of 30% of ITU infections (Hugonnet et al, 2007) which when applied to HCAI data from 2012/13 would translate to adjusted rates of:
11 CDI cases = 7.7
6 MSSA Bacteraemia = 4.2
1 MRSA Bacteraemia = 0.7
24.26 CRBSIs/1000 catheter days = 16.98
And for newly acquired UTIs from November 2012 - November 2013 (from Safety Thermometer Data):
7.16 = 5.012
Reduction of Grade 2 or above Pressure Ulcers - a local example of a neurosurgical ward illustrates that increasing staffing almost to establishment has greatly contributed to achieving 66 days without a pressure ulcer, a record that has not been achieved for the last two years
Patient/ Staff experience and productivity
Sickness management on WHC wards 1.2% reduction = 35 WTE
25% increase in appraisal rates
Staff Turnover and productivity Estimated that each RN that leaves an organisation costs £10,500 in terms of productivity (Hayes et al, 2007)
Average length of stay decreased by 10% pcm (AHRQ 2011, 30(3): 422-5). Nurse : patient care interface boosted by 11% more productivity
Delivery of supervisory status
Improving deployment by 1% across ITU’s Release of 5 WTE

Agenda item 23.6
21
Chapter 4
Current Blueprint and temporary Staffing
4.0 Current Blueprint
The current adult ward nursing establishments for LTHT were set in 2010, and whilst the
Safer Nursing Care Tool, (which will be described in more detail below) was used, the
investment in nursing staff that it suggested could not be achieved due to affordability.
Therefore the approach taken was to reduce the amount of ‘headroom’ (the additional time
allocated per staff member to take account of annual leave, mandatory and priority training
and a degree of sickness absence), in the establishments to 6%.
The Safer Nursing Care Tool provides an allocation of 22% in its acuity multipliers, but it
should be noted that this does not provide any support for maternity leave which can be
compromising when more than 50% of LTHT wards have a maternity leave rate of greater
than 3%.
The outcome of reducing this to 6% is that the wards are reliant on temporary staffing to
cover any shortfall and the Supervisory Leadership time allocated to Ward Managers,
technically 15 hours / week collapses as they are required to provide direct patient care.
4.1 Temporary Staffing
The average use of temporary staffing has remained at 5%, both for 2012/13 and the
financial year to date. This is despite the number of requests, and alongside recruitment
demonstrates a persistent shortfall in maintaining ward nursing establishments by an
average of 170 wte RNs and 50 un-registered Clinical Support Workers on the current
establishments set based on the 2010 ‘blueprint’. Temporary staffing demand and supply is
detailed in the graphs below.
4.2 Overall Shift Demand 11/12
QUALIFIED AND UNQUALIFIED SHIFTS
0
1,000
2,000
3,000
4,000
5,000
6,000
7,000
8,000
April M ay June July August September October November December January February M arch
Current Year Agency
Current Year Bank
Current Year Requests
Last Year Agency
Last Year Bank
Last Year Requests

Agenda item 23.6
22
4.3 Overall Shift demand 12/13
4.4 Overall Shift Demand YTD- October 2013
QUALIFIED AND UNQUALIFIED SHIFTS
0
1,000
2,000
3,000
4,000
5,000
6,000
7,000
8,000
April M ay June July August September October November December January February M arch
Current Year Agency
Current Year Bank
Current Year Requests
Last Year Agency
Last Year Bank
Last Year Requests

Agenda item 23.6
23
4.5 NHSP Shift Fill Rates From April 2011 – October 2013 by year
Source : NHSP Contract Monitoring Data Set
The graphs displayed below demonstrate the reduction in shift fill rate, this has fallen year
by year, from 70.1% in 2011 to 54.8% year to date. The Leeds experience mimics the
national picture of a reduction in fill rates by temporary staffing providers.
Financial YearNet Shifts
Requested
NHSP Filled
Shifts
% NHSP Filled
Shift
Agency Filled
Shifts
% Agency
Filled ShiftsOverall Fill Rate Unfilled Shifts
YTD Unfilled
Shifts
2011/12 58,689 41,136 70.1 % 319 0.5 % 70.6 % 17,234 29.4 %
2012/13 64,841 39,829 61.4 % 807 1.2 % 62.7 % 24,205 37.3 %
YTD (Oct 2013) 47,936 26,275 54.8 % 1,485 3.1 % 57.9 % 20,176 42.1 %

Agenda item 23.6
24
Chapter 5
Patient Acuity and Dependency Monitoring
5.0 Patient Acuity and Dependency Monitoring
There are a range of tools and methods available to use in the determination of nurse
staffing levels, there are briefly described in the table below. Whilst there is no tool that is
recommended above the others, all of the these, when used in combination, provide
evidence to ensure that staffing levels and patient outcomes are correlated. On a national
basis, plans by NICE to review the evidence and accredit evidence-based tools to further
support decision-making on staffing will take place.
Table 1.0
Source : Methods available to calculate staffing requirements (Hurst, 2003)
Method Description
Safer Nursing Care Tool (SNCT)
An evidence based tool that enables nurses to assess patient acuity and dependency, incorporating a staffing multiplier to ensure that nursing establishments reflect patient needs in acuity / dependency terms:
Level 0: patient receiving standard ward care
Level 1a: acute care (unstable patient)
Level 1b: basic nursing care (significantly dependant)
Level 2: HDU level unstable patients
Level 3: ITU level ventilated patients Appropriate for use in any acute hospital within the UK (although further work is underway to refine the tool for use in particular clinical environments). Used in conjunction with Nurse Sensitive Indicators (NSI) such as patient falls and pressure ulcer incidence, which can be linked to staffing. Able to support benchmarking activity in organisations when used across Trusts. Facilitates consistent nurse-to-patient ratios in line with agreed standards across similar care settings in England.
The Professional Judgment model (Telford method)
Simple to use and takes into account clinical staff views but is seen to be subjective, has no evidence-base and is not sensitive to workload intensity.
Staff to Bed ratio
Simple to use, allows benchmarking but assumes that base staffing levels are accurate and reflect patient need and is insensitive to changes in workload.
Activity Monitoring (GRASP)
Uses care plans / pathways and related nursing time but is task oriented, can be time consuming (to gather data / undertake workload studies) and may require support from commercial systems.
Nursing hours per patient day (NHPPD)
Widely used in the USA and Australia. Calculates the number of nurses and nursing assistants required in relation to activity levels.
Regression Methods (Teamwork)
Commercial systems are available and have been useful where workload predictions are possible, but is not easily understood by nurses and there is an underlying assumption that all wards are efficient and effective.
Agenda item 23.6
25
Chapter 6
Results of the LTH Acuity 2013 Review
6.0 Acuity and Staffing Tools Used for 2013 Review
The methods used in the recent assessment of acuity and dependency (September -
October 2013) was a combination of the Safer Nursing Care Tool, with professional
judgement and occupied bed days being incorporated into this.
Ward staff are instrumental in the collection and verification of the data used in the acuity
reviews and staff preparation supported through a series of workshops to appraise and train
staff in their roles. Staff side representatives were also engaged regarding the acuity review.
Data was collected over the month of September, recognising that the acuity of patients is
not always as great as would be expected in the winter months. It is therefore generally
accepted that an acuity tool is used at 2 points in the year to capture the seasonal variation
that wards experience.
The data once analysed was then shared with the Heads of Nursing to ensure all the subtle
nuances of the wards are understood and accounted for in the final analysis. It is important
to note that the data presented, whilst broadly correct, may be subject to some slight
adjustments as discussions are conducted.
Each option includes :
20% headroom (except option 2 for which 22% is integral to the multipliers and
cannot be disaggregated)
0.4wte supervisory leadership time
Registered nurse posts have been calculated at an average cost of Band 5
the current ward acuity ratings as described in the WWH
the consistent application of registered : un-registered ratios of
60/40 for Base Wards,
67/33 for Specialist Wards
80/20 for HDU & ITU areas
Points of note:
As described in chapter 8 the changes in the registered : un-registered skill mix,
particularly for the ITU/HDU areas will take time to achieve due to supply
constraints.
Base ward ratios in Trusts are noted to vary between 60/40 and 65/35
Headroom/uplift has been identified using national tools
0.4 Supervisory leadership time is identified in line with national guidance

Agenda item 23.6
26
6.1 Intelligent Estimate of Staffing Requirements for areas not included in AUKUH
As discussed during the introduction to this paper the acuity tool used is not suitable across
all areas. In an attempt to describe the areas that require investment outwith those in the
AUKUH run, the staffing has been benchmarked against the various standards and
professional guidance that is available, with the shortfalls being costed at Band 5.
These being : ICU’s / HDU’s – using the Intensive Care Society’s Standards 2013
Paediatrics – using the Royal College of Nursing Skill Mix In Children’s Wards 2012
Maternity – Birthrate Plus 2007 - pending revised modelling for future staffing
Theatres – Professional Judgement
Urgent Care - no validated acuity tool, however, professional judgement suggests that
vacancies are required to be filled to ensure staffing levels are satisfactory. This does not
take into account a future workforce development at Advanced Practitioner level
The importance of understanding the staffing in these areas cannot be underestimated,
with many having specifications determined by NHS England against which services are / will
be commissioned.
6.1.2 Adult Intensive Care and High Dependency Units
The majority of the units in LTH have a commissioned patient acuity mix of Level 2 (High
Dependency) and Level 3 (Intensive Care). The current staffing has been benchmarked
against the Intensive Care Society’s suggested Standards 2013 and this has described a
potential gap of 26.34 wte at band 5.
Table 3 : Gap Analysis of Staffing in the Adult ICU & HDU Areas Against the Intensive care
Society Guidance, 2013
Ward Current budgeted
establishment wte
2013 ICS Standards
wte
GAP wte
Band 5
L3 61.5 57.7 -3.8
J54 115.2 139.11 23.91
J81 51.8 54.74 2.94
L6 47.4 49.07 1.67
L8 27.1 27.37 0.27
L4 85.2 86.55 1.35
Agenda item 23.6
27
Totals 388.20 414.54 26.34
6.1.3 Paediatrics
Applying the Royal College of Nursing Skill Mix In Children’s Wards 2012 guidance to the
Paediatric Wards and using associated guidance where required (the Improving Outcomes
Guidance for Children and Young People) the following investment is identified:
• Paediatric Oncology - 7.3 wte
• Paediatric Neurology - 5 wte
• Paediatric Liver, Renal, Gastro – 3 wte
These figures will be verified when the AUKUH Tool for Paediatrics is applied in Q4 of this
financial year.
6.1.4 Maternity
The LTH Board invested £1,300,000 into maternity staffing in 2012, this secured 1:1 care in
labour and improved the safety of care in the ante-natal and delivery stages. The service
makes maximum use of the Maternity Support Worker role in the post natal and community
aspects of the work, however the case loads held by the community midwives (except for
those in the specialist teams for example, the Teenage Pregnancy Team), are far in excess of
the 90-96 / midwife suggested in Birthrate Plus. LTH community midwives carry caseloads of
120 – 140.
The midwifery workforce is paid at band 6, and the costs provided below support this.
LTH has recently been successful in being chosen as a pilot site to work with the Centre for
Workforce Intelligence in the development of an acuity based tool for Maternity Services,
this work will take place in Q4 of this financial year.
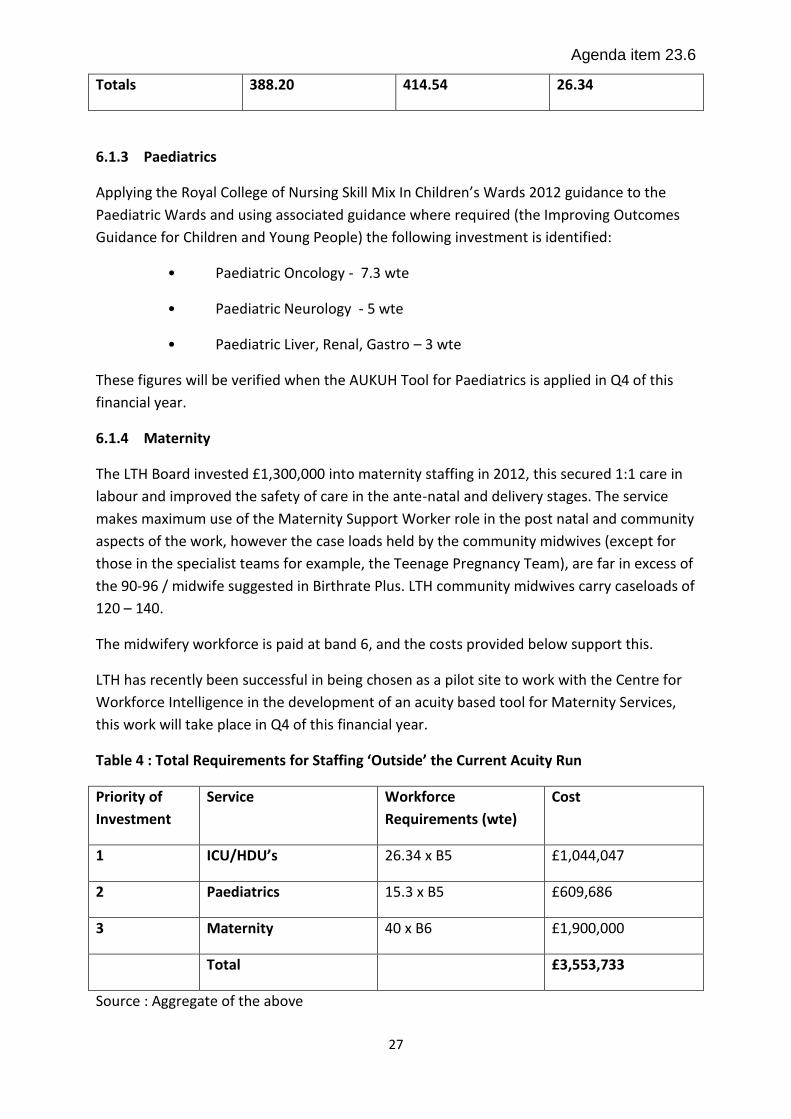
Table 4 : Total Requirements for Staffing ‘Outside’ the Current Acuity Run
Priority of
Investment
Service Workforce
Requirements (wte)
Cost
1 ICU/HDU’s 26.34 x B5 £1,044,047
2 Paediatrics 15.3 x B5 £609,686
3 Maternity 40 x B6 £1,900,000
Total £3,553,733
Source : Aggregate of the above

Agenda item 23.6
28
Appendices 5, 6 & 7 provide the detailed figures of the three models described, and are
shown against the current ward nursing establishments (the shaded areas are those not
included in the review). The difference in wte and funding is then expressed through the
‘gap’ columns.
6.2 Option 1 – Gap £6,996,853
This describes the current funded nursing establishment with the application of the
parameters described on page 23.
6.3 Option 2 – Gap £6,442,837
This describes the findings of the recent AUKUH acuity audit, and has been calculated using
the 2013 multipliers as described below with the addition of 0.4wte Supervisory leadership
time. It is to be noted that in addition to the above cost, costs for those not aligned to the
Safer Staffing tool ie; maternity, childrens’ and intensive care need to be added as described
in table 4.
Where bed occupancy was less than 100% this has been calculated up using the same Level
0, 1a, 1b percentage split that is reflected in the remaining ward beds.
Where ‘like’ wards have marked differences in acuity (despite the quality assurance integral
to the process) an average between the 2 figures has been taken.
Small wards whose acuity figures give a number of staff that would render the ward
unworkable have been allocated the staffing figure from Option 1. With every realignment
of clinical services, the creation of small wards has been avoided wherever possible, and
opportunities to amalgamate or close existing small wards have been taken where clinically
safe to do so.
The registered/ unregistered staff split has been applied as described in above.
Table 2 : AUKUH Multipliers – includes 22% headroom
Acuity/Dependency Level AUKUH Multiplier (Previous) AUKUH Multiplier (2013)
Level 0 0.79 0.99
Level 1a 1.70 1.39
Level 1b 1.86 1.72
Level 2 2.44 1.97
Level 3 6.51 5.96
As can be seen above there is a marked difference in the multipliers at acuity Level 1a and
beyond to those previously used in the 2010 review, this has led to the decrease of staff in
some ward areas, though these are very few in number.
Agenda item 23.6
29
6.4 Option 3 – Gap £14,006,985
This describes :
1 RN : 8 patients, 24/7 for the base wards, with the registered : un-registered split of
60/40 being applied, with an uplift of 22% in line with AUKUH.
Applying the AUKUH findings to the specialist areas : (recognising that specialist
areas are currently resourced at a higher level, the 1:8 ratio has not as yet been
applied to these areas).
The requirement for Paediatrics, Adult Intensive Care / High Dependency areas and
Maternity as described in 6.1.2 – 6.1.4 above.
0.4wte Supervisory leadership time for Ward Leaders
The £500,000 to replace 10% of maternity leave absence, using of a ‘pool’ of staff to
cover the absence, (see section 6.7 for a fuller description).
6.5 Option 4 – Gap £15,506,985
This describes :
All of the above and meets the LTH aspiration of 0.8 wte supervisory leadership time
for the ward leaders, which will assist in maximising the productivity of the improved
staffing, and is described in more detail in section 6.8.
6.6 Option 5 – Gap £20,291,020
This describes :
The provision for all of the above and meets the full requirement of maternity leave
absence support, (see section 6.7 for a fuller description).
6.7 Maternity Leave
It should be noted that the ‘headroom’ associated with all the models above contain no
allowance for maternity leave. This is variably applied across the country with the only
national guidance coming from the Paediatric Intensive Care Society, where a
recommendation of 5% is added to each PICU bed to take into account the loss of staff to
Maternity Leave in a workforce that contains a large number of women of child bearing age.
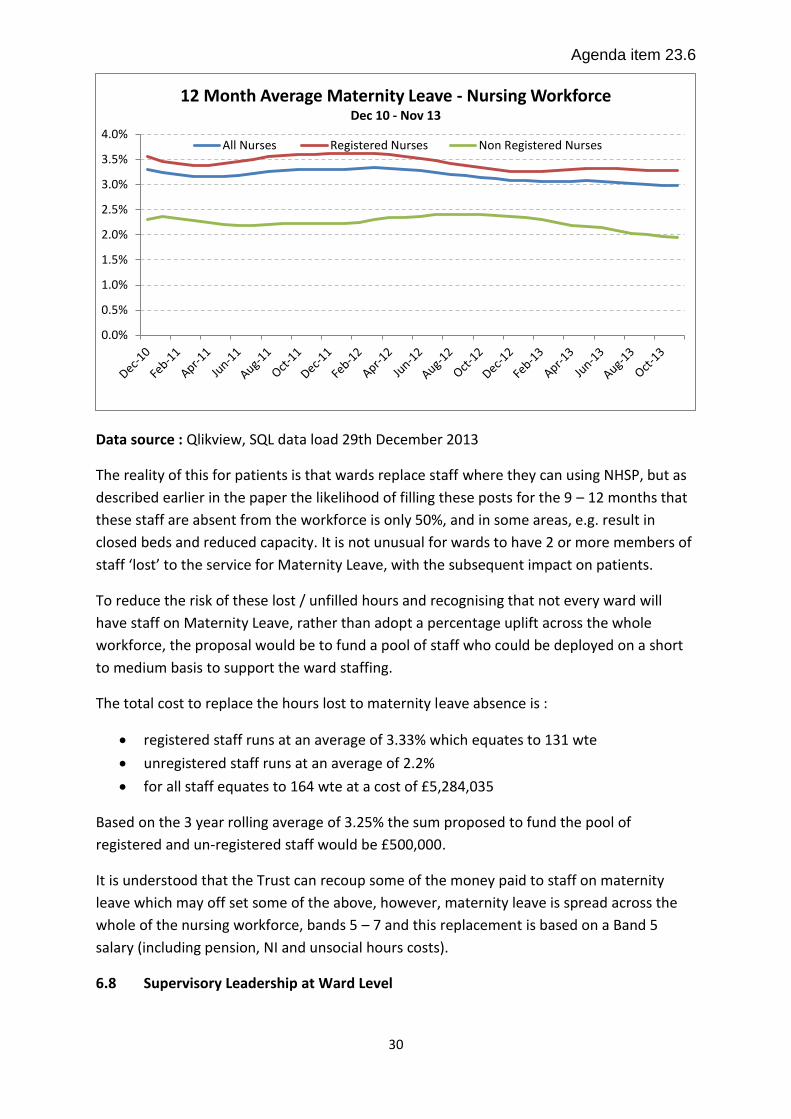
The rolling 3 year average for Maternity leave in LTH is :
Agenda item 23.6
30
Data source : Qlikview, SQL data load 29th December 2013
The reality of this for patients is that wards replace staff where they can using NHSP, but as
described earlier in the paper the likelihood of filling these posts for the 9 – 12 months that
these staff are absent from the workforce is only 50%, and in some areas, e.g. result in
closed beds and reduced capacity. It is not unusual for wards to have 2 or more members of
staff ‘lost’ to the service for Maternity Leave, with the subsequent impact on patients.
To reduce the risk of these lost / unfilled hours and recognising that not every ward will
have staff on Maternity Leave, rather than adopt a percentage uplift across the whole
workforce, the proposal would be to fund a pool of staff who could be deployed on a short
to medium basis to support the ward staffing.
The total cost to replace the hours lost to maternity leave absence is :
registered staff runs at an average of 3.33% which equates to 131 wte
unregistered staff runs at an average of 2.2%
for all staff equates to 164 wte at a cost of £5,284,035
Based on the 3 year rolling average of 3.25% the sum proposed to fund the pool of
registered and un-registered staff would be £500,000.
It is understood that the Trust can recoup some of the money paid to staff on maternity
leave which may off set some of the above, however, maternity leave is spread across the
whole of the nursing workforce, bands 5 – 7 and this replacement is based on a Band 5
salary (including pension, NI and unsocial hours costs).
6.8 Supervisory Leadership at Ward Level
0.0%
0.5%
1.0%
1.5%
2.0%
2.5%
3.0%
3.5%
4.0%
12 Month Average Maternity Leave - Nursing Workforce Dec 10 - Nov 13
All Nurses Registered Nurses Non Registered Nurses

Agenda item 23.6
31
As described earlier in this paper in chapter 2, the recommendation of all the recent
national reviews is for wholly supervisory status for Ward Leaders with a de-minimus of 0.4
wte, but to be truly effective many Trusts are planning 0.8 wte. This paper describes an
allocation of 0.4 wte in 3 of the 5 options.
For every day of Ward Leader supervisory time the cost is £750,000 for LTH based on a
replacement cost at Band 5. For the future, more flexibility can be achieved in replacement
costs when staffing levels are optimised.
To achieve the LTH aspiration of 0.8wte supervisory time for this cohort the cost of
£1,500,000 would be required to be added to each of the figures described in each of the
options above, this will provide supervisory leadership for all ward areas not just those
included in this acuity review.
In order to maintain appropriate levels, Band 7 backfill would be supported via Band 5 nurse
time, without this the registered component of the ward establishments are compromised.
The would require the addition of 48 band 5 nurses to the recruitment figures should this
be progressed.
The benefits of supervisory leadership are well articulated in the recent national reviews
While there is much that can be done to improve leadership at all levels, and to facilitate
staff engagement, that does not involve high cost interventions, it is indisputable that in
order to facilitate the supervisory roles of ward managers within the Trust, current levels of
staffing, and of nurse : patient ratios, need to be addressed. This will hopefully in turn lead
to the beneficial effect on staff engagement, and therefore on patient satisfaction and
improved patient safety and patient outcomes. As outlined in the NHS Employers briefing,
effective relationships between employees and managers can facilitate the transmission of
skills and knowledge to staff, and this will in turn impact upon the quality of care. While this
is not the primary driver for an investment into improved nurse : patient staffing ratios on
the wards, it is undoubtedly an additional anticipated and much welcome outcome of such
an investment.
Effective leadership entails:
• Listening to staff in effective forums and allowing them to not only feel
acknowledged, but part of the decision making process
• Maintaining a balance between the Trust’s overall objectives and vision, and the
wards clinical and staff priorities and being able to justify and substantiate decisions
• Time and resources to enable the development and maintenance of a core of
effective supervisors
• Provision of effective appraisal systems and a meaningful career progression, staff
skill mix and training needs analysis of all staff at all levels

Agenda item 23.6
32
• The effective delegation of appropriate tasks to free up senior management time,
and to develop and engage more junior members of the team, thereby ensure longevity and
ownership
What is also alluded to but not clearly articulated, is that a programme of training and
preparation for Ward Leaders is required if the organisation is to gain the maximum benefit
from this time and the potential efficiencies this can bring. The supervisory role is not
intuitive to all in Ward Leader positions and needs to be planned for.
Agenda item 23.6
33
Chapter 7
Review Recommendations
7.0 Review Recommendations
In considering the evidence based review undertaken it is proposed that investment is made
into the nurse staffing establishments in LTH and that this takes a phased approach based
on the ability to recruit the numbers of both registered and un-registered staff required and
on the need to provide a leadership development programme for the Ward managers/
Team Leaders.
Option 3 would be the proposed model of choice, with the addition of the ‘Maternity Pool’,
therefore a total investment of £14,006,985 is required.
This is based on the growing body of evidence that to provide safe, effective and high
quality care to patients the ratio of RNs to patients should be no less than 1 RN to 8
patients, and the level of care required by our patients should be reflected in the numbers
of nurses available to provide that care..
The areas for investment would be based on an assessment that would include :
Areas where staffing affects the flow of patients through the organisation – ‘pinch
points’
Areas where cancelled operations have a direct correlation to staffing
Areas where full bed compliments may fluctuate due to staffing
Wards that have been staffed as base wards but due to the nature of their patients
should be specialist wards.
Wards that are already in the ‘concerned’ zone
Early indications suggest an investment plan within the following CSUs would be of
maximum benefit to patients:
• Acute Medicine (this includes all the elderly care wards)
• Neurosciences
• Digestive Diseases
• Hepato-Renal
• Trauma and Related Services
• ITU
In support of this, discussions with the LETB will take place to enable the increase of
commissions for future band 4 staff and that this should commence in April 2014, with the
remaining phase starting in April 2015. Complementing the recruitment and HEI planning,
discussions regarding the implementation of supervisory roles will take place, supported in
advance by Ward Manager/ Team Leader development to provide capability tools and clear
expectations of delivery.

Agenda item 23.6
34
Whilst further investment in Maternity services is clearly required, the areas of greatest risk
meet the national requirements. The overarching LTH ratios are 32:1000 births currently
(31.25 births/midwife) versus national guidance of 29.5 births/midwife. Therefore
investment, whilst required, would be recommended to occur later in the plan.
In staging this investment there would also be little benefit from investing minimally in a
large number of wards, which would result in diluted impact that there would be a danger
of little benefit being felt by either patients, families or LTH.
The effect of the increase in staffing on the nurse specific indicators as described in the
Ward and Workforce Health Checks together with productivity measures can then be
monitored for statistically significant improvement prior to future phase rollout and is
described in more detail in Chapter 9.
Supporting investment on this scale will require clear communications and expectations.
This will be supported through a clear scoping and implementation plan and being subject
to discussion at both the Executive Team and Trust Board.

Agenda item 23.6
35
Chapter 8
Limiting factors and Considerations
8.1 Recruitment –General Considerations
This investment and step change is not going to be achieved in one year however, and a
transitional delivery plan over the next 30 months is being planned with a recruitment plan
commencing in January 2014 see appendix 11 .
This will include :
Taking interview panels to local universities, a number have been approached and
are very keen to work with LTH
Open Days for Band 5’s with interview panels, where CSU’s will showcase their
services, these are being planned for regular intervals throughout the year with off-
site accessible venues being sought.
Aiming a recruitment campaign to attract nurses whose registration has lapsed back into
nursing.
8.1 Recruitment – Registered Staff
The information obtained from the staffing review demonstrates a need for an additional 52
- 94 wte registered staff, whilst at the first glance this may appear achievable, this needs to
be considered against the numbers of staff that need to be recruited to replace and
maintain the pace with staff turnover ie: 270 leavers in 2012/3 and year to date (April - Dec
2013) 221 leavers .
Appendix 8 shows the figures month by month.
Source : LTH Electronic Staff Record
-80
-60
-40
-20
0
20
40
60
80
100
120
140
Ap
r-1
2
May
-12
Jun
-12
Jul-
12
Au
g-1
2
Sep
-12
Oct
-12
No
v-1
2
De
c-1
2
Jan
-13
Feb
-13
Mar
-13
Ap
r-1
3
May
-13
Jun
-13
Jul-
13
Au
g-1
3
Sep
-13
Oct
-13
No
v-1
3
Band 5 Nurses Joiners FTE Leavers FTE

Agenda item 23.6
36
During 2012/13, joiners to LTH at Band 5, were 472, with 270 leavers thus the organisation
persistently carried approximately 250 – 300 vacancies at this time on top of the
compromised ‘blueprint’.
8.2 Higher Education Institutions Nurse Training Outturn for 2014
The Higher Education Institutions that LTH most commonly recruit from are; Leeds, York and
Bradford, whilst Huddersfield, Hull and Sheffield also have nurse training cohorts the
majority of their outturn is used in their locality.
The figures displayed in the table below represent the total number of commissioned nurse
training places for the various disciplines for those universities described, within this there
will be approximately a 10% attrition rate.
Of these commissions, we would routinely expect to recruit the following, based on new
starters, reported via Workforce Intelligence data from the Electronic Staff Register:
2011/2012 - 186.4 WTE (extensive vacancy controls in place)
2012/2013 - 462 WTE
2013/YTD - 274 WTE (vacancy controls in place for first 5 months of the year
reflected in YTD figures due to 12 week recruitment pipeline)
Table 6 : Total Commissions and Anticipated Outturn from Universities of Leeds, Leeds
Metropolitan, Bradford, Huddersfield and the Open Univeristy.
NHS Non-Medical: Education Commissions
*Please base on Academic year where possible
*Measure: Headcount
Commission Group Actual 11/12
Actual 12/13
Actual 13/14
Forecast 14/15
Total 1114 1115 1118 1204
Total Nursing 936 939 949 1033
Total Midwifery 178 176 169 171
Of which Adult 585 583 593 659
Of which Children's 103 98 98 107
Of which Mental Health 205 215 215 215
Of which Learning Disability 43 43 43 52
Of which Midwifery Commissions 178 176 169 171
Source: The Local Education & Training Board, 2013

Agenda item 23.6
37
8.3 Recruitment – Un-registered Staff : Bands 1 & 2
The numbers of un-registered staff identified equate to a total of 137 wte unregistered staff.
The pattern of leavers and joiners can be seen in the tables below and in appendix 8.
The recruitment of the un-registered workforce is recognised to be more problematic, with
no HEI pipeline. LTH introduced an apprentice programme which has successfully provided a
training ground and recruitment pool for this section of the workforce. The learning
provider changes in January 2014, with agreed numbers of 300 students over 2 years. Whilst
there could be some movement in these numbers following a discussion with the provider –
Learn Direct, our ward circuit is saturated with learners and the numbers of mentors
required are not available to adequately support a surge in apprentices.

Agenda item 23.6
38
The recruitment of existing band 2 replacement staff continues but cannot be relied on to
provide these numbers of staff, and there is some doubt about whether this number exists
with the required educational underpinning in the ‘market place’.
This would have to be phased across a minimum of two years.
8.4 Recruitment – Un-registered Staff : Band 4 : Assistant Practitioners
The registered to un-registered staff in the Intensive Care and High Dependency Units has
been set at 80:20, however in order to make this a functional skill mix 75% of the un-
registered workforce need to be at band 4. This cohort of staff have a foundation degree
gained over a year through Leeds University and are an existing feature of the workforce in
this area.
The cohort is currently only contracted for 25 per year with a single outturn each
September. There is currently recruitment processes underway for staff at band 4 with the
required qualification, whilst this has yet to come to fruition the anticipation is that the
success will be limited.
It is recognised that fulfilling the current establishment levels or higher would improve the
level of available workforce, continuity of care, and decrease reliance on temporary staffing.
This needs to be taken into consideration for productivity purposes. Any intent to
substantially increase nurse numbers (both locally within LTHT and as a health economy)
will need to be factored into strategic workforce plans as soon as possible, and therefore
feed into the LETB annual planning process.
8.5 Nurse efficiency
The following section is based on the adult in-patient units included in the Ward Workforce
Healthcheck (WWH) document, which incorporates 69 units with a paid FTE of 1,695.6 FTE
(as at end October 2013) and a bed base of 1,542 beds.
8.51 Reducing Absence
The below table shows the relative sickness rate, days lost through sickness absence per FTE
and the cost of time lost through sickness absence for the Trust as a whole and for the adult
in-patient WWH units:
Table 7
LTHT – total
workforce
Wards & Depts
represented in
the WWH
Sickness Absence Rate 4.2% 5.4%
Days lost per FTE 15.4 19.5

Agenda item 23.6
39
Cost of Sickness £14.8m £2.3m
If sickness absence in the adult in-patient WWH units was reduced by 1.2% to the current
Trust average of 4.2% that would release the equivalent of 20 FTE back into the system
(£509k @ £25k/FTE). Savings on temporary staffing may also be realised as vacancies
reduce. Work on supervisory leadership where wards have managers on supervisory time
for 0.8 FTE have demonstrated a reduction in sickness absence of 1% (Compassion in
Practice, 2012).
8.52 Improving Deployment
The implementation of eRostering demonstrates that staff deployment in designated areas
could improve e.g. ICU – current staff unavailability equates to 15% which translates to,
approx. 53 FTE (out of a total staffing of approx. 364 FTE. Reducing actual unavailability to
13% would ‘release’ approximately 5 FTE – equating almost to a staffed bed in ICU.
The multi-factorial nature of rostering nursing staff using the eRostering system means that
there are many potential areas of inefficiency, for example:
• the creation of additional duties
• the use of temporary staffing
• the proportion of time spent on non-direct care
• the impact of poor housekeeping on the management information
generated by the system
Identifying those areas requires a detailed ward level analysis to be carried out by a multi-
professional team (involving HR, Nursing, operational and eRostering subject experts). As
preparation for the migration from version 9.5 to version 10 of eRostering this ‘ward
rostering audit’ is timetabled to be carried out in Q4 2013/14 led by HR. A toolkit to aid this
audit is currently being finalised.
8.6 Alternative Solutions to Recruitment
The solution to bridge the gap by recruiting using the usual means will achieve the required
result but will take a period of time that may be measured in years. Consideration therefore
need to be given to alternative routes that could be taken to compliment the locally sourced
recruits.
8.61 Overseas recruiting
LTH have had a great deal of success in the past with oversea recruiting campaigns,
particularly in the Philippines and has more recently contracted with NHSP, the temporary
staffing provider, to source staff for theatres from Portugal towards the end of last year.
This yielded 7 staff, some of whom have elected to apply for posts within LTH. However, this

Agenda item 23.6
40
is a well plunged pool of staff and many Trusts are recruiting in Portugal and Spain. LTH
could explore the new markets that are opening up in Romania and Bulgaria with NHSP.
A variation on the theme of overseas recruiting is to market LTH to those staff who have
departed to North America and the southern hemisphere on a career break and may be
tempted back to an alternative organisation.
8.62 Increased Banding
One of the options used by a number of Trusts to increase their appeal to staff has been to
offer posts on wards at a higher band, for example to increase the number of band 6 posts
on the wards from the current one position that is the usual number. This can be used as a
short term approach.
8.63 Recruitment and retention premia
A recruitment and retention premia (RRP) can be considered for those working in difficult to
recruit areas or those undertaking a set number of additional shifts in an area. Examples of
this having been applied in other Trusts have been successful in areas of neonatal and A&E
nursing.
RRP: AfC terms and conditions allow for local determination and approval of two types of
RRP payments:
1. Long term for deep-rooted problems 2. Short term for those issues which are expected to improve or disappear in the
foreseeable future.
Retention/loyalty incentive: This would comprise a single payment once someone had completed one full year’s employment on a ward.
Agenda item 23.6
41
Chapter 9
Realising the Investment
9.1 Measuring the Impact of the Investment
Consideration has been given in chapters 2 and 3 about how the evidence to demonstrate
that adequate levels of nurse staffing has the most positive influence overall on patient
outcomes. Kruegar et al 2013, listed the following benefits.
Reduction in failure to respond
Decreased length of stay
Reduced levels of post operative sepsis
Higher numbers of registered numbers reduced the incidence of MRSA
Improved ward staffing prevents re-admission to ICU’s
A positive correlation between staffing levels and in-hospital mortality
Increased appraisal rates
Increased staff support and reduced staff turnover
To determine the return on this investment for patients in LTH, a range of baseline data
based, where it can be achieved on the measures described above, will be taken in January
2014 on the 13/14 year to date activity figures.
Expectations against the above indications are to be developed which will be attributed on a
sliding scale basis from Quarter 4 2014/15. This takes into account the lead time for
recruitment, supply and the critical mass to make an impact.
It is proposed that alternate month measures will be taken across the areas for investment
and these will be tracked through the Ward and Workforce Health Checks all of which the
LTH Board have sight of quarterly.

Agenda item 23.6
42
References P Aalto, L Kare, A Koivisto and M Valimaki (2009) The connection between personnel resources with work loading, and patient satisfaction on in-patient wards Journal of Nursing management Jan 17 (1) (pp135-142) R F Abualrub and M G Alghamdi (2012) The impact of leadership styles on nurses’ satisfaction and intention to stay among Saudi nurses Journal of Nursing Management 20 (pp668-678) AHRQ Agency for Healthcare Research and Quality (2012) Service Delivery Innovation profile - Redesigned inpatient care model increases quality and patient satisfaction, reduces costs and length of stay, October 10, 2012 [Accessed online] http://www.innovations.ahrq.gov/content.aspx?id=3355 Anonymous (2013) Accent on research: Does shift length affect patient outcomes and nurse satisfaction Kentucky Nurse, October, November, December 2013 Association of UK University Hospitals (2009) Patient Care Portfolio. AUKUH acuity/dependency tool: implementation resource pack, London: AUKUK. Tool and related literature are available for download from www.aukuh.org.uk J Ball and G Pike (2009) Past imperfect, future tense: nurses’ employment and morale in 2009, London: RCN D.Berwick, (2013) A promise to learn- a commitment to act: improving the safety of patients in England - Berwick Review into Patient Safety DH publication Aug 6, 2013 (Accessed Online) https://www.gov.uk/government/publication/berwick-review-into-patient-safety D Blakey, M Kroth and J Gregson (2011) The impact of nurse rounding on patient satisfaction in a medical-surgical hospital unit Medsurg Nursing, November-Decmber 2011, Vol 20, No. 6 C Boev (2012) The relationship between nurses’ perception of work environment and patient satisfaction in adult critical care Journal of Nursing Scholarship, 44:4 (pp368-375) Care Quality Commission (2010) NHS staff survey 2009 London: CQC Centre for Workforce Intelligence (2013) Future nursing workforce projections: Starting the discussion (Accessed Online) http://www.cfwi.org.uk/publications/future-nursing-workforce-projections Commissioning Board Chief Nursing Officer & DH Chief Nursing Advisor Compassion in Practice: Nursing, Midwifery & Care Staff- Our Vision & Strategy, Dec 4, 2012 (Accessed Online) http://www.commissioningboard.nhs.uk Department of Health (2009) NHS Health and well-being review – Final report [The Boorman Report], London: DH (Lead reviewer: S Boorman)

Agenda item 23.6
43
L Diya, K Van den Heede, W Sermeus and E Lesaffre (2011) The relationship between in-hospital mortality, readmission into the intensive care nursing unit and/or operating theatre and nurse staffing levels Journal of Advanced Nursing (pp1073-1081) C-A Dubois, D D’Amour, E Tchouaket, S Clarke, M Rivard, R Blais (2013) Associations of patient safety outcomes with models of nursing care organization at unit level in hospitals International Journal for Quality in Health Care, vol 25, number 2, (13 April 2013) (pp 110- 117) R Francis QC (2013) Mid Staffordshire NHS Foundation Trust Public Enquiry Feb 10, 2013 (Accessed Online) http://www.midstaffspublicinquiry.com/report C Garrett (2008)The effect of Nurse Staffing patterns on medical errors and nurse burnout AORN Journal (Vol 87, No 6) (pp1191-1204) J K Gardner, C Thomas-Hawkins, L Fogg and C E Latham (2007) the relationships between nurses’ perceptions of the hemodialysis unit work environment and nurse turnover, patient satisfaction and hospitalisations Nephrology Nursing Journal, May-June 2007. Vol 34, No. 3 (pp271-281) L Hayes, L O’Brien-Pallas, C Duffield, J Shamian, J Buchan, F Hughes, H Spence Laschinger, N North, P Stone Nurse turnover: A literature review International Journal of Nursing Studies 43 (2006) 237-263 House of Commons Health Committee (2009) Patient safety: Care Quality Commission, Monitor, and Professor - Sir Ian Kennedy’s responses to the committee’s sixth report of session 2008-09, London: TSO S Hugonett, I Uckay and D Pittet (2007) Staffing level: a determinant of late-onset ventilator-associated pneumonia Critical care, 2007, 11:R80 R Kane, T A Shamliyan, C Mueller, S Duval and T Wilt (2007) The Association of Registered Nurse Staffing Levels and Patient Outcomes: systematic review and metaanalysis, Medical Care, 45(12), pp. 1195-1204 Prof Sir B Keogh KBE (2013) Review into the quality of care and treatment provided by 14 hospital trusts in England: overview report July 16 2013, (Accessed Online) http://www.nhs.uk/NHSEngland/bruce-keogh-review/Documents/outcomes/keogh-review-final-report.pdf B M Kooker and C Kamikawa (2010) Successful strategies to improve RN retention and patient outcomes in a large medical centre in Hawaii Journal of Clinical Nursing, 20 (pp34-39) L Knudson (2013) Nurse staffing levels linked to patient outcomes, nurse retention AORN Connections, Vol 97 No.1 (C1-C9) L Krueger, C Funk, J Greene and K Kuznar (2013) Nurse-related variables associated with patient outcomes: A review of the literature 2006-2012

Agenda item 23.6
44
Teaching and Learning in Nursing 8, (pp120-127) L-F Liu, S lee, P-F Chia, S-C Chi, Y-C Yin (2012) Exploring the association between nurse workload and nurse-sensitive patient safety outcome indicators Journal of Nursing Research 20 (4) (pp300-309) L McGillis Hall and E Buch (2009) Skill mix decision making for nursing International Centre for Human Resources in Nursing, Geneva: ICN National Patient Safety Agency (2009) Quarterly data summary issue 13; learning from reporting – staffing – how do staffing issues impact on patient safety London: NPSA. Available at www.nris.npsa.nhs.uk. NHS Employers (2009) Briefing 68: Improving staff engagement: a practical toolkit (Accessed Online) available at http://www.nhsemployers.org/Aboutus/Publications/Documents/Improving_staff_engagement-Briefing_68.PDF NHS Health Act (1999) (Accessed Online) http://www.legislation.gov.uk/ukpga/1999/8/pdfs/ukpga_19990008_en.pdf NHS Institute for Innovation and Improvement (2009) High impact actions for nursing and midwifery Resources available for download at http://www.institute.nhs.uk N North, W Leung, T Ashton, E Rasmussen, F Hughes, M Finlayson (2013) Nurse turnover in New Zealand: costs and relationships with staffing practises and patient outcomes Journal of Nursing Management Apr 21 (3) (pp419-28) Nursing and Midwifery Council (2008) The code: standards of conduct, performance and ethics for nurses and midwives, London: NMC A M Rafferty, S P Clarke, J Coles, J Ball, P James, M McKee and L H Aiken (2007) Outcomes of variation in hospital nurse staffing in English hospitals: cross-sectional analysis of survey data and discharge records International Journal of Nursing Studies, 44(2) (pp175-182) G H Raup (2008) The impact of ED Nurse Manager leadership style on staff nurse turnover and patient satisfaction in academic health center hospitals Journal of Emergency Nursing 34:5, (pp403-409). J Robert, S K Fridkin, H M Blumberg, B Anderson, N White, S M Ray, J Chan and W R Jarvis (2000) The influence of the composition of nursing staff on primary bloodstream infection rates in a surgical intensive care unit Infection Control and Hospital Epidemiology 21 (1) (pp12-17) C M Rochefort and S P Clarke (2010) Nurses’ work environments, care rationing, job outcomes, and quality of care on neonatal units Journal of Advanced Nursing Royal College of Nursing (2009) Breaking down barriers, driving up standards. The role of the ward sister and charge nurse. London: RCN

Agenda item 23.6
45
Royal College of Nursing (2010), Guidance on safe staffing levels in the UK S Shortell, J Zimmerman, D Rousseau, R Gillies, D Wagner, E Draper, W Knaus, J Duffy (1994) The performance of Intensive Care Units: Does good management make a difference? Medical care, Vol 32, No.5 (May 1994) (pp508-525) L M S Tejero (2011) The mediating role of the nurse-patient dyad bonding in bringing about patient satisfaction Journal of Advanced Nursing (pp994-1002) A M Tomey (2009) Nursing leadership and management effects work environments Journal of Nursing Management, 17 (pp15-25) K Van den Heede, S Simoens, L Diya, E Lesaffre, A Vleugels and QW Sermeus (2010) Increasing staffing levels in Belgian cardiac surgery centres: a cost-effective patient safety intervention Journal of Advanced Nursing (pp1291-1296) G R Whitman, Y Kim, LJ Davidson, GA Wolf and S Wang (2002) The impact of staffing levels on patient outcomes across speciality units Journal of Nursing Administration 32 (12) (pp633-639) L-M You, L H Aiken, D M Sloane, K Liu, G-p He, Y Hu, X-l Jiang, X-h Li, X-m Li, H-p Liu, S-m Shang, A Kutney-Lee and Walter Sermeus (2013) Hospital nursing, care quality, and patient satisfaction: cross-sectional surveys of nurses and patients in hospitals in China and Europe International Journal of Nursing Studies 50 (pp154-161)

Agenda item 23.6
46
Appendix 1 - See Excel Document
Appendix 2 - See Excel Document
Appendix 5 - See Excel document
Appendix 6 - See Excel Document
Appendix 7 - See Excel Document
Appendix 10 - See Excel Document
Appendix 11 - See Excel Document

Agenda item 23.6
47
Appendix 3

Agenda item 23.6
48
Appendix 4
12 MONTH AVERAGE TURNOVER AUGUST 2013Division or CSU All Registered Nurses Band 5 Nurses Band 2 CSW
Acute Medicine CSU 14.3% 16.2% 16.7%
Cardio-Respiratory CSU 14.1% 16.9% 5.5%
Corporate Services 6.2% 5.0% 38.8%
Adult Critical Care CSU 7.0% 7.9% 23.3%
Chapel Allerton CSU 5.3% 6.4% 7.0%
Childrens CSU 12.4% 13.6% 8.8%
Radiology CSU 6.0% 8.9% -
Outpatients CSU 6.4% 4.2% 9.4%
Digestive Diseases CSU 10.4% 12.0% 6.8%
Pathology CSU - - -
Institute of Neurosciences CSU 17.5% 23.4% 10.3%
E&F - - 12.1%
Institute for Oncology/Leeds Cancer Centre CSU 9.7% 13.4% 5.0%
Urgent Care CSU 13.4% 18.1% 12.0%
Leeds Dental Institute CSU - - 54.5%
Adult Theatres & Anaesthesia CSU 5.8% 5.1% 5.3%
Hepatorenal CSU 6.8% 7.6% 14.2%
Trauma and Related Services CSU 13.1% 14.2% 18.3%
Head Neck & Ophthalmology CSU 6.1% 8.7% 11.5%
Womens CSU 7.3% 7.0% 8.3%
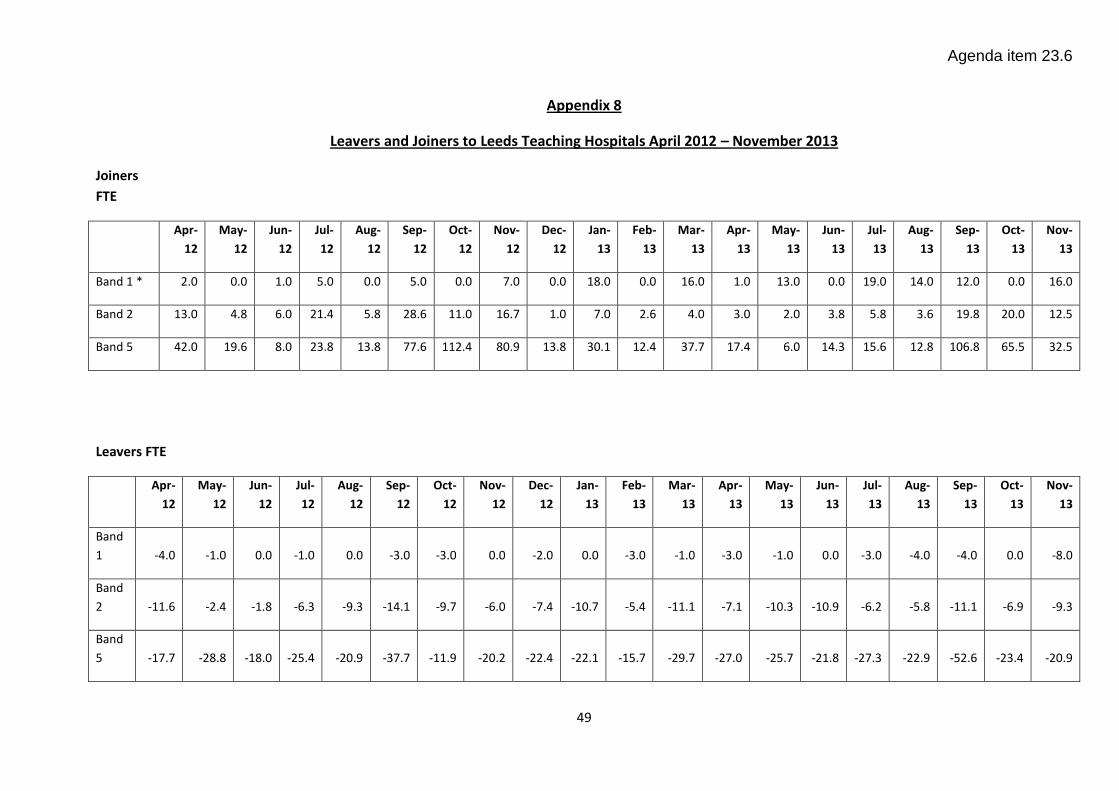
Agenda item 23.6
49
Appendix 8
Leavers and Joiners to Leeds Teaching Hospitals April 2012 – November 2013
Joiners
FTE
Apr-
12
May-
12
Jun-
12
Jul-
12
Aug-
12
Sep-
12
Oct-
12
Nov-
12
Dec-
12
Jan-
13
Feb-
13
Mar-
13
Apr-
13
May-
13
Jun-
13
Jul-
13
Aug-
13
Sep-
13
Oct-
13
Nov-
13
Band 1 * 2.0 0.0 1.0 5.0 0.0 5.0 0.0 7.0 0.0 18.0 0.0 16.0 1.0 13.0 0.0 19.0 14.0 12.0 0.0 16.0
Band 2 13.0 4.8 6.0 21.4 5.8 28.6 11.0 16.7 1.0 7.0 2.6 4.0 3.0 2.0 3.8 5.8 3.6 19.8 20.0 12.5
Band 5 42.0 19.6 8.0 23.8 13.8 77.6 112.4 80.9 13.8 30.1 12.4 37.7 17.4 6.0 14.3 15.6 12.8 106.8 65.5 32.5
Leavers FTE
Apr-
12
May-
12
Jun-
12
Jul-
12
Aug-
12
Sep-
12
Oct-
12
Nov-
12
Dec-
12
Jan-
13
Feb-
13
Mar-
13
Apr-
13
May-
13
Jun-
13
Jul-
13
Aug-
13
Sep-
13
Oct-
13
Nov-
13
Band
1 -4.0 -1.0 0.0 -1.0 0.0 -3.0 -3.0 0.0 -2.0 0.0 -3.0 -1.0 -3.0 -1.0 0.0 -3.0 -4.0 -4.0 0.0 -8.0
Band
2 -11.6 -2.4 -1.8 -6.3 -9.3 -14.1 -9.7 -6.0 -7.4 -10.7 -5.4 -11.1 -7.1 -10.3 -10.9 -6.2 -5.8 -11.1 -6.9 -9.3
Band
5 -17.7 -28.8 -18.0 -25.4 -20.9 -37.7 -11.9 -20.2 -22.4 -22.1 -15.7 -29.7 -27.0 -25.7 -21.8 -27.3 -22.9 -52.6 -23.4 -20.9

Agenda item 23.6
50
Source : Electronic Staff Record LTH
* Note : The flow of Band 1 staff into the organisation is dictated by the start dates of the Apprentice training programmes

Agenda item 23.6
51
Appendix 9 Registered Nurse Training Commissions by University
University
Commissions
Actual Intake 11\12 12\13 13\14 14\15
11\12 12\13 13\14
LMU Total Nursing & Midwifery 45 81 81 81 44 82 94
Total Nursing 45 81 81 81 44 82 94
Adult 22 46 46 46
17 45 60
Children's n/a n/a n/a n/a n/a n/a n/a
Mental Health 23 35 35 35
27 37 34
Learning Disability n/a n/a n/a n/a n/a n/a n/a
Midwifery
Uni of Bradford Total Nursing & Midwifery 236 228 221 230 239 228 216
Total Nursing 183 175 175 184 186 175 170
Adult 126 118 118 124
132 119 113
Children's 21 21 21 24
23 22 21
Mental Health n/a n/a n/a n/a
n/a n/a n/a
Learning Disability n/a n/a n/a n/a
n/a n/a n/a
Midwifery 53 53 46 46 53 53 46
Huddersfield Uni Total Nursing & Midwifery 235 235 235 266 234 234 234
Total Nursing 192 192 192 223 191 191 191
Adult 100 100 100 125 98 100 100
Children's 21 21 21 24
22 21 21
Mental Health 46 46 46 46
46 45 46
Learning Disability 25 25 25 28
25 25 24
Midwifery 43 43 43 43 43 43 43
Uni of Leeds Total Nursing & Midwifery 352 318 328 328 349 294 316
Total Nursing 287 258 268 268 284 230 259
Adult 192 170 180 180
192 155 179
Children's 50 45 45 45
49 41 39

Agenda item 23.6
52
n/a : LTH would not
recruit staff with this
qualification or course
not run at this
institution
Mental Health 45 43 43 43
43 34 41
Learning Disability n/a n/a n/a n/a
n/a n/a n/a
Midwifery 65 60 60 60 65 64 57
York Uni Total Nursing & Midwifery 201 208 208 249 209 213 0
Total Nursing 184 188 188 227 189 193 0
Adult 115 119 119 149
120 124 0
Children's 11 11 11 14
11 11 0
Mental Health 40 40 40 40
40 40 0
Learning Disability 18 18 18 24
18 18 0
Midwifery 17 20 20 22 20 20 0
Open Uni Total Nursing & Midwifery 45 45 45 50 45 45 45
Total Nursing 45 45 45 50 45 45 45
Adult 30 30 30 35
30 30 31
Children's n/a n/a n/a n/a
n/a n/a n/a
Mental Health 15 15 15 15
15 15 14
Learning Disability n/a n/a n/a n/a
n/a n/a n/a
Midwifery