delta scuti stars - university of texas at austin
TRANSCRIPT

1973A&A....23..221B
Astron. & Astrophys. 23, 221- 240 (1973)
Delta Scuti Stars A. Baglin+, M. Breger*, C. Chevalierx, B. Hauck0 , J.M. le Contel+, J.P. Sareyanv and J.C. Valtier+ Observatoire de Nice+, University of Texas at Austin*, Observatoire de Meudon, Department d'Astrophysique Fondamentalex, Institut d'Astronomie de l'Universite de Lausanne et Observatoire de Geneve0 , Observatoire de ParisV, Departement de Photometrie
Received August 28, 1972
Summary. The extensive observational and theoretical data on b Scuti variables (published and previously unpublished) are collected and analyzed. Properties of pulsation are discussed, and relationships between b Scuti stars and other types of pulsators and nonvariable stars are established.
1. Introduction
b Scuti variables are short-period pulsators situated in the extension of the cepheid instability strip, which crosses the main-sequence between A2 V and FO V. Pulsation periods are between 34 minutes and 5 hours. The amplitudes in light and radial velocity are generally very small: a few hundredths of a magnitude and about 10 km s-1 respectively. In addition beats are often observed. The variables discovered so far lie either on the main-sequence or in a band up to three magnitudes above. We suggest the following definition of ab Scuti variable: a b Scuti variable is a pulsating star which (i) is situated in the cepheid instability strip (or its extension) and (ii) has a pulsation period less than one day. In practice, this means a Population I short-period pulsator of spectral type A or F. b Scuti stars are therefore the younger analogs to the RR Lyrae stars and have many characteristics similar to the AI Vel stars. The first mention of the b Scuti variables was made by Wright (1900) who announced the radial velocity of the star b Set as variable. Better observations required an improvement of photographic plates. It was only around 1935 that Colacevich (1935) and Fath (1935) made their relatively accurate simultaneous radial velocity and photometric measurements of (j Set. They determined a period and placed the star in the f3 Canis Majoris variable star group. Further investigations made in the following years suggested that b Set resembled the cepheids rather than the (hotter) /3 Canis Majoris variables. Walker (1953) and Lindblad and Eggen (1953) discovered the stars DQ Cep and CC And to be variable. In an important development, Eggen (1956) found the variability of l! Pup and (j Del and pointed out the existence of a separate type
Key words: b Scuti stars - cepheid variables - shortperiod pulsators
of variable stars. At the time the b Scuti variable group had five members. Only after 1965 were numerous discoveries of b Scuti variables made. This is due to the fact that the small amplitudes of most variables require modem photoelectljc techniques. Several systematic searches for more (j Scuti variables have been made by Danziger and Dickens (1967), Millis (1967b), J0rgensen et al. (1971) and Breger (1966, 1969a, 1972a, b). In Fig. 1, a typical light curve in the V filter is shown. The observations were made with the Lick 24-inch reflector. The variability and .period were confirmed on subsequent nights. At present, more than 70 b Scuti variables are known and a thousand more should be within reach of a small telescope. With the numerous recent developments in the study of these stars we thought it necessary to review the subject and to give reliable basic data for future investigations. (j Scuti variables are also of relevance to other fields of Astronomy, and an attempt has been made to point out these directions.
My+ Const. HR 6290 -0.010
0.000
+0.010 (Moy 22,1969)
U.T. 02.00 03.00 04.00 05.00 06.00 07.00
Fig. 1. Light curve of the variable H.R. 6290 in the V filter obtained at the Lick 24 inch reflector by M.B.
© European Southern Observatory • Provided by the NASA Astrophysics Data System
1973A&A....23..221B
222 A. Baglin et al.
2. Variability Measurements
Observations of c5 Scuti variables have been undertaken with three main aims: to establish which stars are variable, to determine the amplitude and period of variations and to study beat phenomena. The amplitudes of variation are generally near the limit of detection, and even can be almost zero at certain epochs when beats exist. So, long observational sequences on the same object are needed, if possible, on several consecutive nights. For example HR 5005 has been observed as constant by Valtier (1971) during 4.5 hours but was discovered precedingly by Danziger and Dickens (1967) with a period of 3 hours. The brightness or radial velocity variability of these stars appears most promising to measure, but changes in surface gravity and shapes of line profiles also may be looked for. The best possible instrumentation, weather conditions as well as observing and reduction techniques are required.
2.1. Photometry
Light amplitudes under 0.05 magnitudes have to be detected; this rules out classical photographic technics. Photoelectrically, both D.C. and pulse-counting techniques have been employed successfully. Differential star-star methods are required. Unfortunately, most observers have not described their observing techniques and in the case of a few controversial variables, critical evaluation by other astronomers may be impossible. We would like to list some of the problems to be guarded against and possible ways to solve them: (i) Photomultiplier memory, fatigue and instability. This is always present to some degree. Then, stability has to be insured on HT sources (Lallemand, 1962), filters and P.M. temperatures (Young, 1967) terrestrial magnetic field' (Rufener, 1966). P.M. memory and fatigue effect are minimized by keeping a constant voltage between the cathod and the first three dynodes, and varying the voltage on the following stages (Sareyan and Ischi, 1972). In each case, it is better observing the stars in the same manner as well as using two comparison stars. (ii) One has to be careful of obtaining a proper Fabry (field lens) action and stable position on the photocathod to avoid errors due to movements of the image of the stars inside the diaphragm and to different sensitivities of different parts of the photocathod. (This is easier to obtain on P.M. in which the photocathod is perpendicular to the incident flux: e.g. Lallemand, EMI. ... ) (iii) Atmospheric changes such as thin undetected clouds, variable extinction coefficients and transparency changes. If the atmospheric changes are slower than the time needed to complete one observing cycle of two comparison and one variable stars, then the
differential reduction method should correct for these effects, assuming their linearity in time. (iv) Filter width and color-dependent extinction coefficients. Since the comparison stars are likely to have different colors from the variable star, in wideband filters the effective wavelengths may differ. These effective wavelengths are extinction-dependent. This may be a problem during nights of variable extinction and at large hour angles. So it is more interesting to work with narrow-band filters. For bright stars under these circumstances, an intermediate-band photometric system such as the uvby system may be appropriate. However, the width and the wavelengths of the filters depend also on the purpose of the observations (detection, or measure of physical parameters such as T,,). (v) The chromatic variation of the photomultiplier response is a related problem. The photomultiplier should be kept at a constant temperature (Young, 1963). If the Johnson V filter and a 1 P 21 photomultiplier tube is used, then the long wavelength cutoff is given by the tube and quite variable. In the differential reduction mode, again these effects should cancel out if the comparison stars have the same color. In the method proposed by Sareyan and Ischi (1972) the chromatic effect and the fatigue of the P.M. are reduced. (vi) Spurious signal. In the pulse-counting mode weaker pulses are not counted and extrinsic spurious pulses may be detected by sudden count increases. This important problem may be overcome by eliminating the sources of such pulses. Shielding of the cold box is desirable and it may be necessary to have a preamplifier inside the shielded system. In the D.C. mode similar problems are present, but may be more difficult to detect. (vii) Photon Statistics. This excludes fainter objects. (viii) Seeing and background changes. A relatively large diaphragm should be used to measure all the light from the star and to avoid the small light losses when the seeing disk increases in size. A diaphragm size of 20" or larger is recommended. This, however, also increases the sky contribution. If this sky contribution is significant, it has to be monitored very carefully. (ix) Outputs. It is important to have the possibility of knowing the seeing conditions at any time. An analog output system is necessary. It permits also a rapid estimate of the quantity of information needed to get a given precision. Young (1968) has shown that with a counting system the necessary information is obtained more rapidly. In addition reductions are more rapid and personal errors are avoided. (x) Pulsational amplitudes are usually larger at shorter wavelengths where one might expect them to be easily detectable. On the other hand, the atmosphere appears to be_ more stable in the visual region. The blue or
© European Southern Observatory • Provided by the NASA Astrophysics Data System

1973A&A....23..221B
Delta Scuti Stars 223
visible region appears to be a good compromise for detection in one filter. (xi) Choice of comparison stars. In the differential technique, most sources of error cancel out when two or more comparison stars are used. Without two comparison stars, it is very difficult with small amplitudes to determine with certainty which star is variable and whether the variability is intrinsic. In this respect we note that the variability of several ~ Scuti variables was discovered by accident when these stars were used as comparison stars for other variables. The comparison stars should be of similar brightness and color to the variable star (to avoid non linear systematic effects and to get the same signal to noise ratio). <?ther stars in the instability strip appear ideal, but their constancy has to be confirmed first. Comparison stars just outside the instability strip are even more suitable. Proximity in the sky ( < 2°) is extremely important in this work to correct for small atmospheric changes. This is primarily the reason for the increased work on small amplitudes in stellar clusters. One of us ·(M.B.) observes two comparison stars (Ci. C2) and one program star (V) in successive cycles C1VC2C1VC2 • If the period of the variable is less than one hour shorter cycles C1 VC2 VC1 etc. are chosen.
2.2. Spectroscopic Measurements
The amplitudes in radial velocity of ~ Scuti variables generally lie in the range of 2-30kms- 1. Most of them are less than 10 km s- 1. High dispersion spectra are therefore required. The observational limit is then the length of exposure time compared to the pulsation period. It is difficult to combine radial velocities obtained during several different nights because of possible beat phenomena and the difficulty of determining a period In order to obtain a reliable velocity curve, the exposure time may not be more than 10--20% of the pulsation period. In the case of a twohour variable, exposure times must then be around ten minutes or less. This limitation suggests the use of an image intensifying device. These at the present time may not give the required accuracy of about 1 kms- 1. A very promising new technique to measure stellar radial velocities and their variability, is the use of a photoelectric radial velocity spectrometer, where the spectrum does not have to be recorded (Griffin, 1967). This technique matches the stellar spectrum with a recorded spectrum on a diaphragm and the best wavelength shifts can be determined photoelectrically. At present, the radial velocity measurements are better than 1 km s - 1. This precision and application to fai~ter stars makes the spectrometer technique very smtable for work on small-amplitude variables.
2.3. Spectrophotometric Measurements
It is desirable to determine the variations of effective temperature and surface gravity during a pulsation cycle, since these can be directly compared with theoretical calculations. In the past, a conversion to these par~eters from the conventional filter systems has been difficult. It was therefore important to measure the changes in the energy distribution as a function of wavelength directly (with ·a seanner) and to compare these with model atmospheres after correcting for lineblocking. Various spectrophotometric scanners allow flux measurements at discrete wavelengths from 3200 to 11 OO? A. Such measurements, unfortunately, are less precise than filter photometry, and a reasonable limit for well-detectable variability appears to be LI T.; ,..., 100° K and LI log g,..., 0.1. This limits the application to only a few stars with large amplitudes such as ~Set, ~Del and l! Pup. We would like to mention the extensive work by Bessel (1969a), Danziger and Kuhi (1966), Kuhl and Danziger (1967), Breger and Kuhl (1970) and Dickens and Penny (1971). The variations in temperature and gravity of a fourth variable are shown in Fig. 2 and were taken from an (unpublished) program of simultaneous photometry, spectrophotometry and sp~ctroscopy at Lick Observatory by Breger et al. It must be emphasized that the fitting of a model to observed fluxes is usually a two-parameter fit for these stars ('I;,, logg) and that consequently spectrophotometry yields :QO more information than work with carefully chosen intermediate-band filters. For variables with smaller amplitudes, the variations in T,. and logg can be determined with carefully chosen intermediate-band filters. For unreddened stars the Balmer jump and slope of the Paschen continuum ~eeds to be measured. An ideal system appears to be the Stromgren-Crawford uvbyp system (Stromgren, 1966). A direct conversion from Ci. (b- y) in that system to logg, T,. is available (Breger and Bregman, 1972). Other intermediate-band photometric systems have also been applied.
log g 3.55
3.50
3.45 Aug 29, 1967 U.T.
04.00 05.00 06.00 oaoo
Fig. 2 Variations of effective temperature and gravity of HR 7331 obtained at Lick Observatory by Breger, Kuhi and Hutchins '
© European Southern Observatory • Provided by the NASA Astrophysics Data System
1973A&A....23..221B
224 A Baglin et al.
2.4. Detection
Due to the observational conditions, detection of light variations or velocity variations raise completely different problems.
(i) Light Variations
Only one filter is needed. Due to the fact that amplitudes seem to be always larger in the blue region, a blue filter should be more advisable. The sequence proposed by M.B. (see 2.1) can be used:
Each observation consists of 9 ten-second integrations. The sky background is measured in the middle of each observatiOn if it exceeds 5 % of the stellar signal and/or if different amplification gains are used for the different stars. Otherwise, the sky is monitored less frequently. Magnitudes are plotted against time and the two comparison stars superposed. A mean comparison star curve is drawn which is then subtracted from the variable. Differential extinction corrections are then applied (if necessary). These correction.s are usually only a few thousandths of a magnitude: mean extinction coefficients for that observing run may be sufficient. They give a check of the photometric conditions and then of the obtainable precision.
It is generally not advisable to compare magnitude differences obtained on different telescopes or taken at different photomultiplier voltages. For highest accuracy, only measurements taken during the same night should be analyzed. However, if it is required to intercompare measurements taken at different voltages, one has to be careful about the P.M. characteristics. For detection of very low amplitudes, differential light measurements should be accurate to at least 0.002 mag. This precision is obtainable now.
When measurements are done in more than one filter (for example when the uvby system is used for classification or T.. variations) a balance has to be done between a given precision to be reached on the S/N ratio and the number of observational points over a short period. In that case a single comparison star may be suitable if its constancy has been checked over a long time.
In the same way, several other promising observational approaches exist. Bijaoui at Observatoire de Haute Provence is using a Lallemand camera to detect variables in faint galactic clusters. While the precision is still insufficient to detect amplitudes of the order of 0.01 mag, larger amplitudes of a large number of stars should be detectable. Hudson et al:(1911) have successfully used an automatic monitoring telescope to observe 14 Aur. Finally, simultaneous observations of two stars should further decrease atmospheric and instrumental errors. One such system already in operation is the dual beam photometer described by McCord (1968).
(ii) Radial Velocity Variations
The detection of variations are limited by the short exposure times necessary to observe the short period variations. It is possible to get spectra over several different nights, but in such a case a poor period is generally determined. Anderson and Kraft (1972) have shown that the radial velocity of a sharplined star can be measured to a precision of better than 0.25 km s- 1, which may well represent the practical limit for b Scuti work as well. For more broad-lined stars, the uncertainty in the velocity measurement increases. Abt and Smith (1969) found the following external probable errors for their new optics and measurements with the Grant radial velocity measuring engine: 1-2kms- 1 at13.5Amm- 1
and 3 km s - 1 at 39 A nim - 1. At even lower dispersion (62Amm- 1) Gray (1971) finds an error of 4kms- 1•
This was confirmed by Jones and Haslaw (1966) and Jones (1971) who found new short period variables, using a dispersion of 29 A/mm at Hy on a 6th magnitude star. Some bright stars (for example ix Aql) can be considered as possible b Scuti candidates. In the list of non binary stars which radial vel9city measurements spread over more .than 2kms- 1 given by Abt (1965), 5 over 23 stars have been confirmed to be b Scuti later: HR 21, 1611, 3888, 5329, 5960.
(iii) Conclusions
The brightest stars are more easily detectable through spectroscopic observations (Jones and Haslaw, 1966). The faint stars should be detected photometrically. The faintest objects can be detected using larger telescopes or turning to new techniques. Observations as rapid as possible are needed. This leads to try to realize the following conditions: - rapid manual or automatic monitoring telescope (Hudson et al., 1971), - simultaneous observation of the star and the comparison, - reduction of the time of measurement of the sky background.
2.5. Period Determination
The short periods of b Scuti variables generally exclude the use of observations spaced several nights apart. Only after an initial period has been obtained, can spaced observations be used to improve the period. Several methods have been adopted: (i) For the majority of variables with periods less than three hours, several cycles are available. The period can then be deduced by fitting the times of maximum, minimum or half-way up or down the light curve. The only problem arises when secondary bumps are present in the light curve. These bumps may be observational errors and a good policy may be to dismiss bumps of
© European Southern Observatory • Provided by the NASA Astrophysics Data System

1973A&A....23..221B
Delta Scuti Stars 225
heights less than a few u, where u is the accuracy of observation. Real bumps may be due to a secondary period or just variable amplitudes. Subsequent observations of several variables have shown that many large bumps are actually real maxima and that an accurate period, fitting all the data, can only be obtained if this bump represents a new pulsation cycle. Fortunately, most light curves appear to be free from large beats and bumps. (ii) Autocorrelation analyses and Fourier transforms are very useful if a large set of equally-spaced measurements is available. An extended description of the method has been given by Wehlau and Leung (1964). The method is precise and gives all the periods present in the sequence of observations. One then has to be very careful about the meaning of the smallest amplitude modes. This method has also been used by Fitch (1970). (iii) Valtier (1972) has redetermined the periods of most known b Scuti stars by using a method based on the mean quadratic approximation of a function by a trigonometric polynomial. The advantage of this method is that it can be used when the data set is small and irregularly spaced, but is only precise when the light curves are sinusoidal (which is not always the case). Detection of variability can be made through that method, comparing the mean quadratic deviation from a straight line and a sine curve. If a sine curve gives a smaller deviation the star has a good probability to be variable. But it is necessary to have a great number of observational points. The periods of most b Scuti stars are not well determined because of insufficient data. We estimate that the period of the average variable is only known to ± 10 %.
3. Properties of Pulsation
3 .1. Amplitudes
A list of known b Scuti variables is given in Table 1 together with relevant stellar properties. A summary of variability in galactic clusters has been given by Breger (1972b). More references to individual observations can also be found in the collection by Seeds and Yanchak (1972). The amplitudes of variation are generally small. During pulsation both the temperature and stellar radius vary, and the light, color and radial velocity are all variable. The radial velocity variations are not as well known as the light variations, since a high:-dispersion coude spectrograph and a large telescope are usually required to obtain accurate radial velocities. The observed relations between visual and velocity amplitude are shown in Fig. 3 together with similar relations for other types of variables. More data on blue amplitudes of AI Vel (dwarf cepheid) stars can be found in the paper by Leung (1970). Figure 3 shows
1.0
' •
0.5
' A
•
'
•
0
' '
• •
• • •• •
• • • •
•
0
0 AV km/s
50 100
Fig. 3. Amplitude of radial velocities versus amplitude of light for D Scuti stars and other classes of variables. For the o Scuti stars amplitudes are taken from: D Set: Paddock and Struve (1954), Leung and Wehlau (1967), D Del, I! Pup: Danziger and Dickens (1967), CC Andr: Walker, Wilson, Merle (1956~ DQ Cep: Fitch and Wehlau (1965), 4 CV n: Wachmann (1966). + 28 And, + o Set, "V DQ Cep, • 4 Cvn, x 14 Aur, * o Del, /::,,, CC And, e Al Vel, D I! Pup, o p CMa, Y Classical Cepheids, • RR Lyrae
that the amplitude ratios of b Scuti variables are similar to those of other cepheid-like variables, but differ from those of the p CMa variables (whose periods and amplitudes are very similar to those of b Scuti stars). Light amplitudes as a function of wavelength are known only for a few stars. The B amplitude is always larger than the Vamplitude, and consequently the variables are bluer at maximum light. In l! Pup, Thulassi Doss (1970) found amplitudes of 0.17, 0.14, 0.12, 0.09 mag at 3858, 4310, 4720, 5875 A, while in HR 1170, Breger (1968) measured amplitudes of 0.12, 0.13, 0.11, 0.09 mag at 3400, 4100, 4700 and 5500A. What is the typical amplitude of a b Scuti variable? Different answers are found for different surveys, which correlate with accuracy of measurements. To obtain a statistically unbiased sample, we restrict ourselves to one observer with the largest sample of stars. In Fig. 4 we show the frequency-amplitude distribution taken from the surveys by Breger. The stars for which no variability has been established are plotted in the interval 0.000 < Av < 0.010 mag. This graph very strongly suggests an exponential distribution of amplitudes, so that most (but not all, see later) of the nonvariables may in fact vary with an undetectable amplitude. Increasing accuracy of measurement then also dramatically increases the number of variables detected.
© European Southern Observatory • Provided by the NASA Astrophysics Data System

1973A&A....23..221B
226 A. Baglin et al.
70 % s
60
50
40
30
20
10
0
rs
I-z <t I-Ill z 0 (.J
N (nuniber Of stars 90
50
20
10 Amplitude (ma )
QOS QOS 0.10 O
Fig. 4. Histogram of the amplitudes of known variables. Unshaded area: stars for which no variability could be established, lying in the "instability strip"
It is n_ow possible to reconcile the 30% variability found m the Northern hemisphere with that of 10% recently found by J0rgensen et al. (1971) in the Southern hemisphere. The frequency-amplitude distribution shows that only 10% of the variables have amplitudes in excess of 0.02 mag. The precision of measurement and analysis quoted by J0rgensen et al. ~hould fmd the variables near 0.02 mag or higher, 1.e. about 10 %. Amplitudes may vary in size from cycle to cycle. Such variatjons generally are less than a factor of two, but may make a star appear constant. We would like to list some extreme examples: unpublished measurements of 29 v UMa by Chevalier et al. (1969) show the constancy with 0.01 mag during two hours while on other nights the star was definitely variable with a detectable amplitude of 0.04 mag and a period of 3.2 ~ours. HR 5005 was found constant according to Valtier (1971), but variable according to Danziger and Dickens (1967). HR 8880 was observed constant to 0.001 mag (Breger, 1969a), while definite variations ~ere detected by Millis and Thompson (1970). Another important example is the Am star HR 5491. It was reported to be variable by Bessel and Eggen (1972) but later on, photometric observation by Breger et al. (1972) show no evidence of light variability. More observational studies on a few selected stars are required. Chevalier (1971) concluded from theoretical calculations that all A stars of normal Population I composition should always be variable (except for Am stars; Baglin, 1972). · The light a~d radial velocity curves are not in phase. The analysis by Danziger (1967) indicates that maximum light occurs between 0.25 and 0.00 periods before minimum radial velocity. Chevalier et al. (1968) get the same result for 14 Aur. Up to now, it has never been possible to obtain reliable variations of physical parameters like for example radius or effective temperature except for a few large; amplitude variables for example Q Pup (Thulassi-Doss 1~~ '
3.2. Periods
Periods range from 34 minutes to five hours. The diffic~lty in obtaining precise periods has already been mentioned. The present gap in our knowledge of accurate single and multiple periods is serious. The data shows that (on the whole) the giants have longer periods than the dwarfs. This is not surprising. For a given mass and a given mode, the period of radial pulsation increases as the radius of the model star increases. This effect may be masked if the mode of pulsation changes as the star evolves i.e. if more evolved stars pulsate in higher harmonics. There might be also a change of mode with mass for stars in the same stage of evolution (for example main-sequence stars) hotter stars could pulsate in higher harmonics. That is why one cannot even expect a P-L-T,, relation necessarily exists. On the other hand, L and T,, are not observable quantities. The directly observed quantities are P, and for example c1 and (b- y). The uncertainties involved into the transformations c1 __,, L and (b- y) __,, T,, are not the ~ame for dwarfs, sub-giants and giants, the calibration becoming poorer for more evolved stars. Therefore if a P-ci-(b- y) relation can be found it is diflicult to derive a meaningful relation P-L-r.,.' It is ~till more doubtful to interpret it theoretically (taking mto account the observational uncertainties in P and the range of permitted chemical compositions for the models). Breger and Bregman (1972) have considered the uncertainties in each of the three quantities period, color and absolute magnitude in a least-squares analysis. Such a statistical method and an improved absolute magnitude calculation lead them to correlations between Mv, P and b - y. They indicate a difference in ~values between the hot and cool variables (a possible Jump near (b - y) = 0.145). An unusual form of the observed period-color-luminosity relation is given in Fig. 5. This figure is based on the
0.30 ,---,--.------r--.----,---~--Period (days)
0.20
0.10
0.05
0 0 .02 t.c;( by)
0.00 0.10 0.20 0.30 Fig. 5. Relation between Period and LI c1 (see Section 3.2). 0 (b - y) < 0.145, (B - V) < 0.250; e (b - y) > 0.145, (B- V) > 0.250
© European Southern Observatory • Provided by the NASA Astrophysics Data System
1973A&A....23..221B
Table!
NUMBER
01
02
o ..
05
06
01
08
09
10
11
12
13
14
15
16
17
18
19
20
21
22
23
24
25
26
28
29
30
31
HD 8-Y
HR Ml
000 .. 32 OOZl +0.216 +0.177
002628 0114 +0.169 +0.165
004919 0242
006870
008511 0401 +o.124 +0.205
009065 0431
009100 0432 +0.090 +0.166
009133
010845 0515 +0.158 +0.173
015550 0729 -t0.155 +0.185
017093 0812 +3.135 +0.188
023156
023567
023607
023643
023728 1170 +0.179 +0.154
024550
024809 1223 <t0.125 +0.185
024832 1225 +o.152 +0.190
026322 1287 +D.215 +0.175
02651" 1298 +o.197 +D.192
027397 1351 +0.110 +0.198
027't59 1356 +0.126 +o. 20s
030780 1547 +0.122 +0.207
032045 1611 +0.166 +D.172
032846 1653
033959 1706 +o.uo +0.180
040312 2100 +o.116 +O. 218
040535 2101 +0.153 +0.197
050018 2539 +o.240 +0.186
055057 2701 +De 184 +0.187
First line, successive columns.
Delta Scuti Stars
NAME Cl
BETA CAS +o. 1as
28 AND +0.869
RHO PHE
CLUSTER SP TYPE BETA DMI
F21V -0.015
AM +0.014
DF2
v DCl
MY PERIOD VSINI PARALLAX
+2.30 +l.55 +0.164- 072
+5.20 +1.53 +0.14-1 022
+5.22
0.104 +0.072
0.068 -o.ouz 0.110 -0.001
A5111 +7e57 +1.50 130
o.o6s
44 CET +0.829 +2.786
97 PSC +l.093 +2.817
+o. 979 +2. 111
26 ARI +0.839 +2. 777
38 ARI +0.837 +2.B04
TR51
TR359
TR390
TRUO
+0.826 +2.743
+0.825 +Z.803
+0.870
44 TAU +D. 752 +2. 708
38 ERi +o. 789 +z. 730
57 TAU VB30 +o. 110 +z. 767
58 TAU V833 +0.868 +2.812
FOY +o.ooo
FOIV
A41V +0.020
FD
A7N +0.002
A9V +0.006
A71Y +0.013
A7V
A9V
AlV
A3V
FD +0.024
ABN
A8V +0.020
FD -o.ooo
F21V -0.009
F211 -0.020
FOIV -0.009
A9V -0.008
97 TAU V8123 OA5 +0.900 +2.813 -0.009
64 ERi FOIV +1.003 +2. 754 -0.004
14 AUR +0.998 +2. 799
59 ORI +0.952
l MON +O. 888 +2. 740
59 AUR +0. 764 +2. 702
21 MON +0.878
F21V
A91V +0.006
A5
F21V -0.010
ATN -0.013
A8N -0.011
+6.ZO +Z.51 +0.011 200
+6.SB
+5. 90 +0.52 +0.217 110
+a.as
+6.40 +0.69 +0.229 080
+6.10 +1.97 +0.083 150
+5.20 +2.33 +0.041 083
+a.so
+a.28
+9.10
+a.10
+2.32 066
+2.4-3 091
+Z.37 010
+s.ao +1.74 +0.118 100
+7.60 100
+6.50 +2.54 +0.009 160
+6.20 +1.73 +0.108 150
+5.40 +l.87 +0.128
+4.00 +1.85 +0.111 098
+5.59 +Z.40 +G.044 109
+s.20 +z.14 +0.054 065
+s.10 +1.89 +0.079 141
+It. 80 +0.38 +0.269 186
+6.33 +1.50
+5.10 +D.94 +0.192 033
+6.01 +l.34 070
+6.30 +1.55 +0.121 025
+6.00 +1.33 +o. 21s 130
+5. 50 +1.19 +0.180 121
0.010
0.090
0.131
0.045
0.163
0.080
0.031 +o.024
0.024
0.032
0.031
0.095 +0.022
0.076
0.052
0.160
0.080 +0.028
0.054
0.042 +0.009
+0.015
0.135
o.oa1 +0.007
0.060
0.139
0.110 +0.020
AMP u
0.030 -34.89
0.035 +0.69
015 -72.51
0.020
0.030
0.020 -zs.12
0.035
0.012 -2+.26
0.026 -26.45
0.014 -1.22
0.010 -12.83
0.015
0.010 -10.35
0.030 -10.11
o.oaz +13.98
O.D!iO
0.010 -0.4-1
0.040
0.010 -14.72
0.020 -14.55
0.030 -44.46
-38.46
0.012 -39.00
+27.50
0.130 -18.53
0.080 +10.51
-38.38
0.140 -16.39
+o.01
0.060 -25.10
-1.94
-lB.30
-76.1>7
-18.75
-11.1a
-25.07
-25.26
-3.70
-7.93
+1.61
-18.86
-16. 78
-16.58
-21.20
+4.80
-22.44
-9.79
+0.87
-16. 75
-6.83
+6.12
-0.58
+10.38
-10.89
0.97
-12.09
-s.11
-12.41
+6.95
-0.59
-16.03
-1.90
-2.83
-2.28
+8.99
+7.20
-2.69
-8.04
+2.56
+3.33
-7.47
REFERENCE REMARKS
+23
+24
+21
+15
+ZO
+10
+04
+10
+04
+04
+24
+36
+36
+36
+36
+04
+ll
+04
+20
+08
+20
+03
+05
+25
+20
+18
SB+09
58+37
+08
+09
+14
227
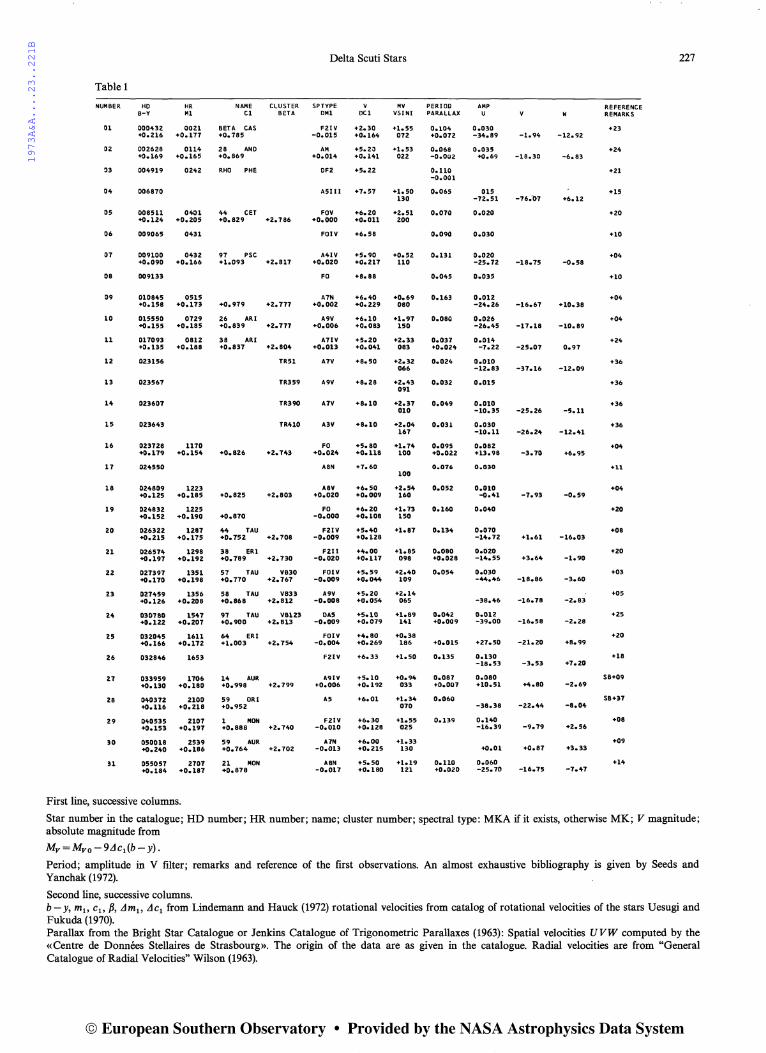
Star number in the catalogue; HD number; HR number; name; cluster number; spectral type: MKA if it exists, otherwise MK; V magnitude; absolute magnitude from
Mv=Mv 0 -9Llc1(b-y).
Period; amplitude in V filter; remarks and reference of the first observations. An almost exhaustive bibliography is given by Seeds and Yanchak (1972).
Second line, successive columns. b - y, mi. Ci. /J, LI mi. LI c1 from Lindemann and Hauck (1972) rotational velocities from catalog of rotational velocities of the stars Uesugi and Fukuda (1970). Parallax from the Bright Star Catalogue or Jenkins Catalogue of Trigonometric Parallaxes (1963): Spatial velocities UVW computed by the «Centre de Donnees Stellaires de Strasbourg». The origin of the data are as given in the catalogue. Radial velocities are from "General Catalogue of Radial Velocities" Wilson (1963).
© European Southern Observatory • Provided by the NASA Astrophysics Data System

1973A&A....23..221B
228
Table 1 (continued)
NUMBER
J2
33
34
35
36
38
39
40
u
4'>
45
46
48
'9
50
51
52
53
55
56
57
58
59
60
61
62
63
64
65
66
67
6B
69
70
71
HD 8-Y
HR Ml
062437 2989 +0.112 +0.202
067523 3185 +0.258 +0.211
069997 3265 +0.196 +0.230
073175 +0.131 +0.213
073450 +D.149 +0.197
073575 +0.153 +0.180
073576 -tO. lOlt +0.199
073729 +D.198 +0.172
073763 +0.130 +D.189
073798 +O.l'tl +0.213
074028 +0.120 +o. 201
on050 +0.115 +0.197
077140 3588
08'>999 3888 +0.196 +D.162
100363
106384
107131 4684 +o.099 +0.196
107904 4715 +o.226 +0.178
115308 5005 +0.200 +0.166
115604 5017 +o.180 +0.231
116994
124675 5329 +0.115 +0.165
137422 5735 +0.057 +0.121
138917 5788
140436 5849 -0.010 +0.173
143466 5960 +D.178 +0.188
152830 6290 +D.208 +0.190
155514 6391 +0.124 +o. 200
160613 6581 +o.047 +0.166
170625
172748 7020 +0.192 +0.206
174553
177392 7222 +D.206 +0.168
181333 7331 +0.164 +0.184
181577 7340 +0.129 +0.188
186357 7501 +o. 222 +0.188
186786 7524
187764 7563 +0.1ao +0.167
197461 7928 +o.191 +0.162
199124 8006 +0.111 +0.184
A. Baglin et al.
NAME Cl
CLUSTER SP TYPE v DCl
MV PERIOD BETA DMl VSINI PARALLAX
FD +6e30 +1.02 +1.006 +2.811t -0.012 +0.174
RHO PUP FSII +2. 78 +1.28 +0.734 +2.718 -0.040 +0.236 014
F3111 +6.30 +le89 +0.786 +2.753 -0.057 +0.112 025
KW45 FOY +8.26 +2e19 +D.858 +2.790 -0.013 +0.054 162
KW154 A9V +8e50 +2e47 +o. 793 +z. 110 +0.002 +o.ozs 132
38 CNC KW204 FOlll +6e66 +Oe59 +0.995 +2. 778 -0.003 +0.235 158
KW207 A7V +7e67 +l.42 +0.969 +2.a12 -0.003 +0.121 210
KW292 F..ZV +S.19 +l.65 +0.809 +2.742 -0.003 +0.139 168
KW323 A9V +7.BO +1.82 +o. 900 +Z. 796 +0.001 +o. 094 130
KW340 FOY +8.4-8 +2.37 +0.809 +2.764 -0.015 +0.037 166
KW445 A9V +l. 96 +1. 81 +0.911 +2.812 -0.004 +0.088 180
KW-4-4-9 A9 +7. 91 +1. 53 +0.947 +Z.812 -0.002 +0.119 142
90 VEL
NU UHA +o. 830 +2. 130
TR60 +0.946 +2.834
4 CVN +O. 833 +Z.107
+0.824 +2.720
20 CVN +D.913 +2. 780
KAPPA 800 +1.026
GAMMA UM! +l.379 +2. 758
DELTA SER
GAMMA CR8 +1.008 +2.877
+o. 776 +z. 761
+o. 123 +2. 109
63 HER +0.897 +2. 798
0 SER +1.115
DELTA SCUTI +0.824 +2. 741
+o. 892 +2. 749
28 AQL +o. 990 +2. 796
RHO SGR +0.955
+0.761 +2. 727
+0.865
DELTA DEL +0.853 +2. 739
+O.BlO +2.760
FOIII +5.17 +0.75 059
FDIV +0.006
F2V
DF3
+3.80 +l.50 +0.156 104
+8.64 +1.tJS
+6.57 +l.05
AllVV +6.48 +1.71 +0.003 +o. 088 115
F31V +5.90 +0.95 -0.003 +0.242 085
FllV +o.ooo
+6. 50 +l.48 +0.158 060
F31II +4.70 +0.94 -0.063 +o. 201 011
A5
A81V +0.022
A311
FOIV
AlV
FDIV -0.005
F2 -0.018
ABV -0.002
A2V
A5
+a.10
+4.54 +0.82 +0.198 126
+3.03 171
+4.23 080
+3.86 112
+5.00 +2.Zl +0.066 140
+6.0tJ +Z.25 +0.078 020
+6.20 +1.90 +0.079 190
+4.20 125
+8. 74 +a.as
F3111 +lt.60 +1.61 -0.035 +0.142 032
F8111 +tJ.30
F2 -0.012
FD -0.014
FOIY +0.003
FD -0.012
+6.50 +0.76 +0.241 150
+5.30 +0.53 +0.252 059
+3.90 +l.34 +0.147 074
+6.45 +1.67 +0.158 100
FDllI +6.04 +1.20
FOllI +6.2tJ +1.37 110
FOIV +0.007
FD +o.ooo
+4.44 +1.36 +0.169 041
+6.60 +2.03 +0.086 200
0.094
0.141 +0.031
0.097
o.03a
0.051
0.110
o.on
0.074
0.031
0.012
0.053
0.058
0.065 +o.ou1
0.132 +0.036
0.055
0.010
0.055
0.139
0.121
0.135 +0.014
0.102
0.066 +0.014
0.143 -0.005
0.134 +0.015
0.030 +0.026
0.063 +0.019
0.100
0.011
0.053 +D.003
o.oaa
0.194 +0.020
o.1so
o.09e
0.150 +0.002
0.050 +0.035
o.oaa
0.080
0.100
0.153 +o.ooa
0.068
AMP u
0.060 -16.99
0.100 -28.40
0.040 -34.31
-37.73
-31.81
-13.53
-38.35
0.015 -36.75
0.050 -50.32
0.022 113.99
0.025 -71.87
0.020 +3.72
0.140 -31.26
0.040
0.035 -26.61
0.250
0.030 +16.34
0.050
0.040
o.050
0.020 -26.59
+6.33
0.010
0.025
0.290 -41.66
0.120
0.035 +10.10
0.060 -2.62
0.020 +1.eo
0.016 -35.14
0.011 -86.53
o.03s -3.26
0.050 +12.a1
0.020
-10.10
-38.05
-26.50
-19.34
+1.75
-19.09
-5.84
-13.31
-92.85
+19.76
-B.37
-11. 79
-12.10
+4.50
-is.ea
-4.49
+1.91
-17.89
+0.90
+6.80
+1.95
-10.20
-32.78
-U.69
+2.48
-21. 72
-0.46
-1.99
-5.26
-10.23
-0.56
-9.28
-29.0D
+0.38
-12.10
+4.21
-52.21
+37.40
-0.32
-1.aa
+9.28
-19.32
+6.43
-14.18
+4.19
-0.32
-11.oa
+0.98
+4.32
-13.50
-19.60
-5.16
-4.65
REFERENCE REMARKS
+26
+13
+21
+05
+05
+05
+05
+05
+05
+05
+05
+05
+15
+OB
+12
+12
+06
+19
+09
+29
+31
+23
+01
+24
SB+16
+0'>
+37
+04
SB+25
•12
+07
+17
+04
+04
+25
+04
+12
+04
SB+13
+04
© European Southern Observatory • Provided by the NASA Astrophysics Data System

1973A&A....23..221B
Delta Scuti Stars 229
Table 1 (continued)
NUMBER HD HR NAME CLUSTER SP TYPE v 8-Y Ml Cl BETA DMl DCl
72 199908 DQ CEP FllV +7.25 +Ool79 +0.028 +0.844 +2. 739 +0.148 +0.136
73 211336 8494 EPSI CEP FDIV +4.20 +Ool69 +0.192 +o. 1a1 +2.757 -O.OOlt +0.059
n 213534 8584 A8V +6.30 <t0.118 +0.193 +0.959 +2.821 +o.ooo +0.134-
75 220061 8880 TAU PEG A5V +4.60 +Ool04 +0.166 +1.013 +0.025 +0.165
76 cc AND F31V +8.60
77 A8 CAS A3 +9.36
78 N02 A7111 +9.66
79 W20 F2111 10.21
80 NGC7789 57_3
fact that the lines of constant period are approximately parallel to the main-sequence. The variables have been separated into two color groups to correct for residual temperature effects and the possible color-dependent modes of pulsation. Three stars with very discrepant (b - y) and (b - y)0 colors were omitted. CrawfordStromgren uvbyp photometry (Crawford, 1970) is available for a very large number of stars (Lindemann and Hauck, 1972). In this system c1(by) is the excess in the c1 index relative to the main-sequence (a luminosity indicator) using (b - y) or (b- y)0 as a temperature indicator. The expected period can easily be read off the graph. It may be desirable for an observer to predict an approximate period, and Fig. 5 may be helpful.
4. General Characteristics
4.1. Position in the H.R. Diagram
~ Senti variables have spectral types between A 2 and F 5 with luminosity classes V to II. Most ~ Scuti stars show normal spectra, while a few (mainly giants) show abnormal metal lines. Recently, Morgan and Abt (1972) have established a revised classification system, the MK.A system. They defined new criteria of classification and a new network of standard stars for F stars of luminosity classes II to IV. This system has been applied to 14 ~ Senti stars. Several photometric systems can be applied to place ~ Senti stars in the H.R. diagram, e.g. the StromgrenCrawf ord uvbyp system and that of the Geneva Observatory. The parameters and applications to A and F stars have been described in papers by Stromgren (1963, 1966), Crawford (1970) for uvby P photometry and Hauck (1968) for the Geneva system. We note that in all photometric systems the absolute magnitude determination is actually a log g determination (Breger und Kuhl, 1970). It is therefore necessary to be sure that the obtained values in Mv are in good agreement with those obtained by independent methods such as
MY PERIOD AMP REFERENCE
VSINl PARALLAX u v REMARKS
+l.58 0.079 0.080 +28 060
+2.27 0.042 0.020 +02 086 +0.039 -43.00 -10.66 -23.90
+1.39 0.056 o.ou 58+04 032 +23.18 +l.16 -1.u
+1.02 0.055 0.015 +32 162 +0.034 -6.31 +9.32 -13.59
+l.90 0.124 o.zso +22 020
+2.20 o.osa 0.050 +33
-0.20 0.110 0.010 +35
+0.40 0.006 +35
+l.50 0.160 0.010 +34
trigonometric parallaxes, cluster membership etc. This comparison has been successfully made by Breger (1969a), Leung (1970), Hauck (1971), Dickens and Penny (1971) and Breger and Bregman (1972). Historically, the absolute magnitude determinations of ~ Scuti variables are made in the uvbyf:J system with the relationship given by Stromgren (1966)
Mv= 1.6+ 7.5(2.946-p)-11.0Llc1 . (1)
However, for stars in the upper part of the mainsequence the absolute magnitudes may be too bright and the derived absolute magnitudes of all cluster stars only seem accurate to ±0.4 mag. A newer calibration was announced by Crawford (1970)
Mv = Mv(ZAMS)- 8LI c1 (p). (2)
Since p is not available for many stars, a calibration using (b - y) rather than p as a temperature indicator was given by Breger and Bregman (1972)
Mv = Mv(ZAMS) - 9 LI c1 (b- y). (3)
Cluster stars fit to ±0.25 mag in the latter calibrations. However, it is difficult to calibrate, for the spectral types considered here, the photometric methods to obtain the absolute magnitude of giant stars, because few of these stars have a well determinated distance. In the case of the o Scuti stars, the possible errors for the absolute magnitude can be 0.3 mag for the nearest of the main-sequence and 0.5 mag for the most luminous (Chevalier, 1971). It may be desirable to plot a H.R. diagram using theoretical indices. For main-sequence stars a standard (b- y), T,, or (B - V), T,, calibration (e.g. Matsushima, 1969) can be used. However, these relatio~ cannot be extended to giants (see Baylac, 1972), and the giants may be cooler by about 200°. The calibration of Breger 8.I!d Bregman (1972) includes gravity effects, and a conversion from (b- y), c1 to T,,, logg was computed from a set of ATLAS model atmospheres after correcting for filter transmissions, photomultiplier responses and line-blocking. Another useful temperature
© European Southern Observatory • Provided by the NASA Astrophysics Data System

1973A&A....23..221B
230 A. Baglin et al.
indicator is the (V - I) index in the UBJtRI system, which was applied by Dickens and Penny (1971). The direct determination of logg and T,, from spectral scans has already been discussed in Section 2.3. The (j Scuti variables lie in the main-sequence band or lower Hertzsprung gap. Observed absolute magnitudes range from 2.7 to 0. Figure 6 shows the position of known variable stars in the color-magnitude diagram. The known nonvariable stars tested by Breger are also shown for comparison. It is possible to draw the following conclusions: (1) A cool border exists ranging from F 0 V to F 5 III (or b-y = 0.19 and 0.26 respectively). No cooler variables have been detected. (11) A hot border is found ranging from A 2 V to A 3 III (or b- y = 0.075 and 0.09 respectively). A few hotter stars show some variability of presently unknown nature and periods. (111) The probability of a star situated inside the instability strip having a detectable light variability of0.01 mag or larger is 30% (Breger, 1969b, 1970). This figure seems to be independent of luminosity. The largeamplitude variables, however, are usually giants. Leung (1970) suggested that the (j Scuti variables are not randomly distributed in the H.R. diagram, but lie in two well-defined boxes containing short and longperiod pulsators respectively. Most nonvariables would be outside the boxes. Chevalier (1971), however, found some discrepancies in his calculated indices. The existence of such boxes critically depends on the distributions of both nonvariable and variable stars. These distributions at this stage do not appear different to any statistically significant degree. The new cluster data also shows that variables and nonvariables have similar magnitudes and colors. It is therefore not surprising that the instability boxes are not visible in Fig. 6. We do note, however, the high incidence of variability in the middle of the instability strip near A 7 IV or Mv = 1.5 and (b-y)=0.18.
0.0 My x
xx
x x x
x 1.0 x
x • x p
2.0 x !!
A2V
3D
0.05 0.10
. .,,· (•) x x
x
0.15
x
x
• x •
x
x
x x x x x xx x ~
0.20
x
x x
x
x
0.25
Fig. 6. H.R. diagram for all known variable (dots) and nonvariables (crosses) stars with known uvby photometry and fainter than Mv = 0.0.
4.2. Spatial Velocities, Groups and Binaries
The U, V, W space velocities of (j Scuti variables cannot be separated from the velocities of the nonvariable A and F stars of Population I (Breger, 1969a; Eggen, 1970). The variables are also found in a large number of galactic clusters and moving groups. (j Scuti variables have been detected in clusters of a wide range of ages such as NGC 2264 (pre-main-sequence), Pleiades, Hyades, Praesepe and Coma (Breger, 1969a, 1970, 1972a, b, c; Millis, 1967b) and the old cluster NGC 7789 (Danziger, 1971) as well as in old disk population groups like~ Her or a Pup (Eggen, 1970, 1971). If these Eggen moving groups are real, this leads to the conclusion that the incidence of pulsation is probably not related to age or population. Several (j Scuti variables are well known binaries. A list is given in Table 2. The detection of the binary motion is difficult for pulsating stars, since the radial velocity also varies due to pulsation. An excellent method to detect small velocity changes due to binary motion is to study the average radial velocity during a pulsation cycle, i.e. the variation of the y-veloci!Y· It may, however, still be difficult to detect any bmary amplitudes less than 10 km s- 1 in this manner. The percentage of binaries among (j Scuti stars is low (less than 30%) and probably similar to the percentage of binaries among the normal A and F stars. The binary frequency of the variables does, however, differ dramatically from that of the metallic-line A stars, which are nearly all in short-period binary systems. This difference may not be surprising (see 6.1). Three out of the five binaries in Table 2 have short orbital periods, smaller than 4 days. Abt (1965) showed that the binary systems among normal A stars (as opposed to Am stars) have long orbital periods. However, more recent results (Abt and Hudson, 1971) show that the connection between unusual abundances and short period binaries is not absolute and that several short-period A type binaries show normal spectra. At this stage the evidence points against a connection between pulsation and binary characteristics. So that, the present data leads little support to suggestions linking pulsation to tidal interactions. However, the companion may affect the pulsational amplitude. An
Table 2. Binaries among /j Scuti stars
H.R.No. Name SpT V.,sini p
km/s
1706 14Aur A9V 33 3.789d 5849 yCrb A1V 112 91y 6581 o Ser A2V 125 7928 oDel FOIV 41 8584 TWLac A8V 32 2.341d
The /j Scuti nature of HR 5849 and HR 6581 still need to be confirmed.
© European Southern Observatory • Provided by the NASA Astrophysics Data System

1973A&A....23..221B
Delta Scuti Stars 231
excellent system, where this effect needs to be studied in more detail, is 14 Aur (Hudson et al., 1971; Chevalier et al., 1968). More systematic observations of binary characteristics of o Scuti variables are definitely needed. HD 24550 may be a good candidate for radial velocity measurements (Dickens, 1967).
4.3. Abundances
The question of abundances is important in several respects: to determine the population membership of o Scuti stars and to find how the variables differ from the nonvariables and the Am stars. However, it is certainly one of the most contested field in astrophysics. We feel that it is not time here to enter the dispute but we want to express our feeling that the grounds are not so strongly rooted as it could be thought. We will now report results based all on the usual theory of abundance analysis generally done differentially relative to stars of similar temperatures and gravities, preferably using model atmosphere techniques. Photometrically, unusual abundances in A and F stars can be detected through the m1 index of the uvby{:J system (Stromgren, 1966). An A dwarf with a high m1
index is very often a metallic-line star (Milton and Conti, 1968). However, for giants and sub-giants the astrophysical meaning of the m1 index is less clear. Indeed, according to Hauck (1971), late A giants with normal abundances may show an abnormal m1 index. In Fig. 7 we have plotted the metallicity index of the o Scuti variables. For the few reddened stars in our sample (i.e. in the Pleiades cluster), the natural indices were unreddened in the standard manner. Only 4 stars show a large m1 index relative to the Hyades line. None of these stars is on the main-sequence. This is an important result since in the instability strip, 30 % of the dwarfs are Am stars. We interpret the diagram to indicate that most (or all) variables have normal or near-normal abundances.
0.23 m, 50170 03265
oao 0.22 0
• .o •
0.20
•
0.18
0 0 0 • 0.16 0
0
0 (b-y)
0.050 0.100 0.150 0.200 0.250
Fig. 7. Metallicity index as a function of (b - y) for known {> Scuti stars. e Main-sequence, O above Main-sequence
Eggen (1971) and Hessell and Eggen (1972) reported that most o Scuti variables in the Hyades group have high m1 indices. The apparent difference between the Hyades group and the Hyades/Praesepe clusters may not be real and caused by selection effects and the small samples. Only a few abundance analyses have been made and none of a variable dwarf. Figure 8 gives the location of the analysed variables in the H.R. diagram. The results
2
yBoo IC
14Aur IC
6Del IC
/ Main-sequence
pPup IC
6Sct IC
Fig. 8. Location of variables with detailed abundance analysis in the H.R. diagram ·
(N]
x
+0.5
O.O Normal
-0.5
Am
Fig. 9. Abundances, relative to standards, of {> Scuti stars compared to normal and Am stars. f>. {> Del, O (l Pup, \I {>Set, x 20 CVn (above 0). Crosses below the 0 correspond to 28 And
© European Southern Observatory • Provided by the NASA Astrophysics Data System
1973A&A....23..221B
232 A. Baglin et al.
are shown in Fig. 9, where the "average" Am stars has been taken from the review paper by Conti (1970).
28 And (HR 114) has a normal solar abundance (Smith, 1971). 20 CVn (HR 5017) is somewhat metal-rich, and Dickens et al. (1971) relate this to the membership in the Hyades group. Their results and the m1 index may also be compatible with a small overabundance of metals (including Ca and Sc, which are usually deficient in Am stars). Similar results were also found for l! Pup and o Set by Breger (1970) who reanalyzed Bessel's (1969a) extensive data with model atmospheres techniques. Another star with a high m1 index may be unusual: Smith (private communication) informs that the spectrum of HR 3265 is neither normal or similar to that of an Am star, but shows strong Sc and an especially strong Y 11 4309 line.
Another variable giant, o Dei may be unusual. The star has been recognized for a long time to have a weak Ca K line for its temperature (see 6.1). The low Ca/Fe ratio is confirmed by abundance analyses and the metals in o Del may be deficient by a factor of 2 (Reimers, 1969; Breger, 1970). Bidelman (1966) has defined a new spectral type using o Del as a prototype. Cowley et al. (1969) list 8 stars in the o Del group. Theo Scuti variable 14 Aur, also belongs to this list. However, Morgan and Abt (1972) do not indicate any weakening of the Ca 11 line for 14 Aur, but they give a revised spectral type of A 9 IV instead of A 9 V. Chevalier also studying the spectra of 14 Aur taken at a dispersion of 10 A/mm was unable to find any evidence of unusual abundances in the spectra of 14 Aur; but the relative strength of the lines of ionized metals indicates that the star has evolved off the main-sequence. Considering these results as well as the poor knowledge of the abundances in the "normal" A giants, it is impossible to say at this stage whether some variables are associated with slight anomalies. The recent spectral classifications by Morgan and Abt (1972) and especially their listed peculiarities do not correlate with the photometric m1 indices. It is hoped that a program of abundance analyses of A and F giants (including o Scuti, o Dei Am and normal stars) presently undertaken by Terrile et al., will answer some of these questions. The variability of the star has a small amplitude so that through a period the physical parameters of the atmosphere do not vary too much. However, the velocity field, of the order of 5 km/s, is never introduced in the model. Some authors have analysed spectra exposed through the whole period, so that one may think that they are looking at an average atmosphere similar to a stable one; others are less careful. Then, are the results reliable and comparable to those on stable stars? As atmospheric models introducing the coupling between the velocity field and the radiation field are far from our possibilities such a question remains open.
4.4. Rotation
Comparisons have been made for mainly field stars by Breger (1969b), updated by Danziger and Faber (1972) and for cluster stars by Breger (1972b). The results can be summarized as follows: (i) Dwarfs: Pulsating stars are generally not slow rotators. But there are some exceptions. When only non-Am stars are considered, the rotational velocities of variable and nonvariable stars are similar. (ii) Giants: the large-amplitude variables such as o Del, {! Pup and o Set have very low rotational velocities. Most known variables have lower rotational velocities than the nonvariables. We cannot yet definitely establish whether fast rotation inhibits pulsation in all giants. Danziger and Faber (1972) conclude that no direct correlation exist between rotation and luminosity. The giants and dwarfs, therefore, differ in the observed correlations between rotation and pulsational excitation. We cannot yet say whether the change with luminosity is smooth and continuous.
5. Theoretical Models
Studies in theoretical models of stars are important for obtaining answers to several central questions: (i) Masses and evolutionary phases of o Scuti variables. (ii) Cause of the variability. (iii) Interpretation of the observed characteristics of the pulsation. Recently some properties of the o Scuti stars have been successfully explained by conventional theories of stellar evolution and pulsation, but several questions remain unsolved.
5.1. Luminosities, Masses and Ages of the o Scuti Stars
The preceding paragraphs have shown that the position of the o Scuti stars in the H.R. diagram is obtained indirectly from photometric or spectrophotometric measurements. In fact, the observations lead to the determination of the effective temperature T,,, and the surface gravity g. Photometric measures give color indices and the size of the Balmer discontinuity, which can be related to g and T,, through model atmospheres. Breger and Bregman (1972) have discussed the temperature and gravity calibration of Stromgren-Crawford photometry. When spectrophotometric measures are available, the energy distribution curves are compared with a grid of theoretical curves from model atmospheres and give logg and T,. with a better precision. Breger and Kuhl (1970), Dickens and Penny (1971) have analyzed some stars in this manner. Even in these favourable cases, the uncertainties are typically of ± O.ol in log r., and ±0.30 in logg. The luminosity (or the absolute magnitude Mh0J and the mass m of a star are then related to g and T,, by
Mbol + 2.5 logm= 2.5 logg- 10 logT,, +constant. (4)
© European Southern Observatory • Provided by the NASA Astrophysics Data System

1973A&A....23..221B
Delta Scuti Stars 233
If the absolute magnitude of a star can be obtained from one of the following sources: trigonometric parallax, cluster membership, moving group membership, companion star, the mass of the star can be estimated. At the best, the trigonometric parallax is of the order of a few tens of milliseconds of arc (0':010 - 0':040). This gives an uncertainty larger than ± 1 mag in MhoI in most cases. The uncertainty on magnitudes estimated from cluster membership can be ± 0.5 mag. Magnitudes estimated from moving group membership and companion stars are much less precise. Taking L1 MhoI equal to 0.5 mag, which is very optimistic in most cases, L1 logg = 0.3, L1 log T,, = 0.01, one obtains from relation (4): L1 logm = 0.54. That is, for a mean mass of m/m0 = 1.8, 0.5 < m/m0 < 7. The masses evaluated in Table 4 of Dickens and Penny (1971) fall in this range. Therefore, one is presently unable to assign a "low" mass or a "normal" mass either to a [J Scuti star or to a dwarf cepheid star on the basis of (i) spectrophotometric determination of logg and log T,, and (ii) knowledge of the absolute magnitude within half a magnitude. Lacking an independent determination of the luminosity, photometry and spectrophotometric measurements do not allow a ,ffiass to be assigned to each [J Scuti star. The photometric calibrations used to transform the observational parameters into luminosity and temperature are valid if one assumes that the [J Scuti stars have masses similar to those of the standard stars in the photometric calibration, whose observational parameters are the same. See in this
respect the discussion by Breger and Kuhi (1970), also Dickens and Penny (1971) and Section (4.1) of this paper. To summarize the results of photometric and spectrophotometric studies: within the uncertainties previously discussed, the location of the [J Scuti stars in the H.R. diagram is defined by the intervals
O<MboI < 3'
3.8 < log'T., < 4.
The masses derived from surface gravity and available parallaxes are between a few tenths and a few solar masses. In this region, the proportion of detected variables to~ non variables is around 30% (see Section 3), and the frequency amplitude distribution strongly suggests that most of the nonvariables may vary with a very small amplitude, presently undetectable. The hypotheses that the [J Scuti stars are in a mainsequence stage of evolution or moving from the mainsequence to the giant branch allows us to account for their position in the H.R. diagram and for the high incidence of variability. Some of them could be in a pre-main-sequence stage. This is not excluded but the time scale of evolution in this phase is much shorter. Breger (1972a) found two [J Scuti stars in NGC 2264, however the cluster membership of these two stars has to be confirmed. Several model stars and evolutionary sequences of models are constructed in this region of the H.R. dia-
Table 3. List of some population I model stars in the {> Scuti-dwarf Cepheid region
Initial chemical composition (by mass)
x =0.739 z =0.021
X=0 700 jZ=0.020 . Z=0.030
X=0600 Z=0.030 . Z=0.005
x = o. 100 {z = 0.020 and Z=0.030 x = 0.600 z = 0.040
x = 0.596 z = 0.020
X=0.708 Z=0.020
X=0.700 Z=0.030
X=0.700 Z=0.030
Masses (m/m0 )
1.0 2.0
from 1.10
to 2.5
1.585 1.780 2.82
2.0
1.25 1.50 2.25 3.0
1.8 2.0
1.5 3.0
Stage of evolution
Pre-main-sequence (quasi-static contraction)
Main-sequence only homogeneous models central hydrogen burning
From the main-sequence to the subgiant region central hydrogen burning
From the main-sequence to the giant region central and shell hydrogen burning
From the main-sequence to the giant branch central and shell hydrogen burning
From the main-sequence to the giant region central and shell hydrogen burning
From the main-sequence to the giant branch central and shell hydrogen burning
Authors
Ezer and Cameron (1967)
Copeland et al. (1970)
Kelsall and Str0mgren (1966)
Auman (1965)
lben (1967)
Chevalier (1971)
Paczy6.ski (1970)
© European Southern Observatory • Provided by the NASA Astrophysics Data System
1973A&A....23..221B
234 A. Baglin et al.
2
~~---- -·----... . . "" • • .......... .l.25 M9 ( I)
• . ........ .......................... .. . . .
- - - - - ._ -l_.5 MJ I) . ..... '--. . ..... ....... ..... •• • ...... >
/
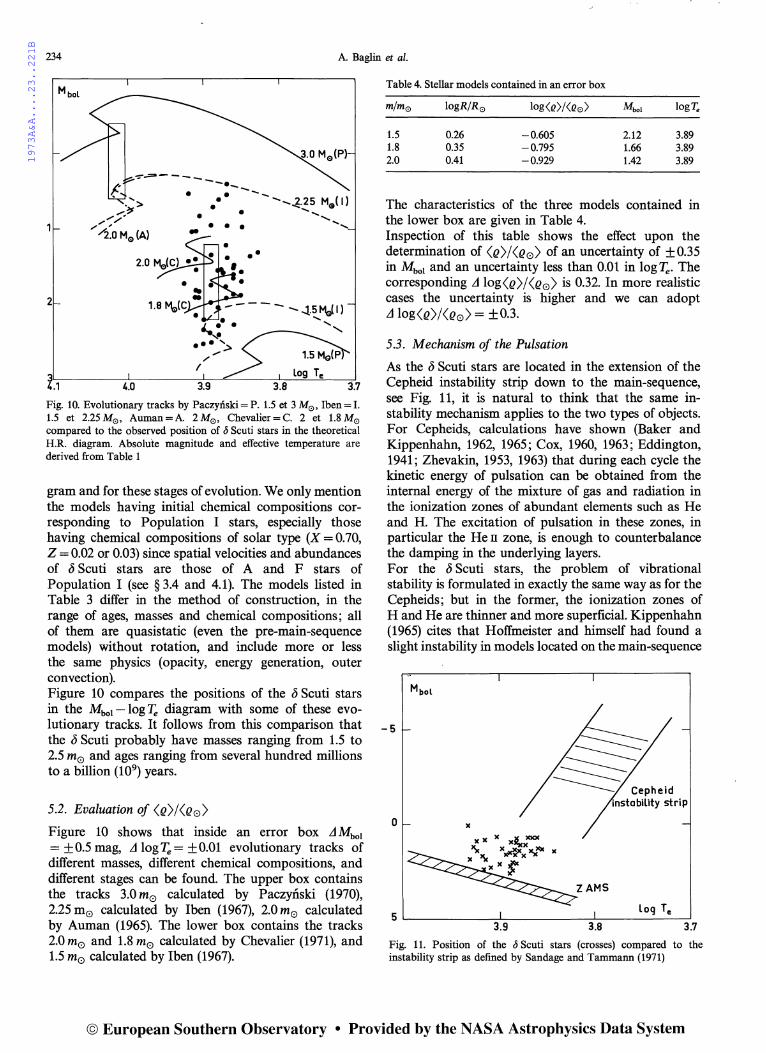
3'--~~~~.L.._~~~~'-'--=~~~-'--l_o~g_T~e~__,... 4.1 4.0 3.9 3.8 3.7
Fig. 10. Evolutionary tracks by Paczynski = P. 1.5 et 3 M0 , lben =I. 1.5 et 2.25 M0 , Auman= A. 2 M0 , Chevalier= C. 2 et 1.8 M0 compared to the observed position of {> Scuti stars in the theoretical H.R. diagram. Absolute magnitude and effective temperature are derived from Table 1
gram and for these stages of evolution. We only mention the models having initial chemical compositions corresponding to Population I stars, especially those having chemical compositions of solar type (X = 0.70, Z = 0.02 or 0.03) since spatial velocities and abundances of c5 Scuti stars are those of A and F stars of Population I (see § 3.4 and 4.1). The models listed in Table 3 differ in the method of construction, in the range of ages, masses and chemical compositions; all of them are quasistatic (even the pre-main-sequence models) without rotation, and include more or less the same physics (opacity, energy generation, outer convection). Figure 10 compares the positions of the c5 Scuti stars in the Mbot - log T,, diagram with some of these evolutionary tracks. It follows from this comparison that the c5 Scuti probably have masses ranging from 1.5 to 2.5 m0 and ages ranging from several hundred millions to a billion (109) years.
5.2. Evaluation of (e)/(eo)
Figure 10 shows that inside an error box L1 Mbot
= ± 0.5 mag, L1 log T,, = ± 0.01 evolutionary tracks of different masses, different chemical compositions, and different stages can be found. The upper box contains the tracks 3.0 m0 calculated by Paczyiiski (1970), 2.25 m0 calculated by lben (1967), 2.0 m0 calculated by Auman (1965). The lower box contains the tracks 2.0 m0 and 1.8 m0 calculated by Chevalier (1971), and 1.5 m0 calculated by lben (1967).
Table 4. Stellar models contained in an error box
m/m0 logR/R0 log(11)/(110) Mbot log'.f.
1.5 0.26 -0.605 2.12 3.89 1.8 0.35 -0.795 1.66 3.89 2.0 0.41 -0.929 1.42 3.89
The characteristics of the three models contained in the lower box are given in Table 4 . Inspection of this table shows the effect upon the determination of (e)/(e0 ) of an uncertainty of ±0.35 in Mbot and an uncertainty less than 0.01 in log T,,. The corresponding L1 log(e)/(e0 ) is 0.32. In more realistic cases the uncertainty is higher and we can adopt L1 log(e)/(e0 ) = ±0.3.
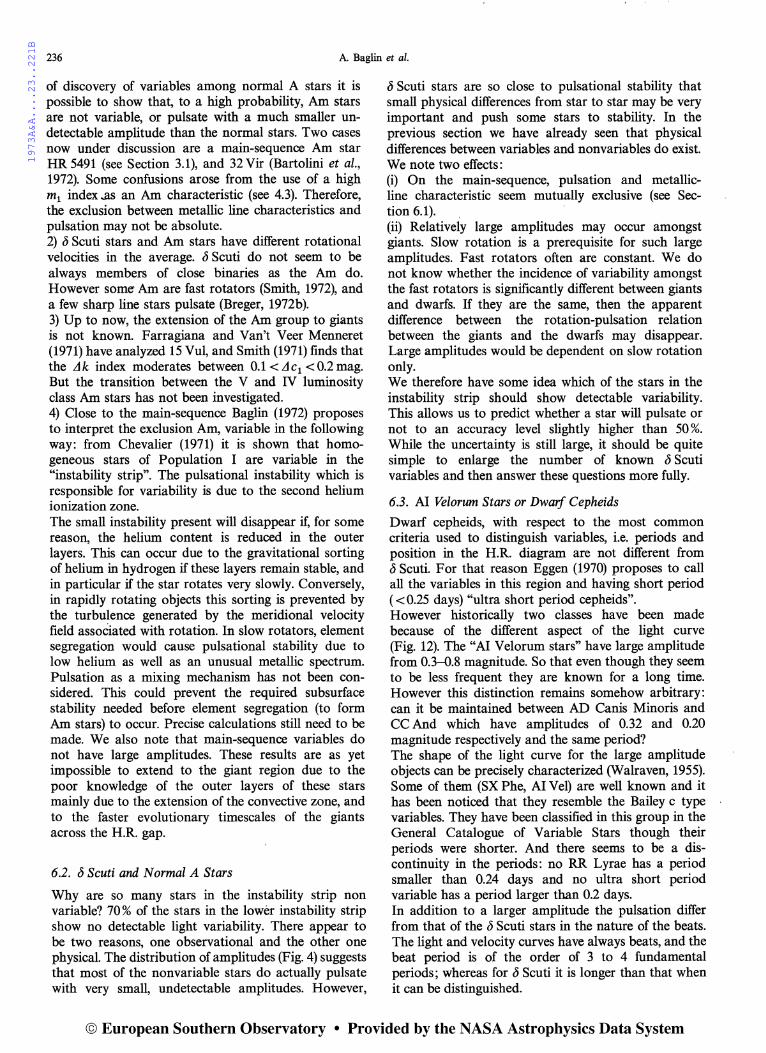
5 .3. Mechanism of the Pulsation
As the c5 Scuti stars are located in the extension of the Cepheid instability strip down to the main-sequence, see Fig. 11, it is natural to think that the same instability mechanism applies to the two types of objects. For Cepheids, calculations have shown (Baker and Kippenhahn, 1962, 1965; Cox, 1960, 1963; Eddington, 1941; Zhevakin, 1953, 1963) that during each cycle the kinetic energy of pulsation can be obtained from the internal energy of the mixture of gas and radiation in the ionization zones of abundant elements such as He and H. The excitation of pulsation in these zones, in particular the He 11 zone, is enough to counterbalance the damping in the underlying layers. For the c5 Scuti stars, the problem of vibrational stability is formulated in exactly the same way as for the Cepheids; but in the former, the ionization zones of H and He are thinner and more superficial. Kippenhahn (1965) cites that Hoffmeister and himself had found a slight instability in models located on the main-sequence
-5
0
x><
loq Te 5 '--~~~~~~~~~~~~~~~~~~~
3.9 3.8 3.7
Fig. 11. Position of the {> Scuti stars (crosses) compared to the instability strip as defined by Sandage and Tammann (1971)
© European Southern Observatory • Provided by the NASA Astrophysics Data System

1973A&A....23..221B
Delta Scuti Stars 235
near T,, = 7500° K. More recently Chevalier (1971) carried out a linear stability analysis of a model corresponding to a mean [J Scuti star having left the main-sequence, for the fundamental and first overtone non-adiabatic radial oscillations. The main results of this analysis are: - the model is unstable in the fundamental and first overtone. - the He 11 ionization zone is sufficient to de-stabilize the model. The hydrogen zone, notwithstanding all reservations that can be formulated concerning its treatment (gray absorption coefficient and thermal diffusion approximation, influence of boundary condition etc., ... ) does not seem able to furnish a notable contribution to the excitation of the oscillations. - the stability coefficient is defined as:
G'i 1 W; 11=--=--
a, 4n wP
where w; is the value of the energy integral at the inner boundary of the envelope and wP the total pulsational energy of the star. It gives a rising time for the pulsation which is of the same order (103 years) for the fundamental and the first overtone. This rising time is longer than in the Cepheids but remains shorter than the characteristic stellar evolution time-scale in this phase. Castor (1972) has carried out linear stability analysis on various model envelopes. In particular, for stars located around the blue edge of the theoretical instability strip he finds instabilities for higher harmonics than the first and second and consequently very short periods for unstable modes.
5.4. Constant of Pulsation, Modes of Pulsation
The linear stability analysis thus allows an explanation of the [J Scuti pulsation but does not furnish a clear indication concerning the preferred pulsation mode. In his paper on the calculation of linear non adiabatic pulsations of stellar models applied to models of RR Lyrae stars and Cepheids, previously treated respectively by Christy (1966) and Baker and Kippenhahn (1965). Castor (1971) suggests that w; "correlates with the surviving full amplitude mode much better than 17 does. That is, the mode with the largest value of wi is usually the surviving mode". In the case of the model studied for [J Scuti stars, the values of w; are not very different for the fundamental and the first overtone, only slightly larger for the fundamental mode. On the other hand, Christy (1968) also notes that "since the [J Scuti are of small amplitude, one cannot be sure that the non linear aspects are important and it is therefore not certain in what mode they are vibrating". Many authors have used the value of the pulsation constant Q in order to determine the mass of the [J Scuti (or dwarf Cepheids) stars, and their preferred mode of pulsation. Q is defined by the relation:
Q =Pdaysl(e)/(e0)1 112 . (5)
We have seen (Section 5.2) that the comparison of observed positions of [J Scuti stars with theoretical models is possible within an uncertainty in log((e)/(e0 )) of ±0.30. The observed periods are precise to about 10%. Consequently, the uncertainty in "observational" Q values is larger than 25 %, more likely 30 or 40 %. The pulsation properties of stellar envelopes in the lower part of the instability strip have been calculated by Petersen and Jergensen (1972), Cogan (1970); Chevalier (1971) studied the same properties for complete stellar models. These works show that for each mode the theoretical Q value is largely insensitive to the variation of surface gravity temperature and chemical composition in this part of the H.R. diagram. For the fundamental mode the pulsation constant is found to be in the interval 0.031<Q0 <0.035. Within 10%, Q0 is an invariant. On the other hand,
Q1 - Q0 = 0.008 ,,_, 25 % Q0 0.033 °'
Therefore, the "observed" Q values derived from the presently available data cannot provide clear indications regarding the mass, the chemical composition and the preferred mode of pulsation of the [J Scuti stars (and also the AI Velorum stars). Finally, a comparison of the ratio Pif P0 computed using the models to that determined by observation does not remove the uncertainty. Pi/P0 , like P2/P0
etc. . . . are also rather insensitive to variations in the model. These ratios vary of a few percent when the mass changes by a factor of two and the chemical composition changes from extreme Population I type to solar type, and even Population II type. In most cases, the uncertainties in the observed period ratios are larger (Fitch, 1970). A mixture of modes and possibly resonance terms could occur. This hypothesis is supported by the evidence of beat phenomena and variations of amplitude in the light and radial velocity curves of several [J Scuti stars.
6. Relation to Connected Objects
We would like to discuss in this chapter the relation between the variable [J Scuti stars and some other groups of stars which seem to populate the same region of the H.R. diagram and so having some connection with them.
6.1. Relation to Am Stars
1) From variability surveys of A stars Breger (1970, 1972b) has suggested that typical Am stars are not variable. He has tested a large number of Am stars for variability and comparing the results with the statistics
© European Southern Observatory • Provided by the NASA Astrophysics Data System
1973A&A....23..221B
236 A. Baglin et al.
of discovery of variables among normal A stars it is possible to show that, to a high probability, Am stars are not variable, or pulsate with a much smaller undetectable amplitude than the normal stars. Two cases now under discussion are a main-sequence Am star HR 5491 (see Section 3.1), and 32 Vir (Bartolini et al., 1972). Some confusions arose from the use of a high m1 index .as an Am characteristic (see 4.3). Therefore, the exclusion between metallic line characteristics and pulsation may not be absolute. 2) (j Scuti stars and Am stars have different rotational velocities in the average. (} Scuti do not seem to be always members of close binaries as the Am do. However some Am are fast rotators (Smith, 1972), and a few sharp line stars pulsate (Breger, 1972b). 3) Up to now, the extension of the Am group to giants is not known. Farragiana and Van't Veer Menneret (1971) have analyzed 15 Vul, and Smith (1971) finds that the A k index moderates between 0.1 < A c1 < 0.2 mag. But the transition between the V and IV luminosity class Am stars has not been investigated. 4) Close to the main-sequence Baglin (1972) proposes to interpret the exclusion Am, variable in the following way: from Chevalier (1971) it is shown that homogeneous stars of Population I are variable in the "instability strip". The pulsational instability which is responsible for variability is due to the second helium ionization zone. The small instability present will disappear if, for some reason, the helium content is reduced in the outer layers. This can occur due to the gravitational sorting of helium in hydrogen if these layers remain stable, and in particular if the star rotates very slowly. Conversely, in rapidly rotating objects this sorting is prevented by the turbulence generated by the meridional velocity field assoCiated with rotation. In slow rotators, element segregation would cause pulsational stability due to low helium as well as an unusual metallic spectrum. Pulsation as a mixing mechanism has not been considered. This could prevent the required subsurface stability needed before element segregation (to form Am stars) to occur. Precise calculations still need to be made. We also note that main-sequence variables do not have large amplitudes. These results are as yet impossible to extend to the giant region due to the poor knowledge of the outer layers of these stars mainly due to the extension of the convective zone, and to the faster evolutionary timescales of the giants across the H.R. gap.
6.2. (j Scuti and Normal A Stars
Why are so many stars in the instability strip non variable? 70 % of the stars in the lower instability strip show no detectable light variability. There appear to be two reasons, one observational and the other one physical. The distribution of amplitudes (Fig. 4) suggests that most of the nonvariable stars do actually pulsate with very small, undetectable amplitudes. However,
(j Scuti stars are so close to pulsational stability that small physical differences from star to star may be very important and push some stars to stability. In the previous section we have already seen that physical differences between variables and nonvariables do exist. We note two effects: (i) On the main-sequence, pulsation and metallicline characteristic seem mutually exclusive (see Section 6.1). (ii) Relatively large amplitudes may occur amongst giants. Slow rotation is a prerequisite for such large amplitudes. Fast rotators often are constant. We do not know whether the incidence of variability amongst the fast rotators is significantly different between giants and dwarfs. If they are the same, then the apparent difference between the rotation-pulsation relation between the giants and the dwarfs may disappear. Large amplitudes would be dependent on slow rotation only. We therefore have some idea which of the stars in the instability strip should show detectable variability. This allows us to predict whether a star will pulsate or not to an accuracy level slightly higher than 50 %. While the uncertainty is still large, it should be quite simple to enlarge the number of known (} Scuti variables and then answer these questions more fully.
6.3. AI Velorum Stars or Dwarf Cepheids
Dwarf cepheids, with respect to the most common criteria used to distinguish variables, i.e. periods and position in the H.R. diagram are not different from (j Scuti. For that reason Eggen (1970) proposes to call all the variables in this region and having short period ( <0.25 days) "ultra short period cepheids". However historically two classes have been made because of the different aspect of the light curve (Fig. 12). The "AI Velorum stars" have large amplitude from 0.3--0.8 magnitude. So that even though they seem to be less frequent they are known for a long time. However this distinction remains somehow arbitrary: can it be maintained between AD Canis Minoris and CC And which have amplitudes of 0.32 and 0.20 magnitude respectively and the same period? The shape of the light curve for the large amplitude objects can be precisely characterized (Walraven, 1955). Some of them (SX Phe, AI V el) are well known and it has been noticed that they resemble the Bailey c type variables. They have been classified in this group in the General Catalogue of Variable Stars though their periods were shorter. And there seems to be a discontinuity in the periods: no RR Lyrae has a period smaller than 0.24 days and no ultra short period variable has a period larger than 0.2 days. In addition to a larger amplitude the pulsation differ from that of the (j Scuti stars in the nature of the beats. The light and velocity curves have always beats, and the beat period is of the order of 3 to 4 fundamental periods; whereas for (j Scuti it is longer than that when it can be distinguished.
© European Southern Observatory • Provided by the NASA Astrophysics Data System

1973A&A....23..221B
Delta Scuti Stars 237
a8 0.4 no
-0.4 -0.8 -12
0.0
a2 OJ.
0.6
OB
a2 OJ.
0.6
OB
0.74 0:78 0.82 0.86 0.90 ll79 083 0.87 n91 0.95
Al Velorum Morch 81 1952
Al Velorum Febr &11953
0.74 0.78 o.82 ass o.so o.94 o.981.02 1.0& 1.10
Fig. 12. Light curves of CC And, a ~ Scuti of period 0.125 day and AI Vel (period 0.112 day) (Walraven, 1955)
In taking into account first one or another characteristic they have been named successively "short period RR Lyrae" by Woltjer (1956) or "dwarf cepheids" by Smith (1965). They are usually known under that name, but Bessel (1969b) proposes to name them after AI Vel a very well known star of the group to avoid confusion. We will use this naming in the following. Bessel (1969b) lists 17 stars for which period and colors are known. We will discuss successively their main properties. - They all seem to be sharp line stars of luminosity class IV or V, and can be considered in the average as slow rotators. They are certainly not all binaries and seem to behave normally in that respect. - They are all quite faint and remote objects so that parallaxes are very uncertain and motions difficult to determine as well as distance moduli. They certainly have larger space motions than the b Scuti group but not as large as halo stars (Eggen, 1970). It cannot be said that they belong to Pop II from this criterion. - Some of them are probably members of groups for example: CY Aqr is a member of the 17 Cep group (Eggen, 1964a), DY Peg of the a Pup group (Eggen, 1964b), EH Lib and SZ Lyn of the e Herculis group. These groups have all an intermediate disk population, no AI Velorum stars have ever been found in younger groups like the Hyades for example. But, recently (Eggen, 1970, 1971) b Scuti stars also have been disco-
vered in such intermediate groups. (For example HD 6870 in a Puppis.) - Bessel (1969b) has attempted to analyze the abundances of some of the AI Velorum stars. Using a curve of growth analysis he was not able to detect any significant difference from Pop I stars. But, it has been demonstrated later by Reimers (1969) that this method can give erroneous abundances determinations (Section 4.3). So that no age criterion can be clearly taken from that. In the same work Bessel (1969b) obtains effective temperatures in the range 8400 - 7700 °K. This result does not seem to be affected by Reimer's criticism (Section 4.3). This is included in the temperature range of the b Scuti stars (Section 4.1). - The absolute magnitude is much more difficult to determine. The only somehow reliable parallaxes determination of AI Velorum and SX Phe give 4 and 3.8 respectively for My. But the absolute magnitude of SX Phe is certainly not larger than My = 2 otherwise its space velocity would exceed the galactic escape velocity. DY Peg, as a member of the a Pup group, has a higher luminosity My = 1.9 close to the luminosity of the b Scuti star of the same group HD 6870. If magnitudes as large as four were real these stars would be located somehow lower than the main-sequence of the corresponding old disk population. But color-luminosity diagrams of groups having AI Velorum stars in them lead to the opposite conclusion. Bessel (1969b) gives a discussion of the different methods which always lead to the interval 1<My<4. McNamara (1965) tried to obtain photometric determination of the magnitude, using the ckl system, the weak point being that the calibration is based on main-sequence standards; but examination of spectral characteristics leads to class IV or V. All luminosities given by McNamara are higher than My= 2.1 (Table 5), and Eggen (1970) proposes a statistical mean magnitude of 1.9 for this group of stars, based on these results. - Figure 13 gives the approximate position of some of these stars in a color magnitude diagram. They all seem to lie in the "instability strip" (§ 4), as the b Scuti stars. The two stars of the e Herculis group in the instability region are EH Lib and SZ Lyn - two AI Velorum stars. In the a Puppis group the two stars of the instability strip (Fig. 14) are available but one is a b Scuti and the other is DY Peg. As seen on Fig. 13
Table 5. Magnitude in the ckl system from McNamara (1965)
Mv B-Vmed")
DY Peg 1.9 0.22 EH Lib 2.1 0.21 YZBoo 1.2 0.26 DY Her 1.3 0.30 VZCnc 0.9 0.30
") B - Vmed is the mean value of the color index B - V over the period of pulsation.
© European Southern Observatory • Provided by the NASA Astrophysics Data System

1973A&A....23..221B
238 A. Baglin_ et al.
I I
My
.vz Cnc
1 - 14 Aur -x .vzeoo
•DY Her
HR 6870 21 Mon x x x 'II Uma x ~Set
20 CVn
97 Tau •DY Peg x
2 -x
eEH Lib -
x • x
'x57 Tau
I I B-V D.2 D.3
Fig. 13. Color luminosity diagram of b Scuti and AI Velorum stars. x b Scuti stars B - V from the Bright Star Catalogue Mv from (b- y)0 , c1 calibration.• AI Velorum stars from ck! photometry
: I Mv I I ,
0 I , •• • HD 687ofe ~y Peg
_,._. , . I
+4 I ,
I •
+8
0 -t-0.4 +0.8 +1.2
Fig. 14. Color luminosity array of the CT Pup group. - The Hyades main-sequence.-·- Approximate boundaries of the instability strip
the two classes lie in the same region of the diagram and no distinction is possible. So, from the inspection of the known properties the only differing properties up to now between <> Scuti and AI Vel stars are: amplitude of oscillation, rotation and length of the beat period. The association of large amplitudes and slow rotation seems also to be present in the <> Scuti stars as discussed previously ( 6.2). Would these AI Velorum stars add more consistency to the idea that there is a coupling between rotation and pulsation leading to a control of the amplitude by the rotation? Or is it a correlation due only to an evolutionary effect? Mass determination have lead several authors to claim that AI Velorum stars were different because the masses were different. Those mass determinations where generally based on a comparison of theoretical and "observational" Q values.
The "observational" determination of the Q value, discussed in Section (5.2) for <> Scuti stars is even more uncertain for AI Velorum due to the enormous uncertainties on the photometric parameters. As we have seen, no distinction in luminosity, effective temperature, abundances and period is possible, so that Q values cannot provide a way to argue that masses are intrinsically different. The low masses obtained by Bessel (1967) are based on absolute magnitude from trigonometric parallaxes and two objects. The uncertainty can be estimated to a factor 3 or 4. Petersen and J0rgensen (1972) conclude that AI Velorum stars and <> Scuti stars form separate groups from an analysis of the ratio of the fundamental to the first harmonic P 1/P 0 . Comparing the observed value to theoretical ones they conclude that AI V el stars cannot belong to Population I. As the parameter Q, the ratio P 1/P 0 is extremely unsensitive to the model. So that, it seems difficult to use it as a test for distinguishing different classes. On the other hand, the observational and theoretical uncertainties on the ratio P 1/P 0 cannot permit to make the difference between the observed ratio P 1/P 0 in the interval and the mean computed value for <> Scuti models (Chevalier, 1971) (see Section 5.4). This indirect determination of the mass, as well as the chemical composition made by Petersen and J0rgensen cannot be regarded as certain. By examining successively the space characteristics as well as the physical properties of the AI Velorum stars, it does not seem possible to say that AI Velorum stars and <> Scuti stars are different classes of variables. Up to now, the whole subject is open. More light will be thrown on the matter by systematic search for variables with extreme care of selection effects. In particular the detection of variables in older clusters is extremely rewarding.
6.4. Unusual Variables
A few stars do not fit into the variability scheme summarized in the previous sections. It could be argued that some small residual pulsations could exist in stars just outside the instability strip. On the other hand, causes of variability other than pulsation are also likely to occur, e.g. Ap star variability. Two stars hotter than our hot border at A 2 V are suspected variables. y UMi (HR 5735, A 3 II-III) and y CrB (HR 5849, A 1 V) have been reported to be variable with not very convincing light curves. At other times these stars have been observed to be constant. Breger (1969d) has listed some Ap stars with reported short-period variability of a periodic nature. That variability, if real, could be caused by pulsation. An unusual object, y Boo (HR 5435, A 7 III) is situated inside the instability strip. Old measurements indicate a variability with a period of 0.29 days (Miczaika, 1952; Magalashvili and Kumsishvili, 1965). Other observations showed no signs of variability (e.g. Millis, 1967a).
© European Southern Observatory • Provided by the NASA Astrophysics Data System

1973A&A....23..221B
Delta Scuti Stars 239
Baglin et al. (1968) found large changes in the equivalent widths of the calcium and hydrogen lines. But due to poor observations it could not be associated with a periodic variability. Later in 1969,Le Contel et al. (1970) observed the calcium K line at high resolution and found a small variable emission feature. They also detected an average velocity field in the atmosphere. Up to now, the variable K line emission has been detected in very few objects. The observations of y Boo are not yet sufficient to determine whether its variability is connected with pulsation or due to chromospheric activity. Recent photometric observations (Sareyan et al., 1971) confirmed the old period and phase.
7. Conclusion
At the present stage of our knowledge, the situation concerning b Scuti stars is quite clear. We probably know which kind of stars they are and why they pulsate. But as soon as we get into more details difficulties arise: the observational features which can be reach by the most advanced technical means are far from being explained by theories. Such a simple and straightforward property like the phase lag between the light and velocity curve needs to be understood perhaps by an extended treatment of the hydrodynamics of the outerlayers involving non linear effects and even coupling between radiative transfer and hydrodynamics. A few steps have been attempted in this direction to explain the observed properties of Cepheids. They are still too schematic to give a good representation of the observations. In that sense, more information is obtained by simultaneous spectroscopic and photometric observations. It should be persued as often as possible in future. Even the determination of the rotational velocity from line broadening can be biaised by the variation of the profile of the line through the cycle. Specially when the velocity of rotation and the velocity amplitude of the pulsation are of the same order of magnitude, to separate both effects need a very high resolution study of a set of spectra distributed over the cycle, as in all variables. But in the case of b Scuti stars the difficulty is enhanced by the smallness of the amplitude. However one is able now to detect such effects by the use of the very high resolution spectrography associated with electronic cameras or with scanners. Still several observational facts have to be confirmed by more observations. One of the most important is the relation between pulsation, rotation and metallicism. The exclusion of the metallic-line character and the pulsational instability should provide a clue to the understanding of subsurface hydrodynamics. The influence of rotation, the variation of the metallic character and the occurrence of pulsation from dwarfs to giants, the abundance anomalies of some giant variables are not understood yet. They are certainly
the most interesting fields to investigate in the near future. The definition of the b Scuti variables given in this paper limits a well defined class of objects. However observations raise the question of the extension of the class as well as its relation to close objects. Among these, the AI Velorum stars have been discussed but clarification is badly needed. At the present stage only a more extended set of observational data could bring some new lights. The great improvements obtained in photometry by the detection of systematic errors (due to instabilities in the equipment and to secondary effects in the P.M.) and by counting technics allow now observation of more stars (fainter objects and lower amplitudes). The extension of the variability to higher effective temperatures and the search for short period in Ap stars are almost new and bare fields which should be investigated in a near future.
Acknowledgements. We would like to thank M. A. Smith, Fr. Praderie, M. Dante! and G. Zribi for helpful discussions and comments and for their assistance in preparing the material published here.
References The numbers in front of some references are those of the Table 1 references.
Abt,H.A. 1965, Astrophys. J. Suppl. 11, 429. Abt,H.A., Hudson,K.1. 1971, Astrophys. J.163, 333. Abt,H.A., Smith,G.H. 1969, Puhl. Astron. Soc. Pacific 81, 332. Anderson,K.S., Kraft,R.P. 1972, Astrophys. J. 172, 631. Auman,J.R. 1965, Astrophys. J. 142, 462. Baglin, A. 1972, Astron. & Astrophys. 19, 45. Baglin,A., Praderie,F., Perrin,M.N. 1968, in L. Detre (Ed.): Non
Periodical Phenomena in Variable Stars, IAU Colloquium. Academic Press, Budapest, p. 303.
01 Baker,R.H. 1926, Pub!. Astron. Soc. Pacific 38, 86. Baker,N., Kippenhahn,R. 1962, Z. Astrophys. 54, 114. Baker,N., Kippenhahn,R. 1965, Astrophys. J. 142, 868. Bartolini,C., Grilli,F., Parmeggiani,G. 1972, IAU Inf. Bull. Com.
27, No. 704. Baylac,M.O. 1972, Astron. & Astrophys. 16, 85. Bessel,M.S. 1967, Astrophys. J. Letters 149, L 67. Bessel,M.S. 1969a, Astrophys. J. Suppl. 18, 167. Bessel, M. S. 1969b, Astrophys. J. Suppl. 18, 195. Bessel,M.S., Eggen,0.J. 1972, Publ. Astron. Soc. Pacific 84, 72. Bidelman, W. P. 1966, Vistas in Astronomy 8, 53. 02 Breger,M. 1966, Astrophys. J. 146, 958. Breger,M. 1968, Pub!. Astron. Soc. Pacific 80, 578. 03 Breger,M. 1969a, Astrophys. J. Suppl. 19, 79. Breger, M. 1969b, Astrophys. J. Suppl. 19, 99. 04 Breger,M. 1969c, Astron. J. 74, 166. Breger, M. 1969d, Astrophys. Lett. 3, 67. 05 Breger, M. 1970, Astrophys. J. 162, 597. 35 Breger,M. 1972a, Astrophys. J. 171, 539. 36 Breger, M. 1972b, To be published. 37 Breger,M. 1972c, To be published. Breger,M., Bregman,J.N. 1972, in press. Breger, M., Kuhi, L. V. 1970, Astrophys. J. 160, 1129. 06 Breger, M., Sanval, N. B. 1968, Astrophys. Lett. 1, 103. Breger,M., Maitzen,H.M., Cowley,A.P. 1972, preprint. Castor,J.I. 1971, Astrophys. J. 166, 109. Castor,J.I. 1972, To be published. 31 Chen,K.Y. 1966, Commission 27 IAU Inf. Bull. No 142. Chevalier,C. 1971, Astron. & Astrophys. 14, 24. Chevalier,C., LeContel,J.M., Perrin,M.N. 1968, Astrophys. Lett.
2, 175.
© European Southern Observatory • Provided by the NASA Astrophysics Data System

1973A&A....23..221B
240 A. Baglin et al.: Delta Scuti Stars
Chevalier,C., Le Contel,J.M., Perrin,M.N. (1969) private comm. Christy,R.F. 1966, Astrophys. J. 144, 108. Christy,R.F. 1968, J. Roy. Astron. Soc. Can. 63, 6. Cogan, B. 1970, Astrophys. J. 162, 139. 07 Colacevitch,A. 1935, Lick Obs. Bull. No. 478. Conti,P. 1970, Publ. Astron. Soc. Pacific 82, 781. Copeland,H., Jensen,J.O., fargensen,H.E. 1970, Astron. & Astro
phys. 5, 12. 21 Cousins,A.W.S., Stoy,R.H. 1963, Roy. Observ. Bull., No. 64. Cowley,A., Cowley,C., Jaschek,H., Jaschek,C. 1969, Astron. J.
74, 375. Cox,J.P. 1960, Astrophys. J. 132, 594. Cox,J.P. 1963, Astrophys. J. 138, 487. Crawford,D.L. 1970, IAU Symposium No. 38, 283. Danziger,l.J. 1967, Pub/. Astron. Soc. Pacific 79, 175. 34 Danziger,I.J. 1971, Publ. Astron. Soc. Pacific 83, 84. 08 Danziger,l.J., Dickens,R.J. 1967, IAU Inf. Bull. Commission 27
No. 150. 09 Danziger,I.J., Dickens,R.J. 1967, Astrophys. J. 149, 55. Danziger,I.J., Kuhi,L.V. 1966, Astrophys. J. 146, 743. Danziger,l.J., Faber,S.M. 1972, Astron. & Astrophys. 18, 428. 10 Demers,S. 1969, Publ. Astron. Soc. Pacific 81, 861. 11 Dickens,R.J. 1967, Astrophys. J. 148, L 33. Dickens,R.J., Penny,A.J. 1971, Monthly Notices Roy. Astron. Soc.
153, 287. Dickens,R.J., French,V.A., Owst,P.W., Penny,A.J., Powell,A.L.T.
1971, Monthly Notices Roy. Astron. Soc. 153, 1. Eddington,A.S. 1941, Monthly Notices Roy. Astron. Soc. 101, 182. 13 Eggen,0.J. 1956, Publ. Astron. Soc. Pacific 68, 238 and 541. Eggen,0.J. 1964a, Roy. Observ. Bull. 84. Eggen,O.J. 1964b, Astron. J. 69, 570. 14 Eggen,O.J. 1968, Co=ission 27 IAU Inf. Bull. No. 250. 15 Eggen,0.J. 1970, Publ. Astron. Soc. Pacific 82, 274. 12 Eggen,O.J. 1971, Publ. Astron. Soc. Pacific 83, 762. Ezer, D., Cameron, A.G. W. 1967, Can. J. Phys. 45, 3461. Fath,E.A. 1935, Lick Obs. Bull. No. 479. Faraggiana,R., Van't Veer-Menneret,C. 1971, Astron. & Astrophys.
12, 258. 16 Fernie,J.D. 1969, J. Roy. Astron. Soc. Can. 63, 133. Fitch, W. S. 1970, Astrophys. J. 161, 669. Fitch, W. S., Wehlau, W. 1965, Astrophys. J. 142, 1616. Gray,D.F. 1971, Pub/. Astron. Soc. Pacific 83, 103. Griffin,R.S. 1967, Astrophys. J. 148, 465. 17 Hall,D.S., Mallama,A.D. 1970, Publ. Astron. Soc. Pacific 82,
830. Hauck,B. 1968, Pub/. Obs. Geneve Serie A, No. 75. Hauck,B. 1971, Astron. & Astrophys. 11, 79. Hudson,K.L Chiu,H.Y., Maran,S.P., Stuart,F.E., Vokac,P.R.
1971, Astrophys. J. 165, 573. lben,I., Jr. 1967, Astrophys. J.147, 624. Jenkins,L.F. 1963, General Catalogue of Trigonometric Stellar
Parallaxes. 18 Jones,D.H.P. 1966, Mon. NotesAstr.Soc. Sth. Apr. 25, 168. 19 Jones,D.H.P., Haslaw,C.A. 1966, Observatory 86, 34. Jones,D.H.P. 1971, Roy. Observ. Bull. 163, 241. 20 fargensen,H.E., Johansen,K.I., Olsen,E.H. 1971, Astron. &
Astrophys. 12, 223. Kelsall, T., Strnmgren, B. 1966, Vistas in Astronomy 8, 159. Kippenhahn,R. 1965, IAU 3rd Colloquium on Variable Stars,
Bamberg, p. 7. Kuhi,L. V., Danziger,I.J. 1967, Astrophys. J. 149, 47. Lallemand,A. 1962, Stars and Stellar Systems II, p. 126. Le Conte!, J.M., Praderie, F ., Bijaoui, A., Dante!, M., Sareyan, J.P.
1970, Astron. & Astrophys. 8, 159. Leung,K.C., Wehlau,W. 1967, Astrophys. J.149, 39. Leung,K.C. 1970, Astron. J. 75, 643. 22 Lindblad,B., Eggen,O.J. 1953, Publ. Astron. Soc. Pacific 65, 291. Lindemann,E., Hauck,B. 1972 (Submitted for Publication). Magalashvili,N.L., Kumsischvili,J.J. 1965, Abastumansk. Obs. Bull.
32, 3.
Matsushima,S. 1969, Astrophys. J. 158, 1137. Mc Cord, T. B. 1968, Appl. Optics 7, 475. Mc Namara,D.A. 1965, The Position of Variable Stars in the
HR Diagram, 3rd IAU Colloquium on Variable Stars, Bamberg, p. 111.
Miczaika,G.R. 1952, Z. Astrophys. 30, 134. 23 Millis,R.L. 1966, Commission 27 IAU Inf. Bull. No. 137. 24 Millis,R.L. 1967a, Publ. Astron. Soc. Pacific 79, 267. 25 Millis,R. L. 1967b, Unpublished thesis. 32 Millis, R. L., Thompson, D. T. 1970, Publ. Astron. Soc. Pacific
82, 352. Milton,R.L., Conti,P.S. 1968, Astrophys. J. 154, 1147. Morgan,W. W., Abt,H.A. 1972, Astron. J. 77, 35. Paczynski, B. 1970, Acta Astron. 20, 49. Paddock,G.F., Struve,0. 1954, Astrophys. J. 119, 346. 26 Percy,J.R. 1970, Commission 27 IAU Inf. Bull. No. 444. Petersen,J.O., J0rgensen,H.E. 1972, Astron. & Astrophys. 17, 367. Reimers,D. 1969, Astron. & Astrophys. 3, 94. Rufener,F. 1966, Publ. Obs. Geneve 18, 651. Sandage,A.,_ Tammann,G. 1971, Astrophys. J. 167, 293. Sareyan,J.P., Zribi,G., Bijaoui,A. 1971, Commission 27 IAU Inf.
Bull. No. 531. Sareyan,J. P., Ischi, E. 1972, to be published. Seeds,M.A., Yanchak,G.A. 1972, preprint, Bartol Research Foun-
dation of the Franklin Institute, Swarthmore, Pennsylvania. Smith, M.J. 1965, Harvard University (unpublished dissertation). Smith, M.A. 1971, Astron. & Astrophys. 11, 325. Smith. M.A. 1972, Astron. & Astrophys.19, 314. Strnmgren, B. 1963, in K. Strand (Ed.), Stars and Stellar System,
Chicago University Press, 3, Ch. 9. Strnmgren, B. 1966, Ann. Rev. Astron. Astrophys. 4, 433. 27 Struve,O., Sahade,S., Zebergs,V. 1957, Astrophys. J. 125, 692. 33 Tempesti,P. 1971, Commission 27 IAU Inf. Bull. No. 596. Thulassi-Doss,A. 1970, Kodaikanal Obs. Bull.191, 179. U esugi, A., Fukuda, I. 1970, Contribution from the Institute of
Astrophysics and Kwasan Observatory (University of Kyoto) No. 189.
Valtier,J.C. 1971, Commission 27 IAU Inf. Bull. No. 556. Valtier,J.C. 1972, Astron. & Astrophys. 16, 38. Wachmann,A.A. 1966, IAU Commission No. 27 Inf. Bull. No. 138. 28 Walker,M.F. 1953, Publ. Astron. Soc. Pacific 65, 39. Walker,M.F., Wilson,D.C., Merle,F.L. 1956,Astrophys. J.124, 325. Walraven, Th. 1955, Bull. Astron. Inst. Neth. 12, 223. 29 Wehlau,W.H., Chen,S.C.N., Symonds,G. 1966, Commission 27
IAU Inf. Bull. No. 143. Wehlau,W., Leung,K.C. 1964, Astrophys. J.139, 843. Wilson,R.E. 1963, General Catalogue of Radial Velocities. Woltjer,L. 1956, Bull. Astron. Inst. Neth. 13, 62. Wright, W. H. 1900, Astrophys. J. 12, 256. Young, A. T. 1963, Appl. Opt. 2, 51. Young,A.T. 1967, Monthly Notices Roy. Astron. Soc.135, 175. Young, A. T. 1968, Observatory 88, 151. Zhevakin,S.A. 1953, Astron. Zh. 30, 161. Zhevakin,S.A. 1963, Ann. Rev. Astron. Astrophys. 1, 367.
A. Baglin J.M. le Conte! J. C. Valtier Observatoire de Nice F-06300 Nice, France
M. Breger University of Texas Austin, Texas 78712 USA
C. Chevalier Observatoire de Meudon Department d' Astrophysique Fondamentale F-92190 Meudon, France
B. Hauck Institut d'Astronomie de l'Universite de Lausanne et Observatoire de Geneve CH-1290 Sauverny, Suisse
J.P. Sareyan Observatoire de Paris 61, av. de l'Observatoire F-75014 Paris, France
© European Southern Observatory • Provided by the NASA Astrophysics Data System