democratic planning, design & architecture in the making
TRANSCRIPT

Presentation at Delft University
19th June 2012
Democratic Planning, Design & Architecture
in the making of our cities:The case of Mumbai
P K Das, Architect - Activist, Mumbai

Planning & Architecture are effective democratic
tools of social change and instruments for
mobilizing and facilitating social movements for
equality and justice.

Planning & Architecture in its physical
manifestations greatly influences life and through
them we could contemplate the future of our cities.
Three fundamental steps
Placing planning & architecture in the domain of public
knowledge.
Promoting planning & architecture as subjects of public
dialogue.
Evolving planning & architecture decisions through public
reasoning.

Planning & Architecture must integrate with the
development process for enabling social changes
and for achieving development justice.
This integration is our challenge.

Public spaces are rapidly shrinking as cities
expand.
Exclusivity and exclusion are fast becoming the
basis of city development.

An example
THE HOUSING QUESTION
The case of Mumbai

7 million (60%)
people live in slums
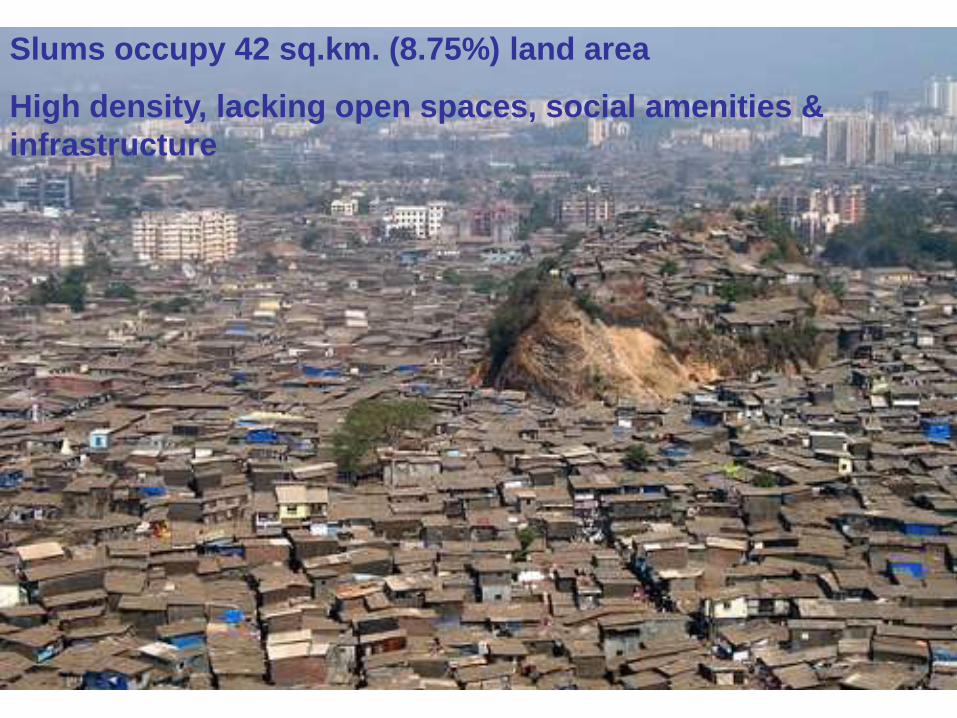
Slums occupy 42 sq.km. (8.75%) land area
High density, lacking open spaces, social amenities &
infrastructure

Approx. 0.4 million live on pavements

Second example
THE PUBLIC SPACES QUESTION
The case of Mumbai

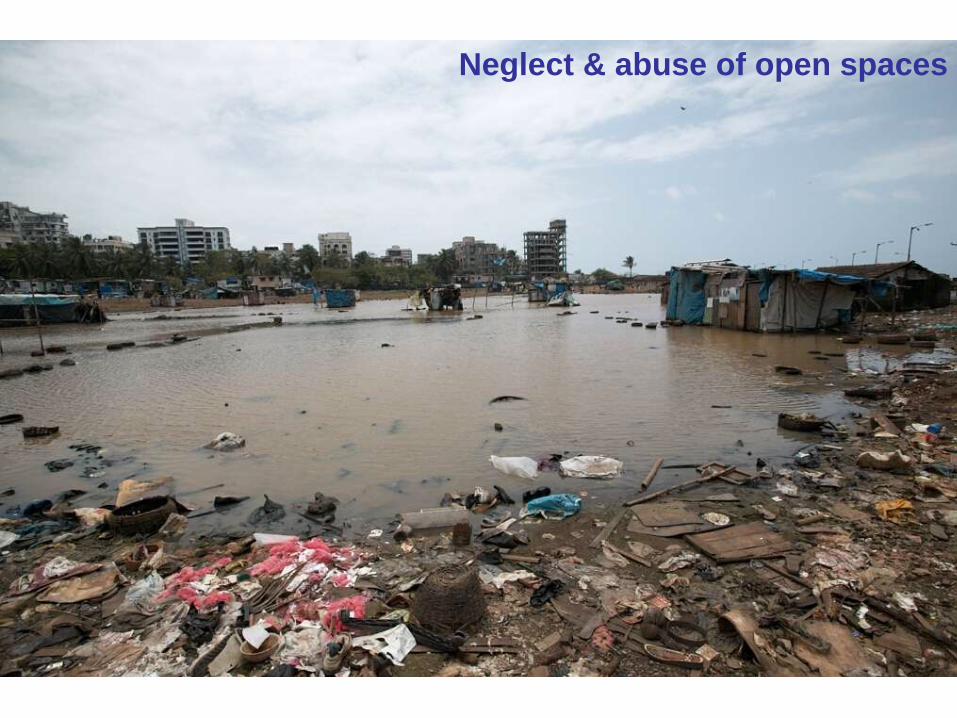
Neglect & abuse of open spaces

Abuse of coastline
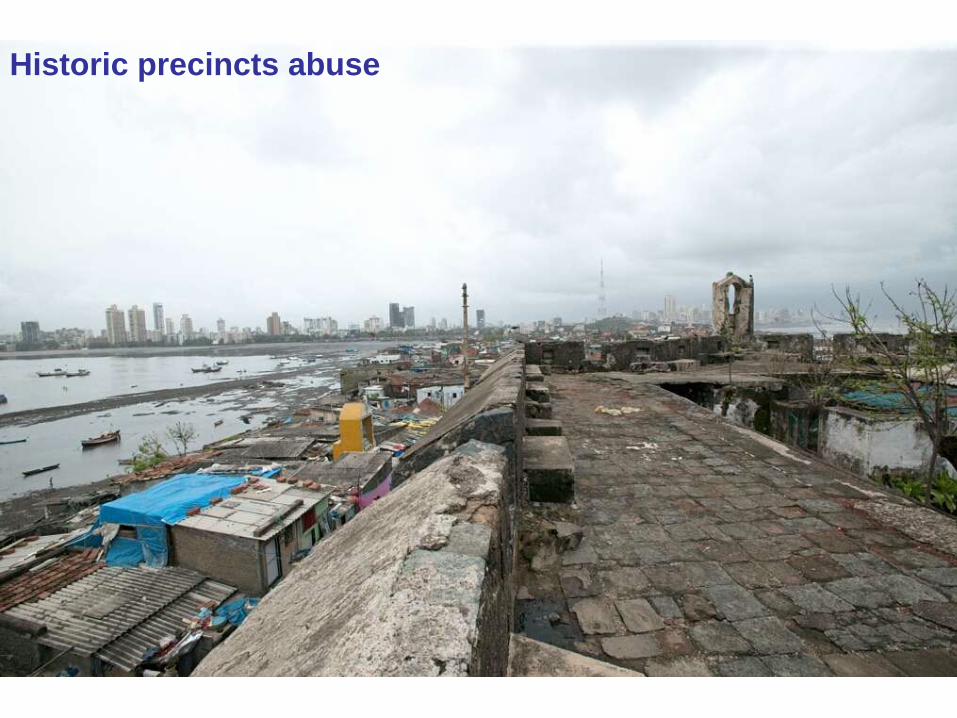
Historic precincts abuse
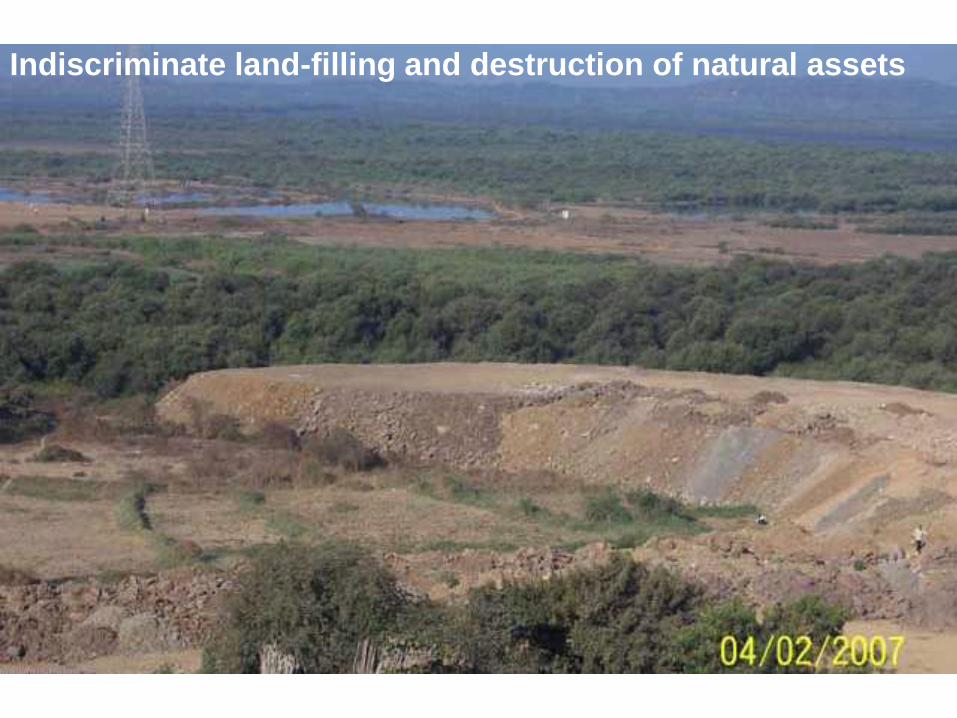
Indiscriminate land-filling and destruction of natural assets

Degeneration of beaches

MUMBAI
A brief background


Navi Mumbai
Thane
AREA – 483 SQ KM
POPULATION – 12.50 MILLION

Mumbai’s natural assets
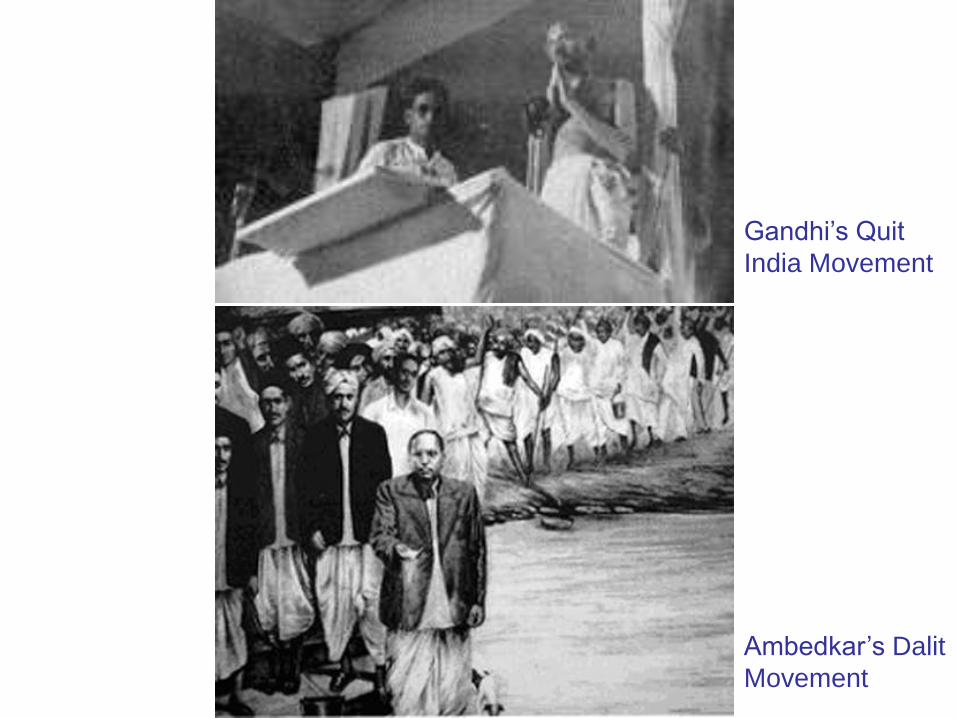
Gandhi’s Quit
India Movement
Ambedkar’s Dalit
Movement

Historical working class & slum dwellers movements

Citizens’ movements
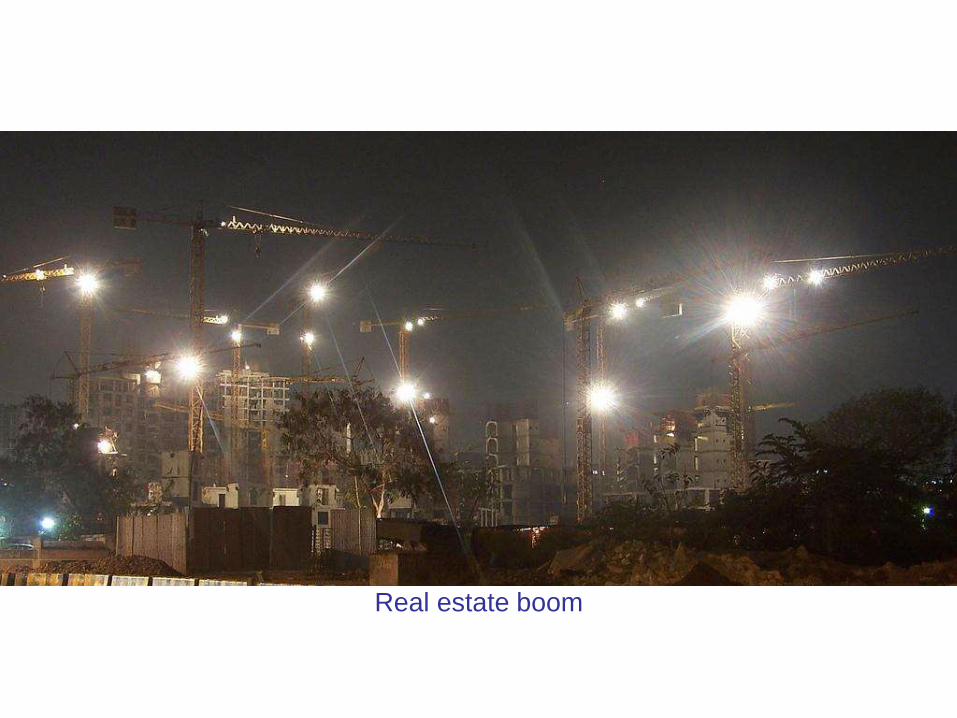
Real estate boom

Growth of exclusive health and educational facilities

Malls & entertainment plazas – our new public spaces

Rise of the informal sector

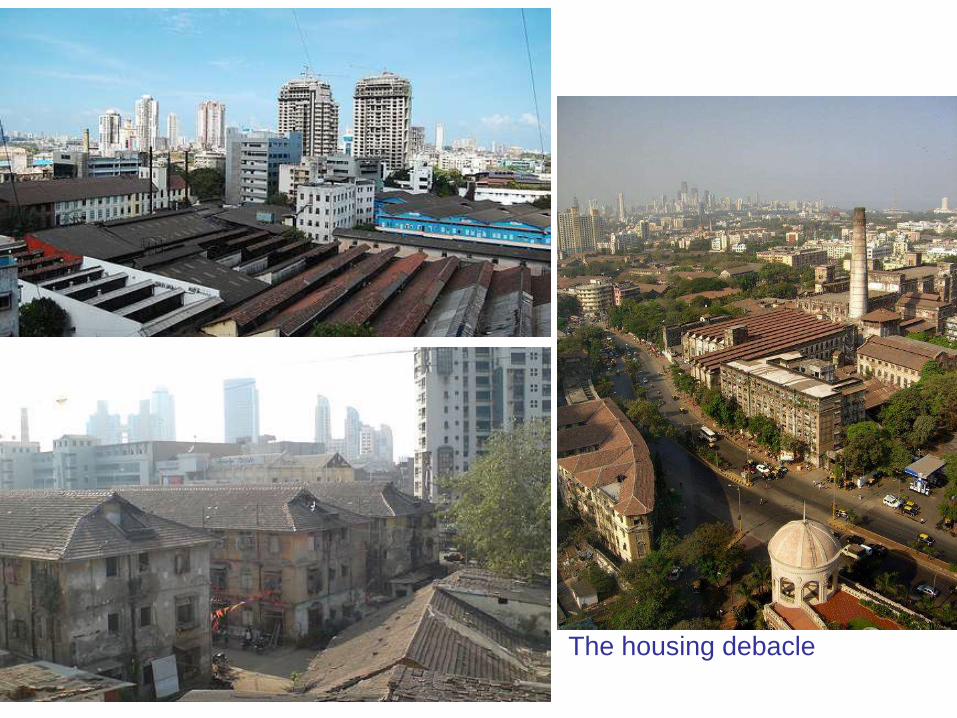
The housing debacle

Ongoing slums redevelopment

Typical slums redevelopment example


Forced evictions


A skewed SRD policy
The slums dwellers are subject to greater abuse
and displacement.

An irrelevant Development Plan
There is no land reserved for affordable housing.
Land reserved for housing is open to speculative investment.
Inadequate social amenities.
SLUMS REDEVELOPMENT
and
AFFORDABLE HOUSING
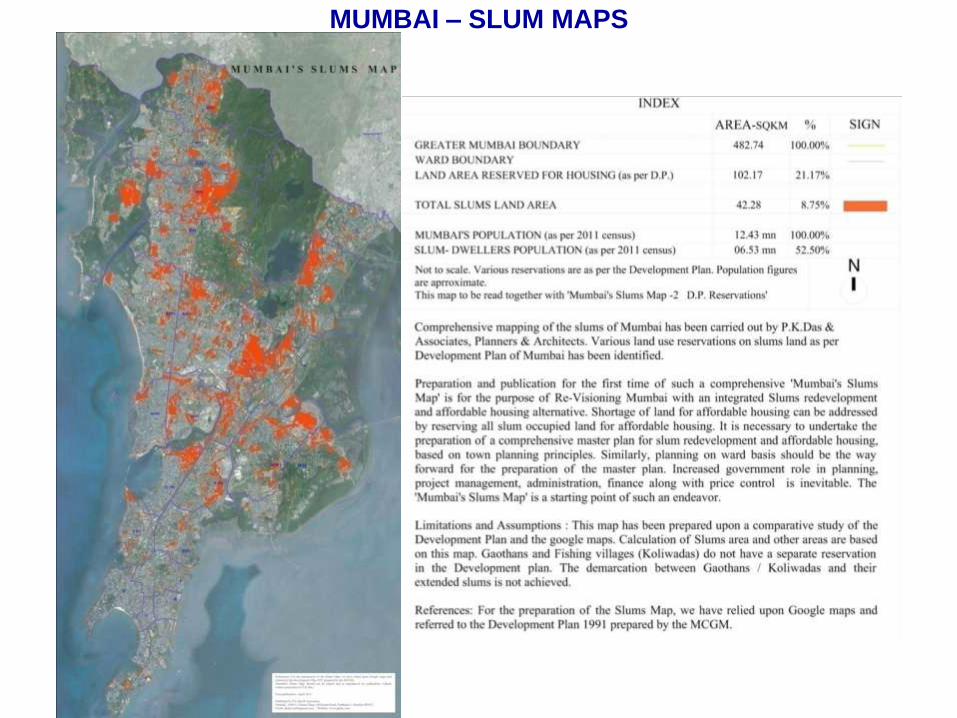
MUMBAI – SLUM MAPS

MUMBAI – SLUM MAPS

RESERVE SLUMS LAND FOR AFFORDABLE HOUSING
• Satellite mapping shows nearly 50% of Slum habitations occupy land
reserved for housing. These constitute only 9% of the land mass of the
city of Mumbai.
• Shortage of land can be solved by reserving all slum occupied land for
affordable housing
• All slum layouts usage should be reserved exclusively for affordable
housing with 2.5 FSI
• Affordable housing stock is being lost in SRA projects with upper class
construction cross- subsidizing slum rehab. Slum lands should be
entirely used for low cost housing to maximize affordable housing
stock.
OBJECTIVE

1. Increased Government role in Administration, Finance and Price
Control.
2. Modified / Amended SRD policy – Redefine private / builders’
participation.
3. Slum dwellers financial contribution with soft long term loans facility
4. Empanelment for Architects, Project Management Consultants and
Construction agencies.
5. Prepare master plan on Town planning principles, on Ward basis for
affordable housing to minimize displacement.
6. Restrict FSI to 2.50. L I G housing requires more land and less FSI to
balance density.
OPERATING PRINCIPLES

42.30 sq km slums land area is available for slums rehabilitation and additional low-cost
housing.
With 2.5 FSI we get 105.75 sq kms or 105 million sq meters to build.
Existing slum dwellers population is approximately 7.5 million or 1.5 million families.
1.5 million famlies x 30 sq mt. house area = 45 sq mts million FSI area.
Balance FSI is 105 million sq mts less 45 million sq mts = Say 60 million sq mts
(ie 60 sq kms)
Build additional affordable housing stock with say 55 sq mts average unit area
(45,55 and 65 sq mts units)
Therefore 60 million sq mts = 1.10 million additional housing stock logistically possible
55 sq mts
Note: Additional housing stock is required for displaced slums from untenable sites, PAPs,
population in-growth and new demands.
AFFORDABLE LOW COST HOUSING PRODUCTION
Target = 2.60 million units

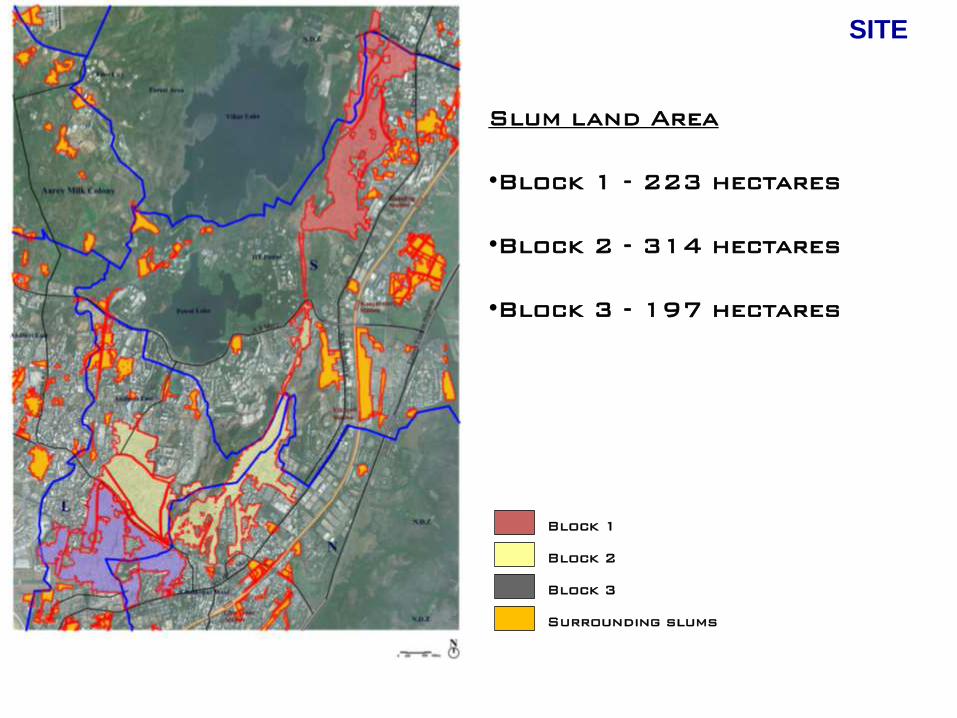
MUMBAI SLUMS – zoning map
site
ZONING OF THE ENTIRE MUMBAI
SLUMS HAS BEEN PROPOSED TO
ACHIEVE A SIMULTANEOUS
COMPREHENSIVE REDEVELOPMENT

SITE
site
Key plan (Not to scale)
Nos. Area (sq.m.)
Area
(ha)
Total Slum land area of
Mumbai 42,280,000 4228
Total Slum population of
Mumbai 6,530,000
Existing Slum Area of
selected Zone 7,342,403 734
Existing Slum Population
of selected Zone 620,000
No. of housing Units in
selected Zone 124,000

SITE
D.P. reservation on slum land
SITE
Block 1
Block 2
Block 3
Surrounding slums
Slum land Area
•Block 1 - 223 hectares
•Block 2 - 314 hectares
•Block 3 - 197 hectares

SITE PLAN
Planning concept:
•At the heart of the planning concept is
a network of public open spaces.
•A network of pedestrian pathways and
open spaces meander through the entire
site thus, integrating and inter-
connecting the various residential
areas.
•Several common squares and a range
of social amenities, essential shops and
other conveniences would be proposed
along these open spaces.

SITE PLAN
Block 1
KEY PLAN
Existing slum land area – 223 HA
Restored areas as per d.p.
reservation –
1. Open space (pg/rg/p/g) – 28 ha.
SITE PLAN
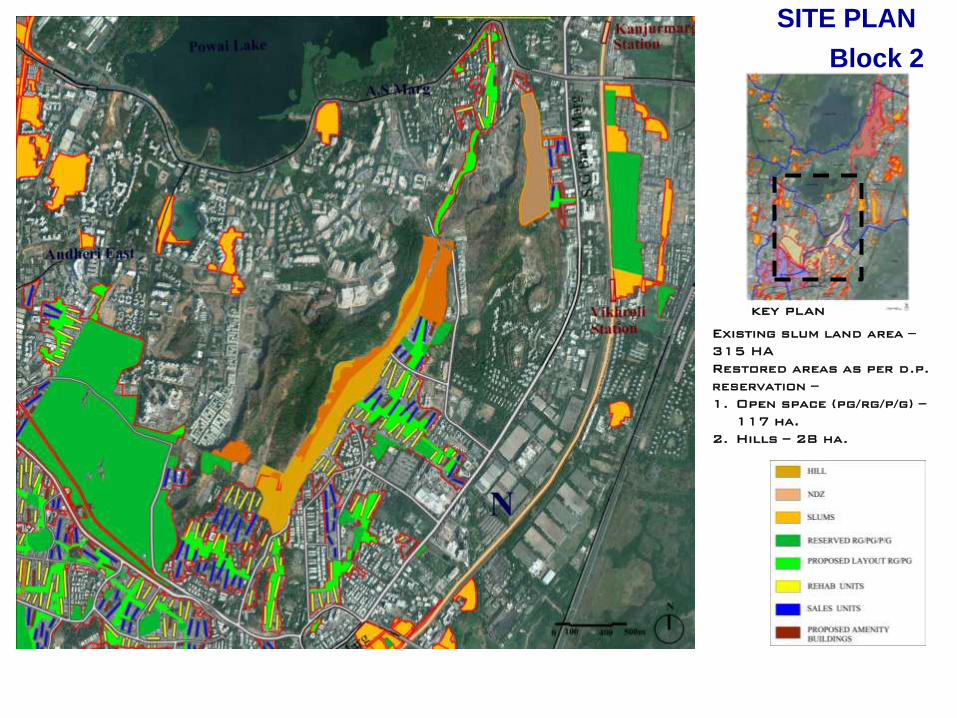
Block 2
key plan
Existing slum land area –
315 HA
Restored areas as per d.p.
reservation –
1. Open space (pg/rg/p/g) –
117 ha.
2. Hills – 28 ha.

SITE PLAN
Block 3
KEY PLAN
Existing slum land area – 197 HA
Restored areas as per d.p. reservation –
1. Open space (pg/rg/p/g) – 48 ha.

Cluster view

Entire Mumbai slums
Area calculation
Calculations for the entire slum areas of Mumbai
Nos. Area (sq.Km.) Area (Ha)
Total Slum Land Area of Mumbai 42.28 4228
Balance Slum Land Area excluding DP Reservations
on open spaces & natural assets38.06 3806
Layout RG (15% of balance land area) 5.71 570.9
Total Developable Land Area 32.35 3235.10
Transport & Infra (15% of developable land area) 4.85 485.27
Total Buildable Land Area 27.50 2749.84
F.S.I (2.5 * developable land area) on 25.73 sq. km. 3.0
Total Built-up area (F.S.I. * developable land area) 97.05 9705.30
Amenity Buildings (5% of built-up area)4.85 485.27
Built- up area of housing units (@ 35 sq.m./ unit) 92.20 9220.04
Each unit area0.000035
0.0035
Total No. of Housing Units - Rehab + Sales2,634,296
No. of Rehab Units 1,317,148
Rehab Population 6,585,739
* Balance slum land area obtained by freeing D.P. reservations on open spaces and natural assets.

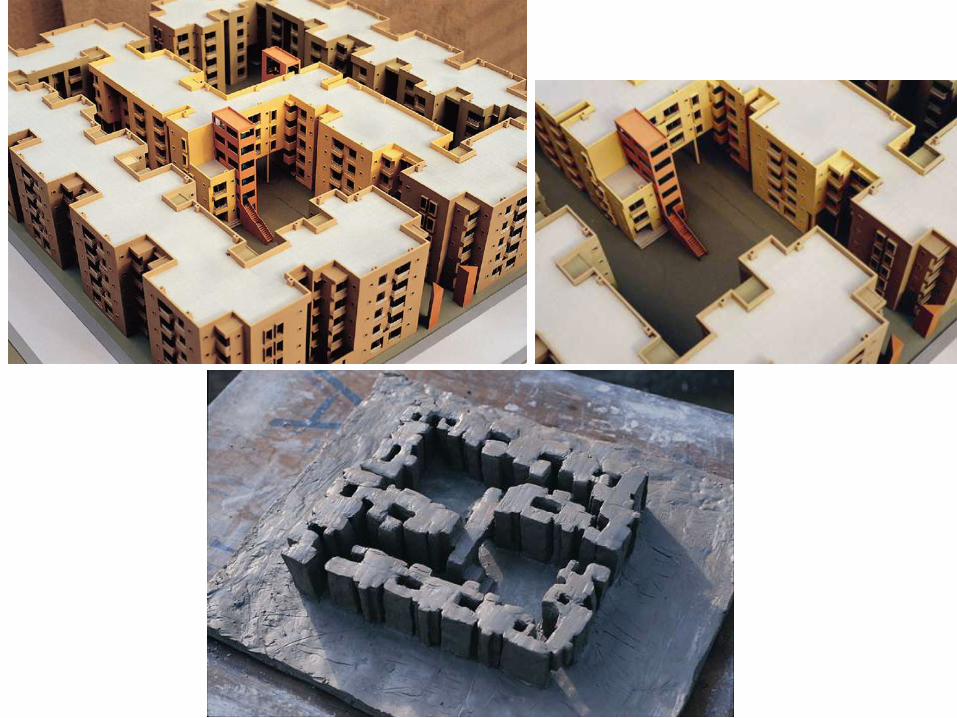
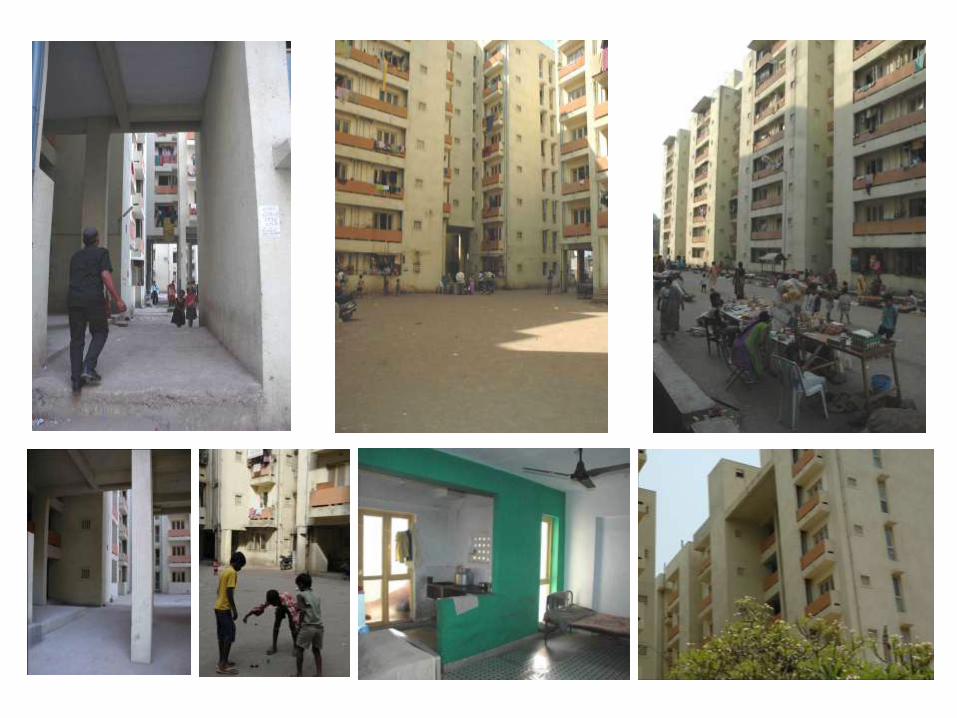
SLUMS REDEVELOPMENT
EXAMPLES
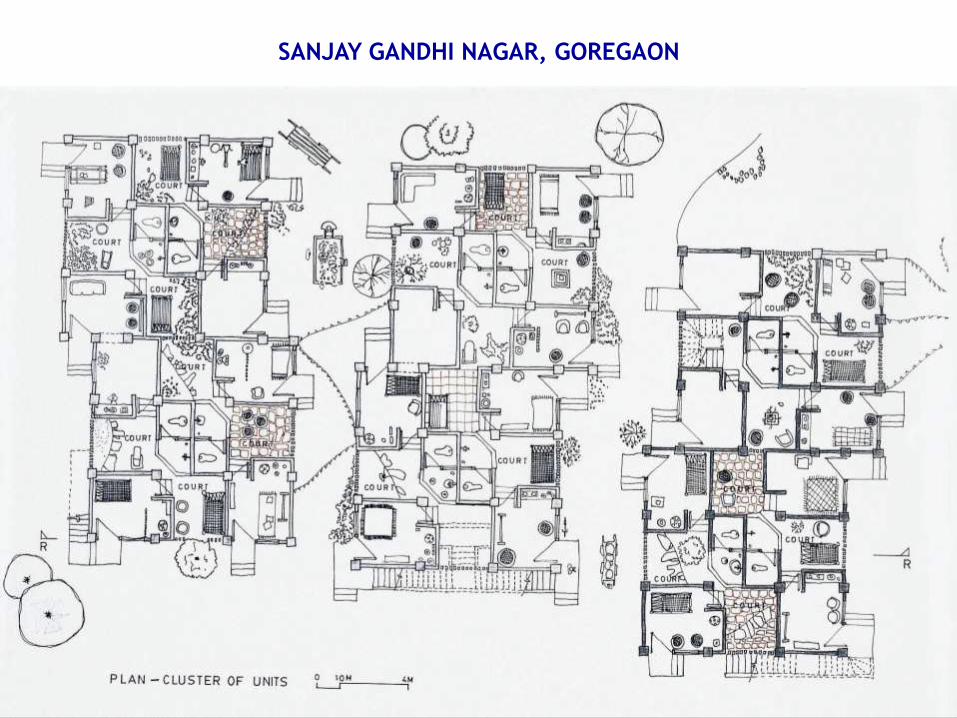
SANJAY GANDHI NAGAR, GOREGAON


AREA – 13 ACRES
NO OF UNITS – 300


CHANDIVALI – A VISION OF HOPE

BEFORE & DURING DEMOLITION
80,000 FAMILIES TO BE EVICTED
25,000 FAMILIES ELIGIBLE FOR REHABILITION
NIVARA HAKK IS THE DESIGNATED NGO
SANJAY GANDHI NATIONAL PARK

Location:
Chandivali Village
Surroundings:
• Nahar Amrit Shakti Residential Complex
• Tata Symphony Residential Towers
• Behind Hiranandani Development., Powai.
• Adjacent to Khairani Rd, Ghatkopar (E)
• 15 minutes to Ghatkopar Station.
Land Details:
• Plot CS No.6, part 11, part 12, part16, part 20, part
25, ward-L
• Land area 305466.35mt ( approx 75.46Acres)
CHANDIVALI REHABILITATION SITE

Total land area – 3,13,621 sq mt ( 77.47 acres)
Total built-up area – 6,58,604 sq mt
Density achieved - 550 units/ha
1. Houses – 18,362 (26.62 %)
2. Social infracture – 13.5 %
Primary schools 8
Secondary schools 2
High schools 2
Community halls 2
Women’s welfare centres/creches 180
Balwadis 80
Society offices 60
Religious institutions 4
3. Facilities 8.6%
Markets 13 (800 shops)
Hospital 1
Consulting rooms 12
Clinics and polyclinics 6
Day care centre/nursing homes 6
4. Commercial development 6.1%
Shops, banks, post offices,
communication centres,
restaurants,Cinemas,
Industrial estates etc. 19432.83 sqmt
5. Open spaces 15.03%
Central maidan 1 10,250 sqmts
Neighbourhood parks 3 2550x3 sqmts
Courtyards 60 450x60sqmtsPOSTERS FOR PUBLIC PARTICIPATION & DISCUSSION

Poster 1- Typical Cluster Poster 2- Amenities Poster 3- Typical House
POSTERS FOR PUBLIC PARTICIPATION & DISCUSSION


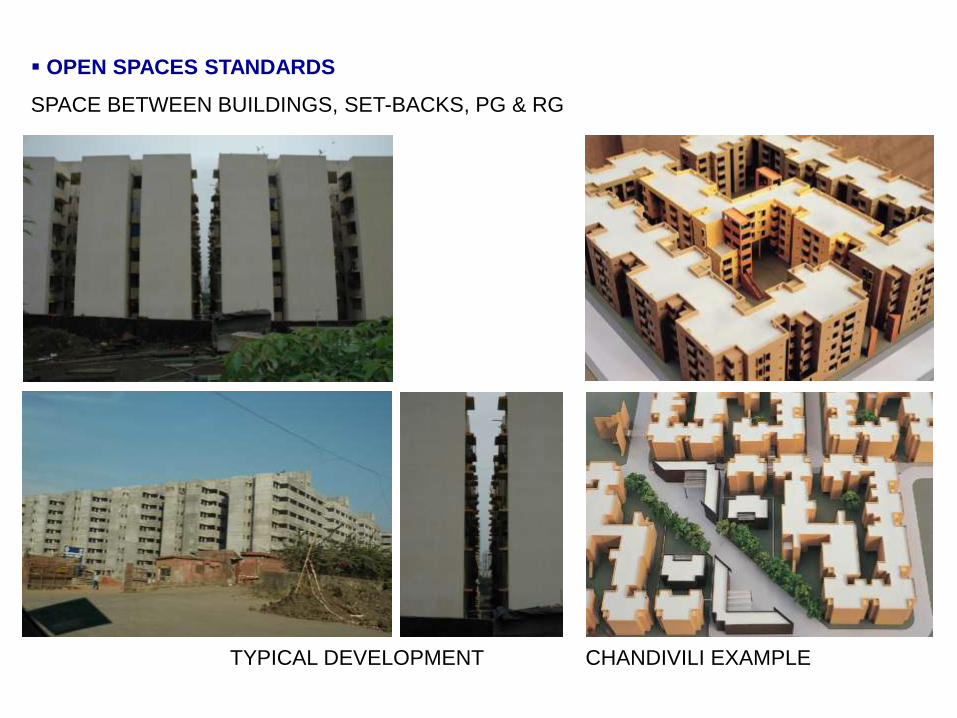
SPACE BETWEEN BUILDINGS, SET-BACKS, PG & RG
TYPICAL DEVELOPMENT CHANDIVILI EXAMPLE
OPEN SPACES STANDARDS

A Typical Re-Development Example At Tank Pakhadi Road
‘ASHRAY’ – CONSERVANCY STAFF QUARTERS

Typical Building Plan

BAITHAKBAITHAK
STREETSTREET
FOYER
FOYERFOYER
FOYER
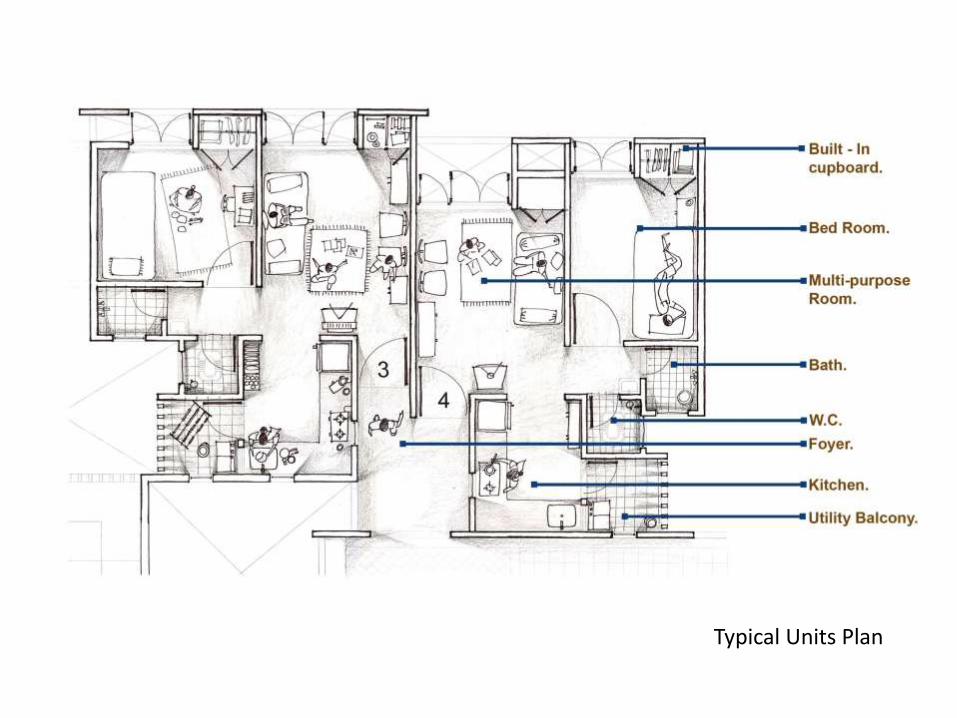
Typical Units Plan

BEDROOMLIVING
ROOM
LIVING
ROOM
BEDROOM
BATH
WCBATH
WCKITCHEN
KITCHENUTILITY
UTILITYFOYER
BAITHAK
STREET
FOYER
1
2
LIFT

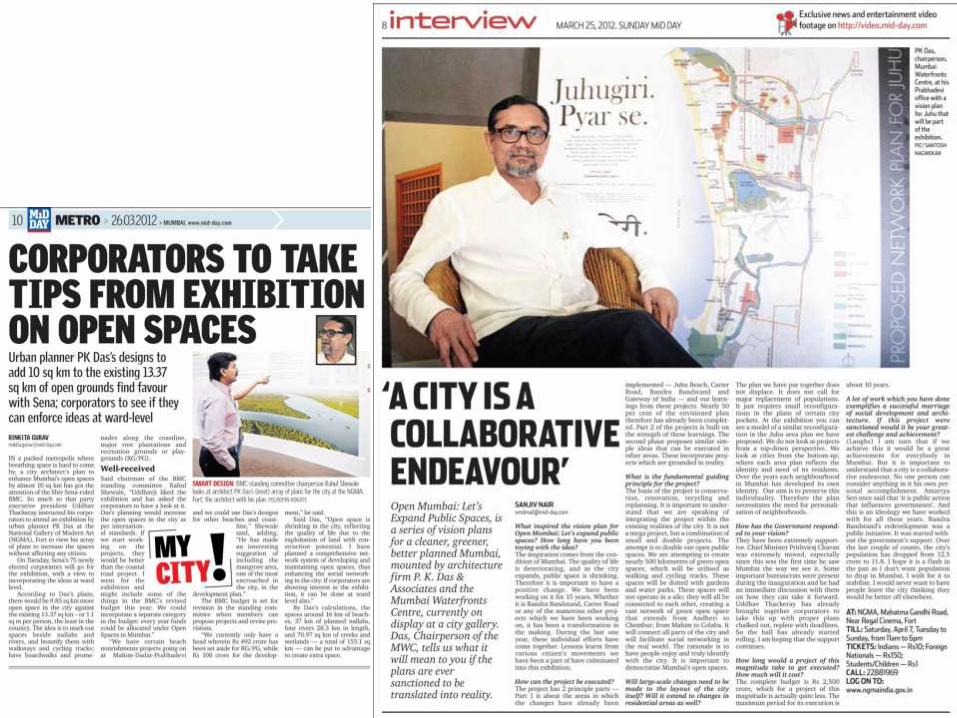
EXPANDING PUBLIC SPACES
‘OPEN MUMBAI’

As Mumbai expands, its open spaces are shrinking. The democratic
'space' that ensures accountability and enables dissent is also shrinking,
very subtly but surely.
The city's shrinking physical open spaces are of course the most visible
manifestation as they adversely affect our quality of life.
Open spaces must clearly be the foundation of city planning. An 'Open
Mumbai' ensures our physical and democratic well-being.
Instead, over the years, open spaces have become ‘leftovers’ or residual
spaces after construction potential has been exploited.
Through this plan, we hope to generate dialogue between people,
government, professionals … and within movements working for social,
cultural and environmental change.
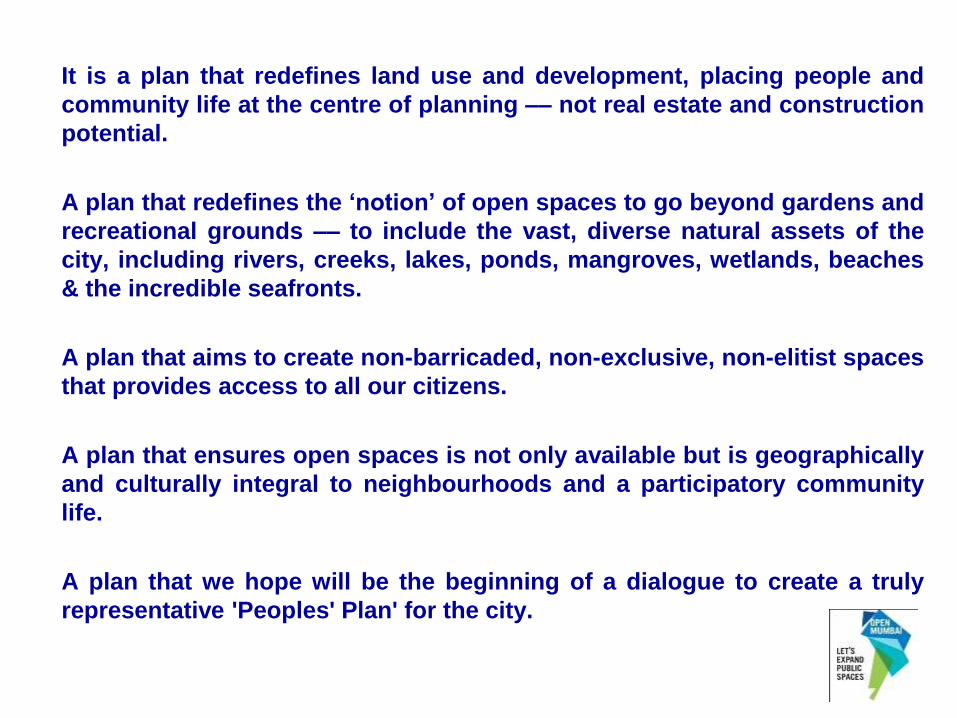
It is a plan that redefines land use and development, placing people and
community life at the centre of planning –– not real estate and construction
potential.
A plan that redefines the ‘notion’ of open spaces to go beyond gardens and
recreational grounds –– to include the vast, diverse natural assets of the
city, including rivers, creeks, lakes, ponds, mangroves, wetlands, beaches
& the incredible seafronts.
A plan that aims to create non-barricaded, non-exclusive, non-elitist spaces
that provides access to all our citizens.
A plan that ensures open spaces is not only available but is geographically
and culturally integral to neighbourhoods and a participatory community
life.
A plan that we hope will be the beginning of a dialogue to create a truly
representative 'Peoples' Plan' for the city.

Objectives:
• Expand and network public open
spaces
• Conserve natural assets & protect
eco-sensitive borders
• Prepare a comprehensive
waterfronts plan
• Establish walking and cycling
tracks
• Promote social, cultural and
recreational opportunities
• Evolve and facilitate participatory
governance practices
• Democratise public spaces
• Undertake necessary amendments
in the DP and DCR.
‘Open Mumbai’ Plan Elements:
• Vast Seafronts
• Beaches
• From Rivers To Nullah’s To Rivers
Again
• Creeks and Mangroves
• Wetlands Conservation
• Lakes Ponds and Tanks
• Integration Of Nullah’s
• Parks and Gardens
• Plots and layout RG’s
• Historic forts and Precincts
• Hills and forests
• City Forests
• ‘Open’ people-friendly Railway
Stations
• Area Networking
OBJECTIVES & ELEMENTS


INCREDIBLE SEAFRONTS: PROMENADES AND PLAZAS

Seafront Promenades
Sr No. Name Location Area (sqm)
1 Gateway Gateway 3428.08
2 Marine Drive Marine Drive 83217.90
3 Haji-Ali Haji-Ali 10227.03
4 Worli Worli 43579.37
5 Band-Stand Bandra 14197.41
6 Carter Rd. Bandra 16044.79
Total area of existing promenades 0.17
Sqkm
Total area of proposed promenades 0.75
Sqkm
Total area of promenades 0.92
Sqkm

BANDRA BANDSTAND

BANDRA BANDSTAND

CARTER ROAD

CARTER ROAD

GATEWAY OF INDIA PLAZA

Waterfront PlazasSr
No.
Name Location Area (sqm)
1 Gateway Gateway Of India 18091.85
2 Land’s End Bandra Fort 18651.59
Total area of waterfront plaza 0.03 sq.km
GATEWAY OF INDIA PLAZA

BEACH CONSERVATION AND NOURISHMENT

Beaches
Sr No. Name Location Area (sqm)
1 Girgaon Girgaon 161985.33
2 Prabhadevi Prabhadevi (including nourishment) 35373.94
3 Dadar Dadar 18788.57
4 Mahim Mahim 14376.31
5 Juhu Juhu 314930.06
6 Versova Versova 338484.43
7 Madh Madh 164248.24
8 Erangal Erangal 19388.28
9 Aksa Aksa 296997.71
10 Manori Manori 31764.76
11 Gorai Manori 31764.76
Total area of beaches 1.42 sqkm

JUHU BEACH

JUHU BEACH

FROM RIVERS TO ‘NULLAHS’ TO RIVERS AGAIN

Avenues And Promenades Along Rivers
Sr No. Name LocationArea (sqm)
Of the river
Area(sqm)
Of the
proposed
development
Total
Area(sqm)
Of river
alongwith
development.
1 Mithi
River
Originates from the
overflow of Vihar
Lake, flows through
Arey Milk Colony,
Powai, Saki Naka,
Kurla, Kalina, Vakola,
Bandra-Kurla
complex, Dharavi and
Mahim and meets the
Arabian sea.
998164.2 12178972078164.2
2 Oshiwar
a RiverStarts from Sanjay
Gandhi National Park
and meets in Arabian
Sea at Versova Creek
284280.5 48545.26 716280.5
3 Dahisar
RiverOriginates from Tulsi
lake in Sanjay Gandhi
National Park and
meets the manori
Creek
161248.4 88277.71 821248.4
4 Poisar Borival West 57067.75 78996.69 327067.75
Total area of avenues and promenades
along rivers
1500761 1433717 3942760.85
1.5 sqkm 1.43 sqkm 3.94 sqkm

MITHI RIVER
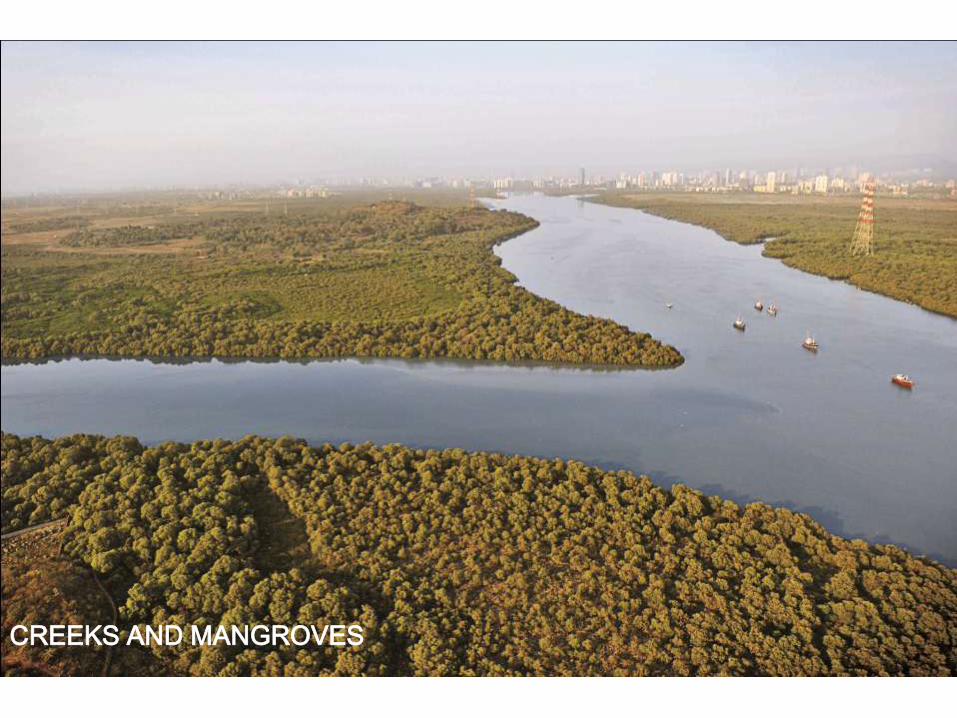
CREEKS AND MANGROVES

Avenues And Promenades Along Creeks
Sr No. Name Location Area (sqm)
Of the creeks
Area(sqm)
Of the
proposed
development
Total
Area(sqm)
Of creeks
alongwith
development
1 Malad
Creek
Located at the
west of Malad
west and
continues till
Malad Marve Rd.
2990463.00117000
3107463
2 Creek
Near
Mankhurd
Located at
Mankhurd 1013750.32 207000
1220750
3 Creek
Near
Mulund
East
Mulund East 113050.41 113050.41
4 Creek at
sewri70857.89 70857.89
5 Manori
Creek 4415577.90 4415577.90
6 Creeks
near
Ghatkopar
Ghatkopar East 370069.56 370069.56
7 Creeks
near
Vikhroli
202920.72 202920.72
8 Creeks
near
mulund
70392.71 70392.71
Total area of avenues and promenades 9247083
324000 9571082
9.25 sqkm 3.24 sqkm 9.57sqkmSummary Areas of Mangroves
Total Area Of Mangroves ……………………………………..61.72 Sqkm
Total Area of boardwalks along mangroves…………....... 0.197 Sqkm
Total Area of mangroves along with boardwalks…..........61.917 Sqkm

MALAD CREEK

WETLANDS CONSERVATION

Avenues Along Wetlands
Sr No. Name Area (sqm)
1 Wetlands 8.01 sqkm
2 Avenues 0.66 sqkm
Total development area 8.67 sqkm
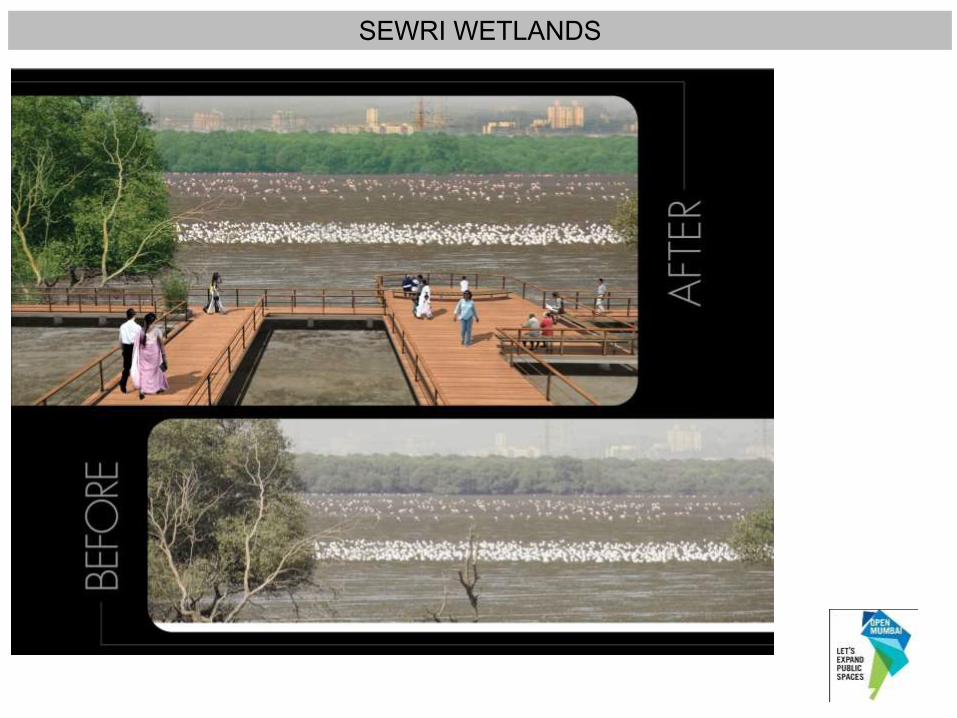
SEWRI WETLANDS
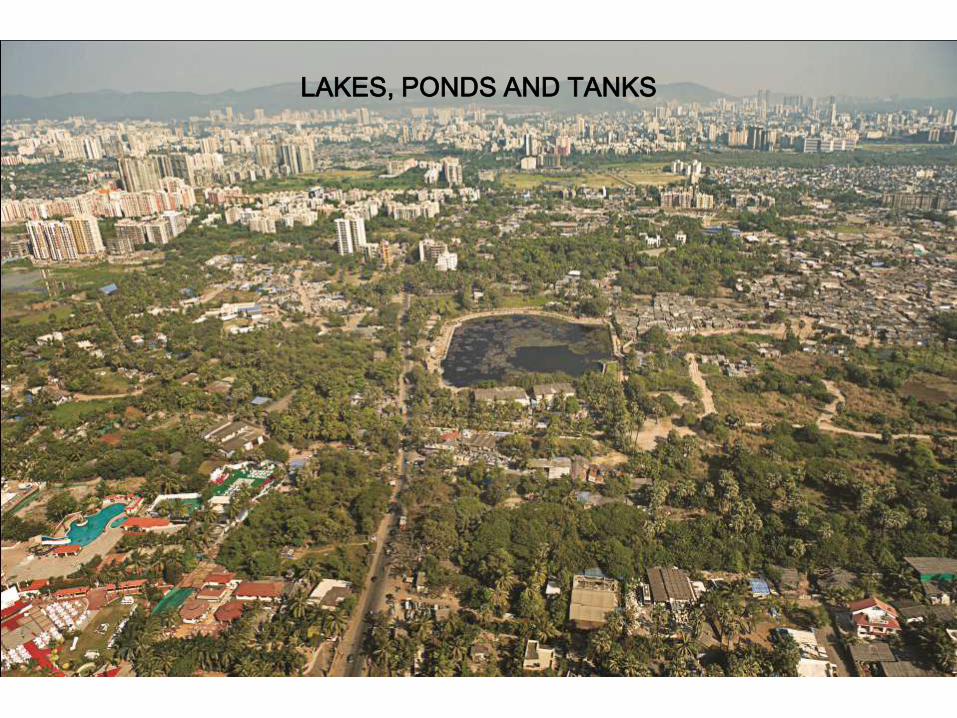
LAKES, PONDS AND TANKS

Lakes, Ponds And Tanks
Sr No. Name Location Area (sqm)
Of the water
body
Area(sqm)
Of the proposed
development
Total Area(sqm)
Of water body
alongwith
development
1 Banganga Tank Malabar Hill 2073 1950.67 4023.67
2 Bandra Talao S.V.Rd, Near Bandra
Station W
24401.50 3155.58 27557.08
3 Water body at BKC 61196.19 61196.19
4 Bhavans Lake Andheri W 10469.74 10469.74
5 Deval Talao Near Seepz Rd A,
Andheri E
15610.83 4108.15 19718.98
6 Chandivali Lake Near Chandivali Farm
Rd, Chandivali
38324.17 11550.22 49874.39
7 Nitie Pond powai 15342.04 15342.04
8 Aarey Tank Aarey colony, Goregaon
E
21966.21 21966.21
9 Kharodi Lake Malad West 20639.37 20639.37
10 Charkop Village
Lake
Charkop 7321.94 7321.94
11 Bhujavale Talao Nr link Rd, Malad W 2744.24 2744.24
12 Jhasi Ki Rani
Laxmibai Udyan
Link Rd, Borivali W 7875.74 7875.74
13 Eksar Talao Borivali W 2017.26 2017.26
14 Lokmanya Tilak
Visarjan Talao
Jogeshwari –Vikhroli
Link Rd, Jogeshwari E
4371.22 4371.22
15 SCI pond Chandivali 7563.41 7563.41
16 Sheetal Lake LBS Rd, Sakinaka 11364.27 11364.27
17 Teen Talao Hemu Kalani Marg,
Chembur
5267.40 5267.40
18 Ishwar Kund Bhandup W 20350.65 20350.65
19 Bhandup W 8222.85 8222.85
20 Powai Lake 1510165.39 1510165.39
21 Vihar Lake 4214866.94 4214866.94
22 Tulsi Lake 1187856.86 1187856.86
Total area of lakes, ponds and tanks along with
development.
7200011 20764.62 7220776
7.2 sqkm 0.02 sqkm 7.22 sqkm

BANDRA LAKE

INTERGRATION OF ‘NULLAHS’

Avenues Along Nullahs
Sr
No.
Name Location Area (sqm)
of nala
Area (sqm)
Of proposed
development
Area (sqm)
including
development
1 Irla Nullah Juhu 149254.7 175600.6 324855.3
2 Kurla Nullah Originates in Tilak
Nagar and meets
in Arabian sea
along Chembur
Sewri Rd.
248061.46 163135.2 411196.7
3 Mahalaxmi
Nullah
Originates from Dr
E Moses Marg
and continues till
Arabian Sea
33761.6 35956.18 69717.78
4 Bandra Kurla
Complex
Nullah
Originates from
mithi river and
continues till
Sahar Airport
102790.16 121671.9 224462.1
5 Govandi Nullah 105438.2 92661.84 198100
6 Chembur
Nullah
25597.39 39735.04 65332.43
7 Ghatkopar
Nullah
70691.58 14376.45 85068.03
8 Jogeshwari W
Nullah
Originates from
Malad creek and
flows through
Jogeshwari W
82085.64 60264.36 142350
Sr No. Name Location Area (sqm)
of nala
Area (sqm)
Of proposed
development
Area (sqm)
including
development
9 Oshiwara
Nullah
Originates at
Oshiwara River
and flows
through
Jogeshwari
38025.52 67578.29 105603.8
10 Vikhroli
Nullah
62509.85 30027.21 92537.06
11 Mulund
Nullah
26231.80 102594.2 128826
12 Kandivali
Nullah
Kandivali 169722.20 211072.00 380794.2
13 Bhandup
Nullah
Bhandup East 429189.76 109222.45 538412.2
14 Aarey Milk
Colony
Nullah
147557.8 159755.5 307313.3
15 Prabhadevi
Nullah
Near
Kalanagar,
Prabhadevi
11398.52 36480.67 47879.19
16 Dahisar
Nullah
33995.08 61429.97 95425.05
Total area of nullahs along with
development.
1736311 1481562 3217873
1.73 sqkm 1.48 sqkm 3.21 sqkm

IRLA NULLAH
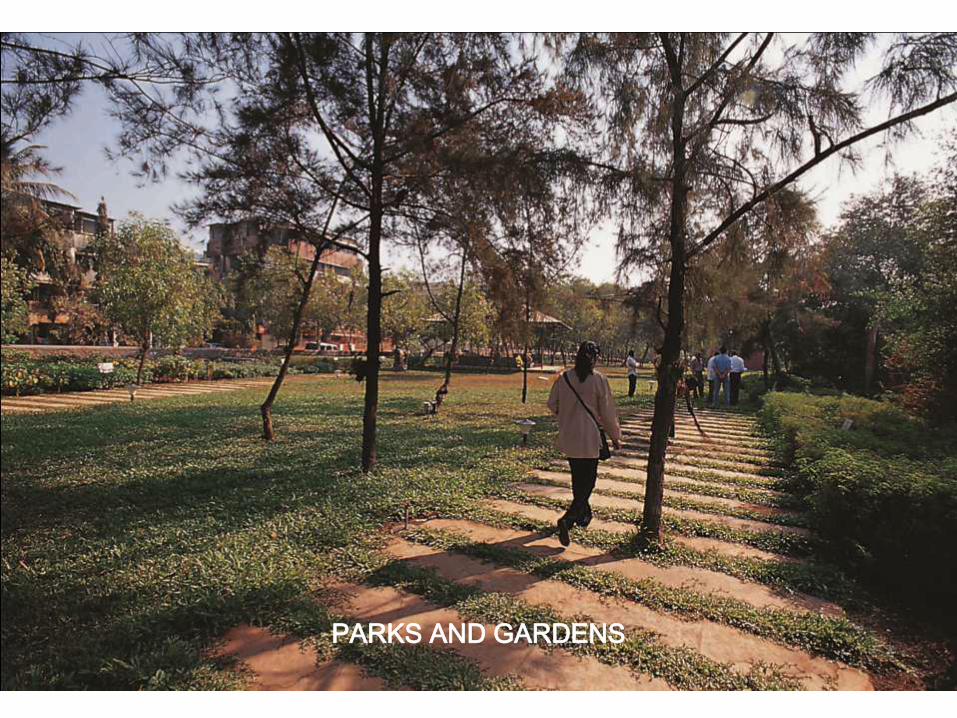
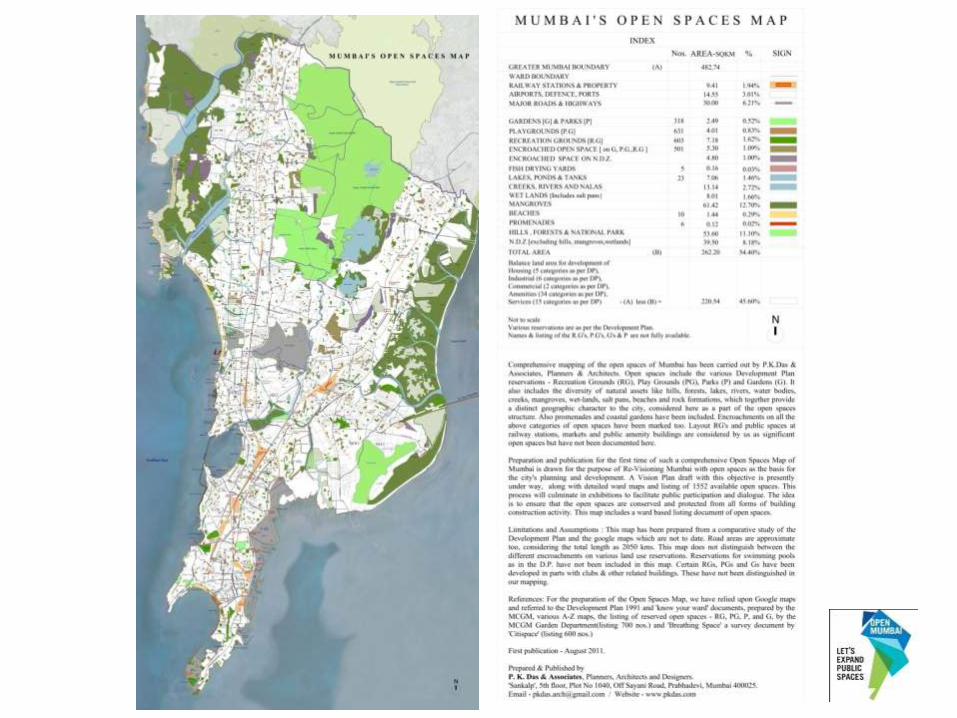
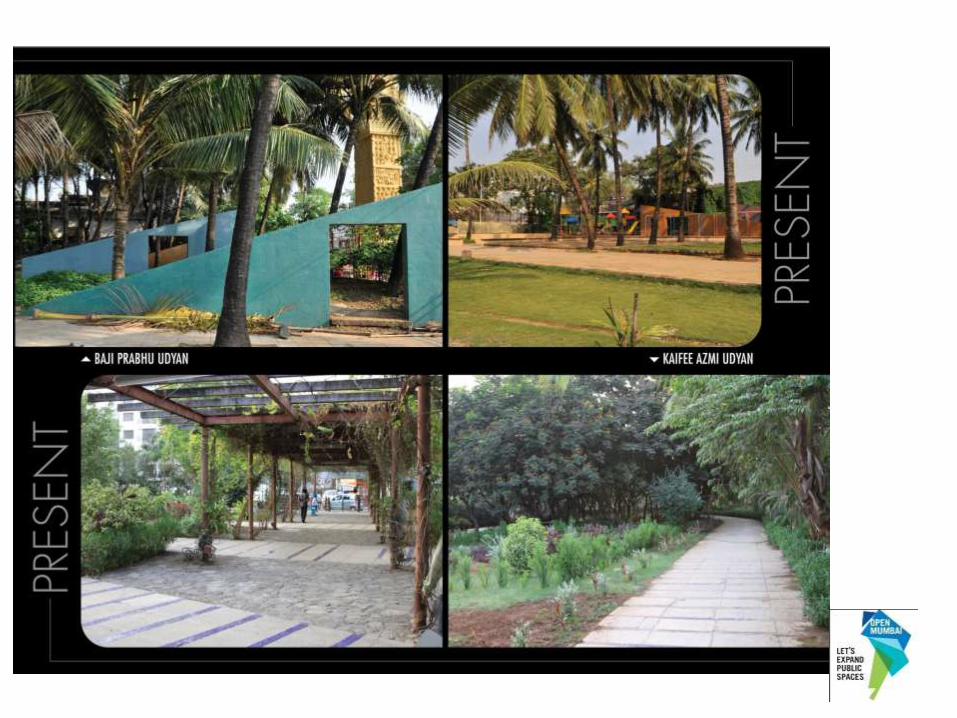
PARKS AND GARDENS

Playgrounds, Parks and Gardens
Type of open space Total nos. all over Mumbai Total Area
(sqkm)
Gardens (G) 318 2.49
Playgrounds (PG) 631 4.01
Recreational Ground (RG) 603 7.18
Total 1552 13.68 sqkm
Encroached G, PG, RG 501 5.30 sqkm
Grand Total 2053 18.98 sqkm

HISTORIC FORT PRECINCTS

Historic Forts And Precincts
Sr. No
Name of the
fort Location Area(sqkm)
1 Sewri Fort Sewri 9569.95
2 Bandra Fort Bandra 8950.19
3 Sion Fort Sion 53810.02
4 Kala Killa Sion 1292.85
5 Worli Fort Koliwada 4969.15
6 Mahim Fort Mahim 4328.07
Total area
82920.23
0.083
sqkm
BANDRA FORT

BANDRA FORT

BANDRA FORT

HILLS & FORESTS

Hills And Forests
Sr No. Name Location Area (sq m)
1 Madala Hill Chembur 6333524.54
2 Gilbert Hill Andheri 6195.11
3Sanjay Gandhi
National ParkBorivali
46685597.1
0
4Aarey Milk
ColonyGoregaon
11230000.0
0
Total area of Hills and forests 64.31 sqkm
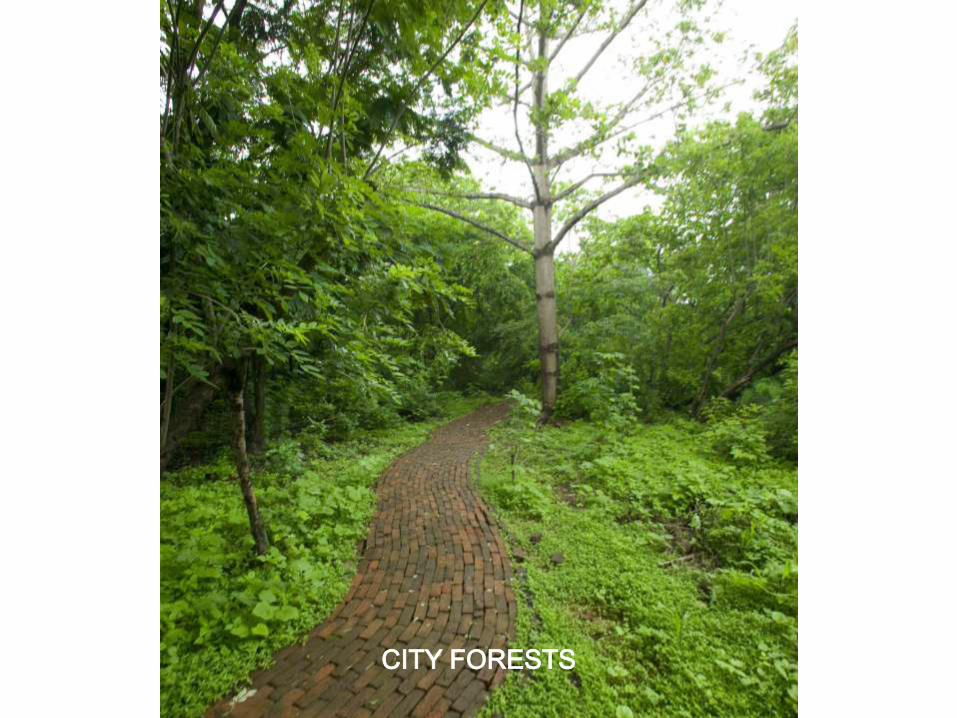
CITY FORESTS

City Forests
Sr No. Name Location Area (sqm)
1 Juhu Forest Juhu, Beside Irla Nala 29687.60
2 Mahim Nature Park Mahim 18826.32
3Mumbai Port trust
GardenNear Colaba Causeway Rd 49398.43
4Veer Jijabai Bhosale
Udyan
Dr. Bbasaheb Ambedkar Rd,
Byculla E, Mumbai-27216936
Total area of existing city forest 0.31sqkm
5Proposed city forest at
Goregaon WestGoregaon West 1300000
6Proposed city forest at
Chembur WestChembur West 200000
Total area of proposed city forest 1.5 sqkm
Total area of city forest. 1.8 sqkm

‘OPEN’ PEOPLE FRIENDLY RAILWAY STATIONS

Space around railway stations are probably the most chaotic city space, making entrances and exits very difficult.
Lack of open space and poor planning have led to this degeneration thus, making lives of millions of people who depend on railtransport, painful.
In Mumbai, over 6.9 million people travel by local train every day . The city and its suburbs have 51 stations. The total roof area ofthese stations would add up to approx. 627300 sq.mtrs. (155 acres).
Creating additional space at the railway stations would be a significant urban development endeavor.
Question is, how do we create more open space at railway stations, clear the present congestion and provide dignity tocommuters?
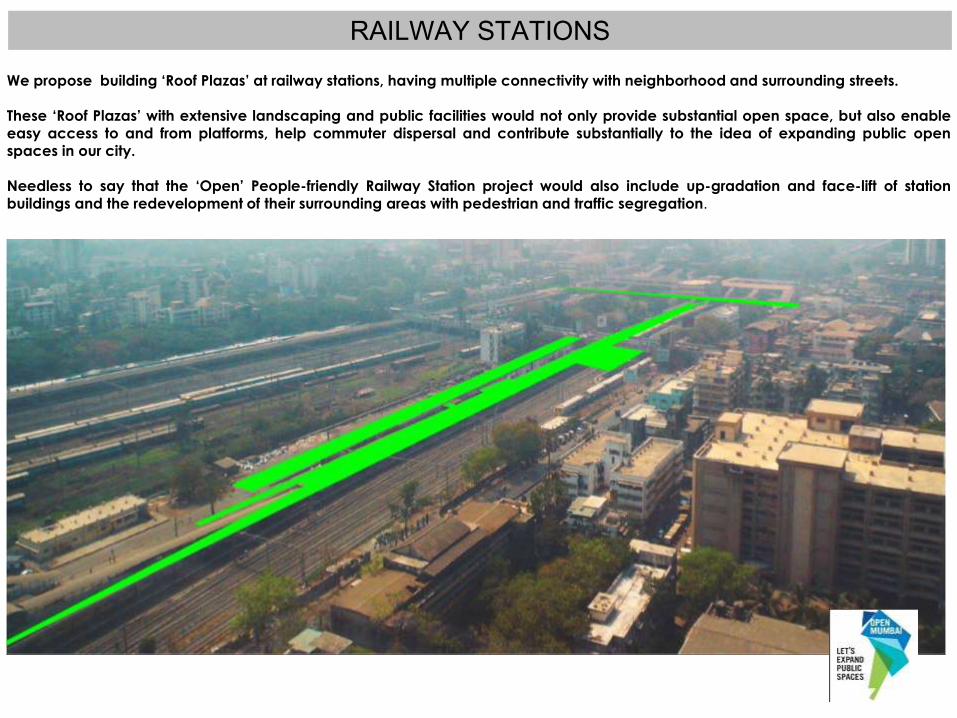
We propose building ‘Roof Plazas’ at railway stations, having multiple connectivity with neighborhood and surrounding streets.
These ‘Roof Plazas’ with extensive landscaping and public facilities would not only provide substantial open space, but also enableeasy access to and from platforms, help commuter dispersal and contribute substantially to the idea of expanding public openspaces in our city.
Needless to say that the ‘Open’ People-friendly Railway Station project would also include up-gradation and face-lift of stationbuildings and the redevelopment of their surrounding areas with pedestrian and traffic segregation.
RAILWAY STATIONS

DADAR STATION

DADAR STATION

KHAR STATION

KHAR STATION

AREA NETWORKING

VISION JUHU

‘OPEN MUMBAI PLAN’

These plans and proposals are essentially rooted in ideas of conservation,
restoration, recycling, re-planning and re-structuring existing realities and
their spatial transformation.
Rather than mega projects with large-scale displacements and enormous
revenue burdens, this approach is based on more pragmatic and people-
oriented alternatives.
Firstly, we believe that all re-developments should recognise and respect
existing realities as part of the planning and urban development process.
Public open spaces as the basis of planning are an effective means to
achieve these objectives. Such an approach engages citizens, leads to
better quality life and ensures a more ‘democratic’, more equitable city.
By achieving intensive levels of citizens’ participation we wish to engage
and influence governments to devise comprehensive plans for public
spaces.
CONCLUSION


LET’S BUILD OPEN CITIES
THANK YOU