demonstration of the softvision software visualization
TRANSCRIPT
DEMONSTRATION OF THE SOFTVISION SOFTWARE VISUALIZATION FRAMEWORK
Matti Sillanpää
Nokia Research Center Helsinki, Finland
E-mail: [email protected]
Alexandru Telea Eindhoven University of Technology
The Netherlands E-mail: [email protected]
Abstract
When recovering and maintaining the architectures of software systems, effective visual presentations are essential for grasping the concepts and constructs involved. There exist several reverse engineering tools that provide visualizations of architectural information. The tools usually offer a set of views allowing interactive navigation of the architectural information in some predefined ways. However, one almost always needs to customize both presentation and exploration methods of the architectural models, according to their domain type, data size, and exploration goal. The SoftVision toolkit aims to provide this customizability via a modular design, in which all elements of the data exploration process are fully customizable by means of a scripting interface. This interface allows the creation of information processing procedures, and custom navigations, visualizations and user interfaces. In this way, several graphical layouts can be created and combined with interactive data viewers, to yield fully customized applications for exploration of software architectures.
1 Introduction
The SoftVision visualization framework is a general-purpose visual environment for browsing and editing graph-based data. Concrete instances of such data are software architectures, component-based systems, network and web structures, and relational databases. Compared to other similar visualization tools, SoftVision’s main advantage is the freedom it provides for
1
the user to customize and extend its functionality to produce effective visualizations for specific domains and data sets. So far, SoftVision has been used to visualize reverse engineering data (Telea et al., 2002a,b; Telea, 2004), the Internet resource metadata language RDF (Resource Description Framework) (Telea et al., 2003), and component-based software systems (Voinea and Telea, 2004). SoftVision’s architecture and design philosophy are described in detail by Telea et al. (2002a,b). The toolkit is also available for download with its manual at a website (Voinea, 2004). In this paper, we focus on demonstrating the flexibility of SoftVision for building visualizations for reverse engineering applications. First, we give a short description of the main concepts SoftVision is based on, i.e. its data and operation model (Section 2). In Section 3, we present a number of reverse engineering visualization scenarios we have constructed using SoftVision and detail the steps we took to customize the generic framework provided by SoftVision to achieve our specific goals. Our presentation of these scenarios has two aims. First, we illustrate and advocate the effectiveness of a visual exploration tool for understanding architectural data. Second, by detailing the steps we took in constructing our visualizations, we give an indication of the (small) amount of effort needed to achieve such results when using the SoftVision toolkit. Finally, we draw out conclusions in Section 4. 2 Toolkit Overview
The SoftVision toolkit is essentially based on the well-known Model-View-Controller (MVC) architecture (Gamma et al., 1995). The Model represents the data to be visualized (Section 2.2) and operations that process these data (Section 2.3). The Views implement the interactive visualization mechanisms (Section 2.4). Finally, the Controller receives commands from SoftVision’s scripting language and the graphical user interface (GUI), translates them to operations on the Model data, and updates the Views to reflect the changes. These elements are outlined in the following. Telea et al. (2002a,b) have described SoftVision’s architecture in more detail.
2.1 Motivation
Here we present a brief overview of the similarities and differences of the SoftVision toolkit with some tools which we have identified as closely resembling SoftVision by their goals and functionality. We outline the reasons
2
that have led us to the conclusion that SoftVision is needed even though several tools in the field are available. As we shall see in the following, the main contribution of SoftVision is the easy customization concerning the user interface, the operations on the data, and the visualizations. This is why we will take a close look at some implementation details in Section 3, i.e. the steps that the user of SoftVision would need to take to create the functionalities that we have decided to create for each specific scenario. As we shall see, some of such functionalities may rather easily be re-used in future scenarios also.
2.1.1 Rigi
The Rigi reverse engineering system (Wong et al., 1995) provides the user with graph-based views of software structures, similarly to SoftVision. It provides multiple windows with “slices” of a software systems’ hierarchy, and the so-called ShriMP views, which provide a fisheye-type view into hierarchical data. However, Rigi does not provide customization for different scenarios by several ways which we have found necessary: The selection of sub-graphs is not well supported; we can only specify one containment relationship type instead of e.g. aggregating containment by several types of edges; and the drawing of nodes and edges can not be customized, e.g. by changing the shapes, lighting, and colors used. A more detailed discussion of the limitations of Rigi, as compared to SoftVision, is given in (Telea et al., 2002a).
2.1.2 VANISH
The VANISH system (Kazman and Carriere, 1995) (Visualizing and Navigating Information Structured Hierarchically) was designed for prototyping different kinds of 2D and 3D visualizations. It provides a custom interpreted visual programming language with which the user may write visualizations. It also includes the possibility to create different kinds of glyphs based on graph information. However, the way in which graph and node attributes are used is based on pre-compiled C++ classes. For rapid scenario prototyping, this solution is inflexible. Moreover, VANISH does not provide prepackaged layout engines that allow users to quickly construct the graph layouts present in most software visualizations.
3
2.2 Data Model
The data model in SoftVision is a hierarchical, typed, and attributed graph. In our reverse engineering applications, nodes represent software artifacts that have resulted from program analysis. Arcs, or edges, represent relations such as ‘uses’, ‘includes’, ‘provides’, ‘requires’, ‘inherits’, or ‘calls’. The hierarchy is defined by clustering of nodes into layers, which represent levels of containment in the system. To model alternate structurings, nodes may have multiple parents defined in the data model.
Although this is a common way of modeling software structures, SoftVision has been successfully applied to data models that are not inherently hierarchical. An example is the visualization of data in the Resource Description Framework format (Telea et al., 2003), which is a metadata model.
In case of a software structure, the data does not need to represent a program implemented with a particular programming paradigm, because of the freedom the user has over the semantics of the nodes and edges. So far, both object-oriented and procedural programs have been visualized with SoftVision.
The data to be input into SoftVision may be in one of several graph formats: the Rigi Standard Format (RSF), GraphEd or AT&T’s text-based graph description language. Such data may be derived from software systems by means of e.g. scripting or using symbol extraction tools such as the Red-Hat Source-Navigator (De Jong, 2003).
2.3 Operation Model
All operations in SoftVision have subsets of the graph (nodes and edges), called selections, as their input and output. Selections are created by user-defined selection operations, which are analogous to filters in other software analysis tools. Operations may also alter the graph data. Graph editing operations may change the nodes’ and edges’ attributes, or even add or remove nodes altogether. Computing metrics, such as the number of provisions and requirements, or performing layouts, i.e. computing graphical coordinates to draw nodes and edges, are naturally implemented as attribute-editing operations. For example, layout operations store the nodes’ coordinates in the node attributes. Nodes may have any number of (named) attributes, which allows storing different layouts, metrics, or any other data (e.g. number of lines of code, name of programmer, software version, etc).
4

These attributes can be used together, or separately, in different data viewers (Section 2.4). When an editing operation has changed the data model, all SoftVision components that depend upon it, such as data viewers, are automatically updated. This mechanism is implemented using the Observer design pattern (Gamma et al., 1995). The last type of operation in SoftVision is the mapping operation. Mapping creates visual objects from graph data. We describe mapping, user interaction, and other aspects related to visualization in the next section.
Figure 1 shows a typical work session of SoftVision, when the tool is used for getting insight into source code, e.g. in a typical reverse engineering activity. A work session consists of a sequence of operations that successively refine the data under scrutiny to finally produce the desired visualization. First, the source code is read and the artifacts of interest, such as functions, classes, and their relationships and/or attributes, are extracted. Next, these low-level artifacts are aggregated into semantically richer constructions. In most cases, this yields a hierarchical system description with the original artifacts at the bottom and successively simplified system descriptions at the top. Next, the user selects a subsystem of interest in the hierarchy, which is examined by operations such as computing various metrics on, or drawing (visualizing) it. The selection and examination steps are usually repeated several times until the desired insight is gained.
Figure 1. A typical work session in SoftVision.
5
2.4 Visualization and User Interaction
As described in the previous section, SoftVision separates the mapping operation (how nodes and edges are drawn) from the layout operation (where nodes and edges are drawn). This choice is usually not present in other visualization systems for graph data (Gansner et al., 2002; North, 2002; Wong et al., 1995; Kazman and Carriere, 1995). We believe this choice to be essential for a flexible toolkit for data visualization for two reasons. First, it allows users to customize their visualizations more freely than if the two operations are tightly coupled. Secondly, it allows (re) using existing layout and mapping software tools, without rewriting them from scratch. For instance, SoftVision provides several layouts such as spring embedding, directed trees, 3D stacked, and nested layouts. Spring embedding and tree layouts are directly reused from the AT&T GraphViz (Gansner et al., 2002; North, 2002) and the GEM toolkits (Frick et al., 1994). The 3D stacked and nested layouts are easily implemented in SoftVision atop of GraphViz and GEM, as described by Telea et al. (2002a,b).
For the mapping operation, we use the powerful Open Inventor 3D graphics and interaction toolkit (Wernecke, 1993). To create custom node and edge shapes, called glyphs, SoftVision provides a simple callback mechanism. The user provides a script, written in the Tcl language (Ousterhout, 1994), that describes how a certain node and/or edge should look like. This script, called by SoftVision for every node and edge to be mapped, can perform arbitrary functions such as examine node or edge data attributes, select the corresponding glyph from a predefined glyph library, and set glyph properties such as color, size, label text, and so on. Users can extend the predefined glyph library of Open Inventor with any 2D and 3D shapes provided in the Inventor file format. Users can switch between glyph scripts, or even edit them at run time, thus instantly customizing the visualizations. If more powerful glyph customization is needed, users can program virtually any shape directly in C++, using Open Inventor’s object-oriented API.
In an instance where a component-based system was the subject of visualization, the glyphs were chosen so that each component type would be of different shape (Sillanpää, 2004). The shapes were selected from a set that enabled easy differentiation based on theories of three-dimensional perception. Examples of these types of graphical primitives may be seen in the visualization scenarios that are presented in Section 3. For example in Figure 7 we see that our ability to identify different types of components is enhanced by the ability to use both color and shape for distinction.
To visualize the glyphs created by the mapping operation, SoftVision
6

provides so-called viewers. Viewers allow end users to interactively navigate (e.g. pan, zoom, translate, rotate, or fly through) the data visualization. Moreover, viewers allow users to customize their interaction with the displayed data, via the same Tcl scripting mechanism as for the mapping operation. When the user selects the displayed glyphs with the mouse, the corresponding nodes and/or edges are stored in a so-called pick selection. Next, the user’s Tcl script is invoked on this selection. This allows full customization of the user interaction. Finally, scripts can also be associated with GUI elements, such as buttons, providing a more traditional user interaction.
3 Example Scenarios
In this section, we present how we used SoftVision to construct visualizations that enabled exploration of software architectural models. All these scenarios were built by customizing SoftVision via its Tcl scripting interface, as outlined in Section 2.4. In detail, Tcl is used for three main goals in SoftVision: • To write mapping and pick callbacks that customize the way visualized
data is drawn and interacted with (Section 2.4). • To write GUI elements (panels, dialogs, etc) that provide operations (e.g.
metrics, filtering, etc) to end users, structured in a custom, scenario-dependent way.
• To allow end users full, low level control of SoftVision via a command-line interface.
All these mechanisms are illustrated in the following for our reverse
engineering applications.
3.1 Custom Navigation
To grasp a software system, the user needs an easy and straightforward way to navigate the visual presentation. SoftVision provides possibilities to freely customize navigation and interaction via its Tcl interface. Several custom navigations are presented next.
7
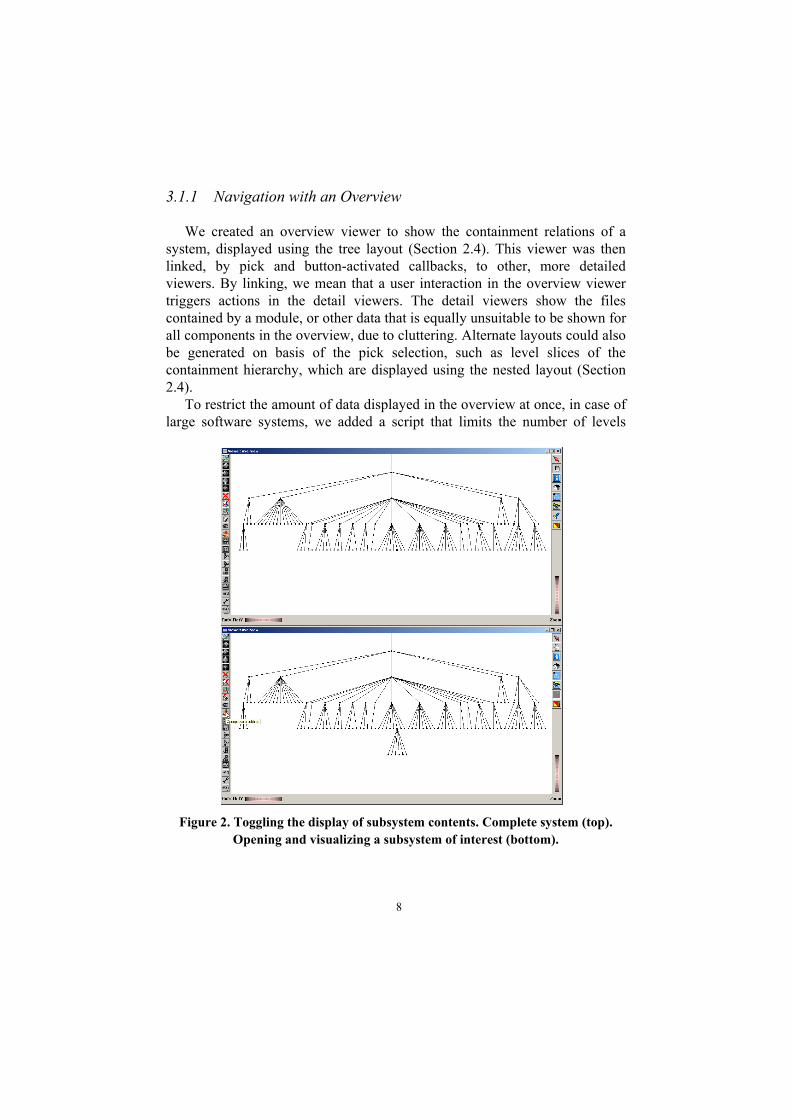
3.1.1 Navigation with an Overview
We created an overview viewer to show the containment relations of a system, displayed using the tree layout (Section 2.4). This viewer was then linked, by pick and button-activated callbacks, to other, more detailed viewers. By linking, we mean that a user interaction in the overview viewer triggers actions in the detail viewers. The detail viewers show the files contained by a module, or other data that is equally unsuitable to be shown for all components in the overview, due to cluttering. Alternate layouts could also be generated on basis of the pick selection, such as level slices of the containment hierarchy, which are displayed using the nested layout (Section 2.4).
To restrict the amount of data displayed in the overview at once, in case of large software systems, we added a script that limits the number of levels
Figure 2. Toggling the display of subsystem contents. Complete system (top). Opening and visualizing a subsystem of interest (bottom).
8

drawn starting from the top of the containment hierarchy. A button was added to the GUI to enable the opening and closing of a subtree under the selected subsystem node. Navigating the overview by opening subsystems of interest is illustrated in Figure 2.
To enable the creation of nested views based on the overview, a second button was added. This button invokes a script that constructs the nested view in a separate viewer, with the selected node defining the topmost level displayed. As for the first task of opening and closing subsystems of interest, SoftVision’s Tcl interface allows linking together any viewers the user wants to relate, and thus creating a collection of views which best supports the
Figure 3. Invoking a nested view. Selected subsystem of interest (top). Details inside selected subsystem (bottom) .
9
construction of a mental model from a particular software system. The linking functionality is illustrated in Figure 3. In the top image, the user has selected a subsystem of interest. The bottom image shows the ‘contents’ of the selected system using the nested layout (Section 2.4). While in the upper image only high-level elements are seen, in the lower image we see the contents of all the elements below the topmost container. In this layout, subsystems contained in a system are displayed as ‘boxes in boxes’, allowing a quick and effective way to understand large structures. The highlighted area of the upper image corresponds to the containing boxes in the lower image.
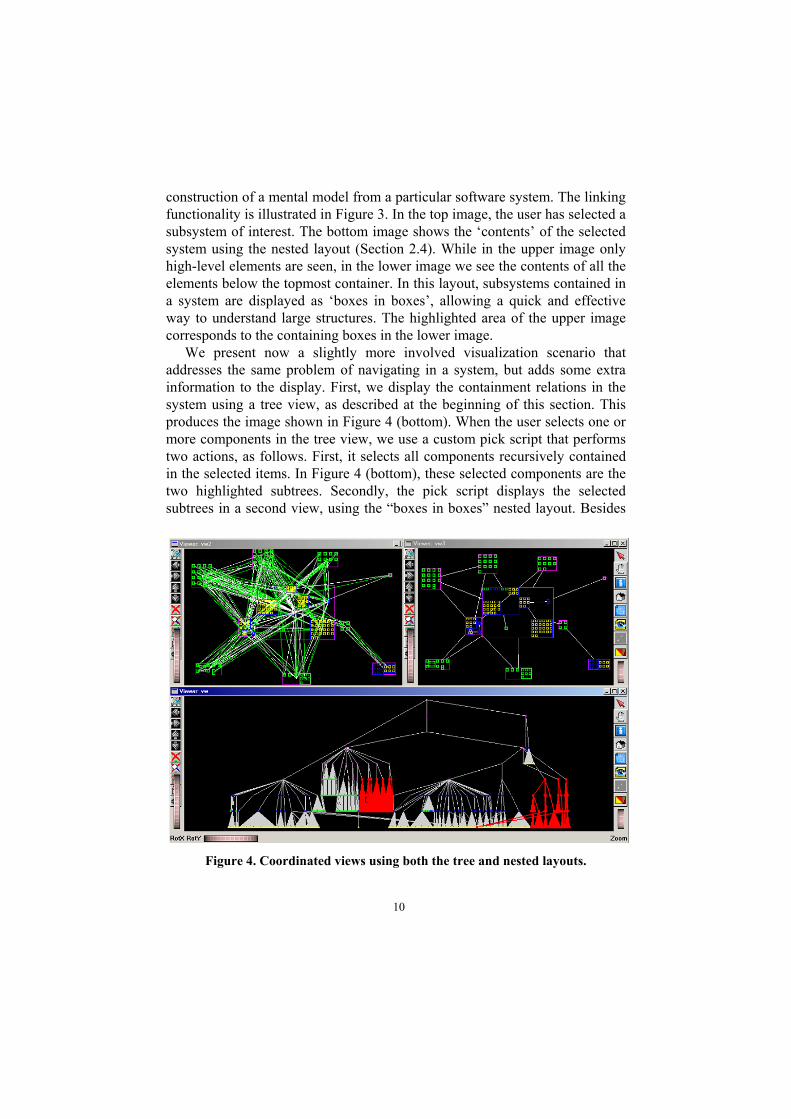
We present now a slightly more involved visualization scenario that addresses the same problem of navigating in a system, but adds some extra information to the display. First, we display the containment relations in the system using a tree view, as described at the beginning of this section. This produces the image shown in Figure 4 (bottom). When the user selects one or more components in the tree view, we use a custom pick script that performs two actions, as follows. First, it selects all components recursively contained in the selected items. In Figure 4 (bottom), these selected components are the two highlighted subtrees. Secondly, the pick script displays the selected subtrees in a second view, using the “boxes in boxes” nested layout. Besides
Figure 4. Coordinated views using both the tree and nested layouts.
10
containment, the nested view displays also the association (e.g. “provides” and “requires”) relationships between components. For the two system subtrees selected in Figure 4 (bottom), the nested view is shown in Figure 4 (top left). Obviously, displaying all containment and association relations in a subsystem will often produce cluttered results, due to the sheer amount of data. To alleviate this, we designed a second pick script that filters out the ‘uninteresting’ association relations between the selected components. Such a filter can, for example, keep only the relations of a certain user-specified type, which the user deems to be important. The result of this filter is shown in the view in Figure 4 (top right). The containment relations are the same as in Figure 4 (top left). However, using the filter described above, we can now get insight in both the structure and “provides”-“requires” relations of a subsystem. If desired, different filters can be easily programmed as scripts, in order to let users selectively browse through different subsets of relations of a given software system. 3.1.2 Level-by-Level Navigation
To enable the traversing of containment levels, interaction buttons were added to a viewer showing a nested layout. After the user visually picks a node, a button performs a re-layout in which the picked node defines the root level. In addition, by simply storing the identifiers of the nodes traversed in Tcl lists, history functionality could be easily added. Going up in the containment hierarchy was added via another button. Such navigation, not present in the original applications of SoftVision (Telea et al., 2003; Telea et al., 2002a,b), is of assistance when fetching information from a large containment hierarchy, where also the horizontal relations, i.e. relations between software artifacts on the same containment level, may be of interest. 3.1.3 Text-based Navigation
When exploring a system, the user may know the name of a component and wish to select it using this information from a view, or see a list of the representatives of a certain component type and choose from those. We felt that adding such text-based search and navigation would enhance the usability of SoftVision for reverse architecting. To add the functionality described above, a new, custom graphical user interface panel was added to SoftVision. Readily available GUI construction procedures in SoftVision were used to
11

Figure 5. Custom navigation interface.
create some of the interface elements, such as a graphical display of information about a selected node. The resulting GUI is shown in Figure 5. The pull-down menus provide the selection, and the button labeled “Element Name” invokes the picking callback function that is related to the selected viewer.
3.2 Investigating the Modularity of a System When designing a software system, an architectural view is often created to restrict certain functionalities inside predefined modules. The interaction between modules may be restricted arbitrarily. In practice, however, it is entirely possible that the restrictions are violated at some point by e.g. making a function call that the original design would not permit.
During the original (or further) development of a system, it may be necessary to check if the implementation actually obeys the designed interaction restrictions and, if not, where violations occur. To begin investigating which modules interact with which, we first apply the nested layout to navigate the system in a level-by-level fashion where we see one hierarchy slice (i.e. all artifacts on the same containment level) at a time. The selection of the slice level may be accomplished e.g. by the methods described in Section 3.1.
After selecting the level we are interested in, we wish to display the relations between some or all of the modules in this level. We found that a
12

Figure 6. Connections in a component model (top). Selected components are opened (bottom).
practical way to do this is to a) first let the user select the nodes of interest and b) add a GUI button that shows or hides the relations (graph edges) between the selected nodes. The reason for this selective relation display is that showing all relations between all components in a view may easily produce a cluttered display, as previous work confirms (Stasko et al., 1998). A slice from a system’s component model with several connections displayed is shown in Figure 6. The displayed connections may trigger an interest to study which subcomponents inside all or some of the displayed systems are actually at the connection end points. For this, we added another GUI button to enable the opening or closing of the selected nodes. To implement this functionality,
13

another script was written that has the following functionality: first, it fetches the children of the selected nodes from the containment hierarchy and adds them to the set of nodes to be shown. Then, only the connections between the lowest level nodes that are visible are added to the set, and the nested layout is applied. In Figure 6 (bottom image), we have opened some container nodes to show the connections inside.
3.3 Displaying the Clients and Suppliers of a Component
When investigating a software model, we may want to view all the connections of a particular component to quickly see where it is used, or see
Figure 7. Creating a layout of the clients of a component (bottom). Component types are indicated by the shape and color of each glyph (top).
14
which other software components it uses itself. Thus, we decided to provide the functionality to collect and visualize the client-supplier relationships for a selected node. We added two buttons to select either clients or suppliers, thus minimizing the display clutter. When a node is picked, the buttons allow invoking a simple Tcl script that collects all nodes the picked node is connected to via the client or the supplier relation. The script performs next a spring layout (Section 2.4), in a separate viewer, of the collected nodes and edges. This simple script allows creating visualizations as shown in Figure 7. To depict the relation directionality (from, to), we used arrow glyphs for visualizing the edges.
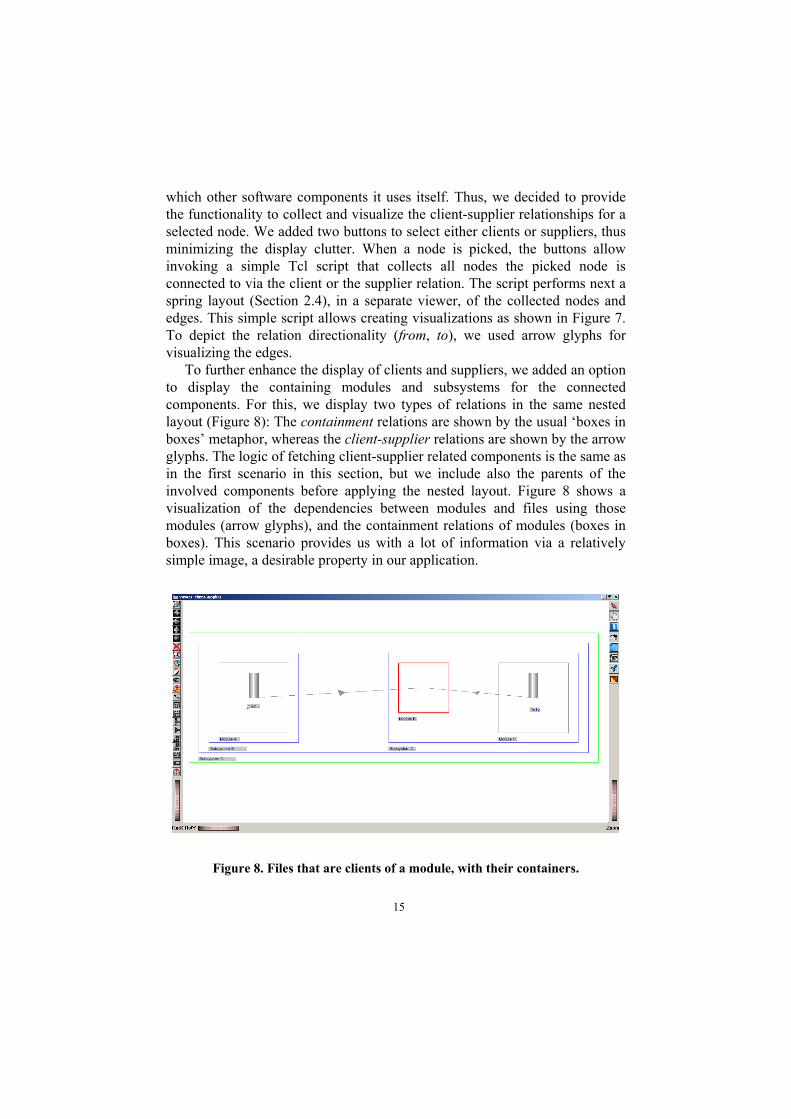
To further enhance the display of clients and suppliers, we added an option to display the containing modules and subsystems for the connected components. For this, we display two types of relations in the same nested layout (Figure 8): The containment relations are shown by the usual ‘boxes in boxes’ metaphor, whereas the client-supplier relations are shown by the arrow glyphs. The logic of fetching client-supplier related components is the same as in the first scenario in this section, but we include also the parents of the involved components before applying the nested layout. Figure 8 shows a visualization of the dependencies between modules and files using those modules (arrow glyphs), and the containment relations of modules (boxes in boxes). This scenario provides us with a lot of information via a relatively simple image, a desirable property in our application.
Figure 8. Files that are clients of a module, with their containers.
15
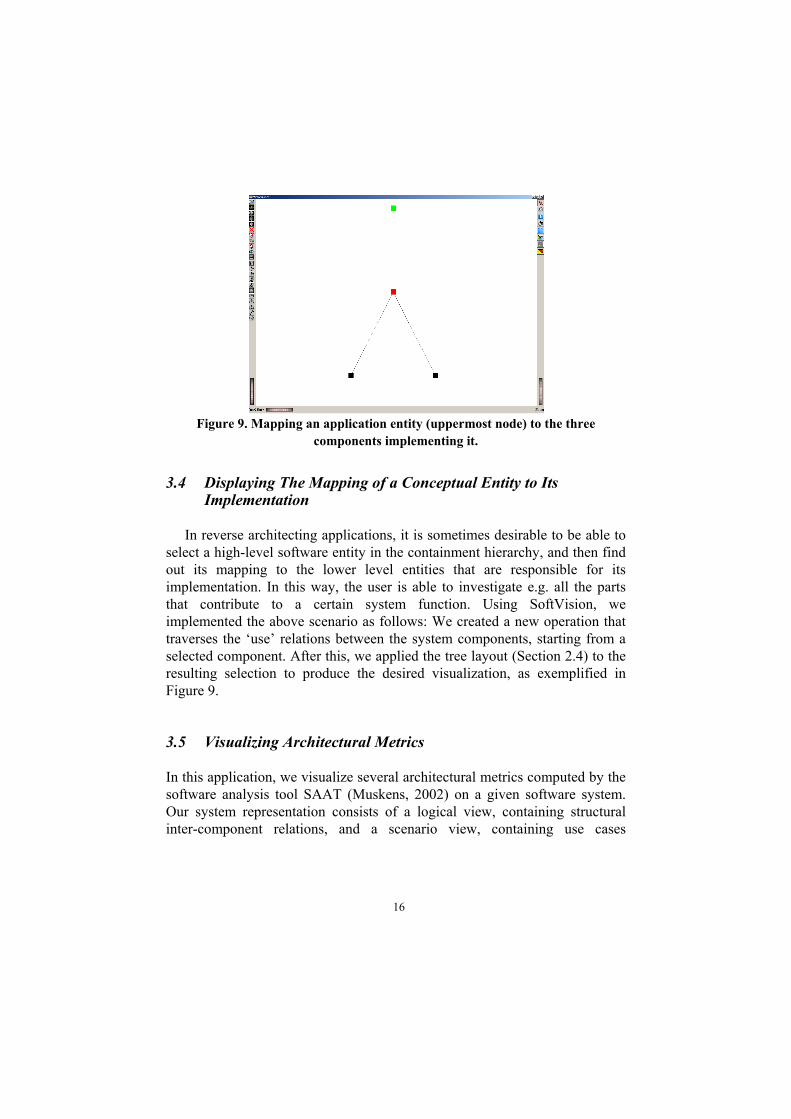
Figure 9. Mapping an application entity (uppermost node) to the three components implementing it.
3.4 Displaying The Mapping of a Conceptual Entity to Its
Implementation
In reverse architecting applications, it is sometimes desirable to be able to select a high-level software entity in the containment hierarchy, and then find out its mapping to the lower level entities that are responsible for its implementation. In this way, the user is able to investigate e.g. all the parts that contribute to a certain system function. Using SoftVision, we implemented the above scenario as follows: We created a new operation that traverses the ‘use’ relations between the system components, starting from a selected component. After this, we applied the tree layout (Section 2.4) to the resulting selection to produce the desired visualization, as exemplified in Figure 9. 3.5 Visualizing Architectural Metrics In this application, we visualize several architectural metrics computed by the software analysis tool SAAT (Muskens, 2002) on a given software system. Our system representation consists of a logical view, containing structural inter-component relations, and a scenario view, containing use cases
16
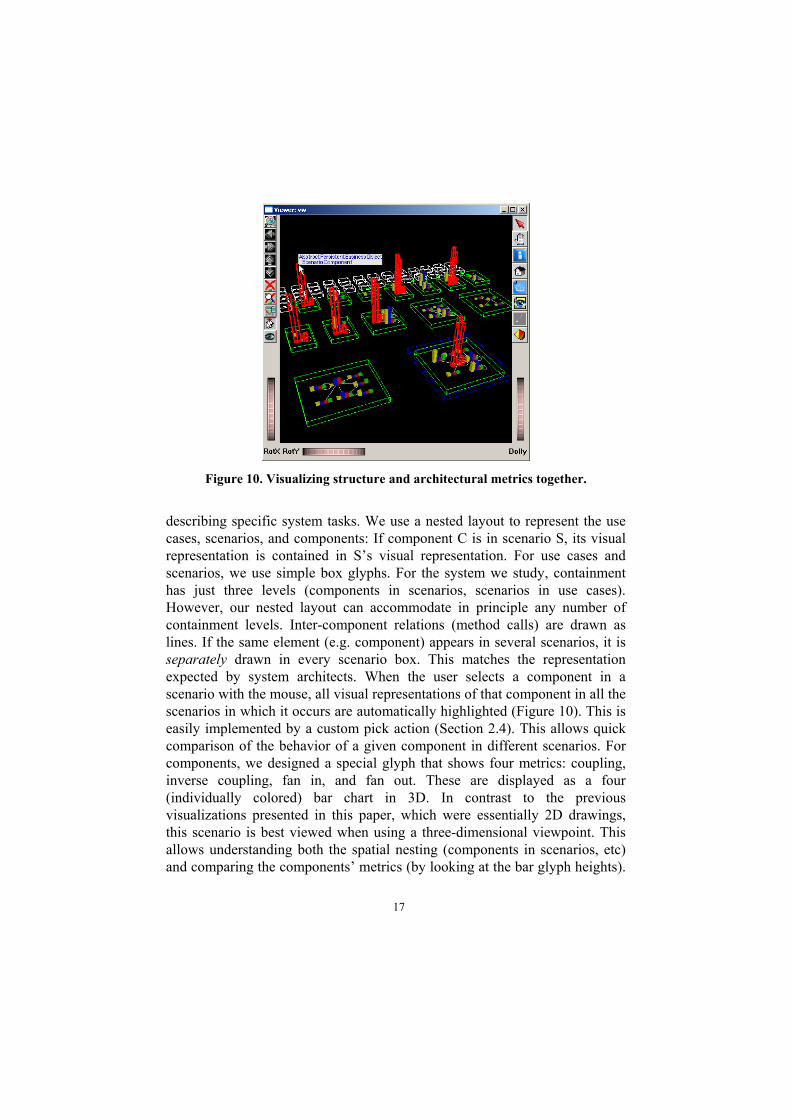
Figure 10. Visualizing structure and architectural metrics together.
describing specific system tasks. We use a nested layout to represent the use cases, scenarios, and components: If component C is in scenario S, its visual representation is contained in S’s visual representation. For use cases and scenarios, we use simple box glyphs. For the system we study, containment has just three levels (components in scenarios, scenarios in use cases). However, our nested layout can accommodate in principle any number of containment levels. Inter-component relations (method calls) are drawn as lines. If the same element (e.g. component) appears in several scenarios, it is separately drawn in every scenario box. This matches the representation expected by system architects. When the user selects a component in a scenario with the mouse, all visual representations of that component in all the scenarios in which it occurs are automatically highlighted (Figure 10). This is easily implemented by a custom pick action (Section 2.4). This allows quick comparison of the behavior of a given component in different scenarios. For components, we designed a special glyph that shows four metrics: coupling, inverse coupling, fan in, and fan out. These are displayed as a four (individually colored) bar chart in 3D. In contrast to the previous visualizations presented in this paper, which were essentially 2D drawings, this scenario is best viewed when using a three-dimensional viewpoint. This allows understanding both the spatial nesting (components in scenarios, etc) and comparing the components’ metrics (by looking at the bar glyph heights).
17
Essentially, this scenario combines two classical views on component architectures: the structural view, usually coming as UML class or package diagrams, and the metric view, usually coming in tabular, text-based form. Combining the two views in the same visualization has several advantages, as follows. Finding outliers, i.e. components with high/low metrics, is easy, as these have the longest/shortest metric bars. Displaying the four metrics along each other with the bar chart glyph allows easy comparison of the metrics for the same component. Using the same color for the same metric allows comparison of that metric between different components. 4. Conclusions
We have presented a number of exploration scenarios of reverse engineered architectural data that we have built using the SoftVision data visualization toolkit. From all our experiments, we have observed that two main aspects contribute to the effectiveness of such visualizations. First, one must be able to define a scenario, consisting of a limited number of relatively simple end-user operations, such as selection, filtering, and navigation, which answers the desired questions about the data at hand. It is not always simple to imagine such simple scenarios, as previous research in software systems visualization has indicated (Wong et al., 1995; Telea, 2004). Secondly, one must be able to implement such scenarios effectively and efficiently, using some data exploration tool. Here, the main problem is to find a data visualization tool which is, on the one hand, generic enough to easily accommodate the data model and interaction type for the scenario at hand, and on the other, specialized enough to allow implementing the desired behavior with little coding effort. For this task, we found the SoftVision toolkit to be an effective working platform. All of the scenarios we described were implemented by essentially writing a number of small, independent Tcl scripts. Such scripts customize the three modular operations of SoftVision: selection, picking, or mapping. By cascading such operations, the desired scenarios could be quickly prototyped. In the future, we plan to organize such operations in more high-level forms, in order to allow the users of SoftVision to quickly exchange ready-made scenarios for a palette of data visualization tasks for several application domains. One such possibility we are currently working on is to organize the SoftVision operations into some form of ‘scenario packages’ that provide specialized tools for a given application domain.
There exist many papers that present applications of visualization systems
18

in software visualization in general and architectural and reverse engineering data visualization in particular (see, for example the work of Stasko et al. (1998)). However, few such papers present in detail experiences of how visualization tools have been concretely used to solve a real-world problem on real-world software data, outside an academic environment. Even fewer detail the steps and effort taken to construct visualization applications using such tools. In this sense, the work presented here represents a concrete testimony showing how an existing toolkit (SoftVision) has been used outside the academic world to address the problem of exploration of reverse engineering data.
Due to the relatively early development stage of the SoftVision toolkit, there is some effort in studying the toolkit’s API and assumptions before being able to produce one’s own custom scripting. However, the user’s guide for SoftVision is under development and available at the website (Voinea, 2004), and future enhancements of SoftVision’s API will also support easier learning. Simple customization options that are available in SoftVision’s standard GUI, such as adjusting layout parameters, also offer straightforward customization of the visualizations. We believe that, once the user masters SoftVision’s basic concepts and functionalities, rapid development of data visualization applications is possible. 4 References De Jong, M. (2003). Source-navigator. WWW. http://sourcenav.sourceforge.net/,
visited 30.7.2004. Frick, A., Ludwig A., and Mehldau H. (1994, 10-12). A Fast Adaptive Layout
Algorithm for Undirected Graphs. In R. Tamassia and I. G. Tollis (Eds.), Proc. DIMACS Int. Work. Graph Drawing, GD, Number 894, Berlin, Germany, pp. 388–403. Springer-Verlag.
Gamma, E., Helm, R., Johnson, R and Vlissides, J. (1995) Design Patterns: Elements of Reusable Object-Oriented Software, Addison-Wesley
Gansner, E., Koutsofios, E. and North, S. (2002, February). Drawing Graphs with dot. AT&T. http://www.research.att.com/sw/tools/graphviz/dotguide.pdf.
Kazman, R. and Carriere J. (1995). Rapid Prototyping Of Information Visualizations Using VANISH. In Proc. IEEE INFOVIS’95. IEEE CS Press.
Muskens, J. (2002). SAAT: Software Architectural Analysis Tool. Master’s thesis, Eindhoven University of Technology, The Netherlands.
North, S. C. (2002, April). Drawing Graphs with NEATO. AT&T. http://www.research.att.com/sw/tools/graphviz/neatoguide.pdf.
Ousterhout, J. K. (1994). Tcl and the Tk Toolkit. Addison-Wesley Sillanpää, M. (2004) Visualizing Reverse Architected Software Models with an Open
Visualization Toolkit. Master’s thesis, Helsinki University of Technology
19

Stasko, J., Domingue, J., Brown, M. H. and Price, B. A. (1998). Software Visualization – Programming as a Multimedia Experience. MIT Press.
Telea, A. (2004). An Open Architecture for Visual Reverse Engineering. In K. Khan (Ed.), Managing Corporate Information Systems Evolution and Maintenance. Idea Group Inc, Hershey PA.
Telea, A., Frasincar F., and Houben G-J. (2003). Visualizing RDF(s)-Based Information. In Information Visualization 2003. IEEE CS Press.
Telea, A., Maccari A., and Riva C. (2002a). An Open Toolkit for Prototyping Reverse Engineering Visualizations. In Proceedings of the symposium on Data Visualisation 2002. Eurographics Association.
Telea, A., Maccari, A., and Riva, C. (2002b, June). An Open Visualization Toolkit for Reverse Architecting. International Workshop on Program Comprehension.
Telea, A. and Voinea, L. (2004) A Framework for Interactive Visualization of Component-Based Software. In Proc. IEEE EUROMICRO 2004. Workshop on Component Models for Dependable Systems (to appear). IEEE CS PRess.
Voinea, L. (2004). Softvision official home page. WWW. http://www.win.tue.nl/˜lvoinea/SoftVision.htm.
Wernecke, J. (1993). The Inventor Mentor: Programming Object-Oriented 3D Graphics. Addison-Wesley.
Wong, K., Tilley, S., Muller, H. and Storey, M. (1995) Structural Redocumentation: A Case Study, IEEE Software, vol 12, nr. 1, pp. 46-50, IEEE CS Press. See also: Wong, K., Rigi User’s Manual, Department of Computer Science, University of Victoria, Canada
20