den internationella dimensionen i miljöarbetet
DESCRIPTION
Den internationella dimensionen i miljöarbetet. Adj Prof. Johan Kuylenstierna Executive Director Stockholm Environment Institute. Energi , mat... Klimat, vatten, mark... Utmaningar, möjligheter... Växande och krympande värld. ”Hyperconnected and globalized world”. - PowerPoint PPT PresentationTRANSCRIPT

Den internationella dimensioneni miljöarbetet
Adj Prof. Johan KuylenstiernaExecutive Director
Stockholm Environment Institute

Energi , mat...Klimat, vatten, mark...Utmaningar, möjligheter...Växande och krympande värld...

World Economic Forum: Global Risks 2011
”Hyperconnected and globalized world”

“The past 20 years….substantial progress….. Most people…… healthier, live longer, are more educated and have more access to goods and services……… also in expanding people’s power to select leaders, influence public decisions and share knowledge. “
UNDP 2010. Human Development Report 2010. Summary. 20th Anniversary Edition. The Real Wealth of Nations: Pathways to Human Development. (UNDP)
www2.warwick.ac.ukwww.brookings.edu

Mega cities 1950
Källa: U.N. Population Division
Mega cities 2015
Source:U.N. Population Division
7,231,108,4605 maj, 14:27:37

CAGR, 1980 - 2010
Real GDP1 by region, 1980 – 2030
USD trillions
10%
3%
2%
3%
4%
The world economy has more than doubled since 1980 and is expected to almost double by 2030
SOURCE: Projection from USDA(ERS), Actual data from World Bank
935
50
43
3
22
3 2
North America
OECD Asia Pacific
Europe and Eurasia
China
Latin America
Middle East and Africa
Rest of Asia Pacific
India
1 Real GDP: Real GDP (constant 2005 US$). Mexico is included in Latin America.
1980 2010 2030

The middle class could grow by 3 billion people by 2030
0.68
0.320.31
0.230.11
3.25
1.74
0.70
0.33
2020
0.170.06
2009
1.85 0.25
Asia-Pacific
4.88
3 billion
Europe
North America
Central and South America
Middle East and North Africa
Sub-Saharan Africa
2030
3.23
0.53
0.66
0.340.18
0.110.03
Global middle classBillions of people
SOURCE: Resource Revolution, McKinsey Global Institute
IPCC 5th Assessment Report

Atmospheric CO2 Concentration
Source: IPCC AR5 WG1

Asia now accounts for ~46% of global emissions, but emissions per capita are still much lower than in North America
SOURCE: World Resources Institute CAIT
GHG emissions per capita in 2010, tCO2e per capita
GHG emissions, including land use change and forestry, by region, 2010
% of global total emissions
46%
17%
16%
11%
9%
2%
Africa
Oceania
Europe
Latin America
& the Caribbean
7,836
4,108
North America7,502
4,936
Asia21,325
Million metric tonnes of CO2 equivalents
Per capita target for staying within2 degrees of global temperature rise
2

Energikonsumtion per person (Btu)

More fossil than we can burn
New research shows listed companies inflate the carbon bubble by $674billion a year. 60-80% of listed companies’ fossil fuel reserves are ‘unburnable’, but $6trillion each decade is spent to develop more
Source: Carbon Tracker: http://www.carbontracker.org/

Tillväxt, primärenergi
OECD/EIS, 2013

OECD/EIS, 2013

Vatten som begränsa(n)d(e) resurs
Picture Source: Dr. Daniel Vermeer, Director, Global Water Partnerships, The Coca-Cola Company

Southeast Asia, Baseline Water Stress and Power Plants

Southeast Asia, Long Term Change in Water Stress and Power Plants (2025, IPCC Scenario A1B)

Source: von Grebmer et al. 2011
Livsmedels(o)trygghet

Jordbruksmark som strategisk resurs
Source: FAO/SOLAW

Phosphorus Price Soared in 2007-2008
World Bank Commodity Price Data (2010)
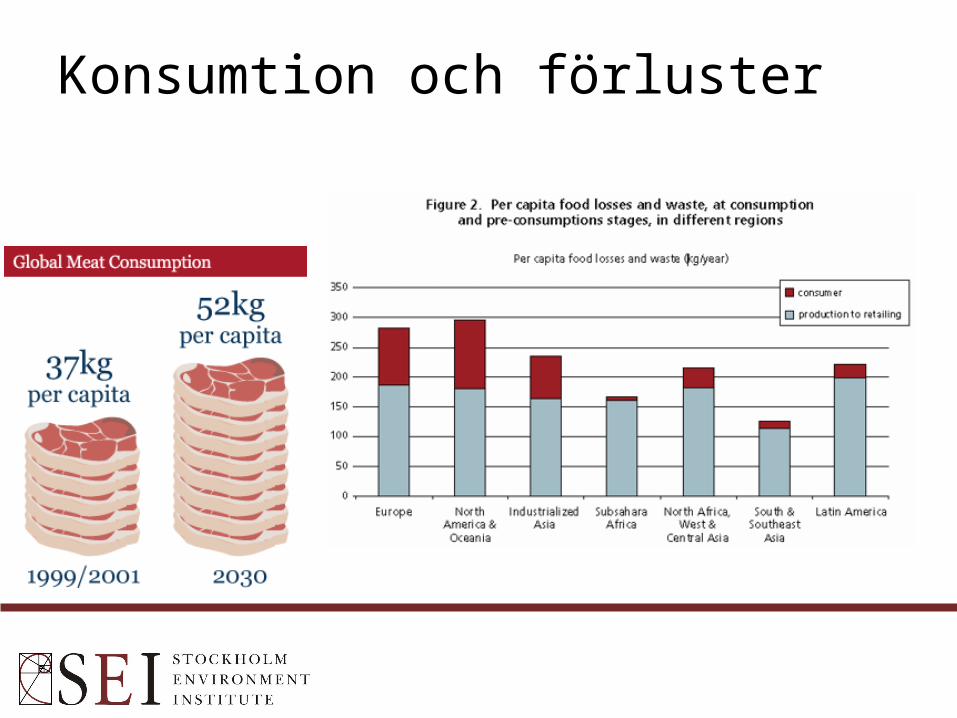
Konsumtion och förluster


Prediction is very difficult, especially about the future. Niels Bohr (1885 - 1962)


”..lösa sina stora miljöproblem ”utan att orsaka ökade miljö- och hälsoproblem utanför Sveriges gränser”.

”Sverige saknar strategi för trygg livsmedelsförsörjning”DN Debatt, 31 december 2012

Economist, April 2013
Vilken roll kommer politiken att spela?
http://www.ellenmacarthurfoundation.org/business/reports
A resource-efficient Europe – Flagship initiative of the Europe 2020 Strategy (http://ec.europa.eu/resource-efficient-europe/)

Hållbarhetsmålen post 2015
• Action-oriented• Concise• Easy to communicate• Limited in number• Aspirational• Global in nature• Universally applicable to all countries while
taking into account different national realities, capacities and levels of development and respecting national policies and priorities.
