denbury resources inc
TRANSCRIPT

DENBURY RESOURCES INC
FORM 10-K(Annual Report)
Filed 03/02/09 for the Period Ending 12/31/08
Address 5320 LEGACY DRIVE
PLANO, TX 75024Telephone 9726732000
CIK 0000945764Symbol DNR
SIC Code 1311 - Crude Petroleum and Natural GasIndustry Oil & Gas Operations
Sector EnergyFiscal Year 12/31
http://www.edgar-online.com© Copyright 2015, EDGAR Online, Inc. All Rights Reserved.
Distribution and use of this document restricted under EDGAR Online, Inc. Terms of Use.

Table of Contents

Table of Contents
UNITED STATES SECURITIES AND EXCHANGE COMMISSION Washington, D.C. 20549
2008 FORM 10-K
For the transition period from _________ to________
Commission file number 1-12935
DENBURY RESOURCES INC. (Exact name of Registrant as specified in its charter)
Securities registered pursuant to Section 12(b) of the Act:
Securities registered pursuant to Section 12(g) of the Act: None
Indicate by check mark if the registrant is a well-known seasoned issuer, as defined in Rule 405 of the Securities Act. Yes � No �
Indicate by check mark if the registrant is not required to file reports pursuant to Section 13 or Section 15(d) of the Act. Yes � No �
Indicate by check mark whether the registrant: (1) has filed all reports required to be filed by Section 13 or 15(d) of the Securities Exchange Act of 1934 during the preceding 12 months (or for such shorter period that the registrant was required to file such reports), and (2) has been subject to such filing requirements for the past 90 days. Yes � No �
Indicate by check mark if disclosure of delinquent filers pursuant to Item 405 of Regulation S-K is not contained herein, and will not be contained, to the best of registrant’s knowledge, in definitive proxy or information statements incorporated by reference in Part III of this Form 10-K or any amendment to this Form 10-K. �
Indicate by check mark whether the registrant is a large accelerated filer, an accelerated filer, a non-accelerated filer, or a small reporting company. See definition of “large accelerated filer”, “accelerated filer”, and “small reporting company” in Rule 12b-2 of the Exchange Act.
Indicate by check mark whether the registrant is a shell company (as defined in Exchange Act Rule 12b-2). Yes � No �
The aggregate market value of the registrant’s common stock held by non-affiliates, based on the closing price of the registrant’s common stock as of the last business day of the registrant’s most recently completed second fiscal quarter was $6,251,312,368.
The number of shares outstanding of the registrant’s Common Stock as of January 31, 2009, was 248,411,326.
(Mark One) � Annual report pursuant to Section 13 or 15(d) of the Securities Exchange Act of 1934
For the fiscal year ended December 31, 2008 OR � Transition report pursuant to Section 13 or 15(d) of the Securities Exchange Act of 1934
Delaware 20-0467835
(State or other jurisdiction (I.R.S. Employer of incorporation or organization) Identification No.)
5100 Tennyson Parkway,
Suite 1200, Plano, TX 75024 (Address of principal executive offices) (Zip Code)
Registrant’s telephone number, including area code: (972) 673-2000
Title of Each Class: Name of Each Exchange on Which Registered: Common Stock $.001 Par Value New York Stock Exchange
Large accelerated filer � Accelerated filer � Non-accelerated filer � Smaller reporting company �

DOCUMENTS INCORPORATED BY REFERENCE
Document: Incorporated as to: 1.
Notice and Proxy Statement for the Annual Meeting of Shareholders to be held May 13, 2009.
1. Part III, Items 10, 11, 12, 13, 14

Denbury Resources Inc. 2008 Annual Report on Form 10-K
Table of Contents
2
Page Glossary and Selected Abbreviations 3 PART I Item 1. Business 4 Item 1A. Risk Factors 22 Item 1B. Unresolved Staff Comments 28 Item 2. Properties 28 Item 3. Legal Proceedings 28 Item 4. Submission of Matters to a Vote of Security Holders 28 PART II Item 5.
Market for Registrant’s Common Equity, Related Stockholder Matters and Issuer Purchases of Equity Securities 29
Item 6. Selected Financial Data 31 Item 7. Management’s Discussion and Analysis of Financial Condition and Results of Operations 32 Item 7A. Quantitative and Qualitative Disclosures About Market Risk 58 Item 8. Financial Statements and Supplementary Data 58 Item 9. Changes in and Disagreements with Accountants on Accounting and Financial Disclosure 99 Item 9A. Controls and Procedures 99 Item 9B. Other Information 99 PART III Item 10. Directors, Executive Officers and Corporate Governance 100 Item 11. Executive Compensation 100 Item 12. Security Ownership of Certain Beneficial Owners and Management and Related Stockholder Matters 100 Item 13. Certain Relationships and Related Transactions, and Director Independence 100 Item 14. Principal Accountant Fees and Services 100 PART IV Item 15. Exhibits and Financial Statement Schedules 100 Signatures 104 EX-10.(d) EX-10.(n) EX-10.(o) EX-21 EX-23.(a) EX-23.(b) EX-31.(a) EX-31.(b) EX-32 EX-99

Table of Contents
Glossary and Selected Abbreviations
3
Denbury Resources Inc.
Bbl
One stock tank barrel, of 42 U.S. gallons liquid volume, used herein in reference to crude oil or other liquid hydrocarbons.
Bbls/d Barrels of oil produced per day. Bcf One billion cubic feet of natural gas or CO 2 . Bcfe
One billion cubic feet of natural gas equivalent using the ratio of one barrel of crude oil, condensate or natural gas liquids to 6 Mcf of natural gas.
BOE
One barrel of oil equivalent using the ratio of one barrel of crude oil, condensate or natural gas liquids to 6 Mcf of natural gas.
BOE/d BOEs produced per day. Btu
British thermal unit, which is the heat required to raise the temperature of a one-pound mass of water from 58.5 to 59.5 degrees Fahrenheit.
CO 2 Carbon dioxide. Finding and Development Cost
The average cost per BOE to find and develop proved reserves during a given period. It is calculated by dividing costs, which includes the total acquisition, exploration and development costs incurred during the period plus future development and abandonment costs related to the specified property or group of properties, by the sum of (i) the change in total proved reserves during the period plus (ii) total production during that period.
MBbls One thousand barrels of crude oil or other liquid hydrocarbons. MBOE One thousand BOEs. Mbtu One thousand Btus. Mcf One thousand cubic feet of natural gas or CO 2 . Mcf/d One thousand cubic feet of natural gas or CO 2 produced per day. Mcfe
One thousand cubic feet of natural gas equivalent using the ratio of one barrel of crude oil, condensate or natural gas liquids to 6 Mcf of natural gas.
Mcfe/d Mcfes produced per day. MMBbls One million barrels of crude oil or other liquid hydrocarbons. MMBOE One million BOEs. MMBtu One million Btus. MMcf One million cubic feet of natural gas or CO 2 . MMcf/d One million cubic feet of natural gas or CO 2 per day. MMcfe One thousand Mcfe. MMcfe/d MMcfes produced per day. PV-10 Value
When used with respect to oil and natural gas reserves, PV-10 Value means the estimated future gross revenue to be generated from the production of proved reserves, net of estimated production and future development costs and abandonment, using prices and costs in effect at the determination date, and before income taxes, discounted to a present value using an annual discount rate of 10%. PV-10 Value is a non-GAAP measure and its use is further discussed in footnote 3 to the table on page 21.
Proved Developed Reserves*
Reserves that can be expected to be recovered through existing wells with existing equipment and operating methods.
Proved Reserves*
The estimated quantities of crude oil, natural gas and natural gas liquids that geological and engineering data demonstrate with reasonable certainty to be recoverable in future years from known reservoirs under existing economic and operating conditions.
Proved Undeveloped Reserves*
Reserves that are expected to be recovered from new wells on undrilled acreage or from existing wells where a relatively major expenditure is required.
Tcf One trillion cubic feet of natural gas or CO 2 .
* This definition is an abbreviated version of the complete definition as defined by the SEC in Rule 4-10(a) of Regulation. For the complete definition see: http://ecfr.gpoaccess.gov/cgi/t/text/text-idx?c=ecfr& sid=20c66c74f60c4bb8392bcf9ad6fccea3&rgn=div5&view=text& node=17:2.0.1.1.8&idno=17#17:2.0.1.1.8.0.21.43 .

Table of Contents
PART I
Item 1. Business
Website Access to Reports
We make our annual report on Form 10-K, quarterly reports on Form 10-Q, current reports on Form 8-K, and amendments to those reports, filed or furnished pursuant to section 13(a) or 15(d) of the Securities Exchange Act of 1934, available free of charge on or through our Internet website, www.denbury.com , as soon as reasonably practicable after we electronically file such material with, or furnish it to, the SEC.
The Company
Denbury Resources Inc. is a Delaware corporation organized under Delaware General Corporation Law (“DGCL”) and is engaged in the acquisition, development, operation and exploration of oil and natural gas properties in the Gulf Coast region of the United States, primarily in Mississippi, Louisiana, Texas and Alabama. Our corporate headquarters is located at 5100 Tennyson Parkway, Suite 1200, Plano, Texas 75024, and our phone number is 972-673-2000. At December 31, 2008, we had 797 employees, 493 of whom were employed in field operations or at the field offices. Our employee count does not include the approximately 610 employees of Genesis Energy, LLC as of December 31, 2008, as its employees exclusively carry out the business activities of Genesis Energy, L.P., which we do not consolidate in our financial statements (see Note 1 to the Consolidated Financial Statements).
Incorporation and Organization
Denbury was originally incorporated in Canada in 1951. In 1992, we acquired all of the shares of a United States operating company, Denbury Management, Inc. (“DMI”), and subsequent to the merger we sold all of its Canadian assets. Since that time, all of our operations have been in the United States.
In April 1999, our stockholders approved a move of our corporate domicile from Canada to the United States as a Delaware corporation. Along with the move, our wholly owned subsidiary, DMI, was merged into the new Delaware parent company, Denbury Resources Inc. This move of domicile did not have any effect on our operations or assets.
Effective December 29, 2003, Denbury Resources Inc. changed its corporate structure to a holding company format. As part of this restructure, Denbury Resources Inc. (predecessor entity) merged into a newly formed limited liability company, and survived as Denbury Onshore, LLC, a Delaware limited liability company and an indirect subsidiary of the newly formed holding company, Denbury Holdings, Inc. Denbury Holdings, Inc. subsequently assumed the name Denbury Resources Inc. (new entity). Stockholders’ ownership interests in the business did not change as a result of the new structure and shares of the Company remain publicly traded under the same symbol (DNR) on the New York Stock Exchange.
Business Strategy
As part of our corporate strategy, we believe in the following fundamental principles:
4
Denbury Resources Inc.
• remain focused in specific regions where we have a competitive advantage as a result of our CO 2 reserves and expanding infrastructure, or where we believe we can ultimately obtain it;
• acquire properties where we believe additional value can be created through tertiary recovery operations and a combination of other exploitation, development, exploration and marketing techniques;
• acquire properties that give us a majority working interest and operational control or where we believe we can ultimately obtain it;
• maximize the value of our properties by increasing production and reserves while controlling cost; and
• maintain a highly competitive team of experienced and incentivized personnel.

Table of Contents
Acquisitions
Information as to recent acquisitions and divestitures by Denbury is set forth under Note 2, “Acquisitions and Divestitures,” to the Consolidated Financial Statements.
Oil and Gas Operations
Our CO 2 Assets
Overview. Since we acquired our first carbon dioxide tertiary flood in Mississippi in 1999, we have gradually increased our emphasis on these types of operations. During this time, we have learned a considerable amount about tertiary operations and working with carbon dioxide. Our tertiary operations have grown to the point that approximately 50% of our December 31, 2008 proved reserves are proved tertiary oil reserves, almost 50% of our forecasted 2009 production is expected to come from tertiary oil operations (on a BOE basis), and almost all of our 2009 capital expenditures are related to our current or future tertiary operations. We particularly like this play as (i) it has a lower risk and is more predictable than most traditional exploration and development activities, (ii) it provides a reasonable rate of return at relatively low oil prices (we estimate our economic per barrel dollar cost on these projects at current oil prices is in the range of the mid-twenties, depending on the specific field and area), and (iii) we have virtually no competition for this type of activity in our geographic area. Generally, from East Texas to Florida, there are no known significant natural sources of CO 2 except our own, and these large volumes of CO 2 that we own drive the play. In addition, we are pursuing anthropogenic (man-made) sources of CO 2 to use in our tertiary operations, which we believe will not only help us recover additional oil, but will provide an economical way to sequester CO 2 . We have acquired several old oil fields in our areas of operations with potential for tertiary recovery and plan to acquire additional fields, and we are continuing to expand our CO 2 pipeline infrastructure to transport CO 2 .
During 2008, we added 63.4 MMBbls of tertiary-related proved oil reserves, primarily initial proven tertiary oil reserves at Heidelberg Field (Phase II), Tinsley Field (Phase III) and Lockhart Crossing Field (Phase I) (see discussion of the individual fields below), increasing our proved tertiary oil reserves from 69.5 MMBbls at December 31, 2007 to 125.8 MMBbls as of December 31, 2008. In order to recognize proved tertiary oil reserves, we must either have an oil production response to the CO 2 injections or the field must be analogous to an existing tertiary flood. The magnitude of proved reserves that we can book in any given year will depend on our progress with new floods and the timing of the associated production response.
We believe that CO 2 is one of the most efficient tertiary recovery mechanisms for crude oil. The CO 2 acts somewhat like a solvent for the oil, removing it from the oil-bearing formation as the CO 2 passes through the rock. CO 2 tertiary floods are unique because they require large volumes of CO 2 , the location of which, to our knowledge, is limited to a few geological basins, one of which is our source near Jackson, Mississippi. Further, the most efficient way to transport CO 2 is via dedicated pipelines, which are also in limited supply. Because the sources and methods of transportation of CO 2 are limited, only 5% or approximately 250,000 Bbls/d of the United States domestic oil production is derived from tertiary recovery projects.
Our CO 2 source field, Jackson Dome, located near Jackson, Mississippi, was discovered during the 1970s while being explored for hydrocarbons. This significant source of CO 2 is the only known one of its kind in the United States east of the Mississippi River. Mississippi’s first enhanced oil recovery project began in the mid 1980s in Little Creek Field following the installation of Shell Oil Company’s Choctaw CO 2 Pipeline. The 183-mile Choctaw Pipeline (now referred to as NEJD Pipeline) transported CO 2 produced from Jackson Dome to Little Creek Field. While the CO 2 flood proved successful in recovering significant amounts of oil, commodity prices at that time made the project unattractive for Shell and they later sold their oil fields in this area, as well as the CO 2 source wells and pipeline.
While enhanced oil recovery (“EOR”) projects utilizing CO 2 may not be considered a new technology, Denbury applies several additional technologies to the fields: well evaluations, new completion or stimulation techniques, operating equipment and seismic interpretations. We began our CO 2 operations in August 1999, when we acquired Little Creek Field, followed by our acquisition of Jackson Dome CO 2 reserves and NEJD pipeline in 2001. Based upon our success at Little Creek, we embarked upon a strategic program to improve our understanding and knowledge of CO 2 production and tertiary recovery to build a dominant position in this enhanced oil play.
5
Denbury Resources Inc.

Table of Contents
Tertiary Recovery Phases. We categorize our tertiary operations by labeling operating areas or groups of fields as phases. Phase I includes several fields along our 183-mile NEJD CO 2 Pipeline that runs through southwest Mississippi and into Louisiana. The most significant fields in this area are Little Creek, Mallalieu, McComb, and Brookhaven Fields, all fields which have been producing oil for some time, and one of our newest enhanced oil fields, Lockhart Crossing Field. We saw our first tertiary oil production from Lockhart Crossing Field, located in South Louisiana, during 2008. Lockhart Crossing, although a relatively small field, is the first of three fields we plan to CO 2 flood in Louisiana and is our first flood outside the state of Mississippi.
Phase II, which began with the early 2006 completion of the Free State CO 2 Pipeline to East Mississippi, includes Eucutta, Soso, and Martinville Fields which have been producing oil for over two years, and Heidelberg Field where we started injecting CO 2 in December 2008. Tinsley Field, located northwest of Jackson, Mississippi, acquired in January 2006, is our Phase III and is serviced by that portion of the Delta CO 2 Pipeline completed in January 2008. Tinsley Field had its first oil production response in the second quarter of 2008. Phase IV includes Cranfield, where we began CO 2 injection operations during July 2008 and had our first oil production response in the first quarter of 2009, and Lake St. John Field, a project currently scheduled to commence in 2011, both fields located near the Mississippi/Louisiana border west of the Phase I fields. Phase V is Delhi Field, a Louisiana field acquired in 2006, located southwest of Tinsley Field. CO 2 injection in Phase V will begin in 2009 upon completion of the Delta CO 2 Pipeline, an 80-mile pipeline from Tinsley to Delhi. Citronelle Field in Southwest Alabama, another field acquired in 2006, is our Phase VI. Citronelle will require an extension to the Free State CO 2 Pipeline in order to commence this project, the timing of which is uncertain at this time. Our last two currently existing phases will require completion of our 320-mile Green Pipeline, which will run from Southern Louisiana to Hastings Field, south of Houston, Texas, scheduled for completion in 2010. Hastings Field, a field on which we acquired a purchase option in late 2006 and purchased in February 2009, is our Phase VII and the Seabreeze Complex, acquired in 2007, will be our Phase VIII.
Jackson Dome. In February 2001, we acquired approximately 800 Bcf of proved producing CO 2 reserves for $42 million, a purchase that gave us control of most of the CO 2 supply in Mississippi, as well as ownership and control of a critical 183-mile CO 2 pipeline. This acquisition provided the platform to significantly expand our CO 2 tertiary recovery operations by assuring that CO 2 would be available to us on a reliable basis and at a reasonable and predictable cost. Since February 2001, we have acquired two wells and drilled 20 additional CO 2
producing wells, significantly increasing our estimated proved CO 2 reserves to approximately 5.6 Tcf as of December 31, 2008, which is almost enough for our existing and currently planned phases of operations. The estimate of 5.6 Tcf of proved CO 2 reserves is based on 100% ownership of the CO 2 reserves, of which Denbury’s net ownership (net revenue interest) is approximately 4.5 Tcf and is included in the evaluation of proved CO 2 reserves prepared by DeGolyer and MacNaughton. In discussing our available CO 2 reserves, we make reference to the gross amount of proved reserves, as this is the amount that is available both for Denbury’s tertiary recovery programs and for industrial users who are customers of Denbury and others, as Denbury is responsible for distributing the entire CO 2 production stream.
Today, we own every producing CO 2 well in the region. Although our current proved and potential CO 2 reserves are quite large, in order to continue our tertiary development of oil fields in the area, incremental deliverability of CO 2 is needed. In order to obtain additional CO 2
deliverability, we continued our exploration efforts by completing a 136 square mile 3-dimensional seismic program during 2008. The 3-D seismic program was located west of the DRI Ice Field over existing known CO 2 fields and adjacent lead areas. The seismic data will be evaluated during 2009 with anticipated exploratory drilling in future years. During 2008 we drilled and completed five CO 2 production wells. These wells added 360 MMcf/d of CO 2 production capacity which increased the Jackson Dome total CO 2 production capacity to between 900 MMcf/d and 1.0 Bcf/d. During the fourth quarter 2008, production averaged 767 MMcf/d of CO 2 , a 44% increase over levels in the fourth quarter 2007. In addition to expanding our production capacity, during 2008 we completed the installation and startup of a second train at the Barksdale dehydration facility at Jackson Dome. This expansion added 300 MMcf/d of CO 2 dehydration capacity, which increased the Jackson Dome total CO 2 dehydration capacity to approximately 1.1 Bcf/d. We also installed a pump station in Brandon, Mississippi, to boost NEJD pipeline pressure and increase CO 2 deliverability capacity in that pipeline to approximately 515 MMcf/d. In order to ensure future production rates, processing capabilities and deliverability to the main transportation pipelines, during 2009 we are constructing a 150 MMcf/d Trace Dehydration Facility, installing additional pump capacity at the Brandon Pump Station and constructing a 13-mile pipeline from the Barksdale dehydration facility to the Brandon Pump Station. This pipeline will provide additional capacity to the NEJD line by bypassing a majority of the industrial users.
6
Denbury Resources Inc.

Table of Contents
During 2008, we sold an average of 89 MMcf/d of CO 2 to commercial users, and we used an average of 548 MMcf/d for our tertiary activities. We are continuing to increase our CO 2 production, averaging 767 MMcf/d during the fourth quarter of 2008. We estimate that our planned tertiary operations will not require any significant additional deliverability through 2010.
Man-made CO 2 sources . In addition to our natural source of CO 2 , we are in discussions with the owners of several possible gasification plants which, if built, will convert coal or petroleum coke into various other fuels, with CO 2 being a significant by-product of the process. If built, these plants could provide us with significant additional sources of CO 2 in the future which would enable us to further expand our tertiary operations, although the earliest source of this manufactured CO 2 is not expected to be available to us until 2013. These plants have all been delayed due to current economic conditions and it is uncertain when, if ever, these plants will be built. We have entered into long-term commitments to purchase manufactured CO 2 from four proposed plants, which, if all four plants are built, could potentially provide us with an aggregate of 1.0 Bcf/d of CO 2 , commencing in 2013. In addition to the proposed gasification plants, we have ongoing discussions underway regarding existing plants of various types that emit CO 2 and we may be able to purchase their volumes. In order to capture such volumes, we (or the plant owner) would need to install additional equipment, which include at a minimum, compression facilities. Most of these existing plants emit relatively small volumes of CO 2 , generally less than the proposed gasification plants, but such volumes may still be attractive if the source is located near our proposed Green CO 2 pipeline. The cost of man-made CO 2 will likely be higher than CO 2 from our natural source, but the location of these plants could mitigate some of the incremental cost of transportation, and we believe that in the next few years Congress could enact legislation to address climate change by capping or taxing U.S. CO 2 emissions, which could ultimately increase the supply and lower our cost of man-made CO 2 for our operations by creating economic penalties for the emission of CO 2 . Further, we see these sources as a possible expansion of our natural Jackson Dome source, assuming they are economic, and we believe that our potential ability to tie these sources together with pipelines will give us a significant competitive advantage over our competitors in our geographic area in acquiring additional oil fields and future potential man-made sources of CO 2 . We believe that we are a likely purchaser of CO 2 produced in our area of operations because of the scale of our tertiary operations, the CO 2 pipeline infrastructure that we are continuing to develop, and the large natural source of CO 2 (Jackson Dome), which can act as a swing CO 2 source to balance our CO 2 supplies and demand.
CO 2 pipelines. We acquired the NEJD 183-mile CO 2 Pipeline that runs from Jackson Dome to near Donaldsonville, Louisiana, as part of the 2001 acquisition of our Jackson Dome source field (see above). Construction of our Free State Pipeline was completed in 2006 and it is currently transporting CO 2 to our four existing Phase II tertiary fields in East Mississippi (Eucutta, Soso, Martinville and Heidelberg) and will also be used for our proposed projects at South Cypress Creek and other fields in Phase II.
During 2008, we continued our expansion of our CO 2 pipeline infrastructure with the completion of the first segment of our Delta Pipeline between Jackson Dome and Tinsley Field in January (31 miles), which significantly increased the transportation capacity of CO 2 to that field. We also reconditioned and converted the natural gas pipeline we acquired from Southern Natural Gas Company in 2007 to CO 2 service, which we are currently using to transport CO 2 to our first Phase IV field, Cranfield Field. During 2008, we started construction to further extend our Delta Pipeline with a 24” 78-mile extension from Tinsley Field to Delhi Field. Completion of this segment is expected during the second quarter of 2009.
In late 2006, we purchased an option to acquire Hastings Field, a potential tertiary flood located near Houston, Texas, which we subsequently acquired in February 2009. In order to flood Hastings Field, we are building a CO 2 pipeline from the southern end of our existing NEJD CO 2 Pipeline that terminates near Donaldsonville, Louisiana, to Hastings Field, estimated to be approximately 320 miles. Based on our latest estimates, this pipeline is expected to cost between $700 million and $750 million. During 2007, we committed to the manufacture of the 24” pipe and thereby locked-in the pipe purchase price, and acquired approximately 100-plus miles of the necessary 320 miles of right-of-way. Our efforts during 2008 were focused on engineering design, pipe manufacturing and right-of-way acquisitions. Construction of the pipeline began during November 2008 and will continue through 2010. This multi-year project is underway and in 2009 we expect elevated activity and elevated spending (especially during the first half of the year) as crews work to complete the pipeline and its connecting line to Oyster Bayou Field, east of Galveston Bay, by late 2009 or early 2010 and on to the Hastings Field by year-end 2010. Initially, we anticipate transporting CO 2 from our natural source at Jackson Dome on this line, but ultimately we expect that it will be used to ship predominately man-made (anthropogenic) sources of CO 2 .
7
Denbury Resources Inc.

Table of Contents
Overall tertiary economics. When we began our tertiary operations several years ago, they were generally economic at oil prices below $20 per Bbl, although the economics varied by field. Our costs have escalated during the last few years due to general cost inflation in the industry, but we expect them to be reduced to an economic break-even dollar cost on these projects in the mid-twenties per barrel if oil prices remain at their current reduced level, dependent on the specific field. Our inception-to-date finding and development costs (including future development and abandonment costs but excluding expenditures on fields without proved reserves) for our tertiary oil fields through December 31, 2008, are approximately $11.30 per BOE. Currently, we forecast that our finding and development costs for most of our tertiary projects will average less than $10 per BOE over the life of each field, depending on the state of a particular field at the time we begin operations, the amount of potential oil, the proximity to a pipeline or other facilities, and other factors, as the finding and development costs to date do not include significant unproved potential reserves in most of the fields. Our operating costs for tertiary operations are highly dependent on commodity prices and could range from $15 to $25 per BOE over the life of each field, again depending on the field itself.
While these economic factors have wide ranges, our rate of return from these operations has generally been better than our rate of return on traditional oil and gas operations, and thus our tertiary operations have become our single most important focus area. While it is extremely difficult to accurately forecast future production, we do believe that our tertiary recovery operations provide significant long-term production growth potential at reasonable rates of return, with relatively low risk, and thus will be the backbone of our Company’s growth for the foreseeable future. Although we believe that our plans and projections are reasonable and achievable, there could be delays or unforeseen problems in the future that could delay or affect the economics of our overall tertiary development program. We believe that such delays or price effects, if any, should only be temporary.
Tentatively, we plan to spend approximately $52 million in 2009 in the Jackson Dome area with the intent to add additional CO 2
deliverability for future operations. Approximately $138 million in capital expenditures is budgeted in 2009 at the oil field level in Phases I through V, plus an additional $485 million for our Delta and Green CO 2 Pipelines, making our combined CO 2 related expenditures just over 90% of our projected $750 million 2009 capital budget.
Our Tertiary Oil Fields with Proved Tertiary Reserves
On December 31, 2008, we had total tertiary-related proved oil reserves of approximately 125.8 MMBbls, consisting of 3.2 MMBbls at Little Creek Field (and surrounding smaller fields), 11.8 MMBbls at Mallalieu Field, 13.7 MMBbls at McComb and Smithdale Fields, 17.3 MMBbls at Brookhaven Field, 9.1 MMBbls at Eucutta Field, 9.0 MMBbls at Soso Field, 0.8 MMBbls at Martinville Field, 34.4 MMBbls at Tinsley, 4.0 MMBbls at Lockhart, and 22.4 MMBbls at Heidelberg. Overall, our production from tertiary operations has increased from approximately 1,350 Bbls/d in 1999, the then existing production at Little Creek Field at the time of acquisition, to an average of 21,874 Bbls/d during the fourth quarter of 2008. We expect this production to continue to increase for several years as we expand our tertiary operations to additional fields.
Phase I Fields
Mallalieu Field. Mallalieu Field consists of two units, West Mallalieu Unit and the smaller East Mallalieu Unit. Combined they are our most prolific tertiary flood in terms of production, producing 5,056 Bbls/d during the fourth quarter 2008. In contrast to many of our existing fields, Mallalieu Field was not waterflooded prior to CO 2 injection. Therefore, we estimate that the tertiary recovery of oil from Mallalieu Field as a result of CO 2 injection could approach 25% of the original oil in place. During 2007, we increased our proved reserves in this area, raising our estimated recovery factor from 17% to 20% for this field, based on production performance to date. A total of $11.3 million was invested in this field during 2008 to drill, re-enter or recomplete wells in efforts to improve production. During the fourth quarter of 2008, we began an expansion of the central processing facility in this field, which is expected to be completed in July, 2009. The expansion of the facility will allow CO 2 recycle rates to increase from the current 160 MMcf/d to 230 MMcf/d.
From inception through December 31, 2008, we had net positive cash flow (revenue less operating expenses and capital expenditures, including the acquisition cost) from Mallalieu Field of $421.0 million.
8
Denbury Resources Inc.

Table of Contents
McComb and Smithdale Fields. We commenced tertiary recovery operations in 2003 at McComb Field and started injecting CO 2 late that year. Significant development occurred during 2004 and 2005 as we expanded the nearby Olive Field CO 2 facility to handle the processing of McComb’s produced oil, water and CO 2 , and developed an additional four injection patterns. The first production response occurred in the second quarter of 2004 and has generally increased since that time, averaging 1,563 Bbls/d in the fourth quarter of 2008. During 2008, we expanded the number of injection wells and increased injection pressures, resulting in significant increases in our CO 2 injections at McComb Field. The field continues to present challenges to the technical team, but we are improving our understanding of the reservoir. The technical team is working to further improve production rates by monitoring injection patterns, reworking producing wells, and using injection surveys for conformance issues within the reservoir.
In early 2008, we had a mechanical failure in one of our best wells at Smithdale, causing a temporary decline in production. The well was redrilled and oil production was restored, averaging 529 Bbls/d in the fourth quarter of 2008. The reservoir at Smithdale is a channel and thus our drilling was based on the completion of our 2007 3-D seismic survey covering the McComb and Smithdale Fields. By utilizing the 3-D seismic data, our geoscientists are able to put our wells in optimal positions within the channels at Smithdale to maximize the aerial coverage and sweep of the CO 2 injected.
From inception through December 31, 2008, we had not yet recovered our costs in these fields, with net negative cash flow (revenue less operating expenses and capital expenditures, including the acquisition costs) from these fields of $101.2 million.
Brookhaven Field. Our first tertiary CO 2 production response at Brookhaven Field occurred during the fourth quarter of 2005, with oil production rates averaging 125 Bbls/d during the fourth quarter of 2005. Production rates continued to generally increase throughout 2006 and 2007 as additional injection patterns have been developed. Brookhaven Field has three discrete reservoirs that are being simultaneously CO 2
flooded. Our oil production here during the fourth quarter of 2008 averaged 3,178 Bbls/d.
During 2008, oil production increased from 3,000 to 4,500 barrels of oil per day as a result of expanded development of the CO 2 flood. Also, detailed production and reservoir evaluations identified certain areas of high permeability within the Tuscaloosa Reservoir that act as “thief zones” and take a disproportionate volume of CO 2 from the injection wells. Polymer treatments designed to reduce CO 2 injection into these “thief zones” were pumped successfully on two wells. The polymer treatments are designed to alter the injection profiles and improve the reservoir sweep efficiencies in the first and second development areas of Brookhaven Field. The injection and offsetting production results of these treatments are encouraging enough that additional treatments are planned in 2009.
From inception through December 31, 2008, we had net positive cash flow (revenue less operating expenses and capital expenditures, including the acquisition cost) from Brookhaven of $4.6 million.
Little Creek Area. The Little Creek area fields, Denbury’s most mature enhanced oil recovery project, were acquired in 1999. During the fourth quarter of 2008, production averaged 1,706 Bbls/d from the Little Creek area, which includes Lazy Creek. Production at Little Creek Field began declining during 2006 and is expected to gradually decline in the future, even though we are working to mitigate production declines by monitoring injection patterns, reworking producing wells and using injection surveys to control at which intervals the CO 2 is injected.
A project was initiated in 2008 between Denbury, Mississippi State University, and the U.S. Department of Energy. The group is studying the process of alternating CO 2 injection with nutrient-enriched water in a CO 2 injection well to stimulate the growth and development of microbes in the reservoir. The one-year project will monitor injection pressures and offset oil samples for evidence of improved sweep efficiencies within the reservoir as a result of the growth of the microbes. If successful, the technique could be expanded to other portions of the field.
From inception through December 31, 2008, we had net positive cash flow (revenue less operating expenses and capital expenditures, including the acquisition cost) from Little Creek (including adjoining smaller fields) of $183.5 million.
Lockhart Crossing Field. Lockhart Crossing, located in Livingston Parish, Louisiana, is our first CO 2 project outside of Mississippi. Lockhart Crossing produces from the Wilcox formation at an average depth of 10,200’ and has similar reservoir characteristics to the Tuscaloosa formation in which we had great success with tertiary flooding at Little Creek and Mallalieu Fields.
We initiated CO 2 injections during December 2007 after completing the six mile supply line connecting Lockhart Crossing to the NEJD Pipeline. We saw our first tertiary production there in July 2008. By the end of 2008, we had completed two of the five development phases in the field and we are using 3-D seismic data to assist us with the remaining development.
From inception through December 31, 2008, we had not yet recovered our costs in this field, with net negative cash flow (revenue less operating expenses and capital expenditures, including the acquisition costs) from this field of $59.5 million.
9
Denbury Resources Inc.

Table of Contents
Phase II Fields
Eucutta Field. The oil production response we have experienced in Eucutta has confirmed the results of the pilot project that was performed in the early 1980s. The Eutaw formation at Eucutta was unitized for water flooding in 1966 and has gone through several stages of development. During the 1980s, Amerada Hess installed an inverted 5-spot injection pilot in the First City Bank sand (one of the Eutaw sands) to test the application of CO 2 flooding. Although the pilot test only covered approximately 20 acres, the pilot was successful in recovering an additional 17% of the original oil in place within the pattern. Based on this success, we designed and constructed a CO 2 flood and facility for the Eucutta Field. Initial well work was completed and CO 2 injection started during the first quarter of 2006. The initial tertiary oil production occurred in the fourth quarter of 2006. During 2008, oil production continued to increase as the Eutaw Reservoir was more fully developed, averaging 3,538 Bbls/d during the fourth quarter of 2008. Our plans for 2009 include the development of the remaining injection patterns, along with an expansion and upgrade of the CO 2 facility. This work will be completed in early 2009, with an anticipated increase in oil production thereafter.
At December 31, 2008, we had 9.1 MMBbls of proved reserves in the Eucutta Field attributable to the CO 2 flood based on a 13% recovery factor, which is lower than was achieved in the pilot program in the 1980s, and therefore we expect upward reserve revisions here in the future. Eucutta is analogous to Heidelberg Field in that the majority of its historical production was produced from the Eutaw formation. From inception through December 31, 2008, we had net positive cash flow (revenue less operating expenses and capital expenditures, including the acquisition cost) from Eucutta of $3.9 million.
Soso Field. Soso Field, near Laurel, Mississippi, produced from numerous reservoirs during primary production including the Rodessa, Bailey and Cotton Valley sands, all of which we plan to CO 2 flood. The Bailey sand exhibits comparable reservoir characteristics to our West Mississippi floods, and we expect the Bailey tertiary flood to perform in a similar manner. We elected to co-develop the Bailey sand and Rodessa sand to accelerate the development of the potential tertiary oil reserves at Soso. Although we began initial development of the Bailey sand very late in 2005, the majority of our capital investment to date occurred in 2006, which involved the construction of CO 2 facilities and the establishment of the two tertiary injection projects. During the first quarter 2006, we initiated our first injections of CO 2 into five Bailey injection wells and initiated injection in the Rodessa during the second quarter of 2006, although injections in the Bailey formation were initially limited because of delays in getting the well work done and limited CO 2 supplies. As expected, we saw our first tertiary production in early 2007 from the Bailey.
In 2007 we continued the development of additional patterns in both the Rodessa and Bailey intervals, and by the fourth quarter of 2007, we had our initial response from the Rodessa combined with continued response from the Bailey. In addition, a pilot CO 2 flood was initiated in the Cotton Valley Sand. We made significant additions to the CO 2 recycle facility during 2008, increasing the CO 2 purchase capacity. During the fourth quarter of 2008, production at Soso had increased to 2,704 Bbls/d.
From inception through December 31, 2008, we had not yet recovered our costs in this field with net negative cash flow (revenue less operating expenses and capital expenditures, including the acquisition cost) from Soso of $67.6 million.
Martinville Field. We initiated our first injections of CO 2 in Martinville Field during the first quarter of 2006 in both the Rodessa and Mooringsport formations. As is the case with most of the East Mississippi fields, Martinville produces from multiple reservoirs. Unlike the majority of our other planned CO 2 projects, Martinville does not contain a single large reservoir to CO 2 flood, but rather several smaller reservoirs. We completed construction of the CO 2 facilities and completed the development of the Mooringsport formation during 2006. During 2008, an additional producing well was drilled to expand the development of the Rodessa sand. A Lower Hosston “huff and puff” project was also initiated. The Lower Hosston project consists of injecting a predetermined volume of CO 2 into the reservoir, allowing the CO 2 time to disperse and contact oil, then flowing the well back and producing the oil that contacted the CO 2 . Numerous cycles of injection and production are planned. We are currently in the first injection cycle on this project. During the fourth quarter of 2008 production at Martinville averaged 1,213 Bbls/d, almost all of which is from the Mooringsport.
Although we booked minimal proved reserves in 2006 from the one responding well in the Mooringsport, in 2007 and 2008 we booked additional reserves, approximately 1.5 MMBbls and 0.8 MMBbls, respectively, in the Mooringsport and the Rodessa IX reservoir. There are several additional Rodessa reservoirs that will be developed following completion of the CO 2 flood in the Rodessa IX.
10
Denbury Resources Inc.

Table of Contents
From inception through December 31, 2008, we had not yet recovered our costs in this field with net negative cash flow (revenue less operating expenses and capital expenditures, including the acquisition cost) from Martinville of $6.2 million.
The Martinville Field Wash Fred 8500’ reservoir development continues to evolve. The Wash Fred formation contains a low oil gravity (thick oil), 15 o API, which will not develop miscibility with CO 2 at reservoir conditions. Denbury has several fields with similar low gravity oils, which like the Wash Fred 8500’ have had lower recoveries due to the low oil gravities and strong water drives, which do not sweep the oil efficiently. We initiated CO 2 injection during the first quarter of 2006 at the crest of the structure. Although we will not achieve miscibility, the injection of CO 2 is expected to swell the oil, decrease the oil viscosity, and displace the water and oil downward in the reservoir to the adjacent producing wells and result in incremental oil production. Well bore issues delayed the implementation of this flood during 2006, and fluid handling and processing of the CO 2 with this heavy crude have continued to hamper the development of this flood. Although we have seen indications of CO 2 response, the ability to produce and process this heavy crude with the associated CO 2 production is proving very difficult. We are evaluating various ideas and scenarios to address the processing issues we are experiencing. If we can resolve these issues, this field could provide the impetus to look at a whole new array of fields that have historically not been considered for CO 2 injection, although there can be no assurance that this technique will be successful or economic.
Heidelberg Field. Our 2008 capital program included $43.4 million for construction of the CO 2 pipeline necessary to transport CO 2 from the Free State Pipeline to Heidelberg Field, construction of the initial phase of the CO 2 recycle facilities and initial development of a CO 2
flood in West Heidelberg Field. The initial phase of our CO 2 project will be conducted in the West Heidelberg (WHEOUP) Unit. The reservoir associated with the WHEOUP unit is the Eutaw formation, the same formation we are CO 2 flooding at Eucutta Field. Thus we expect the results at Heidelberg to be similar to the results at Eucutta Field. During the first half of 2008, the Heidelberg central processing and CO 2
recycle facility surface site was secured, cleared, and prepared for construction and facility construction began during the third quarter of the year. The first phase well work was completed in the fourth quarter with the conversion of seventeen producers and eight CO 2 injectors. As of year end, we were injecting approximately 40 MMcf/d of CO 2 into the Eutaw formation in the southern end of West Heidelberg Field. During 2009, we will add eight new injection patterns and expand the central processing facility. Oil production response to the CO 2 injection is expected during the second half of 2009. Four phases are planned for West Heidelberg Field before moving EOR operations into East Heidelberg.
Due to Heidelberg being an analogy to Eucutta, we were able to book proved tertiary oil reserves at Heidelberg Field at December 31, 2008. Although similar in many respects, the Eutaw reservoir at Heidelberg contains two to three times the potential oil reserves as the Eutaw formation at Eucutta Field.
Phase III Field
Tinsley Field. Tinsley Field was acquired in January 2006 and is the largest oil field in the state of Mississippi. As is the case with the majority of fields in Mississippi, Tinsley produces from multiple reservoirs. Our primary target in Tinsley for CO 2 enhanced oil recovery operations is the Woodruff formation. A prior operator performed a pilot CO 2 project at Tinsley in the Perry sandstone. The CO 2 was successful at mobilizing oil but the operator decided not to expand the flood due to low crude oil prices. The acquisition of the field included an 8” pipeline that was installed to deliver CO 2 to the pilot project but was converted to natural gas service some time ago. We reconditioned the pipeline for CO 2 service and initiated limited CO 2 injection in Tinsley Field in January 2007. During 2008 the 24” Delta Pipeline was completed and placed in service between Jackson Dome and the Tinsley CO 2 recycle facility, allowing us to transport and inject significantly larger volumes of CO 2 . We had our first tertiary oil production commencing in April 2008. By July 2008, all of the tertiary wells in the first two phases were responding to CO 2 injection and producing oil. During the fourth quarter of 2008, the average oil production was 1,832 Bbls/d. We also had non-CO 2 oil production during this same period of 736 Bbls/d.
From inception through December 31, 2008, we had not yet recovered our costs in this field, with net negative cash flow (revenue less operating expenses and capital expenditures, including the acquisition cost) from Tinsley of $213.8 million.
11
Denbury Resources Inc.

Table of Contents
Our Tertiary Oil Fields Without Proved Tertiary Reserves
Cranfield . Cranfield development accelerated during 2008 as we increased the well count to 11 CO 2 injectors and 11 producers. Reconditioning of the CO 2 pipeline and the initial phase of the production facility were completed in the third quarter of 2008, which allowed us to commence CO 2 injection into the Lower Tuscaloosa reservoir. The CO 2 injection increased reservoir pressure to a level that caused most of the wells to begin flowing water by late 2008. We had our first minor amounts of tertiary oil production in January 2009. At Cranfield, we have participated with the Bureau of Economic Geology (BEG) from the University of Texas as they study CO 2 injection and sequestration to better define and understand the movement of CO 2 through the reservoir. The results of this study could lead to a greater recovery of the oil in the reservoir.
Delhi Field. During May 2006, we purchased the Delhi Holt-Bryant Unit (“Delhi”) in Northern Louisiana for $50 million, plus a 25% reversionary interest to the seller after we achieve $200 million in net operating income. In 2008, eight wells were re-completed to be utilized in the Delhi flood patterns. We also finalized the development plans to complete two CO 2 flood patterns in the Paluxy formation and one pattern in the Tuscaloosa formation. The surveying and permitting process for wells, flowlines and facilities are expected to be completed during the first quarter of 2009. The Delta Pipeline (Tinsley to Delhi) is expected to be delivering CO 2 to Delhi Field by the end of the second quarter of 2009. The CO 2 processing facility engineering will be completed during 2009 and construction of the CO 2 facility will begin, with first enhanced oil production anticipated in 2010. As of December 31, 2008, there was no significant oil production nor proved oil reserves at Delhi Field.
Hastings Field. During November 2006, we entered into an agreement with a subsidiary of Venoco, Inc. that gave us an option to purchase their interest in Hastings Field, a strategically significant potential tertiary flood candidate located near Houston, Texas. We exercised the purchase option prior to September 2008, and closed the $201 million acquisition during February 2009. As consideration for the option agreement, we made total payments of $50 million.
The purchase price of $201 million included approximately $4.9 million for certain surface land, oilfield equipment and other related assets. Under the terms of the agreement, Venoco, Inc., the seller, retained a 2% override and reversionary interest of approximately 25% following payout, as defined in the option agreement. The Hastings Complex is currently producing approximately 2,400 BOE/d, net to the acquired interest, with conventional proved reserves of approximately 5.8 MMBOE using year-end 2008 prices. The Hastings proved reserves were not included in the Company’s year-end proved reserves. We plan to commence flooding the field with CO 2 beginning in 2011, after completion of our Green CO 2 Pipeline currently under construction, and construction of field CO 2 recycling facilities.
As part of the agreement, we are required to spend an aggregate of approximately $179 million over a five year period to develop the field for tertiary operations (commencing in 2010), with an obligation to commence CO 2 injections in the field by late 2012.
Based on preliminary engineering data, the West Hastings Unit (the most likely area to be initially developed as a tertiary flood) has significant net reserve potential from CO 2 tertiary floods, more reserve potential than any other single field in our inventory. We started construction of the Green Pipeline during November 2008 to transport CO 2 to this field (see “CO 2 pipelines” above). Based on our latest estimates, it will cost between $400 million and $600 million to develop the West Hastings Unit as a tertiary flood, excluding the cost of the Green Pipeline.
Oyster Bayou, Fig Ridge and Gillock Fields. During 2007, we acquired an interest in three fields in Southeast Texas with significant tertiary potential. The Oyster Bayou and Fig Ridge Fields are located in close proximity to each other and are located on or close to the planned route of the 24” Green Pipeline. We acquired the majority interest in Oyster Bayou Field and a relatively small interest in Fig Ridge Field. We plan to start the unitization hearings required at Oyster Bayou Field during 2009. Because of current lack of majority interest at Fig Ridge Field, we will need the cooperation of other operators and lease owners to form the necessary unit. During 2008 we initiated those discussions.
Our acquisitions in Gillock Field include an acquisition of almost all of the South Gillock Unit, the Southeast Gillock unit and the acquisition of a key lease in the Gillock Field. The Gillock acquisitions are located near the proposed Green Pipeline and Hastings Field. Denbury continues to evaluate other potential acquisition candidates in Southeast Texas and in Louisiana in proximity to our Green Pipeline.
12
Denbury Resources Inc.

Table of Contents
Overall Tertiary Economics to Date. Through December 31, 2008, we have invested a total of $1.4 billion on tertiary oil fields (including the allocated acquisition costs), and received $1.3 billion in net operating income (revenue less operating expenses), or net unrecovered cash flow of $105.3 million, the deficit primarily due to the significant funds expended on acquisitions during 2006. Of our total spending, approximately $229.6 million was invested to date on fields that had little or no proved reserves at December 31, 2008 (i.e., significant incremental proved reserves are anticipated in future years). These amounts do not include the capital costs or related depreciation and amortization of our CO 2 producing properties at Jackson Dome, which had an unrecovered net cash flow of $816.7 million as of December 31, 2008, including $525.7 million associated with CO 2 pipelines. At year-end 2008, the proved oil reserves in our tertiary recovery oil fields had a PV-10 Value of approximately $1.0 billion, using December 31, 2008, NYMEX pricing of $44.60 per barrel. In addition, there are significant probable and potential reserves at several other fields for which tertiary operations are under way or planned.
Texas Barnett Shale
We currently own approximately 20,441 gross acres and 19,457 net acres in the Barnett Shale area in North Central Texas. We acquired our initial acreage in this area in 2001 and did only limited development until 2005. Through December 31, 2008, we have invested a total of $552.3 million on the Barnett Shale area (including acquisition costs) and have received $403.0 million in net operating income (revenue less operating expenses), or net negative cash flow of $149.3 million. At December 31, 2008, we had approximately 458 Bcfe of proved reserves in the Barnett Shale area with a PV-10 Value of approximately $430.0 million, using December 31, 2008, Henry Hub indicative cash pricing of $5.71 per MMBtu.
We continue to refine our completion and fracturing techniques, including an analysis of the best number of fracture treatments to adequately stimulate the entire length of the lateral sections of our horizontal wells, which can exceed 4,000’. During 2008, we drilled and completed 38 horizontal wells which kept our production from this area about the same throughout the year, averaging approximately 73 MMcfe/d during the fourth quarter of 2008.
Horizontal wells in the Barnett Shale were initially drilled by spacing horizontal wells approximately 1,500’ apart and drilling 3,000’ to 4,500’ laterals. As our development progressed, we began testing wells at various spacings of 750’ and subsequently 500’ along with other operators in the Barnett. Initial production rates and early production data indicated that we were not efficiently draining the reservoir on the larger initial well spacing, and thus we began developing our acreage position on 500’ well spacing which significantly increased the number of future development well locations that could be drilled. Our year-end reserves included 77 proved undeveloped locations, plus we have an additional 64 probable undeveloped locations based on 500’ well spacing. We have recently begun testing well spacings less than 500’ but the results of this additional downspacing are inconclusive at this time. We have drilled two 250’ spaced wells. These wells have produced volumes at or above that which an average conventionally spaced well would have produced at this time in their production life. If our testing of the Barnett Shale on tighter well spacing continues to be successful, it would significantly increase our number of future locations. We expect production in the Barnett Shale to decline during 2009, as we are planning on drilling only six wells during the year due to reduction of our overall capital expenditure program because of the significant decline in commodity prices during the last half of 2008. Our planned 2009 capital expenditures in the Barnett Shale area are estimated to be approximately $25 million.
East Mississippi Fields without Proved Tertiary Oil Reserves
We have been active in East Mississippi since Denbury was founded in 1990 and are by far the largest oil producer in the basin. Historically, this was our area with the highest production and most proved reserves, and while still significant, it is no longer our largest. Production during the fourth quarter of 2008 averaged approximately 12,150 BOE/d from this area (25% of our Company total), and we had proved reserves of 40.1 MMBOE as of December 31, 2008 (16% of our Company total). Since we have generally owned these Eastern Mississippi properties longer than properties in our other regions, they tend to be more fully developed, and although most are targeted for tertiary operations in the future, only four currently have tertiary operations (Soso, Martinville, Eucutta and Heidleberg Fields). Production from our conventional and secondary recovery operations in our East Mississippi fields has been relatively consistent over the last three years, averaging 12,743 BOE/d in 2006, 12,479 BOE/d in 2007 and 11,897 BOE/d during 2008.
Heidelberg Field. The largest field in the region and one of our largest fields corporately is Heidelberg Field, which for the fourth quarter of 2008 produced an average of 7,482 BOE/d. Heidelberg Field was acquired from Chevron in December 1997. The field is a large salt-cored anticline that is divided into western and eastern
13
Denbury Resources Inc.

Table of Contents
segments due to subsequent faulting. Most of the past and current production comes from the Eutaw, Selma Chalk and Christmas sands at depths from 3,500’ to 5,000’.
The majority of the oil production at Heidelberg is from six waterflood units that produce from the Eutaw formation (at approximately 4,400’). Most of our recent development at Heidelberg, other than our tertiary operations, has been in the Selma Chalk, a natural gas reservoir at around 3,700’, making Heidelberg our second largest gas field. We have steadily developed the Selma Chalk since 2001, drilling from 13 to 20 wells per year, increasing the natural gas production at Heidelberg to a peak quarterly average of 19.4 MMcf/d in the fourth quarter of 2008. During late 2006 and early 2007, we drilled our first horizontal wells in West Heidelberg Field where vertical wells were generally uneconomic. The horizontal wells have performed well and thus we expect to be able to expand our Selma Chalk development throughout West Heidelberg Field. During 2007, we drilled 13 horizontal Selma Chalk wells, two of which were located in West Heidelberg, and during 2008, we drilled 10 horizontal Selma Chalk wells, three of which were located in West Heidelberg. Similar to the Barnett Shale, we have severely curtailed capital expenditures on this field in 2009 as a result of lower commodity prices.
14
Denbury Resources Inc.

Table of Contents
Field Summaries
Denbury operates in five primary areas: Eastern Mississippi, Western Mississippi, Texas, Alabama and Louisiana. Our 17 largest fields (listed below) constitute approximately 97% of our total proved reserves on a BOE basis, and 96% of our total proved reserves on a PV-10 Value basis. Within these 17 fields, we own a weighted average 95% working interest and operate all of these fields. The concentration of value in a relatively small number of fields allows us to benefit substantially from any operating cost reductions or production enhancements we achieve, and allows us to effectively manage the properties from our four primary field offices located in Laurel, Mississippi; McComb, Mississippi; Jackson, Mississippi; and Aledo, Texas.
Denbury Resources Inc.
Proved Reserves as of December 31, 2008 (1) 2008 Average Daily Production Oil Natural Gas BOE PV-10 Value (2) Oil Natural Gas (MBbls) (MMcf) MBOEs % of total (000's) (Bbls/d) (Mcf/d) Avg NRI
Tertiary Oil Fields Tinsley 34,440 — 34,440 13.8 % $ 224,812 1,010 — 75.6 % Heidelberg 22,394 — 22,394 8.9 % 22,948 — — 77.3 % Brookhaven 17,330 — 17,330 6.9 % 213,816 2,826 — 79.2 % McComb Area 13,688 — 13,688 5.5 % 101,106 1,901 — 78.9 % Mallalieu 11,790 — 11,790 4.7 % 161,077 5,686 — 76.6 % Eucutta 9,147 — 9,147 3.7 % 135,975 3,109 — 83.5 % Soso 9,024 — 9,024 3.6 % 91,089 2,111 — 77.2 % Lockhart Crossing 3,970 — 3,970 1.6 % 35,502 186 — 58.0 % Little Creek & Lazy Creek 3,213 — 3,213 1.3 % 40,758 1,683 — 83.2 % Martinville 839 — 839 0.3 % 7,700 865 — 78.1 %
Total Tertiary Oil Fields 125,835 — 125,835 50.3 % 1,034,783 19,377 — 78.7 %
Mississippi
Heidelberg 17,066 63,637 27,672 11.0 % 276,199 4,505 17,663 77.3 % Sharon 16 24,458 4,092 1.6 % 54,930 13 8,222 83.6 % Eucutta 1,140 — 1,140 0.5 % 14,346 309 3 67.3 % Summerland 1,044 — 1,044 0.4 % 7,524 373 — 74.4 % S. Cypress Creek 937 17 940 0.4 % 9,523 190 20 83.0 % Other Mississippi 4,777 2,807 5,245 2.1 % 53,816 2,012 1,065 21.4 %
Total Mississippi 24,980 90,919 40,133 16.0 % 416,338 7,402 26,973 48.4 %
Texas
Newark (Barnett Shale) 20,865 332,502 76,282 30.5 % 429,961 2,887 58,874 79.9 % Other Texas 343 553 435 0.1 % 3,059 266 1,488 64.6 %
Total Texas 21,208 333,055 76,717 30.6 % 433,020 3,153 60,362 78.8 %
Louisiana and Other
Various Fields 417 3,912 1,069 0.4 % 17,786 310 1,312 56.7 % Louisiana Sold (3) — — — — — 15 518 49.0 %
Total Louisiana and Other 417 3,912 1,069 0.4 % 17,786 325 1,830 55.4 %
Alabama
Citronelle 6,686 — 6,686 2.7 % 24,906 1,176 — 63.3 % Other Alabama — 69 12 — 22 3 277 1.8 %
Total Alabama 6,686 69 6,698 2.7 % 24,928 1,179 277 29.5 %
Company Total 179,126 427,955 250,452 100.0 % $ 1,926,855 31,436 89,442 64.9 %
(1) The reserves were prepared using constant prices and costs in accordance with the guidelines of SFAS No. 69 based on the prices received on a field-by-field basis as of December 31, 2008. The prices at that date were a NYMEX oil price of $44.60 per Bbl adjusted to prices received by field and a Henry Hub natural gas cash price of $5.71 per MMBtu also adjusted to prices received by field.
(2) PV-10 Value is a non-GAAP measure and is different from the Standardized Measure of Discounted Future Net Cash Flows (“Standardized Measure”) in that PV-10 Value is a pre-tax number and the Standardized Measure is an after-tax number. The information used to calculate PV-10 Value is derived directly from data determined in accordance with SFAS No. 69. The Standardized Measure was $1,415,498 at December 31, 2008. A comparison of PV-10 to the Standardized Measure is included in the table on page 21 as well as further information regarding our use of this non-GAAP measure.
(3) Production in the Louisiana sold category is associated with the portion of the Louisiana divestiture that closed in February 2008.

15

Table of Contents
Oil and Gas Acreage, Productive Wells, and Drilling Activity
In the data below, “gross” represents the total acres or wells in which we own a working interest and “net” represents the gross acres or wells multiplied by Denbury’s working interest percentage. For the wells that produce both oil and gas, the well is typically classified as an oil or natural gas well based on the ratio of oil to gas production.
Oil and Gas Acreage
The following table sets forth Denbury’s acreage position at December 31, 2008:
Denbury’s net undeveloped acreage that is subject to expiration over the next three years, if not renewed, is approximately 25% in 2009, 22% in 2010 and 45% in 2011.
Productive Wells
The following table sets forth our gross and net productive oil and natural gas wells at December 31, 2008:
16
Denbury Resources Inc.
Developed Undeveloped Total Gross Net Gross Net Gross Net Mississippi 153,080 108,720 248,227 32,036 401,307 140,756 Louisiana 35,863 34,162 4,559 3,882 40,422 38,044 Texas 37,691 34,324 7,229 3,814 44,920 38,138 Alabama 19,429 15,218 68,697 11,755 88,126 26,973 Other 6,852 855 38,711 9,686 45,563 10,541
Total 252,915 193,279 367,423 61,173 620,338 254,452
Producing Natural Producing Oil Wells Gas Wells Total Gross Net Gross Net Gross Net Operated Wells: Mississippi 585 558.3 220 200.0 805 758.3 Louisiana 25 18.8 9 9.0 34 27.8 Texas 27 23.1 199 192.6 226 215.7 Alabama 151 120.3 7 3.1 158 123.4
Total 788 720.5 435 404.7 1,223 1,125.2
Non-Operated Wells: Mississippi 39 3.8 20 4.6 59 8.4 Louisiana — — 1 — 1 — Texas 1 — 4 0.5 5 0.5 Alabama — — 3 0.6 3 0.6 Other 4 — — — 4 —
Total 44 3.8 28 5.7 72 9.5
Total Wells: Mississippi 624 562.1 240 204.6 864 766.7 Louisiana 25 18.8 10 9.0 35 27.8 Texas 28 23.1 203 193.1 231 216.2 Alabama 151 120.3 10 3.7 161 124.0 Other 4 — — — 4 —
Total 832 724.3 463 410.4 1,295 1,134.7

Table of Contents
Drilling Activity
The following table sets forth the results of our drilling activities over the last three years:
Production and Unit Prices
Information regarding average production rates, unit sale prices and unit costs per BOE are set forth under “Management’s Discussion and Analysis of Financial Condition and Results of Operations — Operating Results” included herein.
Title to Properties
Customarily in the oil and gas industry, only a perfunctory title examination is conducted at the time properties believed to be suitable for drilling operations are first acquired. Prior to commencement of drilling operations, a thorough drill site title examination is normally conducted, and curative work is performed with respect to significant defects. During acquisitions, title reviews are performed on all properties; however, formal title opinions are obtained on only the higher value properties. We believe that we have good title to our oil and natural gas properties, some of which are subject to minor encumbrances, easements and restrictions.
Geographic Segments
All of our operations are in the United States.
Significant Oil and Gas Purchasers and Product Marketing
Oil and gas sales are made on a day-to-day basis under short-term contracts at the current area market price. The loss of any single purchaser would not be expected to have a material adverse effect upon our operations; however, the loss of a large single purchaser could potentially reduce the competition for our oil and natural gas production, which in turn could negatively impact the prices we receive. For the year ended December 31, 2008, we had three significant purchasers that each accounted for 10% or more of our oil and natural gas revenues: Marathon Petroleum Company LLC (49%), Hunt Crude Oil Supply Co. (20%) and Crosstex Energy Field Services Inc. (14%).
17
Denbury Resources Inc.
Year Ended December 31, 2008 2007 2006 Gross Net Gross Net Gross Net Exploratory Wells: (1)
Productive (2) — — 9 6.2 10 8.5 Non-productive (3) 1 1.0 4 3.4 8 6.8
Development Wells: (1) Productive (2) 102 98.3 101 96.8 90 82.7 Non-productive (3)(4) 1 0.7 — — — —
Total 104 100.0 114 106.4 108 98.0
(1) An exploratory well is a well drilled either in search of a new, as yet undiscovered, oil or natural gas reservoir or to greatly extend the known limits of a previously discovered reservoir. A development well is a well drilled within the presently proved productive area of an oil or natural gas reservoir, as indicated by reasonable interpretation of available data, with the objective of completing in that reservoir.
(2) A productive well is an exploratory or development well found to be capable of producing either oil or natural gas in sufficient quantities to justify completion as an oil or natural gas well.
(3) A nonproductive well is an exploratory or development well that is not a producing well.
(4) During 2008, 2007 and 2006, an additional 33, 23, and 14 wells, respectively, were drilled for water or CO 2 injection purposes.

Table of Contents
For the year ended December 31, 2007, three purchasers each accounted for 10% or more of our oil and natural gas revenues: Marathon Petroleum Company LLC (43%), Hunt Crude Oil Supply Co. (19%) and Crosstex Energy Field Services Inc. (16%). For the year ended December 31, 2006, we had two significant purchasers that each accounted for 10% or more of our oil and natural gas revenues: Marathon Petroleum Company LLC (28%) and Hunt Crude Oil Supply Co. (18%).
Our ability to market oil and natural gas depends on many factors beyond our control, including the extent of domestic production and imports of oil and gas, the proximity of our gas production to pipelines, the available capacity in such pipelines, the demand for oil and natural gas, the effects of weather, and the effects of state and federal regulation. Our production is primarily from developed fields close to major pipelines or refineries and established infrastructure. As a result, we have not experienced any difficulty to date in finding a market for all of our production as it becomes available or in transporting our production to those markets; however, there is no assurance that we will always be able to market all of our production or obtain favorable prices.
Oil Marketing
The quality of our crude oil varies by area, thereby impacting the corresponding price received. In Heidelberg Field, one of our larger fields, and our other Eastern Mississippi properties, our oil production is primarily light to medium sour crude and sells at a significant discount to the NYMEX prices. In Western Mississippi, the location of our Phase I tertiary operations, our oil production is primarily light sweet crude, which typically sells at near NYMEX prices, or often at a premium. For the year ended December 31, 2008, the discount for our oil production from Heidelberg Field averaged $15.65 per Bbl and for our Eastern Mississippi properties as a whole the discount averaged $13.64 per Bbl relative to NYMEX oil prices. For our Phase I tertiary fields in Southwest Mississippi, we averaged a premium of $3.75 per Bbl over NYMEX oil prices during 2008. For our Phase II tertiary fields, we averaged a discount of $6.61 per Bbl below NYMEX oil prices during 2008. Our Texas Barnett Shale properties averaged $43.74 per Bbl below NYMEX prices during 2008, largely because the reported oil sales are mostly natural gas liquids, which typically sell at much lower prices than crude oil.
Natural Gas Marketing
Virtually all of our natural gas production is close to existing pipelines and consequently we generally have a variety of options to market our natural gas. We sell the majority of our natural gas on one-year contracts with prices fluctuating month-to-month based on published pipeline indices with slight premiums or discounts to the index. We receive near NYMEX or Henry Hub prices for most of our natural gas sales in Mississippi. For the year ended December 31, 2008, we averaged $0.35 above NYMEX prices for our Mississippi natural gas production. However, in the Barnett Shale area in Texas, due primarily to its location, the price we received averaged $0.74 below NYMEX prices.
Competition and Markets
We face competition from other oil and natural gas companies in all aspects of our business, including acquisition of producing properties and oil and gas leases, marketing of oil and gas, and obtaining goods, services and labor. Many of our competitors have substantially larger financial and other resources. Factors that affect our ability to acquire producing properties include available funds, available information about prospective properties and our standards established for minimum projected return on investment. Gathering systems are the only practical method for the intermediate transportation of natural gas. Therefore, competition for natural gas delivery is presented by other pipelines and gas gathering systems. Competition is also presented by alternative fuel sources, including heating oil and other fossil fuels. Because of the nature of our core assets (our tertiary operations) and our ownership of a relatively uncommon significant natural source of carbon dioxide, we believe that we are effective in competing in the market.
The demand for qualified and experienced field personnel to drill wells and conduct field operations, geologists, geophysicists, engineers and other professionals in the oil and natural gas industry can fluctuate significantly, often in correlation with oil and natural gas prices, causing periodic shortages. There have also been shortages of drilling rigs and other equipment, as demand for rigs and equipment has increased along with the number of wells being drilled. These factors also cause significant increases in costs for equipment, services and personnel. Higher oil and natural gas prices generally stimulate increased demand and result in increased prices for drilling rigs, crews and associated supplies, equipment and services. We cannot be certain when we will experience
18
Denbury Resources Inc.

Table of Contents
these issues, and these types of shortages or price increases could significantly decrease our profit margin, cash flow and operating results or restrict our ability to drill those wells and conduct those operations that we currently have planned and budgeted.
Federal and State Regulations
Numerous federal and state laws and regulations govern the oil and gas industry. These laws and regulations are often changed in response to changes in the political or economic environment. Compliance with this evolving regulatory burden is often difficult and costly, and substantial penalties may be incurred for noncompliance. The following section describes some specific laws and regulations that may affect us. We cannot predict the impact of these or future legislative or regulatory initiatives.
Management believes that we are in substantial compliance with all laws and regulations applicable to our operations and that continued compliance with existing requirements will not have a material adverse impact on us. The future annual capital costs of complying with the regulations applicable to our operations is uncertain and will be governed by several factors, including future changes to regulatory requirements. However, management does not currently anticipate that future compliance will have a materially adverse effect on our consolidated financial position or results of operations.
Regulation of Natural Gas and Oil Exploration and Production
Our operations are subject to various types of regulation at the federal, state and local levels. Such regulation includes requiring permits for drilling wells; maintaining bonding requirements in order to drill or operate wells and regulating the location of wells; the method of drilling and casing wells; the surface use and restoration of properties upon which wells are drilled; the plugging and abandoning of wells; and the disposal of fluids used in connection with operations. Our operations are also subject to various conservation laws and regulations. These include regulation of the size of drilling, spacing or proration units and the density of wells that may be drilled in those units, and the unitization or pooling of oil and gas properties. In addition, state conservation laws which establish maximum rates of production from oil and gas wells, generally prohibit the venting or flaring of gas and impose certain requirements regarding the ratability of production. The effect of these regulations may limit the amount of oil and gas we can produce from our wells and may limit the number of wells or the locations at which we can drill. The regulatory burden on the oil and gas industry increases our costs of doing business and, consequently, affects our profitability.
Federal Regulation of Sales Prices and Transportation
The transportation and certain sales of natural gas in interstate commerce are heavily regulated by agencies of the U.S. federal government and are affected by the availability, terms and cost of transportation. In particular, the price and terms of access to pipeline transportation are subject to extensive U.S. federal and state regulation. The Federal Energy Regulatory Commission (FERC) is continually proposing and implementing new rules and regulations affecting the natural gas industry. The stated purpose of many of these regulatory changes is to promote competition among the various sectors of the natural gas industry. The ultimate impact of the complex rules and regulations issued by FERC cannot be predicted. Some of FERC’s proposals may, however, adversely affect the availability and reliability of interruptible transportation service on interstate pipelines. While our sales of crude oil, condensate and natural gas liquids are not currently subject to FERC regulation, our ability to transport and sell such products is dependent on certain pipelines whose rates, terms and conditions of service are subject to FERC regulation. Additional proposals and proceedings that might affect the natural gas industry are considered from time to time by Congress, FERC, state regulatory bodies and the courts. We cannot predict when or if any such proposals might become effective and their effect, if any, on our operations. Historically, the natural gas industry has been heavily regulated; therefore, there is no assurance that the less stringent regulatory approach recently pursued by FERC, Congress and the states will continue indefinitely into the future.
Federal Energy and Climate Change Legislation
In October 2008, as part of the Emergency Economic Stabilization Act, Congress included a new tax credit for carbon capture and sequestration, including that achieved through enhanced oil recovery, as further modified by the American Recovery and Reinvestment Act of 2009, passed in February 2009. In future periods Congress may decide to revisit legislation introduced in prior sessions to repeal existing incentives or impose new taxes on the
19
Denbury Resources Inc.

Table of Contents
exploration and production of oil, gas and other minerals, and/or create new incentives for alternative energy sources. Congress may also consider legislation to reduce emissions of carbon dioxide or other greenhouse gases. If enacted, such legislation could impose a tax or other economic penalty on the production of oil and gas that, when consumed, ultimately release CO 2 . Any additional taxes or economic penalties imposed on the production of oil and gas would increase the costs incurred by the Company in its exploration and production activities and more than likely reduce the supply of domestic production of oil and gas which could in turn increase the price received on our oil and gas production. At the same time, legislation to reduce the emissions of carbon dioxide or other gases could also create economic incentives for technologies and practices that reduce or avoid such emissions, including activities that sequester CO 2 in geologic formations such as oil and gas reservoirs. Denbury’s CO 2 -EOR operations, including our CO 2 pipeline network are well positioned in this regard.
Natural Gas Gathering Regulations
State regulation of natural gas gathering facilities generally include various safety, environmental and, in some circumstances, nondiscriminatory-take requirements. Although such regulation has not generally been affirmatively applied by state agencies, natural gas gathering may receive greater regulatory scrutiny in the future.
Federal, State or Indian Leases
Our operations on federal, state or Indian oil and gas leases are subject to numerous restrictions, including nondiscrimination statutes. Such operations must be conducted pursuant to certain on-site security regulations and other permits and authorizations issued by the Bureau of Land Management, Minerals Management Service (“MMS”) and other agencies.
Environmental Regulations
Public interest in the protection of the environment has increased dramatically in recent years. Our oil and natural gas production and saltwater disposal operations, and our processing, handling and disposal of hazardous materials such as hydrocarbons and naturally occurring radioactive materials are subject to stringent regulation. We could incur significant costs, including cleanup costs resulting from a release of hazardous material, third-party claims for property damage and personal injuries, fines and sanctions, as a result of any violations or liabilities under environmental or other laws. Changes in or more stringent enforcement of environmental laws could also result in additional operating costs and capital expenditures.
Various federal, state and local laws regulating the discharge of materials into the environment, or otherwise relating to the protection of the environment, directly impact oil and gas exploration, development and production operations, and consequently may impact the Company’s operations and costs. These regulations include, among others, (i) regulations by the EPA and various state agencies regarding approved methods of disposal for certain hazardous and nonhazardous wastes; (ii) the Comprehensive Environmental Response, Compensation, and Liability Act, Federal Resource Conservation and Recovery Act and analogous state laws that regulate the removal or remediation of previously disposed wastes (including wastes disposed of or released by prior owners or operators), property contamination (including groundwater contamination), and remedial plugging operations to prevent future contamination; (iii) the Clean Air Act and comparable state and local requirements, which may result in the gradual imposition of certain pollution control requirements with respect to air emissions from the operations of the Company or could result in the imposition of economic penalties on the production of fossil fuels that, when used, ultimately release CO 2 ; (iv) the Oil Pollution Act of 1990, which contains numerous requirements relating to the prevention of and response to oil spills into waters of the United States; (v) the Resource Conservation and Recovery Act, which is the principal federal statute governing the treatment, storage and disposal of hazardous wastes; and (vi) state regulations and statutes governing the handling, treatment, storage and disposal of naturally occurring radioactive material (“NORM”).
Management believes that we are in substantial compliance with applicable environmental laws and regulations. To date, we have not expended any material amounts to comply with such regulations, and management does not currently anticipate that future compliance will have a materially adverse effect on our consolidated financial position, results of operations or cash flows.
20
Denbury Resources Inc.

Table of Contents
Estimated Net Quantities of Proved Oil and Natural Gas Reserves and Present Value of Estimated Future Net Revenues
DeGolyer and MacNaughton, independent petroleum engineers located in Dallas, Texas, prepared estimates of our net proved oil and natural gas reserves as of December 31, 2008, 2007 and 2006. The reserve estimates were prepared using constant prices and costs in accordance with the guidelines of Statement of Financial Accounting Standards (“SFAS”) No. 69. The prices used in preparation of the reserve estimates were based on the market prices in effect as of December 31 of each year, with the appropriate adjustments (transportation, gravity, basic sediment and water (“BS&W”), purchasers’ bonuses, Btu, etc.) applied to each field. The reserve estimates do not include any value for probable or possible reserves that may exist, nor do they include any value for undeveloped acreage. The reserve estimates represent our net revenue interests in our properties. During 2008, we provided oil and gas reserve estimates for 2007 to the United States Energy Information Agency. The information provided was substantially the same as the reserve estimates included in our Form 10-K for the year ended December 31, 2007.
Our proved nonproducing reserves primarily relate to reserves that are to be recovered from productive zones that are currently behind pipe. Since a majority of our properties are in areas with multiple pay zones, these properties typically have both proved producing and proved nonproducing reserves.
Proved undeveloped reserves associated with our CO 2 tertiary operations and our Heidelberg waterfloods in East Mississippi account for approximately 90% of our proved undeveloped oil reserves. We consider these reserves to be lower risk than other proved undeveloped reserves that require drilling at locations offsetting existing production because all of these proved undeveloped reserves are associated with secondary recovery or tertiary recovery operations in fields and reservoirs that historically produced substantial volumes of oil under primary production. The main reason these reserves are classified as undeveloped is because they require significant additional capital associated with drilling/re-entering wells or additional facilities in order to produce the reserves and/or are waiting for a production response to the water or CO 2 injections. Our proved undeveloped natural gas reserves associated with our Selma Chalk play at Heidelberg and the Barnett Shale play account for approximately 94% of our proved undeveloped natural gas reserves. Due to the curtailment of our capital spending for 2009, our current plans include drilling only six new wells in the Barnett Shale during 2009.
Denbury Resources Inc.
December 31, 2008 2007 2006
ESTIMATED PROVED RESERVES: Oil (MBbls) 179,126 134,978 126,185 Natural gas (MMcf) 427,955 358,608 288,826 Oil equivalent (MBOE) 250,452 194,746 174,322
PERCENTAGE OF TOTAL MBOE:
Proved producing 47 % 56 % 48 % Proved non-producing 11 % 13 % 17 % Proved undeveloped 42 % 31 % 35 %
REPRESENTATIVE OIL AND NATURAL GAS PRICES: (1)
Oil — NYMEX $ 44.60 $ 95.98 $ 61.05 Natural gas — Henry Hub 5.71 6.80 5.63
PRESENT VALUES (thousands): (2)
Discounted estimated future net cash flow before income taxes (“PV-10 Value” ) (3) $ 1,926,855 $ 5,385,123 $ 2,695,199 Standardized measure of discounted estimated future net cash flow after income taxes 1,415,498 3,539,617 1,837,341
(1) The prices of each year-end were based on market prices in effect as of December 31 of each year, NYMEX prices per Bbl and Henry Hub cash prices per MMBtu, with the appropriate adjustments (transportation, gravity, BS&W, purchasers’ bonuses, Btu, etc.) applied to each field to arrive at the appropriate corporate net price.
(2) Determined based on year-end unescalated prices and costs in accordance with the guidelines of SFAS No. 69, discounted at 10% per annum.
(3) PV-10 Value is a non-GAAP measure and is different from the Standardized Measure in that PV-10 Value is a pre-tax number and the Standardized Measure is an after-tax number. The information used to calculate PV-10 Value is derived directly from data determined in accordance with SFAS No. 69. The difference between these two amounts, the discounted estimated future income tax (in thousands), was $511,357 at December 31, 2008, $1,845,506 at December 31, 2007, and $857,858 at December 31, 2006. We believe that PV-10 Value is a useful supplemental disclosure to the Standardized Measure because the Standardized Measure can be impacted by a company’s unique tax situation, and it is not practical to calculate the Standardized Measure on a property by property basis. Because of this, PV-10 Value is a widely used measure within the industry and is commonly used by securities analysts, banks and credit rating agencies to evaluate the estimated future net cash flows from proved reserves on a comparative basis across companies or specific properties. PV-10 Value is commonly used by us and others in our industry to evaluate properties that are bought and sold and to assess the potential return on investment in our oil and gas properties. PV-10 Value is not a measure of financial or operating performance under GAAP, nor should it be considered in isolation or as a substitute for the Standardized Measure. Our PV-10 Value and the Standardized Measure do not purport to represent the fair value of our oil and natural gas reserves. See Note 15 to our Consolidated Financial Statements for additional disclosures about the Standardized Measure.

21

Table of Contents
There are numerous uncertainties inherent in estimating quantities of proved oil and natural gas reserves and their values, including many factors beyond our control. See “Risk Factors — Estimating our reserves, production and future net cash flow is difficult to do with any certainty.” See also Note 15, “Supplemental Oil and Natural Gas Disclosures,” to the Consolidated Financial Statements.
Item 1A. Risk Factors
RISKS RELATED TO OUR BUSINESS
Our production will decline if our access to sufficient amounts of carbon dioxide is limited.
Our current long-term growth strategy is focused on our CO 2 tertiary recovery operations, and we expect approximately 90% of our 2009 capital expenditures to be in this area. The crude oil production from our tertiary recovery projects depends on having access to sufficient amounts of carbon dioxide. Our ability to produce this oil would be hindered if our supply of carbon dioxide were limited due to problems with our current CO 2 producing wells and facilities, including compression equipment, or catastrophic pipeline failure. Our anticipated future crude oil production is also dependent on our ability to increase the production volumes of CO 2 and inject adequate amounts of CO 2 into the proper formation and area within each oil field. The production of crude oil from tertiary operations is highly dependent on the timing, volumes and location of the CO 2 injections. If our crude oil production were to decline, it could have a material adverse effect on our financial condition, results of operations and cash flows.
Oil and natural gas prices are volatile. A substantial decrease in oil and natural gas prices could adversely affect our financial results.
Our future financial condition, results of operations and the carrying value of our oil and natural gas properties depend primarily upon the prices we receive for our oil and natural gas production. Oil and natural gas prices historically have been volatile, have been particularly volatile over the last six months, and likely will continue to be volatile in the future, especially given current world geopolitical conditions. As a result of the low oil and natural gas prices at December 31, 2008, we recorded a $226.0 million full cost ceiling test write-down. Subsequent to December 31, 2008, oil and natural gas prices have continued their volatility and are currently at levels lower than at year-end 2008. If oil and natural gas prices remain at these lower levels through March 31, 2009, or subsequent periods, we may be required to record additional full cost ceiling test write-downs in the first quarter of 2009, or in subsequent periods. The amount of any future write-down is difficult to predict and will depend upon the oil and natural gas prices at the end of each period, the incremental proved reserves that might be added during each period and additional capital spent.
Our cash flow from operations is highly dependent on the prices that we receive for oil and natural gas. This price volatility also affects the amount of our cash flow available for capital expenditures and our ability to borrow money or raise additional capital. The amount we can borrow or have outstanding under our bank credit facility is subject to semi-annual redeterminations. Oil prices are likely to affect us more than natural gas prices because approximately 72% of our December 31, 2008 proved reserves are oil, with oil being an even larger percentage of our future potential reserves and projects due to our focus on tertiary operations. The prices for oil and natural gas are subject to a variety of additional factors that are beyond our control. These factors include:
22
Denbury Resources Inc.
• the level of consumer demand for oil and natural gas;
• the domestic and foreign supply of oil and natural gas;
• the ability of the members of the Organization of Petroleum Exporting Countries (“OPEC”) to agree to and maintain oil price and production controls;
• the price of foreign oil and natural gas;
• domestic governmental regulations and taxes;

Table of Contents
These factors and the volatility of the energy markets generally make it extremely difficult to predict future oil and natural gas price movements. Also, oil and natural gas prices do not necessarily move in tandem. Declines in oil and natural gas prices would not only reduce revenue, but could reduce the amount of oil and natural gas that we can produce economically and, as a result, could have a material adverse effect upon our financial condition, results of operations, oil and natural gas reserves and the carrying values of our oil and natural gas properties. If the oil and natural gas industry experiences significant price declines, we may, among other things, be unable to meet our financial obligations or make planned expenditures.
Since the end of 1998, oil prices have gone from near historic low prices to historic highs. At the end of 1998, NYMEX oil prices were at historic lows of approximately $12.00 per Bbl, but have generally increased since that time until mid-2008, albeit with fluctuations. For 2008, NYMEX oil prices increases throughout the first six months, averaging approximately $111.03 per Bbl for the first six months of 2008. During the last half of 2008, oil prices declined substantially, ending the year at a NYMEX price of $44.60 per Bbl. Since we have acquired oil commodity derivative contracts with a NYMEX floor price of $75 per barrel covering approximately 80% of our 2009 forecasted oil production, we are relatively insensitive to lower oil prices during 2009. We currently do not have any oil or natural gas commodity derivative contracts in place for subsequent years, and therefore oil prices could decline to a level that makes our tertiary projects uneconomic. If that were to happen, we may decide to suspend future expansion projects and if prices were to drop below the cash break- even point for an extended period of time, we may decide to shut-in existing production, either of which would have a material adverse effect on our operations. Since our operating costs have not decreased as quickly as commodity prices, it is difficult to determine a precise break-even point for our tertiary projects. Based on prior history, we estimate that our economic break-even point for these types of projects would approximate per barrel dollar costs in the range of the mid-twenties, and our operating cash break-even point would be between $15 and $20 of cost per barrel if commodity prices remain at current levels for sustained periods.
The prices we receive for our crude oil do not always correlate with NYMEX prices. Our NYMEX differentials over the last few years have ranged from a low of approximately $1.50 per Bbl to a high of almost $10.00 per Bbl. These variances have been due to various factors and are difficult to forecast or anticipate but have a direct impact on the net oil price we receive.
Natural gas prices have also experienced volatility during the last few years. During 1999, natural gas prices averaged approximately $2.35 per Mcf and, like crude oil, have generally trended upward since that time, although with significant fluctuations along the way. NYMEX natural gas prices averaged $6.97 per MMBtu during 2006, $7.09 per MMBtu during 2007, and $8.89 per MMBtu during 2008, and ended 2008 at $5.62 per MMBtu.
The current financial crisis may have effects on our liquidity, business and financial condition that we cannot predict.
Liquidity is essential to our business. Our liquidity could be substantially negatively affected by an inability to raise funding in the long-term or short-term debt capital markets or equity capital markets or an inability to access bank financing. The continued credit crisis and related turmoil in the global financial system is likely to continue to materially affect our liquidity, business and our financial condition. Our ability to access the capital markets has been restricted as a result of this crisis and may be restricted in the future when we would like, or need, to raise capital. The economic situation could also adversely affect the collectability of our trade receivables or performance by our suppliers and cause our commodity hedging arrangements to be ineffective if our counterparties are unable to perform their obligations or seek bankruptcy protection. Additionally, the current economic situation could lead to reduced demand for oil and gas, or lower prices for oil and gas, or both, which could have a negative impact on our revenues.
23
Denbury Resources Inc.
• the price and availability of alternative fuel sources;
• weather conditions, including hurricanes and tropical storms in and around the Gulf of Mexico;
• market uncertainty;
• political conditions in oil and natural gas producing regions, including the Middle East; and
• worldwide economic conditions.

Table of Contents
Our level of indebtedness may adversely affect operations and limit our growth.
As of February 27, 2009, we had outstanding $525 million (principal amount) of 7.5% subordinated notes, $420 million (principal amount) of 9.75% Senior Subordinated Notes, and $60 million of bank debt. At that time, we had approximately $690 million available on our bank credit line. We currently have a bank borrowing base of $1.0 billion, with a commitment amount of $750 million. The borrowing base represents the amount that can be borrowed from a credit standpoint, while the commitment amount is the amount the banks have committed to fund pursuant to the terms of the credit agreement. The next semi-annual redetermination of the borrowing base for our bank credit facility will be on April 1, 2009. Our bank borrowing base is adjusted at the banks’ discretion and is based in part upon external factors, such as commodity prices, over which we have no control. If our then redetermined borrowing base is less than our outstanding borrowings under the facility, we will be required to repay the deficit over a period of six months.
We may incur additional indebtedness in the future under our bank credit facility in connection with our acquisition, development, exploitation and exploration of oil and natural gas producing properties as our projected 2009 capital expenditures, excluding acquisitions, are between $200 million and $300 million higher than our projected 2009 cash flow from operations. Further, our cash flow from operations is highly dependent on the prices that we receive for oil and natural gas, which in the latter part of 2008, declined significantly. If oil and natural gas prices remain depressed for an extended period of time, our degree of leverage could increase substantially. The level of our indebtedness could have important consequences, including but not limited to the following:
If we are unable to generate sufficient cash flow or otherwise obtain funds necessary to make required payments on our indebtedness or if we otherwise fail to comply with the various covenants in such indebtedness, including covenants in our bank credit facility, we would be in default. This default would permit the holders of such indebtedness to accelerate the maturity of such indebtedness and could cause defaults under other indebtedness, including the subordinated notes, or result in our bankruptcy. Our ability to meet our obligations will depend upon our future performance, which will be subject to prevailing economic conditions and to financial, business and other factors, including factors beyond our control.
24
Denbury Resources Inc.
• a substantial portion of our cash flows from operations may be dedicated to servicing our indebtedness and would not be available for other purposes;
• as a result of the discretionary nature of the setting of our bank borrowing base and its being highly dependent on current commodity prices, if commodity prices were to further decrease, our banks could reduce our borrowing base so that we could not borrow additional funds or to a level below our outstanding debt that would require us to repay any deficit (between the borrowing base and the outstanding bank debt) over a six month period;
• our business may not generate sufficient cash flow from operations to enable us to continue to meet our obligations under our indebtedness;
• our level of indebtedness may impair our ability to obtain additional financing in the future for working capital, capital expenditures, acquisitions or general corporate and other purposes;
• our interest expense may increase in the event of increases in interest rates, because certain of our borrowings are at variable rates of interest;
• our vulnerability to general adverse economic and industry conditions may be greater as a result of our level of indebtedness, potentially restricting us from making acquisitions, introducing new technologies or exploiting business opportunities;
• our ability to borrow additional funds, dispose of assets, pay dividends and make certain investments may be limited by the covenants contained in the agreements governing our outstanding indebtedness limit; and
• our debt covenants may also affect our flexibility in planning for, and reacting to, changes in the economy and in our industry. Our failure to comply with such covenants could result in an event of default under such debt instruments which, if not cured or waived, could have a material adverse effect on us.

Table of Contents
Product price derivative contracts may expose us to potential financial loss.
To reduce our exposure to fluctuations in the prices of oil and natural gas, we currently and may in the future enter into derivative contracts in order to economically hedge a portion of our oil and natural gas production. Derivative contracts expose us to risk of financial loss in some circumstances, including when:
In addition, these derivative contracts may limit the benefit we would receive from increases in the prices for oil and natural gas. Information as to these activities is set forth under “Management’s Discussion and Analysis of Financial Condition and Results of Operations — Market Risk Management,” and in Note 10, “Derivative Instruments and Hedging Activities,” to the Consolidated Financial Statements.
Our future performance depends upon our ability to find or acquire additional oil and natural gas reserves that are economically recoverable.
Unless we can successfully replace the reserves that we produce, our reserves will decline, resulting eventually in a decrease in oil and natural gas production and lower revenues and cash flows from operations. We have historically replaced reserves through both drilling and acquisitions. In the future, we may not be able to continue to replace reserves at acceptable costs. The business of exploring for, developing or acquiring reserves is capital intensive. We may not be able to make the necessary capital investment to maintain or expand our oil and natural gas reserves if our cash flows from operations are reduced, due to lower oil or natural gas prices or otherwise, or if external sources of capital become limited or unavailable. Further, the process of using CO 2 for tertiary recovery and the related infrastructure requires significant capital investment, often one to two years prior to any resulting production and cash flows from these projects, heightening potential capital constraints. If we do not continue to make significant capital expenditures, or if outside capital resources become limited, we may not be able to maintain our growth rate or meet expectations. In addition, certain of our drilling activities are subject to numerous risks, including the risk that no commercially productive oil or natural gas reserves will be encountered. Exploratory drilling involves more risk than development drilling because exploratory drilling is designed to test formations for which proved reserves have not been discovered.
In January 2006, we purchased three oil fields for $250 million that we believe have significant potential oil reserves that can be recovered through the use of tertiary flooding: Tinsley Field approximately 40 miles northwest of Jackson, Mississippi; Citronelle Field in Southwest Alabama, and the smaller South Cypress Creek Field near our Eucutta Field in Eastern Mississippi. These three fields produced approximately 3,926 BOE/d net to the acquired interests during the fourth quarter of 2008, and have proved reserves of approximately 42.8 MMBOEs as of December 31, 2008. During 2008, we recognized approximately 34.8 MMBOE of proven tertiary reserves at Tinsley Field, but have yet to recognize any tertiary oil reserves at Citronelle or South Cypress Creek Fields. In February 2009, we closed on the acquisition of Hastings field located near Houston, Texas. Hastings is also a potential tertiary oil field and it will be supplied CO 2 by the Green Pipeline, which is currently under construction. The purchase price, including option payments, was approximately $250 million. We purchased these fields because we believe that they have significant additional potential through tertiary flooding and we paid a premium price for these properties based on that assumption. In addition to these specific acquisitions, we have, and plan to continue, acquiring other old oil fields that we believe are tertiary flood candidates, likely at a premium price. We are investing significant amounts of capital as part of this strategy. If we are unable to successfully develop the potential oil in these acquired fields, it would negatively affect the return on our investment on these acquisitions and could severely reduce our ability to obtain additional capital for the future, fund future acquisitions, and negatively affect our financial results to a significant degree.
We face competition from other oil and natural gas companies in all aspects of our business, including acquisition of producing properties and oil and gas leases. Many of our competitors have substantially larger financial and other resources. Other factors that affect our ability to acquire producing properties include available
25
Denbury Resources Inc.
• production is less than expected;
• the counter-party to the derivative contract defaults on its contract obligations; or
• there is a change in the expected differential between the underlying price in the hedging agreement and actual prices received.
Table of Contents
funds, available information about prospective properties and our standards established for minimum projected return on investment.
Oil and natural gas drilling and producing operations involve various risks.
Drilling activities are subject to many risks, including the risk that no commercially productive reservoirs will be discovered. There can be no assurance that new wells drilled by us will be productive or that we will recover all or any portion of our investment in such wells. Drilling for oil and natural gas may involve unprofitable efforts, not only from dry wells but also from wells that are productive but do not produce sufficient net reserves to return a profit after deducting drilling, operating and other costs. The seismic data and other technologies used by us do not provide conclusive knowledge, prior to drilling a well, that oil or natural gas is present or may be produced economically. The cost of drilling, completing and operating a well is often uncertain, and cost factors can adversely affect the economics of a project. Further, our drilling operations may be curtailed, delayed or canceled as a result of numerous factors, including:
Our operations are subject to all the risks normally incident to the operation and development of oil and natural gas properties and the drilling of oil and natural gas wells, including encountering well blowouts, cratering and explosions, pipe failure, fires, formations with abnormal pressures, uncontrollable flows of oil, natural gas, brine or well fluids, release of contaminants into the environment and other environmental hazards and risks.
The nature of these risks is such that some liabilities could exceed our insurance policy limits, or, as in the case of environmental fines and penalties, cannot be insured. We could incur significant costs, related to these risks that could have a material adverse effect on our results of operations, financial condition and cash flows.
Our CO 2 tertiary recovery projects require a significant amount of electricity to operate the facilities. If these costs were to increase significantly, it could have an adverse effect upon the profitability of these operations.
We depend on our key personnel.
We believe our continued success depends on the collective abilities and efforts of our senior management. The loss of one or more key personnel could have a material adverse effect on our results of operations. We do not have any employment agreements and do not maintain any key man life insurance policies. Additionally, if we are unable to find, hire and retain needed key personnel in the future, our results of operations could be materially and adversely affected.
Shortages of oil field equipment, services and qualified personnel could reduce our cash flow and adversely affect results of operations.
The demand for qualified and experienced field personnel to drill wells and conduct field operations, geologists, geophysicists, engineers and other professionals in the oil and natural gas industry can fluctuate significantly, often in correlation with oil and natural gas prices, causing periodic shortages. Due to the recent record high oil and gas prices, we have experienced shortages of equipment used in our tertiary facilities, drilling rigs and other equipment, as demand for rigs and equipment has increased along with higher commodity prices. Higher oil and natural gas prices generally stimulate increased demand and result in increased prices for drilling rigs, crews and associated supplies, oilfield equipment and services and personnel in our exploration and production
26
Denbury Resources Inc.
• unexpected drilling conditions;
• title problems;
• pressure or irregularities in formations;
• equipment failures or accidents;
• adverse weather conditions, including hurricanes and tropical storms in and around the Gulf of Mexico that can damage oil and natural gas facilities and delivering systems and disrupt operations;
• compliance with environmental and other governmental requirements; and
• cost of, or shortages or delays in the availability of, drilling rigs, equipment and services.

Table of Contents
operations. These types of shortages or price increases could significantly decrease our profit margin, cash flow and operating results and/or restrict or delay our ability to drill those wells and conduct those operations that we currently have planned and budgeted, causing us to miss our forecasts and projections.
The loss of more than one of our large oil and natural gas purchasers could have a material adverse effect on our operations.
For the year ended December 31, 2008, three purchasers each accounted for more than 10% of our oil and natural gas revenues and in the aggregate, for 83% of these revenues. We would not expect the loss of any single purchaser to have a material adverse effect upon our operations. However, the loss of a large single purchaser could potentially reduce the competition for our oil and natural gas production, which in turn could negatively impact the prices we receive.
Estimating our reserves, production and future net cash flows is difficult to do with any certainty.
Estimating quantities of proved oil and natural gas reserves is a complex process. It requires interpretations of available technical data and various assumptions, including assumptions relating to economic factors, such as future commodity prices, production costs, severance and excise taxes, capital expenditures and workover and remedial costs, and the assumed effect of governmental regulation. There are numerous uncertainties about when a property may have proved reserves as compared to potential or probable reserves, particularly relating to our tertiary recovery operations. Forecasting the amount of oil reserves recoverable from tertiary operations and the production rates anticipated therefrom requires estimates, one of the most significant being the oil recovery factor. Actual results most likely will vary from our estimates. Also, the use of a 10% discount factor for reporting purposes, as prescribed by the SEC, may not necessarily represent the most appropriate discount factor, given actual interest rates and risks to which our business or the oil and natural gas industry in general are subject. Any significant inaccuracies in these interpretations or assumptions or changes of conditions could result in a reduction of the quantities and net present value of our reserves.
Quantities of proved reserves are estimated based on economic conditions, including oil and natural gas prices in existence at the date of assessment. Our reserves and future cash flows may be subject to revisions based upon changes in economic conditions, including oil and natural gas prices, as well as due to production results, results of future development, operating and development costs and other factors. Downward revisions of our reserves could have an adverse effect on our financial condition, operating results and cash flows.
The reserve data included in documents incorporated by reference represent only estimates. In accordance with requirements of the SEC, the estimates of present values are based on prices and costs as of the date of the estimates. Actual future prices and costs may be materially higher or lower than the prices and cost as of the date of the estimate.
As of December 31, 2008, approximately 42% of our estimated proved reserves were undeveloped. Recovery of undeveloped reserves requires significant capital expenditures and may require successful drilling operations. The reserve data assumes that we can and will make these expenditures and conduct these operations successfully, but these assumptions may not be accurate, and this may not occur.
We are subject to complex federal, state and local laws and regulations, including environmental laws, which could adversely affect our business.
Exploration for and development, exploitation, production and sale of oil and natural gas in the United States are subject to extensive federal, state and local laws and regulations, including complex tax laws and environmental laws and regulations. Existing laws or regulations, as currently interpreted or reinterpreted in the future, or future laws, regulations or incremental taxes and fees, could harm our business, results of operations and financial condition. We may be required to make large expenditures to comply with environmental and other governmental regulations.
It is possible that new taxes on our industry could be implemented and/or tax benefits could be eliminated or reduced, reducing our profitability and available cash flow. In addition to the short-term negative impact on our financial results, such additional burdens, if enacted, would reduce our funds available for reinvestment and thus ultimately reduce our growth and future oil and natural gas production.
27
Denbury Resources Inc.

Table of Contents
Matters subject to regulation include oil and gas production and saltwater disposal operations and our processing, handling and disposal of hazardous materials, such as hydrocarbons and naturally occurring radioactive materials, discharge permits for drilling operations, spacing of wells, environmental protection and taxation. We could incur significant costs as a result of violations of or liabilities under environmental or other laws, including third-party claims for personal injuries and property damage, reclamation costs, remediation and clean-up costs resulting from oil spills and discharges of hazardous materials, fines and sanctions, and other environmental damages.
Item 1B. Unresolved Staff Comments
None.
Item 2. Properties
See Item 1. “Business — Oil and Gas Operations.” We also have various operating leases for rental of office space, office and field equipment, and vehicles. See “Off-Balance Sheet Agreements — Commitments and Obligations” in “Management’s Discussion and Analysis of Financial Condition and Results of Operations”, and Note 11, “Commitments and Contingencies,” to the Consolidated Financial Statements for the future minimum rental payments. Such information is incorporated herein by reference.
Item 3. Legal Proceedings
We are involved in various lawsuits, claims and regulatory proceedings incidental to our businesses. While we currently believe that the ultimate outcome of these proceedings, individually and in the aggregate, will not have a material adverse effect on our financial position or overall trends in results of operations or cash flows, litigation is subject to inherent uncertainties. If an unfavorable ruling were to occur, there exists the possibility of a material adverse impact on our net income in the period in which the ruling occurs. We provide accruals for litigation and claims if we determine that we may have a range of legal exposure that would require accrual.
Item 4. Submission of Matters to a Vote of Security Holders
None.
28
Denbury Resources Inc.

Table of Contents
PART II
Item 5. Market for Registrant’s Common Equity, Related Stockholder Matters and Issuer Purchases of Equity Securities
Common Stock Trading Summary
The following table summarizes the high and low reported sales prices on days in which there were trades of Denbury’s common stock on the New York Stock Exchange (“NYSE”), for each quarterly period for the last two fiscal years. The sale prices are adjusted to reflect the 2-for-1 stock split on December 5, 2007. As of February 23, 2009, based on information from the Company’s transfer agent, American Stock Transfer and Trust Company, the number of holders of record of Denbury’s common stock was 1,066. On February 25, 2009, the last reported sale price of Denbury’s common stock, as reported on the NYSE, was $12.88 per share.
We have never paid any dividends on our common stock, and we currently do not anticipate paying any dividends in the foreseeable future. Also, we are restricted from declaring or paying any cash dividends on our common stock under our bank loan agreement. No unregistered securities were sold by the Company during 2008.
Purchases of Equity Securities by the Issuer and Affiliated Purchasers
There shares were purchased from employees of Denbury who delivered shares to the company to satisfy their minimum tax withholding requirements related to the vesting of restricted shares.
29
Denbury Resources Inc.
2008 2007 High Low High Low First Quarter $ 33.640 $ 21.760 $ 15.310 $ 12.980 Second Quarter 40.320 27.280 19.380 14.835 Third Quarter 37.240 16.110 23.380 18.275 Fourth Quarter 18.860 5.590 30.560 22.405
(c) Total Number of (d) Maximum Number (a) Total Shares Purchased of Shares that May Number of (b) Average as Part of Publicly Yet Be Purchased Shares Price Paid Announced Plans or Under the Plan Or
Period Purchased per Share Programs Programs October 1 through 31, 2008 3,475 $ 15.44 — — November 1 through 30, 2008 398 $ 10.33 — — December 1 through 31, 2008 — $ — — — Total 3,873 $ 14.91 — —
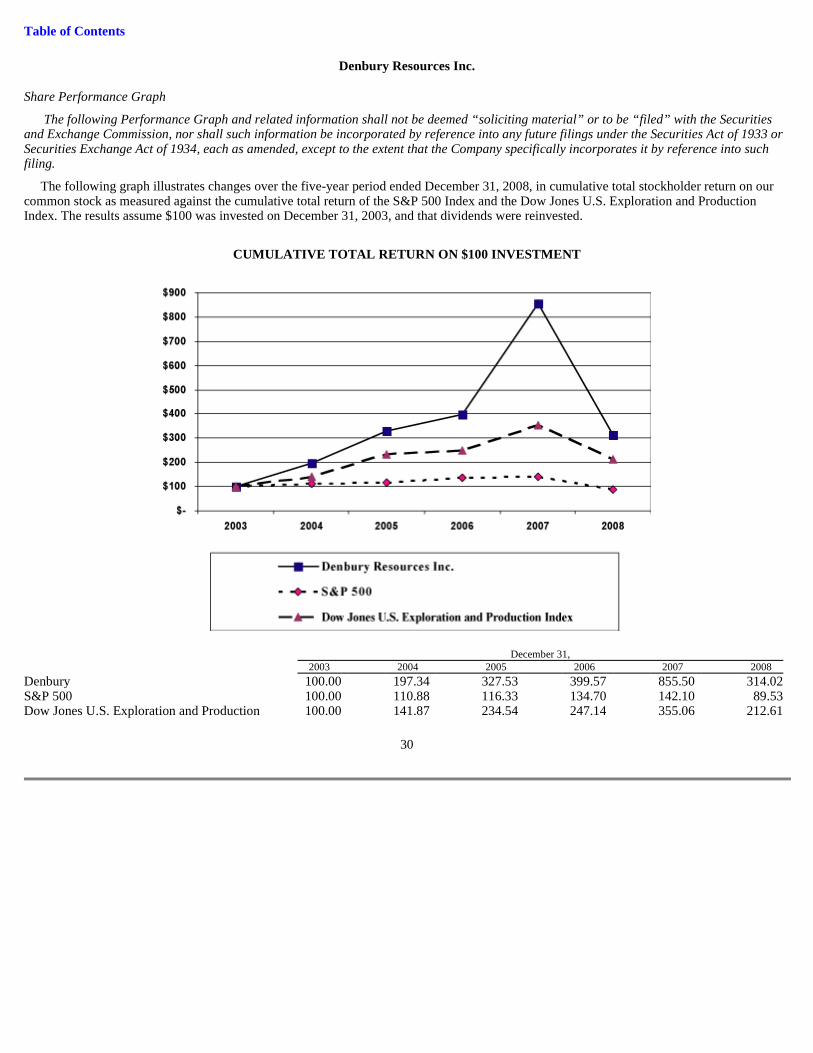
Table of Contents
Share Performance Graph
The following Performance Graph and related information shall not be deemed “soliciting material” or to be “filed” with the Securities and Exchange Commission, nor shall such information be incorporated by reference into any future filings under the Securities Act of 1933 or Securities Exchange Act of 1934, each as amended, except to the extent that the Company specifically incorporates it by reference into such filing.
The following graph illustrates changes over the five-year period ended December 31, 2008, in cumulative total stockholder return on our common stock as measured against the cumulative total return of the S&P 500 Index and the Dow Jones U.S. Exploration and Production Index. The results assume $100 was invested on December 31, 2003, and that dividends were reinvested.
CUMULATIVE TOTAL RETURN ON $100 INVESTMENT
30
Denbury Resources Inc.
December 31, 2003 2004 2005 2006 2007 2008 Denbury 100.00 197.34 327.53 399.57 855.50 314.02 S&P 500 100.00 110.88 116.33 134.70 142.10 89.53 Dow Jones U.S. Exploration and Production 100.00 141.87 234.54 247.14 355.06 212.61

Table of Contents
Item 6. Selected Financial Data
31
Denbury Resources Inc.
(In thousands, unless otherwise noted) Year Ended December 31, 2008 2007 2006 (1) 2005 2004 (2) Consolidated Statements of Operations Data: Revenues $ 1,365,702 $ 973,060 $ 731,536 $ 560,392 $ 382,972 Net income (3) 388,396 253,147 202,457 166,471 82,448 Net income per common share (4) :
Basic 1.59 1.05 0.87 0.74 0.38 Diluted 1.54 1.00 0.82 0.70 0.36
Weighted average number of common shares outstanding (4) : Basic 243,935 240,065 233,101 223,485 219,482 Diluted 252,530 252,101 247,547 239,267 229,206
Consolidated Statements of Cash Flow Data: Cash provided by (used by):
Operating activities $ 774,519 $ 570,214 $ 461,810 $ 360,960 $ 168,652 Investing activities (994,659 ) (762,513 ) (856,627 ) (383,687 ) (93,550 ) Financing activities 177,102 198,533 283,601 154,777 (66,251 )
Production (daily): Oil (Bbls) 31,436 27,925 22,936 20,013 19,247 Natural gas (Mcf) 89,442 97,141 83,075 58,696 82,224 BOE (6:1) 46,343 44,115 36,782 29,795 32,951
Unit Sales Price (excluding impact of derivative settlements): Oil (per Bbl) $ 92.73 $ 69.80 $ 59.87 $ 50.30 $ 36.46 Natural gas (per Mcf) 8.56 6.81 7.10 8.48 6.24
Unit Sales Price (including impact of derivative settlements): Oil (per Bbl) $ 90.04 $ 68.84 $ 59.23 $ 50.30 $ 27.36 Natural gas (per Mcf) 7.74 7.66 7.10 7.70 5.57
Costs per BOE: Lease operating expenses $ 18.13 $ 14.34 $ 12.46 $ 9.98 $ 7.22 Production taxes and marketing expenses 3.76 3.05 2.71 2.54 1.55 General and administrative 3.56 3.04 3.20 2.62 1.78 Depletion, depreciation and amortization 13.08 12.17 11.11 9.09 8.09
Proved Reserves: Oil (MBbls) 179,126 134,978 126,185 106,173 101,287 Natural gas (MMcf) 427,955 358,608 288,826 278,367 168,484 MBOE (6:1) 250,452 194,746 174,322 152,568 129,369 Carbon dioxide (MMcf) (5) 5,612,167 5,641,054 5,525,948 4,645,702 2,664,633
Consolidated Balance Sheet Data: Total assets $ 3,589,674 $ 2,771,077 $ 2,139,837 $ 1,505,069 $ 992,706 Total long-term liabilities 1,363,539 1,102,066 833,380 617,343 368,128 Stockholders’ equity (6) 1,840,068 1,404,378 1,106,059 733,662 541,672
(1) Effective January 1, 2006, we adopted Statement of Financial Accounting Standards No. 123(R), “Share Based Payment.”
(2) We sold Denbury Offshore, Inc. in July 2004.
(3) In 2008, we had a full cost ceiling test write-down of $226 million ($140.1 million net of tax) and pretax expense of $30.6 million associated with a cancelled acquisition. These charges were partially offset by pretax income of $200.1 million on our commodity derivative contracts.
(4) On December 5, 2007, and October 31, 2005, we split our common stock on a 2-for-1 basis. Information relating to all prior years’ shares and earnings per share has been retroactively restated to reflect the stock splits.
(5) Based on a gross working interests basis and includes reserves dedicated to volumetric production payments 153.8 Bcf at December 31, 2008, of 182.3 Bcf at December 31, 2007, 210.5 Bcf at December 31, 2006, 237.1 Bcf at December 31, 2005, and 178.7 Bcf at December 31, 2004. (See Note 15 to the Consolidated Financial Statements).
(6) We have never paid any dividends on our common stock.

Table of Contents
Denbury Resources Inc.
Item 7. Management’s Discussion and Analysis of Financial Condition and Results of Operations
The following discussion and analysis should be read in conjunction with our Consolidated Financial Statements and Notes thereto included in Item 8, “Financial Statements and Supplementary Data.” Our discussion and analysis includes forward looking information that involves risks and uncertainties and should be read in conjunction with “Risk Factors” under Item 1A of this report, along with “Forward Looking Information” at the end of this section for information on the risks and uncertainties that could cause our actual results to be materially different than our forward looking statements.
Overview
We are a growing independent oil and gas company engaged in acquisition, development and exploration activities in the U.S. Gulf Coast region. We are the largest oil and natural gas producer in Mississippi, own the largest reserves of carbon dioxide (“CO 2 ”) used for tertiary oil recovery east of the Mississippi River, and significant operating acreage in the Barnett Shale play near Fort Worth, Texas, and also hold properties in Southeast Texas. Our goal is to increase the value of acquired properties through a combination of exploitation, drilling, and proven engineering extraction processes, with our most significant emphasis relating to tertiary recovery operations. Our corporate headquarters are in Plano, Texas (a suburb of Dallas), and we have four primary field offices located in Laurel, Mississippi; McComb, Mississippi; Jackson, Mississippi; and Aledo, Texas.
Liquidity. During the last six months, we have taken several steps to improve our liquidity as a result of the deterioration in the capital markets and the decrease in oil and natural gas prices (see “Capital Resources and Liquidity”).
2008 Operating Highlights. Oil and natural gas prices were extremely volatile during 2008, with NYMEX oil prices setting a record high of approximately $145 per Bbl around mid-year, followed by a rapid drop during the second half of the year to below $40 per Bbl, a price level not seen since 2004, finishing the year at $44.60 per Bbl. Natural gas prices followed a similar trend in 2008, beginning the year at $7.48 per Mcf, increasing to approximately $13.60 per Mcf in mid-2008, and then ending 2008 at slightly under $6.00 per Mcf. See the charts below for further information on the fluctuations in oil and natural gas prices during 2008.
In spite of the commodity price volatility, our average revenue per BOE for the year was $79.42, approximately 34% higher than 2007’s average of $59.17 per BOE. These higher prices were a significant contributor to our record cash flow and earnings. Our 2008 cash flow from operations was $774.5 million, a 36% increase over our 2007 annual cash flow from operations of $570.2 million, and our 2008 net income of $388.4 million was 53% higher than our $253.1 million of net income during 2007. In addition to higher commodity prices during 2008, we had record high production levels, partially offset by higher operating costs and a $30.6 million charge related to the cancellation of the Conroe Field acquisition in early October (see also “Capital Resources and Liquidity” below). During 2008, we also had two significant non-cash operational items, (i) a net gain of $257.6 million ($159.7 million net of tax) associated with our fair value adjustments on our derivative contracts, the majority of which were related to the 2009 oil price collars acquired in October 2008, and (ii) a full cost ceiling write-down at December 31, 2008, of $226.0 million ($140.1 million net of tax) incurred because of the significant decrease in oil and natural gas prices during the latter part of 2008.
32

Table of Contents
Denbury Resources Inc. Management’s Discussion and Analysis of Financial Condition and Results of Operations
During 2008 our oil and natural gas production averaged 46,343 BOE/d, an 18% increase over our 2007 average production (after adjusting for the sale of our Louisiana natural gas properties in December 2007 and February 2008), with growth primarily from our tertiary oil operations and Barnett Shale, partially offset by modest declines in our East Mississippi non-tertiary production. Our average tertiary oil production increased to 19,377 BOE/d in 2008, a 31% increase over our 2007 tertiary oil production levels, and our average Barnett Shale production increased to 12,699 BOE/d, a 33% increase year-over-year. (See “Results of Operations — Operating Results — Production” for more information). Our oil and natural gas revenues increased 41% in 2008, with 5% of the increase associated with the higher production levels and 36% of the increase due to higher oil and natural gas commodity prices.
Our operating costs have gradually increased over the last few years along with commodity prices; the cost inflation caused by a corresponding increase in the demand for goods and services in our business as a result of commodity price escalation. While we recognized some cost savings during the last quarter of 2008 following the sharp decline in commodity prices during the second half of the year, operating costs have not decreased at the same rate as commodity prices. Therefore on average, virtually all of our expenses increased on both an absolute and per BOE basis during 2008. This continued a trend that we have experienced over the last several years as our costs have been increasing, due to (i) higher overall industry costs, (ii) a higher percentage of operations related to tertiary operations (which have higher operating costs per BOE), and (iii) higher compensation expense resulting from additional employees and increased salaries, which we consider necessary in order to remain competitive in the industry. We expect to see further cost reductions in 2009, as we believe that lower spending levels in the industry will reduce demand for goods and services and eventually lower costs, but it is uncertain how quickly costs will come down and by how much.
We invested approximately $1.1 billion in capital projects and minor acquisitions during 2008, of which approximately $462.9 million was spent on CO 2 pipelines, facilities and drilling. During 2008 our proved oil and natural gas reserves increased from 194.7 MMBOE as of December 31, 2007 to 250.5 MMBOE at December 31, 2008, replacing approximately 525% of our 2008 production, almost entirely from organic growth. The most significant reserve additions during 2008 were approximately 63.4 MMBbls added in our tertiary oil operations, primarily associated with the booking of proved tertiary reserves at Tinsley, Heidelberg and Lockhart Crossing Fields, and 19.5 MMBOE added in our Barnett Shale operations.
Genesis Transactions. On May 30, 2008, we closed two transactions with Genesis Energy, L.P. (“Genesis”) involving our Northeast Jackson Dome (“NEJD”) and Free State CO 2 Pipelines, which included a long-term transportation service arrangement for the Free State Pipeline and a 20-year financing lease for the NEJD system. We received from Genesis $225 million in cash and $25 million of Genesis common units (1,199,041 units at an average price of $20.85 per unit). These transactions were treated as financing leases for accounting purposes, with the assets and liabilities recorded on our balance sheet. We currently project that we will initially pay Genesis approximately $30 million per annum under the financing lease and transportation services agreement, with future payments for the NEJD pipeline fixed at $20.7 million per year during the term of the financing lease, and the payments relating to the Free State Pipeline dependent on the volumes of CO 2 transported therein, with a minimum annual payment thereon of $1.2 million.
Change in Tax Accounting Method for Certain Tertiary Costs. During the third quarter of 2008, we obtained approval from the Internal Revenue Service (“IRS”) to change our method of tax accounting for certain assets used in our tertiary oilfield recovery operations. Previously, we had capitalized and depreciated these costs, but now we can deduct these costs once the assets are placed into service. As a result, we expect to receive tax refunds of approximately $10.6 million for tax years through 2007, along with other tax benefits, and we have reduced our current income tax expense and increased our deferred income tax expense in 2008 to adjust for the impact of this change. This change is not expected to have a significant impact on our overall tax rate; however, it will allow for a quicker deduction of costs for tax purposes.
This change in tax treatment impacts the overall economics of certain financing-type transactions we have historically utilized, primarily equipment lease financing and certain transactions with Genesis. Following the favorable ruling, we initially discontinued our leasing program and pipeline financings with Genesis, but with the recent downturn in commodity prices, we anticipate that our cash income taxes for 2009 will be minimal, minimizing the effect of this change in tax accounting. With lower projected cash income taxes expected for the near future, and given the generally advantageous interest rate inherent in equipment lease transactions, and their being an alternative source of liquidity, we plan to resume our equipment leasing program in 2009 and budgeted
33

Table of Contents
Denbury Resources Inc. Management’s Discussion and Analysis of Financial Condition and Results of Operations
$100 million of leasing in 2009, but if possible, we would like to lease as much as $150 million. Because of the uncertainties that exist in the capital markets, we cannot be certain of the dollar amount, pricing or availability of such equipment financing leases.
The economic impact of our acceleration of tax deductions will also affect how we view future asset transactions with Genesis. Transactions which are not sales for tax purposes, such as the $175 million financing lease on the NEJD CO 2 Pipeline (see “Overview — Genesis Transactions” above) would not be affected provided that they meet other necessary tax criteria. Those transactions which constitute a sale for tax purposes, such as the $75 million sale and associated long-term transportation service agreement entered into with Genesis on our Free State CO 2 Pipeline (see “Overview — Genesis Transactions” above), will be less advantageous from a tax perspective.
Sale of Louisiana Natural Gas Assets. In February 2008, we received the $48.9 million remaining portion (30%) of the proceeds from the sale of our Louisiana natural gas assets, the prior 70% of which closed in December 2007. Production attributable to the sold properties averaged 302 BOE/d (approximately 81% natural gas) during the first quarter of 2008, representing production prior to the closing date for the portion of the sale that closed in February.
Recent 2009 Transactions
Purchase of Hastings Field. On February 2, 2009, we closed the $201 million acquisition of the Hastings Field, which is located near Houston, Texas, and is a potential tertiary oil field to be supplied by the Green CO 2 Pipeline which has commenced construction. In August 2008, we exercised our option with a subsidiary of Venoco, Inc. (“Venoco”) to purchase Hastings Field, and in consideration of our exercising the option in 2008 rather than 2009, Venoco agreed to extend the deadlines for capital expenditures, commencement of CO 2
injections and certain other contractual requirements by one year.
Management Succession Plan. On February 5, 2009, our Board of Directors adopted a management succession plan under which our current executive officers will assume new roles on or about June 30, 2009. Gareth Roberts, the Company’s founder, will relinquish his position as President and CEO and become Co-Chairman of the Board of Directors and will assume a non-officer role as the Company’s Chief Strategist. Phil Rykhoek, currently Senior Vice President and Chief Financial Officer, will become CEO; Tracy Evans, currently Senior Vice President — Reservoir Engineering, will become President and Chief Operating Officer; and Mark Allen, currently Vice President and Chief Accounting Officer, will become Senior Vice President and Chief Financial Officer.
Subordinated Debt Issuance. On February 13, 2009, we issued $420 million of 9.75% Senior Subordinated Notes due 2016 (the “Notes”). The Notes were sold to the public at 92.816% of par, plus accrued interest from February 13, 2009, which equates to an effective yield to maturity of approximately 11.25% (before offering expenses). Interest on the Notes will be paid on March 1 and September 1 of each year, beginning September 1, 2009. The Notes will mature on March 1, 2016. We used the net proceeds from the offering of approximately $381 million to repay most of the then outstanding debt on our bank credit facility.
Capital Resources and Liquidity
During the last six months, we have taken several steps to improve our liquidity as a result of the deterioration in the capital markets and the decrease in oil and natural gas commodity prices. These included a $400 million increase to our bank commitment amount (see “Increased Bank Credit Line” below for more details), cancellation of the $600 million acquisition of Conroe Field, purchase of oil derivative contracts covering approximately 80% of our currently estimated 2009 oil production, and reduction of our capital budget for 2009. Also, in February 2009, we issued $420 million of Senior Subordinated Notes (see “Overview — Recent 2009 Transactions — Subordinated Debt Issuance”).
Prior to the decline in economic conditions, we had intended, in a tax free exchange, to exchange the Barnett Shale properties for the Conroe and Hastings Fields, both of which are future tertiary flood candidates located near Houston, Texas. However, because of the deterioration in capital market conditions, we believed that the sale of our Barnett Shale properties at a price that we would consider reasonable was doubtful, and without the certainty of a Barnett Shale property sale, we did not feel comfortable increasing our leverage. As such, we cancelled our $600 million contract to purchase Conroe Field, forfeiting a $30 million non-refundable deposit which we expensed in the third quarter. To further protect our liquidity in the event that commodity prices continued to decline, in October
34

Table of Contents
Denbury Resources Inc. Management’s Discussion and Analysis of Financial Condition and Results of Operations
2008 we purchased oil derivative contracts for 2009 with a floor price of $75 / Bbl and a ceiling price of $115 / Bbl for total consideration of $15.5 million. The collars cover 30,000 Bbls/d representing approximately 80% of our currently anticipated 2009 oil production. See “Oil and Natural Gas Derivative Contracts” below in this section for information regarding the counterparties for these collars. We further significantly increased our liquidity in February 2009 by issuing $420 million of subordinated debt. We used net proceeds from that offering ($381 million) to repay most of our then outstanding bank debt, freeing-up most of our bank credit line for future capital needs, as our total bank commitment amount of $750 million was not reduced because of the offering.
We currently estimate that our 2009 total capital spending will be approximately $750 million, plus the already closed Hastings acquisition of $201 million. Our current 2009 capital budget includes approximately $485 million relating to our CO 2 pipelines, the majority of which is to build the Green CO 2 Pipeline. The budget also assumes that we fund approximately $100 million of budgeted equipment purchases with operating leases, a practice we had discontinued in the last half of 2008 as a result of our favorable tax ruling (see “Overview — Change in Tax Accounting Method for Certain Tertiary Costs”). Use of these operating leases is dependent upon being able to secure acceptable financing and as of February 27, 2009, we had not yet secured most of this financing. The 2009 budget incorporates significantly reduced spending in the Barnett Shale and in other conventional areas such as the Heidelberg Selma Chalk, and a slower development program for our tertiary operations. Based on our current cash flow projections, using $50.00 per barrel for oil and $5.00 per Mcf for natural gas prices and including our expected oil derivative contract settlements, we anticipate that our capital expenditures could exceed projected cash flow by $400 million to $500 million, including the Hastings acquisition.
We anticipate funding this shortfall during 2009 with the proceeds from our February 2009 subordinated debt issuance and our bank credit line, and expect to have a total bank debt balance by the end of 2009 of $150 million to $250 million, leaving us $500 million to $600 million of availability on our $750 million bank commitment amount. We anticipate that this credit line will be sufficient to fund our 2009 plans and do not expect our bank credit line to be reduced by our banks unless commodity prices were to further decrease significantly from current levels. We may raise additional capital during 2009 if it is possible to do so in a reasonably economic manner. Such additional capital sources could include the sale or joint venture of assets, a volumetric production payment, additional operating leases, or other options that become available during the year. We will also continually monitor our capital expenditures on a regular basis, adjusting them up or down depending on commodity prices and the resultant cash flow. Therefore, should our cash flow be less than expected, we would plan to reduce our capital expenditures to the extent possible during the year, which could in turn, have the impact of reducing our anticipated production levels in future years. For 2009, we have contracted for certain capital expenditures, including construction of most of the Green Pipeline already in progress and two drilling rigs, and therefore the portion of capital that we could eliminate without significant penalty is limited (see also “Off-Balance Sheet Arrangements — Commitments and Obligations”).
Based on our long-term models, we expect our future capital spending needs to be less in the future than they have been in recent years, excluding any potential acquisitions. Therefore, if commodity prices remain at current levels after 2009, we anticipate that we will be able to match our capital spending with our projected cash flow from operations and preserve our liquidity to the extent that we deem necessary, although any such spending reductions would most likely lower our anticipated rate of production growth.
Increased Bank Credit Line. In early October 2008, we amended our bank credit facility, which increased the banks’ commitment amount from $350 million to $750 million, maintained our borrowing base at $1.0 billion, modified the commitment fees and pricing grid for the loan, raising the pricing grid by 25 basis points, and provided for other transactions, such as the acquisition of Conroe Field, which were not consummated. The borrowing base represents the amount that can be borrowed from a credit standpoint while the commitment amount is the amount the banks have committed to fund pursuant to the terms of the credit agreement. We further amended our bank credit facility in February 2009 to allow us to issue the subordinated debt at an interest rate higher than the previously allowed 10% (see “Overview — Recent 2009 Transactions — Subordinated Debt Issuance”).
While bank borrowing bases in our industry are likely to be reduced in the future to reflect the reduction in commodity prices, with $250 million of cushion between our borrowing base and commitment amount and the incremental value added by retaining our Barnett Shale properties, currently we do not expect our bank commitment level to be reduced below $750 million unless prices were to further decrease significantly from current strip prices of approximately $45.00 per barrel for oil and $5.00 per Mcf for natural gas. As of February 27, 2009, we had
35

Table of Contents
Denbury Resources Inc. Management’s Discussion and Analysis of Financial Condition and Results of Operations
outstanding $525 million (principal amount) of 7.5% subordinated notes, $420 million (principal amount) of 9.75% Senior Subordinated Notes and $60 million of bank debt.
Although we remain interested in acquiring mature oil fields that we believe have potential as future tertiary flood candidates, with the general lack of liquidity in the capital markets, our ability to fund any significant acquisitions will be limited and are not likely to be material unless we are able to obtain additional capital.
Sources and Uses of Capital Resources
Our 2008 capital expenditures were funded with $774.5 million of cash flow from operations, $225 million from the drop-down of CO 2
pipelines to Genesis, and $51.7 million from property sales proceeds.
Our 2007 capital expenditures were funded with $570.2 million of cash flow from operations, $150.0 million from the April 2007 issuance of subordinated debt, $135.8 million from property sales proceeds, and $16.0 million of net bank borrowings.
Our 2006 expenditures were funded with $461.8 million of cash flow from operations, $139.8 million of equity issued, $134.0 million of net bank borrowings, and a $13.2 million increase in our accrued capital expenditures, with the balance funded with working capital, predominately cash from the December 2005 issuance of $150 million of subordinated debt.
Off-Balance Sheet Arrangements
Commitments and Obligations
At December 31, 2008, our dollar denominated payment obligations that are not on our balance sheet include our operating leases, which at year-end 2008 totaled $128.6 million (including $104.5 million of equipment costs) relating primarily to the lease financing of certain equipment for CO 2 recycling facilities at our tertiary oil fields. We also have several leases relating to office space and other minor equipment leases. At December 31, 2008, we had a total of $10.5 million of letters of credit outstanding under our bank credit agreement. Additionally, we have dollar denominated obligations that are not currently recorded on our balance sheet relating to various obligations for development and exploratory expenditures that arise from our normal capital expenditure program or from other transactions common to our industry. In addition, in order to recover our undeveloped proved reserves, we must also fund the associated future development costs forecasted in our proved reserve reports. For a further discussion of our future development costs and proved reserves, see “Results of Operations — Depletion, Depreciation and Amortization” below.
Genesis Energy, LLC, our subsidiary that is the general partner of Genesis (a limited partnership), could under certain circumstances become liable, in its capacity as general partner, for debts and obligations of Genesis. There were no guarantees by Denbury or any of its other subsidiaries of the debt of Genesis or of Genesis Energy, LLC at December 31, 2008.
36
Capital Expenditure Summary Year Ended December 31, Amounts in thousands 2008 2007 2006 Capital expenditures
Oil and gas exploration and development Drilling $ 244,841 $ 313,258 $ 245,350 Geological, geophysical and acreage 18,183 22,829 31,590 Facilities 170,263 118,003 98,890 Recompletions 140,451 141,264 120,438 Capitalized interest 17,627 18,305 11,059
Total oil and gas exploration and development expenditures 591,365 613,659 507,327 Oil and natural gas property acquisitions 31,367 49,077 319,000
Total oil and natural gas capital expenditures 622,732 662,736 826,327 CO 2 capital expenditures, including capitalized interest 462,889 171,182 63,586
Total $ 1,085,621 $ 833,918 $ 889,913

Table of Contents
Denbury Resources Inc. Management’s Discussion and Analysis of Financial Condition and Results of Operations
During the second quarter of 2008, we entered into transactions with Genesis relating to two of our CO 2 pipelines (see “Overview — Genesis Transactions” above). As a result of these two transactions, we currently project that we will initially pay Genesis approximately $30 million per annum under the financing lease and transportation services agreement (a pro-rated total of $15.4 million during 2008), with future payments for the NEJD pipeline fixed at $20.7 million per year during the term of the financing lease, and the payments relating to the Free State Pipeline dependent on the volumes of CO 2 transported therein, with a minimum annual payment thereon of $1.2 million.
We currently have long-term commitments to purchase CO 2 from four proposed gasification plants, two of which are in the Gulf Coast region and two in the Midwest region (Illinois / Kentucky area) of the United States. The Midwest plants are not only conditioned on those specific plants being constructed, but also upon Denbury contracting additional volumes of CO 2 for purchase in the general area of the proposed plants that would provide an acceptable economic return on the CO 2 pipeline that we would need to construct to transport these volumes to our existing CO 2 pipeline system. If all four plants are built, these CO 2 sources are currently anticipated to provide us with aggregate CO 2 volumes of around 1 Bcf/d. Due to the current economic conditions, the earliest we would expect any plant to be completed and provide CO 2 would be 2013, and there is some doubt as to whether they will be constructed at all. The base price of CO 2 per Mcf from these CO 2 sources varies by plant and location, but is generally higher than our most recent all-in cost of CO 2 from our natural sources (Jackson Dome) using current oil prices. Prices for CO 2 delivered from these projects are expected to be competitive with the cost of our natural CO 2
after adjusting for our share of potential carbon emissions reduction credits using estimated futures prices of carbon emissions reduction credits. If all four plants are built, the aggregate purchase obligation for this CO 2 would be around $135 million per year, assuming a $50 per barrel oil price, before any potential savings from our share of carbon emissions reduction credits. All of the contracts have price adjustments that fluctuate based on the price of oil. Construction has not yet commenced on any of these plants, and their construction is contingent on the satisfactory resolution of various issues, including financing. While it is likely that not every plant currently under contract will be constructed, there are several other plants under consideration that could provide CO 2 to us that would either supplement or replace the CO 2 volumes from the four proposed plants that we currently have contracts with. We are having ongoing discussions and negotiations with several of these other potential sources. We have not included any financial commitment attributable to the existing contracts or other potential sources in the commitment table below as all such payments are contingent on the plants being built.
A summary of our obligations at December 31, 2008, is presented in the following table:
37
Payments Due by Period Amounts in thousands Total 2009 2010 2011 2012 2013 Thereafter
Contractual Obligations: Subordinated debt (a) $ 525,000 $ — $ — $ — $ — $ 225,000 $ 300,000 Senior Bank Loan (a) 75,000 — — 75,000 — — — Estimated interest payments
on subordinated debt and Senior Bank Loan (a) 234,096 41,588 41,588 40,933 39,375 26,661 43,951
Pipeline financing lease obligations (b) 588,414 29,358 31,759 33,205 33,438 33,518 427,136
Operating lease obligations 128,606 17,938 17,351 16,571 15,199 12,510 49,037 Capital lease obligations (c) 9,219 2,120 1,882 1,882 1,242 700 1,393 Capital expenditure
obligations (d) 376,827 367,980 8,847 — — — — Other Cash Commitments:
Future development costs on proved oil and gas reserves, net of capital obligations (e) 890,262 97,048 312,069 188,275 115,605 61,921 115,344
Future development cost on proved CO 2 reserves, net of capital obligations (f) 116,792 18,792 — 22,000 — — 76,000
Asset retirement obligations (g) 106,413 2,154 1,321 1,288 722 1,013 99,915
Total $ 3,050,629 $ 576,978 $ 414,817 $ 379,154 $ 205,581 $ 361,323 $ 1,112,776
(a) These long-term borrowings and related interest payments are further discussed in Note 6 to the Consolidated Financial Statements. This table assumes that our long-term debt is held until maturity. On February 13, 2009 we issued $420 million of 9.75% Senior Subordinated Notes at a discount, 92.816% of par, for which the obligations related thereto are not included in the above table. See Note 14 to the Consolidated Financial Statements.

Table of Contents
Denbury Resources Inc. Management’s Discussion and Analysis of Financial Condition and Results of Operations
During February 2009, we closed our $201 million purchase of Hastings Field (see “Recent 2009 Transactions — Purchase of Hastings Field” above). Under the agreement, we are required to make aggregate net capital expenditures in this field of approximately $179 million over the next six years as follows (the following amounts representing cumulative amounts required by that date): $26.8 million by December 31, 2010, $71.5 million by December 31, 2011, $107.2 million by December 31, 2012, $142.9 million by December 31, 2013, and $178.7 million by December 31, 2014. If we fail to spend the required amounts by the due dates, we are required to make a cash payment equal to 10% of the cumulative shortfall at each applicable date. Further, we are committed to injecting at least an average of 50 MMcf/day of CO 2
(total of purchased and recycled) in the West Hastings Unit for the 90 day period prior to January 1, 2013. If such injections do not occur, we must either (1) relinquish our rights to initiate (or continue) tertiary operations and reassign to Venoco all assets previously purchased for the value of such assets at that time based upon the discounted value of the field’s proved reserves using a 20% discount rate, or (2) make an additional payment of $20 million in January 2013, less any payments made for failure to meet the capital spending requirements as of December 31, 2012, and a $30 million payment for each subsequent year (less amounts paid for capital expenditure shortfalls) until the CO 2
injection in the Hastings Field equals or exceeds the minimum required injection rate.
Long-term contracts require us to deliver CO 2 to our industrial CO 2 customers at various contracted prices, plus we have a CO 2 delivery obligation to Genesis pursuant to three volumetric production payments (“VPP”) entered into during 2003 through 2005. Based upon the maximum amounts deliverable as stated in the industrial contracts and the volumetric production payments, we estimate that we may be obligated to deliver up to 512 Bcf of CO 2 on a cumulative basis to these customers over the next 19 years; however, since the group as a whole has historically taken less CO 2 than the maximum allowed in their contracts, based on the current level of deliveries, we project that our commitment would likely be reduced to approximately 254 Bcf. The maximum volume required in any given year is approximately 136 MMcf/d, although based on our current level of deliveries this would likely be reduced to approximately 78 MMcf/d. Given the size of our proven CO 2 reserves at December 31, 2008 (approximately 5.6 Tcf before deducting approximately 153.8 Bcf for the three VPPs), our current production capabilities and our projected levels of CO 2 usage for our own tertiary flooding program, we believe that we will be able to meet these delivery obligations.
38
(b) Represents estimated future cash payments under a long-term transportation service agreement for the Free State Pipeline, and future minimum cash payments in a 20-year financing lease for the NEJD pipeline system. Both transactions with Genesis were entered into in 2008 and are being accounted for as financing leases. The payment required for the Free State Pipeline is variable based upon the amount of the CO 2 we ship through the pipeline and the commitment amounts disclosed above for that line are computed based upon our internal forecasts. Approximately $338.2 million of these payments represent interest. See Note 3 to Consolidated Financial Statements.
(c) Represents future minimum cash commitments of $5.9 million to Genesis under capital leases in place at December 31, 2008, primarily for transportation of crude oil and CO 2 , and $3.3 million for office space and rental equipment. Approximately $2.0 million of these payments represents interest.
(d) Represents future cash commitments under contracts in place as of December 31, 2008, primarily for pipe, pipeline construction contracts, drilling rig services and well related costs, including approximately $311.2 million for our Green CO 2 Pipeline. As is common in our industry, we commit to make certain expenditures on a regular basis as part of our ongoing development and exploration program. These commitments generally relate to projects that occur during the subsequent several months and are usually part of our normal operating expenses or part of our capital budget, which for 2009 is currently set at $750 million, exclusive of acquisitions. In certain cases we have the ability to terminate contracts for equipment in which case we would only be liable for the cost incurred by the vendor up to that point; however, as we currently do not anticipate cancelling those contracts these amounts include our estimated payments under those contracts. We also have recurring expenditures for such things as accounting, engineering and legal fees, software maintenance, subscriptions, and other overhead type items. Normally these expenditures do not change materially on an aggregate basis from year to year and are part of our general and administrative expenses. We have not attempted to estimate the amounts of these types of recurring expenditures in this table as most could be quickly cancelled with regard to any specific vendor, even though the expense itself may be required for ongoing normal operations of the Company.
(e) Represents projected capital costs as scheduled in our December 31, 2008 proved reserve report that are necessary in order to recover our proved undeveloped oil and natural gas reserves. These are not contractual commitments and are net of any other capital obligations shown under “Contractual Obligations” in the table above.
(f) Represents projected capital costs as scheduled in our December 31, 2008 proved reserve report that are necessary in order to recover our proved undeveloped CO 2 reserves from our CO 2 source wells used to produce CO 2 for our tertiary operations. These are not contractual commitments and are net of any other capital obligations shown above.
(g) Represents the estimated future asset retirement obligations on an undiscounted basis. The present discounted asset retirement obligation is $45.1 million, as determined under SFAS No. 143, and is further discussed in Note 4 to the Consolidated Financial Statements.
Table of Contents
Denbury Resources Inc. Management’s Discussion and Analysis of Financial Condition and Results of Operations
Results of Operations
CO 2 Operations
Overview. Since we acquired our first carbon dioxide tertiary flood in Mississippi in 1999, we have gradually increased our emphasis on these types of operations. During this time, we have learned a considerable amount about tertiary operations and working with carbon dioxide. Our tertiary operations have grown to the point that approximately 50% of our December 31, 2008 proved reserves are proved tertiary oil reserves, almost 50% of our forecasted 2009 production is expected to come from tertiary oil operations (on a BOE basis), and almost all of our 2009 capital expenditures are related to our current or future tertiary operations. We particularly like this play as (i) it has a lower risk and is more predictable than most traditional exploration and development activities, (ii) it provides a reasonable rate of return at relatively low oil prices (we estimate our economic break-even per barrel dollar cost on these projects at current oil prices is in the range of the mid-twenties, depending on the specific field and area), and (iii) we have virtually no competition for this type of activity in our geographic area. Generally, from East Texas to Florida, there are no known significant natural sources of CO 2 except our own, and these large volumes of CO 2 that we own drive the play. In addition, we are pursuing anthropogenic (man-made) sources of CO 2 to use in our tertiary operations, which we believe will not only help us recover additional oil, but will provide an economical way to sequester CO 2 . We have acquired several old oil fields in our areas of operations with potential for tertiary recovery and plan to acquire additional fields, and we are continuing to expand our CO 2
pipeline infrastructure to transport CO 2 .
We talk about our tertiary operations by labeling operating areas or groups of fields as phases. Phase I is in Southwest Mississippi and includes several fields along our 183-mile NEJD CO 2 Pipeline that we acquired in 2001. The most significant fields in this area are Little Creek, Mallalieu, McComb and Brookhaven. Phase II, which began with the early 2006 completion of the Free State CO 2 Pipeline to East Mississippi, includes Eucutta, Soso, Martinville and Heidelberg Fields. Tinsley Field located northwest of Jackson, Mississippi, acquired in January 2006, is our Phase III and is serviced by that portion of the Delta CO 2 Pipeline completed in January 2008. Phase IV includes Cranfield and Lake St. John Fields, two fields near the Mississippi/Louisiana border located west of the Phase I fields, and Phase V is Delhi Field, a Louisiana field we acquired in 2006, located southwest of Tinsley Field. Flooding in Phase V is anticipated to begin in 2009 upon completion of the Delta CO 2 Pipeline from Tinsley to Delhi. Citronelle Field in Southwest Alabama, another field acquired in 2006, is our Phase VI which will require an extension to the Free State CO 2 Pipeline, the timing of which is uncertain at this time. Our last two currently existing phases will require completion of our proposed Green Pipeline, a 320-mile CO 2 pipeline which will run from Southern Louisiana to near Houston, Texas, and is scheduled for completion in 2010. Hastings Field, a field which we purchased in February 2009 (see “Commitments and Contingencies”), is our Phase VII, and the Seabreeze Complex, acquired in 2007, will be our Phase VIII.
CO 2 Resources. Since we acquired the CO 2 source field located near Jackson, Mississippi, in 2001, we have continued to develop the field and have increased the proven CO 2 reserves from approximately 800 Bcf at the time of the acquisition to approximately 5.6 Tcf as of December 31, 2008. During 2008, the increase in our proven CO 2 reserves was offset by the 233 Bcf of CO 2 production during the year. The estimate of 5.6 Tcf of proved CO 2 reserves is based on 100% ownership of the CO 2 reserves, of which Denbury’s net revenue interest ownership is approximately 4.5 Tcf. Both reserve estimates are included in the evaluation of proven CO 2 reserves prepared by DeGolyer and MacNaughton. In discussing the available CO 2 reserves, we make reference to the gross amount of proved reserves, as this is the amount that is available for Denbury’s tertiary recovery programs, Genesis, and industrial users, as Denbury is responsible for distributing the entire CO 2
production stream for all of these uses. We currently estimate that it will take approximately 1.8 Tcf of CO 2 to develop and produce the proved tertiary recovery reserves we have recorded at December 31, 2008, in Phases I, II and III.
Today, we own every known producing CO 2 well in the region, providing us a significant strategic advantage in the acquisition of other properties in Mississippi, Louisiana and Texas that could be further exploited through tertiary recovery. As of February 27, 2009, we estimate that we are capable of producing between 900 MMcf/d and 1 Bcf/d of CO 2 , over eight times the rate that we were capable of producing at the time of our initial acquisition in 2001. We continue to drill additional CO 2 wells, with one more well planned for 2009, in order to further increase our production capacity. Our drilling activity at Jackson Dome will continue beyond 2009 as our current forecasts for the existing eight phases suggest that we will need approximately 1.4 Bcf/d of CO 2 production by 2013.
39

Table of Contents
Denbury Resources Inc. Management’s Discussion and Analysis of Financial Condition and Results of Operations
In addition to using CO 2 for our tertiary operations, we sell CO 2 to third party industrial users under long-term contracts. Most of these industrial contracts have been sold to Genesis along with the sale of volumetric production payments for the CO 2. Our average daily CO 2
production during 2006, 2007 and 2008 was approximately 342 MMcf/d, 493 MMcf/d and 637 MMcf/d, respectively, of which approximately 75% in 2006, 81% in 2007 and 86% in 2008 was used in our tertiary recovery operations, with the balance delivered to Genesis under the volumetric production payments or sold to third party industrial users.
We spent approximately $0.22 per Mcf in operating expenses to produce our CO 2 during 2008, more than our 2007 average of $0.21 per Mcf and our 2006 average of $0.19 per Mcf, with the higher costs each year primarily due to higher average oil costs, which is the basis upon which we pay royalty owners for the CO 2 , and higher operating costs. Our CO 2 costs peaked at $0.27 per Mcf in the second quarter of 2008, corresponding to the peak in oil prices, but decreased during the fourth quarter of 2008 to an average of approximately $0.15 per Mcf as a result of the decline in oil prices. Our estimated total cost per thousand cubic feet of CO 2 during 2008 was approximately $0.30, after inclusion of depreciation and amortization expense related to the CO 2 production, as compared to approximately $0.29 per Mcf during 2007 and $0.28 per Mcf during 2006.
Man-Made CO 2 Sources. In addition to our natural source of CO 2 , we are in discussions with the owners of several proposed solid carbon gasification plants which, if constructed, will convert coal or petroleum coke into various other products, with CO 2 being a significant by-product of the process. If built, these plants could provide us with significant additional sources of CO 2 in the future which would enable us to further expand our tertiary operations, although the earliest date this CO 2 is expected to be available to us is in 2013. These plants have all been delayed due to current economic conditions and it is uncertain, when, if ever, these plants will be built. We have entered into long-term commitments to purchase CO 2 from four proposed plants (see “Commitments and Obligations”), which, if all four plants are built, are currently anticipated to provide us with an aggregate of approximately 1 Bcf/d of CO 2 . In addition to the proposed gasification plants, we have ongoing discussions with existing plants of various types that emit CO 2 and we may be able to purchase their volumes. In order to capture such volumes, we (or the plant owner) would need to install additional equipment, which include at a minimum, compression and dehydration facilities. Most of these existing plants emit relatively small volumes of CO 2 , generally less than the proposed gasification plants, but such volumes may still be attractive if the source is located near our Green CO 2 Pipeline. The capture of CO 2 could also be influenced by anticipated federal legislation, which could impose economic penalties for the emission of CO 2 . We believe that we are a likely purchaser of CO 2 produced in our area of operations because of the scale of our tertiary operations, our CO 2 pipeline infrastructure, and the large natural source of CO 2 (Jackson Dome), which can act as a swing CO 2 source to balance CO 2 supplies and demands.
Overview of Tertiary Economics. When we began our tertiary operations several years ago, they were generally economic at oil prices below $20 per Bbl, although the economics varied by field. Our costs have escalated during the last few years due to general cost inflation in the industry, but we expect them to be reduced during 2009, and to be at economic break-even dollar costs in the mid-twenties per barrel if oil prices remain at their current reduced level, dependent on the specific field. Our inception-to-date finding and development costs (including future development and abandonment costs but excluding expenditures on fields without proven reserves) for our tertiary oil fields through December 31, 2008, are approximately $11.30 per BOE. Currently, we forecast that most of these costs will average less than $10 per BOE over the life of each field, depending on the state of a particular field at the time we begin operations, the amount of potential oil, the proximity to a pipeline or other facilities, and other factors, as the finding and development costs to date do not include significant unproven potential reserves in most of the fields. Our operating costs for tertiary operations are highly dependent on commodity prices and could range from $15 to $25 per BOE over the life of each field, again depending on the field itself.
While these economic factors have wide ranges, our rate of return from these operations has generally been better than our rate of return on traditional oil and gas operations, and thus our tertiary operations have become our single most important focus area. While it is extremely difficult to accurately forecast future production, we do believe that our tertiary recovery operations provide significant long-term production growth potential at reasonable rates of return, with relatively low risk, and thus will be the backbone of our Company’s growth for the foreseeable future. Although we believe that our plans and projections are reasonable and achievable, there could be delays or unforeseen problems in the future that could delay or affect the economics of our overall tertiary development program. We believe that such delays or price effects, if any, should only be temporary.
40

Table of Contents
Denbury Resources Inc. Management’s Discussion and Analysis of Financial Condition and Results of Operations
Financial Statement Impact of CO 2 Operations. Our increasing emphasis on CO 2 tertiary recovery projects has significantly impacted, and will continue to impact our financial results and certain operating statistics.
First, there is a significant delay between the initial capital expenditures on these fields and the resulting production increases, as we must build facilities before CO 2 flooding can commence, and it usually takes six to 12 months before the field responds to the injection of CO 2 (i.e., oil production commences). Further, we may spend significant amounts of capital before we can recognize any proven reserves from fields we flood (see “Analysis of CO 2 Tertiary Recovery Operating Activities” below). Even after a field has proven reserves, there will usually be significant amounts of additional capital required to fully develop the field.
Second, these tertiary projects can be more expensive to operate than our other oil fields because of the cost of injecting and recycling the CO 2 (primarily due to the significant energy requirements to re-compress the CO 2 back into a near-liquid state for re-injection purposes). Since a significant portion of our operating costs vary along with commodity and electrical prices, these costs are highly variable and will increase in a high commodity price environment and decrease in a low price environment. As an example (as discussed above), during 2008, the cost of our CO 2 varied from $0.15 per Mcf to $0.27 per Mcf. Most of our CO 2 operating costs are allocated to our tertiary oil fields and recorded as lease operating expenses or capitalized to those fields at the time the CO 2 is injected, and these costs have historically represented over 25% of the total operating costs for a tertiary operation. Since we expense all of the operating costs to produce and inject our CO 2
(following the commencement of tertiary oil production), the operating costs per barrel will be higher at the inception of CO 2 injection projects because of minimal related oil production at that time.
Analysis of CO 2 Tertiary Recovery Operating Activities . We currently have tertiary operations ongoing at almost all Phase I fields, at Soso, Martinville, Eucutta and Heidelberg Fields in Phase II, Tinsley Field in Phase III, and Cranfield (Phase IV). We project that our oil production from our CO 2 operations will increase substantially over the next several years as we continue to expand this program by adding additional projects and phases. As of December 31, 2008, we had approximately 125.8 MMBbls of proven oil reserves related to tertiary operations (50.0 MMBbls in Phase I, 41.4 MMBbls in Phase II and 34.4 MMBbls in Phase III) representing about 50% of our total corporate proved reserves, and have identified and estimate significant additional oil potential in other fields that we own in this region.
We added 63.4 MMBbls of tertiary-related proved oil reserves during 2008, primarily initial proven tertiary oil reserves at Heidelberg Field (Phase II), Tinsley Field (Phase III) and Lockhart Crossing Field (Phase I). In order to recognize proved tertiary oil reserves, we must either have an oil production response to the CO 2 injections or the field must be analogous to an existing tertiary flood. The magnitude of proven reserves that we can book in any given year will depend on our progress with new floods and the timing of the production response.
Our average annual oil production from our CO 2 tertiary recovery activities has increased during the last few years, from 3,970 Bbls/d in 2002 to 19,377 Bbls/d during 2008 (21,874 Bbls/d during the fourth quarter of 2008). Tertiary oil production represented approximately 62% of our total corporate oil production during 2008 and approximately 42% of our total corporate production of both oil and natural gas during the same period on a BOE basis. We expect that this tertiary related oil production will continue to increase, although the increases are not always predictable or consistent. While we may have temporary fluctuation in oil production related to tertiary operations, this usually does not indicate any issue with the proved and potential oil reserves recoverable with CO 2 , because the historical correlation between oil production and CO 2 injections remains high. A detailed discussion of each of our tertiary oil fields and the development of each is included on pages 8-11 under “ Our Tertiary Oil Fields With Proved Tertiary Reserves.” Following is a chart with our tertiary oil production by field for 2006 and 2007, and by quarter for 2008. In 2008, we had initial production response from our tertiary floods at Lockhart Crossing Field and Tinsley Field, and we saw continued improved response from our newer Phase II floods at Martinville, Eucutta and Soso Fields, most of which were initiated during 2006. We initiated CO 2 injections at Cranfield Field in July 2008 and at Heidelberg Field in December 2008. We anticipate our first response and sales from the Cranfield CO 2 injections in the first quarter of 2009 and from the Heidelberg Field injections in the second half of 2009. One of our Phase I fields, Little Creek, is a mature flood and is expected to continue its gradual decline over the next several years. Production at another Phase I field, Mallalieu, appears to have plateaued and is not expected to increase during 2009.
41

Table of Contents
Denbury Resources Inc. Management’s Discussion and Analysis of Financial Condition and Results of Operations
In addition to higher electrical costs to operate our tertiary recycling facilities caused by higher commodity prices, we have experienced general cost inflation during the last few years. We also lease a portion of our recycling and plant equipment used in our tertiary operations, which further increases operating expenses. Over the last six years we have leased certain equipment that qualifies for operating lease treatment representing an underlying aggregate cost of approximately $104.5 million as of December 31, 2008. These leases have been an attractive method of financing due to their low imputed interest rates, which are fixed for seven to ten years. Also, the cost to produce our CO 2 gradually increased through mid-2008, as oil prices increased (see “CO 2 Resources” above), with all of these items causing our lease operating expense for our tertiary operations to peak at $26.81 per Bbl in the third quarter of 2008, before declining along with the drop in oil prices in the latter part of 2008 to an average of $21.86 per Bbl during the fourth quarter of 2008. Our total tertiary operating expenses and cost per barrel for each of the last three years are set forth in the following table:
Through December 31, 2008, we have invested a total of $1.4 billion in tertiary fields (including allocated acquisition costs) and have only $105.3 million in unrecovered net cash flow (revenue less operating expenses and capital expenditures). Of this total invested amount, approximately $229.6 million (17%) was spent on fields which had little or no proved reserves at December 31, 2008 (i.e., fields for which significant incremental proved reserves are anticipated during 2009 and beyond). The proved oil reserves in our CO 2 fields have a PV-10 Value of $1.0 billion, using December 31, 2008, constant NYMEX pricing of $44.60 per Bbl. These amounts do not include the capital costs or related depreciation and amortization of our CO 2 producing properties, but do include CO 2 source field lease operating costs and transportation costs.
CO 2 Source Field-Related Capital Budget for 2009. Tentatively, we plan to spend approximately $52 million in 2009 in the Jackson Dome area with the intent to add deliverability for future operations. Approximately $138 million in capital expenditures is budgeted in 2009 at the oil field level in Phases I through V, plus an additional $485 million for our Delta and Green CO 2 Pipelines, making our combined CO 2
related expenditures just over 90% of our $750 million 2009 capital budget (excluding the Hastings Field purchase).
42
Average Daily Production (BOE/d) First Second Third Fourth Quarter Quarter Quarter Quarter Year Ended December 31, Tertiary Oil Field 2008 2008 2008 2008 2008 2007 2006
Phase I: Brookhaven 2,638 2,714 2,772 3,178 2,826 2,048 833 Little Creek area 1,807 1,661 1,556 1,706 1,683 2,014 2,739 Mallalieu area 6,099 6,260 5,339 5,056 5,686 5,852 5,210 McComb area 1,632 1,818 2,061 2,092 1,901 1,912 1,235 Lockhart Crossing — — 182 555 186 — —
Phase II: Martinville 793 715 736 1,213 865 709 6 Eucutta 2,699 2,933 3,262 3,538 3,109 1,646 47 Soso 1,488 1,885 2,358 2,704 2,111 586 —
Phase III: Tinsley — 675 1,518 1,832 1,010 — —
Total tertiary oil production 17,156 18,661 19,784 21,874 19,377 14,767 10,070
Year ended December 31, 2008 2007 2006
Tertiary operating expenses (thousands) $ 167,156 $ 106,541 $ 65,028 Tertiary operating expenses per Bbl 23.57 19.77 17.69

Table of Contents
Denbury Resources Inc. Management’s Discussion and Analysis of Financial Condition and Results of Operations
Operating Results
Net income and cash flow from operations have increased each year during the last three years. Production increased 5% between 2007 and 2008 (net of the production that was sold), and 20% between 2006 and 2007 which, coupled with higher prices, resulted in record annual net income and cash flow.
43
Year Ended December 31, Amounts in Thousands, Except Per Share Amounts 2008 2007 2006
Net income $ 388,396 $ 253,147 $ 202,457 Net income per common share:
Basic $ 1.59 $ 1.05 $ 0.87 Diluted 1.54 1.00 0.82
Cash flow from operations $ 774,519 $ 570,214 $ 461,810

Table of Contents
Denbury Resources Inc. Management’s Discussion and Analysis of Financial Condition and Results of Operations
Certain of our operating statistics for each of the last three years are set forth in the following table:
44
Year Ended December 31, 2008 2007 2006
Average daily production volumes Bbls/d 31,436 27,925 22,936 Mcf/d 89,442 97,141 83,075 BOE/d (1) 46,343 44,115 36,782
Operating revenues (in thousands)
Oil sales $ 1,066,917 $ 711,457 $ 501,176 Natural gas sales 280,093 241,331 215,381
Total oil and natural gas sales $ 1,347,010 $ 952,788 $ 716,557
Oil and natural gas derivative contracts (in thousands) (2)
Cash receipt (payment) on settlements of derivative contracts $ (57,553 ) $ 20,480 $ (5,302 ) Non-cash fair value adjustment income (expense) 257,606 (39,077 ) 25,130
Total income (expense) from oil and natural gas derivative contracts $ 200,053 $ (18,597 ) $ 19,828
Operating expenses (in thousands)
Lease operating expenses $ 307,550 $ 230,932 $ 167,271 Production taxes and marketing expenses (3) 63,752 49,091 36,351
Total production expenses $ 371,302 $ 280,023 $ 203,622
Non-tertiary CO 2 operating margin (in thousands)
CO 2 sales and transportation fees (4) $ 13,858 $ 13,630 $ 9,376 CO 2 operating expenses 4,216 4,214 3,190
Non-tertiary CO 2 operating margin $ 9,642 $ 9,416 $ 6,186
Unit sales price — including impact of derivative settlements (2)
Oil price per Bbl $ 90.04 $ 68.84 $ 59.23 Gas price per Mcf 7.74 7.66 7.10
Unit sales price — excluding impact of derivative settlements (2)
Oil price per Bbl $ 92.73 $ 69.80 $ 59.87 Gas price per Mcf 8.56 6.81 7.10
Oil and natural gas operating revenues and expenses per BOE (1)
Oil and natural gas revenues $ 79.42 $ 59.17 $ 53.37
Oil and natural gas lease operating expenses $ 18.13 $ 14.34 $ 12.46 Oil and natural gas production taxes and marketing expenses 3.76 3.05 2.71
Total oil and natural gas production expenses $ 21.89 $ 17.39 $ 15.17
(1) Barrel of oil equivalent using the ratio of one barrel of oil to six Mcf of natural gas (BOE).
(2) See also “Market Risk Management” below for information concerning the Company’s derivative transactions.
(3) For 2008, 2007 and 2006, includes transportation expenses paid to Genesis of $8.0 million, $6.0 million and $4.4 million, respectively.
(4) For 2008, 2007 and 2006, includes deferred revenue of $4.5 million, $4.4 million and $4.2 million, respectively, associated with volumetric production payments and transportation income of $5.5 million, $5.2 million and $4.6 million, respectively, both from Genesis.

Table of Contents
Denbury Resources Inc. Management’s Discussion and Analysis of Financial Condition and Results of Operations
Production . Average daily production by area for 2006 and 2007, and each of the quarters of 2008 is listed in the following table (BOE/d).
Average daily production during 2008 increased 18% (7,047 BOE/d) over 2007 levels after adjusting for the sale of our Louisiana natural gas assets in December 2007 and February 2008. The production increases in 2008 were primarily from increased oil production from our tertiary operations and increased production from the Barnett Shale, partially reduced by declines in production from our Mississippi — non-CO 2 floods. Production increases from the Barnett Shale contributed approximately 3,149 BOE/d of the increase and our tertiary operations contributed 4,610 BOE/d of the increase, partially offset by decreases of 582 BOE/d at our Mississippi — non-CO 2 fields.
See “CO 2 Operations” above for a discussion of our tertiary related production.
Production in the Mississippi — non-CO 2 floods area decreased slightly each year from the prior year as this area is on a gradual decline from normal depletion, partially offset by drilling activity developing the Selma Chalk natural gas reservoir in the Heidelberg area.
Our production in the Barnett Shale area in Texas increased 3,149 BOE/d (33%) during 2008 over our 2007 level, and during 2007 increased 4,690 BOE/d (97%) over our 2006 level there. We drilled and completed 38 wells during 2008, 45 wells during 2007 and 46 wells drilled during 2006, and plan to drill 6 wells during 2009. We have severely curtailed our spending plans in this area for 2009 in an effort to prioritize and reduce our overall capital expenditures. We expect our Barnett Shale production to gradually decrease throughout 2009 based on our reduced level of future drilling activity. These wells are characterized by steep decline rates in their first year of production, followed by a gradual leveling-off of production and a resultant slow decline rate, giving them an overall long production life. The Texas property acquisition we made late in the first quarter of 2007, the Seabreeze Complex, contributed approximately 506 BOE/d to our 2008 average production, approximately the same as the 524 BOE/d produced during 2007.
The decrease in onshore Louisiana production in 2008 is due to the December 2007 and February 2008 divesture of these assets, excluding any oil fields that could have tertiary oil potential (see “Overview — Sale of Louisiana Natural Gas Assets”).
Our production for 2008 was 68% oil as compared to 63% during 2007 and 62% in 2006. This increase is due to the sale of our Louisiana natural gas assets in December 2007 and February 2008, and to the increase in our tertiary oil production.
45
Average Daily Production (BOE/d) First Second Third Fourth Quarter Quarter Quarter Quarter Year Ended December 31, Operating Area 2008 2008 2008 2008 2008 2007 2006
Tertiary Oil Fields 17,156 18,661 19,784 21,874 19,377 14,767 10,070 Mississippi — non-CO 2 floods 12,128 11,617 11,694 12,150 11,897 12,479 12,743 Texas 13,522 14,068 12,701 12,576 13,214 10,074 4,868 Onshore Louisiana 905 663 512 418 624 5,542 7,937 Alabama and other 1,189 1,296 1,222 1,219 1,231 1,253 1,164
Total Company 44,900 46,305 45,913 48,237 46,343 44,115 36,782

Table of Contents
Denbury Resources Inc. Management’s Discussion and Analysis of Financial Condition and Results of Operations
Oil and Natural Gas Revenues. Our oil and natural gas revenues have increased for each of the last two years due to increases in both overall commodity prices and production, as seen in the following table:
Excluding any impact of our derivative contracts, our net realized commodity prices and NYMEX differentials were as follows during 2008, 2007 and 2006:
Our oil NYMEX differential peaked during 2008 in the second quarter at $(9.64), corresponding to the peak in oil prices. Differentials have decreased since that time along with the decline in oil prices, averaging $(3.59) during the fourth quarter of 2008, a relatively low differential based on our historical averages, but not as low as they were during 2007. The improved NYMEX differential during 2007 was related to higher prices received for both our light sweet barrels and our sour barrels primarily as a result of NYMEX (WTI) prices being depressed due to lack of available storage capacity in the mid-continent area, an oversupply of crude from Canada, capacity/transportation issues in moving crude oil out of the Cushing, Oklahoma area and unanticipated refinery outages. This trend had reversed itself by the fourth quarter of 2007, with average NYMEX oil differentials during that quarter of $(7.27) per Bbl.
Our natural gas NYMEX differentials are generally caused by movement in the NYMEX natural gas prices during a month as most of our natural gas is sold on an index price that is set near the first of the month. While the percentage change in the above table is quite large, these differentials are very seldom more than a dollar above or below the NYMEX amount.
46
Year Ended December 31, Amounts in thousands 2008 vs. 2007 2007 vs. 2006 Percentage Percentage Increase in Increase Increase in Increase Revenues in Revenues Revenues in Revenues Change in revenues due to: Increase in production $ 50,845 5 % $ 142,860 20 % Increase in commodity prices 343,377 36 % 93,371 13 %
Total increase in revenues $ 394,222 41 % $ 236,231 33 %
Year Ended December 31, 2008 2007 2006 Net Realized Prices: Oil price per Bbl $ 92.73 $ 69.80 $ 59.87 Gas price per Mcf 8.56 6.81 7.10 Price per BOE 79.42 59.17 53.37 NYMEX Differentials: Oil per Bbl $ (7.02 ) $ (2.65 ) $ (6.41 ) Natural Gas per Mcf (0.33 ) (0.28 ) 0.13

Table of Contents
Denbury Resources Inc. Management’s Discussion and Analysis of Financial Condition and Results of Operations
Oil and Natural Gas Derivative Contracts.
During 2008, we had significant fluctuations in our pre-tax income related to non-cash fair value adjustments in our oil and natural gas derivative contracts due to fluctuating oil and natural gas prices. During 2008 we made cash payments of $57.5 million on the settlements of our commodity derivative contracts, with $26.5 million related to our 2008 natural gas swaps, and $31.0 million related to payments on our oil swaps. During 2007, we had settlements on our commodity derivative contracts of $20.5 million, all related to our natural gas swaps, partially offset by payments on our oil swaps. During 2006, we made payments on our derivative contracts of $5.3 million, related to oil swaps put in place in late 2005 to protect the rate of return on fields acquired in January 2006.
Changing commodity prices cause fluctuations in the mark-to-market value adjustments of our derivative contracts. The most significant adjustment made in 2008 was for oil derivative contracts purchased in October 2008 covering 30,000 Bbls/d during calendar year 2009. These contracts have a floor price of $75 per Bbl and a ceiling price of $115 per Bbl, and were purchased for $15.5 million. As oil prices declined significantly after we purchased these contracts, we recognized $234.3 million of non-cash fair value income on these contracts during the fourth quarter of 2008. The estimated fair value of these contracts recognized as a current asset on our Consolidated Balance Sheet at December 31, 2008, was $249.7 million. Further, significant fluctuations in oil commodity prices during 2009 may result in corresponding significant fluctuations in our 2009 quarterly pretax income due to market value changes in these outstanding contracts. The remaining $23.3 million of net non-cash fair value income during 2008 was primarily associated with our oil swap contracts that settled during 2008. During 2007, we expensed $24.6 million related to mark-to-market value adjustments of our natural gas swaps, primarily offsetting the gain we recognized on the same swaps in late 2006 as the swaps had expired by the end of 2007. We also expensed $14.5 million related to our oil swaps in 2007, as a result of the increasing oil price. We recognized a non-cash gain of $25.1 million in 2006 as a result of decreasing prices, primarily related to the 75 MMcf/d of natural gas swaps for calendar 2007 that we entered into during December 2006.
Operating Expenses. Our lease operating expenses have increased each year on both a per BOE basis and in absolute dollars primarily as a result of (i) our increasing emphasis on tertiary operations (see discussion of those expenses under “CO 2 Operations ” above), (ii) higher overall industry costs, (iii) increased personnel and related costs, (iv) higher fuel and electrical costs to operate our properties, and (v) increasing lease payments for certain of our tertiary operating facilities and equipment.
During 2008, operating costs averaged $18.13 per BOE, up from $14.34 per BOE during 2007, and $12.46 per BOE in 2006. On a sequential quarterly basis during 2008, our operating costs per BOE averaged $16.15, $18.23, $20.20, and finally $17.90 for the fourth quarter, generally following the changes in oil prices. Operating expenses for our tertiary operations were $167.2 million in 2008, up from $106.5 million during 2007, and $65.0 million during 2006, all as a result of increased tertiary activity. Tertiary operating expenses were particularly impacted by higher electrical costs during 2007 and the first half of 2008, higher costs for CO 2 , and payments on leased facilities and equipment (see “CO 2 Operations” above). As discussed under “CO 2 Operations”, we expect our tertiary operating costs to partially correlate with oil prices. They have steadily risen during the last few years as oil prices have generally gone up, but with the recent drop in oil prices, these costs are expected to decrease. The sale of our Louisiana natural gas properties (see “Overview — Sale of Louisiana Natural Gas Properties”) also
47
Year Ended December 31, Amounts in thousands 2008 2007 2006 Non-Cash Non-Cash Non-Cash Fair Value Cash Fair Value Cash Fair Value Cash Adjustment Settlements Adjustment Settlements Adjustment Settlements Income/ Receipt/ Income/ Receipt/ Income/ Receipt/ (expense) (payment) (expense) (payment) (expense) (payment) First quarter $ (38,733 ) $ (8,048 ) $ (35,158 ) $ 8,251 $ (10,862 ) $ (768 ) Second quarter (30,223 ) (28,594 ) 13,330 1,719 (9,317 ) (2,212 ) Third quarter 86,079 (24,072 ) (5,441 ) 9,414 14,582 (2,207 ) Fourth quarter 240,483 3,161 (11,808 ) 1,096 30,727 (115 )
Total $ 257,606 $ (57,553 ) $ (39,077 ) $ 20,480 $ 25,130 $ (5,302 )

Table of Contents
Denbury Resources Inc. Management’s Discussion and Analysis of Financial Condition and Results of Operations
increased our corporate average operating cost per BOE in 2008. If the sold properties were excluded from our operating results for the entire year of 2007, our operating costs would have been approximately $15.47 per BOE, approximately $1.13 per BOE higher than as reported.
Production taxes and marketing expenses generally change in proportion to commodity prices and therefore have been higher in each of the last three years along with increasing commodity prices. Transportation and plant processing fees were approximately $8.4 million higher in 2008 than in 2007 and approximately $6.9 million higher in 2007 than in 2006, largely associated with the incremental production and incremental plant processing fees related to our Barnett Shale production.
General and Administrative Expenses
During the last three years, general and administrative (“G&A”) expenses have increased on a gross basis, while fluctuating on a per BOE basis as outlined below:
Gross G&A expenses increased $22.5 million, or 19% between 2007 and 2008, and $19.0 million, or 20%, between 2006 and 2007. The increases are primarily due to higher compensation and personnel related costs caused by an increase in the number of employees and higher wages which we consider necessary in order to remain competitive in our industry. During 2007, we increased our employee count by 15%, and we further increased our employee count 16% during 2008. Stock compensation expense reflected in gross G&A was $16.2 million during 2008, $12.2 million during 2007 and $18.9 million during 2006. The 2006 amount included $6.0 million of non-recurring charges related to the retirement and departure of two vice presidents during 2006.
Higher operator overhead recovery charges resulting from incremental activity helped to partially offset the increase in gross G&A. Our well operating agreements allow us, when we are the operator, to charge a well with a specified overhead rate during the drilling phase and also to charge a monthly fixed overhead rate for each producing well. As a result of the additional operated wells from acquisitions, additional tertiary operations, increased drilling activity and increased compensation expense (including the allocation of that portion of stock compensation charged to lease operating expense), the amount we recovered as operator labor and overhead charges increased by 16% between 2007 and 2008, and 24% between 2006 and 2007. Capitalized exploration and development costs increased each year primarily due to additional personnel and increased compensation costs.
The net effect of the increases in gross G&A expenses, operator overhead recoveries and capitalized exploration costs was a 23% increase in net G&A expense between 2007 and 2008, and a 14% increase in net G&A expense between 2006 and 2007. On a per BOE basis, G&A increased 17% in 2008 as compared to 2007 but G&A per BOE decreased 5% in 2007 as compared to 2006 levels as higher production more than offset the increase in gross costs.
48
Year Ended December 31, 2008 2007 2006
Net G&A expense (thousands) Gross G&A expense $ 137,979 $ 115,519 $ 96,479 State franchise taxes 3,415 2,915 1,825 Operator labor and overhead recovery charges (68,556 ) (59,145 ) (47,667 ) Capitalized exploration and development costs (12,464 ) (10,317 ) (7,623 )
Net G&A expense $ 60,374 $ 48,972 $ 43,014
Average G&A cost per BOE $ 3.56 $ 3.04 $ 3.20 Employees as of December 31 797 686 596

Table of Contents
Denbury Resources Inc. Management’s Discussion and Analysis of Financial Condition and Results of Operations
Interest and Financing Expenses
Interest expense increased $1.8 million, or 6%, between 2007 and 2008, and $7.3 million, or 31%, between 2006 and 2007, primarily as a result of higher debt levels in the 2007 and 2008 periods, partially offset by higher capitalized interest during the 2007 and 2008 periods. Interest expense increased significantly during 2008 as a result of the two transactions with Genesis which were recorded as financing leases (see “Overview — Genesis Transactions”) and which carry a higher imputed rate of interest. The higher rate of interest is partially offset by the cash distributions that we receive from Genesis, which have increased from $1.7 million in 2007 to $7.1 million during 2008. However, the cash receipts related to distributions from Genesis are not recognized in our income statement but rather as an adjustment to our investment account.
Our interest capitalization increased in 2008 because of our growing balance of unevaluated property expenditures, expenditures on our CO 2 pipeline projects and higher overall interest rates.
Depletion, Depreciation and Amortization (“DD&A”) and Full Cost Ceiling Test Write-down
We adjust our DD&A rate each quarter for significant changes in our estimates of oil and natural gas reserves and costs, and thus our DD&A rate could change significantly in the future. Our DD&A rate per BOE, before the $226.0 million ($140.1 million net of tax) full cost ceiling write-down in 2008, increased 7% between 2007 and 2008, and 10% between 2006 and 2007, primarily due to capital spending and increased costs. Our proved reserves increased from 174.3 MMBOE as of December 31, 2006, to 194.7 MMBOE as of December 31, 2007, and further increased to 250.5 MMBOE as of December 31, 2008. Our 2008 year-end proved reserve quantities represent a 29% increase over proved reserves at the end of 2007, in spite of an estimated 13.8 MMBOE that were excluded as a result of the lower commodity prices at the end of 2008.
We added a total of 88.9 MMBOE of proved reserves during 2008 (before netting out 2008 production, property sales and downward reserve revisions due to pricing), replacing approximately 525% of our 2008
49
Year Ended December 31, Amounts in thousands, except per BOE data 2008 2007 2006
Cash interest expense $ 59,955 $ 49,205 $ 33,787 Non-cash interest expense 1,802 2,010 1,121 Less: Capitalized interest (29,161 ) (20,385 ) (11,333 )
Interest expense $ 32,596 $ 30,830 $ 23,575
Interest and other income $ 4,834 $ 6,642 $ 5,603
Average net cash interest expense per BOE (1) $ 1.59 $ 1.43 $ 1.26 Average debt outstanding $ 735,288 $ 672,376 $ 455,603 Average interest rate (2) 8.2 % 7.3 % 7.4 %
(1) Cash interest expense, less capitalized interest, less interest and other income on a BOE basis.
(2) Includes commitment fees but excludes amortization of discount, premium and debt issue costs.
Year Ended December 31, Amounts in thousands, except per BOE data 2008 2007 2006
Depletion and depreciation of oil and natural gas properties $ 192,791 $ 174,356 $ 132,880 Depletion and depreciation of CO 2 assets 15,644 11,609 8,375 Asset retirement obligations 3,048 2,977 2,389 Depreciation of other fixed assets 10,309 6,958 5,521
Total DD&A $ 221,792 $ 195,900 $ 149,165
DD&A per BOE: Oil and natural gas properties $ 11.55 $ 11.02 $ 10.08 CO 2 assets and other fixed assets 1.53 1.15 1.03
Total DD&A cost per BOE $ 13.08 $ 12.17 $ 11.11
Full cost ceiling test write-down $ 226,000 $ — $ —

Table of Contents
Denbury Resources Inc. Management’s Discussion and Analysis of Financial Condition and Results of Operations
production. The most significant reserve additions during 2008 were approximately 63.4 MMbbls added in our tertiary oil operations and approximately 117 Bcfe (19.5 MMBOE) in the Barnett Shale, both before netting out 2008 production. Our tertiary-related oil reserves added during the year were primarily at Tinsley Field in Phase III (34.8 MMBOE), Heidelberg Field in Phase II (22.4 MMBOE) and Lockhart Crossing Field in Phase I (4.0 MMBOE). Even though the additional proved reserves were significant, at the same time that we recognize incremental proved tertiary oil reserves, we move any related costs for that field from unevaluated properties into the full cost pool. Usually, these unevaluated costs are significant and when combined with the estimated future development costs, the net impact of the DD&A rate is usually minimal, and in some cases, increases the rate. Further, we generally do not initially recognize all of the potential tertiary oil reserves that we believe are recoverable, and therefore we expect to recognize incremental proved reserves at each of these tertiary fields in the future. These potential future reserves will have little or no cost associated with the incremental barrels; therefore, as these potential future reserves are recognized they will reduce the average ultimate cost per barrel.
Approximately $76.6 million of our 2008 capital expenditures were incurred on properties for which there were no proved reserves at year-end 2008 (primarily our new tertiary floods), and as such, were classified as unevaluated costs and did not affect our DD&A rate. As part of the initial recognition of proved reserves at Tinsley, Heidelberg and Lockhart Crossing Fields during 2008, approximately $284.6 million of previously unevaluated costs were moved to the full cost pool.
Our DD&A rate during the fourth quarter of 2008 was also negatively impacted by the exclusion of approximately 13.8 MMBOE due to the decrease in commodity prices. Had these reserves been included, the DD&A rate on oil and gas properties for the fourth quarter of 2008 would have been approximately $11.32 per BOE, rather than the $11.92 per BOE that was reported.
Our DD&A rate for our CO 2 and other fixed assets increased in both 2007 and 2008 as a result of the Free State CO 2 Pipeline that was placed into service in 2006, the Lockhart Crossing CO 2 pipeline placed into service during 2007, the Tinsley and Heidelberg CO 2 pipelines placed into service during 2008, drilling costs for additional CO 2 wells, and the expansion of our corporate office space during 2008.
As part of the requirements of Statement of Financial Accounting Standards (SFAS) No. 143, Accounting for Asset Retirement Obligations, the fair value of a liability for an asset retirement obligation is recorded in the period in which it is incurred, discounted to its present value using our credit adjusted risk-free interest rate, with a corresponding capitalized amount. The liability is accreted each period, and the capitalized cost is depreciated over the useful life of the related asset. On an undiscounted basis, we estimated our retirement obligations as of December 31, 2006, to be $91.3 million ($41.1 million present value), with an estimated salvage value of $60.0 million. As of December 31, 2007, we estimated our retirement obligations to be $100.6 million ($41.3 million present value), with an estimated salvage value of $67.3 million, and as of December 31, 2008, we estimated our retirement obligations to be $106.4 million ($45.1 million present value), with an estimated salvage value of $76.4 million, the increase related to 2008 activity and higher cost estimates due to the inflation in our industry, partially offset by a decrease in our obligation of approximately $9.5 million, ($9.3 million present value) related to the sale of most of our Louisiana natural gas properties in late 2007 and early 2008. DD&A is calculated on the increase in retirement obligations recorded as incremental oil and natural gas and CO 2 properties, net of its estimated salvage value. We also include the accretion of discount on the asset retirement obligation in our DD&A expense.
Under full cost accounting rules, we are required each quarter to perform a ceiling test calculation. We have not had any full cost pool ceiling test write-downs since 1998. However, during 2008, commodity prices were volatile, with oil NYMEX prices moving from $95.98 per Bbl at December 31, 2007 to $140.00 per Bbl at June 30, 2008 then down to $44.60 per Bbl at December 31, 2008. Likewise, natural gas NYMEX prices went from $7.48 per Mcf as of December 31, 2007 to $13.35 per Mcf at June 30, 2008 and down to $5.62 per Mcf as of December 31, 2008. Because of the 54% decrease in NYMEX oil price and 25% decrease in NYMEX natural gas price between year-end 2007 and year-end 2008, we recognized a full cost pool ceiling test write-down at December 31, 2008 of $226.0 million, or $13.32 per BOE. Subsequent to December 31, 2008, oil and natural gas prices have continued their volatility and are currently at levels lower than at year-end 2008. If oil and natural gas prices remain at these lower levels through March 31, 2009, or subsequent periods, we may be required to record additional write-downs under the full cost ceiling test in the first quarter of 2009, or in subsequent periods. The amount of any future write-down is difficult to predict and will depend upon the oil and natural gas prices at the end of each period, the incremental proved reserves that might be added during each period and additional capital spent.
50

Table of Contents
Denbury Resources Inc. Management’s Discussion and Analysis of Financial Condition and Results of Operations
Income Taxes
Our income tax provision was based on an estimated statutory rate of approximately 38% in 2008 and 2007 and 39% in 2006. Our effective tax rate has generally been less than our estimated statutory rate due to the impact of certain items such as our domestic production activities deduction, partially offset by compensation arising from incentive stock options that cannot be deducted for tax purposes in the same manner as book expense. The reduction in the estimated statutory rate to 38% in 2008 and 2007 was a result of our sale of our Louisiana natural gas assets during the fourth quarter of 2007. In 2008, we received permission from the IRS to change our method of tax accounting for certain assets used in our tertiary recovery operations (see “Overview — Change in Tax Accounting Method for Certain Tertiary Costs”).
In all three periods, the current income tax expense represents our anticipated alternative minimum cash taxes that we cannot offset with enhanced oil recovery (“EOR”) credits. As of December 31, 2008, we had an estimated $44 million of EOR credit carryforwards that we can utilize to reduce a portion of our cash taxes. These EOR credits do not begin to expire until 2022. Since the ability to earn additional enhanced oil recovery credits is based upon the level of oil prices, we may earn EOR credits again in the future if oil prices remain at their currently depressed levels.
Results of Operations on a Per BOE Basis
The following table summarizes the cash flow, DD&A and results of operations on a per BOE basis for the comparative periods. Each of the individual components is discussed above.
51
Year Ended December 31, Amounts in thousands, except per BOE amounts and tax rates 2008 2007 2006
Current income tax expense $ 40,812 $ 30,074 $ 19,865 Deferred income tax expense 195,020 110,193 107,252
Total income tax expense $ 235,832 $ 140,267 $ 127,117
Average income tax expense per BOE $ 13.90 $ 8.71 $ 9.47 Effective tax rate 37.8 % 35.7 % 38.6 % Total net deferred tax asset (liability) $ (522,234 ) $ (334,662 ) $ (229,925 )
Year Ended December 31, Per BOE data 2008 2007 2006
Oil and natural gas revenues $ 79.42 $ 59.17 $ 53.37 Gain (loss) on settlements of derivative contracts (3.40 ) 1.27 (0.39 ) Lease operating expenses (18.13 ) (14.34 ) (12.46 ) Production taxes and marketing expenses (3.76 ) (3.05 ) (2.71 )
Production netback 54.13 43.05 37.81 Non-tertiary CO 2 operating margin 0.57 0.58 0.46 General and administrative expenses (3.56 ) (3.04 ) (3.20 ) Net cash interest expense (1.59 ) (1.43 ) (1.26 ) Abandoned acquisition costs (1.80 ) — — Current income taxes and other (1.78 ) (1.37 ) (0.41 ) Changes in assets and liabilities relating to operations (0.31 ) (2.38 ) 1.00
Cash flow from operations 45.66 35.41 34.40 DD&A (13.08 ) (12.17 ) (11.11 ) Write-down of oil and natural gas properties (13.32 ) — — Deferred income taxes (11.50 ) (6.84 ) (7.99 ) Non-cash commodity derivative adjustments 15.19 (2.43 ) 1.87 Changes in assets and liabilities and other non-cash items (0.05 ) 1.75 (2.09 )
Net income $ 22.90 $ 15.72 $ 15.08

Table of Contents
Denbury Resources Inc. Management’s Discussion and Analysis of Financial Condition and Results of Operations
Market Risk Management
Debt
We finance some of our acquisitions and other expenditures with fixed and variable rate debt. These debt agreements expose us to market risk related to changes in interest rates. We had $75 million of bank debt outstanding as of December 31, 2008, and $60 million outstanding as of February 27, 2009. The carrying value of our bank debt is approximately fair value based on the fact that it is subject to short-term floating interest rates that approximate the rates available to us for those periods. We adjusted the estimated fair value measurements of our bank debt at December 31, 2008 in accordance with SFAS No. 157 for estimated nonperformance risk. This estimated nonperformance risk totaled approximately $11.0 million and was determined utilizing industry credit default swaps. None of our existing debt has any triggers or covenants regarding our debt ratings with rating agencies, although under the NEJD financing lease with Genesis (see “Overview — Genesis Transactions”) in the event of significant downgrades of our corporate credit rating by the rating agencies, Genesis can require certain credit enhancements from us, and possibly other remedies under the lease. The fair value of the subordinated debt is based on quoted market prices. The following table presents the carrying and fair values of our debt, along with average interest rates at December 31, 2008.
Oil and Natural Gas Derivative Contracts
From time to time, we enter into various oil and natural gas derivative contracts to provide an economic hedge of our exposure to commodity price risk associated with anticipated future oil and natural gas production. We do not hold or issue derivative financial instruments for trading purposes. These contracts have consisted of price floors, collars and fixed price swaps. The production that we hedge has varied from year to year depending on our levels of debt and financial strength and expectation of future commodity prices. Historically, we hedged up to 80% of our anticipated production to provide us with a reasonably certain amount of cash flow to cover most of our budgeted exploration and development expenditures without incurring significant debt. In late 2006, we swapped 80% to 90% of our forecasted 2007 natural gas production at a weighted average price of $7.96 per Mcf, and in September 2007 we swapped 70% to 80% of our remaining forecasted 2008 natural gas production (after the sale of our Louisiana natural gas properties — see “2008 Overview — Sale of Louisiana Natural Gas Assets”) at a weighted average price of $7.91 per Mcf. We cancelled the December 2008 natural gas swaps in the third quarter of 2008 because of our plans at that time to sell our Barnett Shale properties, receiving approximately $61,000 from the cancellation.
As a result of the current economic conditions and in order to protect our liquidity in the event that commodity prices continue to decline, during early October 2008, we purchased oil derivative contracts for 2009 with a floor price of $75 / Bbl and a ceiling price of $115 / Bbl for total consideration of $15.5 million. The collars cover 30,000 Bbls/d representing approximately 80% of our currently anticipated 2009 oil production. These 2009 contracts were entered into with the following counterparties: JPMorgan Chase Bank (10,000 Bbls/d), Wells Fargo Bank (7,500 Bbls/d), Keybank (5,000 Bbls/d), Fortis Energy Marketing and Trading GP (5,000 Bbls/d) and Comerica Bank (2,500 Bbls/d).
Historically, when we made a significant acquisition, we generally attempted to hedge a large percentage, up to 100%, of the forecasted proved production for the subsequent one to three years following the acquisition in order to help provide us with a minimum return on our investment. For 2008, we had derivative contracts in place related to our $250 million acquisition that closed on January 31, 2006, on which we entered into contracts to cover 100% of the first three years of estimated proved producing production at the time we signed the purchase and sale agreement. These swaps covered 2,000 Bbls/d for 2008 at a price of $57.34 per Bbl.
All of the mark-to-market valuations used for our oil and natural gas derivatives are provided by external sources and are based on prices that are actively quoted. We manage and control market and counterparty credit risk through established internal control procedures that are reviewed on an ongoing basis. We attempt to minimize
52
Expected Maturity Dates Carrying Fair Amounts in thousands 2011 2013 2015 Value Value
Variable rate debt: Bank debt (weighted average interest rate of 2.95% at
December 31, 2008) $ 75,000 $ — $ — $ 75,000 $ 64,000 Fixed rate debt:
7.5% subordinated debt due 2013 (fixed rate of 7.5%) — 225,000 — 224,174 171,000 7.5% subordinated debt due 2015 (fixed rate of 7.5%) — — 300,000 300,599 213,000

Table of Contents
Denbury Resources Inc. Management’s Discussion and Analysis of Financial Condition and Results of Operations
credit risk exposure to counterparties through formal credit policies, monitoring procedures and diversification. We have included an estimate of nonperformance risk in the fair value measurement of our oil derivative contracts as required by SFAS No. 157. At December 31, 2008, all of our oil derivative contracts are in an asset position. Therefore, in assessing the nonperformance risk of the counterparties to these contracts, we have measured the risk by using credit default swaps as we believe this data is the most responsive to current market events. If a counter-party did not have credit default swaps associated with that specific entity, we utilized industry credit default swaps as an estimate of the fair value of this risk associated with that entity. At December 31, 2008, the fair value of our oil derivative contracts was reduced by $3.7 million for the estimated nonperformance risk of our counterparties.
For accounting purposes, we do not apply hedge accounting for our oil and natural gas derivative contracts. This means that any changes in the fair value of these derivative contracts will be charged to earnings on a quarterly basis instead of charging the effective portion to other comprehensive income and the ineffective portion to earnings. Information regarding our current derivative contract positions and results of our historical derivative activity is included in Note 10 to the Consolidated Financial Statements.
At December 31, 2008, our derivative contracts were recorded at their fair value, which was a net asset of approximately $249.7 million, an increase of $273.0 million from the $23.3 million fair value liability recorded as of December 31, 2007. This change is primarily related to the declining oil prices which significantly increased the value of our 2009 oil collars, and the expiration of our natural gas hedges during 2008. During 2008, we recognized total income related to our hedge contracts of $200.1 million, consisting of $57.5 million of net cash payments on settlements of expired contracts, and $257.6 million of income relating to mark-to-market non-cash adjustments.
Based on NYMEX crude oil futures prices at December 31, 2008, we would expect to receive future cash payments of $229.8 million on our crude oil commodity derivative contracts. If crude oil futures prices were to decline by 10%, we would expect to receive future cash payments on our crude oil commodity derivative contracts of $289.0 million, and if futures prices were to increase by 10% we would expect to receive $170.7 million.
Critical Accounting Policies and Estimates
The preparation of financial statements in accordance with generally accepted accounting principles requires that we select certain accounting policies and make certain estimates and judgments regarding the application of those policies. Our significant accounting policies are included in Note 1 to the Consolidated Financial Statements. These policies, along with the underlying assumptions and judgments by our management in their application, have a significant impact on our consolidated financial statements. Following is a discussion of our most critical accounting estimates, judgments and uncertainties that are inherent in the preparation of our financial statements.
Full Cost Method of Accounting, Depletion and Depreciation and Oil and Natural Gas Reserves
Businesses involved in the production of oil and natural gas are required to follow accounting rules that are unique to the oil and gas industry. We apply the full-cost method of accounting for our oil and natural gas properties. Another acceptable method of accounting for oil and gas production activities is the successful efforts method of accounting. In general, the primary differences between the two methods are related to the capitalization of costs and the evaluation for asset impairment. Under the full cost method, all geological and geophysical costs, exploratory dry holes and delay rentals are capitalized to the full cost pool, whereas under the successful efforts method such costs are expensed as incurred. In the assessment of impairment of oil and gas properties, the successful efforts method follows the guidance of SFAS No. 144, “Accounting for the Impairment or Disposal of Long-Lived Assets,” under which the net book value of assets are measured for impairment against the undiscounted future cash flows using commodity prices consistent with management expectations. Under the full cost method, the full cost pool (net book value of oil and gas properties) is measured against future cash flows discounted at 10% using commodity prices in effect at the end of the reporting period. The financial results for a given period could be substantially different depending on the method of accounting that an oil and gas entity applies. Further, we do not designate our oil and natural gas derivative contracts as hedge instruments for accounting purposes under SFAS No. 133, and as a result, these contracts are not considered in the full cost ceiling test.
In our application of full cost accounting for our oil and gas producing activities, we make significant estimates at the end of each period related to accruals for oil and gas revenues, production, capitalized costs and operating expenses. We calculate these estimates with our best available data, which includes, among other things, production reports, price posting, information compiled from daily drilling reports and other internal tracking devices, and analysis of historical results and trends. While management is not aware of any required revisions to its
53

Table of Contents
Denbury Resources Inc. Management’s Discussion and Analysis of Financial Condition and Results of Operations
estimates, there will likely be future adjustments resulting from such things as changes in ownership interests, payouts, joint venture audits, re-allocations by the purchaser/pipeline, or other corrections and adjustments common in the oil and natural gas industry, many of which will require retroactive application. These types of adjustments cannot be currently estimated or determined and will be recorded in the period during which the adjustment occurs.
Under full cost accounting, the estimated quantities of proved oil and natural gas reserves used to compute depletion and the related present value of estimated future net cash flows therefrom used to perform the full cost ceiling test have a significant impact on the underlying financial statements. The process of estimating oil and natural gas reserves is very complex, requiring significant decisions in the evaluation of all available geological, geophysical, engineering and economic data. The data for a given field may also change substantially over time as a result of numerous factors, including additional development activity, evolving production history and continued reassessment of the viability of production under varying economic conditions. As a result, material revisions to existing reserve estimates may occur from time to time. Although every reasonable effort is made to ensure that the reported reserve estimates represent the most accurate assessments possible, including the hiring of independent engineers to prepare the report, the subjective decisions and variances in available data for various fields make these estimates generally less precise than other estimates included in our financial statement disclosures. Over the last four years, Denbury’s annual revisions to its reserve estimates have averaged approximately 3.3% of the previous year’s estimates and have been both positive and negative.
Changes in commodity prices also affect our reserve quantities. During 2006 and 2007, the change to reserve quantities related to commodity prices was relatively small as prices were relatively high each year-end; however, at December 31, 2008 the lower commodity prices lowered our proved reserves by 13.8 MMBOE. These changes in quantities affect our DD&A rate, and the combined effect of changes in quantities and commodity prices impacts our full cost ceiling test calculation. For example, we estimate that a 5% increase in our estimate of proved reserves quantities would have lowered our fourth quarter 2008 DD&A rate from $13.72 per BOE to approximately $13.17 per BOE, and a 5% decrease in our proved reserve quantities would have increased our DD&A rate to approximately $14.33 per BOE. Also, reserve quantities and their ultimate values are the primary factors in determining the borrowing base under our bank credit facility and are determined solely by our banks.
Under full cost accounting rules, we are required each quarter to perform a ceiling test calculation. We did not have any full cost pool ceiling test write-downs in 2006 or 2007. However, during 2008, commodity prices were volatile, with oil NYMEX prices moving from $95.98 per Bbl at December 31, 2007 to $140.00 per Bbl at June 30, 2008 then down to $44.60 per Bbl at December 31, 2008. Likewise, natural gas NYMEX prices went from $7.48 per Mcf as of December 31, 2007 to $13.35 per Mcf at June 30, 2008 and down to $5.62 per Mcf as of December 31, 2008. Because of the 54% decrease in NYMEX oil price and 25% decrease in NYMEX natural gas price between year-end 2007 and year-end 2008, we recognized a full cost pool ceiling test write-down during 2008 of $226.0 million, or $13.32 per BOE. Commodity prices have historically been volatile and are expected to be in the future. If oil and natural gas prices remain at these lower levels through March 31, 2009, or subsequent periods, we may be required to record additional write-downs due to the full cost ceiling test in the first quarter of 2009, or in subsequent periods. The amount of any future write-down is difficult to predict and will depend upon the oil and natural gas prices at the end of each period, the incremental proved reserves that might be added during each period and additional capital spent.
There can also be significant questions as to whether reserves are sufficiently supported by technical evidence to be considered proven. In some cases our proven reserves are less than what we believe to exist because additional evidence, including production testing, is required in order to classify the reserves as proven. We have a corporate policy whereby we generally do not book proved undeveloped reserves unless the project has been committed to internally, which normally means it is scheduled within the subsequent three years (or at least the commencement of the project is scheduled in the case of longer-term multi-year projects such as waterfloods and tertiary recovery projects). Therefore, with regard to potential reserves, there is uncertainty as to whether the reserves should be included as proven or not. We also have a corporate policy whereby proved undeveloped reserves must be economic at long-term historical prices, which have generally been significantly less than the year-end prices used in our reserve report. This also can have the effect of eliminating certain projects being included in our estimates of proved reserves, which projects would otherwise be included if undeveloped reserves were determined to be economic solely based on current prices in a high price environment, as was the case during 2006 and 2007 year-ends. (See “Depletion, Depreciation and Amortization” under “Results of Operations” above for further discussion.) All of these factors and the decisions made regarding these issues can have a significant effect on our proven reserves and thus on our DD&A rate, full cost ceiling test calculation, borrowing base and financial statements. See
54

Table of Contents
Denbury Resources Inc. Management’s Discussion and Analysis of Financial Condition and Results of Operations
also discussion of requirements to book proven tertiary oil reserves at “Results of Operations — Depletion, Depreciation and Amortization.”
Tertiary Injection Costs
Our tertiary operations are conducted in reservoirs that have already produced significant amounts of oil over many years; however, in accordance with the rules for recording proved reserves, we cannot recognize proved reserves associated with enhanced recovery techniques, such as CO 2 injection, until there is a production response to the injected CO 2 or, unless the field is analogous to an existing flood. Our costs associated with the CO 2 we produce (or acquire) and inject are principally our costs of production, transportation and acquisition, and to pay royalties.
Prior to January 1, 2008, we expensed currently all costs associated with injecting CO 2 that we used in our tertiary recovery operations, even though some of these costs were incurred prior to any tertiary related oil production. Commencing January 1, 2008, we began capitalizing, as a development cost, injection costs in fields that are in their development stage, which means we have not yet seen incremental oil production due to the CO 2 injections (i.e. a production response). These capitalized development costs will be included in our unevaluated property costs within our full cost pool if there are not already proved tertiary reserves in that field. After we see a production response to the CO 2 injections (i.e. the production stage), injection costs will be expensed as incurred and any previously deferred unevaluated development costs will become subject to depletion upon recognition of proved tertiary reserves. Had the new method of accounting for tertiary injection costs been used in periods prior to January 1, 2008, the effect on our financial statements would have been immaterial for all periods presented. During 2008, we capitalized $10.4 million of tertiary injection costs associated with our tertiary projects that we would have previously expensed.
Asset Retirement Obligations
We have significant obligations related to the plugging and abandonment of our oil, natural gas and CO 2 wells, the removal of equipment and facilities from leased acreage, and land restoration. SFAS No. 143 requires that we estimate the future cost of this obligation, discount it to its present value, and record a corresponding asset and liability in our Consolidated Balance Sheets. The values ultimately derived are based on many significant estimates, including the ultimate expected cost of the obligation, the expected future date of the required cash payment, and interest and inflation rates. Revisions to these estimates may be required based on changes to cost estimates, the timing of settlement, and changes in legal requirements. Any such changes that result in upward or downward revisions in the estimated obligation will result in an adjustment to the related capitalized asset and corresponding liability on a prospective basis and an adjustment in our DD&A expense in future periods. See Note 4 to our Consolidated Financial Statements for further discussion regarding our asset retirement obligations.
Income Taxes
We make certain estimates and judgments in determining our income tax expense for financial reporting purposes. These estimates and judgments occur in the calculation of certain tax assets and liabilities that arise from differences in the timing and recognition of revenue and expense for tax and financial reporting purposes. Our federal and state income tax returns are generally not prepared or filed before the consolidated financial statements are prepared; therefore, we estimate the tax basis of our assets and liabilities at the end of each period as well as the effects of tax rate changes, tax credits and, net operating loss carryforwards. Adjustments related to these estimates are recorded in our tax provision in the period in which we file our income tax returns. Further, we must assess the likelihood that we will be able to recover or utilize our deferred tax assets (primarily our enhanced oil recovery credits). If recovery is not likely, we must record a valuation allowance against such deferred tax assets for the amount we would not expect to recover, which would result in an increase to our income tax expense. As of December 31, 2008, we believe that all of our deferred tax assets recorded on our Consolidated Balance Sheet will ultimately be recovered. If our estimates and judgments change regarding our ability to utilize our deferred tax assets, our tax provision would increase in the period it is determined that recovery is not more likely than not. A 1% increase in our effective tax rate would have increased our calculated income tax expense by approximately $6.2 million, $3.9 million and $3.3 million for the years ended December 31, 2008, 2007 and 2006, respectively. See Note 7 to the Consolidated Financial Statements for further information concerning our income taxes.
55
Table of Contents
Denbury Resources Inc. Management’s Discussion and Analysis of Financial Condition and Results of Operations
Oil and Natural Gas Derivative Contracts
We enter into oil and natural gas derivative contracts to mitigate our exposure to commodity price risk associated with future oil and natural gas production. These contracts have historically consisted of options, in the form of price floors or collars, and fixed price swaps. We do not designate these derivative commodity contracts as hedge instruments for accounting purposes under SFAS No. 133. This means that any changes in the future fair value of these derivative contracts will be charged to earnings on a quarterly basis instead of charging the effective portion to other comprehensive income and the balance to earnings. While we may experience more volatility in our net income than if we were to apply hedge accounting treatment as permitted by SFAS No. 133, we believe that for us the benefits associated with applying hedge accounting do not outweigh the cost, time and effort to comply with hedge accounting. During 2008, 2007 and 2006, we recognized expense (income) of ($257.6) million, $39.1 million and ($25.1) million, respectively, related to changes in the fair market value of our derivative contracts.
Stock Compensation Plans
SFAS No. 123(R), “Share-Based Payment” requires that we recognize the cost of employee services received in exchange for awards of equity instruments, based on the grant date fair value of those awards, in the financial statements. We estimate the fair value of stock option or stock appreciation right (“SAR”) awards on the date of grant using the Black-Scholes option pricing model. The Black-Scholes option valuation model requires the input of somewhat subjective assumptions, including expected stock price volatility and expected term. Other assumptions required for estimating fair value with the Black-Scholes model are the expected risk-free interest rate and expected dividend yield of the Company’s stock. The risk-free interest rates used are the U.S. Treasury yield for bonds matching the expected term of the option on the date of grant. Our dividend yield is zero, as Denbury does not pay a dividend. We utilize historical experience in arriving at our assumptions for volatility and expected term inputs.
We recognize the stock-based compensation expense on a straight-line basis over the requisite service period for the entire award. The expense we recognize is net of estimated forfeitures. We estimate our forfeiture rate based on prior experience and true it up for actual results as the awards vest. As of December 31, 2008, there was $12.5 million of total compensation cost to be recognized in future periods related to non-vested stock options and SARs. The cost is expected to be recognized over a weighted-average period of 2.6 years.
Use of Estimates
The preparation of financial statements requires us to make other estimates and assumptions that affect the reported amounts of certain assets, liabilities, revenues and expenses during each reporting period. We believe that our estimates and assumptions are reasonable and reliable, and believe that the ultimate actual results will not differ significantly from those reported; however, such estimates and assumptions are subject to a number of risks and uncertainties, and such risks and uncertainties could cause the actual results to differ materially from our estimates.
Recent Accounting Pronouncements
Business Combinations. In December 2007, the FASB issued SFAS No. 141 (Revised 2008), “Business Combinations.” SFAS No. 141(R) establishes principles and requirements for how an acquirer recognizes and measures in its financial statements the identifiable assets acquired, the liabilities assumed, any noncontrolling interest in the acquiree and the goodwill acquired. SFAS No. 141(R) also establishes disclosure requirements to enable the evaluation of the nature and financial effects of the business combination. This statement is effective for us beginning January 1, 2009. We do not anticipate the adoption of SFAS 141(R) will have a material impact on our financial condition or results of operations, absent any material business combinations.
Noncontrolling Interests. In December 2007, the FASB issued SFAS No. 160, “Noncontrolling Interests in Consolidated Financial Statements an amendment of ARB No. 51.” SFAS No. 160 establishes accounting and reporting standards for ownership interests in subsidiaries held by parties other than the parent, the amount of consolidated net income attributable to the parent and to the noncontrolling interest, changes in a parent’s ownership interest, and the valuation of retained noncontrolling equity investments when a subsidiary is deconsolidated. SFAS No. 160 also establishes disclosure requirements that clearly identify and distinguish between the interests of the parent and the interests of the noncontrolling owners. This statement is effective for us beginning January 1, 2009. Since we currently do not have any noncontrolling interests, SFAS No. 160 does not presently have any impact on us.
56

Table of Contents
Denbury Resources Inc. Management’s Discussion and Analysis of Financial Condition and Results of Operations
Disclosures about Derivative Instruments and Hedging Activities. In March 2008, the FASB issued SFAS No. 161, “Disclosures about Derivative Instruments and Hedging Activities—an amendment of SFAS No. 133.” SFAS No. 161 requires entities that utilize derivative instruments to provide qualitative disclosures about their objectives and strategies for using such instruments, as well as any details of credit-risk-related contingent features contained within derivatives. SFAS No. 161 also requires entities to disclose additional information about the amounts and location of derivatives located within the financial statements, how the provisions of SFAS No. 133 have been applied, and the impact that hedges have on an entity’s financial position, financial performance, and cash flows. SFAS No. 161 is effective for us beginning January 1, 2009. As its only requirement is to enhance disclosures, SFAS No. 161 will not have a significant impact on us.
Modernization of Oil and Gas Reporting. On December 31, 2008, the Securities and Exchange Commission adopted major revisions to its rules governing oil and gas company reporting requirements. These include provisions that permit the use of new technologies to determine proved reserves, and that allow companies to disclose their probable and possible reserves to investors. The current rules limit disclosure to only proved reserves. The new disclosure requirements also require companies that have an audit performed of their reserves to report the independence and qualifications of the auditor of the reserve estimates, and to file reports when a third party reserve engineer is relied upon to prepare reserve estimates. The new rules also require that oil and gas reserves be reported and the full cost ceiling value calculated using an average price based upon the prior 12-month period. The new oil and gas reporting requirements are effective for annual reports on Forms 10-K for fiscal years ending on or after December 31, 2009, with early adoption not permitted. We are currently evaluating the impact the new rules may have on our financial condition or results of operations.
Forward-Looking Information
The statements contained in this Annual Report on Form 10-K that are not historical facts, including, but not limited to, statements found in this Management’s Discussion and Analysis of Financial Condition and Results of Operations, are forward-looking statements, as that term is defined in Section 21E of the Securities and Exchange Act of 1934, as amended, that involve a number of risks and uncertainties. Such forward-looking statements may be or may concern, among other things, forecasted capital expenditures, drilling activity or methods, acquisition plans and proposals and dispositions, development activities, cost savings, capital budgets, production rates and volumes or forecasts thereof, hydrocarbon reserve quantities and values, CO 2 reserves, potential reserves from tertiary operations, hydrocarbon prices, pricing or cost assumptions based on current and projected oil and gas prices, liquidity, cash flows, availability of capital, borrowing capacity, regulatory matters, mark-to-market values, competition, long-term forecasts of production, finding costs, rates of return, estimated costs, or changes in costs, future capital expenditures and overall economics and other variables surrounding our operations and future plans. Such forward-looking statements generally are accompanied by words such as “plan,” “estimate,” “expect,” “predict,” “anticipate,” “projected,” “should,” “assume,” “believe,” “target” or other words that convey the uncertainty of future events or outcomes. Such forward-looking information is based upon management’s current plans, expectations, estimates and assumptions and is subject to a number of risks and uncertainties that could significantly affect current plans, anticipated actions, the timing of such actions and the Company’s financial condition and results of operations. As a consequence, actual results may differ materially from expectations, estimates or assumptions expressed in or implied by any forward-looking statements made by or on behalf of the Company. Among the factors that could cause actual results to differ materially are: fluctuations of the prices received or demand for the Company’s oil and natural gas; inaccurate cost estimates; availability of and fluctuations in the prices of goods and services; the uncertainty of drilling results and reserve estimates; operating hazards; disruption of operations and damages from hurricanes or tropical storms; acquisition risks; requirements for capital or its availability; conditions in the financial and credit markets; general economic conditions; competition and government regulations; and unexpected delays, as well as the risks and uncertainties inherent in oil and gas drilling and production activities or which are otherwise discussed in this annual report, including, without limitation, the portions referenced above, and the uncertainties set forth from time to time in the Company’s other public reports, filings and public statements.
This Annual Report is not deemed to be soliciting material or to be filed with the Securities and Exchange Commission or subject to the liabilities of Section 18 of the Securities Act of 1934.
57

Table of Contents
Denbury Resources Inc.
Item 7A. Quantitative and Qualitative Disclosures About Market Risk
The information required by Item 7A is set forth under “Market Risk Management” in “Management’s Discussion and Analysis of Financial Condition and Results of Operations,” appearing on pages 52 through 53.
Item 8. Financial Statements and Supplementary Data
58
Page Report of Independent Registered Public Accounting Firm 59 Consolidated Balance Sheets 60 Consolidated Statements of Operations 61 Consolidated Statements of Cash Flows 62 Consolidated Statements of Changes in Stockholders’ Equity 63 Consolidated Statements of Comprehensive Income 64 Notes to Consolidated Financial Statements 65 Supplemental Oil and Natural Gas Disclosures (Unaudited) 94 Quarterly Financial Information (Unaudited) 98

Table of Contents
REPORT OF INDEPENDENT REGISTERED PUBLIC ACCOUNTING FIRM
To the Board of Directors and Stockholders of Denbury Resources Inc.:
In our opinion, the consolidated financial statements listed in the accompanying index present fairly, in all material respects, the financial position of Denbury Resources Inc. and its subsidiaries at December 31, 2008 and 2007, and the results of their operations and their cash flows for each of the three years in the period ended December 31, 2008 in conformity with accounting principles generally accepted in the United States of America. Also in our opinion, the Company maintained, in all material respects, effective internal control over financial reporting as of December 31, 2008, based on criteria established in Internal Control — Integrated Framework issued by the Committee of Sponsoring Organizations of the Treadway Commission (COSO). The Company’s management is responsible for these financial statements, for maintaining effective internal control over financial reporting and for its assessment of the effectiveness of internal control over financial reporting, included in Management’s Report on Internal Control over Financial Reporting under Item 9A. Our responsibility is to express opinions on these financial statements and on the Company’s internal control over financial reporting based on our integrated audits. We conducted our audits in accordance with the standards of the Public Company Accounting Oversight Board (United States). Those standards require that we plan and perform the audits to obtain reasonable assurance about whether the financial statements are free of material misstatement and whether effective internal control over financial reporting was maintained in all material respects. Our audits of the financial statements included examining, on a test basis, evidence supporting the amounts and disclosures in the financial statements, assessing the accounting principles used and significant estimates made by management, and evaluating the overall financial statement presentation. Our audit of internal control over financial reporting included obtaining an understanding of internal control over financial reporting, assessing the risk that a material weakness exists, and testing and evaluating the design and operating effectiveness of internal control based on the assessed risk. Our audits also included performing such other procedures as we considered necessary in the circumstances. We believe that our audits provide a reasonable basis for our opinions.
A company’s internal control over financial reporting is a process designed to provide reasonable assurance regarding the reliability of financial reporting and the preparation of financial statements for external purposes in accordance with generally accepted accounting principles. A company’s internal control over financial reporting includes those policies and procedures that (i) pertain to the maintenance of records that, in reasonable detail, accurately and fairly reflect the transactions and dispositions of the assets of the company; (ii) provide reasonable assurance that transactions are recorded as necessary to permit preparation of financial statements in accordance with generally accepted accounting principles, and that receipts and expenditures of the company are being made only in accordance with authorizations of management and directors of the company; and (iii) provide reasonable assurance regarding prevention or timely detection of unauthorized acquisition, use, or disposition of the company’s assets that could have a material effect on the financial statements.
Because of its inherent limitations, internal control over financial reporting may not prevent or detect misstatements. Also, projections of any evaluation of effectiveness to future periods are subject to the risk that controls may become inadequate because of changes in conditions, or that the degree of compliance with the policies or procedures may deteriorate.
59
/s/ PricewaterhouseCoopers LLP
PricewaterhouseCoopers LLP Dallas, Texas February 28, 2009

Table of Contents
Denbury Resources Inc. Consolidated Balance Sheets
See accompanying Notes to Consolidated Financial Statements.
60
(In thousands, except shares) December 31, 2008 2007
Assets Current assets
Cash and cash equivalents $ 17,069 $ 60,107 Accrued production receivable 67,805 136,284 Trade and other receivables, net of allowance of $377 and $369 80,579 28,977 Derivative assets 249,746 2,283 Deferred tax assets — 12,708
Total current assets 415,199 240,359
Property and equipment
Oil and natural gas properties (using full cost accounting) Proved 3,386,606 2,682,932 Unevaluated 235,403 366,518
CO 2 properties, equipment and pipelines 899,542 436,591 Other 70,328 50,116 Less accumulated depletion, depreciation and impairment (1,589,682 ) (1,143,282 )
Net property and equipment 3,002,197 2,392,875
Deposits on properties under option or contract 48,917 49,097 Other assets 43,357 32,338 Investment in Genesis 80,004 56,408
Total assets $ 3,589,674 $ 2,771,077
Liabilities and Stockholders’ Equity
Current liabilities Accounts payable and accrued liabilities $ 202,633 $ 147,580 Oil and gas production payable 85,833 84,150 Derivative liabilities — 28,096 Deferred revenue — Genesis 4,070 4,070 Deferred tax liability 89,024 — Current maturities of long-term debt 4,507 737
Total current liabilities 386,067 264,633
Long-term liabilities
Long-term debt-Genesis 251,047 4,544 Long-term debt 601,720 675,786 Asset retirement obligations 43,352 38,954 Deferred revenue — Genesis 19,957 24,424 Deferred tax liability 433,210 347,370 Other 14,253 10,988
Total long-term liabilities 1,363,539 1,102,066
Commitments and contingencies (Note 11) Stockholders’ equity
Preferred stock, $.001 par value, 25,000,000 shares authorized; none issued and outstanding — — Common stock, $.001 par value, 600,000,000 shares authorized; 248,005,874 and 245,386,951 shares
issued at December 31, 2008 and 2007, respectively 248 245 Paid-in capital in excess of par 707,702 662,698 Retained earnings 1,139,575 751,179 Accumulated other comprehensive loss (627 ) (1,591 ) Treasury stock, at cost, 446,287 and 637,795 shares at December 31, 2008 and 2007, respectively (6,830 ) (8,153 )
Total stockholders’ equity 1,840,068 1,404,378
Total liabilities and stockholders’ equity $ 3,589,674 $ 2,771,077


Table of Contents
Denbury Resources Inc. Consolidated Statements of Operations
See accompanying Notes to Consolidated Financial Statements.
61
(In thousands, except per share data) Year Ended December 31, 2008 2007 2006 Revenues and other income
Oil, natural gas and related product sales $ 1,347,010 $ 952,788 $ 716,557 CO 2 sales and transportation fees 13,858 13,630 9,376 Interest income and other 4,834 6,642 5,603
Total revenues 1,365,702 973,060 731,536
Expenses
Lease operating expenses 307,550 230,932 167,271 Production taxes and marketing expenses 55,770 43,130 31,993 Transportation expense — Genesis 7,982 5,961 4,358 CO 2 operating expenses 4,216 4,214 3,190 General and administrative 60,374 48,972 43,014 Interest, net of amounts capitalized of $29,161, $20,385 and $11,333 in 2008, 2007 and
2006, respectively 32,596 30,830 23,575 Depletion, depreciation and amortization 221,792 195,900 149,165 Commodity derivative expense (income) (200,053 ) 18,597 (19,828 ) Abandoned acquisition cost 30,601 — — Write-down of oil and natural gas properties 226,000 — —
Total expenses 746,828 578,536 402,738
Equity in net income (loss) of Genesis 5,354 (1,110 ) 776
Income before income taxes 624,228 393,414 329,574 Income tax provision
Current income taxes 40,812 30,074 19,865 Deferred income taxes 195,020 110,193 107,252
Net income $ 388,396 $ 253,147 $ 202,457
Net income per share — basic $ 1.59 $ 1.05 $ 0.87 Net income per share — diluted $ 1.54 $ 1.00 $ 0.82 Weighted average common shares outstanding
Basic 243,935 240,065 233,101 Diluted 252,530 252,101 247,547

Table of Contents
Denbury Resources Inc. Consolidated Statements of Cash Flows
See accompanying Notes to Consolidated Financial Statements.
62
(In thousands) Year Ended December 31, 2008 2007 2006 Cash flow from operating activities:
Net income $ 388,396 $ 253,147 $ 202,457 Adjustments needed to reconcile to net cash flow provided by operations:
Depreciation, depletion and amortization 221,792 195,900 149,165 Write-down of oil and natural gas properties 226,000 — — Deferred income taxes 195,020 110,193 107,252 Deferred revenue — Genesis (4,466 ) (4,419 ) (4,180 ) Stock based compensation 14,068 10,595 17,246 Non-cash fair value derivative adjustments (257,502 ) 38,952 (25,129 ) Other (3,499 ) 4,149 1,603
Changes in assets and liabilities relating to operations: Accrued production receivable 68,479 (63,886 ) (5,474 ) Trade and other receivables (58,236 ) (10,409 ) 1,712 Derivative assets (15,471 ) — — Other assets 348 (819 ) (672 ) Accounts payable and accrued liabilities 254 1,576 7,038 Oil and gas production payable 1,683 31,906 10,422 Other liabilities (2,347 ) 3,329 370
Net cash provided by operating activities 774,519 570,214 461,810
Cash flow used for investing activities:
Oil and natural gas capital expenditures (591,365 ) (613,659 ) (507,327 ) Acquisitions of oil and gas properties (31,367 ) (49,077 ) (319,000 ) Change in accrual for capital expenditures 59,183 (421 ) 13,195 CO 2 capital expenditures, including pipelines (462,889 ) (171,182 ) (63,586 ) Investment in Genesis (516 ) (47,738 ) — Distributions from Genesis 7,139 — — Net purchases of other assets (23,799 ) (13,672 ) (10,531 ) Net proceeds from sales of oil and gas properties and equipment 51,684 142,667 42,762 Other (2,729 ) (9,431 ) (12,140 )
Net cash used for investing activities (994,659 ) (762,513 ) (856,627 )
Cash flow from financing activities:
Bank repayments (222,000 ) (265,000 ) (249,000 ) Bank borrowings 147,000 281,000 383,000 Income tax benefit from equity awards 19,665 19,181 16,575 Issuance of subordinated debt — 150,750 — Pipeline financing — Genesis 225,252 — — Issuance of common stock 13,972 18,222 139,834 Other (6,787 ) (5,620 ) (6,808 )
Net cash provided by financing activities 177,102 198,533 283,601
Net increase (decrease) in cash and cash equivalents (43,038 ) 6,234 (111,216 ) Cash and cash equivalents at beginning of year 60,107 53,873 165,089
Cash and cash equivalents at end of year $ 17,069 $ 60,107 $ 53,873

Table of Contents
Denbury Resources Inc. Consolidated Statements of Changes in Stockholders’ Equity
See accompanying Notes to Consolidated Financial Statements.
63
Paid-In Accumulated Common Stock Capital in Other Treasury Stock Total ($.001 Par Value) Excess of Retained Comprehensive (at cost) Stockholders' (Dollar amounts in thousands) Shares Amount Par Earnings Income (Loss) Shares Amount Equity Balance — December 31, 2005 115,038,531 $ 115 $ 443,283 $ 295,575 $ — 340,337 $ (5,311 ) $ 733,662 Repurchase of common stock — — — — — 167,255 (5,544 ) (5,544 ) Issued pursuant to employee stock
purchase plan — — 1,245 — — (137,265 ) 2,715 3,960 Issued pursuant to employee stock option
plan 2,012,472 2 11,018 — — — — 11,020 Issued pursuant to directors’
compensation plan 4,441 — 134 — — — — 134 Restricted stock grants 129,987 — — — — — — — Restricted stock grants — forfeited (171,211 ) — — — — — — — Stock based compensation — — 18,941 — — — — 18,941 Income tax benefit from equity awards — — 16,575 — — — — 16,575 Issuance of common stock 3,492,595 4 124,850 — — — — 124,854 Net income — — — 202,457 — — — 202,457
Balance — December 31, 2006 120,506,815 121 616,046 498,032 — 370,327 (8,140 ) 1,106,059
Repurchase of common stock — — — — — 74,130 (2,960 ) (2,960 ) Issued pursuant to employee stock
purchase plan — — 2,099 — — (149,360 ) 2,947 5,046 Issued pursuant to employee stock option
plan 2,071,940 2 13,174 — — — — 13,176 Issued pursuant to directors’
compensation plan 3,981 — 136 — — — — 136 Two-for-one stock split 122,626,451 122 (122 ) — — 342,698 — — Restricted stock grants 198,354 — — — — — — — Restricted stock grants — forfeited (20,590 ) — — — — — — — Stock based compensation — — 12,184 — — — — 12,184 Income tax benefit from equity awards — — 19,181 — — — — 19,181 Derivative contracts, net — — — — (1,591 ) — — (1,591 ) Net income — — — 253,147 — — — 253,147
Balance — December 31, 2007 245,386,951 245 662,698 751,179 (1,591 ) 637,795 (8,153 ) 1,404,378
Repurchase of common stock — — — — — 155,297 (3,762 ) (3,762 ) Issued pursuant to employee stock
purchase plan — — 1,176 — — (346,805 ) 5,085 6,261 Issued pursuant to employee stock option
plan 2,578,563 3 7,708 — — — — 7,711 Issued pursuant to directors’
compensation plan 12,753 — 212 — — — — 212 Restricted stock grants 278,973 — — — — — — — Restricted stock grants — forfeited (251,366 ) — — — — — — — Stock based compensation — — 16,243 — — — — 16,243 Income tax benefit from equity awards — — 19,665 — — — — 19,665 Derivative contracts, net — — — — 964 — — 964 Net income — — — 388,396 — — — 388,396
Balance — December 31, 2008 248,005,874 $ 248 $ 707,702 $ 1,139,575 $ (627 ) 446,287 $ (6,830 ) $ 1,840,068

Table of Contents
Denbury Resources Inc. Consolidated Statements of Comprehensive Income
See accompanying Notes to Consolidated Financial Statements.
64
(In thousands) Year Ended December 31, 2008 2007 2006 Net income $ 388,396 $ 253,147 $ 202,457
Other comprehensive income (loss), net of income tax: Change in fair value of interest rate lock contracts designated as a hedge, net of tax of
$49, ($1,017) and $-, respectively 12 (1,591 ) — Interest rate lock derivative contracts reclassified to income, net of taxes of $583 952 — —
Comprehensive income $ 389,360 $ 251,556 $ 202,457
Table of Contents
Denbury Resources Inc. Notes to Consolidated Financial Statements
Note 1. Significant Accounting Policies
Organization and Nature of Operations
Denbury Resources Inc. is a Delaware corporation, organized under Delaware General Corporation Law, engaged in the acquisition, development, operation and exploration of oil and natural gas properties. We have one primary business segment, which is the exploration, development and production of oil and natural gas in the U.S. Gulf Coast region. We also own the rights to a natural source of carbon dioxide (“CO 2 ”) reserves that we use for injection in our tertiary oil recovery operations. We also sell some of the CO 2 we produce to Genesis Energy, L.P. (“Genesis”) (see Note 3) and to third party industrial users.
Principles of Reporting and Consolidation
The consolidated financial statements herein have been prepared in accordance with generally accepted accounting principles (“GAAP”) and include the accounts of Denbury and its subsidiaries, all of which are wholly owned. A Denbury subsidiary, Genesis Energy, LLC is the general partner of, and together with Denbury’s other subsidiaries, owns an aggregate 12% interest in Genesis, a publicly traded master limited partnership. We account for our 12% ownership interest in Genesis under the equity method of accounting. Even though we have significant influence over the limited partnership in our role as general partner, because our control is limited by the Genesis limited partnership agreement we do not consolidate Genesis. See Note 3 for more information regarding our related party transactions with Genesis. All material intercompany balances and transactions have been eliminated. We have evaluated our consolidation of variable interest entities in accordance with FASB Interpretation No. 46, “Consolidation of Variable Interest Entities,” and have concluded that we do not have any variable interest entities that would require consolidation.
Stock Split
On November 19, 2007, stockholders of Denbury Resources Inc. approved an amendment to our Restated Certificate of Incorporation to increase the number of shares of our authorized common stock from 250,000,000 shares to 600,000,000 shares and to split our common stock on a 2-for-1 basis. Stockholders of record on December 5, 2007, received one additional share of Denbury common stock for each share of common stock held at that time.
Information pertaining to shares and earnings per share has been retroactively adjusted in the accompanying financial statements and related notes thereto to reflect the stock split, except for the share amounts included on our Consolidated Balance Sheets and Consolidated Statements of Changes in Stockholders’ Equity, which reflect the actual shares outstanding at each period end.
Oil and Natural Gas Operations
Capitalized Costs . We follow the full cost method of accounting for oil and natural gas properties. Under this method, all costs related to acquisitions, exploration and development of oil and natural gas reserves are capitalized and accumulated in a single cost center representing our activities, which are undertaken exclusively in the United States. Such costs include lease acquisition costs, geological and geophysical expenditures, lease rentals on undeveloped properties, costs of drilling both productive and non-productive wells, capitalized interest on qualifying projects, and general and administrative expenses directly related to exploration and development activities, and do not include any costs related to production, general corporate overhead or similar activities. Proceeds received from disposals are credited against accumulated costs except when the sale represents a significant disposal of reserves, in which case a gain or loss is recognized.
Depletion and Depreciation . The costs capitalized, including production equipment and future development costs, are depleted or depreciated on the unit-of-production method, based on proved oil and natural gas reserves as determined by independent petroleum engineers. Oil and natural gas reserves are converted to equivalent units based upon the relative energy content, which is six thousand cubic feet of natural gas to one barrel of crude oil. The depletion and depreciation rate per BOE associated with our oil and gas producing activities was $12.54 in 2008, $11.60 in 2007 and $10.54 in 2006.
Asset Retirement Obligations . In general, our future asset retirement obligations relate to future costs associated with plugging and abandonment of our oil, natural gas and CO 2 wells, removal of equipment and facilities from
65

Table of Contents
Denbury Resources Inc. Notes to Consolidated Financial Statements
leased acreage, and returning such land to its original condition. The fair value of a liability for an asset retirement obligation is recorded in the period in which it is incurred, discounted to its present value using our credit adjusted risk-free interest rate, and a corresponding amount capitalized by increasing the carrying amount of the related long-lived asset. The liability is accreted each period, and the capitalized cost is depreciated over the useful life of the related asset. Revisions to estimated retirement obligations will result in an adjustment to the related capitalized asset and corresponding liability. If the liability is settled for an amount other than the recorded amount, the difference is recorded to the full cost pool, unless significant. See Note 4 for more information regarding our asset retirement obligations.
Ceiling Test. The net capitalized costs of oil and natural gas properties are limited to the lower of unamortized cost or the cost center ceiling. The cost center ceiling is defined as the sum of (i) the present value of estimated future net revenues from proved reserves before future abandonment costs (discounted at 10%), based on unescalated period-end oil and natural gas prices; (ii) plus the cost of properties not being amortized; (iii) plus the lower of cost or estimated fair value of unproved properties included in the costs being amortized, if any; (iv) less related income tax effects. We include that portion of net capitalized costs of CO 2 assets and CO 2 pipelines that are required for our current proved tertiary reserves in the net capitalized costs subject to the ceiling test. The cost center ceiling test is prepared quarterly.
Joint Interest Operations. Substantially all of our oil and natural gas exploration and production activities are conducted jointly with others. These financial statements reflect only Denbury’s proportionate interest in such activities, and any amounts due from other partners are included in trade receivables.
Proved Reserves. See Note 15, “Supplemental Oil and Natural Gas Disclosures (Unaudited)” for information on our proved oil and natural gas reserves and the basis on which they are recorded.
Tertiary Injection Costs. Our tertiary operations are conducted in reservoirs that have already produced significant amounts of oil over many years; however, in accordance with the rules for recording proved reserves, we cannot recognize proved reserves associated with enhanced recovery techniques, such as CO 2 injection, until there is a production response to the injected CO 2 or, unless the field is analogous to an existing flood. Our costs associated with the CO 2 we produce (or acquire) and inject are principally our costs of production, transportation and acquisition, and to pay royalties.
Prior to January 1, 2008, we expensed currently all costs associated with injecting CO 2 that we use in our tertiary recovery operations, even though some of these costs were incurred prior to any tertiary related oil production. Commencing January 1, 2008, we began capitalizing, as a development cost, injection costs in fields that are in their development stage, which means we have not yet seen incremental oil production due to the CO 2 injections (i.e. a production response). These capitalized development costs will be included in our unevaluated property costs within our full cost pool if there are not already proved tertiary reserves in that field. After we see a production response to the CO 2 injections (i.e. the production stage), injection costs will be expensed as incurred and any previously deferred unevaluated development costs will become subject to depletion upon recognition of proved tertiary reserves. Based upon the status of some of our tertiary floods, during 2008 this change in accounting caused us to capitalize certain costs that we historically expensed. During 2008, we capitalized $10.4 million of tertiary injection costs associated with our tertiary projects that we would have previously expensed. Had the new method of accounting for tertiary injection costs been used in periods prior to January 1, 2008, the effect on our financial statements would have been immaterial for all periods presented.
Property and Equipment — Other
Other property and equipment, which includes furniture and fixtures, vehicles, computer equipment and software, and capitalized leases, is depreciated principally on a straight-line basis over estimated useful lives. Estimated useful lives are generally as follows: vehicles and furniture and fixtures — 5 to 10 years; and computer equipment and software — 3 to 5 years.
Leased property meeting certain capital lease criteria is capitalized, and the present value of the related lease payments is recorded as a liability. Amortization of capitalized leased assets is computed using the straight-line method over the shorter of the estimated useful life or the initial lease term.
66

Table of Contents
Denbury Resources Inc. Notes to Consolidated Financial Statements
Revenue Recognition
Revenue is recognized at the time oil and natural gas is produced and sold. Any amounts due from purchasers of oil and natural gas are included in accrued production receivable.
We follow the sales method of accounting for our oil and natural gas revenue, whereby we recognize revenue on all oil or natural gas sold to our purchasers regardless of whether the sales are proportionate to our ownership in the property. A receivable or liability is recognized only to the extent that we have an imbalance on a specific property greater than the expected remaining proved reserves. As of December 31, 2008 and 2007, our aggregate oil and natural gas imbalances were not material to our consolidated financial statements.
We recognize revenue and expenses of purchased producing properties at the time we assume effective control, commencing from either the closing or purchase agreement date, depending on the underlying terms and agreements. We follow the same methodology in reverse when we sell properties by recognizing revenue and expenses of the sold properties until either the closing or purchase agreement date, depending on the underlying terms and agreements.
Derivative Instruments and Hedging Activities
We utilize oil and natural gas derivative contracts to mitigate our exposure to commodity price risk associated with our future oil and natural gas production. These derivative contracts have historically consisted of options, in the form of price floors or collars, and fixed price swaps. We have also used interest rate lock contracts to mitigate our exposure to interest rate fluctuations related to sale-leaseback financing of certain equipment used at our oilfield facilities. Our derivative financial instruments are recorded on the balance sheet as either an asset or a liability measured at fair value. We do not apply hedge accounting to our oil and natural gas derivative contracts and accordingly the changes in the fair value of these instruments are recognized in income in the period of change. See Note 10 for further information on our derivative contracts.
Financial Instruments with Off-Balance-Sheet Risk and Concentrations of Credit Risk
Our financial instruments that are exposed to concentrations of credit risk consist primarily of cash equivalents, trade and accrued production receivables, and the derivative instruments discussed above. Our cash equivalents represent high-quality securities placed with various investment-grade institutions. This investment practice limits our exposure to concentrations of credit risk. Our trade and accrued production receivables are dispersed among various customers and purchasers; therefore, concentrations of credit risk are limited. Also, most of our significant purchasers are large companies with excellent credit ratings. If customers are considered a credit risk, letters of credit are the primary security obtained to support lines of credit. We attempt to minimize our credit risk exposure to the counterparties of our oil and natural gas derivative contracts through formal credit policies, monitoring procedures and diversification. There are no margin requirements with the counterparties of our derivative contracts.
CO 2 Operations
We own and produce CO 2 reserves that are used for our own tertiary oil recovery operations, and in addition, we sell a portion to Genesis and to other third party industrial users. We record revenue from our sales of CO 2 to third parties when it is produced and sold. CO 2 used for our own tertiary oil recovery operations is not recorded as revenue in the Consolidated Statements of Operations. Expenses related to the production of CO 2 are allocated between volumes sold to third parties and volumes used for our own use. The expenses related to third party sales are recorded in “CO 2 operating expenses” and the expenses related to our own uses are recorded in “Lease operating expenses” in the Consolidated Statements of Operations or, effective January 1, 2008, are capitalized as oil and gas properties in our Consolidated Balance Sheets, depending on the status of floods that receive the CO 2 (see “Tertiary Injection Costs” on page 66 for further discussion). We capitalize acquisitions and the costs of exploring and developing CO 2 reserves. The costs capitalized are depleted or depreciated on the unit-of-production method, based on proved CO 2 reserves as determined by independent engineers. To evaluate our CO 2 assets for impairment, we determine the CO 2 required for our proved tertiary reserves and include the estimated net capitalized costs of those CO 2 assets in the oil and natural gas ceiling test. The remaining net capitalized CO 2 asset cost is evaluated for impairment by comparing our expected future revenues from these assets to their net carrying value.
67

Table of Contents
Denbury Resources Inc. Notes to Consolidated Financial Statements
CO 2 Pipelines
CO 2 pipelines are used for transportation of CO 2 to our tertiary floods from our CO 2 source field located near Jackson, Mississippi. We are continuing expansion of our CO 2 pipeline infrastructure with several pipelines currently under construction. At December 31, 2008 and 2007, we had $402.0 million and $106.2 million of costs, respectively, related to construction in progress, recorded under “CO 2 properties, equipment and pipelines” in our Consolidated Balance Sheets. These costs of CO 2 pipelines under construction were not being depreciated at December 31, 2008 or December 31, 2007. Depreciation will commence when the pipelines are placed into service. Each pipeline is depreciated on a straight-line basis over its estimated useful life. We include the net capitalized cost of the pipelines which provide CO 2 to the tertiary floods that have proved tertiary reserves, in the oil and natural gas ceiling test.
Cash Equivalents
We consider all highly liquid investments to be cash equivalents if they have maturities of three months or less at the date of purchase.
Restricted Cash and Investments
At December 31, 2008 and 2007, we had approximately $7.4 million and $9.5 million, respectively, of restricted cash and investments held in escrow accounts for future site reclamation costs. These balances are recorded at cost and are included in “Other assets” in the Consolidated Balance Sheets. The estimated fair market value of these investments at December 31, 2008 and 2007 was approximately the same as amortized cost.
Net Income Per Common Share
Basic net income per common share is computed by dividing the net income attributable to common stockholders by the weighted average number of shares of common stock outstanding during the period. Diluted net income per common share is calculated in the same manner, but also considers the impact to net income and common shares for the potential dilution from stock options, non-vested stock appreciation rights (“SARs”), non-vested restricted stock and any other convertible securities outstanding.
All shares have been adjusted for the 2-for-1 stock split effective December 5, 2007. For each of the three years in the period ended December 31, 2008, there were no adjustments to net income for purposes of calculating basic and diluted net income per common share. In April 2006, we issued 6,985,190 shares (3,492,595 on a pre-split basis) of common stock in a public offering — See Note 8, “Stockholders’ Equity.”
The following is a reconciliation of the weighted average shares used in the basic and diluted net income per common share computations:
The weighted average common shares — basic amount in 2008, 2007 and 2006 excludes 2.2 million, 2.7 million and 2.8 million shares of non-vested restricted stock, respectively, that is subject to future vesting over time. As these restricted shares vest, they will be included in the shares outstanding used to calculate basic net income per common share (although all restricted stock is issued and outstanding upon grant). For purposes of calculating weighted average common shares — diluted, the non-vested restricted stock is included in the computation using the
68
(In thousands) Year Ended December 31, 2008 2007 2006
Weighted average common shares — basic 243,935 240,065 233,101
Potentially dilutive securities: Stock options and SARs 7,102 10,485 12,376 Restricted stock 1,493 1,551 2,070
Weighted average common shares — diluted 252,530 252,101 247,547

Table of Contents
Denbury Resources Inc. Notes to Consolidated Financial Statements
treasury stock method, with the proceeds equal to the average unrecognized compensation during the period, adjusted for any estimated future tax consequences recognized directly in equity. The dilution impact of these shares on our earnings per share calculation may increase in future periods, depending on the market price of our common stock during those periods. Stock options and SARs to purchase approximately 1.1 million shares in 2008, 130,000 shares in 2007 and 256,000 shares in 2006 were outstanding but excluded from the diluted net income per common share calculations, as their exercise prices exceeded the average market price of our common stock during the respective periods; therefore, their inclusion would be anti-dilutive to the calculations.
Stock-Based Compensation
In December 2004, the Financial Accounting Standards Board (“FASB”) issued Statement of Financial Accounting Standard (“SFAS”) No. 123(R), “Share Based Payment,” which is a revision of SFAS No. 123, “Accounting for Stock-Based Compensation.” SFAS No. 123(R) supersedes Accounting Principles Board Opinion 25 (“APB 25”), “Accounting for Stock Issued to Employees,” and amends SFAS No. 95, “Statement of Cash Flows.” Generally, the approach in SFAS No. 123(R) is similar to the approach described in SFAS No. 123. However, SFAS No. 123(R) requires all share-based compensation to employees, including grants of employee stock options, to be recognized in our consolidated financial statements based on estimated fair value.
We adopted SFAS No. 123(R) on January 1, 2006, using the modified prospective application method described in the statement. Under the modified prospective method, effective January 1, 2006, we began to recognize compensation expense for the unvested portion of awards outstanding as of December 31, 2005, over the remaining service periods, and for new awards granted or modified after January 1, 2006. See Note 9 for further discussion regarding our stock compensation plans.
Income Taxes
Income taxes are accounted for using the liability method under which deferred income taxes are recognized for the future tax effects of temporary differences between the financial statement carrying amounts and the tax basis of existing assets and liabilities using the enacted statutory tax rates in effect at year-end. The effect on deferred taxes for a change in tax rates is recognized in income in the period that includes the enactment date. A valuation allowance for deferred tax assets is recorded when it is more likely than not that the benefit from the deferred tax asset will not be realized.
Effective January 1, 2007 we adopted the provisions of FASB Interpretation No. 48 (“FIN 48”), Accounting for Uncertainties in Income Taxes — an interpretation of SFAS No. 109, Accounting for Income Taxes . This interpretation addresses how tax benefits claimed or expected to be claimed on a tax return should be recorded in the financial statements. Under FIN 48, the Company may recognize the tax benefit from an uncertain tax position only if it is more likely than not that the tax position will be sustained on examination by the taxing authorities, based on the technical merits of the position. The tax benefits recognized in the financial statements from such a position should be measured based on the largest benefit that has a greater than fifty percent likelihood of being realized upon ultimate settlement. There was no material impact on our financial statements as the result of our adoption of FIN 48 in 2007. See Note 7, “Income Taxes,” for further information regarding our income taxes and our adoption of FIN 48.
Use of Estimates
The preparation of financial statements in conformity with GAAP requires management to make estimates and assumptions that affect the reported amount of certain assets and liabilities and disclosure of contingent assets and liabilities at the date of the financial statements and the reported amounts of revenues and expenses during each reporting period. Management believes its estimates and assumptions are reasonable; however, such estimates and assumptions are subject to a number of risks and uncertainties that may cause actual results to differ materially from such estimates. Significant estimates underlying these financial statements include (i) the fair value of financial derivative instruments, (ii) the estimated quantities of proved oil and natural gas reserves used to compute depletion of oil and natural gas properties, the related present value of estimated future net cash flows therefrom and ceiling test, (iii) accruals related to oil and gas production and revenues, capital expenditures and lease operating expenses, (iv) the estimated costs and timing of future asset retirement obligations, and (v) estimates made in the calculation of income taxes. While management is not aware of any significant revisions to any of its estimates, there will likely be future revisions to its estimates resulting from matters such as revisions in estimated oil and gas volumes,
69

Table of Contents
Denbury Resources Inc. Notes to Consolidated Financial Statements
changes in ownership interests, payouts, joint venture audits, re-allocations by purchasers or pipelines, or other corrections and adjustments common in the oil and gas industry, many of which require retroactive application. These types of adjustments cannot be currently estimated and will be recorded in the period during which the adjustment occurs.
Reclassifications
Certain prior period amounts have been reclassified to conform with the current year presentation. Such reclassifications had no impact on our reported net income, current assets, total assets, current liabilities, total liabilities or stockholders’ equity.
Recently Adopted Accounting Pronouncement
Fair Value Measurements
During the first quarter of 2008, we adopted SFAS No. 157, “Fair Value Measurements.” SFAS No. 157 defines fair value, establishes a framework for measuring fair value in accordance with United States generally accepted accounting principles, and expands disclosures about fair value measurements. SFAS No. 157 does not require any new fair value measurements, but provides guidance on how to measure fair value by providing a fair value hierarchy used to classify the source of the information. On February 12, 2008, the FASB issued FASB Staff Position (“FSP”) SFAS No. 157-2 which delays the effective date of SFAS No. 157 for all nonfinancial assets and nonfinancial liabilities, except those that are recognized or disclosed at fair value in the financial statements on a recurring basis (at least annually). This FSP partially defers the effective date of SFAS No. 157 to fiscal years beginning after November 15, 2008, and interim periods within those fiscal years for items within the scope of this FSP. This deferral of SFAS No. 157 applies to our asset retirement obligation (“ARO”), which uses fair value measures at the date incurred to determine our liability. We do not expect the adoption of SFAS No. 157 to significantly change the methodology we use to estimate the initial fair value of our ARO.
In October 2008, the FASB issued FSP FAS 157-3, “Determining the Fair Value of a Financial Asset When the Market for That Asset Is Not Active.” FSP FAS 157-3 clarifies the application of SFAS No. 157 in a market that is not active and provides an example to illustrate key considerations in determining the fair value of a financial asset when the market for that financial asset is not active. FSP FAS 157-3 was effective upon issuance, including prior periods for which financial statements had not been issued. Revisions resulting from a change in the valuation technique or its application should be accounted for as a change in accounting estimate following the guidance in FASB Statement No. 154, “Accounting Changes and Error Corrections.” FSP FAS 157-3 was effective for the financial statements included in our quarterly report for the period ended September 30, 2008, but had no impact on our Consolidated Financial Statements.
As defined in SFAS No. 157, fair value is the price that would be received to sell an asset or paid to transfer a liability in an orderly transaction between market participants at the measurement date (exit price). We utilize market data or assumptions that market participants would use in pricing the asset or liability, including assumptions about risk and the risks inherent in the inputs to the valuation technique. These inputs can be readily observable, market corroborated, or generally unobservable. We primarily apply the market approach for recurring fair value measurements and endeavor to utilize the best available information. Accordingly, we utilize valuation techniques that maximize the use of observable inputs and minimize the use of unobservable inputs. We are able to classify fair value balances based on the observability of those inputs. SFAS No. 157 establishes a fair value hierarchy that prioritizes the inputs used to measure fair value. The hierarchy gives the highest priority to unadjusted quoted prices in active markets for identical assets or liabilities (level 1 measurement) and the lowest priority to unobservable inputs (level 3 measurement). The three levels of the fair value hierarchy defined by SFAS No. 157 are as follows:
Level 1 — Quoted prices in active markets for identical assets or liabilities as of the reporting date. During 2008 we had no level 1 recurring measurements.
Level 2 — Pricing inputs are other than quoted prices in active markets included in level 1, which are either directly or indirectly observable as of the reported date. Level 2 includes those financial instruments that are valued using models or other valuation methodologies. These models are primarily industry-standard models that consider various assumptions, including quoted forward prices for commodities, time value, volatility factors, and current market and contractual prices for the underlying instruments, as well as other relevant economic measures. Substantially all of these assumptions are observable in the marketplace throughout the full term of the instrument,
70
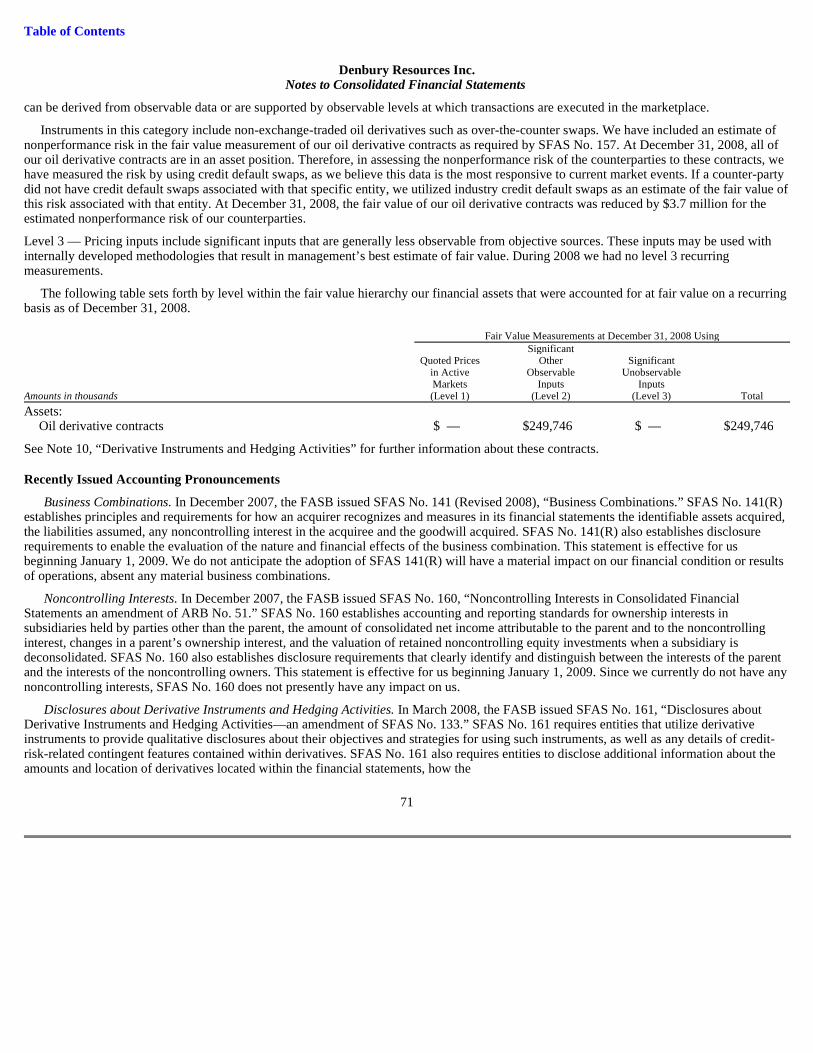
Table of Contents
Denbury Resources Inc. Notes to Consolidated Financial Statements
can be derived from observable data or are supported by observable levels at which transactions are executed in the marketplace.
Instruments in this category include non-exchange-traded oil derivatives such as over-the-counter swaps. We have included an estimate of nonperformance risk in the fair value measurement of our oil derivative contracts as required by SFAS No. 157. At December 31, 2008, all of our oil derivative contracts are in an asset position. Therefore, in assessing the nonperformance risk of the counterparties to these contracts, we have measured the risk by using credit default swaps, as we believe this data is the most responsive to current market events. If a counter-party did not have credit default swaps associated with that specific entity, we utilized industry credit default swaps as an estimate of the fair value of this risk associated with that entity. At December 31, 2008, the fair value of our oil derivative contracts was reduced by $3.7 million for the estimated nonperformance risk of our counterparties.
Level 3 — Pricing inputs include significant inputs that are generally less observable from objective sources. These inputs may be used with internally developed methodologies that result in management’s best estimate of fair value. During 2008 we had no level 3 recurring measurements.
The following table sets forth by level within the fair value hierarchy our financial assets that were accounted for at fair value on a recurring basis as of December 31, 2008.
See Note 10, “Derivative Instruments and Hedging Activities” for further information about these contracts.
Recently Issued Accounting Pronouncements
Business Combinations. In December 2007, the FASB issued SFAS No. 141 (Revised 2008), “Business Combinations.” SFAS No. 141(R) establishes principles and requirements for how an acquirer recognizes and measures in its financial statements the identifiable assets acquired, the liabilities assumed, any noncontrolling interest in the acquiree and the goodwill acquired. SFAS No. 141(R) also establishes disclosure requirements to enable the evaluation of the nature and financial effects of the business combination. This statement is effective for us beginning January 1, 2009. We do not anticipate the adoption of SFAS 141(R) will have a material impact on our financial condition or results of operations, absent any material business combinations.
Noncontrolling Interests. In December 2007, the FASB issued SFAS No. 160, “Noncontrolling Interests in Consolidated Financial Statements an amendment of ARB No. 51.” SFAS No. 160 establishes accounting and reporting standards for ownership interests in subsidiaries held by parties other than the parent, the amount of consolidated net income attributable to the parent and to the noncontrolling interest, changes in a parent’s ownership interest, and the valuation of retained noncontrolling equity investments when a subsidiary is deconsolidated. SFAS No. 160 also establishes disclosure requirements that clearly identify and distinguish between the interests of the parent and the interests of the noncontrolling owners. This statement is effective for us beginning January 1, 2009. Since we currently do not have any noncontrolling interests, SFAS No. 160 does not presently have any impact on us.
Disclosures about Derivative Instruments and Hedging Activities. In March 2008, the FASB issued SFAS No. 161, “Disclosures about Derivative Instruments and Hedging Activities—an amendment of SFAS No. 133.” SFAS No. 161 requires entities that utilize derivative instruments to provide qualitative disclosures about their objectives and strategies for using such instruments, as well as any details of credit-risk-related contingent features contained within derivatives. SFAS No. 161 also requires entities to disclose additional information about the amounts and location of derivatives located within the financial statements, how the
71
Fair Value Measurements at December 31, 2008 Using Significant Quoted Prices Other Significant in Active Observable Unobservable Markets Inputs Inputs Amounts in thousands (Level 1) (Level 2) (Level 3) Total
Assets: Oil derivative contracts $ — $ 249,746 $ — $ 249,746

Table of Contents
Denbury Resources Inc. Notes to Consolidated Financial Statements
provisions of SFAS No. 133 have been applied, and the impact that hedges have on an entity’s financial position, financial performance, and cash flows. SFAS No. 161 is effective for us beginning January 1, 2009. As its only requirement is to enhance disclosures, SFAS No. 161 will not have a significant impact on us.
Modernization of Oil and Gas Reporting. On December 31, 2008, the Securities and Exchange Commission adopted major revisions to its rules governing oil and gas company reporting requirements. These include provisions that permit the use of new technologies to determine proved reserves, and that allow companies to disclose their probable and possible reserves to investors. The current rules limit disclosure to only proved reserves. The new disclosure requirements also require companies that have an audit performed of their reserves to report the independence and qualifications of the auditor of the reserve estimates, and to file reports when a third party reserve engineer is relied upon to prepare reserve estimates. The new rules also require that oil and gas reserves be reported and the full cost ceiling value calculated using an average price based upon the prior 12-month period. The new oil and gas reporting requirements are effective for annual reports on Forms 10-K for fiscal years ending on or after December 31, 2009, with early adoption not permitted. We are currently evaluating the impact the new rules may have on our financial condition or results of operations.
Note 2. Acquisitions and Divestitures
Cancellation of Conroe Field Acquisition
In August 2008, we entered into an agreement with a privately owned company to purchase a 91.4% interest in Conroe Field, a significant potential tertiary flood north of Houston, Texas, for $600 million, plus additional potential consideration if oil prices were to exceed $121 per barrel during the next three years. Closing was provided for in early October 2008. Based on capital market conditions in early October, and a desire to refrain from increasing our leverage in that environment, we cancelled the contract to purchase the Conroe Field, forfeiting a $30 million non-refundable deposit. The $30 million deposit plus miscellaneous acquisition costs of $0.6 million are included in “Abandoned acquisition costs” in our Consolidated Statement of Operations for the year ended December 31, 2008.
Hastings Acquisition
During November 2006, we entered into an agreement with a subsidiary of Venoco, Inc. that gave us an option to purchase their interest in Hastings Field, a strategically significant potential tertiary flood candidate located near Houston, Texas. We exercised the purchase option prior to September 2008, and closed the $201 million acquisition during February 2009. As consideration for the option agreement, we made total payments of $50 million. The deposit and final purchase price will be transferred to oil and natural gas properties in the first quarter of 2009 and will be allocated between proved and unevaluated oil and natural gas properties based on a risk adjusted analysis of the total estimated value of the proved and probable reserves acquired.
The purchase price of $201 million included approximately $4.9 million for certain surface land, oilfield equipment and other related assets. Under the terms of the agreement, Venoco, Inc. the seller, retained a 2% override and reversionary interest of approximately 25% following payout, as defined in the option agreement. The Hastings proved reserves were not included in the Company’s year-end proved reserves. We plan to commence flooding the field with CO 2 beginning in 2011, after completion of our Green CO 2 Pipeline currently under construction and construction of field recycling facilities.
As part of the agreement, we are required to spend an aggregate of approximately $179 million over a five year period to develop the field for tertiary operations (commencing in 2010), with an obligation to commence CO 2 injections in the field by late 2012.
Sale of Louisiana Natural Gas Assets
In October 2007, we entered into an agreement to sell our Louisiana natural gas assets to a privately held company for approximately $180 million (before closing adjustments) plus we retained a net profits interest in one well. In late December 2007, we closed on approximately 70% of that sale with net proceeds of approximately $108.6 million (including estimated final purchase price adjustments). We closed on the remaining portion of the sale in February 2008 and received net proceeds of approximately $48.9 million. The agreement has an effective date of August 1, 2007, and consequently operating net revenue after August 1, net of capital expenditures, along with any other minor closing items were adjustments to the purchase price. The potential net profits interest relates
72

Table of Contents
Denbury Resources Inc. Notes to Consolidated Financial Statements
to a well in the South Chauvin field and is only earned if operating income from that well exceeds certain levels. The operating results of these sold properties are included in our financial statements through the applicable closing dates of the sold properties. We did not record any gain or loss on the sale in accordance with the full cost method of accounting.
2007 Acquisition
On March 30, 2007, Denbury completed the acquisition of the Seabreeze Complex, which is composed of two significant fields and four smaller fields in the general area of Houston, Texas. Two of these fields are future potential CO 2 tertiary flood candidates. Tertiary flooding at these fields is not expected to begin until 2011, following completion of the Green Pipeline from Louisiana to Hastings Field, near Houston, Texas. The adjusted purchase price was approximately $39.4 million, of which $33.9 million was assigned to unevaluated properties.
2006 Acquisitions
On January 31, 2006, we completed an acquisition of three producing oil properties that are future potential CO 2 tertiary oil flood candidates: Tinsley Field approximately 40 miles northwest of Jackson, Mississippi; Citronelle Field in Southwest Alabama, and the smaller South Cypress Creek Field near the Company’s Eucutta Field in Eastern Mississippi. The adjusted purchase price was approximately $250 million (including the $25 million deposited as earnest money as of December 31, 2005), of which $124 million was assigned to unevaluated properties.
During May 2006, we purchased the Delhi Holt-Bryant Unit (“Delhi”) in Northern Louisiana for $50 million, plus a 25% reversionary interest to the seller after we have achieved $200 million in net operating revenue, as defined. Delhi is also a future potential CO 2 tertiary oil flood candidate. Approximately $49 million of the purchase price was assigned to unevaluated properties.
Note 3. Related Party Transactions — Genesis
Interest in and Transactions with Genesis
Denbury’s subsidiary, Genesis Energy, LLC is the general partner of, and together with Denbury’s other subsidiaries, owns an aggregate 12% interest in Genesis, a publicly traded master limited partnership. Genesis’ business is focused on the mid stream segment of the oil and gas industry in the Gulf Coast area of the United States, and its activities include gathering, marketing and transportation of crude oil and natural gas, refinery services, wholesale marketing of CO 2 , and supply and logistic services.
We account for our 12% ownership in Genesis under the equity method of accounting as we have significant influence over the limited partnership; however, our control is limited under the limited partnership agreement and therefore we do not consolidate Genesis. Denbury received cash distributions from Genesis of $7.1 million in 2008, $1.7 million in 2007, and $0.9 million in 2006. We also received $0.2 million in 2008, and $0.1 million in 2007 and 2006, in directors’ fees for certain officers of Denbury that are board members of Genesis. There are no guarantees by Denbury or any of our other subsidiaries of the debt of Genesis or of Genesis Energy, LLC.
On July 25, 2007, Genesis acquired several energy related businesses. Approximately one-half of the acquisition was funded by debt and approximately one-half through the issuance of Genesis common units to the seller. In conjunction with that acquisition, our subsidiary, Genesis Energy, LLC, exercised its right to maintain its pro rata (7.4%) ownership of common units, acquiring 1,074,882 additional common units for approximately $22.4 million, in addition to its capital contribution of an additional $6.2 million, as general partner, to maintain its 2% general partner’s capital interest.
In December 2007, Genesis issued additional common units in a public offering. Our subsidiary, Genesis Energy, LLC, maintained its 2% general partner’s interest and also acquired 734,732 common units in this offering for a total of $20 million, which maintained its same ownership interest of approximately 9.25%.
Our cumulative investments in Genesis of $85.5 million exceeded our percentage of net equity in the limited partnership at the time of acquisition by approximately $15.7 million, which represents goodwill and is not subject to amortization. At December 31, 2008, the balance of our equity investment in Genesis is $80.0 million. Based on
73

Table of Contents
Denbury Resources Inc. Notes to Consolidated Financial Statements
quoted market values of Genesis’ publicly traded limited partnership units at December 31, 2008, the estimated market value of our publicly traded common units of Genesis was approximately $35.2 million. Since the general partner units we hold are not publicly traded, there is not a readily available market value for these units. Due to the capital market conditions during the latter part of 2008, we have reviewed the value of our investment in Genesis as of December 31, 2008 for impairment. Based upon this review, and the current and future expected cash flows of Genesis, we do not believe the investment balance is impaired.
Incentive Compensation Agreement
In late December 2008, our subsidiary, Genesis Energy, LLC, entered into agreements with three members of Genesis’ management for the purpose of providing them incentive compensation. On December 29, 2008, prior to entering these compensation agreements, we converted our subsidiary Genesis Energy, Inc. into Genesis Energy, LLC. The compensation agreements provide Genesis’ management with the ability to earn up to an approximate 17% interest in the incentive distributions that Genesis Energy, LLC will receive from Genesis. These awards have a mandatory redemption feature upon termination of employment that requires a cash payment to be made by Genesis Energy, LLC (guaranteed by us) to the holder of the award. The awards have a graded vesting of 25% per year from the date of the award. The estimated fair value of the mandatory redemption feature of these awards will be recorded as a liability at each reporting date, adjusted for the graded vesting feature and estimated forfeitures, with the changes in this liability recorded as compensation expense in General and administrative expenses in our Consolidated Statement of Operations.
NEJD Pipeline and Free State Pipeline Transactions
On May 30, 2008, we closed on two transactions with Genesis involving our Northeast Jackson Dome (“NEJD”) pipeline system and Free State CO 2 pipeline, which included a long-term transportation service agreement for the Free State pipeline and a 20-year financing lease for the NEJD system. We received from Genesis $225 million in cash and $25 million in Genesis common units. We used the proceeds to repay our outstanding borrowings on our bank credit facility and the balance was used for capital expenditures. We have recorded both of these transactions as financing leases. At December 31, 2008, we have recorded $173.6 million for the NEJD financing and $76.6 million for the Free State financing as debt on our Consolidated Balance Sheet (see Note 6, “Long-term Debt”).
The NEJD pipeline system is a 183-mile, 20” pipeline extending from the Jackson Dome, near Jackson, Mississippi, to near Donaldsonville, Louisiana, and is currently being used by us to transport CO 2 for our tertiary operations in southwest Mississippi. We have the rights to exclusive use of the NEJD pipeline system, we will be responsible for all operations and maintenance on the system, and we will bear and assume all obligations and liabilities with respect to the pipeline. The NEJD financing lease requires us to make quarterly base rent payments beginning August 30, 2008. These quarterly rent payments are fixed at $5.2 million per quarter or approximately $20.7 million per year (prorated for 2008) during the 20-year term, at an interest rate of approximately 10.25% per annum. At the end of the term, Genesis will release its secured interest in the line to us for $1.00. We have the option or obligation upon the occurrence of certain events specified in the financing lease, and may have the obligation if we default, to prepay our financing lease obligations. In the event of significant downgrades of our corporate credit rating by the rating agencies, Genesis can require certain credit enhancements from us, and possibly other remedies under the lease.
The Free State pipeline is an 86-mile, 20” pipeline that extends from our CO 2 source fields at the Jackson Dome, near Jackson, Mississippi, to our oil fields in east Mississippi. Under the terms of the transportation agreement, Genesis is responsible for owning, operating, maintaining and making improvements to the pipeline. We have exclusive use of the pipeline and are required to use the pipeline to supply CO 2 to certain of our tertiary operations in east Mississippi. The Free State transportation agreement requires us to make monthly payments of $100,000 plus a through-put fee based on average daily volumes per month with no minimum volumes required. Based on our forecasted through-put, we currently project that we will initially pay Genesis approximately $9.3 million per annum (prorated for 2008). Approximately $1.5 million (increasing at 1% per year) of the annual payments will be expensed as operating costs, with the remainder recognized as principal and interest expense. The implicit rate on the financing is approximately 13.2% per annum.
Oil Sales and Transportation Services
We utilize Genesis’ trucking services and common carrier pipeline to transport certain of our crude oil production to sales points where it is sold to third party purchasers. We expensed $8.0 million in 2008, $6.0 million in 2007, and $4.4 million in 2006 for these transportation services.
74

Table of Contents
Denbury Resources Inc. Notes to Consolidated Financial Statements
Transportation Leases
We have pipeline transportation agreements with Genesis to transport our crude oil from certain of our fields in Southwest Mississippi, and to transport CO 2 from our main CO 2 pipeline to Brookhaven Field for our tertiary operations. We have accounted for these agreements as capital leases. The pipelines held under these capital leases are classified as property and equipment and are amortized using the straight-line method over the lease terms. Lease amortization is included in depreciation expense. The related obligations are recorded as debt. At December 31, 2008 and 2007, we had $4.5 million and $5.2 million, respectively, of capital lease obligations with Genesis recorded as liabilities in our Consolidated Balance Sheets.
CO 2 Volumetric Production Payments
During 2003 through 2005, we sold 280.5 Bcf of CO 2 to Genesis under three separate volumetric production payment agreements. We have recorded the net proceeds of these volumetric production payment sales as deferred revenue and recognize such revenue as CO 2 is delivered under the volumetric production payments. At December 31, 2008 and 2007, $24.0 million and $28.5 million, respectively, was recorded as deferred revenue of which $4.1 million was included in current liabilities at both December 31, 2008 and 2007. We recognized deferred revenue of $4.5 million, $4.4 million and $4.2 million for the years ended December 31, 2008, 2007 and 2006, respectively, for deliveries under these volumetric production payments. We provide Genesis with certain processing and transportation services in connection with transporting CO 2 to their industrial customers for a fee of approximately $0.19 per Mcf of CO 2 . For these services, we recognized revenues of $5.5 million, $5.2 million and $4.6 million for the years ended December 31, 2008, 2007 and 2006, respectively.
Note 4. Asset Retirement Obligations
In general, our future asset retirement obligations relate to future costs associated with plugging and abandonment of our oil, natural gas and CO 2 wells, removal of equipment and facilities from leased acreage and land restoration. The fair value of a liability for an asset retirement is recorded in the period in which it is incurred, discounted to its present value using our credit adjusted risk-free interest rate, and a corresponding amount capitalized by increasing the carrying amount of the related long-lived asset. The liability is accreted each period, and the capitalized cost is depreciated over the useful life of the related asset.
The following table summarizes the changes in our asset retirement obligations for the years ended December 31, 2008 and 2007.
At December 31, 2008 and 2007, $1.7 million and $2.3 million, respectively, of our asset retirement obligations were classified in “Accounts payable and accrued liabilities” under current liabilities in our Consolidated Balance Sheets. Liabilities sold in 2008 and 2007 were primarily associated with the sale of our Louisiana natural gas properties in December 2007 and February 2008. The reversal of these asset retirement obligations, which were assumed by the purchaser, was recorded as an adjustment to the full cost pool with no gain or loss recognized, in accordance with the full cost method of accounting. Liabilities incurred and assumed during 2008 were primarily for new wells drilled. Liabilities incurred and assumed during 2007 were primarily for properties acquired. We have escrow accounts that are legally restricted for certain of our asset retirement obligations. The balances of these escrow accounts were $7.4 million at December 31, 2008, and $9.5 million at December 31, 2007, and are included in “Other assets” in our Consolidated Balance Sheets.
75
(In thousands) Year Ended December 31, 2008 2007 Beginning asset retirement obligation $ 41,258 $ 41,107
Liabilities incurred and assumed during period 1,382 6,530 Revisions in estimated retirement obligations 4,456 1,165 Liabilities settled during period (4,711 ) (1,302 ) Accretion expense 3,048 2,976 Sales of properties (369 ) (9,218 )
Ending asset retirement obligation $ 45,064 $ 41,258

Table of Contents
Denbury Resources Inc. Notes to Consolidated Financial Statements
Note 5. Property and Equipment
At December 31, 2008 and 2007, we had $402.0 million and $106.2 million of costs, respectively, related to pipelines under construction, and as such, were not being depreciated at December 31, 2008 or December 31, 2007, respectively. Depreciation will commence when the pipelines are placed into service. The Company capitalizes interest on its CO 2 pipelines during the construction period. Interest capitalized on these CO 2 pipelines was $11.5 million in 2008 and $2.1 million in 2007.
Unevaluated Oil and Natural Gas Properties Excluded From Depletion
Under full cost accounting, we may exclude certain unevaluated costs from the amortization base pending determination of whether proved reserves can be assigned to such properties. We allocate the purchase price of oil and natural gas properties we acquire between proved and unevaluated properties based on a risk adjusted analysis of the total estimated value of the proved, probable and possible reserves acquired. The costs classified as unevaluated are transferred to the full cost amortization base as the properties are developed, tested and evaluated. A summary of the unevaluated properties excluded from oil and natural gas properties being amortized at December 31, 2008 and 2007, and the year in which they were incurred follows:
76
(In thousands) December 31, 2008 2007 Oil and natural gas properties
Proved properties $ 3,386,606 $ 2,682,932 Unevaluated properties 235,403 366,518
Total 3,622,009 3,049,450 Accumulated depletion and depreciation (1,481,801 ) (1,081,909 )
Net oil and natural gas properties 2,140,208 1,967,541
CO 2 properties and equipment 377,711 269,335 Accumulated depletion and depreciation (60,758 ) (34,676 )
Net CO 2 properties 316,953 234,659
CO 2 pipelines in service 119,819 61,025 CO 2 pipelines under construction 402,012 106,231 Accumulated depletion and depreciation (16,392 ) (3,340 )
Net CO 2 pipelines 505,439 163,916
Capital leases 9,565 7,985 Accumulated depletion and depreciation (3,333 ) (2,482 )
Net capital leases 6,232 5,503
Other 60,763 42,131 Accumulated depletion and depreciation (27,398 ) (20,875 )
Net other 33,365 21,256
Net property and equipment $ 3,002,197 $ 2,392,875

Table of Contents
Denbury Resources Inc. Notes to Consolidated Financial Statements
Property acquisition costs for 2007 are primarily for CO 2 tertiary oil field candidates acquired in the Seabreeze Complex acquisition, and for 2006 are primarily associated with our acquisitions of three CO 2 tertiary oil field candidates: Citronelle Field, South Cypress Creek Field and Delhi Field. See Note 2, “Acquisitions and Divestitures.” Exploration and development costs are primarily associated with our CO 2
tertiary oil fields that are under development and did not have proved reserves at December 31, 2008. During 2008, we established proved reserves at Tinsley Field, Lockhart Crossing Field and Heidelberg Field and as a result we transferred $284.6 million of costs incurred (as of December 31, 2007 these costs were $197.6 million) on these projects into the amortization base. Costs are transferred into the amortization base on an ongoing basis as the projects are evaluated and proved reserves established or impairment determined. We review the excluded properties for impairment at least annually. We currently estimate that evaluation of most of these properties and the inclusion of their costs in the amortization base is expected to be completed within five years. Until we are able to determine whether there are any proved reserves attributable to the above costs, we are not able to assess the future impact on the amortization rate.
Full Cost Ceiling Test
The Company recognized a write down of its oil and natural gas properties of $226 million under the full cost ceiling test at December 31, 2008. In accordance with the full cost ceiling rules, the ceiling limit is calculated utilizing the unescalated period-end prices, which were a NYMEX WTI oil price per Bbl of $44.60 and a Henry Hub cash price per MMBtu of $5.71. We include the portion of net capitalized cost of CO 2 assets and CO 2 pipelines that are required for our current proved tertiary reserves in the net capitalized costs subject to this ceiling test. The fair value of our oil derivative contracts at December 31, 2008 of $249.7 million, which contracts have a floor price of $75.00 per barrel on 30,000 barrels per day for calendar year 2009, was not included in the ceiling test as we did not designate these contracts as hedge instruments for accounting purposes under SFAS No. 133. Subsequent to December 31, 2008, oil and natural gas prices have continued to be volatile and are currently at levels lower than at year-end 2008. If oil and natural gas prices remain at these lower levels through March 31, 2009, or subsequent periods, we may be required to record additional write-downs under the full cost ceiling test in the first quarter of 2009, or in subsequent periods. The amount of any future write-down is difficult to predict and will depend upon the oil and natural gas prices at the end of each period, the incremental proved reserves that might be added during each period and additional capital spent.
77
(In thousands) December 31, 2008 Costs Incurred During: 2008 2007 2006 Total Property acquisition costs $ 3,520 $ 31,338 $ 72,020 $ 106,878 Exploration and development 74,127 30,439 2,877 107,443 Capitalized interest 12,538 5,963 2,581 21,082
Total $ 90,185 $ 67,740 $ 77,478 $ 235,403
(In thousands) December 31, 2007 Costs Incurred During: 2007 2006 2005 Total Property acquisition costs $ 40,889 $ 184,407 $ 4,567 $ 229,863 Exploration and development 95,246 13,638 23 108,907 Capitalized interest 17,501 10,247 — 27,748
Total $ 153,636 $ 208,292 $ 4,590 $ 366,518

Table of Contents
Denbury Resources Inc. Notes to Consolidated Financial Statements
Note 6. Notes Payable and Long-Term Indebtedness
NEJD Financing and Free State Financing
On May 30, 2008, we closed on two transactions with Genesis involving two of our pipelines. The two transactions have been recorded as financing leases. See Note 3, “Related Party Transactions — Genesis — NEJD Pipeline and Free State Pipeline Transactions.”
7.5% Senior Subordinated Notes due 2015
On April 3, 2007, we issued $150 million of Senior Subordinated Notes due 2015 as an additional issuance under our existing indenture governing our December 2005 sale of $150 million of 7.5% Senior Subordinated Notes due 2015 (collectively, the “2015 Notes”) discussed below. These notes, which carry a coupon rate of 7.5%, were sold at 100.5% of par, which equates to an effective yield to maturity of approximately 7.4%. Net proceeds from the sale were approximately $149.2 million. The net proceeds were used to repay a portion of the outstanding borrowings under our bank credit facility.
The $150 million of 2015 Notes issued on December 21, 2005 were priced at par, and we used the $148.0 million of net proceeds from the offering to fund a portion of the $250 million oil and natural gas property acquisition, which closed in January 2006 (see Note 2, “Acquisitions and Divestitures”). The 2015 Notes mature on December 15, 2015, and interest on the 2015 Notes is payable each June 15 and December 15. We may redeem the 2015 Notes at our option beginning December 15, 2010, at the following redemption prices: 103.75% after December 15, 2010, 102.5% after December 15, 2011, 101.25%, after December 15, 2012, and 100% after December 15, 2013. The indenture contains certain restrictions on our ability to incur additional debt, pay dividends on our common stock, make investments, create liens on our assets, engage in transactions with our affiliates, transfer or sell assets, consolidate or merge, or sell substantially all of our assets. The 2015 Notes are not subject to any sinking fund requirements. All of our significant subsidiaries fully and unconditionally guarantee this debt.
7.5% Senior Subordinated Notes due 2013
On March 25, 2003, we issued $225 million of 7.5% Senior Subordinated Notes due 2013 (“2013 Notes”). The 2013 Notes were priced at 99.135% of par, and we used most of our $218.4 million of net proceeds from the offering, after underwriting and issuance costs, to retire our then existing $200 million of 9% Senior Subordinated Notes due 2008, including the Series B notes.
The 2013 Notes mature on April 1, 2013, and interest on the 2013 Notes is payable each April 1 and October 1. We may redeem the 2013 Notes at our option beginning April 1, 2008, at the following redemption prices: 103.75% after April 1, 2008, 102.5% after April 1, 2009, 101.25% after April 1, 2010, and 100% after April 1, 2011, and thereafter. The indenture contains certain restrictions on our ability to incur additional debt, pay dividends on our common stock, make investments, create liens on our assets, engage in transactions with our affiliates, transfer
78
(In thousands) December 31, 2008 2007 7.5% Senior Subordinated Notes due 2015 $ 300,000 $ 300,000 Premium on Senior Subordinated Notes due 2015 599 685 7.5% Senior Subordinated Notes due 2013 225,000 225,000 Discount on Senior Subordinated Notes due 2013 (826 ) (1,020 ) NEJD financing — Genesis 173,618 — Free State financing — Genesis 76,634 — Senior bank loan 75,000 150,000 Capital lease obligations — Genesis 4,544 5,238 Capital lease obligations 2,705 1,164
Total 857,274 681,067 Less current obligations 4,507 737
Long-term debt and capital lease obligations $ 852,767 $ 680,330

Table of Contents
Denbury Resources Inc. Notes to Consolidated Financial Statements
or sell assets, consolidate or merge, or sell substantially all of our assets. The 2013 Notes are not subject to any sinking fund requirements. All of our significant subsidiaries fully and unconditionally guarantee this debt.
Senior Bank Loan
Effective April 1, 2008, we amended our Sixth Amended and Restated Credit Agreement, the instrument governing our senior bank loan, which increased our borrowing base from $500 million to $1.0 billion. In early October 2008, we further amended our bank credit facility which increased the banks’ commitment amount from $350 million to $750 million and maintained the borrowing base at $1.0 billion. This amendment also (i) allowed us to divest of our Barnett Shale properties, (ii) allowed us to do a tax free like-kind exchange of the Barnett Shale properties for Conroe, Hastings and other fields, (iii) allowed for additional permitted indebtedness of up to $600 million in the form of subordinated or convertible debt, and (iv) modified the commitment fees and pricing grid for the loan, raising the pricing grid by 25 basis points.
With regard to our bank credit facility, the borrowing base represents the amount that can be borrowed from a credit standpoint based on our mortgaged assets, as confirmed by the banks, while the commitment amount is the amount the banks have committed to fund pursuant to the terms of the credit agreement. The banks have the option to participate in any borrowing request by us in excess of the commitment amount ($750 million), up to the borrowing base limit ($1.0 billion), although the banks are not obligated to fund any amount in excess of the commitment amount.
The bank credit facility is secured by substantially all of our producing oil and natural gas properties, and contains several restrictions including, among others: (i) a prohibition on the payment of dividends, (ii) a requirement to maintain positive working capital, as defined, (iii) a minimum interest coverage test, and (iv) a prohibition of most debt and corporate guarantees. Additionally, there is a limitation on the aggregate amount of forecasted production that can be economically hedged with oil or natural gas derivative contracts. We were in compliance with all of our bank covenants as of December 31, 2008. Borrowings under the credit facility are generally in tranches that can have maturities up to one year. Interest on any borrowings is based on the Prime Rate or LIBOR rate plus an applicable margin as determined by the borrowings outstanding. The facility matures in September 2011.
As of December 31, 2008, we had $75.0 million of outstanding borrowings under the facility and $10.5 million in letters of credit secured by the facility. The weighted average interest rate on these outstanding borrowings was 2.95% at December 31, 2008. The next scheduled redetermination of the borrowing base will be as of April 1, 2009, based on December 31, 2008 assets and proved reserves. Our bank debt borrowing base is adjusted at the banks’ discretion and is based in part upon external factors over which we have no control. Although we currently do not anticipate a reduction in our bank borrowing base or commitment amount as of April 1, 2009, if our borrowing base were to be less than our outstanding borrowings under the facility, we will be required to repay the deficit over a period of six months.
In February 2009, we amended our Sixth Amended and Restated Credit Agreement (see Note 14, “Subsequent Events”).
Issuance of 9.75% Senior Subordinated Notes due 2016
On February 13, 2009, we issued $420 million of 9.75% Senior Subordinated Notes due 2016 (see Note 14, “Subsequent Events”).
79

Table of Contents
Denbury Resources Inc. Notes to Consolidated Financial Statements
Indebtedness Repayment Schedule
At December 31, 2008, our indebtedness, excluding the discount and premium on our senior subordinated debt, is repayable over the next five years and thereafter as follows:
Note 7. Income Taxes
Our income tax provision is as follows:
During the third quarter of 2008, we obtained approval from the Internal Revenue Service (“IRS”) to change our method of tax accounting for certain assets used in our tertiary oilfield recovery operations. Previously, we had capitalized and depreciated these costs, but now we can deduct these costs once the assets are placed into service. As a result, we expect to receive tax refunds of approximately $10.6 million for tax years through 2007, along with other tax benefits, and we have reduced our current income tax expense and increased our deferred income tax expense in 2008 to adjust for the impact of this change. This change is not expected to have a significant impact on our overall tax rate; however, it will allow for a quicker deduction of costs for tax purposes.
At December 31, 2008, we had state net operating loss carryforwards totaling $5.0 million and an estimated $44 million of enhanced oil recovery credits to carry forward related to our tertiary operations. Our enhanced oil recovery credits will begin to expire in 2022.
Deferred income taxes relate to temporary differences based on tax laws and statutory rates in effect at the December 31, 2008 and 2007, balance sheet dates. We believe that we will be able to realize all of our deferred tax assets at December 31, 2008, and therefore have provided no valuation allowance against our deferred tax assets.
80
(In thousands)
2009 $ 4,507 2010 5,464 2011 82,634 2012 8,097 2013 233,578 Thereafter 523,221
Total indebtedness $ 857,501
(In thousands) Year Ended December 31, 2008 2007 2006 Current income tax expense:
Federal $ 32,475 $ 21,948 $ 16,033 State 8,337 8,126 3,832
Total current income tax expense 40,812 30,074 19,865
Deferred income tax expense (benefit): Federal 184,630 113,868 97,902 State 10,390 (3,675 ) 9,350
Total deferred income tax expense 195,020 110,193 107,252
Total income tax expense $ 235,832 $ 140,267 $ 127,117

Table of Contents
Denbury Resources Inc. Notes to Consolidated Financial Statements
At December 31, 2008 and 2007, our deferred tax assets and liabilities were as follows:
Our income tax provision varies from the amount that would result from applying the federal statutory income tax rate to income before income taxes as follows:
Uncertain Tax Positions
We adopted the provisions of FIN 48 as of January 1, 2007. As a result of the implementation, we determined that approximately $4.0 million of tax benefits previously recognized were considered uncertain tax positions, as the timing of these deductions may not be sustained upon examination by taxing authorities. As such, upon adoption of FIN 48, we recorded income taxes payable of $4.3 million (including $0.3 million in estimated interest) which was offset by a corresponding reduction of the deferred tax liability of $4.1 million for the tax position that we believe will ultimately be sustained. At December 31, 2008, the total amount of unrecognized tax benefits was $1.0 million, exclusive of interest.
There was no cumulative adjustment made to the opening balance of retained earnings at January 1, 2007. Our uncertain tax positions relate primarily to timing differences, and we do not believe any of such uncertain tax positions will materially impact our effective tax rate in future periods. The amount of unrecognized tax benefits are expected to change over the next 12 months; however, such change is not expected to have a significant impact on our results of operations or financial position.
We file consolidated and separate income tax returns in the U.S. federal jurisdiction and in many state jurisdictions. The Internal Revenue Service concluded its examination of our 2004 tax year during the third quarter of 2007 and concluded its examination of our 2005 tax year during the second quarter of 2008. The state of Mississippi concluded its audit of tax years 1998 through 2000 during the third quarter of 2007 and is currently examining years 2001 through 2004. None of the concluded examinations by the Internal Revenue Service or the state of Mississippi resulted in any material assessments. As a result of the examinations concluded during 2007 and 2008, we decreased our total amount of unrecognized tax benefits from $4.5 million at January 1, 2007 to $3.5 million at December 31, 2007, and to $1.0 million at December 31, 2008. These adjustments all related to temporary timing differences and did not have any impact on our effective tax rate. We have not paid any
81
(In thousands) December 31, 2008 2007 Deferred tax assets:
Loss carryforwards — state $ 152 $ — Tax credit carryover 32,156 15,631 Enhanced oil recovery credit carryforwards 43,772 37,257 Other 13,221 19,950
Total deferred tax assets 89,301 72,838
Deferred tax liabilities: Property and equipment (520,455 ) (406,632 ) Derivative contracts (91,080 ) (868 )
Total deferred tax liabilities (611,535 ) (407,500 )
Total net deferred tax liability $ (522,234 ) $ (334,662 )
(In thousands) Year Ended December 31, 2008 2007 2006 Income tax provision calculated using the federal statutory income tax rate $ 218,479 $ 137,695 $ 115,351 State income taxes 18,865 11,536 13,183 Estimated statutory rate change — (7,351 ) — Other (1,512 ) (1,613 ) (1,417 )
Total income tax expense $ 235,832 $ 140,267 $ 127,117

Table of Contents
Denbury Resources Inc. Notes to Consolidated Financial Statements
significant interest or penalties associated with our income taxes, but classify both interest expense and penalties as part of our income tax expense.
Note 8. Stockholders’ Equity
Authorized
We are authorized to issue 600 million shares of common stock, par value $.001 per share, and 25 million shares of preferred stock, par value $.001 per share. The preferred shares may be issued in one or more series with rights and conditions determined by the Board of Directors.
Stock Split
On November 19, 2007, stockholders of Denbury Resources Inc. approved an amendment to our Restated Certificate of Incorporation to increase the number of shares of our authorized common stock from 250,000,000 shares to 600,000,000 shares and to split our common stock on a 2-for-1 basis. Stockholders of record on December 5, 2007, received one additional share of Denbury common stock for each share of common stock held at that time.
Information pertaining to shares and earnings per share has been retroactively adjusted in the accompanying financial statements and related notes thereto to reflect the stock splits, except for the share amounts included on our Consolidated Balance Sheets and Consolidated Statements of Changes in Stockholders’ Equity, which reflect the actual shares outstanding at each period end.
Stock Issuance
On April 25, 2006, we sold 6,985,190 shares (3,492,595 on a pre-split basis) of common stock in a public offering for $125 million (net to Denbury). We used the net proceeds from the offering to repay then current borrowings under our bank credit facility.
Stock Repurchases
In 2006, 2007 and 2008, all of our share repurchases were from employees of Denbury that delivered shares to the Company to satisfy their minimum tax withholding requirements as provided for under Denbury’s stock compensation plans and were not part of a formal stock repurchase plan.
Employee Stock Purchase Plan
We have an Employee Stock Purchase Plan that is authorized to issue up to 7,400,000 shares of common stock. As of December 31, 2008, there were 432,288 authorized shares remaining to be issued under the plan. In accordance with the plan, eligible employees may contribute up to 10% of their base salary and Denbury matches 75% of their contribution. The combined funds are used to purchase previously unissued Denbury common stock or treasury stock purchased by the Company in the open market for that purpose, in either case, based on the market value of Denbury’s common stock at the end of each quarter. We recognize compensation expense for the 75% company match portion, which totaled $2.7 million, $2.2 million and $1.7 million for the years ended December 31, 2008, 2007 and 2006, respectively. This plan is administered by the Compensation Committee of Denbury’s Board of Directors.
401(k) Plan
Denbury offers a 401(k) Plan to which employees may contribute tax deferred earnings subject to Internal Revenue Service limitations. Effective January 1, 2008, Denbury increased its match to 100% of an employee’s contribution, up to 6% of compensation, as defined by the plan. Previously, up to 3% of an employee’s compensation, was matched by Denbury at 100%, and an employee’s contribution between 3% and 6% of compensation was matched by Denbury at 50%. Denbury’s match is vested immediately. During 2008, 2007 and 2006, Denbury’s matching contributions were approximately $3.3 million, $2.2 million and $1.6 million, respectively, to the 401(k) Plan.
82

Table of Contents
Denbury Resources Inc. Notes to Consolidated Financial Statements
Note 9. Stock Compensation Plans
Stock Incentive Plans
Denbury has two stock compensation plans. The first plan has been in existence since 1995 (the “1995 Plan”) and expired in August 2005 (although options granted under the 1995 Plan prior to that time can remain outstanding for up to 10 years). The 1995 Plan only provided for the issuance of stock options, and in January 2005, we issued stock options under the 1995 Plan that utilized substantially all of the remaining authorized shares. The second plan, the 2004 Omnibus Stock and Incentive Plan (the “2004 Plan”), has a 10-year term and was approved by the stockholders in May 2004. In May 2007, shareholders approved an increase to the number of shares that may be used under our 2004 Plan, from 10.0 million to 14.0 million shares. The 2004 Plan provides for the issuance of incentive and non-qualified stock options, restricted stock awards, stock appreciation rights (“SARs”) settled in stock, and performance awards that may be issued to officers, employees, directors and consultants. Awards covering a total of 14.0 million shares of common stock are authorized for issuance pursuant to the 2004 Plan, of which awards covering no more than 6.7 million shares may be issued in the form of restricted stock or performance vesting awards. At December 31, 2008, a total of 4,165,908 shares were available for future issuance of awards, of which only 1,386,318 shares may be in the form of restricted stock or performance vesting awards.
Denbury has historically granted incentive and non-qualified stock options to its employees. Effective January 1, 2006, we completely replaced the use of stock options for employees with SARs settled in stock, as SARs are less dilutive to our stockholders while providing an employee with essentially the same economic benefits as stock options. The stock options and SARs generally become exercisable over a four-year vesting period with the specific terms of vesting determined at the time of grant based on guidelines established by the Board of Directors. The stock options and SARs expire over terms not to exceed 10 years from the date of grant, 90 days after termination of employment, and 90 days or one year after permanent disability, depending on the plan, or one year after the death of the optionee. The stock options and SARs are granted at the fair market value at the time of grant, which is defined in the 2004 Plan as the closing price on the NYSE on the date of grant. The plan is administered by the Compensation Committee of Denbury’s Board of Directors.
In 2004, Denbury began the use of restricted stock awards for its officers and independent directors, all granted under the 2004 Plan. The holders of these shares have all of the rights and privileges of owning the shares (including voting rights) except that the holders are not entitled to delivery of a portion thereof until certain requirements are met. With respect to the restricted stock granted to officers of Denbury in 2004, the vesting restrictions on those shares are as follows: i) 65% of the awards vest 20% per year over five years, and ii) 35% of the awards vest upon retirement, as defined in the 2004 Plan. On January 30, 2009 the Board of Directors modified the vesting provisions for the 35% of the awards that would vest upon retirement to now vest ratably each January 31 (beginning January 31, 2009) until the final vesting on the retirement eligibility date.
In the second quarter of 2006, our Senior Vice President of Operations departed Denbury. The Board of Directors modified certain of his outstanding long-term equity incentives awarded to him during 2003 and 2004. As a result of the modification, compensation cost of approximately $5.3 million was included in “General and administrative expenses” in the Consolidated Statement of Operations for the year ended December 31, 2006. During the third quarter of 2006, our Vice President of Marketing announced his retirement and departed the Company on August 31, 2006, in connection with which we expensed approximately $750,000 related to options and restricted stock that he held.
Total stock-based compensation expense was $14.1 million, $10.6 million and $17.2 million (including the $5.3 million resulting from modification of equity awards discussed above) for the years ended December 31, 2008, 2007 and 2006, respectively. Part of this expense, $1.4 million in 2008 and $1.5 million in both 2007 and 2006, was included in “Lease operating expenses” for stock compensation expense associated with our field employees, and the remaining amount recognized in “General and administrative expenses” in the Consolidated Statements of Operations. The total income tax benefit recognized in the Consolidated Statements of Operations for share-based compensation arrangements was $5.3 million, $4.1 million and $4.6 million for the years ended December 31, 2008, 2007 and 2006, respectively. Share-based compensation capitalized as part of “Oil and natural gas properties” was $2.2 million, $1.6 million and $1.7 million for the years ended December 31, 2008, 2007 and 2006, respectively. An appropriate portion of stock-based compensation associated with our employees involved in our exploration and drilling activities has been capitalized as part of our “Oil and natural gas properties” in the Consolidated Balance Sheets.
83

Table of Contents
Denbury Resources Inc. Notes to Consolidated Financial Statements
Stock Options and SARs
The fair value of each SAR award is estimated on the date of grant using the Black-Scholes option pricing model with the assumptions noted in the following table. The risk-free rate for periods within the contractual life of the option is based on the U.S. Treasury yield curve in effect at the time of grant. The expected life of stock options and SARs granted was derived from examination of our historical option grants and subsequent exercises. The contractual terms (4-year cliff vesting and 4-year graded vesting) are evaluated separately for the expected life, as the exercise behavior for each is different. Expected volatilities are based on the historical volatility of our stock. Implied volatility was not used in this analysis as our tradable call option terms are short and the trading volume is low. Our dividend yield is zero, as Denbury does not pay a dividend.
The following is a summary of our stock option and SARs activity.
The total intrinsic value of stock options and SARs exercised during the years ended December 31, 2008, 2007 and 2006, was approximately $65.8 million, $60.3 million and $49.3 million, respectively. The total grant-date fair value of stock options and SARs vested during the years ended December 31, 2008, 2007 and 2006, was approximately $7.2 million, $6.8 million and $6.0 million, respectively. The aggregate intrinsic value of stock options and SARs outstanding at December 31, 2008, was approximately $39.8 million, and these options and SARs have a weighted-average remaining contractual life of 5.9 years. The aggregate intrinsic value of options exercisable at December 31, 2008, was approximately $30.6 million, and these stock options and SARs have a weighted-average remaining contractual life of 4.5 years.
84
2008 2007 2006
Weighted average fair value of SARs granted $ 11.91 $ 6.90 $ 6.32 Risk free interest rate 3.29% 4.54% 4.52% Expected life 4.5 to 6.2 years 4.6 to 6.4 years 4.9 to 6.9 years Expected volatility 38.1% 38.3% 41.1% Dividend yield — — —
Year Ended December 31, 2008 2007 2006 Weighted Weighted Weighted Number Average Number Average Number Average of Options Price of Options Price of Options Price
Outstanding at beginning of year 11,463,285 $ 6.28 14,964,920 $ 4.96 18,812,144 $ 4.04 Granted 1,042,810 29.45 873,649 16.34 1,034,310 13.58 Exercised (2,612,134 ) 3.36 (4,054,844 ) 3.44 (4,032,652 ) 2.77 Forfeited (378,962 ) 13.80 (320,440 ) 7.90 (848,882 ) 5.53
Outstanding at end of year 9,514,999 9.32 11,463,285 6.28 14,964,920 4.96
Exercisable at end of year 4,593,407 $ 4.55 3,969,466 $ 3.26 4,739,104 $ 2.66

Table of Contents
Denbury Resources Inc. Notes to Consolidated Financial Statements
A summary of the status of our non-vested stock options and SARs as of December 31, 2008, and the changes during the year ended December 31, 2008, is presented below:
As of December 31, 2008, there was $12.5 million of total compensation cost to be recognized in future periods related to non-vested stock option and SAR share-based compensation arrangements. The cost is expected to be recognized over a weighted-average period of 2.6 years. Cash received from stock option exercises under share-based payment arrangements for the years ended December 31, 2008, 2007 and 2006, was $7.7 million, $13.1 million and $11.1 million, respectively. The tax benefit realized from the exercises of stock options and SARs totaled $18.9 million for 2008, $18.7 million for 2007, and $14.7 million for 2006.
Restricted Stock
As of December 31, 2008, we had issued 4,931,087 shares of restricted stock (net of forfeited shares) pursuant to the 2004 Plan and have recorded deferred compensation expense of $37.5 million, the fair market value of the shares on the grant dates, net of estimated forfeitures of $5.0 million. This expense is amortized over the applicable five-year, four-year, or retirement date vesting periods. As of December 31, 2008, there was $14.5 million of unrecognized compensation expense related to non-vested restricted stock grants. This unrecognized compensation cost is expected to be recognized over a weighted-average period of 4.0 years.
A summary of the status of our non-vested restricted stock grants and the changes during the year ended December 31, 2008, is presented below:
The total vesting date fair value of restricted stock vested during the years ended December 31, 2008, 2007 and 2006 was $12.3 million, $10.7 million and $17.4 million, respectively.
Performance Equity Awards
On January 2, 2007 and January 7, 2008, the Board of Directors awarded performance equity awards to the officers of Denbury. These performance-based shares will vest on March 31, 2010 and 2011, respectively, when the Company’s various financial and operational results for 2009 and 2010 will have been finalized. The number of performance-based shares that will be earned (and eligible to vest) during the performance period will depend on the Company’s level of success in achieving four specifically identified performance targets. Generally, one-half of the shares earnable under the performance-based shares will be earned for performance at the designated target levels (100% target vesting levels) or upon any earlier change of control, and twice the number of shares will be earned if the higher maximum target levels are met. If performance is below designated minimum levels for all performance
85
Weighted Average Grant-Date Non-Vested Stock Options and SARs Shares Fair Value
Non-vested at January 1, 2008 7,493,819 $ 3.45 Granted 1,042,810 11.91 Vested (3,236,075 ) 2.22 Forfeited (378,962 ) 5.83
Non-vested at December 31, 2008 4,921,592 5.87
Weighted Average Grant-Date Non-Vested Restricted Stock Grants Shares Fair Value
Non-vested at January 1, 2008 2,702,448 $ 7.46 Granted 278,973 31.36 Vested (519,372 ) 7.32 Forfeited (251,366 ) 7.43
Non-vested at December 31, 2008 2,210,683 10.52

Table of Contents
Denbury Resources Inc. Notes to Consolidated Financial Statements
targets, no performance-based shares will be earned. Any portion of the performance shares that are not earned by the end of the three year measurement period will be forfeited. In certain change of control events, one-half (i.e. the target level amount) of the performance-based shares would vest.
The aggregate number of performance-based equity awards (at the 100% targeted vesting level, net of forfeitures) granted to the Company’s executive officers as of December 31, 2008, is 191,298 shares. The actual number of shares to be delivered pursuant to the performance-based awards could range from zero to 200% (382,596 shares) of the stated 100% targeted amount. These performance-based share awards have an average grant date fair value of $22.16 per share. The Company recognizes compensation expense when it becomes probable that the performance criteria specified in the plan will be achieved. We currently estimate that the 100% targeted vesting level amount is probable. During the years ended December 31, 2008 and 2007, we recorded $1.2 million and $0.4 million, respectively, of expense in “General and administrative expenses” in our Consolidated Statements of Operations for these performance-based awards.
Note 10. Derivative Instruments and Hedging Activities
Oil and Natural Gas Derivative Contracts
We do not apply hedge accounting treatment to our oil and natural gas derivative contracts and therefore the changes in the fair values of these instruments are recognized in income in the period of change. These fair value changes, along with the cash settlements of expired contracts are shown under “Commodity derivative expense (income)” in our Consolidated Statements of Operations.
From time to time, we enter into various oil and natural gas derivative contracts to provide an economic hedge of our exposure to commodity price risk associated with anticipated future oil and natural gas production. We do not hold or issue derivative financial instruments for trading purposes. These contracts have consisted of price floors, collars and fixed price swaps. Historically, we hedged up to 80% of our anticipated production to provide us with a reasonably certain amount of cash flow to cover most of our budgeted exploration and development expenditures without incurring significant debt. In late 2006, we swapped 80% to 90% of our forecasted 2007 natural gas production at a weighted average price of $7.96 per Mcf, and in September 2007, we swapped 70% to 80% of our remaining forecasted 2008 natural gas production (after the sale of our Louisiana natural gas properties) at a weighted average price of $7.91 per Mcf. We cancelled the December 2008 natural gas swaps in the third quarter of 2008 because of our plans at that time to sell our Barnett Shale properties, receiving approximately $61,000 from the cancellation.
As a result of the current economic conditions and in order to protect our liquidity in the event that commodity prices continue to decline, during early October 2008, we purchased oil derivative contracts for 2009 with a floor price of $75 / Bbl and a ceiling price of $115 / Bbl for total consideration of $15.5 million. These 2009 contracts were entered into with the following counterparties: JPMorgan Chase Bank (10,000 Bbls/d), Wells Fargo Bank (7,500 Bbls/d), Keybank (5,000 Bbls/d), Fortis Energy Marketing and Trading GP (5,000 Bbls/d) and Comerica Bank (2,500 Bbls/d).
All of the mark-to-market valuations used for our oil and natural gas derivatives are provided by external sources and are based on prices that are actively quoted. We manage and control market and counterparty credit risk through established internal control procedures that are reviewed on an ongoing basis. We attempt to minimize credit risk exposure to counterparties through formal credit policies, monitoring procedures and diversification. We have included an estimate of nonperformance risk in the fair value measurement of our oil derivative contracts as required by SFAS No. 157. At December 31, 2008, all of our oil derivative contracts are in an asset position. Therefore, in assessing the nonperformance risk of the counterparties to these contracts, we have measured the risk by using credit default swaps as we believe this data is the most responsive to current market events. If a counter-party did not have credit default swaps associated with that specific entity, we utilized industry credit default swaps as an estimate of the fair value of this risk associated with that entity. At December 31, 2008, the fair value of our oil derivative contracts was reduced by $3.7 million for the estimated nonperformance risk of our counterparties.
86

Table of Contents
Denbury Resources Inc. Notes to Consolidated Financial Statements
The following is a summary of “Commodity derivative income (expense),” included in our Consolidated Statements of Operations:
Oil Derivative Contracts at December 31, 2008:
Interest Rate Lock Derivative Contracts
In January 2007, we entered into interest rate lock contracts to remove our exposure to possible interest rate fluctuations related to our commitment to the sale-leaseback financing of certain equipment for CO 2 recycling facilities at our tertiary oil fields. We applied hedge accounting to these contracts as provided under SFAS No. 133. On June 30, 2008, we settled our remaining interest rate lock contracts for a payment due to the counterparty of approximately $1.6 million. During the second quarter of 2008, we determined that we would not complete the anticipated sale-leaseback transactions which were designated as the forecasted hedged transactions for several of the interest rate lock contracts. As a result, we reclassified the $1.4 million in fair market value changes for these contracts that was in “Accumulated other comprehensive loss” to expense during the second quarter of 2008. We have $0.6 million (net of taxes of $0.4 million) in “Accumulated other comprehensive loss” in our December 31, 2008 Consolidated Balance Sheet. We recognized ineffectiveness totaling $0.1 million as expense in our Consolidated Statement of Operations for the year ended December 31, 2008.
Note 11. Commitments and Contingencies
We have operating leases for the rental of equipment, office space and vehicles that totaled $128.6 million, $143.8 million and $101.4 million as of December 31, 2008, 2007 and 2006, respectively. During the last six years, we entered into lease financing agreements for equipment at certain of our oil and natural gas properties and CO 2 source fields. These lease financings totaled $6.1 million during 2008, $27.1 million during 2007, and $41.1 million during 2006 with associated required monthly payments of $56,000 for the 2008 leases, $257,000 for the 2007 leases, and $431,000 for the 2006 leases. Leases entered into prior to 2006 have seven-year terms, and the leases entered into in 2006, 2007 and 2008 have 10-year terms. Rental expense for operating leases totaled $27.2 million in 2008, $23.4 million in 2007, and $14.1 million in 2006. We have subleased part of the office space where we have operating leases. The cash payments we will receive under these contracts total approximately $1.3 million for 2009 through 2012.
In 2005 and 2006, we entered into three agreements with Genesis to transport crude oil and CO 2 . These agreements are accounted for as capital leases and are discussed in detail in Note 3. In 2008, we entered into two transactions with Genesis involving our NEJD pipeline system and Free State CO 2 pipeline, which included a long-term transportation service agreement for the Free State pipeline and a 20-year financing lease for the NEJD pipeline system. These two transactions are accounted for as financing leases and are discussed in detail in Note 3.
87
(In thousands) Year Ended December 31, 2008 2007 2006 Receipt (payment) on settlements of derivative contracts — oil $ (30,969 ) $ (9,833 ) $ (5,302 ) Receipt (payment) on settlements of derivative contracts — gas (26,584 ) 30,313 — Fair value adjustments to derivative contracts — income (expense) 257,606 (39,077 ) 25,130
Commodity derivative income (expense) $ 200,053 $ (18,597 ) $ 19,828
Crude Oil Contracts: Estimated Fair Value NYMEX Contract Prices Per Bbl Asset at Collar Prices December 31, 2008 Type of Contract and Period Bbls/d Floor Ceiling (In thousands)
Collar Contracts Jan. 2009 - Dec. 2009 30,000 $ 75.00 $ 115.00 $ 249,746

Table of Contents
Denbury Resources Inc. Notes to Consolidated Financial Statements
At December 31, 2008, long-term commitments for these items require the following future minimum rental payments:
Long-term contracts require us to deliver CO 2 to our industrial CO 2 customers at various contracted prices, plus we have a CO 2 delivery obligation to Genesis related to three CO 2 volumetric production payments (“VPPs”) (see Note 3). Based upon the maximum amounts deliverable as stated in the industrial contracts and the volumetric production payments, we estimate that we may be obligated to deliver up to 512 Bcf of CO 2 to these customers over the next 19 years, with a maximum volume required in any given year of approximately 136 MMcf/d. However, since the group as a whole has historically purchased less CO 2 than the maximum allowed in their contracts, based on the current level of deliveries, we project that the amount of CO 2 that we will ultimately be required to deliver will be significantly less than the contractual commitment. Given the size of our proven CO 2 reserves at December 31, 2008 (approximately 5.6 Tcf before deducting approximately 153.8 Bcf for the VPPs with Genesis), our current production capabilities and our projected levels of CO 2 usage for our own tertiary flooding program, we believe that we can meet these contractual delivery obligations.
We currently have long-term commitments to purchase manufactured CO 2 from four proposed gasification plants, two of which are in the Gulf Coast region and two in the Midwest region (Illinois / Kentucky area) of the United States. The Midwest plants are not only conditioned on those specific plants being constructed, but also upon Denbury contracting additional volumes of CO 2 for purchase in the general area of the proposed plants that would provide an acceptable economic return on the CO 2 pipeline that we would need to construct to transport these volumes to our existing CO 2 pipeline system. If all four plants are built, these CO 2 sources are currently anticipated to provide us with aggregate CO 2 volumes of around 1 Bcf/d. Due to the current economic conditions, the earliest we would expect any plant to be completed and provide CO 2 would be 2013, and there is some doubt as to whether they will be constructed at all. The base price of CO 2 per Mcf from these CO 2 sources varies by plant and location, but is generally higher than our most recent all-in cost of CO 2 from our natural sources (Jackson Dome) using current oil prices. Prices for CO 2 delivered from these projects are expected to be competitive with the cost of our natural CO 2
after adjusting for our share of potential carbon emissions reduction credits using estimated futures’ prices of carbon emissions reduction credits. If all four plants are built, the aggregate purchase obligation for this CO 2 would be around $135 million per year, assuming a $50 per barrel oil price, before any potential savings from our share of carbon emissions reduction credits. All of the contracts have price adjustments that fluctuate based on the price of oil. Construction has not yet commenced on any of these plants, and their construction is contingent on the satisfactory resolution of various issues, including financing. While it is likely that not every plant currently under contract will be constructed, there are several other plants under consideration that could provide CO 2 to us that would either supplement or replace the CO 2 volumes from the four proposed plants that we currently have contracts with. We are having ongoing discussions and negotiations with several of these other potential sources. We have invested a total of $13.5 million during 2006, 2007 and 2008 in preferred stock of one of the proposed plants. All of our investment may later be redeemed, with a return, or converted to equity after construction financing for the project has been obtained. We have recorded our investment in this debt security at cost and classified it as held-to-maturity, since we have the intent and ability to hold it until it is redeemed. The investment is included in “Other assets” in our Consolidated Balance Sheets.
88
Pipeline Financing Capital Operating (In thousands) Leases Leases Leases
2009 $ 29,358 $ 2,120 $ 17,938 2010 31,759 1,882 17,351 2011 33,205 1,882 16,571 2012 33,438 1,242 15,199 2013 33,518 700 12,510 Thereafter 427,136 1,393 49,037
Total minimum lease payments 588,414 9,219 $ 128,606
Less: Amount representing interest (338,162 ) (1,970 )
Present value of minimum lease payments $ 250,252 $ 7,249

Table of Contents
Denbury Resources Inc. Notes to Consolidated Financial Statements
Denbury is subject to various possible contingencies that arise primarily from interpretation of federal and state laws and regulations affecting the oil and natural gas industry. Such contingencies include differing interpretations as to the prices at which oil and natural gas sales may be made, the prices at which royalty owners may be paid for production from their leases, environmental issues and other matters. Although management believes that it has complied with the various laws and regulations, administrative rulings and interpretations thereof, adjustments could be required as new interpretations and regulations are issued. In addition, production rates, marketing and environmental matters are subject to regulation by various federal and state agencies.
Litigation
We are involved in various lawsuits, claims and regulatory proceedings incidental to our businesses. While we currently believe that the ultimate outcome of these proceedings, individually and in the aggregate, will not have a material adverse effect on our financial position or overall trends in results of operations or cash flows, litigation is subject to inherent uncertainties. If an unfavorable ruling were to occur, there exists the possibility of a material adverse impact on our net income in the period in which the ruling occurs. We provide accruals for litigation and claims if we determine that a loss is probable and the amount can be reasonably estimated.
Note 12. Supplemental Information
Significant Oil and Natural Gas Purchasers
Oil and natural gas sales are made on a day-to-day basis or under short-term contracts at the current area market price. The loss of any purchaser would not be expected to have a material adverse effect upon our operations. For the year ended December 31, 2008, we had three significant purchasers that each accounted for 10% or more of our oil and natural gas revenues: Marathon Petroleum Company LLC (49%), Hunt Crude Oil Supply Co. (20%) and Crosstex Energy Field Services Inc. (14%). For the year ended December 31, 2007, three purchasers each accounted for 10% or more of our oil and natural gas revenues: Marathon Petroleum Company LLC (43%), Hunt Crude Oil Supply Co. (19%) and Crosstex Energy Field Services Inc. (16%). For the year ended December 31, 2006, we had two significant purchasers that each accounted for 10% or more of our oil and natural gas revenues: Marathon Petroleum Company LLC (28%) and Hunt Crude Oil Supply Co. (18%).
Accounts Payable and Accrued Liabilities
89
(In thousands) December 31, 2008 2007 Accounts payable $ 111,899 $ 59,076 Accrued exploration and development costs 50,571 36,409 Accrued compensation 10,746 10,872 Accrued lease operating expense 10,014 10,114 Accrued interest 6,780 5,716 Taxes payable 6,282 8,103 Asset retirement obligations — current 1,712 2,304 Hastings purchase option — current — 4,709 Other 4,629 10,277
Total $ 202,633 $ 147,580

Table of Contents
Denbury Resources Inc. Notes to Consolidated Financial Statements
Supplemental Cash Flow Information
During 2008, 2007, and 2006 we capitalized $17.6 million, $18.3 million and $11.0 million of interest, respectively, on our significant unevaluated properties, primarily related to our CO 2 tertiary floods without proved reserves. Additionally, we capitalized $11.5 million in 2008, $2.1 million in 2007, and $0.3 million in 2006 of interest relating to the construction of our CO 2 pipelines. In 2008 we received $225 million in cash, and recorded a $25 million non-cash increase to investments in subsidiaries for common limited partnership units received related to two financing leases entered into with Genesis (see Note 3, “Related Party Transactions — Genesis”). In 2008, we issued 278,973 shares of restricted stock with a market value of $8.7 million on the date of grant. In 2007, we issued 367,108 shares of restricted stock with a market value of $6.5 million on the date of grant. In 2006, we issued 259,974 shares of restricted stock with a market value of $3.8 million on the date of grant. See Note 9, “Stock Compensation Plans — Restricted Stock.”
In November 2006, we entered into an agreement for the option to purchase Hastings Field (see Note 2, “Acquisitions and Divestitures”) for an upfront payment of $37.5 million, plus required additional payments totaling $12.5 million during the following two years. In 2006, we accrued the discounted present value of these required additional payments and recorded this amount plus the upfront payment in “Deposits on properties under option or contract” on our December 31, 2006, Consolidated Balance Sheet. The upfront payment of $37.5 million in 2006, along with the additional payments of $7.5 million in 2007 and $5.0 million in 2008, are recorded on our Consolidated Statements of Cash Flow under “Investing Activities.”
Fair Value of Financial Instruments
The fair values of our senior subordinated notes are based on quoted market prices. The carrying value of our Senior Bank Loan is approximately fair value based on the fact that it is subject to short-term floating interest rates that approximate the rates available to us for those periods. We adjusted the estimated fair value measurement of our Senior Bank Loan at December 31, 2008 in accordance with SFAS No. 157 for estimated nonperformance risk. This estimated nonperformance risk totaled approximately $11.0 million and was determined utilizing industry credit default swaps. We have other financial instruments consisting primarily of cash, cash equivalents, short-term receivables and payables that approximate fair value due to the nature of the instrument and the relatively short maturities.
90
(In thousands) Year Ended December 31, 2008 2007 2006
Interest paid, net of amounts capitalized $ 26,997 $ 27,892 $ 21,514 Interest capitalized 29,161 20,385 11,333 Income taxes paid 70,349 10,277 4,210
(In thousands) December 31, 2008 2007 Carrying Estimated Carrying Estimated Amount Fair Value Amount Fair Value
7.5% Senior Subordinated Notes due 2013 $ 224,174 $ 171,000 $ 223,980 $ 227,250 7.5% Senior Subordinated Notes due 2015 300,599 213,000 300,685 303,000 Senior Bank Loan 75,000 64,000 150,000 150,000

Table of Contents
Denbury Resources Inc. Notes to Consolidated Financial Statements
Note 13. Condensed Consolidating Financial Information
Our subordinated debt is fully and unconditionally guaranteed jointly and severally by all of Denbury Resources Inc.’s subsidiaries other than minor subsidiaries, except that with respect to our $225 million of 7.5% Senior Subordinated Notes due 2013, Denbury Resources Inc. and Denbury Onshore, LLC are co-obligors. Except as noted in the foregoing sentence, Denbury Resources Inc. is the sole issuer and Denbury Onshore, LLC is a subsidiary guarantor. The results of our equity interest in Genesis are reflected through the equity method by one of our subsidiaries, Denbury Gathering & Marketing. Each subsidiary guarantor and the subsidiary co-obligor are 100% owned, directly or indirectly, by Denbury Resources Inc. The following is condensed consolidating financial information for Denbury Resources Inc., Denbury Onshore, LLC, and subsidiary guarantors:
Condensed Consolidating Balance Sheets
91
(In thousands) December 31, 2008 Denbury Denbury Resources Inc. Onshore, LLC Denbury (Parent and (Issuer and Guarantor Resources Inc. Co-Obligor) Co-Obligor) Subsidiaries Eliminations Consolidated
Assets Current assets $ 458,051 $ 408,940 $ 14,992 $ (466,784 ) $ 415,199 Property and equipment — 2,973,947 28,250 — 3,002,197 Investment in subsidiaries (equity method) 1,371,347 24,901 1,368,759 (2,685,003 ) 80,004 Other assets 312,239 89,471 899 (310,335 ) 92,274
Total assets $ 2,141,637 $ 3,497,259 $ 1,412,900 $ (3,462,122 ) $ 3,589,674
Liabilities and Stockholders’ Equity
Current liabilities $ 970 $ 810,476 $ 41,405 $ (466,784 ) $ 386,067 Long-term liabilities 300,599 1,373,127 148 (310,335 ) 1,363,539 Stockholders’ equity 1,840,068 1,313,656 1,371,347 (2,685,003 ) 1,840,068
Total liabilities and stockholders’ equity $ 2,141,637 $ 3,497,259 $ 1,412,900 $ (3,462,122 ) $ 3,589,674
(In thousands) December 31, 2007 Denbury Denbury Resources Inc. Onshore, LLC Denbury (Parent and (Issuer and Guarantor Resources Inc. Co-Obligor) Co-Obligor) Subsidiaries Eliminations Consolidated
Assets Current assets $ 430,518 $ 237,273 $ 7,263 $ (434,695 ) $ 240,359 Property and equipment — 2,392,865 10 — 2,392,875 Investment in subsidiaries (equity method) 961,990 — 962,204 (1,867,786 ) 56,408 Other assets 312,556 78,230 818 (310,169 ) 81,435
Total assets $ 1,705,064 $ 2,708,368 $ 970,295 $ (2,612,650 ) $ 2,771,077
Liabilities and Stockholders’ Equity
Current liabilities $ — $ 691,062 $ 8,266 $ (434,695 ) $ 264,633 Long-term liabilities 300,686 1,111,510 39 (310,169 ) 1,102,066 Stockholders’ equity 1,404,378 905,796 961,990 (1,867,786 ) 1,404,378
Total liabilities and stockholders’ equity $ 1,705,064 $ 2,708,368 $ 970,295 $ (2,612,650 ) $ 2,771,077

Table of Contents
Denbury Resources Inc. Notes to Consolidated Financial Statements
Condensed Consolidating Statements of Operations
92
(In thousands) Year Ended December 31, 2008 Denbury Denbury Resources Inc. Onshore, LLC Denbury (Parent and (Issuer and Guarantor Resources Inc. Co-Obligor) Co-Obligor) Subsidiaries Eliminations Consolidated Revenues $ 22,500 $ 1,365,658 $ 44 $ (22,500 ) $ 1,365,702 Expenses 22,982 743,033 3,313 (22,500 ) 746,828
Income (loss) before the following: (482 ) 622,625 (3,269 ) — 618,874 Equity in net earnings of subsidiaries 408,393 666 412,100 (815,805 ) 5,354
Income before income taxes 407,911 623,291 408,831 (815,805 ) 624,228 Income tax provision 19,515 215,879 438 — 235,832
Net income $ 388,396 $ 407,412 $ 408,393 $ (815,805 ) $ 388,396
(In thousands) Year Ended December 31, 2007 Denbury Denbury Resources Inc. Onshore, LLC Denbury (Parent and (Issuer and Guarantor Resources Inc. Co-Obligor) Co-Obligor) Subsidiaries Eliminations Consolidated Revenues $ 19,594 $ 972,992 $ 68 $ (19,594 ) $ 973,060 Expenses 20,046 574,134 3,950 (19,594 ) 578,536
Income (loss) before the following: (452 ) 398,858 (3,882 ) — 394,524 Equity in net earnings of subsidiaries 253,970 — 256,443 (511,523 ) (1,110 )
Income before income taxes 253,518 398,858 252,561 (511,523 ) 393,414 Income tax provision (benefit) 371 141,305 (1,409 ) — 140,267
Net income $ 253,147 $ 257,553 $ 253,970 $ (511,523 ) $ 253,147
(In thousands) Year Ended December 31, 2006 Denbury Denbury Resources Inc. Onshore, LLC Denbury (Parent and (Issuer and Guarantor Resources Inc. Co-Obligor) Co-Obligor) Subsidiaries Eliminations Consolidated Revenues $ 11,219 $ 731,516 $ 20 $ (11,219 ) $ 731,536 Expenses 11,581 400,657 1,719 (11,219 ) 402,738
Income (loss) before the following: (362 ) 330,859 (1,699 ) — 328,798 Equity in net earnings of subsidiaries 202,749 — 204,446 (406,419 ) 776
Income before income taxes 202,387 330,859 202,747 (406,419 ) 329,574 Income tax provision (benefit) (70 ) 127,189 (2 ) — 127,117
Net income $ 202,457 $ 203,670 $ 202,749 $ (406,419 ) $ 202,457

Table of Contents
Denbury Resources Inc. Notes to Consolidated Financial Statements
Condensed Consolidating Statements of Cash Flows
Note 14. Subsequent Events
On February 2, 2009, we completed our purchase of Hastings Field from Venoco, Inc. for approximately $201 million (see Note 2, “Acquisition and Divestitures — Hastings Acquisition”).
On February 13, 2009, we issued $420 million of 9.75% Senior Subordinated Notes due 2016. The notes, which carry a coupon rate of 9.75%, were sold at a discount (92.816% of par), which equates to an effective yield to maturity of approximately 11.25%. The net proceeds of $381.4 million were used to repay most of our outstanding borrowings under our bank credit facility, which increased from the December 31, 2008 balance, primarily associated with the funding of the Hastings acquisitions (see above). In conjunction with this debt offering we
93
(In thousands) Year Ended December 31, 2008 Denbury Denbury Resources Inc. Onshore, LLC Denbury (Parent and (Issuer and Guarantor Resources Inc. Co-Obligor) Co-Obligor) Subsidiaries Eliminations Consolidated Cash flow from operations $ (10 ) $ 776,112 $ (1,583 ) $ — $ 774,519 Cash flow from investing activities (29,874 ) (994,659 ) — 29,874 (994,659 ) Cash flow from financing activities 29,874 177,102 — (29,874 ) 177,102
Net (decrease) in cash (10 ) (41,445 ) (1,583 ) — (43,038 ) Cash, beginning of period 34 58,343 1,730 — 60,107
Cash, end of period $ 24 $ 16,898 $ 147 $ — $ 17,069
(In thousands) Year Ended December 31, 2007 Denbury Denbury Resources Inc. Onshore, LLC Denbury (Parent and (Issuer and Guarantor Resources Inc. Co-Obligor) Co-Obligor) Subsidiaries Eliminations Consolidated Cash flow from operations $ 33 $ 570,098 $ 83 $ — $ 570,214 Cash flow from investing activities (183,204 ) (762,513 ) — 183,204 (762,513 ) Cash flow from financing activities 183,204 198,533 — (183,204 ) 198,533
Net increase in cash 33 6,118 83 — 6,234 Cash, beginning of period 1 52,225 1,647 — 53,873
Cash, end of period $ 34 $ 58,343 $ 1,730 $ — $ 60,107
(In thousands) Year Ended December 31, 2006 Denbury Denbury Resources Inc. Onshore, LLC Denbury (Parent and (Issuer and Guarantor Resources Inc. Co-Obligor) Co-Obligor) Subsidiaries Eliminations Consolidated Cash flow from operations $ — $ 460,841 $ 969 $ — $ 461,810 Cash flow from investing activities (150,864 ) (856,625 ) (2 ) 150,864 (856,627 ) Cash flow from financing activities 150,864 283,601 — (150,864 ) 283,601
Net increase (decrease) in cash — (112,183 ) 967 — (111,216 ) Cash, beginning of period 1 164,408 680 — 165,089
Cash, end of period $ 1 $ 52,225 $ 1,647 $ — $ 53,873

Table of Contents
Denbury Resources Inc. Notes to Consolidated Financial Statements
amended our bank credit facility in early February 2009, which among other things allowed us to issue these senior subordinated notes.
Note 15. Supplemental Oil and Natural Gas Disclosures (Unaudited)
Costs Incurred
The following table summarizes costs incurred and capitalized in oil and natural gas property acquisition, exploration and development activities. Property acquisition costs are those costs incurred to purchase, lease, or otherwise acquire property, including both undeveloped leasehold and the purchase of reserves in place. Exploration costs include costs of identifying areas that may warrant examination and examining specific areas that are considered to have prospects containing oil and natural gas reserves, including costs of drilling exploratory wells, geological and geophysical costs and carrying costs on undeveloped properties. Development costs are incurred to obtain access to proved reserves, including the cost of drilling development wells, and to provide facilities for extracting, treating, gathering and storing the oil and natural gas, and the cost of improved recovery systems.
The Company capitalizes interest on unevaluated oil and gas properties that have on-going development activities. Included in the costs incurred below are capitalized interest of $17.6 million in 2008, $18.3 million in 2007 and $11.0 million in 2006. Costs incurred also include new asset retirement obligations established, as well as changes to asset retirement obligations resulting from revisions in cost estimates or abandonment dates. Asset retirement obligations included in the table below were $5.8 million in 2008, $7.5 million in 2007 and $12.8 million in 2006 (see Note 4, “Asset Retirement Obligations”).
Costs incurred in oil and natural gas activities were as follows:
94
(In thousands) Year Ended December 31, 2008 2007 2006 Property acquisitions:
Proved $ 32,781 $ 15,531 $ 147,655 Unevaluated 16,129 60,079 205,506
Exploration 5,710 42,726 43,564 Development 575,947 553,315 443,866
Total costs incurred (1) $ 630,567 $ 671,651 $ 840,591
(1) Capitalized general and administrative costs that directly relate to exploration and development activities were $12.5 million, $10.3 million and $7.6 million for the years ended December 31, 2008, 2007 and 2006, respectively.

Table of Contents
Denbury Resources Inc. Notes to Consolidated Financial Statements
Oil and Natural Gas Operating Results
Results of operations from oil and natural gas producing activities, excluding corporate overhead and interest costs, were as follows:
Oil and Natural Gas Reserves
Net proved oil and natural gas reserve estimates for all years presented were prepared by DeGolyer and MacNaughton, independent petroleum engineers located in Dallas, Texas. The reserves were prepared in accordance with guidelines established by the Securities and Exchange Commission and, accordingly, were based on existing economic and operating conditions. Oil and natural gas prices in effect as of the reserve report date were used without any escalation. (See “Standardized Measure of Discounted Future Net Cash Flows and Changes Therein Relating to Proved Oil and Natural Gas Reserves” below for a discussion of the effect of the different prices on reserve quantities and values.) Operating costs, production and ad valorem taxes and future development costs were based on current costs with no escalation.
There are numerous uncertainties inherent in estimating quantities of proved reserves and in projecting the future rates of production and timing of development expenditures. The following reserve data represents estimates only and should not be construed as being exact. Moreover, the present values should not be construed as the current market value of our oil and natural gas reserves or the costs that would be incurred to obtain equivalent reserves. All of our reserves are located in the United States.
95
(In thousands, except per BOE data) Year Ended December 31, 2008 2007 2006 Oil, natural gas and related product sales $ 1,347,010 $ 952,788 $ 716,557 Lease operating costs 307,550 230,932 167,271 Production taxes and marketing expenses 63,752 49,091 36,351 Depletion, depreciation and amortization 195,839 177,333 135,269 CO 2 depletion, depreciation and amortization (1) 16,771 9,403 6,281 Write-down of oil and natural gas properties 226,000 — — Commodity derivative expense (income) (200,053 ) 18,597 (19,828 )
Net operating income 737,151 467,432 391,213 Income tax provision 278,643 177,624 151,008
Results of operations from oil and natural gas producing activities $ 458,508 $ 289,808 $ 240,205
Depletion, depreciation and amortization per BOE $ 12.54 $ 11.60 $ 10.54
(1) Represents an allocation of the depletion, depreciation and amortization of our CO 2 properties and pipelines associated with our tertiary oil producing activities.

Table of Contents
Denbury Resources Inc. Notes to Consolidated Financial Statements
Estimated Quantities of Reserves
Standardized Measure of Discounted Future Net Cash Flows and Changes Therein Relating to Proved Oil and Natural Gas Reserves
The Standardized Measure of Discounted Future Net Cash Flows and Changes Therein Relating to Proved Oil and Natural Gas Reserves (“Standardized Measure”) does not purport to present the fair market value of our oil and natural gas properties. An estimate of such value should consider, among other factors, anticipated future prices of oil and natural gas, the probability of recoveries in excess of existing proved reserves, the value of probable reserves and acreage prospects, and perhaps different discount rates. It should be noted that estimates of reserve quantities, especially from new discoveries, are inherently imprecise and subject to substantial revision.
Under the Standardized Measure, future cash inflows were estimated by applying year-end prices to the estimated future production of year-end proved reserves. The product prices used in calculating these reserves have varied widely during the three-year period. These prices have a significant impact on both the quantities and value of the proven reserves as reductions in oil and gas prices can cause wells to reach the end of their economic life much sooner and can make certain proved undeveloped locations uneconomical, both of which reduce the reserves. The following representative oil and natural gas year-end prices were used in the Standardized Measure. These prices were adjusted by field to arrive at the appropriate corporate net price.
Future cash inflows were reduced by estimated future production, development and abandonment costs based on year-end costs to determine pre-tax cash inflows. Future income taxes were computed by applying the statutory tax rate to the excess of pre-tax cash inflows over our tax basis in the associated proved oil and natural gas properties. Tax credits and net operating loss carryforwards were also considered in the future income tax calculation. Future net cash inflows after income taxes were discounted using a 10% annual discount rate to arrive at the Standardized Measure.
96
Year Ended December 31, 2008 2007 2006 Oil Gas Oil Gas Oil Gas (MBbl) (MMcf) (MBbl) (MMcf) (MBbl) (MMcf)
Balance at beginning of year 134,978 358,608 126,185 288,826 106,173 278,367 Revisions of previous estimates 1,348 10,291 (1,601 ) 1,478 4,351 (22,279 ) Revisions due to price changes (13,320 ) (2,915 ) 1,538 (355 ) (2 ) (3,116 ) Extensions and discoveries 5,037 107,020 6,887 131,451 4,587 65,582 Improved recovery (1) 59,317 — 12,376 — 5,044 — Production (11,505 ) (32,736 ) (10,193 ) (35,456 ) (8,372 ) (30,322 ) Acquisition of minerals in place 3,653 79 405 1,935 14,424 643 Sales of minerals in place (382 ) (12,392 ) (619 ) (29,271 ) (20 ) (49 )
Balance at end of year 179,126 427,955 134,978 358,608 126,185 288,826
Proved Developed Reserves:
Balance at beginning of year 97,005 226,271 83,703 176,648 59,640 151,681 Balance at end of year 96,746 298,114 97,005 226,271 83,703 176,648
(1) Improved recovery additions result from the application of secondary recovery methods such as water-flooding or tertiary recovery methods such as CO 2 flooding.
December 31, 2008 2007 2006
Oil (NYMEX) $ 44.60 $ 95.98 $ 61.05 Natural Gas (Henry Hub) 5.71 6.80 5.63
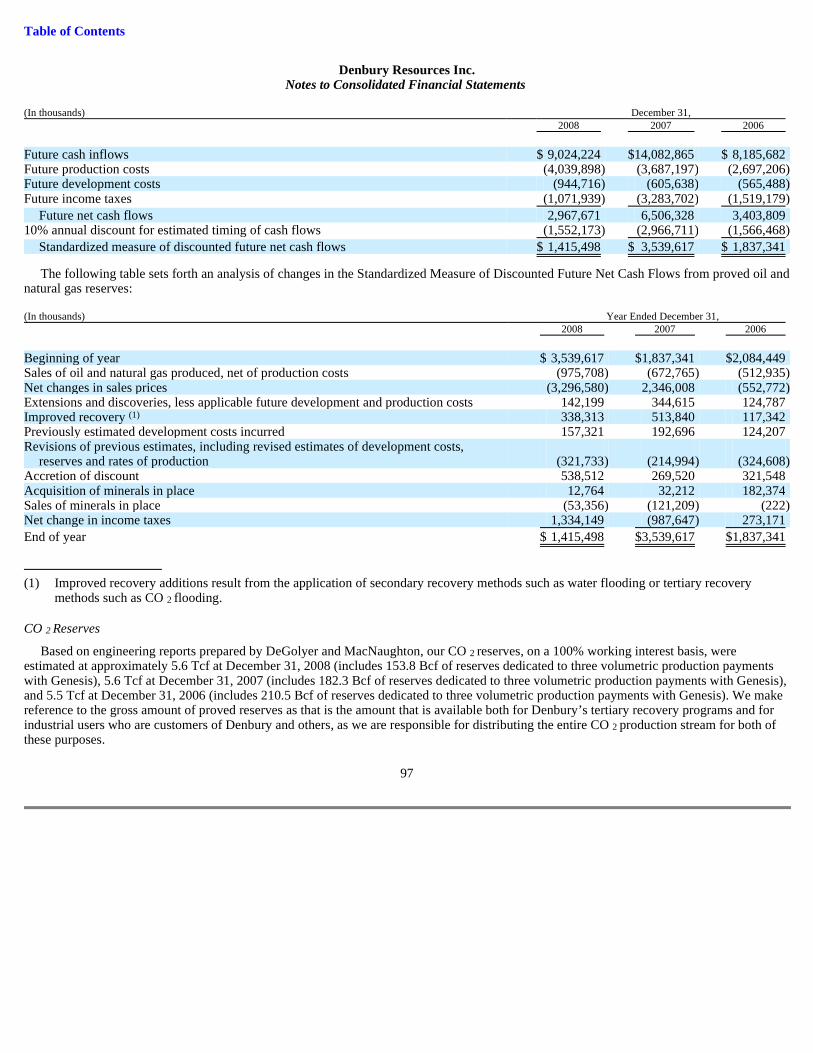
Table of Contents
Denbury Resources Inc. Notes to Consolidated Financial Statements
The following table sets forth an analysis of changes in the Standardized Measure of Discounted Future Net Cash Flows from proved oil and natural gas reserves:
CO 2 Reserves
Based on engineering reports prepared by DeGolyer and MacNaughton, our CO 2 reserves, on a 100% working interest basis, were estimated at approximately 5.6 Tcf at December 31, 2008 (includes 153.8 Bcf of reserves dedicated to three volumetric production payments with Genesis), 5.6 Tcf at December 31, 2007 (includes 182.3 Bcf of reserves dedicated to three volumetric production payments with Genesis), and 5.5 Tcf at December 31, 2006 (includes 210.5 Bcf of reserves dedicated to three volumetric production payments with Genesis). We make reference to the gross amount of proved reserves as that is the amount that is available both for Denbury’s tertiary recovery programs and for industrial users who are customers of Denbury and others, as we are responsible for distributing the entire CO 2 production stream for both of these purposes.
97
(In thousands) December 31, 2008 2007 2006 Future cash inflows $ 9,024,224 $ 14,082,865 $ 8,185,682 Future production costs (4,039,898 ) (3,687,197 ) (2,697,206 ) Future development costs (944,716 ) (605,638 ) (565,488 ) Future income taxes (1,071,939 ) (3,283,702 ) (1,519,179 )
Future net cash flows 2,967,671 6,506,328 3,403,809 10% annual discount for estimated timing of cash flows (1,552,173 ) (2,966,711 ) (1,566,468 )
Standardized measure of discounted future net cash flows $ 1,415,498 $ 3,539,617 $ 1,837,341
(In thousands) Year Ended December 31, 2008 2007 2006 Beginning of year $ 3,539,617 $ 1,837,341 $ 2,084,449 Sales of oil and natural gas produced, net of production costs (975,708 ) (672,765 ) (512,935 ) Net changes in sales prices (3,296,580 ) 2,346,008 (552,772 ) Extensions and discoveries, less applicable future development and production costs 142,199 344,615 124,787 Improved recovery (1) 338,313 513,840 117,342 Previously estimated development costs incurred 157,321 192,696 124,207 Revisions of previous estimates, including revised estimates of development costs,
reserves and rates of production (321,733 ) (214,994 ) (324,608 ) Accretion of discount 538,512 269,520 321,548 Acquisition of minerals in place 12,764 32,212 182,374 Sales of minerals in place (53,356 ) (121,209 ) (222 ) Net change in income taxes 1,334,149 (987,647 ) 273,171
End of year $ 1,415,498 $ 3,539,617 $ 1,837,341
(1) Improved recovery additions result from the application of secondary recovery methods such as water flooding or tertiary recovery methods such as CO 2 flooding.

Table of Contents
Denbury Resources Inc. Notes to Consolidated Financial Statements
Note 16. Unaudited Quarterly Information
98
In thousands, except per share amounts March 31 June 30 September 30 December 31
2008 Revenues $ 317,255 $ 417,049 $ 407,474 $ 223,924 Expenses (1) 201,446 234,310 156,537 154,535 Net income 73,002 114,053 157,548 43,793 Net income per share:
Basic 0.30 0.47 0.64 0.18 Diluted 0.29 0.45 0.63 0.18
Cash flow from operations 206,257 164,072 262,442 141,748 Cash flow used for investing activities (2) (163,688 ) (218,384 ) (235,605 ) (376,982 ) Cash flow provided by (used for) financing activities (3) (28,637 ) 127,282 1,464 76,993 2007 Revenues $ 174,008 $ 222,637 $ 253,336 $ 323,079 Expenses 146,907 120,033 142,296 169,300 Net income 16,616 62,567 67,988 105,976 Net income per share (4) :
Basic 0.07 0.26 0.28 0.44 Diluted 0.07 0.25 0.27 0.42
Cash flow from operations 93,345 102,252 169,214 205,403 Cash flow used for investing activities (2) (215,615 ) (205,404 ) (231,045 ) (110,449 ) Cash flow provided by (used for) financing activities (5) 103,404 100,722 68,668 (74,261 )
(1) Includes commodity derivative expense (income) of $46.8 million in the first quarter, $58.8 million in the second quarter, ($62.0) million in the third quarter and ($243.6) million in the fourth quarter. We had a full cost ceiling write-down of $226 million in the fourth quarter. In addition, during the third quarter we expensed approximately $30 million associated with a non-refundable deposit on a cancelled acquisition.
(2) In December 2007 and February 2008, we received cash proceeds of $108.6 million and $48.9 million, respectively, for the sale of our Louisiana natural gas assets. (See Note 2, “Acquisitions and Divestitures.” )
(3) In the second quarter of 2008, we received $225 million in cash from two financing leases entered into with Genesis (See Note 3, “Related Party Transactions — Genesis.”) Also during 2008, we had net borrowings of $75 million in the fourth quarter, and net payments of $39 million in the first quarter, and $111 million in the second quarter, all under our senior bank loan.
(4) Per share amounts for all periods reflect the impact of a 2-for-1 split on December 5, 2007.
(5) In the second quarter of 2007, we issued $150 million of 7.5% Senior Subordinated Notes due 2015 (See Note 6, “Notes Payable and Long-Term Indebtedness.”) Also during 2007, we had net borrowings of $96 million in the first quarter and $60 million in the third quarter, and net repayments of $60 million in the second quarter and $80 million in the fourth quarter, all under our senior bank loan.

Table of Contents
Denbury Resources Inc.
Item 9. Changes in and Disagreements with Accountants on Accounting and Financial Disclosure
None.
Item 9A. Controls and Procedures
Evaluation of Disclosure Controls and Procedures
As of the end of the period covered by this report, an evaluation of the effectiveness of the design and operation of the Company’s disclosure controls and procedures (as defined in Rule 13a-15(e) under the Exchange Act) was performed under the supervision and with the participation of the Company’s management, including our President and Chief Executive Officer and our Chief Financial Officer. Based on that evaluation, the Company’s President and Chief Executive Officer and our Chief Financial Officer concluded that the Company’s disclosure controls and procedures were effective as of December 31, 2008 to ensure: that information required to be disclosed in the reports it files and submits under the Securities Exchange Act of 1934 is recorded, processed, summarized and reported within the time periods specified in the SEC’s rules and forms; and that information that is required to be disclosed under the Exchange Act is accumulated and communicated to the Company’s management, including our President and Chief Executive Officer and our Chief Financial Officer, as appropriate to allow timely decisions regarding required disclosure.
Evaluation of Changes in Internal Control over Financial Reporting
Under the supervision and with the participation of our management, including our President and Chief Executive Officer and our Chief Financial Officer, we have determined that, during the fourth quarter of fiscal 2008, there were no changes in our internal control over financial reporting that have materially affected, or are reasonably likely to materially affect, our internal control over financial reporting.
Management’s Report on Internal Control over Financial Reporting
Our management is responsible for establishing and maintaining adequate internal control over financial reporting as defined in Rules 13a-15(f) and 15d-15(f) of the Securities Exchange Act of 1934, as amended. Under the supervision and with the participation of our management, including our President and Chief Executive Officer and our Chief Financial Officer, we assessed the effectiveness of our internal control over financial reporting as of the end of the period covered by this report based on the framework in “Internal Control—Integrated Framework” issued by the Committee of Sponsoring Organizations of the Treadway Commission. Based on that assessment, our President and Chief Executive Officer and our Chief Financial Officer concluded that our internal control over financial reporting was effective to provide reasonable assurance regarding the reliability of our financial reporting and the preparation of our financial statements for external purposes in accordance with U.S. generally accepted accounting principles.
The effectiveness of the Company’s internal control over financial reporting as of December 31, 2008, has been audited by PricewaterhouseCoopers LLP, an independent registered public accounting firm, as stated in their report which appears herein.
Important Considerations
The effectiveness of our disclosure controls and procedures and our internal control over financial reporting is subject to various inherent limitations, including cost limitations, judgments used in decision making, assumptions about the likelihood of future events, the soundness of our systems, the possibility of human error, and the risk of fraud. Moreover, projections of any evaluation of effectiveness to future periods are subject to the risk that controls may become inadequate because of changes in conditions and the risk that the degree of compliance with policies or procedures may deteriorate over time. Because of these limitations, there can be no assurance that any system of disclosure controls and procedures or internal control over financial reporting will be successful in preventing all errors or fraud or in making all material information known in a timely manner to the appropriate levels of management.
Item 9B. Other Information
None.
99
Table of Contents
Denbury Resources Inc.
PART III
Item 10. Directors, Executive Officers and Corporate Governance
Except as disclosed below, information as to Item 10 will be set forth in the Proxy Statement (“Proxy Statement”) for the Annual Meeting of Shareholders to be held May 13, 2009, (“Annual Meeting”) and is incorporated herein by reference.
Code of Ethics
We have adopted a Code of Ethics for Senior Financial Officers and the Principal Executive Officer. This Code of Ethics, including any amendments or waivers, is posted on our website at www.denbury.com.
Item 11. Executive Compensation
Information as to Item 11 will be set forth in the Proxy Statement for the Annual Meeting and is incorporated herein by reference.
Item 12. Security Ownership of Certain Beneficial Owners and Management and Related Stockholder Matters
Information as to Item 12 will be set forth in the Proxy Statement for the Annual Meeting and is incorporated herein by reference.
Item 13. Certain Relationships and Related Transactions, and Director Independence
Information as to Item 13 will be set forth in the Proxy Statement for the Annual Meeting and is incorporated herein by reference.
Item 14. Principal Accountant Fees and Services
Information as to Item 14 will be set forth in the Proxy Statement for the Annual Meeting and is incorporated herein by reference.
PART IV
Item 15. Exhibits and Financial Statement Schedules
Financial Statements and Schedules. Financial statements and schedules filed as a part of this report are presented on page 60. All financial statement schedules have been omitted because they are not applicable or the required information is presented in the financial statements or the notes to consolidated financial statements.
Exhibits. The following exhibits are filed as part of this report.
100
Exhibit
No. Exhibit 3(a)
Restated Certificate of Incorporation of Denbury Resources Inc. filed with the Delaware Secretary of State on December 29, 2003 (incorporated by reference as Exhibit 3.1 of our Form 8-K filed December 29, 2003).
3(b)
Certificate of Amendment of Restated Certificate of Incorporation of Denbury Resources Inc. filed with the Delaware Secretary of State on October 20, 2006 (incorporated by reference as Exhibit 3(a) of our Form 10-Q filed November 8, 2005).
3(c)
Certificate of Amendment of Restated Certificate of Incorporation of Denbury Resources Inc. filed with the Delaware Secretary of State on November 21, 2007 (incorporated by reference as Exhibit 3(c) of our Form 10-K filed February 29, 2008).
3(d)
Bylaws of Denbury Resources Inc., a Delaware corporation, adopted December 29, 2003 (incorporated by reference as Exhibit 3.2 of our Form 8-K filed December 29, 2003).

Table of Contents
Denbury Resources Inc.
101
Exhibit
No. Exhibit 4(a)
Indenture for $420 million of 9.75% Senior Subordinated Notes due 2016 among Denbury Resources Inc., certain of its subsidiaries, and The Bank of New York Mellon Trust Company, N.A., as Trustee (incorporated by reference as Exhibit 4.1 of our Form 8-K filed February 17, 2009).
4(b)
Indenture for $150 million of 7.5% Senior Subordinated Notes due 2015 among Denbury Resources Inc., certain of its subsidiaries, and JP Morgan Chase Bank, as trustee (incorporated by reference as Exhibit 4.1 of our Form 8-K filed December 9, 2005).
4(c)
Indenture for $225 million of 7.5% Senior Subordinated Notes due 2013 among Denbury Resources Inc., certain of its subsidiaries and JP Morgan Chase Bank as trustee, dated March 25, 2003 (incorporated by reference as Exhibit 4(a) of our Registration Statement No. 333-105233- 04 on Form S-4, filed May 14, 2003).
4(d)
First Supplemental Indenture for $225 million of 7.5% Senior Subordinated Notes due 2013 dated as of December 29, 2003, among Denbury Resources Inc., certain of its subsidiaries, and the JP Morgan Chase Bank, as trustee (incorporated by reference as Exhibit 4.1 of our Form 8-K filed December 29, 2003).
4(e)
First Supplemental Indenture for $150 million of 7.5% Senior Subordinated Notes due 2015, dated April 3, 2008, between Denbury Resources Inc., as issuer, and The Bank of New York Trust Company, N.A., as Trustee (incorporated by reference as Exhibit 4.1 of our Form 8-K filed April 3, 2007).
10(a)
Sixth Amended and Restated Credit Agreement among Denbury Onshore, LLC, as Borrower, Denbury Resources Inc., as Parent Guarantor and JPMorgan Chase Bank, N.A., as Administrative Agent, and certain other financial institutions, dated September 14, 2007 (incorporated by reference as Exhibit 10.1 of our Form 8-K filed September 19, 2006).
10(b)
First Amendment to Sixth Amended and Restated Credit Agreement among Denbury Onshore, LLC, as Borrower, Denbury Resources Inc., as Parent Guarantor, JPMorgan Chase Bank, N.A., as Administrative Agent and certain other financial institutions effective March 31, 2008 (incorporated by reference as Exhibit 10 of our Form 10-Q for the quarter ended March 31, 2007).
10(c)
Second Amendment to Sixth Amended and Restated Credit Agreement among Denbury Onshore, LLC, as Borrower, Denbury Resources Inc., as Parent Guarantor, JPMorgan Chase Bank, N.A., as Administrative Agent, and certain other financial institutions dated as of October 7, 2008 (incorporated by reference as Exhibit 10(a) of our Form 10-Q for the quarter ended September 30, 2008).
10(d)*
Third Amendment to Sixth Amended and Restated Credit Agreement among Denbury Onshore, LLC, as Borrower, Denbury Resources Inc., as Parent Guarantor, JPMorgan Chase Bank, N.A., as Administrative Agent, and certain other financial institutions dated as of February 6, 2009.
10(e)
Amendment for Increased Borrowing Base from $500 million to $1.0 billion to Sixth Amended and Restated Credit Agreement among Denbury Onshore, LLC, as Borrower, and JPMorgan Chase Bank, N.A., as Administrative Agent, and certain other financial institutions dated as of March 28, 2008 (incorporated by reference as Exhibit 10(a) of our Form 10-Q for the quarter ended March 31, 2008).
10(f)
Option Agreement to Purchase Hasting Field By and Between TexCal Energy South Texas, L.P. and Denbury Onshore, LLC dated November 1, 2006 (incorporated by reference as Exhibit 10(b) of our Form 10-Q for the quarter ended September 30, 2008).
10(g)
First Amendment to Option Agreement, dated as of August 29, 2008, by and between TexCal Energy South Texas, L.P. and Denbury Onshore, LLC (incorporated by reference as Exhibit 10(c) of our Form 10-Q for the quarter ended September 30, 2008).
10(h)
Pipeline Financing Lease Agreement by and between Genesis NEJD Pipeline, LLC as Lessor, and Denbury Onshore, LLC, as Lessee, dated May 30, 2008 (incorporated by reference as Exhibit 99.1 of our Form 8-K filed on June 5, 2008).
10(i)
Transportation Services Agreement by and between Genesis Free State Pipeline, LLC and Denbury Onshore, LLC, dated May 30, 2008 (incorporated by reference as Exhibit 99.2 of our Form 8-K filed on June 5, 2008).
10(j)
**
Denbury Resources Inc. Amended and Restated Stock Option Plan as of December 5, 2007 (incorporated by reference as Exhibit 99.2 of our Form 8-K, filed December 11, 2007).
10(k)
**
Denbury Resources Inc. Stock Purchase Plan, as amended and restated December 5, 2007 (incorporated by reference as Exhibit 99.4 of our Form 8-K, filed December 11, 2007).

Table of Contents
Denbury Resources Inc.
102
Exhibit
No. Exhibit 10(l)
**
Form of indemnification agreement between Denbury Resources Inc. and its officers and directors (incorporated by reference as Exhibit 10 of our Form 10-Q for the quarter ended June 30, 1999).
10(m)
**
Denbury Resources Inc. Directors Compensation Plan (incorporated by reference as Exhibit 4 of our Registration Statement on Form S-8, No. 333-39172, filed June 13, 2000, amended March 2, 2001 and May 11, 2006).
10(n)* ** Denbury Resources Severance Protection Plan, as amended and restated effective December 30, 2008. 10(o)* ** Denbury Resources Inc. 2004 Omnibus Stock and Incentive Plan, as amended and restated effective December 30, 2008. 10(p)
**
2006 Form of stock appreciation rights agreement that vests 100% four years from the date of grant, for grants to employees and officers pursuant to 2004 Omnibus Stock and Incentive Plan for Denbury Resources Inc. (incorporated by reference as Exhibit 10(w) of our Form 10-K for the year ended December 31, 2006).
10(q)
**
2006 Form of stock appreciation rights agreement that cliff vests 100% four years from the date of grant, for grants to directors pursuant to 2004 Omnibus Stock and Incentive Plan for Denbury Resources Inc. (incorporated by reference as Exhibit 10(x) of our Form 10-K for the year ended December 31, 2006).
10(r)
**
2006 Form of restricted stock award that vests 25% per annum, for grants to new employees and officers on their hire date pursuant to 2004 Omnibus and Incentive Plan for Denbury Resources Inc. (incorporated by reference as Exhibit 10(y) of our Form 10-K for the year ended December 31, 2006).
10(s)
**
2006 Form of restricted stock award that cliff vests 100% four years from the date of grant for grants to employees and officers pursuant to 2004 Omnibus Stock and Incentive Plan for Denbury Resources Inc. (incorporated by reference as Exhibit 10(z) of our Form 10-K for the year ended December 31, 2006).
10(t)
**
2007 Form of restricted stock award to officers that cliff vests on March 31, 2010 pursuant to 2004 Omnibus Stock and Incentive Plan for Denbury Resources Inc. (incorporated by reference as Exhibit 10(y) of our Form 10-K for the year ended December 31, 2008).
10(u)
**
2007 Form of performance share awards to officers pursuant to 2004 Omnibus Stock and Incentive Plan for Denbury Resources Inc. (incorporated by reference as Exhibit 10(z) of our Form 10-K for the year Ended December 31, 2007).
10(v)
**
2007 Form of restricted stock award to directors that cliff vests after three years pursuant to 2004 Omnibus Stock and Incentive Plan (incorporated by reference as Exhibit 10(cc) of our Form 10-K for the year ended December 31, 2007).
10(w)
**
2007 Form of restricted stock award to new directors that vest 20% per annum (Incorporated by reference as Exhibit 10(z) of our Form 10-K for the year ended December 31, 2007).
10(x)
**
Form of deferred payment cash award that cliff vests 100% four years from the date of grant for grants to employees and officers (incorporated by reference as exhibit 10(bb) of our Form 10-K for the year ended December 31, 2005).
10(y)
**
2008 Form of restricted stock award to certain officers that cliff vests on March 31, 2011 (incorporated by reference as Exhibit 10(b) of our Form 10-Q for the first quarter ended March 31, 2008).
10(z)
**
2008 Form of restricted stock award without change of control vesting to certain officers that cliff vests on March 31, 2011 (incorporated by reference as Exhibit 10(c) of our Form 10-Q for the first quarter ended March 31, 2008).
10(aa)
**
2008 Form of performance share awards to certain officers with change of control vesting (incorporated by reference as Exhibit 10(d) of our Form 10-Q for the first quarter ended March 31, 2008).
10(bb)
**
2008 Form of performance share awards to certain officers without change of control vesting (incorporated by reference as Exhibit 10(e) of our Form 10-Q for the first quarter ended March 31, 2008).
10(cc)
**
2004 form of restricted stock award that vests 20% per annum, for grants to officers pursuant to 2004 Omnibus Stock and Incentive Plan for Denbury Resources Inc. (incorporated by reference as Exhibit 10(k) of our Form 10-K for the year ended December 31, 2004).
10(dd)
**
2004 form of restricted stock award that vests on retirement, for grants to officers pursuant to 2004 Omnibus Stock and Incentive Plan for Denbury Resources Inc. (incorporated by reference as Exhibit 10(l) of our Form 10-K for the year ended December 31, 2004).
10(ee)
**
2004 form of restricted stock award that vests 20% per annum, for grants to directors pursuant to 2004 Omnibus Stock and Incentive Plan for Denbury Resources Inc. (incorporated by reference as Exhibit 10(m) of our Form 10-K for the year ended December 31, 2004).
21* List of subsidiaries of Denbury Resources Inc. 23(a)* Consent of PricewaterhouseCoopers LLP. 23(b)* Consent of DeGolyer and MacNaughton. 31(a)* Certification of Chief Executive Officer Pursuant to Section 302 of Sarbanes-Oxley Act of 2002. 31(b)* Certification of Chief Financial Officer Pursuant to Section 302 of Sarbanes-Oxley Act of 2002.

Table of Contents
Denbury Resources Inc.
103
Exhibit
No. Exhibit 32*
Certification of Chief Executive Officer and Chief Financial Officer Pursuant to Section 906 of the Sarbanes-Oxley Act of 2002.
99*
The summary of DeGolyer and MacNaughton’s Report as of December 31, 2008, on oil and gas reserves (SEC Case) dated February 6, 2009.
* Filed herewith.
** Compensation arrangements.
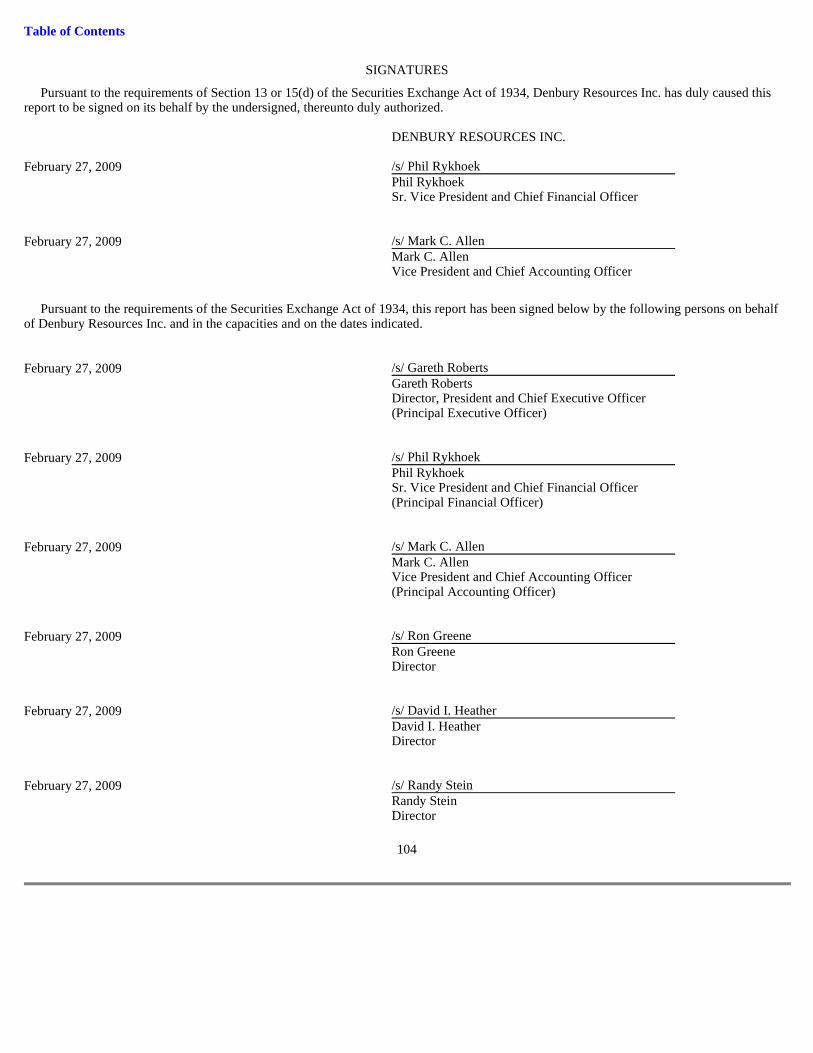
Table of Contents
SIGNATURES
Pursuant to the requirements of Section 13 or 15(d) of the Securities Exchange Act of 1934, Denbury Resources Inc. has duly caused this report to be signed on its behalf by the undersigned, thereunto duly authorized.
Pursuant to the requirements of the Securities Exchange Act of 1934, this report has been signed below by the following persons on behalf of Denbury Resources Inc. and in the capacities and on the dates indicated.
104
DENBURY RESOURCES INC.
February 27, 2009 /s/ Phil Rykhoek Phil Rykhoek Sr. Vice President and Chief Financial Officer February 27, 2009 /s/ Mark C. Allen Mark C. Allen Vice President and Chief Accounting Officer
February 27, 2009 /s/ Gareth Roberts Gareth Roberts
Director, President and Chief Executive Officer (Principal Executive Officer)
February 27, 2009 /s/ Phil Rykhoek Phil Rykhoek
Sr. Vice President and Chief Financial Officer (Principal Financial Officer)
February 27, 2009 /s/ Mark C. Allen Mark C. Allen
Vice President and Chief Accounting Officer (Principal Accounting Officer)
February 27, 2009 /s/ Ron Greene Ron Greene Director February 27, 2009 /s/ David I. Heather David I. Heather Director February 27, 2009 /s/ Randy Stein Randy Stein Director

Table of Contents
105
February 27, 2009 /s/ Wieland Wettstein Wieland Wettstein Director February 27, 2009 /s/ Greg McMichael Greg McMichael Director February 27, 2009 /s/ Michael Beatty Michael Beatty Director February 27, 2009 /s/ Michael Decker Michael Decker Director

Exhibit 10(d)
THIRD AMENDMENT TO SIXTH AMENDED AND RESTATED CREDIT AGREEMENT
This Third Amendment to Sixth Amended and Restated Credit Agreement (this “ Third Amendment ”) is entered into effective as of the 6th day of February, 2009 (the “ Effective Date ”), by and among Denbury Onshore, LLC, a Delaware limited liability company (“ Borrower ”), Denbury Resources Inc., a Delaware corporation (“ Parent ”), JPMorgan Chase Bank, N.A., as Administrative Agent (“ Administrative Agent ”), and the financial institutions parties hereto as Banks (“ Banks ”).
W I T N E S S E T H
WHEREAS, Borrower, Parent, Administrative Agent, the other agents a party thereto and Banks are parties to that certain Sixth Amended and Restated Credit Agreement dated as of September 14, 2006 (as amended, the “ Credit Agreement ”) (unless otherwise defined herein, all terms used herein with their initial letter capitalized shall have the meaning given such terms in the Credit Agreement); and
WHEREAS, pursuant to the Credit Agreement, Banks have made a Revolving Loan to Borrower and provided certain other credit accommodations to Borrower; and
WHEREAS, Parent and Borrower have requested that the Credit Agreement be amended to amend certain terms of the Credit Agreement in certain respects as provided in this Third Amendment; and
WHEREAS, subject to and upon the terms and conditions set forth herein, Banks have agreed to Parent’s and Borrower’s requests.
NOW THEREFORE, for and in consideration of the mutual covenants and agreements herein contained and other good and valuable consideration, the receipt and sufficiency of which are hereby acknowledged and confessed, Parent, Borrower, Administrative Agent and Banks hereby agree as follows:
Section 1. Amendments . In reliance on the representations, warranties, covenants and agreements contained in this Third Amendment, and subject to the satisfaction of the conditions precedent set forth in Section 2 hereof, the Credit Agreement shall be amended effective as of the Effective Date in the manner provided in this Section 1 .
1.1 Additional Definitions . Section 2.1 of the Credit Agreement shall be amended to add thereto in alphabetical order the following definitions which shall read in full as follows:
“ Third Amendment ” means that certain Third Amendment to Sixth Amended and Restated Credit Agreement dated as of February 6, 2009 among Borrower, Parent, Administrative Agent and Banks.

1.2 Amendment to Definitions . The definitions of “ Loan Papers ” and “ Permitted Subordinate Debt ” contained in Section 2.1 of the Credit Agreement shall be amended and restated to read in full as follows:
“ Loan Papers ” means this Agreement, the First Amendment, the Second Amendment, the Third Amendment, the Notes, each Facility Guaranty which may now or hereafter be executed, each Parent Pledge Agreement which may now or hereafter be executed, each Subsidiary Pledge Agreement which may now or hereafter be executed, the Existing Mortgages (as amended by the Amendments to Mortgages), all Mortgages now or at any time hereafter delivered pursuant to Section 6.1 , the Amendments to Mortgages, and all other certificates, documents or instruments delivered in connection with this Agreement, as the foregoing may be amended from time to time.
“ Permitted Subordinate Debt ” means, collectively, (i) Debt of Borrower resulting from a single issue of Borrower’s 7.5% Senior Subordinated Notes Due 2013 in an aggregate outstanding principal balance of not greater than $225,000,000, and which Debt has been assumed by Parent as a co-obligor with Borrower pursuant to that certain First Supplemental Indenture, dated as of December 29, 2003, (ii) Debt of Parent resulting from the issue of Parent’s 7.5% Senior Subordinated Notes Due 2015 in an aggregate outstanding principal amount of not greater than $300,000,000 and (iii) subordinate unsecured Debt of up to $500,000,000 with an interest rate no greater than 15.0% and a maturity date that is no less than 5 years from the date such Debt is incurred; provided that such Debt issued pursuant to this clause (iii) is issued on or prior to April 1, 2009.
1.3 Amendment to Special Redetermination Provision . Clause (a) of Section 5.3 of the Credit Agreement is hereby deleted and replaced in its entirety with the following:
(a) In addition to Scheduled Redeterminations, (1) Borrower and Required Banks shall each be permitted to request a Special Redetermination of the Borrowing Base once in each Fiscal Year, and (2) Banks require a Special Redetermination of the Borrowing Base in connection with any sale, assignment, lease, license, transfer, exchange or other disposition of Barnett Shale Assets permitted by Section 10.5(e) , which Special Redetermination shall be requested by Borrower at least two weeks in advance of any such disposition of Barnett Shale Assets so that Banks may redetermine the Borrowing Base in accordance with the procedures and standards set forth in Section 5.2 (after giving effect to the exclusion of the Barnett Shale Assets from the Borrowing Base Properties). Any request by Required Banks
2

pursuant to this Section 5.3(a) shall be submitted to Administrative Agent and Borrower. Any request by Borrower pursuant to this Section 5.3(a) (including any required request resulting from a sale of Barnett Shale Assets) shall be submitted to Administrative Agent and each Bank and at the time of such request Borrower shall (i) deliver to Administrative Agent and each Bank a Reserve Report (which, in the case of a Special Redetermination resulting from a pending proposed disposition of Barnett Shale Assets, shall exclude the Barnett Shale Assets), and (ii) also notify Administrative Agent and each Bank of the Borrowing Base requested by Borrower in connection with such Special Redetermination.
1.4 Amendment to Borrowing Base Deficiency Provision . Section 5.4 of the Credit Agreement is hereby deleted and replaced in its entirety with the following:
Section 5.4 Borrowing Base Deficiency . To the extent a Borrowing Base Deficiency exists after giving effect to any Redetermination (other than a Special Redetermination resulting from a disposition of Barnett Shale Assets), Borrower shall be obligated to eliminate such Borrowing Base Deficiency over a period not to exceed six (6) months from the effective date of such Redetermination by making six (6) mandatory, equal, consecutive, monthly payments of principal on the Revolving Loan, each of which shall be in the amount of one sixth (1/6th) of such Borrowing Base Deficiency, or in the event that the remaining principal outstanding under the Revolving Loan is less than the Borrowing Base Deficiency, then in the amount of one sixth (1/6th) of the remaining principal outstanding under the Revolving Loan. The first of such six (6) payments shall be due on the thirtieth (30th) day following the effective date of each such Redetermination and each subsequent payment shall be due on the same day of each month thereafter (or if there is no corresponding day of any subsequent month, then on the last day of such month) (each such date is referred to herein as a “ borrowing base deficiency payment date ”). If a Borrowing Base Deficiency cannot be eliminated pursuant to this Section 5.4 by prepayment of the Revolving Loan in full (as a result of outstanding Letter of Credit Exposure), on each borrowing base deficiency payment date, Borrower shall also deposit cash with Administrative Agent, to be held by Administrative Agent to secure outstanding Letter of Credit Exposure in the manner contemplated by Section 3.1(b) , an amount at least equal to one sixth (1/6th) of the balance of such Borrowing Base Deficiency (i.e., one-sixth of the difference between the Borrowing Base Deficiency and the remaining outstanding principal under the Revolving Loan on the effective date of such Redetermination). Notwithstanding the foregoing, if
3

upon any reduction, adjustment and/or Redetermination of the Borrowing Base pursuant to a Special Redetermination resulting from a disposition of Barnett Shale Assets results in a Borrowing Base Deficiency (or increase in any previously existing Borrowing Base Deficiency), Borrower shall promptly, but in all events prior to or contemporaneously with the consummation of any disposition of Barnett Shale Assets, make a mandatory prepayment of the principal of the Revolving Loan in an amount sufficient to eliminate the Borrowing Base Deficiency existing after giving effect to such Special Redetermination.
1.5 Amendment to Asset Dispositions Provision . Section 10.5 of the Credit Agreement is hereby deleted and replaced in its entirety with the following:
Section 10.5 Asset Dispositions . Parent and Borrower will not, nor will Parent and/or Borrower permit any other Credit Party to, sell, lease, transfer, abandon or otherwise dispose of any asset other than (a) the sale in the ordinary course of business of Hydrocarbons produced from Borrower’s Mineral Interests, (b) the sale, lease, transfer, abandonment, exchange or other disposition of other assets, provided , that the aggregate value (which, in the case of assets consisting of Mineral Interests, shall be the Recognized Value of such Mineral Interests and in the case of any exchange, shall be the net value or net Recognized Value realized or resulting from such exchange) of all assets sold, leased, transferred or disposed of pursuant to this clause (b) in any period between Scheduled Redeterminations shall not exceed five percent (5%) of the Borrowing Base then in effect (for purposes of this clause (b) the Closing Date will be deemed to be a Scheduled Redetermination), (c) the sale, lease, transfer, abandonment or disposition of Unproved Reserves, (d) the sale of volumetric production payments of carbon dioxide pursuant to the express terms of the Genesis Transaction Documents and (e) the sale, assignment, lease, license, transfer, exchange or other disposition by any Credit Party of all or substantially all of its right, title and interest in the Barnett Shale Assets; provided, that, (i) prior to the consummation of any disposition of Barnett Shale Assets, Administrative Agent shall have received certified copies of any and all documents related to such disposition, including, without limitation, all documents, if any, related to a like-kind exchange or reverse like-kind exchange involving the Barnett Shale Assets under Section 1031 of the Code, (ii) prior to or contemporaneously with the consummation of any disposition of Barnett Shale Assets, Borrower shall have complied with the requirements set forth in Section 5.3 hereof, pursuant to which a Special Redetermination shall have been requested at least two weeks in advance of any such disposition of Barnett Shale Assets and the Borrowing Base
4

shall have been redetermined in accordance with the procedures and standards set forth in Section 5.2 (after giving effect to the exclusion of the Barnett Shale Assets from the Borrowing Base Properties), and (iii) if a Special Redetermination is required pursuant to Section 5.3 hereof as a result of such disposition of Barnett Shale Assets and such Special Redetermination results in a Borrowing Base Deficiency, Borrower shall make the mandatory prepayments of the Revolving Loan required by Section 5.4 hereof. In no event will Parent, Borrower or any other Credit Party sell, transfer or dispose of any Equity in any Restricted Subsidiary nor will any Credit Party (other than Parent) issue or sell any Equity or any option, warrant or other right to acquire such Equity or security convertible into such Equity to any Person other than the Credit Party which is the direct parent of such issuer on the Closing Date.
Section 2. Conditions Precedent to Amendment . The amendments contained in Section 1 hereof are subject to the satisfaction of each of the following conditions precedent:
2.1 Counterparts . The Administrative Agent shall have received counterparts hereof duly executed by the Borrower, Parent and Required Banks (or, in the case of any party as to which an executed counterpart shall not have been received, telegraphic, telex, or other written confirmation from such party of execution of a counterpart hereof by such party).
2.2 Fees . Borrower shall have paid to Administrative Agent any and all reasonable fees payable to Administrative Agent or the Banks pursuant to or in connection with this Third Amendment in consideration for the agreements set forth herein.
2.3 No Material Adverse Effect . There shall not have occurred since December 31, 2007 any events that, individually or in the aggregate, have had a Material Adverse Effect.
2.4 No Default . No Default or Event of Default shall have occurred which is continuing.
Section 3. Representations and Warranties . To induce Banks and Administrative Agent to enter into this Third Amendment, Parent and Borrower hereby jointly and severally represent and warrant to Banks and Administrative Agent as follows:
3.1 Reaffirm Existing Representations and Warranties . Each representation and warranty of Parent and Borrower contained in the Credit Agreement and the other Loan Papers is true and correct in all material respects on the date hereof and will be true and correct in all material respects after giving effect to the amendments set forth in Section 1 hereof.
3.2 Due Authorization; No Conflict . The execution, delivery and performance by Parent and Borrower of this Third Amendment are within Parent’s and Borrower’s corporate or organizational powers, have been duly authorized by all necessary action, require no action by or in respect of, or filing with, any governmental body, agency or official and do not violate or constitute a default under any provision of applicable law or any Material Agreement binding
5

upon Parent, Borrower or their Subsidiaries or result in the creation or imposition of any Lien upon any of the assets of Parent, Borrower or their Subsidiaries except Permitted Encumbrances.
3.3 Validity and Enforceability . This Third Amendment constitutes the valid and binding obligation of Parent and Borrower enforceable in accordance with its terms, except as (i) the enforceability thereof may be limited by bankruptcy, insolvency or similar laws affecting creditor’s rights generally, and (ii) the availability of equitable remedies may be limited by equitable principles of general application.
Section 4. Miscellaneous .
4.1 Reaffirmation of Loan Papers . Any and all of the terms and provisions of the Credit Agreement and the Loan Papers shall, except as amended and modified hereby, remain in full force and effect. The amendments contemplated hereby shall not limit or impair any Liens securing the Obligations, each of which are hereby ratified, affirmed and extended to secure the Obligations as they may be increased pursuant hereto.
4.2 Parties in Interest . All of the terms and provisions of this Third Amendment shall bind and inure to the benefit of the parties hereto and their respective successors and assigns.
4.3 Legal Expenses . Borrower hereby agrees to pay on demand all reasonable fees and expenses of counsel to Administrative Agent incurred by Administrative Agent in connection with the preparation, negotiation and execution of this Third Amendment and all related documents.
4.4 Counterparts . This Third Amendment may be executed in counterparts, and all parties need not execute the same counterpart; however, no party shall be bound by this Third Amendment until Parent, Borrower and Required Banks have executed a counterpart. Facsimiles shall be effective as originals.
4.5 Complete Agreement . THIS THIRD AMENDMENT, THE CREDIT AGREEMENT AND THE OTHER LOAN PAPERS REPRESENT THE FINAL AGREEMENT BETWEEN THE PARTIES AND MAY NOT BE CONTRADICTED BY EVIDENCE OF PRIOR, CONTEMPORANEOUS OR ORAL AGREEMENTS OF THE PARTIES. THERE ARE NO UNWRITTEN ORAL AGREEMENTS BETWEEN OR AMONG THE PARTIES.
4.6 Headings . The headings, captions and arrangements used in this Third Amendment are, unless specified otherwise, for convenience only and shall not be deemed to limit, amplify or modify the terms of this Third Amendment, nor affect the meaning thereof.
IN WITNESS WHEREOF, the parties hereto have caused this Third Amendment to be duly executed by their respective authorized officers on the date and year first above written.
[Signature Pages to Follow]
6

SIGNATURE PAGE TO THIRD AMENDMENT TO SIXTH AMENDED
AND RESTATED CREDIT AGREEMENT
[SIGNATURE PAGE]
PARENT :
DENBURY RESOURCES INC. , a Delaware corporation
By: /s/ Phil Rykhoek Phil Rykhoek,
Senior Vice President and Chief Financial Officer
BORROWER :
DENBURY ONSHORE, LLC , a Delaware limited liability company
By: /s/ Phil Rykhoek Phil Rykhoek,
Senior Vice President and Chief Financial Officer
SIGNATURE PAGE TO THIRD AMENDMENT TO SIXTH AMENDED
AND RESTATED CREDIT AGREEMENT
Each of the undersigned (i) consent and agree to this Third Amendment, and (ii) agree that the Loan Papers to which it is a party shall remain in full force and effect and shall continue to be the legal, valid and binding obligation of such Person, enforceable against it in accordance with its terms.
[SIGNATURE PAGE]
DENBURY MARINE, L.L.C. ,
a Louisiana limited liability company
By: /s/ Phil Rykhoek Phil Rykhoek,
Senior Vice President and Chief Financial Officer
DENBURY OPERATING COMPANY ,
a Delaware corporation
By: /s/ Phil Rykhoek Phil Rykhoek,
Senior Vice President and Chief Financial Officer
TUSCALOOSA ROYALTY FUND LLC ,
a Mississippi limited liability company
By: /s/ Phil Rykhoek Phil Rykhoek,
Senior Vice President and Chief Financial Officer

SIGNATURE PAGE TO THIRD AMENDMENT TO SIXTH AMENDED
AND RESTATED CREDIT AGREEMENT
[SIGNATURE PAGE]
DENBURY GATHERING & MARKETING, INC.,
a Delaware corporation
By: /s/ Phil Rykhoek Phil Rykhoek,
Senior Vice President and Chief Financial Officer

SIGNATURE PAGE TO THIRD AMENDMENT TO SIXTH AMENDED
AND RESTATED CREDIT AGREEMENT
[SIGNATURE PAGE]
ADMINISTRATIVE AGENT/BANK :
JPMORGAN CHASE BANK, N.A. , as Administrative Agent and a Bank
By: /s/ Brian P. Orlando Brian P. Orlando, Vice President

SIGNATURE PAGE TO THIRD AMENDMENT TO SIXTH AMENDED
AND RESTATED CREDIT AGREEMENT
[SIGNATURE PAGE]
BANKS : FORTIS CAPITAL CORP. By: /s/ David Montgomery
Name: David Montgomery
Title: Director
By: /s/ Ilene Fowler
Name: Ilene Fowler
Title: Director

SIGNATURE PAGE TO THIRD AMENDMENT TO SIXTH AMENDED
AND RESTATED CREDIT AGREEMENT
[SIGNATURE PAGE]
BANKS : CALYON NEW YORK BRANCH By: /s/ Michael D. Willis
Name: Michael D. Willis
Title: Director
By: /s/ David Gurghigian
Name: David Gurghigian
Title: Managing Director
SIGNATURE PAGE TO THIRD AMENDMENT TO SIXTH AMENDED
AND RESTATED CREDIT AGREEMENT
[SIGNATURE PAGE]
BANKS : COMERICA BANK By: /s/ Peter L. Sefzik
Name: Peter L. Sefzik
Title: Senior Vice President

SIGNATURE PAGE TO THIRD AMENDMENT TO SIXTH AMENDED
AND RESTATED CREDIT AGREEMENT
[SIGNATURE PAGE]
BANKS : UNION BANK OF CALIFORNIA, N.A. By: /s/ Sean Murphy
Name: Sean Murphy
Title: Senior Vice President
By: /s/ Alison Fuqua
Name: Alison Fuqua
Title: Assistant Vice President

SIGNATURE PAGE TO THIRD AMENDMENT TO SIXTH AMENDED
AND RESTATED CREDIT AGREEMENT
[SIGNATURE PAGE]
BANKS : BANK OF AMERICA, N.A. By: /s/ Christen A. Lacey
Name: Christen A. Lacey
Title: Principal

SIGNATURE PAGE TO THIRD AMENDMENT TO SIXTH AMENDED
AND RESTATED CREDIT AGREEMENT
[SIGNATURE PAGE]
BANKS : BANK OF SCOTLAND PLC By: /s/ Julia R. Franklin
Name: Julia R. Franklin
Title: Assistant Vice President

SIGNATURE PAGE TO THIRD AMENDMENT TO SIXTH AMENDED
AND RESTATED CREDIT AGREEMENT
[SIGNATURE PAGE]
BANKS : COMPASS BANK By: /s/ Greg Determann
Name: Greg Determann
Title: Vice President

SIGNATURE PAGE TO THIRD AMENDMENT TO SIXTH AMENDED
AND RESTATED CREDIT AGREEMENT
[SIGNATURE PAGE]
BANKS : WELLS FARGO BANK, N.A. By: /s/ David Brooks
Name: David Brooks
Title: Vice President

SIGNATURE PAGE TO THIRD AMENDMENT TO SIXTH AMENDED
AND RESTATED CREDIT AGREEMENT
[SIGNATURE PAGE]
BANKS : THE BANK OF NOVA SCOTIA By: /s/ W. Keith Buchanan
Name: W. Keith Buchanan
Title: Managing Director

SIGNATURE PAGE TO THIRD AMENDMENT TO SIXTH AMENDED
AND RESTATED CREDIT AGREEMENT
[SIGNATURE PAGE]
BANKS : KEYBANK NATIONAL ASSOCIATION By: /s/ Angela McCracken
Name: Angela McCracken
Title: Senior Vice President

SIGNATURE PAGE TO THIRD AMENDMENT TO SIXTH AMENDED
AND RESTATED CREDIT AGREEMENT
[SIGNATURE PAGE]
BANKS : U.S. BANK NATIONAL ASSOCIATION By: /s/ Tyler Faverbach
Name: Tyler Faverbach
Title: Vice President

Exhibit 10(n)
DENBURY RESOURCES SEVERANCE PROTECTION PLAN
(As amended and restated effective December 30, 2008)
ARTICLE I ESTABLISHMENT OF PLAN
As of the Effective Date, Denbury Resources Inc. (the “Company”) hereby establishes a severance compensation plan known as the Denbury Resources Severance Protection Plan (the “Plan”), as set forth in this document. For purposes of the Employee Retirement Income Security Act of 1974, as amended (“ERISA”), the Company intends the Plan to be a “Severance Plan” within the meaning of the applicable ERISA regulations.
ARTICLE II DEFINITIONS
As used herein, the following words and phrases shall have the following respective meanings unless the context clearly indicates otherwise.
Section 2.1 Administrator . The Board or any committee thereof as may be appointed from time to time by the Board to supervise the administration of the Plan.
Section 2.2 Affiliate . With respect to a specified person, a person that directly or indirectly through one or more intermediaries, controls, is controlled by, or is under common control with the specified person.
Section 2.3 Base Salary . The amount a Participant is entitled to receive as wages or salary on an annualized basis, calculated on the basis of their salary rate on either the date immediately prior to a Change in Control or their Termination Date, whichever amount is higher.
Section 2.4 Board . The Board of Directors of the Company.
Section 2.5 Bonus Amount . An amount equal to fifty percent (50%) of the total amount of bonuses awarded to the Participant during the twenty-four months prior to the date of the Change in Control.
Section 2.6 Cause . An Employer shall have “Cause” to terminate a Participant if the Participant (i) willfully and continually fails to substantially perform his duties with the Employer (other than a failure resulting from the Participant’s incapacity due to physical or mental illness) which failure continues for a period of at least thirty (30) days after a written notice of demand for substantial performance has been delivered to the Participant specifying the manner in which the Participant has failed to substantially perform, or (ii) willfully engages in conduct which is demonstrably and materially injurious to the Employer, monetarily or
otherwise; provided, however, that no termination of the Participant’s employment shall be for Cause until there shall have been delivered to the Participant a copy of a written notice specifying in detail the particulars of the Participant’s conduct which violates either (i) or (ii) above. No act, nor failure to act, on the Participant’s part, shall be considered “willful” unless he has acted or failed to act with an absence of good faith and without a reasonable belief that his action or failure to act was in the best interest of the Employer. Notwithstanding anything contained in this Plan to the contrary, no failure to perform by the Participant after Notice of Termination is given by or to the Participant shall constitute Cause.
Section 2.7 Change in Control . A “Change in Control” shall mean any one of the following:
(a) “Continuing Directors” no longer constitute a majority of the Board; the term “Continuing Director” means any individual who has served in such capacity for one year or more, together with any new directors whose election by such Board or whose nomination for election by the stockholders of the Company was approved by a vote of a majority of the Directors of the Company then still in office who were either directors at the beginning of such one-year period or whose election or nomination for election was previously so approved;
(b) after the date of adoption of the severance plan, any person or group of persons acting together as an entity (other than the Texas Pacific Group and its Affiliates) become (i) the beneficial owners (as defined in Rule 13d-3 under the Securities Exchange Act of 1934, as amended) directly or indirectly, of shares of common stock representing thirty percent (30%) or more of the voting power of the Company’s then outstanding securities entitled generally to vote for the election of the Company’s directors, and (ii) the largest beneficial owner directly or indirectly of the Company’s then outstanding securities entitled generally to vote for the election of the Company’s directors;
(c) the merger or consolidation to which the Company is a party if (i) the stockholders of the Company immediately prior to the effective date of such merger or consolidation have beneficial ownership (as defined in Rule 13d-3 under the Exchange Act) of less than forty percent (40%) of the combined voting power to vote for the election of directors of the surviving corporation or other entity following the effective date of such merger or consolidation; or (ii) fifty percent (50%) or more of the individuals constituting the members the Investment Committee are terminated due to the Change in Control; or
(d) the sale of all or substantially all, of the assets of the Company or the liquidation or dissolution of the Company.
Notwithstanding the foregoing provisions of this Section 2.6, if a Participant’s employment with the Employer is terminated by the Employer other than for “Cause” six months

prior to the date on which a Change in Control occurs, such termination shall be deemed to have occurred immediately following a Change in Control.
Notwithstanding anything herein to the contrary, under no circumstances will a change in the constitution of the board of directors of any Subsidiary, a change in the beneficial ownership of any Subsidiary, the merger or consolidation of a Subsidiary with any other entity, the sale of all or substantially all of the assets of any Subsidiary or the liquidation or dissolution of any Subsidiary constitute a “Change in Control” under this Plan.
Section 2.8 Common Shares. “Common Shares” means shares of common stock, $.001 par value of Denbury Resources Inc.
Section 2.9 Company . Denbury Resources Inc., a Delaware corporation.
Section 2.10 Effective Date . The date the Plan is approved by the Board of Directors of the Company, or such other date as the Board shall designate in its resolution approving the Plan.
Section 2.11 Employer . The Company and any Subsidiary of the Company which adopts this Plan as a Participating Employer. With respect to a Participant who is not an employee of the Company, any reference under this Plan to such Participant’s “Employer” shall refer only to the employer of the Participant, and in no event shall be construed to refer to the Company as well.
Section 2.12 Good Reason . “Good Reason” shall mean the occurrence of any of the following events or conditions:
(a) a material diminution in the Participant’s authority, duties or responsibilities;
(b) a material diminution in the authority, duties, or responsibilities of the supervisor to whom the Participant is required to report, including a requirement that a Participant report to a corporate officer or employee instead of reporting directly to the board of directors of a corporation of the Company;
(c) a material diminution in the Participant’s base compensation;
(d) a material change in the geographic location at which the Participant must perform the services, or;
(e) any material breach by the Employer of any provision of this Plan.
The Participant is required to provide notice to the Employer of the existence of the condition that would result in termination of employment for Good Reason within 90 days of the initial existence of the condition. Upon notice, the Employer has 30 days to remedy the

condition. If the Employer does not remedy the condition within 30 days, the Participant will meet the requirements for termination of employment for Good Reason.
Section 2.13 Investment Committee . Each employee of the Employer who has been designated by his Employer as a member of the Investment Committee, as the membership of such Committee may be changed from time to time. Members of the Investment Committee as of the date of the Plan’s execution are listed on Schedule B attached hereto.
Section 2.14 Management Group Employee . Each employee of the Employer who has been designated by his Employer as a “Management Group Employee”, as may be designated from time to time by the Board. Management Group Employees as of the date of the Plan’s execution are listed on Schedule C attached hereto.
Section 2.15 Notice of Termination . A notice which indicates the specific provisions in this Plan relied upon as the basis for any termination of employment which sets forth in reasonable detail the facts and circumstances claimed to provide a basis for termination of the Participant’s employment under the provision so indicated; no purported termination of employment shall be effective without such Notice of Termination.
Section 2.16 Officer . Each employee of the Employer that is a corporate officer and is so designated from time to time pursuant to the Company’s Bylaws. Officers as of the date of the Plan’s execution are listed on Schedule A attached hereto.
Section 2.17 Participant . A Participant who meets the eligibility requirements of Article III.
Section 2.18 Participating Employer . A Subsidiary of the Company which adopts this Plan in accordance with Section 8.4 below, and listed on Schedule D attached hereto, and as may be amended from time to time pursuant to Article VIII of the Plan.
Section 2.19 Payment Date . For a Participant, the fifteenth (15 th ) day after the event triggering the right of that Participant to a Severance Benefit.
Section 2.20 Severance Benefit . The benefits payable in accordance with Article IV of the Plan.
Section 2.21 Severance Units. A Participant who is neither a member of the Investment Committee, nor a Management Group Employee nor Officer shall receive one (1) Severance Unit, to be used in calculating his Severance Benefit, for (i) each ten thousand dollars ($10,000) of his Base Salary plus Bonus Amount, and (ii) each twelve months of employment by the Company or an Employer; the sum of any partial Severance Units under (i) and (ii) shall be rounded to the nearest higher whole number of Severance Units. However, the maximum number of Severance Units that may be granted to a Participant is eighteen (18), and each Participant shall be granted at least four (4) Severance Units.

Section 2.22 Subsidiary . Any subsidiary of the Company, and any wholly or partially owned partnership, joint venture, limited liability company, corporation and other form of investment by the Company.
Section 2.23 Termination Date . In the case of the Participant’s death, the Participant’s Termination Date shall be his date of death. In all other cases, the Participant’s Termination Date shall be the date specified in the Notice of Termination subject to the following:
ARTICLE III ELIGIBILITY AND PARTICIPATION
Section 3.1 Participation . Once a person is employed by their Employer they shall automatically become a Participant in the Plan.
Section 3.2 Duration of Participation . A Participant shall cease to be a Participant in the Plan upon the first to occur of: (i) the date he ceases to be an employee of the Employer at any time six months prior to a Change in Control, (ii) the date his employment is terminated following a Change in Control under circumstances where he is not entitled to a Severance Benefit under the terms of this Plan, or (iii) the date on which he has received all of the benefits to which he is entitled under this Plan.
ARTICLE IV SEVERANCE BENEFITS
Section 4.1 Right to Severance Benefit.
(a) After a Change in Control has occurred, a Participant shall be entitled to receive from the Employer a Severance Benefit in the amount provided in Sections 4.2 and 4.3 if his employment is terminated during the period beginning six months prior to a Change of Control and ending two years after a Change of Control, for any reason other than (i) termination by the Employer for Cause or (ii) termination by the Participant for other than Good Reason.
(b) A Participant shall be entitled to a Severance Benefit if that individual satisfies all the conditions under the Plan required to qualify as a Participant
(a) If the Participant’s employment is terminated by the Employer for Cause, the date specified in the Notice of Termination shall be at least thirty (30) days from the date the Notice of Termination is given to the Participant; and
(b) If the Participant terminates his employment for Good Reason, the date specified in the Notice of Termination shall not be more than sixty (60) days from the date the Notice of Termination is given to the Employer.

and he or she is not otherwise disqualified or excluded from eligibility under the terms of the Plan.
(c) Notwithstanding any other provision of the Plan, the sale, divestiture or other disposition of a Subsidiary, shall not be deemed to be a termination of employment of employees employed by such Subsidiary, and such employees shall not be entitled to benefits from the Company or any Participating Employer under this Plan as a result of such sale, divestiture, or other disposition, or as a result of any subsequent termination of employment.
Section 4.2 Amount of Severance Benefit . If a Participant is entitled to a Severance Benefit under Section 4.1, the employer shall pay to the Participant, on or before the Payment Date, an amount in cash equal to one of the following amounts:
(a) for the Company’s Chief Executive Officer and for all other members of the Investment Committee, three (3) times the sum of the Participant’s Base Salary and the Bonus Amount;
(b) for all other Officers that are not members of the Investment Committee, two and one-half (2-1/2) times the sum of the Participant’s Base Salary and the Bonus Amount;
(c) for all members of the Management Group, two (2) times the sum of the Participant’s Base Salary and the Bonus Amount;
(d) for all other employees, one-twelfth (1/12) of the sum of the Participant’s Base Salary and Bonus Amount multiplied by the Participant’s Severance Units.
Section 4.3 Further Benefits . If a Participant is entitled to a Severance Benefit under Section 4.1, such Participant shall also be entitled to:
(a) Continuation at Employer’s expense, on behalf of the Participant and his dependents and beneficiaries, all medical, dental, vision, and health benefits and insurance coverage which were being provided to the Participant at the time of termination of employment for a period of time subsequent to the Participant’s termination of employment. This period of time shall be equal to fifty percent (50%) of the number of months of compensation represented by the Participants’ Severance Benefit, with the number of months of compensation to be based upon the Participant’s monthly Base Salary immediately prior to the Termination Date. The benefits provided in this Section 4.3(a) shall be no less favorable to the Participant, in terms of amounts and deductibles and costs to him, than the coverage provided the Participant under the plans providing such benefits at the time of termination of Participant’s employment. An Employer may pay the employee’s cost of benefits provided pursuant to Consolidated Omnibus Budget Reconciliation Act of 1986 and allowed under the Employer’s benefit

plans for the applicable period of time in order to satisfy its obligation under this provision.
(b) The Employer’s obligation hereunder to provide a benefit shall terminate if the Participant obtains comparable coverage under a subsequent employer’s benefit plan. For purposes of the preceding sentence, benefits will not be comparable during any waiting period for eligibility for such benefits or during any period during which there is a preexisting condition limitation on such benefits. The Employer also shall pay a lump sum equal to the amount of any additional income tax payable by the Participant and attributable to the benefits provided under subparagraph (a) of this Section at the time such tax is imposed upon the Participant. At the end of the period of coverage set forth above, the Participant shall have the option to have assigned to him at no cost to the Participant and with no apportionment of prepaid premiums, any assignable insurance owned by the Employer and relating specifically to the Participant, and the Participant shall be entitled to all health and similar benefits that are or would have been made available to the Participant under law.
Section 4.4 Mitigation or Set-off of Amounts Payable Hereunder . The Participant shall not be required to mitigate the amount of any payment provided for in this Article IV by seeking other employment or otherwise, nor shall the amount of any payment provided for in this Article IV be reduced by any compensation earned by the Participant as the result of employment by the Company or any successor after the Payment Date or by another employer after the Termination Date, or otherwise. The Employer’s obligations hereunder also shall not be affected by any set-off, counterclaim, recoupment, defense or other claim, right or action which the Employer may have against the Participant.
Section 4.5 Company Guarantee of Severance Benefit . In the event a Participant becomes entitled to receive from the Employer a Severance Benefit under this Article IV above and such Employer fails to pay such Severance Benefit, the Company shall assume the obligation of such Employer to pay such Severance Benefit. In consideration of the Company’s assumption of the obligation to pay such Severance Benefit provided under this Plan, the Company (as the source of payment of benefits under the Plan) shall be subrogated to any recovery (irrespective of whether there is recovery from the third party of the full amount of all claims against the third party) or right to recovery of either a Participant or his legal representative against the Employer or any person or entity. The Participant or his legal representative shall cooperate in doing what is reasonably necessary to assist the Company in exercising such rights, including but not limited to notifying the Company of the institution of any claim against a third party and notifying the third party and the third party’s insurer, if any, of the Company’s subrogation rights. Neither the Participant nor his legal representative shall do anything after a loss to prejudice such rights. In its sole discretion, the Company reserves the right to prosecute an action in the name of the Participant or his legal representative against any third parties potentially liable to the Participant. The Company shall have the absolute discretion to settle subrogation claims on any basis it deems warranted and appropriate under the circumstances. If a Participant or his legal representative initiates a lawsuit against any third

parties potentially liable to the Participant, the Company shall not be responsible for any attorney’s fees or court costs that may be incurred in such liability claim. The Company shall be entitled, to the extent of any payments made to or on behalf of a Participant or a dependent of the Participant, to be paid first from the proceeds of any settlement or judgment that may result from the exercise of any rights of recovery asserted by or on behalf of a Participant or his legal representative against any person or entity legally responsible for the injury for which such payment was made. The right is also hereby given the Company to receive directly from the Employer or any third party(ies), attorney(s) or insurance company(ies) an amount equal to the amount paid to or on behalf of the Participant.
Section 4.6 Forfeiture of Severance Benefits . A Participant shall forfeit any and all entitlement to any Severance Benefit if the Administrator determines that the Participant has failed to fulfill any requirement of the Plan.
Section 4.7 Payment after Death . If a Participant dies before his or her Severance Benefits have been paid in full, the remaining Severance Benefits will be paid to the beneficiaries named in such Participant’s last will and testament, or if no will or beneficiary exist then to such Participant’s heirs at law. The Plan shall be discharged fully and completely to the extent of any payment made to any such beneficiaries or heirs at law.
ARTICLE V TERMINATION OF EMPLOYMENT
Section 5.1 Written Notice Required . Any purported termination of employment, either by the Employer or by the Participant, shall be communicated by written Notice of Termination to the other.
ARTICLE VI ADDITIONAL PAYMENTS BY THE COMPANY
Section 6.1 Gross-Up Payment . In the event it shall be determined that any payment or distribution of any type by the Employer to or for the benefit of an Officer, whether paid or payable or distributed or distributable pursuant to the terms of this Plan or otherwise (the “Total Payments”), would be subject to the excise tax imposed by Section 4999 of the Internal Revenue Code of 1986, as amended (the “Code”) or any interest or penalties with respect to such excise tax (such excise tax, together with any such interest and penalties, are collectively referred to as the “Excise Tax”, then the Officer shall be entitled to receive an additional payment (a “Gross-Up Payment”) in an amount such that at the time of payment by the Officer of all taxes (including additional excise taxes under said Section 4999 and any interest, and penalties imposed with respect to any taxes) imposed upon the Gross-Up Payment, the Officer shall have an amount of the Gross-Up Payment equal to the Excise Tax imposed upon the Total Payments. The Company shall pay the Gross-Up Payment to the Officer within twenty (20) business days after the Payment Date or the Termination Date, whichever is applicable.

Section 6.2 Determination By Accountant . All determinations required to be made under this Article VI, including whether a Gross-Up Payment is required and the amount of such Gross-Up Payment, shall be made by the independent accounting firm retained by the Company on the date of Change in Control (the “Accounting Firm”), which shall provide detailed supporting calculations both to the Company and the Officer within fifteen (15) business days of the Payment Date or Termination Date, whichever is applicable, or such earlier time as is requested by the Company. If the Accounting Firm determines that no Excise Tax is payable by the Officer, it shall furnish the Officer with an opinion that he has substantial authority not to report any Excise Tax on his federal income tax return. Any determination by the Accounting Firm shall be binding upon the Company and the Officer. As a result of the uncertainty in the application of Section 4999 of the Code at the time of the initial determination by the Accounting Firm hereunder, it is possible that a Gross-Up Payment which will not have been made by the Company should have been made (“Underpayment”), consistent with the calculations required to be made hereunder. In the event that the Company exhausts its remedies pursuant to Section 6.3 and the Officer thereafter is required to make a payment of any Excise Tax, the Accounting Firm shall determine the amount of the Underpayment that has occurred and any such Underpayment shall be promptly paid by the Company to or for the benefit of the Officer.
Section 6.3 Notification Required . The Officer shall notify the Company in writing of any claim by the Internal Revenue Service that, if successful, would require the payment by the Company of the Gross-Up Payment. Such notification shall be given as soon as practicable but no later than ten (10) business days after the Officer knows of such claim and shall apprise the Company of the nature of such claim and the date on which such claim is requested to be paid. The Officer shall not pay such claim prior to the expiration of the thirty (30) day period following the date on which it gives such notice to the Company (or such shorter period ending on the date that any payment of taxes with respect to such claim is due). If the Company notifies the Officer in writing prior to the expiration of such period that it desires to contest such claim, the Officer shall:
(a) give the Company any information reasonably requested by the Company relating to such claim,
(b) take such action in connection with contesting such claim as the Company shall reasonably request in writing from time to time, including, without limitation, accepting legal representation with respect to such claim by an attorney reasonably selected by the Company,
(c) cooperate with the Company in good faith in order to effectively contest such claim,
(d) permit the Company to participate in any proceedings relating to such claim, provided, however, that the Company shall bear and pay directly all costs and expenses (including additional interest and penalties) incurred in connection with such contest and shall indemnify and hold the Officer harmless, on an after-tax basis, for any

Excise Tax or income tax, including interest and penalties with respect thereto, imposed as a result of such representation and payment of costs and expenses. Without limitation on the foregoing provisions of this Section 6.3, the Company shall control all proceedings taken in connection with such contest and, at its sole option, may pursue or forgo any and all administrative appeals, proceedings, hearings and conferences with the taxing authority in respect of such claim and may, at its sole option, either direct the Officer to pay the tax claimed and sue for a refund, or contest the claim in any permissible manner, and the Officer agrees to prosecute such contest to a determination before any administrative tribunal, in a court of initial jurisdiction and in one or more appellate courts, as the Company shall determine; provided, however, that if the Company directs the Officer to pay such claim and sue for a refund, the Company shall advance the amount of such payment to the Officer, on an interest-free basis and shall indemnify and hold the Officer harmless, on an after-tax basis, from any Excise Tax or income tax, including interest or penalties with respect thereto, imposed with respect to such advance or with respect to any imputed income with respect to such advance; and further provided that any extension of the statute of limitations relating to payment of taxes for the taxable year of the Officer with respect to which such contested amount is claimed to be due is limited solely to such contested amount. Furthermore, the Company’s control of the contest shall be limited to issues with respect to which a Gross-Up Payment would be payable hereunder and the Officer shall be entitled to settle or contest, as the case may be, any other issue raised by the Internal Revenue Service or any other taxing authority.
Section 6.4 Repayment . If, after the receipt by the Officer of an amount advanced by the Company pursuant to Section 6.3, the Officer becomes entitled to receive any refund with respect to such claim, the Officer shall (subject to the Company’s complying with the requirements of Section 6.3) promptly pay to the Company the amount of such refund (together with any interest paid or credited thereon after taxes applicable thereto). If, after the receipt by the Officer of an amount advanced by the Company pursuant to Section 6.3, a determination is made that the Officer shall not be entitled to any refund with respect to such claim and the Company does not notify the Officer in writing of its intent to contest such denial of refund prior to the expiration of thirty days after such determination, then such advance shall be forgiven and shall not be required to be repaid and the amount of such advance shall offset, to the extent thereof, the amount of Gross-Up Payment required to be paid.
ARTICLE VII SUCCESSORS TO COMPANY
Section 7.1 Successors . This Plan shall bind any successor (whether direct or indirect, by purchase, merger, consolidation or otherwise) to all or substantially all of the business and/or assets of the Company, in the same manner and to the same extent that the Company would be obligated under this Plan if no succession had taken place. In the case of any transaction in which a successor would not, by the foregoing provision or by operation of law, be bound by this Plan, the Company shall require such successor expressly and unconditionally to

assume and agree to perform the Company’s obligations under this Plan, in the same manner and to the same extent that the Company would be required to perform if no such succession had taken place. Failure of the Company to obtain such agreement prior to the effectiveness of any such succession shall be a breach hereof and shall entitle the Participant to compensation from the Company in the same amount and on the same terms as the Participant would be entitled hereunder if the Participant terminated his employment for Good Reason, except that for purposes of implementing the foregoing, the date on which any such succession becomes effective shall be deemed the Termination Date. As used herein, “the Company” shall mean the Company as hereinbefore defined and any successor to its business and/or assets as aforesaid which executes and delivers the agreement provided for in this Section 7.1 or which otherwise becomes bound by all the terms and provisions hereof by operation of law.
ARTICLE VIII DURATION, AMENDMENT, PLAN TERMINATION
AND ADOPTION BY SUBSIDIARIES
Section 8.1 Duration . This Plan shall continue in effect until terminated in accordance with Section 8.2. If a Change in Control occurs, this Plan shall continue in full force and effect, and shall not terminate or expire, until after all Participants who have become entitled to a Severance Benefit hereunder shall have received all of such benefits in full.
Section 8.2 Amendment and Termination . The Plan and its attached Schedules may be terminated or amended in any respect by resolution adopted by two-thirds of the Board; provided, however, that no such amendment or termination of the Plan may be made if such amendment or termination would adversely affect any right of a Participant who became a Participant prior to the later of (i) the date of adoption of any such amendment or termination, or (ii) the effective date of any such amendment or termination; and, provided further, that the Plan no longer shall be subject to amendment, change, substitution, deletion, revocation or termination in any respect whatsoever following a Change in Control.
Section 8.3 Form of Amendment . The form of any amendment or termination of the Plan shall be a written instrument signed by a duly authorized officer or officers of the Company, certifying that the amendment or termination has been approved by the Board.
Section 8.4 Adoption by Subsidiaries . Any Subsidiary of the Company may, with the approval of the Board of Directors of the Company, adopt and become an Employer under this Plan by executing and delivering to the Company an appropriate instrument agreeing to be bound as an Employer by all of the terms of the Plan with respect to its eligible employees. The adoptive instrument may contain such changes and amendments in the terms and provisions of the Plan as adopted by such Subsidiary as may be desired by such Subsidiary and acceptable to the Company. The adoptive instrument shall specify the effective date of such adoption of the Plan and shall become as to such adopting Subsidiary a part of this Plan.

ARTICLE IX CLAIMS AND APPEAL PROCEDURES
Section 9.1 Claims Procedure . With respect to any claim for Severance Benefits under the Plan, the Administrator will issue a decision on whether the claim is denied or granted within fifteen (15) days after receipt of the claim by the Administrator, unless special circumstances require an extension of time for processing the claim, in which case a decision will be rendered not later than twenty (20) days after receipt of the claim. Written notice of the extension will be furnished to the Participant prior to the expiration of the initial fifteen (15) day period and will indicate the special circumstances requiring an extension of time for processing the claim and will indicate the date the Administrator expects to render its decision. If the claim is denied in whole or in part, the decision in writing by the Administrator shall include the specific reasons for the denial and reference to the Plan provisions on which the denial is based. The decision also shall include a description of any additional information which the Participant needs to submit in order to refile the claim, along with an explanation of why such additional information is necessary and how the procedure for reviewing claims works. If the notice of denial is not furnished in accordance with the above procedure, the claim shall be deemed denied and the Participant is permitted to proceed with the review procedure.
Section 9.2 Appeals Procedure . If his claim is denied in whole or in part, an Participant may appeal in writing a denial of the claim, in part or in whole, and request a review by the Administrator. The appeal must be submitted within sixty (60) days after notice of the denial of the claim. The Participant may request in writing to review copies of pertinent Plan documents in connection with the appeal. The Administrator will review the appeal and notify the Participant of the final decision within fifteen (15) days after receiving the request for review unless the Administrator requires an extension due to special circumstances, in which case the final decision will be made within twenty (20) days after the Administrator receives the request for review. The notice of the final decision must include the specific reasons for the decision and specific references to the pertinent Plan provisions on which the Administrator’s decision is based.
Section 9.3 Exclusive Initial Remedy . No action may be brought for benefits provided by this Plan or to enforce any right hereunder until after a claim has been submitted to and determined by the Administrator and all appeal rights under the Plan have been exhausted. Thereafter, the Participant may bring an action for benefits provided by this Plan or to enforce any right hereunder. The Participant’s beneficiary should follow the same claims procedure in the event of the Participant’s death.
ARTICLE X PLAN ADMINISTRATION
Section 10.1 In General . The general administration of the Plan and the duty to carry out its provisions shall be vested in the Administrator, which shall be the “Plan Administrator” as that term is defined in section 3(16)(A) of ERISA. The Plan and Severance Benefits under the

Plan shall be administered by the Administrator appointed from time to time by the Company. The Administrator may, in its discretion, secure the services of other parties, including agents and/or employees to carry out the day-to-day functions necessary to an efficient operation of the Plan. The Administrator’s interpretations, decisions, requests and exercises of power and responsibilities shall not be subject to review by anyone and shall be final, binding, and conclusive upon all persons. The Administrator shall, in its sole and absolute discretion, have the exclusive right to interpret all of the terms of the Plan, to determine eligibility for coverage and benefits, to resolve disputes as to eligibility, type, or amount of benefits, to correct any errors or omissions in the form or operation of the Plan, to make such other determinations with respect to the Plan, and to exercise such other powers and responsibilities as shall be provided for in the Plan or as shall be necessary or helpful with respect thereto. The Administrator under and pursuant to this Plan shall be the named fiduciary for purposes of section 402(a) of ERISA with respect to all powers and duties expressly or implicitly assigned to it hereunder. Any determination or decision by the Company made under or with respect to any provision of the Plan shall be in the Company’s sole and absolute discretion, shall not be subject to review by anyone and shall be final, binding and conclusive upon all persons.
Section 10.2 Reimbursement and Compensation . The Administrator shall receive no compensation for its services as Administrator, but it shall be entitled to reimbursement for all sums reasonably and necessarily expended by it in the performance of such duties.
Section 10.3 Rulemaking Powers . The Administrator shall have the power to make reasonable and uniform rules and regulations required in the administration of the Plan, to make all determinations necessary for the Plan’s administration, except those determinations which the Plan requires others to make, and to construe and interpret the Plan wherever necessary to carry out its intent and purpose and to facilitate its administration.
ARTICLE XI SOURCE OF SEVERANCE PAYMENT
Section 11.1 No Separate Fund Established All Severance Benefits shall be paid in cash from the general funds of the Company or an Employer, and no special or separate fund shall be established. Nothing contained in the Plan shall create or be construed to create a trust of any kind, and nothing contained in the Plan nor any action taken pursuant to the provisions of the Plan shall create or be construed to create a fiduciary relationship between the Company or an employer and a Participant, beneficiary, employee or other person. To the extent that any person acquires a right to receive Severance Benefits from the Company or an Employer under the Plan, such right shall be no greater than the right of any unsecured general creditor of the Company or Employer. For purposes of the Code, the Company intends this Plan to be an unfunded, unsecured promise to pay on the part of the Company. For purposes of ERISA, the Company intends the Plan to be a “severance plan” within the meaning of the applicable ERISA regulations.

ARTICLE XII MISCELLANEOUS
Section 12.1 Participant’s Legal Expenses . The Company agrees to pay, upon written demand therefor by the Participant, fifty percent (50%) of all legal fees and expenses which the Participant may reasonably incur in order to collect amounts to be paid or obtain benefits to be provided to such Participant under the Plan, plus in each case interest at the “applicable Federal rate” (as defined in Section 1274(d) of the Code). In any such action brought by a Participant for damages or to enforce any provisions hereof, he shall be entitled to seek both legal and equitable relief and remedies, including, without limitation, specific performance of the Company’s obligations hereunder, in his sole discretion. However, in any instance where a Participant receives, as the result of a final, nonappealable judgment of a court of competent jurisdiction or a mutually agreed upon settlement with the Company, Severance Benefits greater than those first offered by the Company or its successor to the Participant, then the Company shall pay one hundred percent (100%) of all such legal fees and expenses incurred by the Participant.
Section 12.2 Employment Status . This Plan does not constitute a contract of employment or impose on the Employer any obligation to retain a Participant as an employee, to change the status of a Participant’s employment as a Management Group Employee or in any other position, or to change any employment policies of the Employer.
Section 12.3 Validity and Severability . The invalidity or unenforceability of any provision of the Plan shall not affect the validity or enforceability of any other provision of the Plan, which shall remain in full force and effect, and any prohibition or unenforceability in any jurisdiction shall not invalidate or render unenforceable such provision in any other jurisdiction.
Section 12.4 The Participant’s Heirs, etc . This Agreement shall inure to the benefit of and be enforceable by the Participant’s personal or legal representatives, executors, administrators, successors, heirs, distributees, devisees and legatees. If the Participant should die while any amounts would still be payable to him hereunder as if he had continued to live, all such amounts, unless otherwise provided herein, shall be paid in accordance with the terms hereof to his designee or, if there be no such designee, to his estate.
Section 12.5 Governing Law . The validity, interpretation, construction and performance of the Plan shall in all respects be governed by the laws of the State of Texas.
Section 12.6 Choice of Forum . A Participant shall be entitled to enforce the provisions of this Plan in any state or federal court located in the Dallas County, Texas, in addition to any other appropriate forum.
Section 12.7 Notice . For the purposes hereof, notices and all other communications provided for herein shall be in writing and shall be deemed to have been duly given when delivered or mailed by United States registered or certified mail, return receipt requested, postage prepaid, addressed to the Company at its principal place of business and to the Participant at his address as shown on the records of the Employer, provided that all notices to

the Company shall be directed to the attention of the Chief Executive Officer of the Company with a copy to the Secretary of the Company, or to such other in writing in accordance herewith, except that notices of change of address shall be effective only upon receipt.
Section 12.8 Alienation . No benefit, right or interest of any person under the Plan will be subject to alienation, anticipation, sale, transfer, assignment, pledge, encumbrance or charge, seizure, attachment or legal, equitable or other process or be liable for or subject to, the debts, liabilities or other obligations of such persons, except as otherwise required by law. No Participant, dependent or their beneficiary shall have any right or claim to benefits from the Plan, except as specified in the Plan.
Section 12.9 Pronouns . A pronoun or adjective in the masculine gender includes the feminine gender, and the singular includes the plural, unless the context clearly indicates otherwise.
Section 12.10 Section 409A . If it is determined that Section 409A of the Internal Revenue Code applies to any payments made on account of termination of employment to specified employees (as defined under Section 409A of the Internal Revenue Code) the payment shall occur no earlier than the expiration of the six-month period following such termination of employment.

SCHEDULE A
“Officers”, as of December 30, 2008
Gareth Roberts Mark Allen Dan Cole Robert Cornelius Brad Cox Ray Dubuisson Tracy Evans Charlie Gibson Phil Rykhoek Barry Schneider Jerry Ballard

SCHEDULE B
“Investment Committee”, as of December 30, 2008
Gareth Roberts
Mark Allen
Robert Cornelius
Tracy Evans
Phil Rykhoek

SCHEDULE C
“Management Group”, as of December 30, 2008
None

SCHEDULE D
“Participating Employers”, as of December 30, 2008
None

Table of Contents

Table of Contents
Exhibit 10(o)
2004 OMNIBUS STOCK AND INCENTIVE PLAN
FOR DENBURY RESOURCES INC.
(Plan as of December 30, 2008)
(as amended on December 30, 2008)

TABLE OF CONTENTS
(as amended on December 30, 2008)
i
1. Purpose 1 2. Definitions 1 (a) “Administrator” 1 (b) “ Agreed Price” 1 (c) “ Applicable Laws” 1 (d) “Award” 1 (e) “ Board” 1 (f) “ Broker Assisted Exercise” 1 (g) “ Cause” 2 (h) “Change in Control” 2 (i) “ Change in Control Price” 3 (j) “ Code” 3 (k) “Committee” 3 (l) “ Common Stock” 3 (m) “ Company” 3 (n) “ Date of Grant” 3 (o) “Director” 3 (p) “ Disability ” 3 (q) “ Effective Date” 3 (r) “Eligible Person(s)” 4 (s) “ Employee(s)” 4 (t) “ Fair Market Value ” 4 (u) “ Holder” 4 (v) “Incentive Stock Option” 4 (w) “ Investment Committee” 4 (x) Purposely Omitted 4 (y) “Non-Qualified Stock Option” 4 (z) “ Option” 4 (aa) “ Option Price” 4 (bb) “ Parent” 4 (cc) “Performance Award” 5 (dd) “ Performance Measures” 5 (ee) “ Performance Period” 5 (ff) “Plan” 5 (gg) “ Plan Year” 5 (hh) “ Reserved Shares” 5 (ii) “ Restriction(s)” “ Restricted” 5 (jj) “Restricted Period” 5 (kk) “ Restricted Shares” 5 (ll) “ Restricted Share Award” 6 (mm) “Restricted Share Distributions” 6 (nn) “ Retirement Vesting Date” 6 (oo) “ SAR” 6

Table of Contents
TABLE OF CONTENTS
(as amended on December 30, 2008)
ii
(pp) “ Share(s)” 6 (qq) “ Spread” 6 (rr) “Separation” 6 (ss) “ Subsidiary” 6 (tt) “ 1933 Act” 6 (uu) “1934 Act” 6 (vv) “ Vested” 7 (ww) “ 10% Person” 7 3. Award of Reserved Shares 7 4. Conditions for Grant of Awards 7 5. Grant of Options 8 6. Option Price 9 7. Exercise of Options 9 8. Vesting of Options 9 9. Termination of Option Period 10 10. Acceleration 11 11. Adjustment of Reserved Shares 11 12. Transferability of Awards 13 13. Issuance of Reserved Shares 13 14. Administration of the Plan 14 15. Tax Withholding 15 16. Restricted Share Awards 15 17. Performance Awards 16 18. Stock Appreciation Rights 17 19. Section 83(b) Election 19 20. Vesting of Awards Upon Retirement 19 21. Interpretation 20 22. Amendment and Discontinuation of the Plan 20 23. Effective Date and Termination Date 20 24. Section 409A 20

Table of Contents
2004 OMNIBUS STOCK AND INCENTIVE PLAN FOR
DENBURY RESOURCES INC. 1. Purpose . The purpose of this Plan is to advance the interests of Denbury Resources Inc., a Delaware Corporation, and increase shareholder value by providing additional incentives to attract, retain and motivate those qualified and competent employees and Directors, upon whose efforts and judgment its success is largely dependent.
2. Definitions . As used herein, the following terms shall have the meaning indicated:
(a) “Administrator” shall mean the person(s) designated by the Committee to carry out nondiscretionary administrative duties with respect to the Plan and Awards.
(b) “Agreed Price” shall relate to the grant of an Award in the form of a SAR, and shall mean the value assigned to the Award’s Reserved Shares which will form the basis for calculating the Spread on the date of exercise of the SAR, which assigned value shall be the Fair Market Value of such Reserved Shares on the Date of Grant.
(c) “Applicable Laws” means the requirements relating to the administration of stock option plans under U.S. state corporate laws, U.S. federal and state securities laws, and the Code; and the similar laws of any foreign country or jurisdiction where Options are, or will be, granted.
(d) “Award” shall mean either an Option, a SAR, a Restricted Share Award, or a Performance Award, except that where it shall be appropriate to identify the specific type of Award, reference shall be made to the specific type of Award; and provided, further, that references to Award shall be deemed to be references to the written agreement evidencing such Award, and provided, finally, without limitation, that unless expressly provided to the contrary in the terms of the Award, in the event of a conflict between the terms of the Plan and the terms of an Award, the terms of the Plan are controlling.
(e) “Board” shall mean the Board of Directors of the Parent.
(f) “Broker Assisted Exercise” shall mean a special sale and remittance procedure pursuant to which the Holder of an Option shall concurrently provide irrevocable written instructions to (a) an Administrator designated brokerage firm ( “Broker” ) to effect the immediate sale of the Reserved Shares and remit to the Administrator, out of the sale proceeds available on the settlement date, sufficient funds to cover the aggregate Option Price plus all applicable Federal, state and local income and employment taxes required to be withheld by the Company, and (b) the Administrator to deliver the certificates for the Shares directly to such brokerage firm in order to complete the sale.
(as amended on December 30, 2008)
1

Table of Contents
(g) “Cause” shall mean either (i) a final, nonappealable conviction of a Holder for commission of a felony involving moral turpitude, or (ii) Holder’s willful gross misconduct that causes material economic harm to the Company or that brings substantial discredit to the Company’s reputation.
(h) “Change in Control” shall mean any one of the following:
(1) “Continuing Directors” no longer constitute a majority of the Board; the term “Continuing Director” means any individual who has served in such capacity for one year or more, together with any new directors whose election by such Board or whose nomination for election by the stockholders of the Company was approved by a vote of a majority of the Directors of the Company then still in office who were either directors at the beginning of such one-year period or whose election or nomination for election was previously so approved;
(2) after the Effective Date, any person or group of persons acting together as an entity (other than the Texas Pacific Group and its Affiliates) become (i) the beneficial owners (as defined in Rule 13d-3 under the Securities Exchange Act of 1934, as amended) directly or indirectly, of shares of common stock representing thirty percent (30%) or more of the voting power of the Company’s then outstanding securities entitled generally to vote for the election of the Company’s Directors, and (ii) the largest beneficial owner directly or indirectly of the Company’s then outstanding securities entitled generally to vote for the election of the Company’s Directors;
(3) the merger or consolidation to which the Company is a party if (i) the stockholders of the Company immediately prior to the effective date of such merger or consolidation have beneficial ownership (as defined in Rule 13d-3 under the Exchange Act) of less than forty percent (40%) of the combined voting power to vote for the election of directors of the surviving corporation or other entity following the effective date of such merger or consolidation; or (ii) fifty percent (50%) or more of the individuals constituting the members the Investment Committee are terminated due to the Change in Control; or
(4) the sale of all or substantially all, of the assets of the Company or the liquidation or dissolution of the Company.
(5) Notwithstanding the foregoing provisions of this Section 2(h), if a Holder’s Separation is for a reason other than for Cause, and occurs not more than 90 days prior to the date on which a Change in Control occurs, for purposes of Awards, such termination shall be deemed to have occurred immediately following a Change in Control.
(6) Notwithstanding anything herein to the contrary, under no circumstances will a change in the constitution of the board of directors of any Subsidiary, a change in the beneficial ownership of any Subsidiary, the merger or consolidation of a Subsidiary with any other entity, the sale of all or substantially all
(as amended on December 30, 2008)
2

Table of Contents
of the assets of any Subsidiary or the liquidation or dissolution of any Subsidiary constitute a “Change in Control” under this Plan.
(i) “Change in Control Price” shall mean the higher of (i) the highest price per Share paid in any transaction reported on the NYSE or such other exchange or market as is the principal trading market for the Common Stock, or (ii) the highest price per share paid in any bona fide transaction related to a Change in Control, at any time during the 60 day period immediately preceding such occurrence; with such occurrence date to be determined by the Committee and any payments of a change in control price to be made within the time limits established under Section 10(b) hereof.
(j) “Code” shall mean the Internal Revenue Code of 1986, as now or hereafter amended.
(k) “Committee” shall mean the Compensation Committee of the Board, provided, further, that in granting Performance Awards, Committee shall refer to only those members of the Compensation Committee who are “Outside Directors” within the meaning of Section 162(m) of the Code.
(l) “Common Stock” shall mean the common stock, $.001 par value, of the Parent.
(m) “Company” shall mean, individually and collectively, the Parent and the Subsidiaries, except that when it shall be appropriate to refer only to Denbury Resources Inc., the reference will be to “Parent”.
(n) “Date of Grant” shall mean the date on which the Committee takes formal action to grant an Award, provided that it is followed, as soon as reasonably practicable, by written notice to the Eligible Person receiving the Award.
(o) “Director” shall mean a member of the Board.
(p) “Disability” shall mean a Holder’s present incapacity resulting from an injury or illness (either mental or physical) which, in the reasonable opinion of the Administrator based on such medical evidence as it deems necessary, will result in death or can be expected to continue for a period of at least twelve (12) months and will prevent the Holder from performing the normal services required of the Holder by the Company; provided, however, that such disability did not result, in whole or in part: (i) from chronic alcoholism; (ii) from addiction to narcotics; (ii) from a felonious undertaking; or (iv) from an intentional self-inflicted wound.
(q) “Effective Date” shall mean May 12, 2004.
(as amended on December 30, 2008)
3

Table of Contents
(r) “Eligible Person(s)” shall mean those persons or entities, as applicable, who are Employees, or non-employee Directors.
(s) “Employee(s)” shall mean each person whose customary work schedule is a minimum of thirty (30) hours per week, and who is designated as an employee on the books of the Company.
(t) “Fair Market Value” per Share on the date of reference shall be the Closing Price on such date, provided, further, that if the actual transaction involving the Shares occurs at a time when the New York Stock Exchange is closed for regular trading, then it shall be the most recent Closing Price; provided, further, that “Closing Price” means the closing price of the Shares on the New York Stock Exchange as reported in any newspaper of general circulation.
(u) “Holder” shall mean, at each time of reference, each person with respect to whom an Award is in effect; provided, further, that following the death of a Holder, it shall refer to the person who succeeds to the rights of such Holder.
(v) “Incentive Stock Option” shall mean an Option that is an incentive stock option as defined in Section 422 of the Code.
(w) “Investment Committee” shall mean the committee of that name established by the Board, who shall be solely responsible for selecting its members, and whose members on the Effective Date are Messrs. Gareth Roberts, Ronald T. Evans, Mark Worthey and Phil Rykhoek.
(x) Purposely Omitted
(y) “Non-Qualified Stock Option” shall mean an Option that is not an Incentive Stock Option.
(z) “Option” (when capitalized) shall mean the grant of the right to purchase Reserved Shares through the payment of the Option Price and taking the form of either an Incentive Stock Option or a Non-Qualified Stock Option; except that, where it shall be appropriate to identify a specific type of Option, reference shall be made to the specific type of Option; provided, further, without limitation, that a single Option may include both Incentive Stock Option and Non-Qualified Stock Option provisions.
(aa) “Option Price” shall mean the price per Reserved Share which is required to be paid by the Holder in order to exercise his or her right to acquire the Reserved Share under the terms of the Option.
(bb) “Parent” shall mean Denbury Resources Inc.
(as amended on December 30, 2008)
4

Table of Contents
(cc) “Performance Award” shall mean the award which is granted contingent upon the attainment of the performance objectives during the Performance Period, all as described more fully in Section 17 .
(dd) “Performance Measures” shall mean one or more of the following: (i) earnings per share, (ii) return on average common equity, (iii) pre-tax income, (iv) pre-tax operating income, (v) net revenue, (vi) net income, (vii) profits before taxes, (viii) book value per share, (ix) changes in amounts of oil and gas reserves, (x) changes in production rates, (xi) net asset value, (xii) net asset value per share, (xiii) sales, (xiv) finding costs, or (xv) operating cost reductions, but shall not include remaining in the employ of the Company for a specified period of time.
(ee) “Performance Period” shall mean the period described in Section 17 with respect to which the performance objectives relate.
(ff) “Plan” shall mean this 2004 Omnibus Stock and Incentive Plan for Denbury Resources Inc.
(gg) “Plan Year” shall mean the calendar year.
(hh) “Reserved Shares” shall mean, at each time of reference, the total number of Shares described in Section 3 with respect to which the Committee may grant an Award, all of which Reserved Shares shall be held in the Parent’s treasury or shall be made available from the Parent’s authorized and unissued Shares.
(ii) “Restriction(s)” “Restricted” and similar shall mean the restrictions applicable to Reserved Shares subject to an Award which constitute “a substantial risk of forfeiture” of such Reserved Shares within the meaning of Section 83(a)(1) of the Code.
(jj) “Restricted Period” shall mean the period during which Restricted Shares are subject to Restrictions.
(kk) “Restricted Shares” shall mean the Reserved Shares granted to an Eligible Person which are subject to Restrictions; provided, further, that the Committee may, in its sole discretion, determine that the Restrictions which otherwise would have been imposed have been fully satisfied on the Date of Grant by reason of prior service and/or other considerations, and thus provide that such Restricted Shares shall be fully Vested on the Date of Grant.
(as amended on December 30, 2008)
5

Table of Contents
(ll) “Restricted Share Award” shall mean the award of Restricted Shares.
(mm) “Restricted Share Distributions” shall mean any amounts, whether Shares, cash or other property (other than regular cash dividends) paid or distributed by the Parent with respect to Restricted Shares during a Restricted Period.
(nn) “Retirement Vesting Date” shall mean the first birthday of a Holder on which that Holder has attained the later of (i) his 60th birthday, and (ii) the birthday on which that Holder attains an age equal to (x) 65 minus (y) the number which results from multiplying (A) fifty percent (50%) times (B) that Holder’s full years of service as an Employee on such birthday, with such product of (A) and (B) rounded down to the nearest whole number before being deducted from 65. For example only, and without limiting the generality of the foregoing, a Holder who has completed 70 months of service (i.e., 5 full years of service) as an Employee on his 62nd birthday will not have attained his Retirement Vesting Date, whereas a Holder who has completed 72 months of service (i.e., 6 full years of service) as an Employee on his 62nd birthday will have attained his Retirement Vesting Date.
(oo) “SAR” shall mean a stock appreciation right as defined in Section 18 hereof.
(pp) “Share(s)” shall mean a share or shares of Common Stock.
(qq) “Spread” shall mean the difference between the Option Price, or the Agreed Price, as the case may be, of the Share(s) on the date of the Award, and the Fair Market Value of such Share(s) on the date of reference.
(rr) “Separation” shall mean the date on which a Holder ceases to have an employment relationship with the Company for any reason, including death or Disability; and provided, further, without limitation, such employment relationship will cease, in the case of a non-Employee Director, upon his or her ceasing to be a Director; provided, however, that a Separation will not be considered to have occurred while an Employee is on sick leave, military leave, or any other leave of absence approved by the Company, if the period of such leave does not exceed 90 days, or, if longer, so long as the Employee’s right to redeployment with the Company is guaranteed either by statute or by contract.
(ss) “Subsidiary” shall mean, where the Award is an Incentive Stock Option, a “subsidiary corporation”, whether now or hereafter existing, as defined in Section 424(f) of the Code, and on the case of any other Award, shall mean any entity which would be a subsidiary corporation as defined in Section 424(f) of the Code if it were a corporation. Notwithstanding the foregoing, Genesis Energy, Inc. shall not be considered a Subsidiary for purposes of this Plan.
(tt) “1933 Act” shall mean the Securities Act of 1933, as amended.
(uu) “1934 Act” shall mean the Securities Exchange Act of 1934, as amended.
(as amended on December 30, 2008)
6

Table of Contents
(vv) “Vested” and similar terms shall mean the number of Option Shares which have become nonforfeitable and the number of Restricted Shares on which the Restrictions have lapsed; provided, further, and without limitation, that the lapse of Restrictions based on the attainment of performance objectives is also a Vesting event.
(ww) “10% Person” shall mean a person who owns directly (or indirectly through attribution under Section 425(d) of the Code) at the Date of Grant of an Incentive Stock Option, stock possessing more than 10% of the total combined voting power of all classes of voting stock (as defined in Section 424 of the Code) of the Parent on the Date of Grant.
3. Award of Reserved Shares.
(a) As of the Effective Date (as amended), 7,000,000 Shares shall automatically, and without further action, become Reserved Shares. Notwithstanding the foregoing, not more than 3,350,000 Reserved Shares may be issued under the Plan as a result of the Vesting of Restricted Stock or Performance Awards. To the extent any Award shall terminate, expire or be canceled, the Reserved Shares subject to such Award (or with respect to which the Award is measured), shall remain Reserved Shares. Where an Award is settled on a basis other than the issuance of Reserved Shares, the Reserved Shares which measured the amount of such Award settlement shall be canceled and no longer considered Reserved Shares.
(b) Notwithstanding any provision in this Plan to the contrary, no person whose compensation may be subject to the limitations on deductibility under Section 162(m) of the Code shall be eligible for a grant during a single calendar year of an Award with respect to, or measured by, more than 500,000 Reserved Shares. The limitation under this Section 3(b) shall be construed so as to comply with the requirements of Section 162(m) of the Code.
4. Conditions for Grant of Awards.
(a) Without limiting the generality of the provisions hereof which deal specifically with each form of Award, Awards shall only be granted to such one or more Eligible Persons as shall be selected by the Committee.
(b) In granting Awards, the Committee shall take into consideration the contribution the Eligible Person has made or may be reasonably expected to make to the success of the Company and such other factors as the Committee shall determine. The Committee shall also have the authority to consult with and receive recommendations from officers and other personnel of the Company with regard to these matters. The Committee may from time to time in granting Awards under the Plan prescribe such terms and conditions concerning such Awards as it deems appropriate, including, without limitation, relating an Award to achievement of specific goals established by the Committee or to the continued employment of the Eligible Person for a specified period of time, provided that such terms and conditions are not inconsistent with the provisions of this Plan.
(c) Incentive Stock Options may be granted only to Employees, and all other Awards may be granted to any Eligible Person.
(as amended on December 30, 2008)
7
Table of Contents
(d) The Plan shall not confer upon any Holder any right with respect to continuation of employment by the Company, or any right to provide services to the Company, nor shall it interfere in any way with his or her right or the Company’s right to terminate his or her employment at any time.
(e) The Awards granted to Eligible Persons shall be in addition to regular salaries, pension, life insurance or other benefits (if any) related to their service to the Company, and nothing herein shall be deemed to limit the ability of the Company to enter into any other compensation arrangements with any Eligible Person.
(f) The Administrator shall determine in each case whether periods of military or government service shall constitute a continuation of employment or service for the purposes of this Plan or any Award.
(g) Notwithstanding any provision hereof to the contrary, each Award which in whole or in part involves the issuance of Reserved Shares may provide for the issuance of such Reserved Shares for consideration consisting of cash or cash equivalents, or such other consideration as the Committee may determine, including (without limitation) as compensation for past services rendered.
(h) The Committee may delegate in writing to the Administrator the authority to grant Awards to new Employees of the Company, provided that such authority contains limits on the maximum amount or number of Awards (on both an individual basis and, if the Committee so designates, on an aggregate basis) that the Administrator may grant under such authority. Such authority shall also designate the terms and conditions for these grants.
5. Grant of Options.
(a) The Committee may grant Options to Eligible Persons from time to time, alone, in addition to, or in tandem with, other Awards granted under the Plan. An Option granted hereunder shall be either an Incentive Stock Option or a Non-Qualified Stock Option, and shall clearly state whether it is (in whole or in part) an Incentive Stock Option or a Non-Qualified Stock Option; provided, further, that failure of an Option designated as an Incentive Stock Option to qualify as an Incentive Stock Option will not affect its validity, and the portion which does not qualify as an Incentive Stock Option shall be a Non-Qualified Stock Option.
(b) If both Incentive Stock Options and Non-Qualified Stock Options are granted to a Holder, the right to exercise, to the full extent thereof, Options of either type shall not be contingent in whole or in part upon the exercise of, or failure to exercise, Options of the other type.
(c) The aggregate Fair Market Value (determined as of the Date of Grant) of the Reserved Shares with respect to which any Incentive Stock Option is exercisable for the first time by a Holder during any calendar year under the Plan and all such plans of the Company (as defined in Section 425 of the Code) shall not exceed $100,000; provided, further, without
(as amended on December 30, 2008)
8

Table of Contents
limitation, that any portion of an Option designated as an Incentive Stock Option which exceeds such $100,000 limit will, notwithstanding such designation, be a validly granted Non-Qualified Stock Option.
(d) The Committee may at any time offer to buy out for a payment in cash, an Option previously granted, based on such terms and conditions as the Committee shall establish and as communicated to the Holder by the Administrator at the time that such offer is made.
6. Option Price.
(a) The Option Price shall be any price determined by the Committee which is not less than one hundred percent (100%) of the Fair Market Value per Share on the Date of Grant; provided, however, that in the case of an Incentive Stock Option granted to a 10% Person the Option Price shall not be less than 110% of the Fair Market Value per Share on the Date of Grant. The Administrator shall determine the Fair Market Value per Share.
(b) Unless further limited by the Committee in any Option, the Option Price may be paid in cash, by certified or cashier’s check, by wire transfer, by money order, through a Broker Assisted Exercise, with Shares (but with Shares only if expressly permitted by the terms of the Option and only with Shares owned by the Holder for at least 6 months prior to the exercise date), or by a combination of the above; provided, however, that the Administrator may accept a personal check in full or partial payment. If the Option Price is permitted to be, and is, paid in whole or in part with Shares, the value of the Shares surrendered shall be the Shares’ Fair Market Value on the date delivered to the Administrator.
7. Exercise of Options .
An Option shall be deemed exercised when (i) the Administrator has received written notice of such exercise in accordance with the terms of the Option, and (ii) full payment of the aggregate Option Price plus required withholding tax amounts, if any, described in Section 15, of the Reserved Shares as to which the Option is exercised has been made. Separate stock certificates shall be issued by the Parent for any Reserved Shares acquired as a result of exercising an Incentive Stock Option and a Non-Qualified Stock Option.
8. Vesting of Options.
(a) Without limitation, each Option shall Vest in whole or in part, and shall expire, according to the terms of the Option. Unless otherwise expressly provided in an Option, each Option which is not an Annual Option as described in Section 8(b) below, shall Vest, and Reserved Shares subject to such Option shall become Vested Option Shares, on the dates set forth in the following Vesting Schedule:
(as amended on December 30, 2008)
9

Table of Contents
(1) 25% of the Reserved Shares on the first anniversary of the Date of Grant;
(2) 25% of the Reserved Shares on the second anniversary of the Date of Grant;
(3) 25% of the Reserved Shares on the third anniversary of the Date of Grant; and
(4) 25% of the Reserved Shares on the fourth anniversary of the Date of Grant.
(b) Except as otherwise expressly provided in such Option, an Option which is expressly designated as an “Annual” Option shall not Vest, and shall remain 100% forfeitable, until the fourth (4 th ) anniversary of its Date of Grant, and on such fourth (4 th ) anniversary of its Date of Grant such Annual Option shall become 100% Vested, and all Reserved Shares subject to such Annual Option shall become Vested Option Shares.
(c) The Committee, in its sole discretion, may accelerate the date on which all or any portion of an otherwise unvested Option shall Vest or restrictions on Restricted Shares will lapse.
9. Termination of Option Period.
(a) Unless the terms of an Option expressly provide for a different date of termination, the unexercised portion of an Option shall automatically and without notice terminate and become null and void at the time of the earliest to occur of the following:
(1) on the 90th day following Holder’s Separation for any reason except death, Disability or for Cause; or
(2) immediately upon Separation as a result, in whole or in material part, of a discharge for Cause; or
(3) on the first anniversary of a Separation by reason of death or Disability;
(4) in the case of a 10% Person, on the fifth (5 th ) anniversary of the Date of Grant; or
(5) on the tenth (10th) anniversary of the Date of Grant.
(b) Notwithstanding any provision of the Plan to the contrary, in the event of the proposed dissolution or liquidation of the Parent, or in the event of a proposed sale of all or substantially all of the assets of the Company, or the proposed merger of the Parent with or into another corporation (collectively, the “Transaction”), unless otherwise expressly provided (by express reference to this Section 9(b) ) in the terms of an Option, after the
(as amended on December 30, 2008)
10

Table of Contents
public announcement of the Transaction, the Committee may, in its sole discretion, direct the Administrator to deliver a written notice (“ Cancellation Notice ”) to any Holder of an Option, canceling the unexercised Vested portion (including the portion which becomes Vested by reason of acceleration), if any, of such Option, effective on the date specified in the Cancellation Notice (“ Cancellation Date ”). Notwithstanding the forgoing, the Cancellation Date may not be earlier than the last to occur of (i) the 15 th day following delivery of the Cancellation Notice, and (ii) the 60 th day prior to the proposed date for the consummation of the Transaction (“Proposed Date”). Without limitation, the Cancellation Notice will provide that, unless the Holder elects in writing to waive, in whole or in part, a Conditional Exercise, that the exercise of the Option will be a Conditional Exercise. A “Conditional Exercise” shall mean that in the event the Transaction does not occur within 180 days of the Proposed Date, the exercising Holder shall be refunded any amounts paid to exercise such Holder’s Option, such Option will be reissued, and the purported exercise of such Option shall be null and void ab intitio.
10. Acceleration.
(a) Unless otherwise expressly provided in the Award, in the event the Holder’s Separation is by reason of the Holder’s death, or Disability, all Awards granted to the Holder shall become fully exercisable, Vested, or the Restricted Period shall terminate, as the case may be (hereafter, in this Section 10, such Award shall be “accelerated”).
(b) Unless otherwise expressly provided in an Award, in the event of a Change in Control (i) all Awards shall be accelerated, and (ii) in the sole discretion of the Committee, the value of some or all Awards may be cashed out on the basis of the Change in Control Price, at any time during the 60 day period immediately preceding any bona fide transaction related to a Change in Control; provided, further, that if a date prior to such occurrence is selected for a cash out, any subsequent increase in the Change in Control Price will be paid to each Holder on the date of such occurrence, or as soon thereafter as reasonably possible, but not later than 2 1 / 2 months from the occurrence of the Change in Control.
11. Adjustment of Reserved Shares.
(a) If at any time while the Plan is in effect or Awards with respect to Reserved Shares are outstanding, there shall be any increase or decrease in the number of issued and outstanding Shares through the declaration of a stock dividend or through any recapitalization resulting in a stock split-up, combination or exchange of Shares, then and in such event:
(i) appropriate adjustment shall be made in the maximum number of Reserved Shares which may be granted under Section 3, and equitably in the Reserved Shares which are then subject to each Award, so that the same proportion of the Parent’s issued and outstanding Common Stock shall continue to be subject to grant under Section 3 , and to such Award, and
(as amended on December 30, 2008)
11

Table of Contents
(ii) in addition, and without limitation, in the case of each Award (including, without limitation, Options) which requires the payment of consideration by the Holder in order to acquire Reserved Shares, an appropriate equitable adjustment shall be made in the consideration (including, without limitation the Option Price) required to be paid to acquire the each Reserved Share, so that (i) the aggregate consideration to acquire all of the Reserved Shares subject to the Award remains the same and, (ii) so far as possible, (and without disqualifying an Incentive Stock Option) the relative cost of acquiring each Reserved Share subject to such Award remains the same.
All such determinations shall be made by the Board in its sole discretion.
(b) The Committee may change, or may direct the Administrator to change, the terms of Options outstanding under this Plan, with respect to the Option Price or the number of Reserved Shares subject to the Options, or both, when, in the Committee’s judgment, such adjustments become appropriate by reason of a corporate transaction (as defined in Treasury Regulation § 1.425-1(a)(1)(ii)); provided, however, that if by reason of such corporate transaction an Incentive Stock Option is assumed or a new Incentive Stock Option is substituted therefor, the Committee , or at the direction of the Committee, the Administrator, may only change the terms of such Incentive Stock Option such that (i) the excess of the aggregate Fair Market Value of the Shares subject to the substituted Incentive Stock Option immediately after the substitution or assumption, over the aggregate Option Price of such Shares at such time, is not more than the excess of the aggregate Fair Market Value of all Reserved Shares subject to the Incentive Stock Option immediately before such substitution or assumption over the aggregate Option Price of such Reserved Shares at such time, and (ii) the substituted Incentive Stock Option, or the assumption of the original Incentive Stock Option does not give the Holder additional benefits which such Holder did not have under the original Incentive Stock Option. Without limiting the generality of any other provisions hereof, including, without limitation, Section 21 , except to the minimum extent, if any, required by Section 424(a) of the Code with respect to Incentive Stock Options, no change made under the authority of this Section 11(b) in the terms of an Option shall alter such Option’s material provisions in a way that makes such Option less valuable to its Holder.
(c) Except as otherwise expressly provided herein, the issuance by the Parent of shares of its capital stock of any class, or securities convertible into shares of capital stock of any class, either in connection with direct sale for adequate consideration, or upon the exercise of rights or warrants to subscribe therefor, or upon conversion of shares or obligations of the Parent convertible into such shares or other securities, shall not affect, and no adjustment by reason thereof shall be made with respect to, Reserved Shares subject to Awards granted under the Plan.
(d) Without limiting the generality of the foregoing, the existence of outstanding Awards with respect to Reserved Shares granted under the Plan shall not affect in any manner the right or power of the Parent to make, authorize or consummate (1) any or all adjustments, recapitalizations, reorganizations or other changes in the Parent’s capital
(as amended on December 30, 2008)
12
Table of Contents
structure or its business; (2) any merger or consolidation of the Parent; (3) any issue by the Parent of debt securities, or preferred or preference stock which would rank above the Reserved Shares subject to outstanding Awards; (4) the dissolution or liquidation of the Parent; (5) any sale, transfer or assignment of all or any part of the assets or business of the Company; or (6) any other corporate act or proceeding, whether of a similar character or otherwise.
12. Transferability of Awards . Each Award shall provide that such Award shall not be transferable by the Holder otherwise than by will or the laws of descent and distribution, and that so long as an Holder lives, only such Holder or his or her guardian or legal representative shall have the right to exercise such Incentive Stock Option.
13. Issuance of Reserved Shares . No Holder shall be, or have any of the rights or privileges of, the owner of Reserved Shares subject to an Award unless and until certificates representing such Common Stock shall have been issued and delivered to such Holder. As a condition of any issuance of Common Stock, the Administrator may obtain such agreements or undertakings, if any, as the Administrator may deem necessary or advisable to assure compliance with any such law or regulation or shareholder agreement including, but not limited to, a representation, warranty or agreement to be bound by any legends that are, in the opinion of the Administrator, necessary or appropriate to comply with the provisions of any securities law deemed by the Administrator to be applicable to the issuance of the Reserved Shares and which are endorsed upon the Share certificates.
Share certificates issued to the Holder receiving such Reserved Shares who is a party to any shareholders agreement, voting trust, or any similar agreement shall bear the legends contained in such agreements. Notwithstanding any provision hereof to the contrary, no Reserved Shares shall be required to be issued with respect to an Award unless counsel for the Parent shall be reasonably satisfied that such issuance will be in compliance with applicable federal or state securities laws.
In no event shall the Company be required to sell or issue Reserved Shares under any Award if the sale or issuance thereof would constitute a violation of applicable federal or state securities law or regulation or a violation of any other law or regulation of any governmental authority or any national securities exchange. As a condition to any sale or issuance of Reserved Shares, the Company may place legends on Reserved Shares, issue stop transfer orders, and require such agreements or undertakings as the Company may deem necessary or advisable to assure compliance with any such law or regulation.
Without limitation, the Company shall use its best efforts to register the Reserved Shares with the Securities and Exchange Commission under a Form S-8.
(as amended on December 30, 2008)
13

Table of Contents
14. Administration of the Plan .
(a) The Plan shall be administered by the Committee and, except for the powers reserved to the Board in Section 21 hereof, the Committee shall have all of the administrative powers under Plan. Without limitation, all members of the Committee must be independent Directors under applicable rules of the New York Stock Exchange.
(b) The Committee, from time to time, may adopt rules and regulations for carrying out the purposes of the Plan and, without limitation, may delegate all of what, in its sole discretion, it determines to be primarily administrative or ministerial duties to the Administrator. The determinations under, and the interpretations of, any provision of the Plan or an Award by the Committee (or the Administrator in the exercise of his administrative authority) shall, in all cases, be in its sole discretion, and shall be final and conclusive.
(c) Any and all determinations and interpretations of the Committee shall be made either (i) by a majority vote of the members of the Committee at a meeting duly called, with at least 2 days prior notice, or (ii) without a meeting, by the written approval of all members of the Committee.
(d) No member of the Committee, or the Administrator, shall be liable for any action taken or omitted to be taken by such member or by any other member of the Committee or by the Administrator with respect to the Plan, and to the extent of liabilities not otherwise insured under a policy purchased by the Company, the Company does hereby indemnify and agree to defend and save harmless any member of the Committee, and the Administrator, with respect to any liabilities asserted or incurred in connection with the exercise and performance of their powers and duties hereunder, unless such liabilities are judicially determined to have arisen out of such person’s gross negligence, fraud or bad faith. Such indemnification shall include attorney’s fees and all other costs and expenses reasonably incurred in defense of any action arising from such act of commission or omission. Nothing herein shall be deemed to limit the Company’s ability to insure itself with respect to its obligations hereunder.
(e) In particular, and without limitation, except for the authority granted to the Administrator under Section 4(h) to make determinations described in subsections (i), (ii), and (iii) below while carrying out the general delegation by the Committee with respect to the grant of Awards to new Employees, the Committee shall have the sole authority, consistent with the terms of the Plan:
(i) to determine whether and to what extent Awards are to be granted hereunder to one or more Eligible Persons;
(ii) to determine the number of Reserved Shares to be covered by each such Award granted hereunder;
(iii) to determine the terms and conditions of any Award granted hereunder, and to amend or waive any such terms and conditions except to the extent, if any, expressly prohibited by the Plan;
(as amended on December 30, 2008)
14

Table of Contents
(iv) to determine whether and under what circumstances an Option may be settled in Restricted Shares instead of Reserved Shares;
(v) to determine whether, to what extent, and under what circumstances Awards under the Plan are to be made, and operate, on a tandem basis vis-a-vis other Awards under the Plan; and
(vi) to determine (or to delegate to the Administrator the authority to determine) whether to permit payment of tax withholding requirements in Shares.
(f) Without limitation, Committee (and the Administrator in carrying out his responsibilities under Section 4(h) ) shall have the authority to adopt, alter, and repeal any or all of its rules, guidelines, and practices with respect to the Plan, and all questions of interpretation, with respect to the Plan or any Award shall be decided by the Committee (or by the Administrator in carrying out his duties under Section 4(h) ), whose decision shall be final, conclusive and binding upon the Company and each other affected party.
(g) Without limitation, the Committee in its sole discretion may limit the authority granted, or previously granted, hereunder by the Committee to the Administrator by notifying the Administrator in writing of such change.
15. Tax Withholding. On or immediately prior to the date on which a payment is made to a Holder hereunder or, if earlier, the date on which an amount is required to be included in the income of the Holder as a result of an Award, the Holder shall be required to pay to the Company, in cash, or in Shares (but in Shares only if expressly permitted in the Award, or by written authorization of the Administrator, and then only in the minimum amount required to satisfy the minimum withholding requirements with respect to such Award), the amount (if any) which the Company reasonably determines to be necessary in order for the Company to comply with applicable federal or state tax withholding requirements, and the collection of employment taxes; provided, further, without limitation, that the Administrator may require that such payment be made in cash.
16. Restricted Share Awards.
(a) The Committee may grant Awards of Restricted Shares to any Eligible Person, for no cash consideration, for such minimum consideration as may be required by applicable law, or for such other consideration as may be specified in the grant. The terms and conditions of Restricted Shares shall be specified in the Award. The Committee, in its sole discretion, shall determine what rights, if any, the person to whom an Award of Restricted Shares is made shall have in the Restricted Shares during the Restriction Period and the Restrictions applicable to the particular Award, including whether the holder of the Restricted Shares shall have the right to vote the Restricted Shares and the extent, if any, of Holder’s right to receive Restricted Share Distributions. Unless otherwise provided in the Restricted Share Award, upon the expiration of Restrictions, the Restricted Shares shall cease to be Restricted Shares.
(as amended on December 30, 2008)
15

Table of Contents
(b) The Restrictions on Restricted Shares shall lapse in whole, or in installments, over whatever Restricted Period shall be selected by the Committee.
(c) Without limitations, the Committee may accelerate the date on which Restrictions lapse with respect to any Restricted Shares.
(d) During the Restricted Period, the certificates representing the Restricted Shares, and any Restricted Share Distributions, shall be registered in the Holder’s name and bear a restrictive legend disclosing the Restrictions, the existence of the Plan, and the existence of such Restricted Share Award. Such certificates shall be deposited by the Holder with the Company, together with stock powers or other instruments of assignment, each endorsed in blank, which will permit the transfer to the Company of all or any portion of the Restricted Shares, and any assets constituting Restricted Share Distributions, which shall be forfeited in accordance with the terms of such Restricted Share Award. Restricted Shares shall constitute issued and outstanding Common Stock for all corporate purposes and the Holder shall have all rights, powers and privileges of a holder of unrestricted Shares except those that are expressly excluded under the terms of the Restricted Share Award, and Holder will not be entitled to delivery of the stock certificates until all Restrictions shall have terminated, and the Company will retain custody of all related Restricted Share Distributions (which will be subject to the same Restrictions, terms, and conditions as the related Restricted Shares) until the conclusion of the Restricted Period with respect to the related Restricted Shares; and provided, further, that any Restricted Share Distributions shall not bear interest or be segregated into a separate account but shall remain a general asset of the Company, subject to the claims of the Company’s creditors, until the conclusion of the applicable Restricted Period; and provided, finally, that any material breach of any terms of the Restricted Share Award, as reasonably determined by the Administrator, will cause a forfeiture of both Restricted Shares and Restricted Share Distributions.
17. Performance Awards.
(a) Performance Awards during a Plan Year may be granted only to the Chief Executive Officer and the four (4) highest paid employees as of the last day of such Plan Year (“Covered Employees”), and shall in all events be specifically designated as Performance Awards. Nothing herein shall be construed as limiting the Committee’s authority to grant other types of Awards to Eligible Persons, including Covered Employees, conditioned on the satisfaction of such criteria, including those comprising the Performance Measures, as the Committee, in its sole discretion, may select.
(b) Without limitation, the Committee’s grant of Performance Awards may, in its sole discretion, be made in Reserved Shares, or in cash, or in a combination of Reserved Shares and cash, but the cash portion of such Award may not exceed $500,000 in a Plan Year.
(c) The Committee shall select the Performance Measures which will be required to be satisfied during the Performance Period in order to earn the Performance Award. Such Performance Measures, and the duration of any Performance Period, may differ with respect
(as amended on December 30, 2008)
16
Table of Contents
to each Covered Employee, or with respect to separate Performance Awards issued to the same Covered Employee. The selected Performance Measures, the Performance Period(s), and any other conditions to the Company’s obligation to pay a Performance Award shall be set forth in each Performance Award on or before the first to occur of (i) the 90 th day of the selected Performance Period, (ii) the first date on which more than 25% of the Performance Period has elapsed, and (iii) the first date, if any, on which satisfaction of the Performance Measure(s) is no longer substantially uncertain.
(d) Performance Awards shall be paid in a single payment,but will not be paid prior to the date on which the Performance Measures are attained, except that such payment may be accelerated upon the death or Disability of the Covered Employee, or as a result of a Change in Control, it being understood that if such acceleration events occur prior to the attainment of the Performance Measures, the Performance Award will not be exempt from Section 162(m) of the Code. Any accelerated payment made upon death or Disability (as defined in Section 409A of the Code or rules or regulation thereunder) or as a result of a Change in Control (as defined in Section 409A of the Code or rules or regulation thereunder) will be paid within 2 1 / 2 months of the end of the taxable year in which the death or such disability of the Covered Employee occurs or in which such change in control occurs.
(e) The extent to which any applicable performance objective has been achieved shall be conclusively determined by the Committee, but may be specifically delegated to the Administrator . Without limitation, where a Covered Employee has satisfied the Performance Measures with respect to a Performance Award, if permitted under the terms of such Performance Award, the Committee, in its sole discretion, may reduce the maximum amount payable under such Performance Award.
18. Stock Appreciation Rights
(a) The Committee shall have authority to grant (i) a SAR with respect to Reserved Shares, including, without limitation, Reserved Shares covered by any Option (“Related Option”), or (ii) a SAR with respect to, or as to some or all of, a Performance Award (“Related Performance Award”). A SAR granted with respect to a related Option or Related Performance Award must be granted on the Date of Grant of such Related Option or Related Performance Award.
(b) For the purposes of this Section 18 , the following definitions shall apply:
(i) The term “SAR” shall mean a right granted under this Plan, including, without limitation, a right granted in tandem with an Award, that shall entitle the Holder thereof to an amount equal to the SAR Spread payable as described in Section 18(d) .
(ii) The term “SAR Spread” shall mean with respect to each SAR an amount equal to the product of (1) the excess of (A) the Fair Market Value per Share on the date of exercise, over (B) (x) if the SAR is granted in tandem with an Option, then the Option Price per Reserved Share of the Related Option, (y) if the SAR is
(as amended on December 30, 2008)
17

Table of Contents
granted in tandem with a Performance Award, the Agreed Price under the Related Performance Award, or (z) if the SAR is granted by itself with respect to a designated number of Reserved Shares, the Agreed Price which, without limitation, is the Fair Market Value of the Reserved Shares on the Date of Grant, in each case multiplied by (2) the number of Reserved Shares with respect to which such SAR is being exercised; provided, however, without limitation, that with respect to any SAR granted in tandem with an Incentive Stock Option, in no event shall the SAR Spread exceed the amount permitted to be treated as the SAR Spread under applicable Treasury Regulations or other legal authority without disqualifying the Option as an Incentive Stock Option.
(c) To exercise the SAR the Holder shall:
(i) Give written notice thereof to the Company, specifying the SAR being exercised and the number or Reserved Shares with respect to which such SAR is being exercised, and
(ii) If requested by the Company, deliver within a reasonable time the agreement evidencing the SAR being exercised and, if applicable, the Related Option agreement, or Related Performance Award agreement, to the Secretary of the Company who shall endorse or cause to be endorsed thereon a notation of such exercise and return all agreements to the Holder.
(d) As soon as practicable, but within 2 1 / 2 months after the exercise of a SAR the Company shall transfer to the Holder Reserved Shares having a Fair Market Value on the date the SAR s exercised equal to either the SAR Spread, or the Offer Spread, as the case may be; provided, however, without limiting the generality of Section 15 , that the Company, in its sole discretion, may withhold from such transferred Reserved Shares any amount necessary to satisfy the Company’s minimum obligation for federal and state withholding taxes with respect to such exercise.
(e) A SAR may be exercised only if and to the extent that it is permitted under the terms of the Award which, in the case of a Related Option, shall be only when such Related Option is eligible to be exercised.
(f) Upon the exercise or termination of a Related Option, or the payment or termination of a Related Performance Award, the SAR with respect to such Related Option or Related Performance Award likewise shall terminate.
(g) A SAR shall be transferable (i) only to the extent, if any, provided in the agreement evidencing the SAR, or (ii) if granted with respect to a Related Option, or Related Performance Award, only to the extent, if any, that such Related Option, or Related Performance Award, is transferable, and under the same conditions.
(h) Each SAR shall be on such terms and conditions not inconsistent with this Plan as the Committee may determine.
(as amended on December 30, 2008)
18

Table of Contents
(i) The Holder shall have no rights as a stockholder with respect to the related Reserved Shares as a result of the grant of a SAR.
(j) With respect to a Holder who, on the date of a proposed exercise of a SAR is an officer (as that term is used in Rule 16a-1 promulgated under the 1934 Act or any similar rule which may subsequently be in effect), such proposed exercise may only occur as permitted by Rule 16b-3, including without limitation paragraph (e)(3)(iii) (or any similar rule which may subsequently be in effect promulgated pursuant to Section 16(b) of the 1934 Act).
19. Section 83(b) Election.
If as a result of receiving an Award, a Holder receives Restricted Shares, then such Holder may elect under Section 83(b) of the Code to include in his or her gross income, for his or her taxable year in which the Restricted Shares are transferred to such Holder, the excess of the Fair Market Value (determined without regard to any Restriction other than one which by its terms will never lapse), of such Restricted Shares at the Date of Grant, over the amount (if any) paid for the Restricted Shares. If the Holder makes the Section 83(b) election described above, the Holder shall (i) make such election in a manner that is satisfactory to the Administrator, (ii) provide the Administrator with a copy of such election, (iii) agree to promptly notify the Company if any Internal Revenue Service or state tax agent, on audit or otherwise, questions the validity or correctness of such election or of the amount of income reportable on account of such election, and (iv) agree to pay the withholding amounts described in Section 15.
20. Vesting of Awards Upon Retirement.
Unless otherwise expressly provided in the Award or in the Plan, the unVested portion of each Award granted to a Holder in the form of Option Shares, SARs and owned by that Holder on the date of that Holder’s Separation will vest 100% on the date of that Holder’s Separation if, and only if, such Separation occurs on or after the date that Holder attains their Retirement Vesting Date. Without limiting the generality of the foregoing, the Vesting of the unVested portion of an Award granted to a Holder in the form of Restricted Shares shall not accelerate as a result of that Holder’s Separation after attaining their Retirement Vesting Date except to the extent, if any, that such Vesting is expressly provided for in the Award.
(as amended on December 30, 2008)
19

Table of Contents
21. Interpretation.
(a) If any provision of the Plan is held invalid for any reason, such holding shall not affect the remaining provisions hereof, but instead the Plan shall be construed and enforced as if such provision had never been included in the Plan.
(b) THIS PLAN SHALL BE GOVERNED BY THE LAWS OF THE STATE OF DELAWARE.
(c) Headings contained in this Agreement are for convenience only and shall in no manner be construed as part of this Plan.
(d) Any reference to the masculine, feminine, or neuter gender shall be a reference to such other gender as is appropriate.
(e) Nothing contained in this Plan shall prevent the Board from adopting other or additional compensation arrangements, subject to shareholder approval if such approval is required; and such arrangements may be either generally applicable or applicable only in specific cases.
22. Amendment and Discontinuation of the Plan . The Board, or the Committee (subject to the prior written authorization of the Board), may from time to time amend the Plan or any Award; provided, however, that (except to the extent provided in Section 9(b) ) no such amendment may, without approval by the shareholders of the Parent, (a) increase the number of Reserved Shares or change the class of Eligible Persons, (b) permit the granting of Awards which expire beyond the maximum 10-year period described in Section 9(a)(5) , or (c) make any change for which applicable law or regulatory authority (including the regulatory authority of the NYSE or any other market or exchange on which the Common Stock is traded) would require shareholder approval or for which shareholder approval would be required under Section 162(m) of the Code to secure complete deductibility of all compensation paid as a result of Awards; and provided, further, that no amendment or suspension of the Plan or any Award issued hereunder shall, except as specifically permitted in this Plan or under the terms of such Award, substantially impair any Award previously granted to any Holder without the consent of such Holder.
23. Effective Date and Termination Date. The Plan shall be effective as of its Effective Date, and shall terminate on the tenth anniversary of such Effective Date; provided, further, without limitation, that unless otherwise expressly provided in an Award, the termination of the Plan shall not terminate an Award which is outstanding on such date.
24. Section 409A. It is the intention of the Company that no Award shall be “deferred compensation” subject to Section 409A of the Code, unless and to the extent that the Committee specifically determines otherwise, and the Plan and the terms and conditions of all Awards shall be interpreted accordingly. The terms and conditions governing any Awards that the Committee determines will be subject to Section 409A of the Code, including any rules for elective or mandatory deferral of the delivery of cash or shares of Common Stock pursuant thereto and any rules regarding treatment of such Awards in the event of a Change of Control, shall be set forth in the applicable Award Agreement, deferral election forms and procedures, and rules established by the Committee, and shall comply in all respects with Section 409A of the Code. The following rules will apply to Awards intended to be subject to Section 409A of the Code (“409A Awards”):
(as amended on December 30, 2008)
20

Table of Contents
(a) If a Participant is permitted to elect to defer an Award or any payment under an Award, such election will be permitted only at times in compliance with Code Section 409A, including applicable transition rules thereunder.
(b) The Company shall have no authority to accelerate distributions relating to 409A Awards in excess of the authority permitted under Section 409A.
(c) Any distribution of a 409A Award following a termination of employment that would be subject to Code Section 409A(a)(2)(A)(i) as a distribution following a separation from service of a “specified employee” as defined under Code Section 409A(a)(2)(B)(i), shall occur no earlier than the expiration of the six-month period following such Termination of Employment.
(d) In the case of any distribution of a 409A Award, if the timing of such distribution is not otherwise specified in the Plan or an Award Agreement or other governing document, the distribution shall be made not later than the end of the calendar year during which the settlement of the 409A Award is specified to occur.
(e) In the case of an Award providing for distribution or settlement upon vesting or the lapse of a risk of forfeiture, if the time of such distribution or settlement is not otherwise specified in the Plan or an Award Agreement or other governing document, the distribution or settlement shall be made not later than March 15 of the year following the year in which the Award vested or the risk of forfeiture lapsed.
(as amended on December 30, 2008)
21
DENBURY RESOURCES INC.
By /s/ Phil Rykhoek

EXHIBIT 21
LIST OF SUBSIDIARIES
JURISDICTION OF NAME OF SUBSIDIARY ORGANIZATION Denbury Gathering & Marketing, Inc. Delaware Genesis Energy, LLC Delaware Denbury Operating Company Delaware Denbury Onshore, L.L.C. Delaware Denbury Marine, L.L.C. Louisiana Tuscaloosa Royalty Fund L.L.C. Delaware Denbury New Frontiers, L.L.C. Delaware Denbury Green Pipeline — Texas, LLC Delaware

EXHIBIT 23(a)
CONSENT OF INDEPENDENT REGISTERED PUBLIC ACCOUNTING FIRM
We hereby consent to the incorporation by reference in the Registration Statements on Form S-8 (Nos. 333-1006, 333-27995, 333-55999, 333-70485, 333-39172, 333-39218, 333-63198, 333-90398, 333-106253, 333-116249 and 333-143848) of Denbury Resources Inc. of our report dated February 28, 2009 relating to the consolidated financial statements and the effectiveness of internal control over financial reporting, which appears in this Form 10-K.
/s/ PricewaterhouseCoopers LLP Dallas, Texas February 28, 2009

Exhibit 23(b)
DEGOLYER AND MACNAUGHTON 5001 S PRING V ALLEY R OAD
S UITE 800 E AST D ALLAS , T EXAS 75244
March 2, 2009
Denbury Resources, Inc. 5100 Tennyson Parkway Suite 1200 Plano, Texas 75024
Ladies and Gentlemen:
We hereby consent to the use of the name DeGolyer and MacNaughton, to references to DeGolyer and MacNaughton, to the inclusion of our “Appraisal Report as of December 31, 2008 on Proved Reserves of Certain Properties owned by Denbury Resources Inc. SEC Case”, and to the inclusion of information taken from our “Appraisal Report as of December 31, 2008 on Certain Properties owned by Denbury Resources Inc. SEC Case”, “Appraisal Report as of December 31, 2007 on Proved Reserves of Certain Properties owned by Denbury Resources Inc. SEC Case”, and “Appraisal Report as of December 31, 2006 on Proved Reserves of Certain Properties owned by Denbury Resources Inc. SEC Case”, in the sections “Field Summaries”, “Estimated Net Quantities of Proved Oil and Gas Reserves and Present Value of the Estimated Future Net Revenues”, “Selected Financial Data”, “Results of Operations”, “Oil and Natural Gas Reserves”, and “CO 2 Reserves” in the Annual Report on Form 10-K of Denbury Resources Inc. for the year ended December 31, 2008. Very truly yours,
DeGOLYER and MacNAUGHTON

Exhibit 31 (a)
CERTIFICATION UNDER SECTION 302 OF THE SARBANES-OXL EY ACT OF 2002
I, Gareth Roberts, certify that:
(a) Designed such disclosure controls and procedures, or caused such disclosure controls and procedures to be designed under our supervision, to ensure that material information relating to the registrant, including its consolidated subsidiaries, is made known to us by others within those entities, particularly during the period in which this report is being prepared;
(b) Designed such internal control over financial reporting, or caused such internal control over financial reporting to be designed under our supervision, to provide reasonable assurance regarding the reliability of financial reporting and the preparation of financial statements for external purposes in accordance with generally accepted accounting principles;
(c) Evaluated the effectiveness of the registrant’s disclosure controls and procedures and presented in this report our conclusions about the effectiveness of the disclosure controls and procedures, as of the end of the period covered by this report based on such evaluation; and
(d) Disclosed in this report any change in the registrant’s internal control over financial reporting that occurred during the registrant’s most recent fiscal quarter (the registrant’s fourth fiscal quarter in the case of an annual report) that has materially affected, or is reasonably likely to materially affect, the registrant’s internal control over financial reporting; and
(a) All significant deficiencies and material weaknesses in the design or operation of internal control over financial reporting which are reasonably likely to adversely affect the registrant’s ability to record, process, summarize and report financial information; and
(b) Any fraud, whether or not material, that involves management or other employees who have a significant role in the registrant’s internal control over financial reporting.
1. I have reviewed this report on Form 10-K of Denbury Resources Inc. (the registrant);
2. Based on my knowledge, this report does not contain any untrue statement of a material fact or omit to state a material fact necessary to make the statements made, in light of the circumstances under which such statements were made, not misleading with respect to the period covered by this report;
3. Based on my knowledge, the financial statements, and other financial information included in this report, fairly present in all material respects the financial condition, results of operations and cash flows of the registrant as of, and for, the periods presented in this report;
4. The registrant’s other certifying officers and I are responsible for establishing and maintaining disclosure controls and procedures (as defined in Exchange Act Rules 13a-15(e) and 15d-15(e)) and internal control over financial reporting (as defined in Exchange Act Rules 13a-15(f) and 15d-15(f)) for the registrant and have:
5. The registrant’s other certifying officers and I have disclosed, based on our most recent evaluation of internal control over financial reporting, to the registrant’s auditors and the audit committee of the registrant’s board of directors (or persons performing the equivalent functions):
Dated: March 2, 2009 /s/ Gareth Roberts Gareth Roberts President and Chief Executive Officer

Exhibit 31(b)
CERTIFICATION UNDER SECTION 302 OF THE SARBANES-OXL EY ACT OF 2002
I, Phil Rykhoek, certify that:
(a) Designed such disclosure controls and procedures, or caused such disclosure controls and procedures to be designed under our supervision, to ensure that material information relating to the registrant, including its consolidated subsidiaries, is made known to us by others within those entities, particularly during the period in which this report is being prepared;
(b) Designed such internal control over financial reporting, or caused such internal control over financial reporting to be designed under our supervision, to provide reasonable assurance regarding the reliability of financial reporting and the preparation of financial statements for external purposes in accordance with generally accepted accounting principles;
(c) Evaluated the effectiveness of the registrant’s disclosure controls and procedures and presented in this report our conclusions about the effectiveness of the disclosure controls and procedures, as of the end of the period covered by this report based on such evaluation; and
(d) Disclosed in this report any change in the registrant’s internal control over financial reporting that occurred during the registrant’s most recent fiscal quarter (the registrant’s fourth fiscal quarter in the case of an annual report) that has materially affected, or is reasonably likely to materially affect, the registrant’s internal control over financial reporting; and
(a) All significant deficiencies and material weaknesses in the design or operation of internal control over financial reporting which are reasonably likely to adversely affect the registrant’s ability to record, process, summarize and report financial information; and
(b) Any fraud, whether or not material, that involves management or other employees who have a significant role in the registrant’s internal control over financial reporting.
1. I have reviewed this report on Form 10-K of Denbury Resources Inc. (the registrant);
2. Based on my knowledge, this report does not contain any untrue statement of a material fact or omit to state a material fact necessary to make the statements made, in light of the circumstances under which such statements were made, not misleading with respect to the period covered by this report;
3. Based on my knowledge, the financial statements, and other financial information included in this report, fairly present in all material respects the financial condition, results of operations and cash flows of the registrant as of, and for, the periods presented in this report;
4. The registrant’s other certifying officers and I are responsible for establishing and maintaining disclosure controls and procedures (as defined in Exchange Act Rules 13a-15(e) and 15d-15(e)) and internal control over financial reporting (as defined in Exchange Act Rules 13a-15(f) and 15d-15(f)) for the registrant and have:
5. The registrant’s other certifying officers and I have disclosed, based on our most recent evaluation of internal control over financial reporting, to the registrant’s auditors and the audit committee of the registrant’s board of directors (or persons performing the equivalent functions):
Dated: March 2, 2009 /s/ Phil Rykhoek Phil Rykhoek Sr. Vice President and Chief Financial Officer

Exhibit 32
Certification of Chief Executive Officer and Chief Financial Officer Pursuant to Section 906 of the Sarbanes-Oxley Act of 2002
In connection with the accompanying Annual Report on Form 10-K for the year ended December 31, 2008 (the Report) of Denbury Resources Inc. (Denbury) as filed with the Securities and Exchange Commission on March 2, 2009, each of the undersigned, in his capacity as an officer of Denbury, hereby certifies pursuant to 18 U.S.C. Section 1350, as adopted pursuant to Section 906 of the Sarbanes-Oxley Act of 2002, that to his knowledge:
1. The Report fully complies with the requirements of Section 13(a) or 15(d) of the Securities Exchange Act of 1934, as amended; and
2. The information contained in the Report fairly presents, in all material respects, the financial condition and results of operations of Denbury.
Dated: March 2, 2009 /s/ Gareth Roberts Gareth Roberts President and Chief Executive Officer Dated: March 2, 2009 /s/ Phil Rykhoek Phil Rykhoek Sr. Vice President and Chief Financial Officer

Exhibit 99
DeGolyer and MacNaughton 5001 Spring Valley Road
Suite 800 East Dallas, Texas 75244
APPRAISAL REPORT as of
DECEMBER 31, 2008 on
PROVED RESERVES of
CERTAIN PROPERTIES owned by
DENBURY RESOURCES INC.
SEC CASE
DeGolyer and MacNaughton
TABLE of CONTENTS
Page FOREWORD 1
Scope of Investigation 1 Authority 2 Source of Information 2
CLASSIFICATION of RESERVES 4 ESTIMATION of RESERVES 7 VALUATION of RESERVES 9 SUMMARY and CONCLUSIONS 12

DeGolyer and MacNaughton 5001 Spring Valley Road
Suite 800 East Dallas, Texas 75244
APPRAISAL REPORT as of
DECEMBER 31, 2008 on
PROVED RESERVES of
CERTAIN PROPERTIES owned by
DENBURY RESOURCES INC.
SEC CASE
FOREWORD
Scope of Investigation
This report presents an appraisal, as of December 31, 2008, of the extent and value of the proved crude oil, condensate, natural gas liquids, and natural gas reserves of certain properties owned by Denbury Resources Inc. (Denbury). Estimates of carbon dioxide gas reserves are also included. The reserves estimated in this report are located in Alabama, Arkansas, Louisiana, Mississippi, and Texas. The properties appraised are listed in detail in the related DeGolyer and MacNaughton report entitled “Appraisal Report as of December 31, 2008 on Certain Properties owned by Denbury Resources Inc. SEC Case.”
Reserves estimated in this report are expressed as gross and net reserves. Gross reserves are defined as the total estimated petroleum to be produced from these properties after December 31, 2008. Net reserves are defined as that portion of the gross reserves attributable to the interests owned by Denbury after deducting royalties and interests owned by others.
This report also presents values that were estimated for proved reserves using initial prices and costs provided by Denbury. Prices are related to December 31, 2008, NYMEX prices of $44.60 per barrel and

$5.622 per million British thermal units (MMBtu). No escalation has been applied to prices and costs. A detailed explanation of the future price and cost assumptions is included in the Valuation of Reserves section of this report.
Values of proved reserves in this report are expressed in terms of estimated future gross revenue, future net revenue, and present worth. Future gross revenue is that revenue which will accrue to the appraised interests from the production and sale of the estimated net reserves. Future net revenue is calculated by deducting estimated production taxes, ad valorem taxes, operating expenses, and capital costs from the future gross revenue. Operating expenses include field operating expenses, transportation expenses, compression charges, and an allocation of overhead that directly relates to production activities. Future income tax expenses were not taken into account in the preparation of these estimates. Present worth is defined as future net revenue discounted at a specified arbitrary discount rate compounded monthly over the expected period of realization. In this report, present worth values using a discount rate of 10 percent are reported.
Estimates of oil, condensate, natural gas liquids, gas reserves, and future net revenue should be regarded only as estimates that may change as further production history and additional information become available. Not only are such reserves and revenue estimates based on that information which is currently available, but such estimates are also subject to the uncertainties inherent in the application of judgmental factors in interpreting such information.
Authority
This report was prepared at the request of Mr. Ronald T. Evans, Senior Vice President Reservoir Engineering, Denbury.
Source of Information
Data used in the preparation of this report were obtained from Denbury, from records on file with the appropriate regulatory agencies, and from public sources. In the preparation of this report we have relied, without independent verification, upon information furnished by Denbury with respect to its property interests, production from such properties, current costs of operation and development, current prices for production, agreements relating to current and future operations and sale of
DeGolyer and MacNaughton 2

production, and various other information and data that were accepted as represented. A field examination of the properties was not considered necessary for the purposes of this report.
DeGolyer and MacNaughton 3

CLASSIFICATION of RESERVES
Petroleum reserves included in this report are classified as proved and are judged to be economically producible in future years from known reservoirs under existing economic and operating conditions and assuming continuation of current regulatory practices using conventional production methods and equipment. In the analyses of production-decline curves, reserves were estimated only to the limit of economic rates of production under existing economic and operating conditions using prices and costs as of the date the estimate is made, including consideration of changes in existing prices provided only by contractual arrangements but not including escalations based upon future conditions. Proved reserves classifications used in this report are in accordance with the reserves definitions of Rules 4—10(a) (1)—(13) of Regulation S—X of the Securities and Exchange Commission (SEC) of the United States. The petroleum reserves are classified as follows:
Proved oil and gas reserves — Proved oil and gas reserves are the estimated quantities of crude oil, natural gas, and natural gas liquids which geological and engineering data demonstrate with reasonable certainty to be recoverable in future years from known reservoirs under existing economic and operating conditions, i.e., prices and costs as of the date the estimate is made. Prices include consideration of changes in existing prices provided only by contractual arrangements, but not on escalations based upon future conditions.
(i) Reservoirs are considered proved if economic producibility is supported by either actual production or conclusive formation test. The area of a reservoir considered proved includes (A) that portion delineated by drilling and defined by gas-oil and/or oil-water contacts, if any; and (B) the immediately adjoining portions not yet drilled, but which can be reasonably judged as economically productive on the basis of available geological and engineering data. In the absence of information on fluid contacts, the lowest known structural occurrence of hydrocarbons controls the lower proved limit of the reservoir.
(ii) Reserves which can be produced economically through application of improved recovery techniques (such as fluid injection) are included in the “proved” classification when
DeGolyer and MacNaughton 4

successful testing by a pilot project, or the operation of an installed program in the reservoir, provides support for the engineering analysis on which the project or program was based.
(iii) Estimates of proved reserves do not include the following: (A) oil that may become available from known reservoirs but is classified separately as “indicated additional reserves”; (B) crude oil, natural gas, and natural gas liquids, the recovery of which is subject to reasonable doubt because of uncertainty as to geology, reservoir characteristics, or economic factors; (C) crude oil, natural gas, and natural gas liquids, that may occur in undrilled prospects; and (D) crude oil, natural gas, and natural gas liquids, that may be recovered from oil shales, coal, gilsonite, and other such sources.
Proved developed oil and gas reserves — Proved developed oil and gas reserves are reserves that can be expected to be recovered through existing wells with existing equipment and operating methods. Additional oil and gas expected to be obtained through the application of fluid injection or other improved recovery techniques for supplementing the natural forces and mechanisms of primary recovery should be included as “proved developed reserves” only after testing by a pilot project or after the operation of an installed program has confirmed through production response that increased recovery will be achieved.
Proved undeveloped reserves — Proved undeveloped oil and gas reserves are reserves that are expected to be recovered from new wells on undrilled acreage, or from existing wells where a relatively major expenditure is required for recompletion. Reserves on undrilled acreage shall be limited to those drilling units offsetting productive units that are reasonably certain of production when drilled. Proved reserves for other undrilled units can be claimed only where it can be demonstrated with certainty that there is continuity of production from the existing productive formation. Under no circumstances should estimates for proved undeveloped reserves be attributable to any acreage for which an application of fluid injection or other improved recovery technique is contemplated, unless such techniques
DeGolyer and MacNaughton 5

have been proved effective by actual tests in the area and in the same reservoir.
DeGolyer and MacNaughton 6

ESTIMATION of RESERVES
Estimates of reserves were prepared by the use of geological and engineering methods generally accepted by the petroleum industry. The method or combination of methods used in the analysis of each reservoir was tempered by experience with similar reservoirs, stage of development, quality and completeness of basic data, and production history.
When applicable, the volumetric method was used to estimate the original oil in place (OOIP) and original gas in place (OGIP). Structure maps were prepared to delineate each reservoir, and isopach maps were constructed to estimate reservoir volume. Electrical logs, radioactivity logs, core analyses, and other available data were used to prepare these maps as well as to estimate representative values for porosity and water saturation. When adequate data were available and when circumstances justified, material-balance and other engineering methods were used to estimate OOIP or OGIP.
Estimates of ultimate recovery were obtained after applying recovery factors to OOIP or OGIP. These recovery factors were based on consideration of the type of energy inherent in the reservoirs, analyses of the petroleum, the structural positions of the properties, and the production histories. When applicable, material-balance and other engineering methods were used to estimate recovery factors. An analysis of reservoir performance, including production rate, reservoir pressure, and gas-oil ratio behavior, was used in the estimation of reserves.
For depletion-type reservoirs or those whose performance disclosed a reliable decline in producing-rate trends or other diagnostic characteristics, reserves were estimated by the application of appropriate decline curves or other performance relationships. In the analyses of production-decline curves, reserves were estimated only to the limits of economic production based on current economic conditions.
In certain cases, when the previously named methods could not be used, reserves were estimated by analogy with similar wells or reservoirs for which more complete data were available.
The gas reserves included herein are reported as sales gas. Sales gas is defined as that gas to be delivered into a gas
DeGolyer and MacNaughton 7

pipeline for sale after separation, processing, fuel use, and flare. All gas quantities are expressed at a temperature base of 60 degrees Fahrenheit (°F) and at the legal pressure base of the state or area in which the reserves are located. Condensate reserves estimated herein are those to be recovered by conventional lease separation. Natural gas liquids reserves are estimated to be those attributable to the leasehold interests appraised based on historical yield information.
In the preparation of this study, as of December 31, 2008, gross production estimated to December 31, 2008, was deducted from gross ultimate recovery to arrive at the estimate of gross reserves. In some fields, this required that the production rates be estimated for up to 2 months, since production data from certain properties were available only through October 2008.
The following table presents estimates of the proved reserves, as of December 31, 2008, of the properties appraised, expressed in thousands of barrels (Mbbl) or millions of cubic feet (MMcf):
In addition to the natural gas reserves shown in the foregoing tabulation, Denbury’s net proved carbon dioxide gas reserves in Mississippi, as of December 31, 2008, are estimated to be 4,499,230 MMcf. This amount includes 4,318,049 MMcf of developed reserves and 181,181 MMcf of undeveloped reserves. The carbon dioxide gas reserves have been prepared under the same guidelines as those for oil and natural gas. No revenue estimates have been made for the carbon dioxide reserves.
DeGolyer and MacNaughton 8
Oil and Natural Gas Total Condensate Liquids Liquids Gas (Mbbl) (Mbbl) (Mbbl) (MMcf) Gross Proved Reserves
Developed Producing 116,262 16,096 132,358 469,415 Developed Nonproducing 33,345 1,804 35,150 43,344 Undeveloped 94,799 10,351 105,151 193,944
Total Gross Reserves 244,406 28,251 272,659 706,703 Net Proved Reserves
Developed Producing 61,665 11,682 73,347 270,824 Developed Nonproducing 22,086 1,312 23,399 27,290 Undeveloped 74,524 7,856 82,380 129,841
Total Net Reserves 158,275 20,850 179,126 427,955

VALUATION of RESERVES
Revenue values in this report were estimated using the initial prices and costs provided by Denbury. Future prices were estimated using guidelines established by the SEC and the Financial Accounting Standards Board (FASB).
In this report, values for proved reserves were based on projections of estimated future production and revenue prepared for these properties.
The following assumptions were used for estimating future prices and costs:
Oil and Condensate Prices
Oil and condensate prices were calculated using differentials furnished by Denbury for each lease to a NYMEX price of $44.60 per barrel and held constant thereafter. The weighted average price over the lives of the properties was $40.87 per barrel.
Natural Gas Liquids Prices
Natural gas liquids prices were calculated using the 2008 average ratio to the NYMEX oil price of $44.60 per barrel. These prices were held constant over the lives of the properties. The average price over the lives of the properties is $21.59 per barrel.
Natural Gas Prices
Natural gas prices were calculated for each lease using differentials furnished by Denbury to a NYMEX price of $5.622 per MMBtu and held constant thereafter. The weighted average price over the lives of the properties was $4.919 per thousand cubic feet.
DeGolyer and MacNaughton 9

Operating Expenses and Capital Costs
Current operating expenses and capital costs, based on information provided by Denbury, were used in estimating future costs required to operate the properties. In certain cases, future costs, either higher or lower than current costs, may have been used because of anticipated changes in operating conditions. These costs were not escalated for inflation.
The future revenue to be derived from the production and sale of the proved reserves, as of December 31, 2008, of the properties appraised is estimated as follows:
* Future income taxes have not been taken into account in the preparation of these estimates. Note: Numbers in tables may not add due to rounding.
Timing of capital expenditures and the resulting development of production were based on a development plan provided by Denbury.
In our opinion, the information relating to estimated proved reserves, estimated future net revenue from proved reserves, and present worth of estimated future net revenue from proved reserves of oil, condensate, natural gas liquids, and gas contained in this report has been prepared in accordance with Paragraphs 10—13, 15, and 30(a)—(b) of Statement of Financial Accounting Standards No. 69 (November 1982) of the FASB and Rules 4—10(a) (1)—(13) of Regulation S—X and Rule 302(b) of Regulation S—K of the SEC; provided, however, that (i) certain estimated data have not been provided with respect to changes in reserves information and (ii) future income tax expenses have not been taken into account in estimating the future net revenue and present worth values set forth herein.
DeGolyer and MacNaughton 10
Proved Developed Developed Total Producing Nonproducing Undeveloped Proved (M$) (M$) (M$) (M$) Future Gross Revenue 4,135,446 1,057,473 3,831,305 9,024,224 Production and Ad Valorem Taxes 227,126 47,563 173,476 448,165 Operating Expenses 1,632,181 371,853 1,587,699 3,591,733 Capital Costs 46,862 93,024 761,851 901,737 Abandonment Costs 43,469 (490 ) 0 42,979 Future Net Revenue* 2,185,808 545,524 1,308,278 4,039,610 Present Worth at 10 Percent* 1,288,344 310,446 328,064 1,926,855

To the extent that the above-enumerated rules, regulations, and statements require determinations of an accounting or legal nature or information beyond the scope of our report, we are necessarily unable to express an opinion as to whether the above-described information is in accordance therewith or sufficient therefor.
DeGolyer and MacNaughton 11

SUMMARY and CONCLUSIONS
Denbury owns working and royalty interests in certain properties located in Alabama, Arkansas, Louisiana, Mississippi, and Texas. The estimated net proved reserves of the properties appraised, as of December 31, 2008, are summarized as follows, expressed in thousands of barrels (Mbbl) or millions of cubic feet (MMcf):
The estimated revenue and expenditures attributable to Denbury’s interests in the proved reserves, as of December 31, 2008, of the properties appraised under the aforementioned assumptions concerning future prices and costs are summarized as follows:
* Future income taxes have not been taken into account in the preparation of these estimates. Note: Numbers in tables may not add due to rounding.
DeGolyer and MacNaughton 12
Oil and Natural Gas Total Condensate Liquids Liquids Gas (Mbbl) (Mbbl) (Mbbl) (MMcf) Net Proved Reserves
Developed Producing 61,665 11,682 73,347 270,824 Developed Nonproducing 22,086 1,312 23,399 27,290 Undeveloped 74,524 7,856 82,380 129,841
Total Net Reserves 158,275 20,850 179,126 427,955
Proved Developed Developed Total Producing Nonproducing Undeveloped Proved (M$) (M$) (M$) (M$) Future Gross Revenue 4,135,446 1,057,473 3,831,305 9,024,224 Production and Ad Valorem Taxes 227,126 47,563 173,476 448,165 Operating Expenses 1,632,181 371,853 1,587,699 3,591,733 Capital Costs 46,862 93,024 761,851 901,737 Abandonment Costs 43,469 (490 ) 0 42,979 Future Net Revenue* 2,185,808 545,524 1,308,278 4,039,610 Present Worth at 10 Percent* 1,288,344 310,446 328,064 1,926,855

All gas quantities in this report are expressed at a temperature base of 60°F and at the legal pressure base of the state or area in which the reserves are located.
Submitted,
/s/ DeGolyer and MacNaughton
DeGOLYER and MacNAUGHTON
SIGNED: February 6, 2009
DeGolyer and MacNaughton 13
/s/ Paul J. Szatkowski
Paul J. Szatkowski, P.E. Senior Vice President DeGolyer and MacNaughton