density and conditional distribution based specification...
TRANSCRIPT

Density and Conditional Distribution BasedSpecification Analysis∗
Diep Duong and Norman R. Swanson∗
Rutgers University
February 2012
The technique of using densities and conditional distributions to carry out consistent specification testing and
model selection amongst multiple diffusion processes have received considerable attention from both financial theoreti-
cians and empirical econometricians over the last two decades. One reason for this interest is that correct specification
of diffusion models describing dynamics of financial assets is crucial for many areas in finance including equity and
option pricing, term structure modeling, and risk management, for example. In this paper, we discuss advances to this
literature introduced by Corradi and Swanson (2005), who compare the cumulative distribution (marginal or joint)
implied by a hypothesized null model with corresponding empirical distributions of observed data. We also outline
and expand upon further testing results from Bhardwaj, Corradi and Swanson (BCS: 2008) and Corradi and Swan-
son (2011). In particular, parametric specification tests in the spirit of the conditional Kolmogorov test of Andrews
(1997) that rely on block bootstrap resampling methods in order to construct test critical values are first discussed.
Thereafter, extensions due to BCS (2008) for cases where the functional form of the conditional density is unknown
are introduced, and related continuous time simulation methods are introduced. Finally, we broaden our discussion
from single process specification testing to multiple process model selection by discussing how to construct predictive
densities and how to compare the accuracy of predictive densities derived from alternative (possibly misspecified)
diffusion models. In particular, we generalize simulation Steps outlined in Cai and Swanson (2011) to multifactor
models where the number of latent variables is larger than three. These final tests can be thought of as continuous
time generalizations of the discrete time “reality check” test statistics of White (2000), which are widely used in
empirical finance (see e.g. Sullivan, Timmermann and White (1999, 2001)). We finish the chapter with an empirical
illustration of model selection amongst alternative short term interest rate models.
Keywords: multi-factor diffusion process, specification test, out-of-sample forecasts, conditional
distribution, model selection,block bootstrap, jump process.
___________________________∗ Diep Duong, Department of Economics, Rutgers University, 75 Hamilton Street, New Brunswick, NJ 08901,
USA, [email protected]. Norman R. Swanson, Department of Economics, Rutgers University, 75 Hamilton
Street, New Brunswick, NJ 08901, USA, [email protected]. The authors thanks the editor, Cheng-Few Lee
for many useful suggestions given during the writing of this paper. Duong and Swanson would like to thank the
Research Council at Rutgers University for research support.

1 Introduction
The last three decades have provided a unique opportunity to observe numerous interesting de-
velopments in finance, financial econometrics and statistics. For example, although starting as a
narrow sub-field, financial econometrics has recently transformed itself into an important discipline,
equipping financial economic researchers and industry practitioners with immensely helpful tools
for estimation, testing and forecasting. One of these developments has involved the development of
“state of the art” consistent specification tests for continuous time models, including not only the
geometric Brownian motion process used to describe the dynamics of asset returns (Merton (1973)),
but also a myriad of other diffusion models used in finance, such as the Ornstein-Uhlenbeck process
introduced by Vacisek (1977), the constant elastic volatility process applied by Beckers (1980), the
square root process due to Cox, Ingersoll and Ross (CIR: 1985), the so called CKLS model by
Chan, Karolyi, Longstaff and Sanders (CKLS: 1992), various three factor models proposed Chen
(1996), stochastic volatility processes such as generalized CIR of Andersen and Lund (1997), and
the generic class of affine jump diffusion processes discussed in Duffie, Pan and Singleton (2000).1
The plethora of available diffusion models allow decision makers to be flexible when choosing a
specification to be subsequently used in contexts ranging from equity and option pricing, to term
structure modeling and risk management. Moreover, the use of high frequency data when estimating
such models, in continuous time contexts, allows investors to continuously update their dynamic
trading strategies in real-time.2 However, for statisticians and econometricians, the vast number
of available models has important implications for formalizing model selection and specification
testing methods. This has led to several key papers that have recently been published in the
area of parametric and non-parametric specification testing. Most of the papers focus on the
ongoing “search” for correct Markov and stationary models that “fit” historical data and associated
dynamics. In this literature, it is important to note that correct specification of a joint distribution
is not the same as that of a conditional distribution, and hence the recent focus on conditional
distributions, given that most models have an interpretation as conditional models. In summary, the
key issue in the construction of model selection and specification tests of conditional distributions
is the fact that knowledge of the transition density (or conditional distribution) in general cannot
be inferred from knowledge of the drift and variance terms of a diffusion model. If the functional
form of the density is available parametrically, though, one can test the hypothesis of correct
specification of a diffusion via the probability integral transform approach of Diebold, Gunther,
and Tay (1998); the cross-spectrum approach of Hong (2001), Hong and Li (2005) and Hong, Li,
and Zhao (2007); the martingalization-type Kolmogorov test of Bai (2003); or via the normality
1For complete details, see Section 2.2.2For further discussion, see Duong and Swanson (2010, 2011).

transformation approaches of Bontemps and Meddahi (2005) and Duan (2003). Furthermore, if
the transition density is unknown, one can construct a non-parametric test by comparing a kernel
density estimator of the actual and simulated data, for example, as in Altissimo and Mele (2009)
and Thompson (2008); or by comparing the conditional distribution of the simulated and the
historical data, as in Bhardwaj, Corradi, and Swanson (BCS: 2008). One can also use the methods
of Aït-Sahalia (2002) and Aït-Sahalia, Fan, and Peng (2009), in which they compare closed form
approximations of conditional densities under the null, using data-driven kernel density estimates.
For clarity and ease of presentation, we categorize the above literature into two areas. The
first area, initiated by the seminal work of Aït-Sahalia (1996) and later followed by Pritsker (1998)
and Jiang (1998), breaks new ground in the continuous time specification testing literature by
comparing marginal densities implied by hypothesized null models with nonparametric estimates
thereof. These sorts of tests examine one factor specifications. The second area of testing, as
initiated in Corradi and Swanson (CS: 2005) does not look at densities. Instead, they compare
cumulative distributions (marginal, joint, or conditional) implied by a hypothesized null model
with corresponding empirical distributions. A natural extension of these sorts of tests involves
model selection amongst alternative predictive densities associated with competing models. While
CS (2005) focus on cases where the functional form of the conditional density is known, BCS (2008)
use simulation methods to examine testing in cases where the functional form of the conditional
density is unknown. Corradi and Swanson (CS: 2011) and Cai and Swanson (2011) take the analysis
of BCS (2008) on Step further, and focus on the comparison of out of sample predictive accuracy of
possibly misspecified diffusion models, when the conditional distribution is not known in closed form
(i.e., they “choose” amongst competing models based on predictive density model performance).
The “best” model is selected by constructing tests that compare both predictive densities and/or
predictive conditional confidence intervals associated with alternative models
In this paper, we primarily focus our attention on the second area of the model selection and
testing literature.3 One feature of all of the tests that we shall discuss is that, given that they are
based on the comparison of CDFs, they obtain parametric rates. Moreover, the tests can be used
to evaluate single and multiple factor and dimensional models, regardless of whether or not the
functional form of the conditional distribution is known.
In addition to discussing simple diffusion process specification tests of CS (2005), we discuss
tests discussed in BCS (2008) and CS (2011), and provide some generalizations and additional
results. In particular, parametric specification tests in the spirit of the conditional Kolmogorov
test of Andrews (1997) that rely on block bootstrap resampling methods in order to construct test
critical values are first discussed. Thereafter, extensions due to BCS (2008) for cases where the
3For a recent survey on results in the first area of this literature, see Aït-Sahalia (2007).

functional form of the conditional density is unknown are introduced, and related continuous time
simulation methods are introduced. Finally, we broaden our discussion from single dimensional
specification testing to multiple dimensional selection by discussing how to construct predictive
densities and how to compare the accuracy of predictive densities derived from alternative (possibly
misspecified) diffusion models as in CS (2011). In addition, we generalize simulation and testing
procedures introduced in Cai and Swanson (2011) to more complicated multi-factor and multi-
dimensional models where the number of latent variables larger than three. These final tests can
be thought of as continuous time generalizations of the discrete time “reality check” test statistics
of White (2000), which are widely used in empirical finance (see e.g. Sullivan, Timmermann
and White (1999, 2001)). We finish the chapter with an empirical illustration of model selection
amongst alternative short term interest rate models, drawing on BCS (2008), CS (2011) and Cai
and Swanson (2011).
Of the final note is that the test statistics discussed here are implemented via use of simple
bootstrap methods for critical value simulation. We use the bootstrap because the covariance
kernels of the (Gaussian) asymptotic limiting distributions of the test statistics are shown to contain
terms deriving from both the contribution of recursive parameter estimation error (PEE) and the
time dependence of data. Asymptotic critical value thus cannot be tabulated in a usual way.
Several methods can easily be implemented in this context. First one can use block bootstrapping
procedures, as discussed below. Second one can use the conditional p-value approach of Corradi
and Swanson (2002) which extends the work of Hansen (1996) and Inoue (2001) to the case of
non vanishing parameter estimation error. Third is the subsampling method of Politis, Romano
and Wolf (1999), which has clear efficiency “costs”, but is easy implement. Use of the latter two
methods yields simulated (or subsample based) critical values that diverge at rate equivalent to the
blocksize length under the alternative. This is the main drawback to their use in our context. We
therefore focus on use of a block bootstrap that mimics the contribution of parameter estimation
error in a recursive setting and in the context of time series data. In general, use of the block
bootstrap approach is made feasible by establishing consistency and asymptotic normality of both
simulated generalized method of moments (SGMM) and nonparametric simulated quasi maximum
likelihood (NPSQML) estimators of (possibly misspecified) diffusion models, in a recursive setting,
and by establishing the first-order validity of their bootstrap analogs.
The rest of the paper is organized as follows. In Section 2, we present our setup, and discuss
various diffusion models used in finance and financial econometrics. Section 3 outlines the specifica-
tion testing hypotheses, presents the cumulative distribution based test statistics for one factor and
multiple factor models, discusses relevant procedures for simulation and estimation, and outlines
bootstrap techniques that can be used for critical value tabulation. In Section 4, we present a small

empirical illustration. Section 5 summarizes and concludes.
2 Setup
2.1 Diffusion Models in Finance and Financial Econometrics
For the past two decades, continuous time models have taken center stage in the field of financial
econometrics, particularly in the context of structural modeling, option pricing, risk management,
and volatility forecasting. One key advantage of continuous time models is that they allow financial
econometricians to use the full information set that is available. With the availability of high
frequency data and current computation capability, one can update information, model estimates,
and predictions in milliseconds. In this Section we will summarize some of the standard models
that have been used in asset pricing as well as term structure modelling. Generally, assume that
financial asset returns follow Ito-semimartingale processes with jumps, which are the solution to
the following stochastic differential equation system.
(−) =Z
0
((−) 0)− 0
Z
() +
Z
0
((−) 0) () +
X=1
(1)
where(−) is a cadlag process (right continuous with left limit) for ∈ <+ and is an dimensional
vector of variables, () is an −dimensional Brownian motion, (·) is −dimensional functionof (−) and (·) is an x matrix-valued function of (−) where 0 is an unknown true
parameter. is a Poisson process with intensity parameter 0 0 finite, and the −dimensionaljump size, , is with marginal distribution given by Both and are assumed to be
independent of the driving Brownian motion, ().4Also, note thatR() denotes the mean
jump size, hereafter denoted by 0. Over a unit time interval, there are on average 0 jumps; so
that over the time span [0 ] there are on average 0 jumps. The dynamics of (−) is then given
by:
() =¡((−) 0)− 00
¢+ ((−) 0) () +
Z
( ) (2)
where ( ) is a random Poisson measure giving point mass at if a jump occurs in the interval
, and (·) (·) are the “drift" and “volatility" functions defining the parametric specification ofthe model. Hereafter, the same (or similar) notation is used throughout when models are specified.
Though not an exhaustive list, we review some popular models. Models are presented with the
"true" parameters.
Diffusion Models Without Jumps:
4Hereafter, (−) denotes the cadlag, while denotes discrete skeleton for = 1 2 .

Geometric Brownian Motion (log normal model). In this set-up, ((−) 0) = 0() and
((−) 0) = 0()
() = 0()+ 0() ()
where 0 and 0 are constants and and () is a one dimensional standard Brownian motion. (Be-
low, other constants such as 0 , 0 0 0 0 0, 0, and Ω0 are also used in model specifications.)
This model is popular in the asset pricing literature. For example, one can model equity prices
according to this process, especially in the Black-Scholes option set-up or in structured corporate
finance.5 The main drawback of this model is that the return process (log(price)) has constant
volatility, and is not time varying. However, it is widely used as a convenient “first" econometric
model.
Vasicek (1977) and Ornstein-Uhlenbeck process. The process is used to model asset prices,
specifically in term structure modelling, and the specification is:
() = (0 + 0())+ 0 ()
where () is a standard Brownian motion, and 0, 0 and 0 are constants. 0 is negative to
ensure the mean reversion of ().
Cox, Ingersoll and Ross (1995) use the following square root process to model the term structure
of interest rates:
() = (0 −())+ 0p() ()
where () is a standard Brownian motion, 0 is the long-run mean of () measures the speed
of mean-reversion, and 0 is a standard deviation parameter and is assumed to be fixed. Also,
non-negativity of the process is imposed, as 20 20
Wong (1964) points out that in the CIR model, () with the dynamics evolving according to:
() = ((0 − 0)−())+p0() () 0 0 and 0 − 0 0 (3)
belongs to the linear exponential (or Pearson) family with a closed form cumulative distribution.
0 and 0 are fixed parameters of the model.
The Constant Elasticity of Variance, or CEV model is specified as follows:
() = 0()+ 0()02 ()
where () is a standard Brownian motion and 0 0 and 0 are fixed constants.
Of note is that the interpretation of this model depends on 0 i.e. in the case of stock prices,
if 0 = 2, then the price process () follows a lognormal diffusion; if 0 2 , then the model
captures exactly the leverage effect as price and volatility are inversely correlated.
5See Black and Scholes (1973) for details.

Among other authors, Beckers (1980) uses this CEV model for stocks, Marsha and Rosenfeld
(1983) apply a CEV parametrization to interest rates and Emanuel and Macbeth (1982) utilize this
set-up for option pricing.
The Generalized constant elasticity of variance model is defined as follows:
() = (0()−(1−0) + 0())+ 0()
02 ()
where the notation follows the CEV case. 0 is another parameter of the model. This process nests
log diffusion when 0 = 2 and nests square root diffusion when 0 = 1
Brennan and Schwartz (1979) and Courtadon (1982) analyze the model:
() = (0 + 0())+ 0()2 ()
where 0 0 0 are fixed constants and () is a standard Brownian motion.
Duffie and Kan (1993) study the specification:
() = (0 −())+p0 + 0() ()
where () is a standard Brownian motion and 0 0 and 0 are fixed parameters.
Aït-Sahalia (1996) looks at a general case with general drift and CEV diffusion:
() = (0 + 0() + 0()2 + 0())+ 0()
02 ()
In the above expression, 0 0 0 0 0 and 0 are fixed constants and () is again a standard
Brownian motion.
Diffusion Models with Jumps:
For term structure modeling in empirical finance, the most widely studied class of models is the
family of affine processes, including diffusion processes that incorporate jumps.
Affine Jump Diffusion Model : (−) is defined to follow an affine jump diffusion if
() = 0(0 −())+Ω0p() () + ()
where (−) is an −dimensional vector of variables of interest and is a cadlag process, () is an
−dimensional independent standard Brownian motion, 0 and Ω0 are square × matrices,
0 is a fixed long-run mean, () is a diagonal matrix with diagonal element given by
() = 0 + 00()
In the above expressions, 0 and 00 are constants. The jump intensity is assumed to be a
positive, affine function of () and the jump size distribution is assumed to be determined by it’s
conditional characteristic function. The attractive feature of this class of affine jump diffusions is

that, as shown in Duffie, Pan and Singleton (2000), it has an exponential affine structure that can
be derived in closed form, i.e.
Φ(()) = exp(() + ()0())
where the functions () and () can be derived from Riccati equations.6 Given a known
characteristic function, one can use either GMM to estimate the parameters of this jump diffusion,
or one can use quasi-maximum likelihood (QML), once the first two moments are obtained. In the
univariate case without jumps, as a special case, this corresponds to the above general CIR model
with jumps.
Multifactor and Stochastic Volatility Model: Multifactor models have been widely used
in the literature; particularly in option pricing, term structure, and asset pricing. One general set-
up has (() ())0 =¡() 1() ()
¢0where only the first element, the diffusion process
is observed while () = (1() ())0x1 is latent. In addition, () can be dependent on
() For instance, in empirical finance, the most well-known class of the multifactor models is the
stochastic volatility model expressed as:µ()
()
¶=
µ1(() 0)
2( () 0)
¶+
µ11( () 0)
0
¶1() +
µ12( () 0)
22( () 0)
¶2() (4)
where1()1x1 and2()1x1 are independent standard Brownian motions and () is latent volatil-
ity process. 1(·) is a function of () and 2(·) 11(·) 22(·) and 22(·) are general functions of () such that system of equations (4) is well-defined. Popular specifications are the square-root
model of Heston (1993), the GARCH diffusion model of Nelson (1990), lognormal model of Hull
and White (1987) and the eigenfunction models of Meddahi (2001). Note that in this stochastic
volatility case, the dimension of volatility is = 1 More general set-up can involve driving
Brownian motions in () equation.
As an example, Andersen and Lund (1997) study the generalized CIR model with stochastic
volatility, specifically
() = 0(0 −())+p ()1()
() = 0(0 − ())+ 0p ()2()
where() and () are price and volatility processes, respectively, 0 0 0 to ensure stationar-
ity, 0 is the long-run mean of (log) price process, and 0 and 0 are constants. 1() and2() are
scalar Brownian motions. However, 1() and 2() are correlated such that 1()2() =
where the correlation is some constant ∈ [−1 1]. Finally, note that volatility is a square-rootdiffusion process, which requires that 00 20
6For details, see Singleton (2006), page 102.

Stochastic Volatility Model with Jumps (SVJ): A standard specification is:
() = 0 (0 −()) +p ()1 () + −
() = 0 (0 − ()) + 0p ()2 ()
where and are Poisson processes with jump intensity parameters and respectively, and
are independent of the Brownian motions 1 () and 2 () In particular, is the probability of
a jump up, Pr ( () = 1) = and is the probability of a jump down, Pr ( () = 1) =
and are jump up and jump down sizes and have exponential distributions: () =1exp
³−
´and () =
1exp
³−
´ where 0 are the jump magnitudes, which are the means of
the jumps, and
Three Factor Model (CHEN): The three factor model combines various features of the above
models, by considering a version of the oft examined 3-factor model due to Chan, Karolyi, Longstaff
and Sanders (1992), which is discussed in detail in Dai and Singleton (2000). In particular,
() = 0 ( ()− ()) +p ()1 ()
() = 0 ( − ()) + 0p ()2 () (5)
() = 0¡0 − ()
¢+ 0
p ()3 ()
where1 () 2 () and3 () are independent Brownian motions, and and are the stochastic
volatility and stochastic mean of (), respectively. 0 0 0 0 0 0 0 are constants. As
discussed above, non-negativity for () and () requires that 200 20 and 200 20
Three Factor Jump Diffusion Model (CHENJ): Andersen, Benzoni and Lund (2004) extend the
three factor Chen (1996) model by incorporating jumps in the short rate process, hence improving
the ability of the model to capture the effect of outliers, and to address the finding by Piazzesi
(2004, 2005) that violent discontinuous movements in underlying measures may arise from monetary
policy regime changes. The model is defined as follows:
() = 0 ( ()− ()) +p ()1 () + − (6)
() = 0 (0 − ()) + 0p ()2 ()
() = 0¡0 − ()
¢+ 0
p ()3 () (7)
where all parameters are similar as in (5), 1 () 2 () and 3 () are independent Brownian
motions, and are Poisson processes with jump intensities 0 and 0 respectively, and are
independent of the Brownian motions (), () and () In particular, 0 is the probability
of a jump up, Pr ( () = 1) = 0 and 0 is the probability of a jump down, Pr ( () = 1) =
0 and are jump up and jump down sizes and have exponential distributions () =
10exp
³−
0
´and () =
10exp
³−
0
´ where 0 0 0 are the jump magnitudes, which
are the means of the jumps and

2.2 Overview on Specification Tests and Model Selection
The focus in this paper is specification testing and model selection. The “tools” used in this litera-
ture have been long established. Several key classical contributions include the Kolmogorov-Smirnov
test (see e.g. Kolmogorov (1933) and Smirnov (1939)), various results on empirical processes (see
e.g. Andrews (1993) and the discussion in chapter 19 of van der Vaart (1998) on the contributions of
Glivenko, Cantelli, Doob, Donsker and others), the probability integral transform (see e.g. Rosen-
blatt (1952)), and the Kullback-Leibler Information Criterion (see e.g. White (1982) and Vuong
(1989)). For illustration, the empirical distribution mentioned above is crucial in our discussion of
predictive densities because it is useful in estimation, testing, and model evaluation. Let is a
variable of interest with distribution and parameter 0. The theory of empirical distributions
provides a result that
1√
X=1
(1 ≤ − (|0))
satisfies a central limit theorem (with a parametric rate) if is large (i.e., asymptotically). In the
above expression, 1 ≤ is the indicator function which takes value 1 if ≤ and 0 otherwise.
In the case where there is parameter estimation error, we can use more general results in chapter
19 of van der Vaart (1998). Define
() =1
X=1
() and () =
Z
where is a probability measure associated with Here, () converges to () almost
surely for all the measurable functions for which () is defined . Suppose one wants to test
the null hypothesis that belongs to a certain family 0 : 0 ∈ Θ where 0 is unknown; it isnatural to use a measure of the discrepancy between and for a reasonable estimator b of0 In particular, if b converges to 0 at a root- rate, 1√
( − ) has been shown to satisfy a
central limit theorem.7
With regard to dynamic misspecification and parameter estimation error, the approach dis-
cussed for the class of tests in this paper allows for the construction of statistics that admit for
dynamic misspecification under both hypotheses. This differs from other classes of tests such as the
framework used by Diebold, Gunther and Tay (DGT: 1998), Hong (2001), and Bai (2003) in which
correction dynamic specification under the null hypothesis is assumed. In particular, DGT use the
probability integral transform to show that (|=−1 0) =R −∞ (|=−1 0) is identically
and independently distributed as a uniform random variable on [0; 1], where (·) and (·) are aparametric distribution and density with underlying parameter 0, is again our random variable
7See Theorem 19.23 in van der Vaart (1998) for details.

of interest, and = is the information set containing all “relevant” past information. They thus sug-
gest using the difference between the empirical distribution of (|=−1b) and the 45 - degreeline as a measure of “goodness of fit”, where b is some estimator of 0. This approach has beenshown to be very useful for financial risk management (see e.g. Diebold, Hahnand, Tay (1999)),
as well as for macroeconomic forecasting (see e.g. Diebold, Tay and Wallis (1998) and Clements
and Smith (2000,2002)). Similarly, Bai (2003) develops a Kolmogorov type test of (|=−1 0)
on the basis of the discrepancy between (|=−1b) and the CDF of a uniform on [0; 1]. As
the test involves estimator b, the limiting distribution reflects the contribution of parameter esti-mation error and is not nuisance parameter free. To overcome this problem, Bai (2003) proposes
a novel approach based on a martingalization argument to construct a modified Kolmogorov test
which has a nuisance parameter free limiting distribution. This test has power against violations
of uniformity but not against violations of independence. Hong (2001) proposes another related
interesting test, based on the generalized spectrum, which has power against both uniformity and
independence violations, for the case in which the contribution of parameter estimation error van-
ishes asymptotically. If the null is rejected, Hong (2001) also proposes a test for uniformity robust
to non independence, which is based on the comparison between a kernel density estimator and the
uniform density. Two features differentiate the tests surveyed in this paper from the tests outlined
in the other papers mentioned above. First, the tests discussed here assume strict stationarity.
Second, they allow for dynamic misspecification under the null hypothesis. The second feature
allows us to obtain asymptotically valid critical values even when the conditioning information set
does not contain all of the relevant past history. More precisely, assume that we are interested in
testing for correct specification, given a particular information set which may or may not contain
all of the relevant past information. This is important when a Kolmogorov test is constructed, as
one is generally faced with the problem of defining =−1 If enough history is not included, then
there may be dynamic misspecification. Additionally, finding out how much information (e.g. how
many lags) to include may involve pre-testing, hence leading to a form of sequential test bias.
By allowing for dynamic misspecification, such pre-testing is not required. Also note that critical
values derived under correct specification given =−1 are not in general valid in the case of correct
specification given a subset of =−1. Consider the following example. Assume that we are interested
in testing whether the conditional distribution of |−1 follows normal distribution (1−1 1).Suppose also that in actual fact the “relevant” information set has =−1 including both −1and
−2, so that the true conditional model is |=−1 = |−1 −2 = (1−1 + 2−2 2) In
this case, correct specification holds with respect to the information contained in −1; but there is
dynamic misspecification with respect to −1and −2. Even without taking account of parameter
estimation error, the critical values obtained assuming correct dynamic specification are invalid,

thus leading to invalid inference. Stated differently, tests that are designed to have power against
both uniformity and independence violations (i.e. tests that assume correct dynamic specification
under the null) will reject; an inference which is incorrect, at least in the sense that the “normal-
ity” assumption is not false. In summary, if one is interested in the particular problem of testing
for correct specification for a given information set, then the approach of tests in this paper is
appropriate
3 Consistent Distribution-Based Specification Tests and Predic-
tive Density Type Model Selection for Diffusion Processes
3.1 One Factor Models
In this Section we outline the set-up for the general class of one factor jump diffusion specifications.
All analysis carry through to the more complicated case of multi-factor stochastic volatility models
which we will elaborate upon in the next Subsection. In the presentation of the tests, we follow a
view that all candidate models, either single or multiple dimensional ones, are approximations of
reality, and can thus be misspecified. The issue of correct specification (or misspecification) of a
single model and the model selection test for choosing amongst multiple competing models allow
for this feature.
To begin, fix the time interval [0 ] consider a given single one factor candidate model the
same as (1), with the true parameters 0 0 0 to be replaced by it’s the pseudo true analogs
† respectively and 0 ≤ ≤ :
(−) =Z
0
((−) †)−
Z
() +
Z
0
((−) †) () +
X=1
or
(−) =³((−) †)−
´+ ((−) †) () +
Z
( ) (8)
where variables are defined the same as in (1) and (2). Note that as the above model is the one
factor version of (1) and (2) where the dimension of (−) is 1x1, () is a one-dimensional
standard Brownian motion and jump size, and is one dimensional variable for all . Also note
that both and are assumed to be independent of the driving Brownian motion.
If the single model is correctly specified, then ((−) †) = 0((−) 0), ((−) †) =0((−) 0) = 0 = 0 and = 0 where 0((−) 0) 0((−) 0) 0 0 0 are un-known and belong to the true specification.
Now consider a different case (not a single model) where candidate models are involved. For
model with 1 ≤ ≤ denote it’s corresponding specification to be (((−) †) ((−)
†)

) Two scenarios immediate arise. Firstly, if the model is correctly specified, then
((−) †) = 0((−) 0) ((−)
†) = 0((−) 0) = 0 = 0 and = 0
which are similar to the case of a single model. In the second scenario, all the models are likely to
be misspecified and modelers are faced with the choice of selecting the "best" one. This type of
problem is well-fitted into the class of accuracy assessment tests initiated earlier by Diebold and
Mariano (1995) or White (2000).
The tests discussed hereafter are Kolomogorov type tests based on the construction of cumula-
tive distribution functions (CDFs). In a few cases, the CDF is known in closed form. For instance,
for the simplified version of the CIR model as in (3), () belongs to the linear exponential (or
Pearson) family with the gamma CDF of the form:8
( ) =
R 0(2)−2(1−)−1 exp(−(
2))
Γ(2(1− )) where Γ() =
Z ∞
0
exp(−) (9)
and are constants.
Furthermore, if we look at the pure diffusion process without jumps:
() = (() †)+ (() †) () (10)
where (·) and = (·) are drift and volatility functions, it is known that the stationary density,say ( †) associated with the invariant probability measure can be expressed explicitly as:9
( †) =(†)
2( †)exp
ÃZ 2( †)2( †)
!
where (†) is a constant ensuring that integrates to one. The CDF, say ( †) =R
( †)
can then be obtained using available numerical integration procedures.
However, in most cases, it is impossible to derive the CDFs in closed form. To obtain a CDF in
such cases, a more general approach is to use simulation. Instead of estimating the CDF directly,
simulation techniques estimates the CDF indirectly utilizing it’s generated sample paths and the
theory of empirical distributions. The specification of a specific diffusion process will dictate the
sample paths and thereby corresponding test outcomes.
Note that in the historical context, many early papers in this literature are probability density-
based. For example, in a seminal paper, Ait-Sahalia (1996) compares the marginal densities implied
by hypothesized null models with nonparametric estimates thereof. Following the same framework
of correct specification tests, CS(2005) and BCS (2008), however, do not look at densities. Instead,
they compare the cumulative distribution (marginal or joint) implied by a hypothesized null model
with the corresponding empirical distribution. While CS (2005) focus on the known unconditional
8See Wong (1964) for details.9See Karlin and Taylor (1981) for details.

distribution, BCS (2008) look at the conditional simulated distributions. CS (2011) make extensions
to multiple models in the context of out of sample accuracy assessment tests. This approach is
somewhat novel to this continuous time model testing literature.
Now suppose we observe a discrete sample path 12 (also referred as skeletons).10
The corresponding hypotheses can be set up as follows:
Hypothesis 1: Unconditional Distribution Specification Test of a Single Model
0 : ( †) = 0( 0) for all a.s.
: Pr¡ ( †)− 0( 0) 6= 0
¢ 0, for some ∈ with non-zero Lebesgue measure.
where 0( 0) is the true cumulative distribution implied by the above density, i.e. 0( 0) =
Pr( ≤ ). ( †) = Pr³† ≤
´is the cumulative distribution of the proposed model. †
is a skeleton implied by model (8).
Hypothesis 2: Conditional Distribution Specification Test of A Single Model
0 : (| †) = 0 (| 0) for all a.s.
: Pr¡ (|
†)− 0 (| 0) 6= 0¢ 0, for some ∈ with non-zero Lebesgue mea-
sure.
where (| †) = Pr
³†+ ≤ |†
=
´is -Step ahead conditional distributions and
= 1 − . 0 (| 0) is -Step ahead true conditional distributions .
Hypothesis 3: Predictive Density Test for Choosing Amongst Multiple Competing
Models
The null hypothesis is that no model can outperform model 1 which is the benchmark model.11
0 : max=2
ÃÆ11+ ()
(2)− †11+ ()
(1)
!− (0(2|)− 0(1|))
!2
−
⎛⎝⎛⎝†
+()
(2)− †
+()
(1)
⎞⎠− (0(2|)− 0(1|))
⎞⎠2 : negation of
00
where †
+()
() = (|
†) =
†
µ
†
+ ≤ |†
=
¶ which is the conditional
distribution of + given , and evaluated at under the probability law generated by model
†
+ () with 1 ≤ ≤ − is the skeleton implied by model , parameter † and initial value
Analogously, define 0 (| 0) =
0(+ ≤ |) to be the “true” conditional distribution.
Note that the three hypotheses expressed above apply exactly the same to the case of multifactor
10As mentioned earlier, we follow CS (2005) by using notation (·) when defining continuous time processes and for a skeleton.11See White (2000) for a discussion of a discrete time series analog to this case, whereby point rather than density-
based loss is considered; Corradi and Swanson (2007b) for an extension of White (2000) that allows for parameter
estimation error; and Corradi and Swanson (2006a) for an extension of Corradi and Swanson (2007b) that allows for
the comparison of conditional distributions and densities in a discrete time series context.

diffusions. Now, before moving to the statistics description Section, we briefly explain the intuitions
in facilitating construction of the tests:
In the first case (Hypothesis 1), CS (2005) construct a Kolomogorov type test based on com-
parison of the empirical distribution and the unconditional CDF implied by the specification of the
drift, variance and jumps. Specifically, one can look at the scaled difference between
( †) = Pr³† ≤
´=
Z
( †)
and estimator of the true 0(| 0) the empirical distribution of defined as:
1
X=1
1 ≤
where 1 ≤ is indicator function which takes value 1 if ≤ and 0 otherwise.
Similarly for the second case of conditional distribution (Hypothesis 2), the test statistic can
be a measure of the distance between the − ahead conditional distribution of †+ given
† = as:
(| †) = Pr
³†+ ≤ |†
=
´
to an estimator of the true 0 (| 0) the conditional empirical distribution of + conditional
on the initial value defined as:
1
−
−X=1
1 + ≤
In the third case (Hypothesis 3), model accuracy is measured in terms of a distributional analog
of mean square error. As is commonplace in the out-of-sample evaluation literature, the sample
of observations is divided into two subsamples, such that = + where only the last
observations are used for predictive evaluation. A −Step ahead prediction error under model is11 ≤ + ≤ 2−
³ (2|
†)−
(1| †)´where 2 ≤ ≤ and similarly for model 1
by replacing index with index 1 Suppose we can simulate − paths of −Step ahead skeleton12
using as starting values where = + − from which we can construct a sample of
− prediction errors. Then, these prediction errors can be used to construct a test statistic for
model comparison. In particular, model 1 is defined to be more accurate than model if:
µ³( 1 (2|
†1)−
1 (1| †1))− (
0 (2| 0)− 0 (1| 0))
´2¶
µ³(
(2|
†)−
(1|
†))− (
0 (2| 0)− 0 (1| 0))
´2¶
where(·) is an expectation operator and (11 ≤ + ≤ 2|) = 0 (2| 0)−
0 (1| 0)
Concretely, model is worse than model 1 if on average −Step ahead prediction errors under model is larger than that of model 1.
12See Section 3.3.1 for model simulation details.

Finally, it is important to point out some main features characterized by all the three test
statistics. Processes () hereafter is required to satisfy the regular conditions, i.e. assumptions
A1-A8 in CS (2011). Regarding model estimation (in Section 3.3), † and † are unobserved and
need to be estimated. While CS (2005), BCS (2008) utilize (recursive) Simulated General Method
of Moments (SGMM), CS (2011) make extension to (recursive) Nonparametric Simulated Quasi
Maximum Likelihood (NPSQML). For the unknown distribution and conditional distribution, it
will be pointed out in Section 3.3.2 that ( †), (| †) and
†
+()
() can be replaced
by their simulated counterparts using the (recursive) SGMM and NPSQML parameter estimators.
In addition, test statistics converge to functional of Gaussian processes with covariance kernels that
reflect time dependence of the data and the contribution of parameter estimation error (PEE). Lim-
iting distributions are not nuisance parameter free and critical values thereby cannot be tabulated
by the standard approach. All the tests discussed in this paper rely on the bootstrap procedures
for obtaining the asymptotically valid critical values, which we will describe in Section 3.4.
3.1.1 Unconditional Distribution Tests
For one-factor diffusions, we outline the construction of unconditional test statistics in the context
where CDF is known in closed form. In order to test the Hypothesis 1, consider the following
statistic:
2 =
Z
2()()
where
=1√
X=1
³1 ≤ − (b)
´
In the above expression, is a compact interval and
Z
() = 1 1 ≤ is again the indicator
function which returns value 1 if ≤ and 0 otherwise. Further, as defined in Section 3.3, b
hereafter is a simulated estimator where is sample size and is the discretization interval used
in simulation. In addition, with the abuse of notation, is a generic notation throughout this
paper, i.e. = , the length of each simulation path for (recursive) SGMM and = the
number of random draws (simulated paths) for (recursive) NPQML estimator.13 Also note in our
notation that as the above test is in sample specification test, the estimator and the statistics are
constructed using the entire sample, i.e. b.
It has been shown in CS (2005) that under regular conditions and if the estimator is estimated
by SGMM, the above statistics converges to a functional of Gaussian process.14 In particular, pick
13 is often chosen to coincide with the number of simulated paths used when simulating distributions.14For details and the proof, see Theorem 1 in CS (2005).

the choice →∞ → 0 → 0 and 2 → 0
Under the null,
2 →Z
2()()
where is a Gaussian process with covariance kernel. Hence, the limiting distribution of 2 is
a functional of a Gaussian process with a covariance kernel that reflects both PEE and the time
series nature of the data. As b is root-T consistent, PEE does not disappear in the asymptotic
covariance kernel.
Under , there exists an 0 such that
lim→∞
Pr(1
2 ) = 1
For the asymptotic critical value tabulation, we use the bootstrap procedure. In order to
establish validity of the block bootstrap under SGMM with the presence of PEE, the simulated
sample size should be chosen to grow at a faster rate than the historical sample, i.e. → 0
Thus, we can follow Steps in appropriate bootstrap procedure in Section 3.4. For instance, if
the SGMM estimator is used, the bootstrap statistic is
2∗ =
Z
2∗()()
where
∗ =1√
X=1
³(1∗
≤ − 1 ≤ )− ( (b∗)− (b))´
In the above expression, b∗ is the bootstrap analog ofb and is estimated by the bootstrap
sample ∗1
∗ (see Section 3.4) With appropriate conditions, CS (2005) show that under the
null, 2∗ has a well defined limiting distribution which coincides with that of 2We then can
straightforwardly derive the bootstrap critical value by following Step 1-5 Section 3.4. In particular,
in Step 5, the idea is to perform bootstrap replications ( large) and compute the percentiles
of the empirical distribution of the bootstrap statistics. Reject 0 if 2 is greater than the
(1− )−percentile of this empirical distribution. Otherwise, do not reject 0
3.1.2 Conditional Distribution Tests
Hypothesis 2 tests correct specification of the conditional distribution, implied by a proposed
diffusion model. In practice, the difficulty arises from the fact that the functional form of neither
-Step ahead conditional distributions (| †) nor 0 (| 0) is unknown in most cases.
Therefore, BCS (2008) develop bootstrap specification test on the basis of simulated distribution

using the SGMM estimator.15 With the important inputs leading to the test such as simulated
estimator, distribution simulation and bootstrap procedures to be presented in the next Section16,
the test statistic is defined as:
= sup×∈×
| ( )|
where
( ) =1√
−
−X=1
Ã1
X=1
1
½+ ≤
¾− 1+ ≤
!1 ≤
with and compact sets on the real line. b is the simulated estimator using entire sample
1 and is the number of simulated replications used in the estimation of conditional
distributions as described in Section 3.3. If SGMM estimator is used (similar to unconditional
distribution case and the same as in BCS (2008)), then = , where is the simulation length
used in parameter estimation.
The above statistic is a simulation-based version of the conditional Kolmogorov test of Andrews
(1997), which compare the joint empirical distribution
1
−
−X=1
1+ ≤ 1 ≤
with its semi-empirical/semi-parametric analog given by the product of
1
−
−X=1
0 (| 0)1 ≤
Intuitively, if the null is not rejected, the metric distance between the two should asymptotically
disappear. In the simulation context with parameter estimation error, the asymptotic limit of
however is a nontrivial one. BCS (2008) show that with the proper choice of , i.e.
2 →∞ and 2 → 0 then
→ sup
×∈×|( )|
where ( ) is a Gaussian process with a covariance kernel that characterizes: 1) long-run variance
we would have if we knew 0 (|1 0); 2) the contribution of parameter estimation error; 3) Thecorrelation between the first two.
Furthermore, under there exists some 0 such that:
lim→∞
Pr
µ1√
¶= 1
15 In this paper, we assume that (·) satisfies the regularity conditions stated in CS (2011), i.e. assuptions A1-A8.Those conditions also reflect requirements A1-A2 in BCS (2008). Note that, the SGMM estimator used in BCS (2008)
satisfies the root-N consistency condition that CS (2011) impose on their parameter estimator (See Assumption 4).
16See Sections 3.3 and 3.4 for further details.

As → 0 the contribution of simulation error is asymptotically negligible. The limiting distri-
bution is not nuisance parameter free and hence critical values cannot be tabulated directly from
it. The appropriate bootstrap statistic in this context is:
∗ = sup×∈×
|∗ ( )|
where
∗ ( ) =1√
−
−X=1
Ã1
X=1
1
½∗+ ≤
¾− 1∗
+ ≤ !1 ∗
≤
− 1√ −
−X=1
Ã1
X=1
1
½+ ≤
¾− 1+ ≤
!1 ≤
In the above expression, b∗ is the bootstrap parameter estimated using the resampled data
∗ for = 1 − .
∗+ = 1 and = 1 − is the simulated data underb∗ and ∗
= 1 − is a resampled series constructed using standard block-bootstrap
methods as described in 3.4. Note that in the original paper, BCS (2008) propose bootstrap SGMM
estimator for conditional distribution of diffusion processes. CS (2011) extend the test to the case of
simulated recursive NPSQML estimator. Regarding the generation of the empirical distribution of
∗ (asthmatically the same as ) follow Step 1-5 in the bootstrap procedure in Section 3.4. This
yields bootstrap replications ( large) of ∗ . One can then compare with the percentiles
of the empirical distribution of ∗ and reject 0 if is greater than the (1 − )-percentile.
Otherwise, do not reject 0. Tests carried out in this manner are correctly asymptotically sized,
and have unit asymptotic power.
3.1.3 Predictive Density Tests for Multiple Competing Models
In many circumstances, one might want to compare one (benchmark) model (model 1) against
multiple competing models (models 2 ≤ ≤ ). In this case, recall in the null in Hypothesis
3 is that no model can outperform the benchmark model. In testing the null, we first choose a
particular interval i.e., (1 2) ∈ x where is a compact set so that the objective is evaluation
of predictive densities for a given range of values. In addition, in the recursive setting (not full
sample is used to estimate parameters), if we use the recursive NPSQML estimator, say b1
and b for models 1 and , respectively, then the test statistic is defined as
(1 2) = max
=2(1 2)
where
(1 2)
=1√
−X=
⎛⎝" 1
X=1
1
½1 ≤
11+ () ≤ 2
¾−11 ≤ + ≤ 2
#2

−"1
X=1
1
½1 ≤
+ () ≤ 2
¾−11 ≤ + ≤ 2
#2⎞⎠
All notation is consistent with previous Sections where is the number of simulated replications
used in the estimation of conditional distributions. 11+ () and
+ , = 1 =
1 − are the simulated path under b1 and b If models 1 and are nonnested for
at least one = 2 . Under regular conditions and if are chosen such as →∞and 2 → 0, → where is finite then
max=2
((1 2)− (1 2))→ max
=2(1 2)
where, with an abuse of notation, (1 2) = 1(1 2)− (1 2) and
(1 2) =
⎛⎝ÃÆ
+ ()
(2)− †
+ ()
(1)
!− (0(2|)− 0(1|))
!2⎞⎠
for = 1 and where (1(1 2) (1 2)) is an −dimensional Gaussian randomvariable the covariance kernels that involves error in parameter estimation. Bootstrap statistics are
therefore required to reflect this parameter estimation error issue.17
In the implementation, we can obtain the asymptotic critical value using a recursive version
of the block bootstrap. The idea is that when forming block bootstrap samples in the recursive
setting, observations at the beginning of the sample are used more frequently than observations
at the end of the sample. We can replicate the Step 1-5 in bootstrap procedure in Section 3.4.
It should be stressed the re-sampling in the Step 1 is the recursive one. Specifically, begin by
resampling blocks of length from the full sample, with = For any given it is necessary to
jointly resample +1 + More precisely, let = (+1 + ) = 1 −
Now, resample overlapping blocks of length from This yields ∗ = (∗
∗+1
∗+ )
= 1 − Use these data to construct bootstrap estimator b∗. Recall that is chosen
in CS (2011) as the number of simulated series used to estimate the parameters ( = = ) and
such as → ∞ Under this condition, simulation error vanishes and there is no need to
resample the simulated series.
CS (2011) show that
1√
X=
³b∗ − b
´has the same limiting distribution as
1√
X=
³b − †
´
17See CS (2011) for further discussion.

conditional on all samples except a set with probability measure approaching zero. Given this, the
appropriate bootstrap statistic is:
∗(1 2)
=1√
−X=
⎧⎨⎩⎛⎝" 1
X=1
1
½1 ≤
∗11+ (
∗ ) ≤ 2
¾− 11 ≤ ∗
+ ≤ 2#2
−⎛⎝ 1
X=1
"1
X=1
1
½1 ≤
11+ () ≤ 2
¾− 11 ≤ + ≤ 2
#2⎞⎠⎞⎠−⎛⎝" 1
X=1
1
½1 ≤
∗+ (
∗ ) ≤ 2
¾− 11 ≤ ∗
+ ≤ 2#2
−⎛⎝ 1
X=1
"1
X=1
1
½1 ≤
+ () ≤ 2
¾− 11 ≤ + ≤ 2
#2⎞⎠⎞⎠⎫⎬⎭
As the bootstrap statistic is calculated from the last resampled observations, it is necessary to
have each bootstrap term recentered around the (full) sample mean. This is true even in the case
there is no need to mimic PEE, i.e. the choice of is such that → 0 In such a case, above
statistic can be formed using b rather than b∗
For any bootstrap replication, repeat times ( large) ) bootstrap replications which yield
bootstrap statistics ∗. Reject 0 if is greater than the (1 − )-percentile of the
bootstrap empirical distribution. For numerical implementation, it is of importance to note that in
the case where → 0 → ∞ there is no need to re-estimate b∗1 (b∗) Namely,b
1(b
) can be used in all bootstrap experiments.
Of course, the above framework can also be applied using entire simulated distributions rather
than predictive densities, by simply estimating parameters once, using the entire sample, as opposed
to using recursive estimation techniques, say, as when forming predictions and associated predictive
densities.
3.2 Multifactor Models
Now, let us turn our attention to multifactor diffusion models of the form (() ())0 =¡() 1() ()
¢0
where only the first element, the diffusion process is observed while () = (1() ())0
is latent. The most popular class of the multifactor models is stochastic volatility model expressed
as below:µ()
()
¶=
µ1(()
†)2( ()
†)
¶+
µ11( ()
†)0
¶1() +
µ12( ()
†)22( ()
†)
¶2() (11)

where1()1x1 and2()1x1 are independent Brownian Motions.18 For instance, many term struc-
ture models require the multifactor specification of the above form (see Dai and Singleton (2000)).
In a more complicated case, the drift function can also be specified to be a stochastic process which
poses even more challenges to testing. As mentioned earlier, the hypotheses (Hypothesis 1,2,3)
and the test construction strategy for multifactor models are the same as for one factor model. All
theory essentially applies immediately to multifactor cases. In implementation, the key difference
is in the simulated approximation scheme facilitating parameter and CDF estimation. () cannot
simply be expressed as a function of +1 driving Brownian motions but instead involves a function
of (R 0 ), = 1 +1 (see e.g. Pardoux and Talay (1985) p.30-32 and CS(2005)).
For illustration, we hereafter focus on the analysis of a stochastic volatility model (11) where
drift and diffusion coefficients can be written as
=
µ1(()
†))2( ()
†))
¶ =
µ11( ()
†) 12( () †)
0 22( () †)
¶We also examine a three factor model (i.e., the Chen Model as in (5)) and a three factor model
with jumps, (i.e., CHENJ as in (6)). By presenting two and three factor models as an extension
of our above discussion, we make it clear that specification tests of multiple factor diffusions with
≥ 3 can be easily constructed in similar manner.In distribution estimation, the important challenge for multifactor models lies in the missing
variable issue. In particular, for simulation of , one needs initial values of the latent processes
1 which are unobserved. To overcome this problem, it suffices to simulate the process using
different random initial values for the volatility process, then construct the simulated distribution
using those initial values and average them out. This allows one to integrate out the effect of a
particular choice of volatility initial value.
For clarity of exposition, we sketch out a simulation strategy for a general model of latent
variables in Section 3.3. This generalizes the simulation scheme of three factor models in the Cai
and Swanson (2011). As a final remark before moving to the statistic presentation, note that the
class of multifactor diffusion processes considered in this paper is required to match the regular
conditions as in previous Section (assumption from A1-A8 in CS (2011) with A4 being replaced by
A4’).
18Note that the dimension of (·) can be higher and we can add jumps to the above specification such that itsatisfies the regularity conditions outlined in the one factor case. In addition, CS (2005), provide a detailed discussion
of approximation schemes in the context of stochastic volatility models.

3.2.1 Unconditional Distribution Tests
Following the above discussion on test construction, we specialize to the case of two-factor stochastic
volatility models. Extension to general multidimensional and multifactor models follows similarly.
As the CDF is rarely known in closed form for stochastic volatility models, we rely on simulation
technique. With the simulation scheme, estimators, simulated distributed and bootstrap procedures
to be presented in the next sections (see Section 3.3 and 3.4), the test statistics for Hypothesis 1
turns out to be:
=1√
X=1
Ã1 ≤ − 1
X=1
1( ≤ )
!
In the above expression, recall that is the number of simulation paths used in distribution
simulation, b is a simulated estimator (see Section 3.3). is a generic notation throughout
this paper, i.e. = , the length of each simulation path for SGMM and = the number
of random draws (simulated paths) for NPQML estimator. is the discretization interval used in
simulation. Note that b is chosen in CS (2005) to be SGMM estimator using full sample and
therefore = = .19 To put it simply, one can write b = b.
Under the null, choose to satisfy →∞ → 0 → 0 then:
2 →Z
2()()
where is a Gaussian process with covariance kernel that reflects both PEE and the time dependent
nature of the data. The relevant bootstrap statistic is:
2∗ =1√
X=1
Ã(1∗
≤ − 1 ≤ )− 1(
X=1
1(∗ ≤ )− 1(
≤ ))
!
where b∗ is the bootstrap analogue of b. Repeat the Step 1-5 in the bootstrap procedurein Section 3.4 to obtain critical value which are the percentiles of the empirical distribution of ∗ .
Compare with the percentiles of the empirical distribution of the bootstrap statistic and
reject 0 if is greater than the (1− )-percentile thereof. Otherwise, do not reject 0.
3.2.2 Conditional Distribution Tests
To test Hypothesis 2 for the multifactor models, first we present the test statistic for the case of
the stochastic volatility model ( ) in (11), (i.e., for two factor diffusion), and then we discuss
testing with the three factor model ( 1
2 ) as in (5). Other multiple factor models can be tested
analogously. Note that for illustration, we again assume use of the SGMM estimator b as in
19As seen in assumption A4’ in CS (2011) and Section 3.3 of this paper, can be other estimators such asthe NPSQML estimator. Importantly, satisfies condition A4’ in CS (2011).
the original work of BCS (2008) (namely, b is the simulated estimator described in Section
3.3). Specifically, is chosen as the length of sample path used in parameter estimation. The
associated test statistic is:
= sup×∈×
| ( )|
( ) =1√
−
−X=1
⎛⎝ 1
X=1
X=1
1
½+ ≤
¾− 1+ ≤
⎞⎠ 1 ≤
where + is is - Step ahead simulated skeleton obtained by simulation procedure for multi-
factor model in Subsection 3.4.1.
In a similar manner, the bootstrap statistic analogous to is
∗ = sup×∈×
|∗ ( )|
∗ ( ) =1√
−
−X=1
⎛⎝ 1
X=1
X=1
1
½∗+ ≤
¾− 1∗
+ ≤ ⎞⎠ 1 ∗
≤
− 1√ −
−X=1
⎛⎝ 1
X=1
X=1
1
½+ ≤
¾− 1+ ≤
⎞⎠ 1 ≤
where b∗ is the bootstrap estimator described in Section 3.4. For the three factor model, the
test statistic is defined as
= sup×∈×
| ( )|
( ) =1√
−
−X=1
⎛⎝ 1
2
X=1
X=1
X=1
1
½+ ≤
¾− 1+ ≤
⎞⎠ 1 ≤
and bootstrap statistics is:
∗ ( ) =1√
−
−X=1
⎛⎝ 1
2
X=1
X=1
X=1
1
½∗+ ≤
¾− 1∗
+ ≤ ⎞⎠ 1 ∗
≤
− 1√ −
−X=1
⎛⎝ 1
2
X=1
X=1
X=1
1
½+ ≤
¾− 1+ ≤
⎞⎠ 1 ≤
where+ =
+ (
1
2 ) and
∗+ =
∗+ (
1∗
2∗ )
The first order asymptotic validity of inference carried out using bootstrap statistics formed
as outlined above follows immediately from BCS (2008). For testing decisions, one compares the
test statistics and with the percentiles or the empirical distributions of ∗ and
∗ respectively. Then, reject 0 if the actual statistic is greater than the (1−)-percentileof the empirical distribution of the bootstrap statistic, as in Section 3.4. Otherwise, do not reject
0.

3.2.3 Predictive Density Tests for Multiple Competing Models
For illustration, we present the test for the stochastic volatility model (two factor model). Again,
note that extension to other multi-factor models follows immediately. In particular, all steps in the
construction of the test in the one factor model case carry through immediately to the stochastic
volatility case with the statistic defined as:
= max=2
(1 2)
where
(1 2)
=1√
−X=
⎛⎝⎛⎝ 1
X=1
X=1
1
½1 ≤
11+ (
11 ) ≤ 2
¾−11 ≤ + ≤ 2
⎞⎠2
−⎛⎝ 1
X=1
X=1
1
½1 ≤
+ (
) ≤ 2
¾−11 ≤ + ≤ 2
⎞⎠2⎞⎠
Critical values for these tests can be obtained using a recursive version of the block bootstrap. The
corresponding bootstrap test statistic is:
∗ = max=2
∗(1 2)
where
∗(1 2)
=1√
−X=
⎧⎨⎩⎛⎝⎡⎣ 1
X=1
X=1
1
½1 ≤
∗11+ (
∗
∗11 ) ≤ 2
¾− 11 ≤ ∗
+ ≤ 2⎤⎦2
−⎛⎝ 1
X=1
⎡⎣ 1
X=1
X=1
1
½1 ≤
11+ (
11 ) ≤ 2
¾− 11 ≤ + ≤ 2
⎤⎦2⎞⎠⎞⎠−⎛⎝⎡⎣ 1
X=1
X=1
1
½1 ≤
∗+ (
∗
∗ ) ≤ 2
¾− 11 ≤ ∗
+ ≤ 2⎤⎦2
−⎛⎝ 1
X=1
⎡⎣ 1
X=1
X=1
1
½1 ≤
+ (
) ≤ 2
¾− 11 ≤ + ≤ 2
⎤⎦2⎞⎠⎞⎠⎫⎬⎭
Of note is that we follow CS (2011) by adopting the recursive NPSQML estimator b1 andb for model 1 and , respectively, as introduced in Section 3.3.4 with the choice = = b∗1 andb∗ are bootstrap analogs of
b1 and b respectively (see Section 3.4).
In addition, we do not need to resample the volatility process, although volatility is simulated under
both b and b∗ = 1
Repeat Steps 1-5 in the bootstrap procedure in Section 3.4 to obtain critical values. Compare
with the percentiles of the empirical distribution of ∗ and reject 0 if is
greater than the (1−)-percentile. Otherwise, do not reject 0 Again, in implementation, there
is no need to re-estimate b∗ for each bootstrap replications if → 0 → ∞, assparameter estimation error vanishes asymptotically in this case
3.3 Model Simulation and Estimation
3.3.1 Simulating Data
Approximation schemes are used to obtain simulated distributions and simulated parameter esti-
mators, which are needed in order to construct the tests statistics outlined in previous sections.
We therefore devote the first part of this section to a discussion of the Milstein approximation
schemes that have been used in CS (2005), BCS (2008) and CS (2011). Let be the length of
each simulation path and be the discretization interval, = and be a generic parameter in
simulation expression. We consider three cases:
The pure diffusion process as in (10):
−
(−1) = ((−1) )+ (
(−1) )
−12(
(−1) )0(
(−1) )
+1
2(
(−1) )0(
(−1) )2
where ¡ −(−1)
¢=
∼ (0 )
= 1 with ∼ (0 ); and where 0 is the derivative of (·) with respect to its first
argument. Hereafter, denotes the values of the diffusion at time simulated under generic
and with a discrete interval equal to and so is a fine grain analog of .
The pure jump diffusion process without stochastic volatility as in (??):
(+1) −
= ( )+ (
)(+1) −1
2(
)0(
)
+1
2(
)0(
)2(+1) − +
JX=1
1 ≤ U ≤ ( + 1) (12)
The only difference between this approximation and that used for the pure diffusion is the jump
part. Note that the last term on the right-hand-side (RHS) of (12) is nonzero whenever we have one
(or more) jump realization(s) in the interval [(−1) ]Moreover, as neither the intensity nor thejump size is state dependent, the jump component can be simulated without any discretization error,

as follows. Begin by making a draw from a Poisson distribution with intensity parameter b sayJ . This gives a realization for the number of jumps over the simulation time span. Then, draw Juniform random variables over [0 ] and sort them in ascending order so that U1 ≤ U2 ≤ ≤ UJ These provide realizations for the J jump times. Then, make J independent draws from say
1 J .
SV models without jumps as in (4) (using a generalized Milstein scheme):
(+1) =
+e1(
)+ 11( )1(+1)
+12( )2(+1) +
1
222(
)
12( )
22(+1)
+22( )
11( )
Z (+1)
µZ
1
¶2 (13)
(+1) =
+e2(
)+ 22( )2(+1)
+1
222(
)
22( )
22(+1) (14)
where −12 ∼ (0 1) = 1 2, (120) = 0 for all 6= 0 and
e( ) = Ã e1( )e2( )!=
Ã1( )− 1
222( )
12()
2( )− 1222( )
22()
!
The last terms on the RHS of (13) involve stochastic integrals and cannot be explicitly computed.
However, they can be approximated, up to an error of order () by (see, for example, equation
(3.7), pp. 347 in Kloeden and Platen (1999)):Z (+1)
µZ
1
¶2 ≈
µ1
212 +
p¡12 − 21
¢¶
+
2
X=1
1
³1
³√22 + 2
´− 2
³√21 + 1
´´
where for = 1 2 are (0 1) random variables, =112− 1
22
P=1
12 and
is such that as → 0 →∞
Stochastic Volatility with Jumps
Simulation of sample paths of diffusion processes with stochastic volatility and jumps follows
straightforwardly from the previous two cases. Whenever both intensity and jump size are not
state dependent, a jump component can be simulated and added to either () and/or the ()
in the same manner as above. Extension to general multidimensional and multifactor models both
with and without jumps also follows directly.

3.3.2 Simulating Distributions
In this section we sketch out methods used to construct −step ahead simulated conditional distrib-utions using simulated data. In applications, simulation techniques are needed when the functional
form conditional distribution is unknown. We first illustrate the technique for one factor models
and then discuss multifactor models.
One factor models:
Consider the one factor model as in (8). To estimate the simulated CDFs,
Step 1: Obtain b (using the entire sample) or b (recursive estimator) where b
and b are estimators as discussed in Section 3.3.3 and 3.3.4.
Step 2: Under b or b20, simulate paths of length all having the same starting
value, In particular, for each path = 1 of length generate + () according to
a Milstein schemes detailed in previous section, with = b or b The errors used in
simulation are ∼ (0 ), and = . is assumed to be independent across simulations,
so that () = 0for all 6= and () = for any In addition, as the simulated
diffusion is ergodic, the effect of the starting value approaches zero at an exponential rate, as
→∞.Step 3: If b (b) is used, an estimate for the distribution at time + conditional on
with estimator b(b), is defined as:
b (|b) =1
X=1
1
½+ () ≤
¾
BCS (2008) show that if the model is correctly specified, then 1
P=1 1
½+ () ≤
¾provides
a consistent estimate of the conditional distribution (| †) = Pr
³†+ ≤ |†
=
´
Specifically, assume that → ∞ Then, for the case of SGMM estimator, if → 0
→ 0 and 2 → 0 2 →∞ the following result holds for any ≥ 1 uniformly in
b (|b)− (| †)
→ 0
In addition, if the model is correctly specified (i.e. if (· ·) = 0(· ·) and (· ·) = 0(· ·)) then:
b (|b)− 0 (| 0)→ 0
Step 4: Repeat Steps 1-3 for = 1 − This yields − conditional distributions that are
−Steps ahead which will be used in the construction of the specification tests.
The CDF simulation in the case selection test of multiple models with recursive estimator is
similar. For model let b be the recursive estimator of "pseudo true" † computed using all
20Note that = for the SGMM estimator while = = for NSQML estimator.

observations up to varying time Then, + () is generated according to a Milstein schemes
as in Section 3.3.1, with = b and the initial value = . The corresponding empirical
distribution of the simulated series + () can then be constructed Under some regularity
conditions,
1
X=1
1
½1 ≤
+ () ≤ 2
¾→
†
+()
(2)− †
+()
(1) = −
where †
+()
() is the marginal distribution of †
+ () implied by model (i.e., by the
model used to simulate the series), conditional on the (simulation) starting value Furthermore,
the marginal distribution of †+ () is the distribution of + conditional on the values observed
at time Thus, †
+()
() = (|
†)
Of important note is that in the simulation of + () = 1 , for each = −
we must use the same set of randomly drawn errors and similarly the same draws for numbers
of jumps, jump times and jump sizes. Thus, we only allow for the starting value to change. In
particular, for each = 1 we generate + ()
− (− ) This yields an
x matrix of simulated values, where = −− +1 refers to the length of the out-of-sample
period. +++ (+) (at time + + ) can be seen as periods ahead value "predicted" by
model using all available information up to time + + , = 1 (the initial value +
and b+ estimated using 1 +) The key feature of this setup is that it enables us to
compare "predicted " periods ahead values (i.e. +++ (+)) with actual values that are
periods ahead (i.e., ++ ), for = 1 . In this manner, simulation based tests under ex-ante
predictive density comparison framework can be constructed.
Multifactor model:
Consider the multi-factor model with a skeleton¡
1
¢0(e.g. stochastic mean, sto-
chastic volatility models, stochastic volatility of volatility, etc.) where only the first element is
observed. For simulation of the CDF the difficulty arises as we do not know the initial values of
latent variables ( 1 )0 at each point in timeWe generalize the simulation plan of BCS (2008)
and Cai and Swanson (2011) to the case of dimensions. Specifically, to overcome the initial value
difficulty, a natural strategy is to simulate a long path of length for each latent variable 1
, use them to construct + and the corresponding simulated CDF of + ; and finally, we average
out the volatility values. Note that there are combinations of the initial values 1 For
illustration, consider the case of stochastic volatility ( = 1) and the Chen three factor model as in
(5) ( = 2) using recursive estimators.
For the case of stochastic volatility ( = 1), i.e. ( )0 the steps are as follows:
Step 1: Estimate b using recursive SGMM or NSQML estimation methods.

Step 2. Using the scheme in (14) with = b generate the path for =
1 with = and hence obtain = 1 .
Step 3: Using schemes in (13), (14), simulate x paths of length , setting the initial value for
the observable state variable to be For the initial values of unobserved volatility, use
= 1 as retrieved in Step 2. Also, keep the simulated random innovations (i.e.1.1R (+1)
³R 1
´2) to be constant across each and . Hence, for each replication using
initial values and we obtain
+ () which is a - step ahead simulated value.
Step 4: Now the estimator of (| †) is defined as:
b (|b) =1
X=1
X=1
1
½+ () ≤
¾Note that, by averaging over the initial value of the volatility process, we have integrated out
it’s effect. In other words, 1
P=1 1
½+ () ≤
¾is an estimate of (|
†)
Step 5: Repeat the Steps 1-4 for = 1 − This yields − conditional distributions
that are −steps ahead which will be used in the construction of the specification tests.
For three factor model ( = 2), i.e., ( 1
2 ), consider model (5), where =
¡ 1
2
3
¢are mutually independent standard Brownian motions.
Step 1: Estimate b using SGMM or NSQML estimation methods.
Step 2: Given the estimated parameter b
generate the path 1 and
2 for
= 1 with = and hence obtain 1 ,
2 = 1 .
Step 3: Given the observable and the × simulated latent paths ( 1
and 2
= 1 ) as the start values , we simulate -Step ahead + (
1
2 ).
Since the start values for the two latent variables are × length, so for each we have 2
path. Now to integrate out the initial effect of latent variables, form the estimate of conditional
distribution as
b(|b) = 1
2
X=1
X=1
1
½+ (
1
2 ) ≤
¾
where denotes the simulation.
Step 4: Simulate + S times, that is, repeat Step 3 times i.e. = 1 . The estimate
of (| †) is
b (|b) = 1
X=1
b(|b)
Step 5: Repeat the Steps 1-4 for = 1 − This yields − conditional distributions
that are −steps ahead which will be used in the construction of the specification tests.

As a final remark, for the case of multiple competing models, we can proceed similarly. In
addition, in the next two subsections, we present the exactly identified simulated (recursive) general
method of moments and recursive nonparametric simulated quasi-maximum likelihood estimators
that can be used in simulating distributions as well as constructing test statistics described in
Section 3.2. The bootstrap analogs of those estimators will be discussed in Section 3.4.
3.3.3 Estimation: (Recursive) Simulated General Method of Moments (SGMM) Es-
timators
Suppose that we observe a discrete sample (skeleton) of observations, say (12 )0 from
the underlying diffusion in (8). The (recursive) SGMM estimator b with 1 ≤ ≤ is specified
as:
b = argmin∈Θ
⎛⎝1
X=1
()− 1
X=1
()
⎞⎠0−1
⎛⎝1
X=1
()− 1
X=1
()
⎞⎠(15)
= argmin∈Θ
()0() (16)
where is a vector of moment conditions, Θ ⊂ < (so that we have as many moment conditions
as parameters), and =
[] with = is the simulated path under generic parameter
and with discrete interval . is simulated using the Milstein schemes.
Note that in the above expression, in the context of the specification test b is estimatedusing the whole sample, i.e. = . In the out of sample context, the recursive SGMM estimatorb is estimated recursively using the using sample from 1 up to
Typically, the moment conditions are based on the difference between sample moments of
historical and simulated data or, between sample moments and model implied moments, whenever
the latter are known in closed form. Finally, is the heteroskedasticity and autocorrelation (HAC)
robust covariance matrix estimator, defined as
−1 =
1
X=−
−X=+1+
⎛⎝()− 1
X=1
()
⎞⎠⎛⎝(−)− 1
X=1
()
⎞⎠0 (17)
where = 1− ( + 1) Further, the pseudo true value, †, is defined to be:
† = argmin∈Θ
∞()00∞()
where
∞()00∞() = lim→∞→0
()0();
and where † = 0 if the model is correctly specified.

In the above set up, the exactly identified case is considered rather than the overidentified
(S)GMM. This choice guarantees that ∞(†) = 0 even under misspecification, in the sense that
the model differs from the underlying DGP. As pointed out by Hall and Inoue (2003), the root-N
consistency does not hold for overidentified (S)GMM estimators of misspecified models. In addition,
∇∞(†)0†∞(†) = 0
However, in the case for which the number of parameters and the number of moment conditions is
the same, ∇∞(†)0†is invertible, and so the first order conditions also imply that ∞(†) = 0
Also note that other available estimation methods using moments include the efficient method
of moments (EMM) estimator as proposed by Gallant and Tauchen (1996, 1997), which calculates
moment functions by simulating the expected value of the score implied by an auxiliary model. In
their setup, parameters are then computed by minimizing a chi-square criterion function.
3.3.4 Estimation: Recursive Nonparametric Simulated Quasi Maximum Likelihood
Estimators
In this section we outline a recursive version of the NPSQML estimator of Fermanian and Salani´e
(2004), proposed by CS (2011). The bootstrap counterpart of the recursive NPSQML estimator
will be presented in the next section.
One factor models:
Hereafter, let ¡|−1 †
¢be the conditional density associated with the above jump diffusion
If is known in closed form, we can just estimate † recursively, using standard QML as:21
b = argmax∈Θ
1
X=2
ln ( |−1 ) = + − 1 (18)
Note that, similarly to the case of SGMM, the pseudo true value † is optimal in the sense:
† = argmax∈Θ
(ln (|−1 )) (19)
for the case is not known in closed form, we can follow Kristensen and Shin (2008) and CS (2011)
to construct the simulated analog b of and then use it to estimate †. b is estimated as functionof the simulated sample paths
(−1) for = 2 − 1 = 1 First, generate − 1paths of length one for each simulation replication, using −1 with = 1 as starting values.
Hence, at time and simulation replication we obtain skeletons (−1) for = 2 − 1
= 1 where is the number of simulation paths (number of random draws or (−1)
21Note that as model is, in general, misspecified,−1
=1 (|−1 ) is a quasi-likelihood and
|−1
†
is not necessarily a martingale difference sequence.

and (−1) are i.i.d.) for each simulation replication. is fixed across all initial values. Then
the recursive NPSQML estimator is defined as follows:
b = argmax∈Θ
1
X=2
ln b (|−1 ) ³ b (|−1 )
´ ≥
where b (|−1 ) =1
X=1
Ã(−1)−
!
Note that with abuse of notation, we define b for SGMM and b for NPSQML estimators
where and have different interpretations ( is the length of each simulation path and is
number of random draws).
The function
³ b (|−1 )´is a trimming function. It has some characteristics such
as positive and increasing,
³ b (−1 )´= 0 if b (−1 ) and
³ b (−1 )´= 1 if b (−1 ) 2 for some 0.22 Note that when the log
density is close to zero, the derivative tends to infinity and thus even very tiny simulation errors
can have a large impact on the likelihood. The introduction of the trimming parameter into the
optimization function ensures the impact of this case to be minimal asymptotically.
Multifactor Models:
Since volatility is not observable, we cannot proceed as in the single factor case when estimating
the SV model using NPSQML estimator. Instead, let be generated according to (14), setting
= and = 1 The idea is to simulate different starting values for unobservable
volatility, construct the simulated likelihood functions accordingly and then average them out. For
each simulation replication at time , we simulate different values of (−1 ) by generating
paths of length one, using fixed observable −1 and unobservable , = 1 as starting
values Repeat this procedure for any = 1 − 1, and for any set = 1 of random
errors 1+(+1) and 2+(+1) = 1 1 Note that it is important to use the same set of
random errors 1+(+1) and 2+(+1) across different initial values for volatility. Denote the
simulated value at time simulation replication under generic parameter using −1 as
starting values as (−1
) Then:
b (|−1 ) =1
X=1
1
X=1
Ã(−1
)−
!
22Fermanian and Salanie (2004) suggest using the following triming function:
() =4(− )
3
3− 3(− )4
4
for ≤ ≤ 2

and note that by averaging over the initial values for the unobservable volatility, its effect is inte-
grated out. Finally, define:23
b = argmin∈Θ
1
X=2
ln b (|−1 ) ³ b (|−1 )
´ ≥
Note that in this case, is no longer Markov (i.e., and are jointly Markovian, but
is not). Therefore, even in the case of true data generating process, the joint likelihood cannot be
expressed as the product of the conditional and marginal distributions Thus, b is necessarily
a QML estimator. Furthermore, note that ∇(|−1 †) is no longer a martingale difference
sequence; therefore, we need to use HAC robust covariance matrix estimators, regardless of whether
the model is the “correct” model or not.
3.4 Bootstrap Critical Value Procedures
The test statistics presented in Section 3.1 and 3.2 are implemented using critical values constructed
via the bootstrap. As mentioned earlier, motivation for using the bootstrap is clear. The covariance
kernel of the statistics limiting distributions contain both parameter estimation error and the data
related time dependence components. Asymptotic critical value cannot thus be tabulated in a
usual way. Several methods have been proposed to tackle this issue. One is the block bootstrap
procedures which we discuss. Others have been mentioned above.
With regarding to the validity of the bootstrap, note that, in the case of dependent observations
without PEE, we can tabulate valid critical value using a simple empirical version of the Künsch
(1989) block bootstrap. Now, the difficulty in our context lies in accounting for parameter estima-
tion error. Goncalves and White (2002) establish the first order validity of the block bootstrap for
QMLE (or m-estimator) for dependent and heterogeneous data. This is an important result for the
class of SGMM and NSQML estimators surveyed in this paper, and allows Corradi and Swanson
in CS (2011) and elsewhere to develop asymptotically valid version of the bootstrap that can be
applied under generic model misspecification, as assumed throughout this paper.
For the SGMM estimator, as shown in CS (2005) the first order validity of the block bootstrap
is valid in the exact identification case, and when → 0. In this case, SGMM is asymptotically
equivalent to GMM, and consequently there is no need to bootstrap the simulated series. In
addition, in the exact identification case, GMM estimators can be treated the same way that
QMLE estimators are treated. For the NSQML estimator, CS (2011) point out that the NPSQML
estimator is asymptotically equivalent to the QML estimator. Thus, we do not need to resample
the simulated observations as the negligible contribution of simulation errors.
23For discussion of asymptotic properties of as well as of regularity conditions, see CS(2011).

Also note that critical values for these tests can be obtained using a recursive version of the
block bootstrap. When forming block bootstrap samples in the recursive case, observations at
the beginning of the sample are used more frequently than observations at the end of the sample.
This introduces a location bias to the usual block bootstrap, as under standard resampling with
replacement, all blocks from the original sample have the same probability of being selected. Also,
the bias term varies across samples and can be either positive or negative, depending on the specific
sample. A first-order valid bootstrap procedure for non simulation based−estimators constructedusing a recursive estimation scheme is outlined in Corradi and Swanson (2007a). Here we extend
the results of Corradi and Swanson (2007a) by establishing asymptotic results for cases in which
simulation-based estimators are bootstrapped in a recursive setting.
Now the details of bootstrap procedure for critical value tabulation can be outlined in 5 steps
as follows:
Step 1: Let = where denotes the number of blocks and denotes the length of each
block. We first draw a discrete uniform random variable, 1 that can take values 0 1 − with
probability 1( − +1) The first block is given by 1+1 1+We then draw another discrete
uniform random variable, say 2 and a second block of length is formed, say 2+1 2+
Continue in the same manner, until you draw the last discrete uniform say and so the last block is
+1 + Let’s call the ∗ the resampled series, and note that
∗1
∗2
∗ corresponds to
1+11+2 + Thus, conditional on the sample, the only random element is the beginning
of each block. In particular
∗1
∗
∗+1
∗2
∗−+1
∗
conditional on the sample, can be treated as blocks of discrete uniform random variables. For
a simple illustration the link between the bootstrap sample and the original sample. Note that it
can be shown that except a set of probability measure approaching zero,
∗Ã1
X=1
∗
!=1
X=1
+∗ ( ) (20)
∗Ã
1
12
X=1
∗
!=
1
−X=
X=−
( − 1
X=1
)(+ − 1
X=1
)
+∗(2 ) (21)
where ∗ and ∗ denotes the expectation and the variance operators with respect to ∗ (the
probability law governing the resampled series or the probability law governing the uniform
random variables, conditional on the sample), and where ∗( ) ( ∗(2 )) denotes a term
converging in probability ∗ to zero, as → 0 (2 → 0)

In the case of recursive estimators, we proceed the bootstrap similarly as follows. Begin by
resampling blocks of length from the full sample, with = For any given it is necessary to
jointly resample +1 + More precisely, let = (+1 + ) = 1 −
Now, resample overlapping blocks of length from This yields ∗ = (∗
∗+1
∗+ )
= 1 −
Step 2: Re-estimate b∗(b∗) using the bootstrap sample
∗ = (∗
∗+1
∗+ )
= 1 − (or full sample ∗1
∗2
∗ ). Recall that if we use the entire sample for the
estimation, as the specification test in CS(2005) and BCS(2008), then b∗ is denoted asb∗
The bootstrap estimators for SGMM and NPSQML are presented below:
Bootstrap (recursive) SGMM Estimators
If the full sample is used in the specification test as in CS (2005) and BCS(2008), the bootstrap
estimator is constructed straightforward as
b∗ = argmin∈Θ
⎛⎝ 1
X=1
(∗ )−
1
X=1
()
⎞⎠0 ∗−1
⎛⎝ 1
X=1
(∗ )−
1
X=1
()
⎞⎠
where −1 and () are defined in (17) and is the length of each simulation path.
Note that it is convenient not to resample the simulated series as the simulation error vanishes
asymptotically. In implementation, we do not have mimic its contribution to the covariate kernel.
In the case of predictive density type model selection where recursive estimators are needed,
define the bootstrap analog as
b∗ = argmin∈Θ
⎛⎝1
X=1
⎛⎝⎛⎝(∗ )−
1
X0=1
(0)
⎞⎠−Ã 1
X=1
()−
1
X=1
( )
!⎞⎠⎞⎠0
Ω∗−1
⎛⎝1
X=1
⎛⎝⎛⎝(∗ )−
1
X0=1
(0)
⎞⎠−Ã 1
X=1
()−
1
X=1
( )
!⎞⎠⎞⎠= argmin
∈Θ∗()
0Ω∗−1 ∗()
where
Ω∗−1 =1
X=−
−X=+1+
⎛⎝(∗ )−
1
X0=1
(0)
⎞⎠⎛⎝(∗−)−
1
X0=1
(0)
⎞⎠Note that each bootstrap term is recentered around the (full) sample mean. The intuition
behind the particular recentering in bootstrap recursive SGMM estimator is that it ensures that
the mean of the bootstrap moment conditions, evaluated at b is zero, up to a negligible term.Specifically, we have

∗
⎛⎝1
X=1
⎛⎝(∗ )−
1
X0=1
(0)
⎞⎠−Ã 1
X=1
(∗ )− 1
X=1
( )
!⎞⎠= ∗((∗
))−1
X0=1
(0) = ( ) with = ( 12)
where the ( ) term is due to the end block effect (see Corradi and Swanson (2007b) for
further discussion).
Bootstrap Recursive NPSQML Estimators
Let ∗ = (∗
∗+1
∗+ ) = 1 − . For each simulation replication, generate
− 1 paths of length one, using ∗1
∗−1 as starting values, and so obtaining
(
∗−1) for
= 2 − 1 = 1 Further, let:
b∗
¡∗ |∗
−1 ¢=
1
X=1
Ã(
∗−1)−∗
!
Now, for = + − 1, define:
b∗ = argmax∈Θ
1
X=2
³ln b
¡∗ |∗
−1 ¢
³ b
¡∗ |∗
−1 ¢´
−0Ã1
X0=2
∇b (0 |0−1 )b
¡∗0 |∗
−0 ¢ ¯
=
³ b
³0 |0−1b
´´+ 0
³ b
³0 |0−1b
´´∇b (0 |0−1 )
¯ln b
³0 |0−1b
´´´
where 0(·) denotes the derivative of (·) with respect to its argument. Note that each termin the simulated likelihood is recentered around the (full) sample mean of the score, evaluated
at b This ensures that the bootstrap score has mean zero, conditional on the sample. The
recentering term requires computation of ∇b
³0 |0−1b
´ which is not known in closed
form. Nevertheless, it can be computed numerically, by simply taking the numerical derivative of
the simulated likelihood.
Bootstrap Estimators for Multifactor Model
The SGMM and the bootstrap SGMM estimators in the case of multifactor model are similar
as in one factor model. The difference is that the simulation scheme (13) and (14) are used instead
of (12).
For recursive NPSQML estimators, to construct the bootstrap counterpart b∗
of b
since →∞ and →∞ the contribution of simulation error is asymptotically negligible.
Hence, there is no need to resample the simulated observations or the simulated initial values for
volatility. Define:
b
¡∗ |∗
−1 ¢=1
X=1
1
X=1
Ã(
∗−1
)−∗
!

Now, for = + − 1, define:
b∗
= argmax∈Θ
1
X=2
³log b
¡∗ |∗
−1 ¢
³ b
¡∗ |∗
−1 ¢´
−0Ã1
X0=2
∇b
(0 |0−1 )b
¡∗0 |∗
−0 ¢ ¯
³ b
³0 |0−1b
´´+ 0
³ b
³0 |0−1b
´´∇b
(0 |0−1 )¯
ln b
³0 |0−1b
´´´
where 0(·) denotes the derivative with respect to its argument.Of note is that each bootstrap term is recentered around the (full) sample mean. This is
necessary because the bootstrap statistic is constructed using the last resampled observations,
which in turn have been resampled from the full sample. In particular, this is necessary regardless
of the ratio, . In addition, in the case → 0, so that there is no need to mimic parameter
estimation error, the bootstrap statistics can be constructed using b
instead of b∗
Step 3: Using the same set of random variables used in the construction of the actual statistics,
construct ∗+∗ or
∗+∗ = 1 and = 1 − Note that we do not need resample
the simulated series (as →∞simulation error is asymptotically negligible). Instead, simulate
the series using bootstrap estimators and using bootstrapped values as starting values.
Step 4: Corresponding bootstrap statistics 2∗ (or ∗
∗
2∗
∗
∗
depending on the types of tests) which are built on b∗ (b∗) then are followed correspondingly
For the numerical implementation, again, of importance note is that in the case where we pick the
choice → 0 → ∞ there is no need to re-estimate b∗(b∗)
b
(b∗) can
be used in all the bootstrap replications.
Step 5: Repeat the bootstrap Steps 1-4 times, and generate the empirical distribution of
the bootstrap statistics.
4 Summary of Empirical Applications of the Tests
In this section, we briefly review some empirical applications of the methods discussed above. We
start with unconditional distribution test, as in CS (2005), then give a specific empirical example
using the conditional distribution test from BCS (2008). Finally, we briefly discuss on conditional
distribution specification test applied to multiple competing models. The list of the diffusion models
considered are provided in Table 1.
Table 1: Specification Test Hypotheses of Continuous Time Spot Rate Process24
24Note that the 3rd column, "Reference & Data" provides the referenced papers and data used in empirical

Model Specification Reference & Data Hypothesis
Wong25 () = (− − ())+p() ()
CS (2005)
Simulated DataH1
CIR () = ( − ()) +p () ()
BCS (2008)
Eurodollar Rate
(1971-2005)
Cai & Swanson (2011)
Eurodollar Rate
(1971-2008)
H2
H2,H3
CEV () = ( − ()) + () ()
Cai & Swanson (2011)
Eurodollar Rate
(1971-2008)
H2,H3
SV26() = ( − ()) +
p () ()
() = ( − ()) + p () ()
BCS (2008)
Cai & Swanson (2011)
H2
H2,H3
SVJ27() = ( − ()) +
p () () + −
() = ( − ()) + p () ()
BCS (2008)
Cai & Swanson (2011)
H2
H2,H3
CHEN
()= ( ()− ()) +p ()
()= ( − ()) + p () ()
()= ¡− ()¢ +
p () ()
Cai & Swanson (2011)
Euro Dollar Rate
(1971-2008)
H2, H3
CHENJ
()= ( ()− ()) +p () ()+−
()= ( − ()) + p () ()
()= ¡− ()¢ +
p () ()
Cai & Swanson (2011
Euro Dollar Rate
(1971-2008)
H2, H3
Note that specification testing of the first model - a simplified version of the CIR model (we refer
to this model as Wong) is carried out using the unconditional distribution test. With the cumulative
distribution function known in closed form as in (9), the test statistic can be straightforwardly
calculated. It is also convenient to use GMM estimation in this case as the first two moments are
known in closed form, i.e. − and 2( − ) respectively. CS (2005) examine Hypothesis
1 using simulated data. Their Monte Carlo experiments suggest that the test is useful, even for
samples as small as 400 observations.
Hypothesis 2 is tested in BCS (2008) and Cai and Swanson (2011). For illustration, we focus
on the results in BCS (2008) where CIR, SV and SVJ models are empirically tested using the one-
month Eurodollar deposit rate (as a proxy for short rate) for the sample period January 6, 1971
- September 30, 2005, which yields 1,813 weekly observations. Note that one might apply these
tests to other datasets including the monthly federal funds rate, the weekly 3-month T-bill rate,
the weekly US dollar swap rate, the monthly yield on zero-coupon bonds with different maturities,
applications. In the 4th column, H1, H2 and H3 denote Hypothesis 1, Hypothesis 2 and Hypothesis 3, respectively.
The hypotheses are presented corresponding to the references in the third column. For example, for CIR model, H2
corresponds to BCS (2008) and H2, H3 correspond to Cai and Swanson (2011).25This model is a simplified version of the CIR model. For convenience, we refer to this model as Wong.26Data used for Stochatic Volatility (SV) model is the same as in CIR Model.27Data used for Stochatic Volatility and Jump (SVJ) model is the same as in CIR Model.

and the 6-month LIBOR. Some of these variables have been examined elsewhere, for example in
Ait-Sahalia (1999), Andersen, Benzoni and Lund (2004), Dai and Singleton (2000), Diebold and Li
(2006, 2007), and Piazzesi (2001).
The statistic needed to apply the test discussed in Section 3.1.2 is:
= sup∈
| ()|
where
() =1√
−
−X=1
Ã1
X=1
1
½ ≤
+ ≤
¾− 1 ≤ + ≤
!1 ≤ ;
and
∗ = sup∈
|∗ ()|
where
∗ () =1√
−
−X=1
Ã1
X=1
1
½ ≤
∗+∗ ≤
¾− 1 ≤ ∗
+ ≤ !1 ∗
≤
− 1√ −
−X=1
Ã1
X=1
1
½ ≤
+ ≤
¾− 1 ≤ + ≤
!1 ≤
For the case of stochastic volatility models, similarly we have:
= sup∈
| ()|
where
() =1√
−
−X=1
⎛⎝ 1
X=1
X=1
1
½ ≤
+ ≤
¾− 1 ≤ + ≤
⎞⎠ 1 ≤ ;
and its bootstrap analog
∗ = sup∈
|∗ ()|
where
∗ () =1√
−
−X=1
⎛⎝ 1
X=1
X=1
1
½ ≤
∗+∗ ≤
¾− 1 ≤ ∗
+ ≤ ⎞⎠ 1 ∗
≤
− 1√ −
−X=1
⎛⎝ 1
X=1
X=1
1
½ ≤
+ ≤
¾− 1 ≤ + ≤
⎞⎠ 1 ≤
BCS (2008) carry out these tests using − ahead confidence intervals. They set =
1 2 4 12 which corresponds to one week, two week, one month, and one quarter ahead intervalsand set ( ) = ( ± 05 ± ) covering 46.3% and 72.4% coverage, respectively. and
are the mean and variance of an initial sample of data. In addition, = 10 20 and = 5 10 20 50
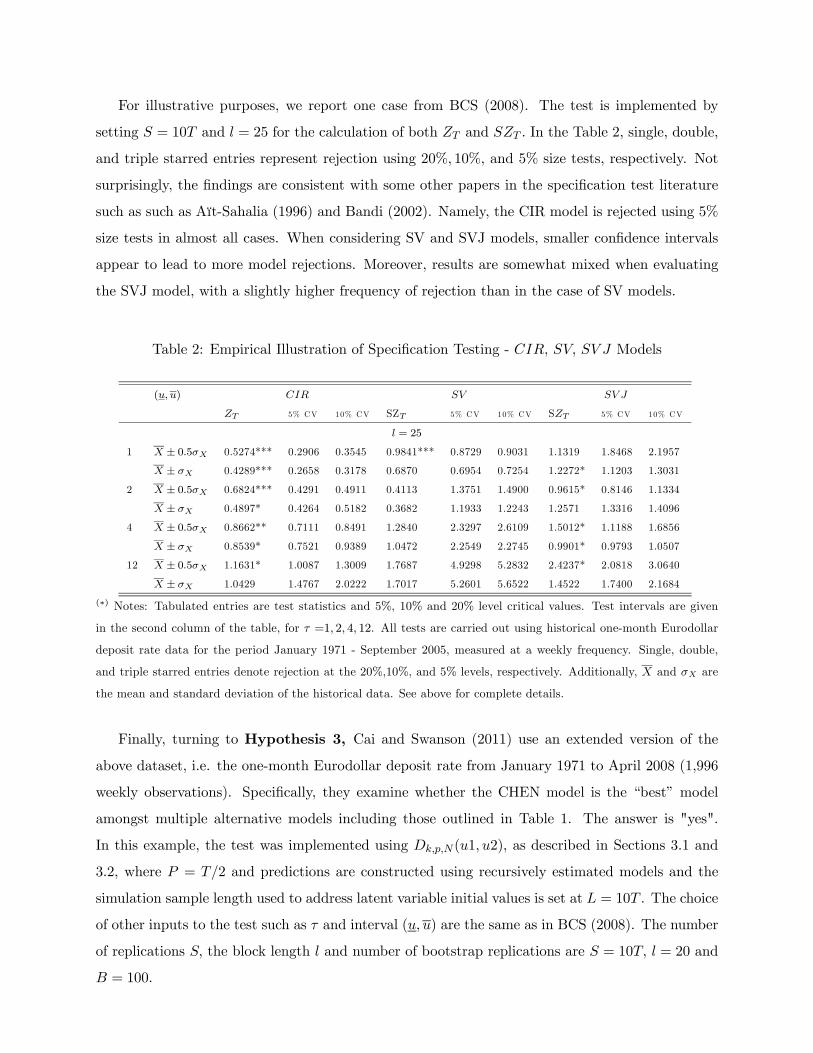
For illustrative purposes, we report one case from BCS (2008). The test is implemented by
setting = 10 and = 25 for the calculation of both and In the Table 2, single, double,
and triple starred entries represent rejection using 20% 10% and 5% size tests, respectively. Not
surprisingly, the findings are consistent with some other papers in the specification test literature
such as such as Aït-Sahalia (1996) and Bandi (2002). Namely, the CIR model is rejected using 5%
size tests in almost all cases. When considering SV and SVJ models, smaller confidence intervals
appear to lead to more model rejections. Moreover, results are somewhat mixed when evaluating
the SVJ model, with a slightly higher frequency of rejection than in the case of SV models.
Table 2: Empirical Illustration of Specification Testing - , Models
( )
5% CV 10% CV SZ 5% CV 10% CV S 5% CV 10% CV
= 25
1 ± 05 0.5274*** 0.2906 0.3545 0.9841*** 0.8729 0.9031 1.1319 1.8468 2.1957
± 0.4289*** 0.2658 0.3178 0.6870 0.6954 0.7254 1.2272* 1.1203 1.3031
2 ± 05 0.6824*** 0.4291 0.4911 0.4113 1.3751 1.4900 0.9615* 0.8146 1.1334
± 0.4897* 0.4264 0.5182 0.3682 1.1933 1.2243 1.2571 1.3316 1.4096
4 ± 05 0.8662** 0.7111 0.8491 1.2840 2.3297 2.6109 1.5012* 1.1188 1.6856
± 0.8539* 0.7521 0.9389 1.0472 2.2549 2.2745 0.9901* 0.9793 1.0507
12 ± 05 1.1631* 1.0087 1.3009 1.7687 4.9298 5.2832 2.4237* 2.0818 3.0640
± 1.0429 1.4767 2.0222 1.7017 5.2601 5.6522 1.4522 1.7400 2.1684
(∗) Notes: Tabulated entries are test statistics and 5%, 10% and 20% level critical values. Test intervals are given
in the second column of the table, for =1 2 4 12. All tests are carried out using historical one-month Eurodollar
deposit rate data for the period January 1971 - September 2005, measured at a weekly frequency. Single, double,
and triple starred entries denote rejection at the 20%,10%, and 5% levels, respectively. Additionally, and are
the mean and standard deviation of the historical data. See above for complete details.
Finally, turning to Hypothesis 3, Cai and Swanson (2011) use an extended version of the
above dataset, i.e. the one-month Eurodollar deposit rate from January 1971 to April 2008 (1,996
weekly observations). Specifically, they examine whether the CHEN model is the “best” model
amongst multiple alternative models including those outlined in Table 1. The answer is "yes".
In this example, the test was implemented using (1 2) as described in Sections 3.1 and
3.2, where = 2 and predictions are constructed using recursively estimated models and the
simulation sample length used to address latent variable initial values is set at = 10 . The choice
of other inputs to the test such as and interval ( ) are the same as in BCS (2008). The number
of replications the block length and number of bootstrap replications are = 10 = 20 and
= 100.

Cai and Swanson (2011) also compare the Chen model with the so called Smooth Transition
Autoregression Model (STAR) model defined as follows:
= (1 + 1−1)( ) + (1 + 2−1)(1−( )) +
where is a disturbance term, 1 1 , 2 and are constants, (·) is the logistic CDF(i.e. ( ) =
11+exp((−)) ), and the number of lags, is selected via the use of Schwarz
information criterion. Test statistics and predictive density type “mean square forecast errors”
(MSFEs) values are again calculated as in Section 3.1 and 3.2.28 Their results indicate that at
a 90% level of confidence, one cannot reject the null hypothesis that the CHEN model generates
predictive densities at least as accurate as the STAR model, regardless of forecast horizon and
confidence interval width. Moreover, in almost all cases, the CHEN model has lower MSFE, and
the magnitude of the MSFE differential between the CHEN model and STAR model rises as the
forecast horizon increases. This confirms their in-sample findings that the CHEN model also wins
when carrying out in-sample tests.
5 Conclusion
This paper reviews a class of specification and model selection type tests developed by CS (2005),
BCS (2008) and CS (2011) for continuous time models. We begin with outlining the setup used
to specify the types of diffusion models considered in this paper. Thereafter, diffusion models in
finance are discussed, and testing procedures are outlined. Related testing procedures are also dis-
cussed, both in contexts where models are assumed to be either correctly specified under the null
hypothesis or generically misspecified under both the null and alternative test hypotheses. In addi-
tion to discussing tests of correct specification and test for selecting amongst alternative competing
models, using both in-sample methods and via comparison of predictive accuracy, methodology
is outlined allowing for parameter estimation, model and data simulation, and bootstrap critical
value construction.
Several extensions that are left to future research are as follows. First, it remains to construct
specification tests that do not integrate out the effects of latent factors. Additionally, it remains
to examine the finite sample properties of the estimators and bootstrap methods discussed in this
paper.
28See Table 6 in Cai and Swanson (2011) for complete details.

6 References
Aït-Sahalia, Y., (1996), Testing Continuous Time Models of the Spot Interest Rate, Review ofFinancial Studies, 9, 385-426.
Aït-Sahalia, Y., (2002), Maximum Likelihood Estimation of Discretely Sampled Diffusions: AClosed Form Approximation Approach, Econometrica, 70, 223-262.
Aït-Sahalia, Y., (2007), Estimating Continuous-Time Models Using Discretely Sampled Data,Econometric Society World Congress Invited Lecture, in Advances in Economics and Econometrics,Theory and Applications, Ninth World Congress, edited by Richard Blundell, Persson Torsten andWhitney K. Newey, Econometric Society Monographs, Cambridge University Press.
Aït-Sahalia, Y., J. Fan and H. Peng, (2009), Nonparametric Transition-Based Tests for Diffusions,Journal of the American Statistical Association, 104, 1102-1116.
Altissimo, F. and A. Mele, (2009), Simulated Nonparametric Estimation of Dynamic Models withApplication in Finance, Review of Economic Studies, 76, 413-450.
Andersen, T.G., and J. Lund, (1997), Estimating Continuous Time Stochastic Volatility Models ofShort Term Interest Rates, Journal of Econometrics, 72, 343-377.
Andersen, T.G., L. Benzoni and J. Lund, (2004), Stochastic Volatility, Mean Drift, and Jumps inthe Short-Term Interest Rate, Working Paper, Northwestern University.
Andrews, D.W.K., (1993), An Introduction to Econometric Applications of Empirical Process The-ory for Dependent Random Variables, Econometric Reviews, 12, 183-216.
Andrews, D.W.K., (1997), A Conditional Kolmogorov Test, Econometrica, 65, 1097-1128.
Bai, J., (2003), Testing Parametric Conditional Distributions of Dynamic Models, Review of Eco-nomics and Statistics, 85, 531-549.
Bandi, F., (2002), Short-Term Interest Rate Dynamics: A Spatial Approach, Journal of FinancialEconomics, 65, 73-110.
Beckers, S. (1980), The Constant Elasticity of Variance Model and US Implications for OptionPricing. Journal of Finance, 35, 661-673.
Bhardwaj, G., V. Corradi and N.R. Swanson, (2008), A Simulation Based Specification Test forDiffusion Processes, Journal of Business and Economic Statistics, 26, 176-93.
Black, F. and M. Scholes, (1973), The pricing of options and corporate liabilities, Journal of PoliticalEconomy, 81, 637—654.
Bontemps, C., and N. Meddahi, (2005), Testing Normality: a GMM Approach, Journal of Econo-metrics, 124, 149-186.
Brennan, M.J., and E.S. Schwartz, (1979), A Continuous-Time Approach to the Pricing Bonds.Journal of Banking and Finance, 3, 133-155.
Cai, L. and N.R. Swanson, (2011), An Empirical Assessment of Spot Rate Model Stability. Journalof Empirical Finance, 18, 743—764.
Chan, K.C., G. A. Karolyi, F. A. Longstaff and A. B. Sanders, (1992), An Empirical Comparisonof Alternative Models of the Short-Term Interest Rate, Journal of Finance, 47, 1209-1227.
Chen, L, (1996), Stochastic Mean and Stochastic Volatility - A Three-Factor Model of Term Struc-ture of Interest Rates and its Application to the Pricing of Interest Rate Derivatives, BlackwellPublishers, Oxford, UK.
Chen, B. and Y. Hong, (2005), Diagnostics of Multivariate Continuous-Time Models with Appli-cation to Affine Term Structure Models, Working Paper, Cornell University.
Clements, M.P. and J. Smith, (2000), Evaluating the Forecast Densities of Linear and NonlinearModels: Applications to Output Growth and Unemployment, Journal of Forecasting, 19, 255-276.
Clements, M.P. and J. Smith, (2002), Evaluating Multivariate Forecast Densities: A Comparisonof Two Approaches, International Journal of Forecasting, 18, 397-407.
Corradi, V. and N.R. Swanson, (2005), A Bootstrap Specification Test for Diffusion Processes,Journal of Econometrics, 124, 117-148.

Corradi, V. and N.R. Swanson, (2006), Predictive Density and Conditional Confidence IntervalAccuracyTests, Journal of Econometrics, 135, 187-228.
Corradi, V. and N.R. Swanson, (2007a), Nonparametric Bootstrap Procedures for Predictive Infer-ence Based on Recursive Estimation Schemes, International Economic Review, February 2007, 48,67-109.
Corradi, V. and N.R. Swanson, (2007b), Nonparametric Bootstrap Procedures for Predictive Infer-ence Based on Recursive Estimation Schemes, International Economic Review, 48, 67-109.
Corradi, V. and N.R. Swanson, (2011), Predictive Density Construction and Accuracy Testing withMultiple Possibly Misspecified Diffusion Models, Journal of Econometrics, 161,304 - 324..
Courtadon, G., (1982), The Pricing of Options on Default-Free Bonds. Journal of Financial andQuantitative Analysis, 17, 75-100.
Cox, J.C., J.E. Ingersoll and S.A. Ross, (1985), A Theory of the Term Structure of Interest Rates,Econometrica, 53, 385-407.
Dai, Q. and Kenneth J. Singleton, (2000), Specification Analysis of Affine Term Structure Models,Journal of Finance, 55, 1943-1978.
Diebold, F.X., T. Gunther and A.S. Tay, (1998), Evaluating Density Forecasts with Applicationsto Finance and Management, International Economic Review, 39, 863-883.
Diebold, F.X., J. Hahn and A.S. Tay, (1999), Multivariate Density Forecast Evaluation and Cal-ibrationin Financial Risk Management: High Frequency Returns on Foreign Exchange, Review ofEconomics and Statistics, 81, 661-673.
Diebold, F.X. and C. Li, (2006), Forecasting the Term Structure of Government Bond Yields,Journal of Econometrics, 130, 337-364.
Diebold, F.X. and R.S. Mariano, (1995), Comparing Predictive Accuracy, Journal of Business andEconomic Statistics, 13, 253-263.
Diebold, F.X., A.S. Tay and K.D. Wallis, (1998), Evaluating Density Forecasts of Inflation: TheSurvey of Professional Forecasters, in Festschrift in Honor of C.W.J. Granger, eds. R.F. Engle andH. White, Oxford University Press, Oxford.
Duan, J.C., (2003), A Specification Test for Time Series Models by a Normality Transformation,Working Paper, University of Toronto.
Duffie, D. and R. Kan, (1996), A Yield-Factor Model of Interest Rates. Mathematical Finance,6:379-406.
Duffie, D., J. Pan, and K. Singleton, (2000), Transform Analysis and Asset Pricing for AffineJunp-Diffusions. Econometrica, 68, 1343—1376.
Duffie, D. and K. Singleton, (1993), Simulated Moment Estimation of Markov Models of AssetPrices, Econometrica, 61, 929-952.
Duong, D., and N.R. Swanson, (2010), Empirical Evidence on Jumps and Large Fluctuations inIndividual Stocks. Working Paper, Rutgers University.
Duong, D., and N.R. Swanson, (2011), Volatility in Discrete and Continuous Time Models: ASurvey with New Evidence on Large and Small Jumps, Missing Data Methods: Advances in Econo-metrics, 27B, 179-233.
Emanuel, D. and J. Mcbeth, (1982), Further Results on the Constant Elasticity of Variance CallOption Pricing Model, Journal of Financial Quantitative Analysis, 17, 533-554.
Fermanian, J.-D. and B. Salanié, (2004), A Nonparametric Simulated Maximum Likelihood Esti-mation Method, Econometric Theory, 20, 701-734.
Gallant, A.R. and G. Tauchen, (1996), Which Moments to Match, Econometric Theory, 12, 657-681.
Gallant, A.R., and G. Tauchen (1997), Estimation of Continuous Time Models for Stock Returnsand Interest Rates, Macroeconomic Dynamics, 1, 135-168.
Goncalves, S. and H. White, (2002), The Bootstrap of the Mean for Dependent HeterogeneousArrays, Econometric Theory, 18, 1367-1384.
Hall, A.R. and A. Inoue, (2003), The Large Sample Behavior of the Generalized Method of MomentsEstimator in Misspecified Models, Journal of Econometrics, 361-394.
Hansen, B.E., (1996), Inference when a Nuisance Parameter is Not Identified Under the NullHypothesis, Econometrica, 64, 413-430.
Heston, S.L., (1993), A Closed Form Solution for Option with Stochastic Volatility with Applica-tions toBond and Currency Options, Review of Financial Studies, 6, 327-344.
Hong, Y., (2001), Evaluation of out-of-sample Probability Density Forecasts with Applications toS&P 500 Stock Prices, Working Paper, Cornell University.
Hong, Y.M., and H.T. Li, (2005), Nonparametric Specification Testing for Continuous Time Modelswith Applications to Term Structure Interest Rates, Review of Financial Studies, 18, 37-84.
Hong, Y.M., H.T. Li, and F. Zhao, (2007), Can the random walk model be beaten in out-of-sampledensity forecasts? Evidence from intraday foreign exchange rates, Journal of Econometrics, 141,736-776.Hull, J., and A. White, (1987), The Pricing of Options on Assets with Stochastic Volatility, Journalof Finance, 42, 281-300.
Inoue, (2001), Testing for Distributional Change in Time Series, Econometric Theory, 17, 156-187.
Jiang, G.J., (1998), Nonparametric Modelling of US Term Structure of Interest Rates and Impli-cations on the Prices of Derivative Securities, Journal of Financial and Quantitative Analysis, 33,465-497.
Karlin, S. and H.M. Taylor, (1981), A Second Course in Stochastic Processes. AcademicPress, San Diego.
Kloeden, P.E. and E. Platen, (1999), Numerical Solution of Stochastic Differential Equa-tions, Springer and Verlag, New York.
Kolmogorov A.N., (1933), Sulla Determinazione Empirica di una Legge di Distribuzione, Giornaledell’Istitutodegli Attuari, 4, 83-91.
Kristensen, D. and Y. Shin, (2008), Estimation of Dynamic Models with Nonparametric SimulatedMaximum Likelihood, CREATES Research Paper 2008-58, University of Aarhus and ColumbiaUniversity.
Künsch H.R., (1989), The Jackknife and the Bootstrap for General Stationary Observations, Annalsof Statistics, 17, 1217-1241.
Marsh, T. and E. Rosenfeld, (1983), Stochastic Processes for Interest Rates and Equilibrium BondPrices. Journal of Finance, 38, 635-646.
Meddahi, N., (2001), An Eigenfunction Approach for Volatility Modeling, Working Paper, Univer-sity of MontrealMerton, C.R., (1973), Theory of Rational Option Pricing, The Bell Journal of Economics andManagement Science, 4, 141-183
Nelson, D.B., (1990), ARCH as Diffusion Approximations, Journal of Econometrics, 45, 7-38
Pardoux, E. and D. Talay, (1985), Discretization and Simulation of Stochastic Differential Equa-tions, Acta Applicandae Mathematicae, 3, 23-47.
Piazzesi, M., (2001), Macroeconomic jump effects and the yield curve, working paper, UCLA.
Piazzesi, M., (2004), Affine Term Structure Models, Manuscript prepared for the Handbook ofFinancial Econometrics, University of California at Los Angeles.
Piazzesi, M., (2005), Bond Yields and the Federal Reserve, Journal of Political Economy, 113,311-344.
Politis, D.N., J.P. Romano and M. Wolf, (1999), Subsampling, Springer and Verlag, New York.
Pritsker, M., (1998), Nonparametric Density Estimators and Tests of Continuous Time InterestRate Models, Review of Financial Studies, 11, 449-487.
Rosenblatt, M., (1952), Remarks on a Multivariate Transformation, Annals of Mathematical Sta-tistics, 23,470-472.
Singleton, K.J. (2006), Empirical Dynamic Asset Pricing - Model Specification and Econo-metric Assessment, Princeton University Press: Princeton and Oxford.
Smirnov N., (1939), On the Estimation of the Discrepancy Between Empirical Curves of Distri-bution for Two Independent Samples, Bulletin Mathematique de l’Universite’ de Moscou, 2, fasc.2.
Sullivan R., A. Timmermann, and H. White, (1999), Data-Snooping, Technical Trading Rule Per-formance, and the Bootstrap, The Journal of Finance, vol. 54, issue 5, 1647-1691.

Sullivan, R., A. Timmermann, and H. White, (2001), Dangers of data-driven inference: The caseof calendar effects in stock returns, Journal of Econometrics, 249— 286.
Thompson, S.B., (2008), Identifying Term Structure Volatility from the LIBOR-swap Curve, Reviewof Financial Studies, 21, 819-854.
Vasicek, O. A., (1977), An Equilibrium Characterization of the Term Structure, Journal of Finan-cial Economics, 5, 177-188.
Vuong, Q., (1989), Likelihood Ratio Tests for Model Selection and Non-Nested Hypotheses, Econo-metrica, 57, 307-333White, H., (1982), Maximum Likelihood Estimation of Misspecified Models, Econometrica, 50, 1-25
White, H., (2000), A Reality Check for Data Snooping, Econometrica, 68, 1097-1126.
Wong, E., (1960), The Construction of a Class of Stationary Markov Processes, in Sixtenn Symposiain Applied Mathematics: Stochastic Processes in Mathematical Physics and Engineering, ed. byR. Bellman, American Mathematical Society, Providence, R.I.