department of education · pdf filedepartment of education ... grants payment processing. ......
TRANSCRIPT

Department of Education
SALARIES AND EXPENSES OVERVIEW
Fiscal Year 2012 Budget Request
CONTENTS
Page
Introduction ................................................................................................................. Y - 1 FY 2012 Budget Request ........................................................................................... Y - 2 Participation in Governmentwide E-Government Initiatives ........................................ Y - 7 Summary Tables: Budget Authority by Account ................................................................................... Y - 11 Budget Authority by Object Classification ............................................................... Y - 12 Full-time Equivalent Employment by Account ......................................................... Y - 13 Full-time Equivalent Employment by Office ............................................................. Y - 14 Detail of Full-time Equivalent Employment .............................................................. Y - 15 Organization Chart ................................................................................................. Y - 16 Locations of Major Administrative Contractors ........................................................ Y - 17 Report on the Budget Formulation and Execution Line of Business. ........................... Y - 18
SALARIES AND EXPENSES OVERVIEW
Y-1
INTRODUCTION
This overview summarizes the administrative costs and staffing for all Department accounts. Departmental administrative costs and full-time equivalent (FTE) employment are supported in 2012 from funding in the following accounts: Program Administration (PA), Office for Civil Rights (OCR), Office of the Inspector General (OIG), College Housing and Academic Facilities Loans Program (CHAFL), Historically Black College and University Capital Financing Program (HBCUCF), Institute of Education Sciences (IES), and Student Aid Administration (SAA). Greater detail on the funds supporting administrative costs and staffing is provided separately in each account’s justification materials. Key programs administered by the Department include Title I of ESEA, which under the President’s 2012 request would deliver $14.8 billion to help 20 million students in high poverty schools make progress toward State college- and career-ready standards; Individuals with Disabilities Education Act Part B Grants to States, which would provide $11.7 billion to help States and school districts meet the special educational needs of students with disabilities; Federal Pell Grants, which would make available $36 billion in need-based grant assistance to students enrolled in postsecondary institutions; and the postsecondary student loan programs, which would help provide roughly $124 billion a year in low-interest, new direct loans to help students and families pay for college. The FY 2012 budget request for salaries and expenses supports the goals and objectives of the Department, in particular, the following:
Focus on Early Learning
For the greatest influence on learning, the years before a child reaches kindergarten are among the most critical. Therefore, the Department is committed to providing the support that our youngest children need to prepare to succeed later in school. States will be urged to enact high standards across all publicly-funded early learning settings, develop new programs to improve opportunities and outcomes, engage parents in their child’s early learning and development, and improve the early education workforce.
Reform and Invest in K-12 Education
The Department will reform America’s public schools to deliver a 21st century education that will prepare all children for success in the new global workplace. A race to the top will be encouraged in our Nation’s schools, by promoting world-class academic standards and a curriculum that fosters critical thinking, problem solving, and the innovative use of knowledge to prepare students for college and career. New, state-of-the-art assessments that provide timely and useful information about the learning and progress of individual students will be created.
Restore America’s Leadership in Higher Education
The Department is committed to ensuring that America will once again lead the world in college completion by 2020. Regardless of their intended educational path after high
SALARIES AND EXPENSES OVERVIEW
Y-2
school, all Americans should be prepared to enroll in at least 1 year of higher education or job training to ensure we have a better prepared workforce for a 21st century economy. In addition to these programmatic goals, the Department must also fund the operational activities necessary for the everyday work of the Department, including expenses for:
Facilities management, including rent for office space and guard services.
Phone and computer network services.
Operation and maintenance of the Department’s Web sites (e.g., www.ED.Gov, www.college.gov).
Grants payment processing.
The FY 2012 budget request also places emphasis on improving departmental management of programs and resources. Specific management priorities include:
Financial management, including projects designed to ensure accountability for Departmental assets, improve grants management, and provide better financial data to Department managers.
Improving staff performance, including leadership development for Department
employees. Improving recruitment, retention, and development of human capital. Improving the acquisition process through development of our acquisition workforce and
reducing the reliance on high-risk contract vehicles.
Information technology, including improving the capability to collect educational data, a continued focus on security, and enhancements to the Department’s Web sites.
Student aid administration, with a focus on administering Pell Grants and Student Loans,
servicing loans obtained through the Ensuring Continued Access to Student Loans Act of 2008, and ensuring adequate capacity to originate all new loans via the William D. Ford Federal Direct Loan Program.
Program performance improvement, to inform decisionmakers and focus limited resources on programs that work and to reform or eliminate programs that do not.
FY 2012 BUDGET REQUEST
The 2012 total Salaries and Expenses budget request is $1.76 billion, 17 percent above the 2011 continuing resolution level. The Department’s Salaries and Expenses budget also includes $247 million in mandatory funding for Not-for-profit servicing costs in the Student Aid Administration account. The requested increase is focused mainly on servicing and other student aid systems costs necessary to achieve approximately $67 billion in savings over the next 10 years, according to

SALARIES AND EXPENSES OVERVIEW
Y-3
CBO estimates, by transitioning all Federal student loan originations to the Direct Loan Program. Additional FTE are also needed to manage the Department’s increased Direct Loan volume as well as provide an enhanced level of program oversight, in response to recent OIG and GAO audit reports. In addition to the student aid-related increases, the Department is also requesting important funding needed for fixed increases such as rent and guard services, improvement to its acquisition system designed to mitigate risk and provide greater functionality, and provide technical assistance to States. The first chart below provides detail on the total Salaries and Expenses request of $1.76 billion by category, while the second chart shows the requested budget increases of $260 million by category.
Personnel35%
Other Non-Personnel5%
Overhead (Rent & Mail) 5%
Contracts55%
FY 2012 Salaries & Expenses Costs by CategoryContract costs account for most of the Salaries and Expenses budget.
4%
63%25%
2% 5% 1%
FY 2012 Budget Increases by CategoryStudent Aid Delivery and Servicing Costs account for 63 percent of the
requested increases.Fixed Costs (4%)
Student Aid Delivery and Servicing (63%)
Other Costs - Includes Student Aid Contracts and FTE (25%)
Contracts and Purchasing Support System (2%)
Integrated Partner Management (IPM)¹ (5%)
Technical Assistance to States (1%)

SALARIES AND EXPENSES OVERVIEW
Y-4
STAFFING AND COSTS SUMMARY
Staffing The 2012 request includes funding for 4,422 FTE, a net increase of 70 FTE from the 2011 continuing resolution level of 4,352 FTE. Also, an additional 31 FTE in 2011 and 29 FTE in 2012 are funded from the Office of the Inspector General, Recovery Act account, and an additional 7 FTE are funded in 2011 from the Education Jobs Fund account. The Department’s programs and responsibilities have grown substantially over the past decade. There has been landmark legislation affecting the very core of the Department’s business. From education reform to the transition to 100 percent direct lending, the past decade has seen a steady and significant growth in Department workload. There has also been a dramatic increase in mandates resulting from an increased security environment as well as an enhanced focus on prudent financial and information technology management. As the chart below shows, despite the dramatic increase in workload over the past decade, the Department has been able to reduce its headcount. However, the totality of recent increases in workload will require an increase in FTE levels towards previous historic levels in order for the Department to carry out its mission.
An increase of 20 FTE is requested for Federal Student Aid primarily due to increased workload in oversight and compliance of the additional servicing contracts resulting from the Student Aid and Fiscal Responsibility Act (SAFRA), which terminated the Federal Family Education Loans program and shifted all new Federal loan originations to the Direct Loan program. A total of 8 FTE are requested to help the Department achieve its High Priority Performance goals that are tracked by the Office of Management and Budget. These efforts include providing technical assistance to States to help achieve education reform; enhancing and
3,800
4,000
4,200
4,400
4,600
4,800
5,000
2000 2001 2002 2003 2004 2005 2006 2007 2008 2009 2010
10,000,000
20,000,000
30,000,000
40,000,000
50,000,000
Dep
artm
ent
FTE
Fiscal Year
$ in
th
ou
san
ds
Department FTE and Budget
ED Non-Pell Discretionary Appropriation
Department FTE
ECA
SLA
AR
RA
SAFR
A(1
00%
Dir
ect
Loan
s)
Note: Excludes ARRA budget authority.
NC
LB

SALARIES AND EXPENSES OVERVIEW
Y-5
increasing the Department’s program evaluations; and administering the new Workforce Innovation Fund, in conjunction with the Department of Labor. An increase of 12 FTE is requested for the Office for Civil Rights (OCR) to ensure successful management of OCR’s enforcement programs, priorities, and complaint resolution. In FY 2010, OCR received 6, 33 complaints, a percent increase from FY 200 the largest number of complaints ever received by the agency. In addition, some of the complaints were more complex than in previous years. An increase of 30 FTE in the Office of Inspector General (OIG) is requested in order to fully address high-priority areas. Additional auditors and investigators are needed to perform a larger number of audits and to conduct investigations larger in scope, with emphasis on Recovery Act, Race to the Top, and Investment in Innovation programs, as well as oversight of guaranty agencies, Direct Loans, and distance education. The additional auditors and investigators, supported by additional Information Technology Audits and Computer Crime Investigations staff, will allow OIG to expand reviews of student loan programs. As shown in the following chart, staff are divided between Washington, D.C., headquarters, 11 regional offices, and 12 field offices. Most regional and field office staff are in Federal Student Aid (FSA), the Office of the Inspector General, and the Office for Civil Rights. The FSA regional office staff conduct reviews of lenders, institutions, and guaranty agencies participating in the student financial aid programs, and perform debt collection activities on defaulted student loans. OIG staff conduct audits and investigations of Department programs and operations. OCR staff investigate civil rights complaints and conducts civil rights compliance reviews.
Boston
New York City
Philadelphia
Washington, D.C.
Regional Offices
Field Offices
Location of the Department of Education
Regional and Field Offices
Seattle
SanFrancisco Denver Kansas
City
Chicago
Atlanta
Dallas
ClevelandSacramento
Long Beach
Puerto Rico Pembroke
Pines
Pittsburgh
St. Paul
Austin
Phoenix
Nashville

SALARIES AND EXPENSES OVERVIEW
Y-6
Personnel and Non-Personnel Costs Summary The budget request includes $622.5 million for personnel compensation and benefits. Non-personnel costs cover such items as travel, rent, mail, telephones, utilities, printing, information technology (IT), contractual services, equipment, supplies, and other departmental services. The total budget for non-personnel activities in 2012 is $1.137 billion, an increase of $238 million, or 26 percent from the 2011 CR level. The increases include $215 million for Federal Student Aid contracts, and a total of $18.3 million for centralized overhead items, primarily for rental costs for office space and continued operations and enhancements for EDCAPS, the Department’s core financial system. Additional details about the IT budget, including OMB Exhibit 300, the Capital Asset Plan and Business case Summary, are found at the Department’s IT Dashboard (www.ed.gov/open/plan/it-dashboard) and at the Governmentwide IT Dashboard (http://it.usaspending.gov/). Centralized Overhead and Technology Departmental overhead expenses cover centralized support and administrative services for all program and staff offices. The funds are administered by the Office of Management. These services include rent, building alterations and repairs, training, supplies, mail, and physical security for buildings and personnel. A total of $149 million is requested for these costs in 2012, an increase of $8.7 million from the 2011 CR level. The increase is primarily for rental costs for office space and guard services in buildings occupied by Department employees, the costs of which are dictated by the Federal Protective Service for necessary security of personnel and property. Information technology activities that comprise centralized IT services include Departmentwide computer operations, maintenance, and improvements; local area network operations; initiatives designed to link Department business needs with the best available technology; and other commonly shared Department IT and office automation activities. The funds are administered by the Office of the Chief Information Officer. Within the total for non-personnel costs, a total of $99.7 million is requested for these IT activities, a $9.6 million increase from the 2011 CR level, primarily for continued operations and enhancements for EDCAPS. Improper Payments The Department will be focusing on accurately measuring, identifying, and reducing improper payments, and recovering confirmed improper payments, where appropriate. Risk assessments are periodically performed on the Department’s programs to identify any programs susceptible to significant improper payments. The Department continues to use recovery audits on a sample of payment invoices to identify and potentially recover any improper contract payments, including payments made on ARRA funded contracts. The Department is moving forward in the implementation of Executive Order 13520, Reducing Improper Payments, and the recently enacted Improper Payments and Elimination and Recovery Act. The Department continues to focus high-level attention on identifying improper payments and implementing corrective actions to further reduce improper payment risk.
SALARIES AND EXPENSES OVERVIEW
Y-7
The Department is participating in OMB’s pilot Single Audit Internal Control Project – ARRA Programs, which is designed to identify and correct internal control deficiencies in selected major programs with ARRA expenditures. Focusing attention of these deficiencies should help minimize the potential for improper payments by Department grantees. Planned activities related to minimizing improper payments in student financial assistance programs include the following two items. First, the Department will implement revisions of the 2012-2013 Free Application for Federal Student Aid (FAFSA) Web form to facilitate enhanced flagging and verification of specified data items consistent with regulatory and legislative changes to the verification selection process or as informed by data analysis of the FAFSA/IRS Data Retrieval project. Second, the Department will conduct a risk assessment of its risk susceptible programs. The currently identified risk susceptible programs are Pell, Direct Loans, TEACH Grants, and the Federal Family Education Loans Program. Workforce Planning and Restructuring Information
The Human Capital Management Plan is designed to ensure critical human capital management challenges are addressed to support the accomplishment of the Department’s mission and programmatic goals. This is accomplished by projecting workforce changes and planning to address needs. Workforce planning includes assessing skill set requirements, training and development activities designed to support and improve employee skill sets, and restructuring organizational components to realign positions in support of direct service delivery. The process takes into consideration annual hiring plans, outreach and recruitment strategies to attract talent, and strategies to retain talent.
To further ensure talent is aligned to support service delivery, the Department deployed a Leadership Competency Model (LCM) and piloted a Leadership Succession Review tool. The LCM facilitates the identification of leadership competency gaps and training and development to close the gaps. The LCM also supports a learning environment to promote continuous employee performance improvement.
The Department will continue to identify and implement these and other strategies and business and systems process improvements to ensure the Department has the talent needed to carry out the many Department responsibilities. PARTICIPATION IN GOVERNMENTWIDE E-GOVERNMENT INITIATIVES
The Department is actively participating in a number of Governmentwide e-Government initiatives, designed to make it easy for citizens and businesses to interact with the Government, save taxpayer dollars, and streamline citizen-to-Government communications. The Department has budgeted a total of $2.368 million in 2011, and $2.192 million in 2012 for these initiatives. The request includes support for the following initiatives:
SALARIES AND EXPENSES OVERVIEW
Y-8
GovBenefits.gov – 2011 CR: $260,000; 2012: $265,000; Student Aid Administration account GovBenefits.gov provides a single point of access for citizens to locate and determine potential eligibility for Government benefits and services. GovBenefits.gov receives approximately 300,000 visits per month by citizens and has provided one million citizen referrals to benefits programs. There are approximately 100,000 citizen referrals from GovBenefits.gov to Department of Education Web pages annually. It is likely the number of referrals will increase in the future. Disaster Assistance Improvement Plan – 2011 CR: $84,000; 2012: $49,000; Student Aid Administration account
The Disaster Assistance Improvement Plan will implement provisions of Executive Order 13411, Improving Assistance for Disaster Victims, which is designed to ensure that individuals who are victims of a terrorist attack or natural disaster have prompt and efficient access to Federal disaster assistance. As an agency with information that is relevant to individuals affected by a disaster, the Department will coordinate with other agencies to provide an alternate mechanism for providing information to disaster victims. This will support delivery of assistance to disaster victims and will expedite answers to inquiries about individual assistance. E-Rulemaking 2011 CR: $110,000; 2012: $127,000; Program Administration account E-Rulemaking allows citizens easy access and participation in the rulemaking process and increases the efficiency of internal agency processes. The initiative has provided the public a single central site (www.archives.gov/federal-register) to access more than 450 regulatory actions completed annually over the last 3 years. It also provides a central location for the public to comment on regulatory actions and reduces the Department’s data storage costs. Grants.gov – 2011 CR: $706,000; 2012: $706,000; Program Administration account Grants.gov provides a single portal for all Federal grant customers to find, apply, and ultimately manage grants online. The Department was the first agency to post an application on Grants.gov and one of the initial adopters of utilizing Grants.gov to receive applications with 152 application packages in 2008. Since the inception of Grants.gov, the Department has posted approximately 675 funding opportunities and over 300 application packages on Grants.gov. To date, approximately 23,800 application packages have been received from the grants community via Grants.gov. As such, the Department ranks in the top five agencies for the number of applications received via Grants.gov since its inception. E -Training – Total – 2011 CR: $180,000; 2012: $0 Program Administration account – 2011 CR: $91,000 Student Aid Administration account – 2011 CR: $50,000 Office for Civil Rights account – 2011 CR: $26,000 Office of the Inspector General account – 2011 CR: $13,000
SALARIES AND EXPENSES OVERVIEW
Y-9
E-Training will consolidate numerous online Federal training capabilities into a premier e-training portal, providing enhanced access to high quality training and competency development for Federal employees. Through participation in this initiative, Department employees have received access to over 2,000 e-learning courses covering a multitude of topics. The e-learning option benefits all employees, but is particularly useful for Regional employees. Recruitment One-Stop – 2011 CR: $23,000; 2012: $25,000 Program Administration account Recruitment One-Stop delivers state-of-the-art online recruitment services to job seekers including job searching, online resume submission, applicant data mining, and online feedback on status and eligibility. Job applicants utilizing the Department’s automated EdHires system also have access to the USAJOBS system, allowing them to apply for positions across the Government. Enterprise Human Resource Integration – 2011 CR: $129,000; 2012: $134,000; Program Administration account Enterprise Human Resource Integration streamlines and automates the exchange of Federal employee human resources information between Federal agencies. Participation in this initiative will provide the Department’s Human Resources managers and specialists with a centralized data warehouse that will assist in workforce planning and analysis capabilities that are currently not possible with a paper-based system. With these tools, trends for retirement, promotions, and reassignments can be accurately forecast. Personnel transactions that currently take weeks to finalize would take days.
E-Travel – 2011 CR: $200,000; 2012: $207,000; Program Administration account
E-Travel is designed to provide a Governmentwide Web-based service that applies world-class travel management practices to consolidate Federal travel arrangements, minimize cost, and produce superior customer satisfaction. The Department has fully migrated its travel services to “E2,” a designated E-Travel system, hosted by Carlson Wagonlit Government Travel. The E2 Travel System provides travelers with a Web-based, end-to-end travel management service with the integration of an online booking engine as well as an authorization and vouchering process. Integrated Acquisition Environment – 2011 CR: $55,000; 2012: $57,000; Program Administration account Integrated Acquisition Environment creates a secure business environment that will facilitate and support cost-effective acquisition of goods and services by agencies. Through adoption of the tools and services developed as part of this initiative, the Department can make better informed and more efficient purchasing decisions.
SALARIES AND EXPENSES OVERVIEW
Y-10
Integrated Acquisition Environment – Grants and Loans – 2011 CR: $186,000; 2012: $186,000; Student Aid Administration account
This is an additional component of the Integrated Acquisition Environment initiative to include participation of grant and loan recipients in addition to the contractors already participating in the initiative.
Financial Management Line of Business – 2011 CR: $143,000; 2012: $143,000; Program Administration account
The Financial Management Line of Business initiative improves the quality and performance of financial management operations, thereby reducing the cost of Government to citizens through business performance improvements in financial management including finding exemplary financial management systems that can be utilized by multiple agencies. Human Resources Management Line of Business – 2011 CR: $66,000; 2012: $66,000; Program Administration account
The Human Resources Line of Business initiative reduces the cost of Government and improves services to citizens through business performance improvements in human resources management. The Department benefits by utilizing “best-in-class” human resources systems that have been approved by the Line of Business. Grants Management Line of Business – 2011 CR: $106,000; 2012: $107,000; Program Administration account
The Grants Management Line of Business initiative reduces the cost of Government and improves services to citizens through business performance improvements in grants management. Geospatial Line of Business – 2011 CR: $15,000; 2012: $15,000; Program Administration account
The Geospatial Line of Business initiative reduces the cost of Government and improves services to citizens through sharing of geospatial data. In conjunction with this Line of Business, the Department’s National Center for Education Statistics provides access to school district geographic and demographic data useful for describing and analyzing characteristics of school districts, children, and K-12 education. Budget Formulation and Execution Line of Business – 2011 CR: $105,000; 2012: $105,000; Program Administration account The Budget Formulation and Execution Line of Business initiative improves services through business performance improvements in budget formulation and execution processes. The Department is serving as Managing Partner for this Line of Business, and thus is a leader in finding exemplary budget systems and/or tools that can be utilized by multiple agencies across the Government. Another benefit is the development of collaborative processes to improve Federal budgeting.

SALARIES AND EXPENSES OVERVIEW
Department of Education
Budget Authority by Account ($000s)
Y-11
Change from
ACTIVITY 2010 2011 CR 2012 2011 to 2012
Program Administration:
Salaries and Expenses $448,000 $448,000 $476,327 $28,327
Building Modernization 8,200 8,200 2,711 (5,489)
Office for Civil Rights 103,024 103,024 107,772 4,748
Office of the Inspector General 60,053 60,053 67,187 7,134
Subtotal, Departmental Management 619,277 619,277 653,997 34,720
Administrative costs from program accounts:
College Housing and Academic Facilities Loans 461 461 478 17
Historically Black College and University Capital Financing 354 354 354 0
Education Jobs Fund 1,000 0 0 0
Institute of Education Sciences:
National Assessment Governing Board 8,723 8,723 8,723 0
National Board for Education Sciences 220 349 349 0
Student Aid Administration
Salaries and Expenses 470,763 594,036 725,104 131,068
Servicing Activities 335,639 276,366 370,314 93,948
Subtotal, program accounts 817,160 880,289 1,105,322 225,033
Total, Salaries and Expenses 1,436,437 1,499,566 1,759,319 259,753
NOTE: Includes discretioanry f unds only .
SALARIES AND EXPENSES OVERVIEW
Y-12
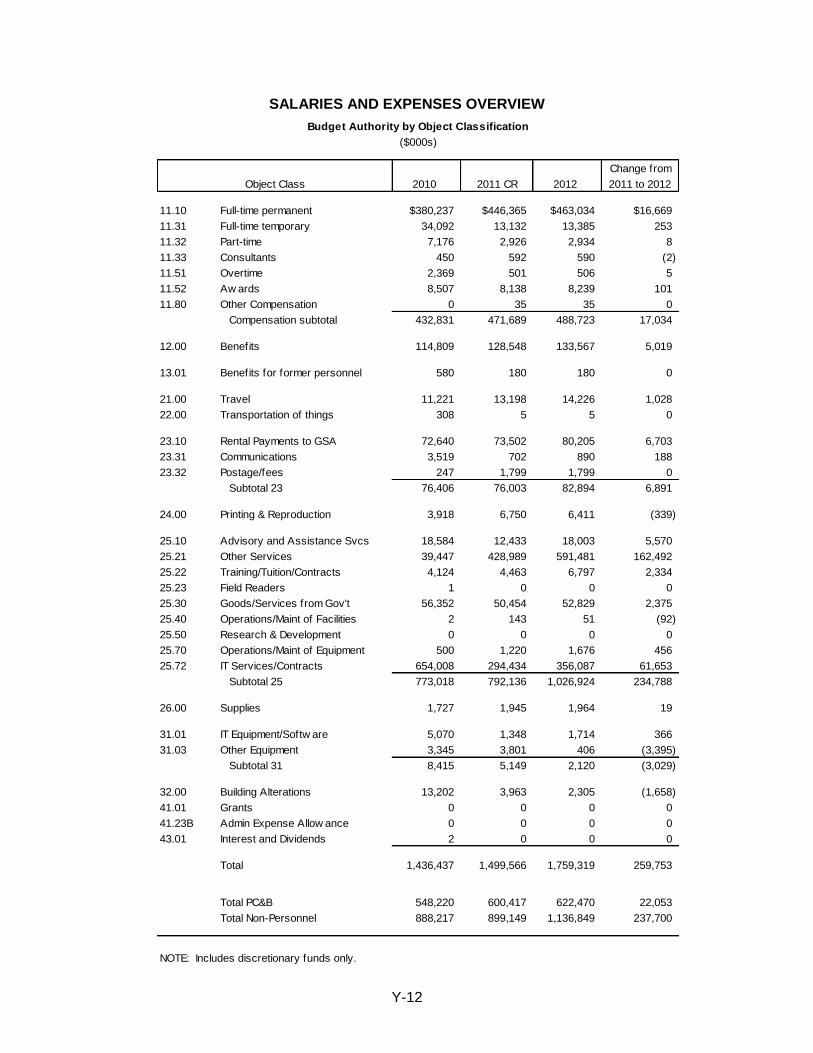
Budget Authority by Object Classification
($000s)
Change from
Object Class 2010 2011 CR 2012 2011 to 2012
11.10 Full-time permanent $380,237 $446,365 $463,034 $16,669
11.31 Full-time temporary 34,092 13,132 13,385 253
11.32 Part-time 7,176 2,926 2,934 8
11.33 Consultants 450 592 590 (2)
11.51 Overtime 2,369 501 506 5
11.52 Aw ards 8,507 8,138 8,239 101
11.80 Other Compensation 0 35 35 0
Compensation subtotal 432,831 471,689 488,723 17,034
12.00 Benefits 114,809 128,548 133,567 5,019
13.01 Benefits for former personnel 580 180 180 0
21.00 Travel 11,221 13,198 14,226 1,028
22.00 Transportation of things 308 5 5 0
23.10 Rental Payments to GSA 72,640 73,502 80,205 6,703
23.31 Communications 3,519 702 890 188
23.32 Postage/fees 247 1,799 1,799 0
Subtotal 23 76,406 76,003 82,894 6,891
24.00 Printing & Reproduction 3,918 6,750 6,411 (339)
25.10 Advisory and Assistance Svcs 18,584 12,433 18,003 5,570
25.21 Other Services 39,447 428,989 591,481 162,492
25.22 Training/Tuition/Contracts 4,124 4,463 6,797 2,334
25.23 Field Readers 1 0 0 0
25.30 Goods/Services from Gov't 56,352 50,454 52,829 2,375
25.40 Operations/Maint of Facilities 2 143 51 (92)
25.50 Research & Development 0 0 0 0
25.70 Operations/Maint of Equipment 500 1,220 1,676 456
25.72 IT Services/Contracts 654,008 294,434 356,087 61,653
Subtotal 25 773,018 792,136 1,026,924 234,788
26.00 Supplies 1,727 1,945 1,964 19
31.01 IT Equipment/Softw are 5,070 1,348 1,714 366
31.03 Other Equipment 3,345 3,801 406 (3,395)
Subtotal 31 8,415 5,149 2,120 (3,029)
32.00 Building Alterations 13,202 3,963 2,305 (1,658)
41.01 Grants 0 0 0 0
41.23B Admin Expense Allow ance 0 0 0 0
43.01 Interest and Dividends 2 0 0 0
Total 1,436,437 1,499,566 1,759,319 259,753
Total PC&B 548,220 600,417 622,470 22,053
Total Non-Personnel 888,217 899,149 1,136,849 237,700
NOTE: Includes discretionary funds only.

SALARIES AND EXPENSES OVERVIEW
Department of Education
Full-time Equivalent Employment (Staff Years) by Account
Y-13
Change from
ACCOUNT 2010 2011 CR 2012 2011 to 2012
Program Administration 2,024 2,134 2,142 8
Office for Civil Rights 584 614 626 12
Office of the Inspector General 289 293 323 30
Subtotal, Departmental Management 2,897 3,041 3,091 50
FTE funded from program accounts:
Career, Technical, and Adult Education:
National Institute for Literacy 12 0 0 0
College Housing and Academic Facilities Loans 3 3 3 0
Historically Black College and University Capital Financing 1 1 1 0
Education Jobs Fund 0 7 0 (7)
Institute of Education Sciences:
National Assessment Governing Board 13 14 14 0
National Board for Education Sciences 1 1 1 0
Student Aid Administration
Discretionary authority 1,090 1,291 1,311 20
Mandatory authority 23 0 0 0
Subtotal, program accounts 1,143 1,317 1,330 13
Subtotal, FTE 4,040 4,358 4,421 63
Applachian Regional Commission Programs (Energy 0 1 1 0
and Water Development Appropriations)
Total, discretionary authority 4,040 4,359 4,422 63
Recovery Act 65 31 29 (2)
Total, FTE 4,105 4,390 4,451 61
NOTE: Includes Recovery Act FTE.

SALARIES AND EXPENSES OVERVIEW
Y-14
Change from
OFFICE 2010 2011 CR 2012 2011 to 2012
Advisory Committee on Student Financial Assistance 6 7 7 0
Chief Financial Officer 189 192 192 0
Chief Information Officer 133 134 134 0
Civil Rights 584 614 626 12
Communications and Outreach 108 104 104 0
Deputy Secretary 15 44 44 0
Elementary and Secondary Education 225 231 228 (3)
English Language Acquisition, Language Enhancement, and
Academic Achievement for Limited English Proficient Students 19 24 24 0
Federal Student Aid 1,022 1,200 1,220 20
General Counsel 106 104 104 0
Innovation and Improvement 94 97 96 (1)
Inspector General 304 324 352 28
Institute of Education Sciences 186 193 199 6
Legislation and Congressional Affairs 20 20 20 0
Management 188 189 188 (1)
National Assessment Governing Board 13 14 14 0
National Board for Education Sciences 1 1 1 0
National Institute for Literacy 12 0 0 0
Planning, Evaluation, and Policy Development 133 137 136 (1)
Postsecondary Education 207 216 216 0
Safe and Drug-Free Schools 44 44 43 (1)
Secretary 134 138 138 0
Special Education and Rehabilitiative Services 265 264 265 1
Under Secretary 10 10 10 0
Vocational and Adult Education 87 88 89 1
Subtotal, FTE 4,105 4,389 4,450 61
Appalachian Regional Commission Programs (Energy 0 1 1 0
and Water Development Appropriations)
Total, FTE 4,105 4,390 4,451 61
NOTE: Includes Recovery Act FTE.
Full-time Equivalent Employment (Staff Years) by Office

SALARIES AND EXPENSES OVERVIEW
Y-15
Department of Education
Detail of Full-Time Equivalent Employment
2010 2011 2012
Actual Estimate Request
Executive level I........................... 1 1 1
Executive level II.......................... 3 3 3
Executive level III......................... 1 1 1
Executive level IV........................ 9 10 10
Executive level V......................... 1 2 2
Subtotal..................................... 15 17 17
Total - EX Salary....................... $2,449,300 $2,743,050 $2,750,500
Senior Executive Service.............… 79 103 103
Subtotal - ES .....................…...... 1/ 79 103 103
Total - ES Salaries........................ $13,604,653 $16,964,100 $17,025,900
AL................................................. 1 1 1
AD................................................ 171 171 176
ED/EI........................................… 6 8 10
GS/GM-15...............................…. 542 548 550
GS/GM-14..................................... 904 897 900
GS/GM-13..................................... 1,043 1,028 1,034
GS-12........................................... 723 726 733
GS-11........................................... 307 316 328
GS-10........................................... 2 4 6
GS-9............................................. 261 265 272
GS-8............................................. 48 51 61
GS-7............................................. 133 146 159
GS-6............................................. 19 22 32
GS-5............................................. 40 45 58
GS-4............................................. 45 46 53
GS-3............................................. 24 25 36
GS-2............................................. 8 8 10
GS-1............................................. 0 1 1
Subtotal...................................... 4,277 4,308 4,420
Total full-time equivalent
employment, end of year........... 2/ 4,371 4,428 4,540
Full-time equivalent (FTE)
usage......................................... 2/ 4,105 4,390 4,451
Average GS/GM grade................. 11.8 11.8 11.7
1/ FY2010 includes 9 FSA SES positions. FY 2011 & FY 2012 include 11 FSA SES positions.
2/ Includes FTE funded by Recovery Act accounts.

SALARIES AND EXPENSES OVERVIEW
Y-16

Y-1
7
7
Denver
Department of Education
Locations of Major Administrative Contracts
and Current Contractors
3 Greenville,
Houston, Killeen
11 Lawrence
3 Boise
11
Coralville
3 &11
Montgomery
3, 12
Utica
1,11, 12 Arlington, VA
1 Financial Management System (FSA) 2 Comprehensive Security Program (FSA)
3 Common Services for Borrowers (CSB) and
4 OCR EDEN Survey (OCR) 5 National Student Loan Data System (FSA) 6 Integrated Partner Management (FSA)
7 Payroll/Personnel Processing Center (OM)
8 Education Department Central Automated Processing System (EDCAPS) (OCFO)
9 Enterprise Integration Services (FSA)
10 11
Virtual Data Center (FSA)
12 Front End Business Integration (FSA)
13 Common Origination and Disbursement (FSA)
14 EDUCATE (OCIO) Operations
1,4,5,8,9,12,14 Washington, DC
3,Germantown, MD
3
3
Bakersfield
12
Niagara Falls
2,3 Reston, VA
10,13 Fairfax, VA
5 Great Falls, VA 12
Columbus
11,13,14 Rockville, MD
11
Phoenix
10,13
Plano
Additional Servicers (CSB) (FSA)
9 Alexandria
Integrated Technical Architecture (FSA)
6 Falls Church
12 Bethesda, MD
Lynn Haven
3
Madison
Boscobel
Lincoln
3 Aurora,
Highlands Ranch
Jacksonville
Wilkes-Barre
Fisher
Harrisburg
3
3 3
3
3 14 Baltimore, MD
2 McLean, VA

SALARIES AND EXPENSES OVERVIEW
Y-18
Report on the Budget Formulation and Execution Line of Business
as Required by Division D, Section 737(d) of the Consolidated
Appropriations Act, 2008, P.L. 110-161
The U.S. Department of Education assumed the role of Managing Partner for the Budget Formulation and Execution Line of Business (BFELoB) in the fall of 2006. The focus of the BFELoB is to build a “budget of the future” by promoting information-sharing across Government agency budget offices, as well as building a “community of practice.” Through this collaboration, the budget community has been identifying best practices for all aspects of budget formulation and execution. The BFELoB strives to find solutions linking budget formulation, execution, planning, performance, and financial management information. Goals of the BFELoB include improvement and enhancements of:
the efficiency and effectiveness of agency and central processes for formulating and
executing the Federal Budget;
the integration and standardized exchange of budget formulation, execution, planning,
performance measurement, and financial management information and activities across the Government;
capabilities for analyzing budget formulation, execution, planning, performance, and
financial information in support of decisionmaking;
capabilities for aligning programs and their outputs and outcomes with budget levels and
actual costs to institutionalize budget and performance integration; and
the efficiency and effectiveness of the Federal budgeting workforce.
BFELoB anticipates 10-year savings of over $200 million Governmentwide due to efficiencies gained through collaboration and increased use of technology. Most agency budget offices do not have automated systems to support budget formulation and execution activities. Agencies rely on basic office software and manual processes. BFELoB’s goal is to reduce time spent on manual processes and increase budget personnel time spent on high priority analytical activities (via increased use of technology, improved processes and a better equipped workforce). BFELoB is a mixed lifecycle investment. Activities and solutions under development by BFELoB workgroups are at different stages within the development lifecycle. Products under development are listed in the Objectives and Benefits table below and include implementation or projected implementation dates.
The following tables display the objectives and benefits, risks, costs, and agency contributions to BFELoB.

SALARIES AND EXPENSES OVERVIEW
Y-19
Objectives and Benefits
Capability Objectives and Benefits
Technology
Collaboration
Improves the efficiency and effectiveness of Government activities through the
ready accessibility of information, and the ability to collaborate remotely both
within an agency (i.e., collaboration with regional and field staff) and across
Federal agencies (i.e., collaboration of each agency with OMB and other
agencies on shared programs).
Current products include the MAX Federal Community (a “wiki” site, in production
Dec. 2006), and secure online meeting capability (Nov. 2008).
Current Status: The MAX Federal Community provides increased information
sharing, collaboration, and knowledge management securely across the Federal
Government, as well as within each agency. Over 36,000 members and multiple
communities utilize the MAX Federal Community across Government. Usage is
currently growing at a rate of almost 1,000 users per month. Many agencies are
also using the secure online meeting tool allowing agency personnel to attend
meetings remotely with presentations displayed on their computer screens.
Data Collection &
Tracking
Improves OMB and agency efficiency and effectiveness in carrying out the
numerous budget data exercises that occur. Benefits apply to both central
budget exercises (i.e., those requested of agencies by OMB) and exercises at
the departmental or agency level (i.e., those requested by central agency offices
of agency regional and field offices). Agency benefits include increased data
collection capabilities, reduced errors, and reduced time spent manually
consolidating and publishing data.
Current products include multiple Web-based data collection tools for central
budget exercises (first exercise in production in March 2007, with ongoing roll-
outs), as well as a Web-based tool, MAX Collect, for agency use in the collection
of budget briefing and “Q&A” materials (in production Nov. 2008).
Current Status: BFELoB data collection tools have already demonstrated value
by automating the collection of data for dozens of centralized exercises related to
earmarks, continuing resolutions, and across-the-board reductions. The MAX
Collect tool provides even greater benefit by enabling agency budget offices to
automate their own data collection exercises. Agencies are now using the tool to
facilitate the rapid collection of agency “Q&A” (questions and answers), “QFR”
(questions for the record) information, and many other exercises.
Knowledge Management
Improves the ability of agencies to locate and access information, increases the availability and comprehensiveness of data, and improves the ability of the budgeting community to manage the impending retirement of key personnel. Database-driven products such as the MAX Federal Community and MAX Collect enhance knowledge management capabilities by capturing “knowledge” as it is generated, simply through use of these tools.
SALARIES AND EXPENSES OVERVIEW
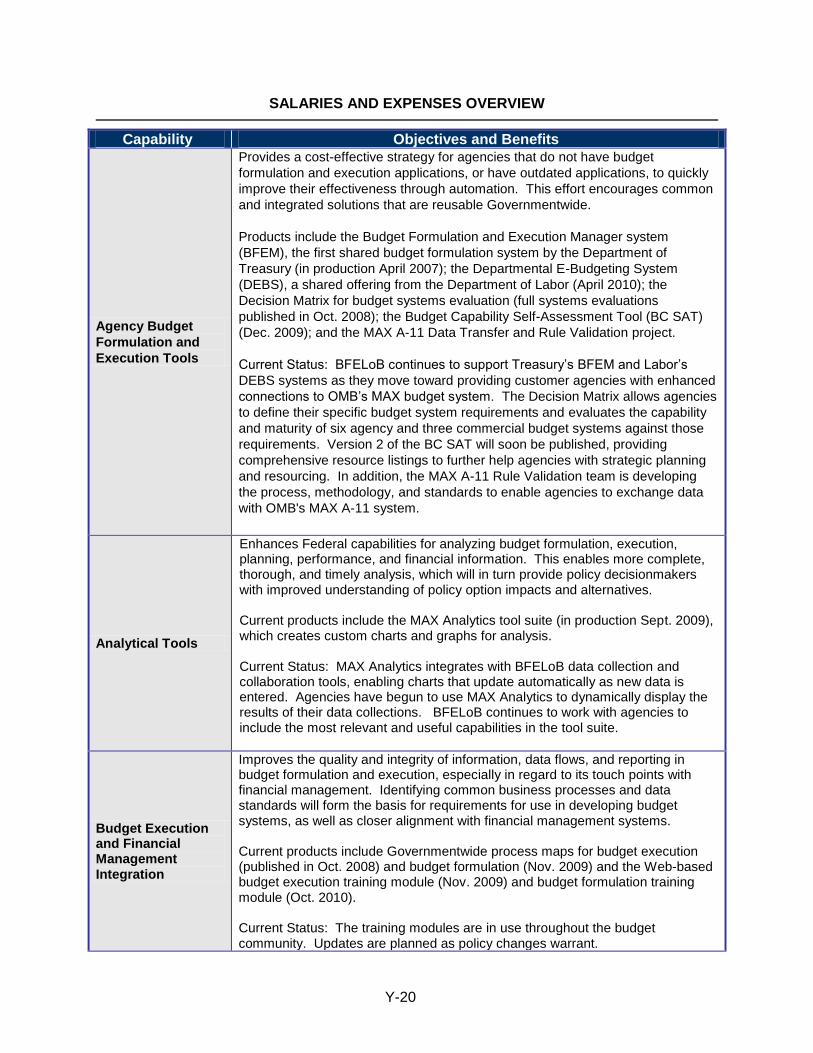
Y-20
Capability Objectives and Benefits
Agency Budget
Formulation and
Execution Tools
Provides a cost-effective strategy for agencies that do not have budget
formulation and execution applications, or have outdated applications, to quickly
improve their effectiveness through automation. This effort encourages common
and integrated solutions that are reusable Governmentwide.
Products include the Budget Formulation and Execution Manager system
(BFEM), the first shared budget formulation system by the Department of
Treasury (in production April 2007); the Departmental E-Budgeting System
(DEBS), a shared offering from the Department of Labor (April 2010); the
Decision Matrix for budget systems evaluation (full systems evaluations
published in Oct. 2008); the Budget Capability Self-Assessment Tool (BC SAT)
(Dec. 2009); and the MAX A-11 Data Transfer and Rule Validation project.
Current Status: BFELoB continues to support Treasury’s BFEM and Labor’s
DEBS systems as they move toward providing customer agencies with enhanced
connections to OMB’s MAX budget system. The Decision Matrix allows agencies
to define their specific budget system requirements and evaluates the capability
and maturity of six agency and three commercial budget systems against those
requirements. Version 2 of the BC SAT will soon be published, providing
comprehensive resource listings to further help agencies with strategic planning
and resourcing. In addition, the MAX A-11 Rule Validation team is developing
the process, methodology, and standards to enable agencies to exchange data
with OMB's MAX A-11 system.
Analytical Tools
Enhances Federal capabilities for analyzing budget formulation, execution, planning, performance, and financial information. This enables more complete, thorough, and timely analysis, which will in turn provide policy decisionmakers with improved understanding of policy option impacts and alternatives. Current products include the MAX Analytics tool suite (in production Sept. 2009), which creates custom charts and graphs for analysis. Current Status: MAX Analytics integrates with BFELoB data collection and collaboration tools, enabling charts that update automatically as new data is entered. Agencies have begun to use MAX Analytics to dynamically display the results of their data collections. BFELoB continues to work with agencies to include the most relevant and useful capabilities in the tool suite.
Budget Execution and Financial Management Integration
Improves the quality and integrity of information, data flows, and reporting in budget formulation and execution, especially in regard to its touch points with financial management. Identifying common business processes and data standards will form the basis for requirements for use in developing budget systems, as well as closer alignment with financial management systems. Current products include Governmentwide process maps for budget execution (published in Oct. 2008) and budget formulation (Nov. 2009) and the Web-based budget execution training module (Nov. 2009) and budget formulation training module (Oct. 2010). Current Status: The training modules are in use throughout the budget community. Updates are planned as policy changes warrant.

SALARIES AND EXPENSES OVERVIEW
Y-21
Capability Objectives and Benefits
Budget Performance Integration
Improves management, assessments, tracking, analysis, and program reporting to enhance the efficiency and effectiveness of Government programs in accordance with the Government Performance Results Act. Products include the first fee-for-service performance system, the Budget Formulation and Execution Manager, developed by the Department of Treasury (performance component in production Jan. 2008).
Document Production
Enables agency budgeting personnel to move from clerical to analytical functions, increasing agency analytical resource availability. Agency budget staff currently works countless hours to incorporate late-breaking policy data changes in high-visibility publications. Often, many changes must be simultaneously made in multiple documents for different stakeholders. Document production capabilities exist in Treasury and Labor’s shared service budget systems, as well as in the MAX Collect Tool.
Governance
Program Management Office (PMO)
Serves as a central coordination point for Governmentwide collaboration and sharing of technologies and processes. The PMO allows resources across Government to be leveraged for cost savings. In this way, costs are reduced, economies of scale are achieved, and risks in developing and buying agency budget tools are reduced through a coordinated combination of approaches that include: sharing common budget formulation components, purchasing commonly used software that has been proven in multiple agencies, and purchasing services from other agencies. The PMO will support enhanced efficiency, effectiveness, quality, knowledge management, presentation, collaboration, and flexibility within the BFELoB. Currently, the PMO supports eight initiative-specific workgroups that meet on a regular basis.
Process Improvements
Allows for the development of system requirements and guidelines for tools that are modular in nature (can be used as part of any system) and available for use by multiple agencies. Accounts for the importance of flexibility in the budgeting process and acts as a set of standards that are essential for the automated exchange of budget data with Treasury and OMB, as well as agency financial management systems. Current products include a budget segment architecture (published in Nov. 2009), budget execution process maps (Oct. 2008), budget formulation process maps (Nov. 2009), and the BC SAT (Dec. 2009).
Service Module Standardization
Encourages reusability and interoperability of budget systems across agencies to achieve significant cost savings through a "build once, use often" philosophy. Service module registration via the PMO will help ensure that agencies are aware of existing services so that duplicative investments are not made.

SALARIES AND EXPENSES OVERVIEW
Y-22
Capability Objectives and Benefits
Human Capital
Budget Human Capital
Enhances the effectiveness of the existing budgeting workforce and encourages participation from other professions within Government, the private sector, and universities. BFELoB provides a central venue for the budget community, OPM, and the Council of Human Capital Officers to grow the appeal of Federal Budgeting as a career by combining agency efforts to define budget career paths, core competencies, leadership development, certification programs, and sharing of ideas in areas such as succession planning, retention and recruitment. Products include recommendations on core competencies (published Nov. 2008) and proficiency levels (published May 2010), training curricula for budget analysts, as well as no-cost training courses for budget staff and self-paced training modules. Current status: Thousands of Government employees have undergone no-cost training through in-class, Web-based, or facilitated online training sessions hosted by the BFELoB. Two brownbag discussion groups focusing on a deeper understanding of budget execution and on the Budget Career Road Map began in Nov. 2010.
Risks
Type of Risk 1
Risk Description Mitigation Approach
Other Schedule Agency staff (from multiple agencies) lead and participate in workgroups on a voluntary basis, which at times, slows progress.
1) Develop revised project charter and ask all agencies to approve the charter, 2) conduct agency outreach/marketing, and 3) target agency staff (based on skill set) for participation on specific projects and for specific time periods.
Other Management Oversight
Agency budget offices do not make use of the full range of LoB products and services available to them.
Develop marketing and outreach strategy and dedicate PMO staff to assist agencies on activities such as building out community pages.
Other Business Impact
PMO strategic plan (CONOPS and target architecture documents) need to be revisited/revalidated.
Revisit strategic plan and architecture documents in advance of the winter 2011 planning meeting.
Other Project Resources
BFELoB understaffed Post vacancy announcements; offer rotations; hire spring/fall and summer interns.
1 If significant risks occur, they have substantial impact on the ability of the Line of Business to succeed. Other risks, while potentially serious, may not significantly impact the Line of Business and its ability to succeed.
SALARIES AND EXPENSES OVERVIEW
Y-23
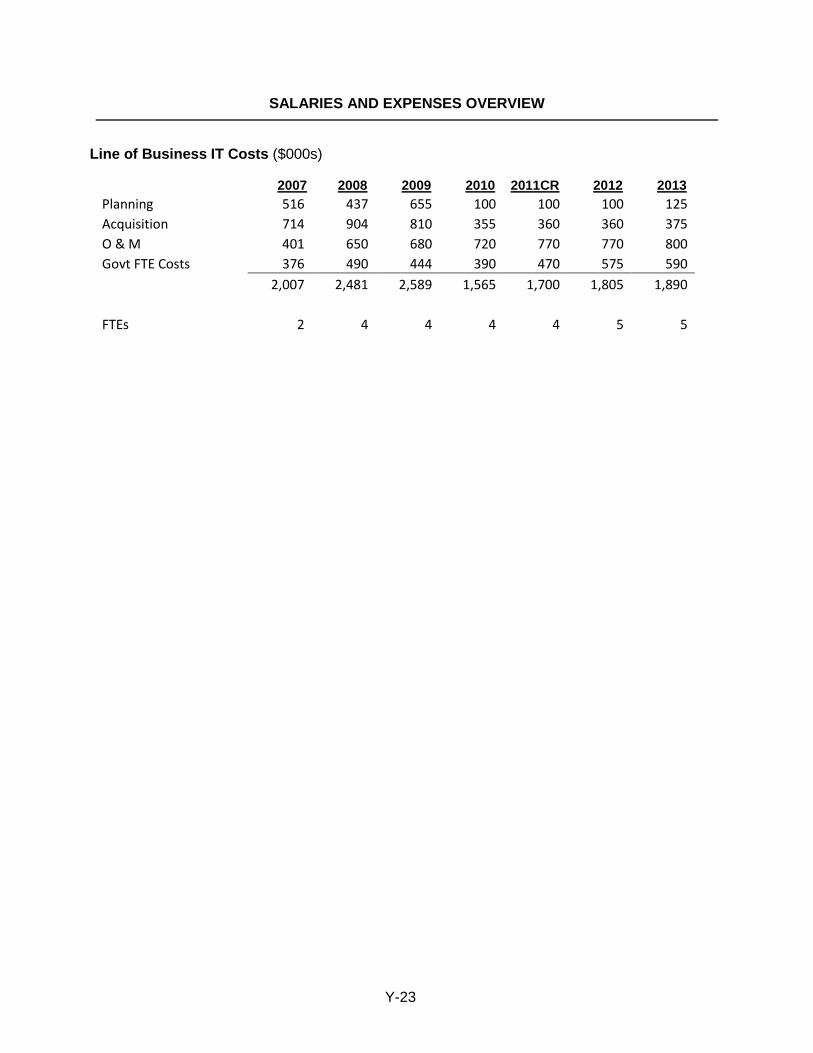
Line of Business IT Costs ($000s)
2007 2008 2009 2010
2011CR 2012 2013
Planning 516 437 655 100 100 100 125
Acquisition 714 904 810 355 360 360 375
O & M 401 650 680 720 770 770 800
Govt FTE Costs 376 490 444 390 470 575 590
2,007 2,481 2,589 1,565 1,700 1,805 1,890
FTEs 2 4 4 4 4 5 5

SALARIES AND EXPENSES OVERVIEW
Y-24
Contributions by Agency ($000s)
AGENCY FY
2010 FY
2011 CR FY
2012
Department of Agriculture 95 105 105
Department of Commerce 95 105 105
Department of Defense--Military 95 105 105
Department of Education (direct funds) 95 105 105
Department of Energy 95 105 105
Department of Health and Human Services 95 105 105
Department of Homeland Security 95 105 105
Housing and Urban Development 95 105 105
Department of the Interior 95 105 105
Department of Justice 105 105 105
Department of Labor 95 105 105
Department of State 95 105 105
Department of Transportation 95 105 105
Department of the Treasury 95 105 105
Department of Veterans Affairs 95 105 105
US Army Corps of Engineers-Civil Works 95 105 105
Environmental Protection Agency 95 105 105
General Services Administration 95 105 105
National Aeronautics and Space Administration 95 105 105
National Science Foundation 95 105 105
USAID 95 105 105
Office of Personnel Management 95 105 105
Small Business Administration 50 50 50
Securities and Exchange Commission 50 50 50
Broadcasting Board of Governors -- 50 50
Office of National Drug Control Policy 50 50 50
Equal Employment Opportunity Commission 50 50 50