department of environmental qualitydeq.wyoming.gov/media/attachments/land...
TRANSCRIPT

DEPARTMENT OF ENVIRONMENTAL QUALITY LAND QUALITY DIVISION
GUIDELINE NO. 12
STANDARDIZED RECLAMATION PERFORMANCE BOND FORMAT AND COST
CALCULATION METHODS
DE 10/2014 ii
TABLE OF CONTENTS INTRODUCTION........................................................................................................................ iv APPLICABLE STATUTES AND RULES AND REGULATIONS ........................................ iv I. COST EXPLANATION FOR ITEMS USED IN STANDARDIZED
RECLAMATION BOND COSTS ................................................................................... 1 Table D-1. Operating Costs and Adjusted Costs ($/Hour w/o Operator) For
Equipment in This Standardized Bond Format……………………………2 Table D-1a. Purchase Price, Lease Cost, and Operating Costs for 58 CY Electric
Shovel and 793F Trucks ............................................................................. 3 Table D-2 Abbreviations Used in This Standardized Bond Format ............................ 4
II. STANDARDIZED RECLAMATION BOND FORMAT ............................................. 4
A. Area Bond ............................................................................................................... 4 1. Introduction ................................................................................................. 4 2. Backfill ........................................................................................................ 4 3. Rough Grade Backfill ................................................................................. 5 4. Final Grade Backfill .................................................................................... 5
B. Incremental Bond .................................................................................................... 5 1. Introduction ................................................................................................. 5 2. Native Topsoil Removal From Borrow and/or Backslope Areas ............... 6 3. Native Overburden Removal From Borrow and/or Backslope Areas......... 6 4. Miscellaneous Overburden Redistribution ................................................. 6 5. Demolition .................................................................................................. 6 6. Removal of Monitoring Structures and Other Miscellaneous Items ........... 7 7. Scarification or Ripping of All Compacted Surfaces .................................. 7 8. Topsoil Redistribution on All Disturbed Areas .......................................... 7 9. Revegetation of All Disturbed Areas ........................................................... 7 10. Reclamation Status and Bond Liability Status of All Lands Within the
Permit Area ................................................................................................. 8 a. Land Status Categories .................................................................... 8 b. Line Item Bond Costs ..................................................................... 9
11. Coal Drilling ............................................................................................. 12 12. Miscellaneous Items .................................................................................. 12 13. Unknown Costs ......................................................................................... 13 14. References ................................................................................................. 14 15. Maps .......................................................................................................... 14
III. APPENDICES ................................................................................................................. 14
Appendix A - Front end loader & truck fleet .................................................................... 15 Appendix B - 657 scraper fleet ......................................................................................... 18 Appendix C - 637 scraper fleet ......................................................................................... 21

DE 10/2014 iii
Appendix D - 58 CY Electric shovel & truck fleet............................................................24 Appendix D1 - 80 CY Electric shovel & truck fleet……………………………………..26 Appendix E - D9 dozer push ............................................................................................. 28 Appendix F - D11 dozer push ........................................................................................... 30 Appendix F1 - D11 CD dozer push .................................................................................. 32 Appendix G - 16M blade grading ..................................................................................... 34 Appendix H - Fencing & powerlines ................................................................................ 35 Appendix I - Asphalt ripping ............................................................................................ 36 Appendix I1 - D10 ripping overburden ............................................................................. 37 Appendix J - Culvert removal ........................................................................................... 38 Appendix K - Demolition ................................................................................................. 39 Appendix L - Drill holes & monitor wells ........................................................................ 40 Appendix M - Grading backfill ......................................................................................... 41 Appendix N - Surface water monitoring stations.............................................................. 42 Appendix O - Air quality monitoring stations .................................................................. 42 Appendix P - Scarification ................................................................................................ 43 Appendix Q - Revegetation .............................................................................................. 44 Appendix R - Project management ................................................................................... 45 Appendix S – Non-coal miscellaneous (contingency) costs……………………………..46
*Diesel fuel cost used in this version = $3.98/gal. & gas = $3.51/gal.

DE 10/2014 iv
INTRODUCTION This document is a Guideline only. Its contents are not to be interpreted by the applicant/permittee or Wyoming Department of Environmental Quality (WDEQ) staff as mandatory. This Guideline intends to assist applicants/permittees in understanding and attaining the requirements of the Wyoming Environmental Quality Act (ACT) and Land Quality Division (LQD) Rules and Regulations addressing bonding topics. This Guideline was developed as a joint project of the Wyoming Mining Association (WMA) Reclamation Subcommittee and the LQD. The LQD has and intends to selectively and periodically publish updated versions of the Cost Calculation Methods as contained in the various Appendices. APPLICABLE WEQA STATUTES AND LQD RULES AND REGULATIONS This is a general summary of items from the ACT.
WS §35-11-417: Outlines some general provisions applying to initial bond and renewal bond values. This statute outlines the concept of Partial Bond Release.
WS §35-11-418: Outlines acceptable bond vehicles.
WS §35-11-423: Outlines procedures for bond release for coal and other mineral permittees.
WS §35-11-411(d): Authorizes the WDEQ Director to establish the bond amount based upon information submitted in the annual report, an inspection and other materials.
These items in LQD Rules and Regulations apply to bonding.
Coal Rules and Regulations, Chapter 1, Section 2(k) and Noncoal Rules and Regulations, Chapter 1, Section 2(i) defines bond.
Coal Rules and Regulations, Chapter 2, Section 3(b)(xxi) requires that shared structures be cross-referenced in the bonds of applicable coal permittees.
Coal Rules and Regulations, Chapter 4, Section 2(d)(ix) establishes a minimum ten (10) year bond period for coal permittees.
Coal Rules and Regulations, Chapter 11 and Noncoal Rules and Regulations, Chapter 6 outlines definitions and procedures for the self-bond program.
Coal Rules and Regulations, Chapter 12 applies exclusively to coal permittees. Section 2(a) defines the Area and Incremental Bonds. Section 2(b) elaborates further bond data

DE 10/2014 v
requirements. Section 2(d) explains the liability areas and periods for the Area and Incremental Bonds. Section 2(e) distinguishes among and establishes procedures for bond adjustments versus bond reductions versus partial bond releases. Sections 2(f) through (h) address requirements for specific bond vehicles.
Coal Rules and Regulations, Chapter 14, Section 4 and Noncoal Rules and Regulations, Chapter 8, Section 3 require a bond for exploration by drilling.
Coal Rules and Regulations, Chapter 15 outlines procedures for partial or complete release of coal permittee bonds.
Noncoal Rules and Regulations, Chapter 9, Section 2 discusses bond requirements for conversion of a non-coal Small Mine Permit to a Regular Mine Permit.
Coal Rules and Regulations, Chapter 20 and Noncoal Rules and Regulations, Chapter 12 details information on Letters of Credit used as a bond vehicle.
DE 10/2014 1
I. COST EXPLANATION FOR ITEMS USED IN STANDARDIZED RECLAMATION BOND COSTS
Equipment sizes (loaders, trucks, scrapers, motor graders, etc.) were selected and agreed upon by the WMA Committee and LQD based on the usual types of equipment contractors normally have available for use. Costs for other equipment may be calculated by using methodologies as shown in this package.
Owning and operating costs were determined, except where noted, by using EquipmentWatch (formerly DataQuest). The owning and operating costs are no longer regionally adjusted to 90% since actual costs in Wyoming no longer reflect that.
Costs for the electric shovel and the trucks associated with the shovel were determined from the InfoMine USA, Inc.; Mine and Mill Equipment Costs Estimators Guide (2014). There was no adjustment factors used for these costs since they are based on actual costs at mining operations in the United States.
A standard efficiency factor of 0.83 is incorporated into all production calculations. The factor accounts for a fifty-minute work hour as recommended by many cost references.
Labor and benefit costs were obtained from the 2014 State Building Construction Prevailing Wages (February 2014).
Supervision costs were determined by adding $5.00 per hour to labor costs and also include the same percentage add-on for benefits that the labor costs had. In most cases, only a portion of a supervisor's costs is applied to each task. Theoretically, this allows one supervisor the flexibility to oversee many jobs or pieces of equipment at the same time.
The supervisor's transportation is also divided among tasks. For example, where one-half of a supervisor's time is allotted, the same amount of time is used in calculating his transportation costs.
Where only a portion of support equipment are used in a calculation (i.e., one-half water truck), it is assumed that the equipment in question services more than one area.

DE 10/2014 2
Table D-1. Operating Costs and Adjusted Costs ($/Hour w/o Operator) For Equipment in This Standardized Bond Format
Equipment
Type
Equipment Name
100% Equipment Watch Book Cost (w/o Operator)
($)
Date
Dozer
Caterpillar D9T (SU)
205.87 10/2014
Blade
Caterpillar 16M
151.77 10/2014
Scraper
Caterpillar 657G P-P
419.32 10/2014
Truck (95 ton)
Caterpillar 777F
308.40 10/2014
Loader (13.5 CY)
Caterpillar 992K
361.20 10/2014
Loader (5.25 CY)
Caterpillar 980H
117.64 10/2014
Dozer
Caterpillar D10T (SU)
284.28 10/2014
Dozer
Caterpillar D11R (U)
457.68 10/2014
Dozer
Caterpillar D11R-CD
427.86 10/2014
Backhoe Loader
Caterpillar 430E(4WD)
35.73 10/2014
Water Truck
14,000 Gallon
210.69 10/2014
Dump Truck
10-12 CY
77.10 10/2014
Pickup Truck
Crew 4x4 1T (Gas)
30.35 10/2014
Pickup Truck
Crew 4x4 1T (Diesel)
26.79 10/2014
Tractor
New Holland 545D 4WD 63 H.P.
16.48
10/2014 Towed Mower
Flail 7 ft
2.43 10/2014
Rubber Tired Dozer
Caterpillar 854G
346.86 10/2014
Scraper Scraper Scraper Blade Dozer Scraper
Caterpillar 637G P-P Caterpillar 651E Caterpillar 627G P-P Caterpillar 140M Caterpillar D6T-XL SU Caterpillar 631G
337.52 256.82 249.49
75.75 93.10
239.72
10/2014
Caterpillar 24H blade: $69.66/hr. to lease and $146.86/hr. operating cost (from InfoMine USA, Inc.) for total of $216.52/hr. This blade is used in the truck/shovel appendices (D & D1) only.

DE 10/2014 3
Table D-1a. Purchase Price, Lease Cost, and Operating Costs for 58 CY Electric Shovel and 793C Trucks
Operators that use the truck/shovel appendix must show a regrading plan that is suitable for a large shovel/truck operation. Many backfill operations are not suited for this type operation because the cuts are not thick enough to allow the shovel optimum digging depths, highwall reduction with dozers takes up a large percentage of the required backfill, and there is insufficient backfill to justify this large shovel/truck fleet. Operators using the shovel/truck appendix should submit suitable cut and fill isopachs that support the choice of this backfill method. This method is not to be used for topsoil movement from native areas or from stockpiles. Topsoil movement from stockpiles should have the production rate at 85% (see page 7, item 8.). The $22,650,000.00 purchase price of the 58 CY shovel must be added to the bond costs. There is no profit or other contingency items added to this cost so it can be added to the bond cost after all the line items and add-ons have been totaled. No salvage value is allowed at the end of the project. 58 CY Electric Shovel Purchase Price $22,650,000 (InfoMine) Productivity - 58 CY x 1 pass/35 sec. x 3,600 sec./hr. x 0.968 bucket fill factor = 5,774 .
5,774 CY/hr. x 0.8696 BCY/LCY (15% swell of BCY) = 5,021 BCY/hr. 5,021 BCY/hr. x 0.8333 (operating efficiency) = 4,184 BCY/hr.
58 CY Shovel Hourly Costs (WME) Overhaul Parts
Overhaul Labor
Maint. Parts
Maint. Labor
Power
Lube
Wear Parts
Total
$69.79
$68.80
104.68
$103.21
$80.12
$64.71
$24.96
$516.28
(Note: if mine uses an 80 CY shovel the purchase price will be $24,200,000 & $517.86/hr. w/o ownership cost) Caterpillar 793D Trucks (240 Ton) Purchase Price $4,129,000 (InfoMine) Monthly Lease (@600 hr./month) $92,787.00 Hourly Lease Cost $154.64 [Cat 797F Trucks (380T) @ $244.08/hr. to lease & $628.41/hr. operating cost = $872.49/hr.]
793 Truck Hourly Costs (WME) Overhaul Parts
Overhaul Labor
Maint. Parts
Maint. Labor
Fuel
Lube
Tires
Total
$13.11
$11.08
$24.35
$20.58
$144.44
$34.26
$106.85
$354.66

DE 10/2014 4
Table D-2. Abbreviations Used in This Standardized Bond Format CPH - Caterpillar Performance Handbook (Edition No. specified where appropriate) EQW - Equipment Watch Guide (date of data indicated) WYDOT-WDD - Wyoming Department of Transportation - Wage Determination Decision
(2014 Version) IM - InfoMine, USA, Inc. (2014 Estimating Guide) BCY - Bank Cubic Yard LCY - Loose Cubic Yard MPH - Miles per Hour BHB - Black Hills Bentonite Corporation AML - DEQ Abandoned Mine Land Reclamation Program II. STANDARDIZED RECLAMATION BOND FORMAT
Individual items may be expanded as necessary or noted as not applicable based upon the specific reclamation practices approved in each permit. This guideline refers to “area bond” and “incremental bond” which are terms that are associated with bond estimates for coal mines. In general terms, the area bond is the pit backfill cost and the incremental bond is the cost of completing the reclamation after backfilling is completed. These terms are not applicable for non-coal mines, but the costs are estimated in the same manner.
A. Area Bond
The Area Bond covers the costs of backfilling and rough grading (and special reconstruction techniques when specifically approved) according to procedures and postmining topography approved in the current term permit.
1. Introduction
Present a general discussion of assumptions, including time frames, backup calculations, procedures, methods, etc. for summarizing or documenting the basis for all calculations. The reclamation cost estimate should be based upon completing the reclamation of the site in a timely and efficient manner consistent with the approved reclamation plan. The time frame for completion must be clearly stated in order to support the calculations.
2. Backfill
Describe equipment, procedures, volumes, and costs for bringing all pits to an interim/bond topography with reference to a quality, current map of the project site. The interim/bond topography must come as close as possible to the approved final topography, acknowledging that the current mine site differs from the final configuration.
DE 10/2014 5
The operator should submit a map showing the interim/bond topography that will be constructed if the mine were to cease operations during the next Annual Report period. Cut and fill isopachs may also need to be submitted to adequately show the backfill work.
LQD realizes that the interim/bond topography will not exactly match the approved PMT because the mine life will not be the same. The operator must do more than simply regrade the highwalls and spoil piles to 5(H):1(V) slopes, topsoil and seed. There has to be some diversity built into the slopes and adequate, non-erosive through drainage. LQD will not accept long, straight slopes that match the dragline or truck/shovel highwall from the current pit.
Appendices A through F detail equipment fleets and costs for this reclamation activity.
Operators should clearly show cut and fill areas and the associated haul distances and grades on a map.
This section should clearly list overburden Drilling and Blasting cost at $0.259/BCY when applicable. If the operator intends to cast blast some material then that should be calculated at $0.400/BCY. Drill and blast costs in small mines and quarries are considerably higher and the cost should be figured at $0.859/BCY, or on a case by case basis depending on the location, topography, rock type, etc.
3. Rough Grade Backfill
Describe procedures and costs for shaping interim/bond topography with reference to a quality map. NOTE: Depending upon permit approved backfill practices, rough grading may not be a necessary line item bond cost.
Appendices G and M detail equipment and costs for this reclamation activity.
4. Final Grade Backfill
Describe equipment, procedures, and costs for specific site tasks (e.g., drainage reconstruction or permit-specific postmining features).
Appendix G details equipment and costs for this reclamation activity.
B. Incremental Bond
1. Introduction The Incremental Bond covers all other costs beyond those detailed in the Area Bond.
Present a general discussion of assumptions, including time frames, backup calculations, procedures, methods, etc. for summarizing or documenting the basis for all calculations. The reclamation cost estimate should be based upon completing the reclamation of the site

DE 10/2014 6
in a timely and efficient manner consistent with the approved reclamation plan. The time frame for completion must be clearly stated in order to support the calculations.
2. Native Topsoil Removal from Borrow and/or Backslope Areas
If applicable, describe equipment, volumes, haul routes, and costs with reference to a quality, current map of the project site.
Appendices A, B, C, E, F and G detail potential equipment and costs for this reclamation activity.
3. Native Overburden Removal from Borrow and/or Backslope Areas
If applicable, describe equipment, haul routes, volumes, and costs with reference to a quality, current map of the project site.
Appendices A through G detail potential equipment and costs for this reclamation activity.
4. Miscellaneous Overburden Redistribution
Describe equipment, haul routes, volumes, and costs (with reference to a quality map) for backfilling structures, such as:
● scoria or shale pit(s) ● sediment ponds ● diversion ditches ● sewage lagoons ● access/haul road cut or fill ● culverts ● railroad cuts/embankments ● other
Appendices A through G (excluding D) detail potential equipment and costs for this reclamation activity.
5. Demolition
Equipment, procedures, and costs for demolition and disposal of each individual structure should be described in terms of size, type of construction, etc. so that appropriate demolition costs can be estimated, such as:
● fences ● power lines, transformers ● hard-surfaced roads ● bridges ● abandoned equipment (i.e., draglines, shovels, drills and pieces of same) ● culverts ● railroads (rails, ties, ballast, scales, etc.) ● facility buildings (shops, warehouse, offices, etc.) ● mineral handling facilities (truck dumps, conveyors, silos, scales, etc.)

DE 10/2014 7
● support facilities (ready line, fuel tanks, water tanks, equipment yards, explosive storage sites, electrical substations)
Appendices H through K contain costs for these reclamation and demolition practices. LQD accepts no salvage value for any facilities, equipment, or other infrastructure.
6. Removal of Monitoring Structures and Other Miscellaneous Items
Describe the procedures, equipment, and costs required to properly abandon or remove and disposal of items, such as: ● groundwater monitor wells ● all other operator-owned wells within the permit area ● surface water monitoring stations ● all other experimental study sites within the permit area ● meteorological/air quality monitoring sites
Appendices L through O detail equipment and costs for these reclamation practices.
7. Scarification or Ripping of All Compacted Surfaces
Describe equipment, procedures, and costs (preferably on a per acre basis) with reference to a quality, current map of the project site.
Appendices I1 and P detail costs for this reclamation practice.
8. Topsoil Redistribution on All Disturbed Areas
Describe equipment, procedures, and costs with reference to a quality, current map of the project site. The map should show haul distances and grades.
Appendices B and C detail equipment and costs for this reclamation activity. Topsoil haul from stockpiles with shovel or loader and trucks is not as productive as conventional drilled and shot material. LQD assumes the cost for this topsoil at 115% of the cost in the truck/shovel and loader/truck appendicies.
9. Revegetation of All Disturbed Areas
Describe equipment, practices, and costs (preferably on a per acre basis), including:
● seedbed preparation ● mulch (purchase and application) ● seed (purchase and application) ● fertilizer (if required, purchase and application)
DE 10/2014 8
● post-seeding maintenance over the minimum bonding period (e.g., weed control, mowing, interseeding). Operators suggest that a ten percent line item should cover this issue for the entire bonding period.
Appendix Q outlines a cost calculation process for this reclamation activity. The costs must be calculated using the specific seed mixes and practices from the approved term permit.
10. Reclamation Status and Bond Liability Status of All Lands within the Permit Area
a. Land Status Categories
The bond calculation should describe the status of all lands within the permit area. Each land status category should be clearly identified on a quality map and cross-referenced to specific reclamation cost for each category. The LQD also prefers a tabular summary of the acreage for each category.
LANDS THAT HAVE BEEN TOPSOILED AND SEEDED BUT HAVE NO BOND RELEASE MUST BE BONDED FOR RETOPSOILING, SCARIFICATION, AND REVEGETATION. [See Section 10.b.(2)(b)i)e) on page 10]
The following is a summary of generic land status categories. Section 10.(2) below
details the information and calculations necessary for each of these categories.
(1) Native lands undisturbed at the time of this specific bond calculation and which will remain undisturbed under this bond calculation (e.g., no borrow areas necessary).
(2) Lands disturbed and requiring backfilling, regrading and revegetation at the
time of this specific bond calculation.
(a) Lands requiring assessment of Area Bond costs
(b) Lands requiring assessment of full or Incremental Bond costs
(c) Lands requiring assessment of partial Incremental Bond costs
i) Lands permanently reclaimed prior to December 31, 1982
ii) Lands permanently reclaimed after December 31, 1982
a) Lands with no approved Partial or Full Bond Release
b) Lands with approved 60 percent Partial Release of the Incremental Bond

DE 10/2014 9
c) Lands with approved larger percent Partial Release of the
Incremental Bond
d) Lands with approved Full Release of Area and Incremental Bonds
b. Line Item Bond Costs
(1) The bond covers lands currently disturbed by mining and associated activities
and those lands to be disturbed in the next 12-month period.
(2) The bond should include costs for the Area Bond (through backfill, rough and final grading) for all open pits, impoundments, sediment ponds, diversions, etc.
(a) Section II.A of this Guideline and its associated appendices detail
procedures and costs for the Area Bond. The bond calculation should detail costs for the operations listed in Section II.A Parts 2, 3 and 4.
(b) Section II.B of this Guideline and its associated appendices detail
general categories and procedures for the Incremental Bond. Overall, the bond calculation should detail costs for the operations listed in Section II B Parts 2 through 9.
i) The bond calculation should assess the full suite of Incremental
Bond tasks and costs for all disturbed lands which have not formally approved partial or full release of the Incremental Bond.
Historic LQD policy, LQD Coal Rules and Regulations Chapter 15 and WS§35-11-417(e) establish three (3) distinct categories of Partial Bond Release for permanently reclaimed lands.
(a) Lands Permanently Reclaimed Prior to December 31, 1982
Prior to this date and prior to approval of the Wyoming State Coal
Program, the LQD granted defacto Partial Bond Release for permanently reclaimed lands.
The LQD did not specifically approve or otherwise record this Partial
Bond Release category, so there is generally no written approval letter.
The bond should specifically identify this Partial Bond Release category if it exists.

DE 10/2014 10
The bond should include a carry-over cost assessment for interseeding an appropriate, permit-approved seed mixture on these lands. These carry-over costs should include seed purchase and seed implantation.
(b) 60 Percent Partial Bond Release
LQD Coal Rules and Regulations Chapter 15, Section 5(a)(i) allows for release of 60 percent of the Incremental Bond when the permittee has completed backfilling, regrading, topsoil replacement, and drainage control according to the approved term permit procedures.
This category of Partial Bond Release requires formal, written approval
by the DEQ Director. If this release category exists for your specific permit, the bond calculation should include the date of the Director's approval letter.
The bond calculation should specifically identify this category and show
the appropriate units on a quality map. The bond calculation should specifically tabulate the residual 40 percent
Incremental Bond costs (preferably on a per acre basis) as the appropriate carry-over cost assessment. As noted above, the Incremental Bond includes all term permit approved Reclamation Plan practices beyond rough grading of the backfill. The tabulation of the 40 percent Incremental Bond carry-over costs should detail all approved reclamation practices.
(c) Larger Percentage of Partial Bond Release
LQD Coal Rules and Regulations Chapter 15, Section 5(a)(ii)(A) allows
more than 60 percent release of the Incremental Bond as determined by the LQD Administrator and DEQ Director.
WS §35-11-423(d) mandates development of specific rules and
regulations for release of coal bonds. These rules are controlling not withstanding other provisions of WS§35-11-417 and §35-11-423 to the contrary.
LQD Coal Rules and Regulations, Chapter 15 is that formulation.
Coal Chapter 15 governs partial and 100 percent release of the
Incremental Bond. For partial release, the amount remaining cannot be less than the cost of reseeding.

DE 10/2014 11
This category of Partial Bond Release requires formal, written approval by the DEQ Director. If this release category exists for your specific permit, the bond calculation should identify the date of the Director's approval letter.
The bond calculation should specifically tabulate the residual percentage
Incremental Bond costs (preferably on a per acre basis) as the appropriate carry-over cost assessment. As previously noted, the Incremental Bond includes all term permit approved Reclamation Plan practices beyond rough grading of the backfill. The tabulation of the percentage Incremental Bond carry-over costs should detail all approved reclamation practices.
NOTE: The percentages of partial release of the Incremental Bond vary
for Noncoal Permittees. A Noncoal Permittee seeking partial release should consult with the LQD.
(d) Full Bond Release of the Area and Incremental Bonds
This category includes all land permanently reclaimed and formally released under provisions of the 1973 ACT and LQD RR Chapter 15.
Full Bond Release requires formal, written approval by the DEQ
Director. If this category exists for your specific permit, the bond calculation should list the date of the DEQ Director's Full Bond Release decision.
(e) Lands Permanently Reclaimed After December 31, 1982
This category includes all land permanently reclaimed that has no bond release.
These reclaimed lands must be bonded to scarify, retopsoil, and reseed.
There are no provisions made for where the topsoil would come from. It is assumed that topsoil would be spread at the same average depth on these lands as it is on the rest of the areas requiring topsoil. Topsoil haul distance and grade used would be the weighted average used for the rest of the reclamation. Scarification and reseeding costs would be the same per acre as those used on other lands requiring reclamation.
NOTE: The LQD continues development of a DRAFT Guideline on
Full and Partial Bond Release Procedures. Please consult with the LQD concerning the status of that Guideline, should you consider bond release for permanently reclaimed lands.

DE 10/2014 12
11. Coal Drilling
Describe the approximate number, depth, diameter, and location (show on inclusive map, if possible) of all holes drilled into or through coal during the current and next annual report period. A tabular format with reference to map locations may be an efficient presentation. This description should distinguish between coal drill holes which will be or have been removed by the pit advance within the annual report period versus those coal drill holes which will not be mined out in a report cycle. The operator may distinguish between abandonment/plugging procedures for the coal drill holes mined out in the report cycle versus the longer term abandoned holes. Each category should have a total line item cost entry in the bond. The LQD prefers that all coal drill hole reclamation costs be estimated according to Appendices L and M.
12. Miscellaneous Items
The following tasks are mostly for the surface coal mine bonds. Miscellaneous bond costs for other mines, which are typically much smaller than coal mines, will be different. Mobilization, de-mobilization, and profit will likely be higher for small, remote projects, and other tasks will also vary. LQD feels that the miscellaneous costs on other mines should range from 25% on projects in excess of $500,000.00, to 35% on projects of $250,000.00, and 45% on projects of $50,000 and less. See Appendix S, page 46.
Each individual operator should identify these items as a line item or include each in some specific bond category. Otherwise, the LQD will enter the item as an addition to total dollar value of the Area and Incremental Bonds.
a. COSTS FOR AN INDEPENDENT FIRM TO DESIGN THE FINAL
RECLAMATION PROJECT: LQD and WMA agreed on a flat $250,000 for project design regardless of project size.
b. CONTRACTOR PROFIT, OVERHEAD, MOBILIZATION AND
DEMOBILIZATION COSTS: The Dataquest Cost Reference Guides used to construct the appendices do not include these costs. If an operator uses these appendices in bond calculations, there is still a need for this distinct line item cost in the bond. Assorted references place these items from 8 to 15 percent of the total bond cost. Presently LQD is using 13.5 percent.
c. PRECONSTRUCTION INVESTIGATION AND STABILIZATION: This item
addresses all field work necessary to document and mitigate dangerous and/or quickly deteriorating conditions, such as slumping highwalls or drainage problems. Any assessment under this item will be based upon the LQD's knowledge of specific site conditions and the length of time between cessation/forfeiture and initiation of the final reclamation project. When necessary, reference sources place this cost at 1 to 2 percent. LQD is using 1.5 percent.

DE 10/2014 13
d. COSTS FOR AN INDEPENDENT FIRM TO MANAGE THE FINAL RECLAMATION PROJECT: LQD and the WMA agreed that the Office of Surface Mining’s sliding scale would be used for this item. A copy of that is attached as Appendix R.
e. COSTS FOR ON SITE MONITORING PROGRAMS FOR TEN YEARS AFTER
COMPLETION OF THE FINAL RECLAMATION PROJECT (INCLUDES SUCH ITEMS AS UTILITIES AND GROUNDWATER SAMPLING): Costs of this item will vary depending upon specific permit commitments. The LQD uses a range of 1/2 to 2 percent. Usually LQD uses 1.0 percent.
f. COSTS FOR SITE SECURITY DURING THE FINAL RECLAMATION PROJECT
AND LIABILITY INSURANCE COST DURING THE FINAL RECLAMATION PROJECT AND OVER THE FULL BONDING PERIOD: LQD and the WMA agreed that $250,000 per year of project life would be adequate.
g. LONG-TERM ADMINISTRATION AND ACCOUNTING COSTS: LQD and the
WMA agreed to a range of $315,000 to $505,000 based on the project size.
h. ANY OTHER SITE-SPECIFIC PERMIT COMMITMENTS SHOULD ALSO BE INCLUDED HERE: Costs will vary according to specific permit commitments.
The LQD has historically used the following sources to establish the range of percentages list in the Miscellaneous Items.
* Means Heavy Construction Cost Data (current edition), published by R. S. Means Company, Inc., Kingston, MA
* Means Site Work Cost Data (current edition), published by R. S. Means
Company, Inc., Kingston, MA
* Building Construction Cost Data (current edition), published by R. S. Means Company, Inc., Kingston, MA
* Handbook for Calculation of Reclamation Bond Costs, 1987, Department of
Interior, Office of Surface Mining Reclamation and Enforcement, Washington, D.C.
* Wyoming DEQ Abandoned Mine Land Program contracting and reclamation
practices and cumulative experience
13. Unknown Costs
The items under L) represent the usual contingency items applied to bonds. If these items are included as line items in the bond, the only remaining category could be unknown as

DE 10/2014 14
per WS §35-11-417(c)(ii). References place this cost at 2 to 5 percent of the total bond cost. Under normal circumstances LQD is using 5.0 percent.
14. References
List sources of information, procedures, costs, etc. which were used in the bond calculations.
15. Maps
This Guideline requests that the various tasks, operations, disturbed areas, reclamation areas, etc., be illustrated on or referenced to a QUALITY, CURRENT MAP. Several of the tasks may be illustrated on the same map. All maps presented in support of the bond calculations must be clear and legible contour maps or recent (with date) aerial photographs. The preferred scale is 1"=500', unless it is necessary to directly compare (e.g., overlay) a bond map to an existing permit map. In this case the scales should be identical. Each map should be of a reasonable size, generally no larger than 48" on a side.
Each map must have a complete title block, including:
● Map title ● Name and address of permittee ● Permit number and term designation ● Annual report period ● Scale, north arrow, contour interval, date of photography or date of preparation
All maps must show and clearly label:
● Legal subdivisions with section, township, and range lines ● Permit area boundary and term boundary
III. APPENDICES The following appendices are intended for use in this standardized bond calculation package. Any references to specific equipment should not be interpreted as a recommendation of any kind by any person, company or agency for the use of specific brand-name equipment.

DE 10/2014 15
Appendix A Calculations for Moving Materials with a Caterpillar 992K Loader and Caterpillar 777F Truck Fleet NOTE: THESE COSTS ARE FOR EXCAVATION ONLY. MATERIAL REQUIRING BLASTING SHOULD HAVE AN ADDITIONAL $0.259/BCY ADDED FOR DRILLING AND BLASTING
COSTS. Material Movement by Loader-Truck Combination
1) Caterpillar 992K Loader 13.2 BCY CPH 40 2) Caterpillar 777F Trucks (85 ton) 66.0 BCY CPH 40 3) Material Density 2,850.0 LB/BCY CPH 40 4) Operating Efficiency Factor (50 Min/Hr.) 0.83 CPH 40 5) Rolling Resistance Factor 4.00 % CPH 40 6) 777F Truck Operating Costs $308.40 per Hour 100% of E-W 7) 992K Loader Operating Costs $361.20 per Hour 100% of E-W 8) Labor Costs $44.97 per Hour WYDOT-WDD 9) 1/2 of 1 - 14,000 Gal. Water Trucks + 1 Operator $127.83 per Hour 1/2 of 100% E-W 10) 1 – 16M Blade for Road Work + 1 Operator $196.74 per Hour 100% E-W + Operator 11) 1 - D9T for Misc. Work + 1 Operator $250.84 per Hour 100% E-W + Operator 12) Supervision Labor Costs $24.99 per Hour 1/2 of WYDOT-WDD 13) Supervisor Transportation $13.40 per Hour 1/2 of 100% E-W 14) Total Fleet Hourly Costs (Except Trucks) $1,019.97 TO USE TABLE: Locate your approximate grade by reference to case number. Determine cost per BCY by using distance column that approximates your distance. No calculations are necessary. Case #1: Level Ground Loaded (0% grade + 4% rolling = 4% total resistance) Empty (0% grade + 4% total resistance)
One-Way Distance
(Ft.)
Load Time (Min.)
Maneuver Time
(Min.)
Travel Time
Loaded (Min.)
Dump Time (Min.)
Travel Time
Empty (Min.)
Total Cycle Time
(Min.)
Trips Per
Hour
Payload (BCY)
Adjusted
Truck Productivity (BCY/Hr.)
Adjusted Loader
Productivity (BCY/Hr.)
Number of Trucks Required
Operating Costs
($/BCY)
500
3.50
0.70
0.282
1.10
0.15
5.732
10.47
66
575
942
1.64 $1.698
1000
3.50
0.70
0.564
1.10
0.30
6.164
9.734
66
535
942
1.76 $1.743
1500
3.50
0.70
0.846
1.10
0.45
6.596
9.10
66
500
942
1.88 $1.788
2000
3.50
0.70
1.129
1.10
0.60
7.029
8.536
66
469
942
2.01 $1.837
2500
3.50
0.70
1.411
1.10
0.75
7.461
8.042
66
442
942
2.13 $1.882
3000
3.50
0.70
1.693
1.10
0.90
7.893
7.602
66
418
942
2.25 $1.927
3500
3.50
0.70
1.975
1.10
1.05
8.325
7.207
66
396
942
2.38 $1.976
4000
3.50
0.70
2.257
1.10
1.20
8.757
6.852
66
377
942
2.50 $2.021
4500
3.50
0.70
2.539
1.10
1.35
9.189
6.53
66
359
942
2.62 $2.066
5000
3.50
0.70
2.821
1.10
1.50
9.621
6.24
66
343
942
2.75 $2.114
5500
3.50
0.70
3.104
1.10
1.65
10.054
5.97
66
328
942
2.87 $2.159
6000
3.50
0.70
3.386
1.10
1.80
10.486
5.72
66
315
942
2.99 $2.204
6500
3.50
0.70
3.668
1.10
1.95
10.918
5.50
66
302
942
3.12 $2.253
7000
3.50
0.70
3.950
1.10
2.10
11.35
5.29
66
291
942
3.24 $2.298
Operating Costs = (((# Trucks x (Truck costs + Labor costs)) + Total Fleet costs)/Loader Productivity)

DE 10/2014 16
Appendix A (Continued) Calculations for Moving Materials with a Caterpillar 992K Loader and Caterpillar 777F Truck Fleet Material Movement by Loader-Truck Combination Case #2: 5% Assisting Grade Loaded (-5% grade + 4% rolling = -1% total) Empty (5% grade + 4% rolling = 9% total)
One-Way Distance
(Ft.)
Load Time (Min.)
Maneuver Time
(Min.)
Travel Time
Loaded (Min.)
Dump Time (Min.)
Travel Time
Empty (Min.)
Total Cycle Time
(Min.)
Trips Per
Hour
Payload (BCY)
Adjusted
Truck Productivity (BCY/Hr.)
Adjusted Loader
Productivity (BCY/Hr.)
Number of Trucks Required
Operating Costs
($/BCY)
500
3.50
0.70
0.139
1.10
0.279
5.718
10.49
66
577
942
1.63 $1.694
1000
3.50
0.70
0.279
1.10
0.557
6.136
9.78
66
538
942
1.75 $1.739
1500
3.50
0.70
0.418
1.10
0.836
6.554
9.15
66
503
942
1.87 $1.784
2000
3.50
0.70
0.557
1.10
1.114
6.971
8.61
66
473
942
1.99 $1.829
2500
3.50
0.70
0.696
1.10
1.393
7.389
8.12
66
446
942
2.11 $1.874
3000
3.50
0.70
0.836
1.10
1.671
7.807
7.69
66
423
942
2.23 $1.919
3500
3.50
0.70
0.975
1.10
1.950
8.225
7.29
66
401
942
2.35 $1.964
4000
3.50
0.70
1.114
1.10
2.229
8.643
6.94
66
381
942
2.46 $2.006
4500
3.50
0.70
1.254
1.10
2.507
9.061
6.62
66
364
942
2.59 $2.054
5000
3.50
0.70
1.393
1.10
2.786
9.479
6.33
66
348
942
2.71 $2.099
5500
3.50
0.70
1.532
1.10
3.064
9.896
6.06
66
333
942
2.83 $2.144
6000
3.50
0.70
1.671
1.10
3.343
10.314
5.82
66
320
942
2.95 $2.189
6500
3.50
0.70
1.811
1.10
3.621
10.732
5.59
66
307
942
3.06 $2.231
7000
3.50
0.70
1.950
1.10
3.900
11.15
5.38
66
296
942
3.18 $2.276
Case #3: 10% Assisting Grade Loaded (-10% grade + 4% rolling = -6% total) Empty (10% grade + 4% rolling = 14% total)
One-Way Distance
(Ft.)
Load Time (Min.)
Maneuver Time
(Min.)
Travel Time
Loaded (Min.)
Dump Time (Min.)
Travel Time
Empty (Min.)
Total Cycle Time
(Min.)
Trips Per
Hour
Payload (BCY)
Adjusted
Truck Productivity (BCY/Hr.)
Adjusted Loader
Productivity (BCY/Hr.)
Number of Trucks Required
Operating Costs
($/BCY)
500
3.50
0.70
0.139
1.10
0.436
5.875
10.21
66
561
942
1.68 $1.713
1000
3.50
0.70
0.279
1.10
0.871
6.45
9.30
66
511
942
1.84 $1.773
1500
3.50
0.70
0.418
1.10
1.307
7.025
8.54
66
470
942
2.01 $1.837
2000
3.50
0.70
0.557
1.10
1.743
7.60
7.89
66
434
942
2.17 $1.897
2500
3.50
0.70
0.696
1.10
2.179
8.175
7.34
66
404
942
2.33 $1.957
3000
3.50
0.70
0.836
1.10
2.614
8.75
6.86
66
377
942
2.50 $2.021
3500
3.50
0.70
0.975
1.10
3.050
9.325
6.45
66
354
942
2.66 $2.081
4000
3.50
0.70
1.114
1.10
3.35
9.90
6.06
66
333
942
2.83 $2.144
4500
3.50
0.70
1.254
1.10
3.921
10.475
5.73
66
315
942
2.99 $2.204
5000
3.50
0.70
1.393
1.10
4.357
11.05
5.43
66
299
942
3.16 $2.268
5500
3.50
0.70
1.532
1.10
4.793
11.625
5.16
66
284
942
3.32 $2.328
6000
3.50
0.70
1.671
1.10
5.229
12.22
4.91
66
270
942
3.49 $2.392
6500
3.50
0.70
1.811
1.10
5.664
12.775
4.70
66
258
942
3.65 $2.452
7000
3.50
0.70
1.950
1.10
6.10
13.35
4.49
66
247
942
3.81 $2.512
DE 10/2014 17
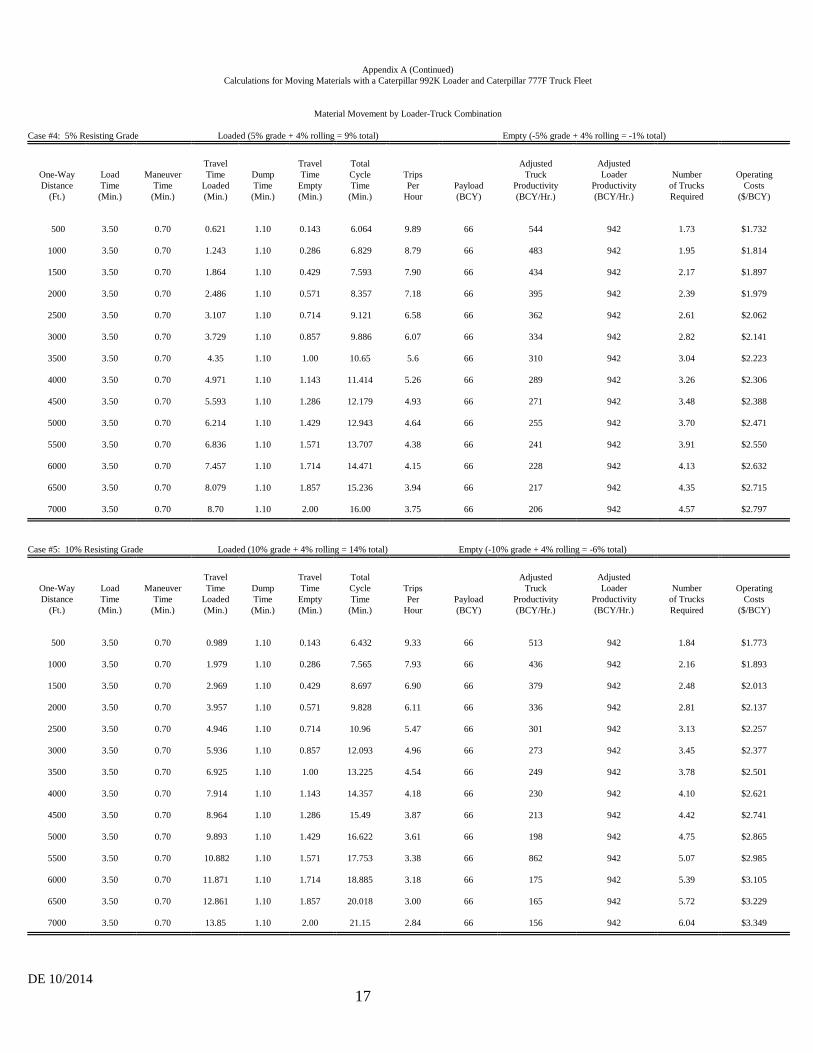
Appendix A (Continued) Calculations for Moving Materials with a Caterpillar 992K Loader and Caterpillar 777F Truck Fleet Material Movement by Loader-Truck Combination Case #4: 5% Resisting Grade Loaded (5% grade + 4% rolling = 9% total) Empty (-5% grade + 4% rolling = -1% total)
One-Way Distance
(Ft.)
Load Time (Min.)
Maneuver Time
(Min.)
Travel Time
Loaded (Min.)
Dump Time (Min.)
Travel Time
Empty (Min.)
Total Cycle Time
(Min.)
Trips Per
Hour
Payload (BCY)
Adjusted
Truck Productivity (BCY/Hr.)
Adjusted Loader
Productivity (BCY/Hr.)
Number of Trucks Required
Operating Costs
($/BCY)
500
3.50
0.70
0.621
1.10
0.143
6.064
9.89
66
544
942
1.73
$1.732
1000
3.50
0.70
1.243
1.10
0.286
6.829
8.79
66
483
942
1.95
$1.814
1500
3.50
0.70
1.864
1.10
0.429
7.593
7.90
66
434
942
2.17
$1.897
2000
3.50
0.70
2.486
1.10
0.571
8.357
7.18
66
395
942
2.39
$1.979
2500
3.50
0.70
3.107
1.10
0.714
9.121
6.58
66
362
942
2.61
$2.062
3000
3.50
0.70
3.729
1.10
0.857
9.886
6.07
66
334
942
2.82
$2.141
3500
3.50
0.70
4.35
1.10
1.00
10.65
5.6
66
310
942
3.04
$2.223
4000
3.50
0.70
4.971
1.10
1.143
11.414
5.26
66
289
942
3.26
$2.306
4500
3.50
0.70
5.593
1.10
1.286
12.179
4.93
66
271
942
3.48
$2.388
5000
3.50
0.70
6.214
1.10
1.429
12.943
4.64
66
255
942
3.70
$2.471
5500
3.50
0.70
6.836
1.10
1.571
13.707
4.38
66
241
942
3.91
$2.550
6000
3.50
0.70
7.457
1.10
1.714
14.471
4.15
66
228
942
4.13
$2.632
6500
3.50
0.70
8.079
1.10
1.857
15.236
3.94
66
217
942
4.35
$2.715
7000
3.50
0.70
8.70
1.10
2.00
16.00
3.75
66
206
942
4.57
$2.797
Case #5: 10% Resisting Grade Loaded (10% grade + 4% rolling = 14% total) Empty (-10% grade + 4% rolling = -6% total)
One-Way Distance
(Ft.)
Load Time (Min.)
Maneuver Time
(Min.)
Travel Time
Loaded (Min.)
Dump Time (Min.)
Travel Time
Empty (Min.)
Total Cycle Time
(Min.)
Trips Per
Hour
Payload (BCY)
Adjusted
Truck Productivity (BCY/Hr.)
Adjusted Loader
Productivity (BCY/Hr.)
Number of Trucks Required
Operating Costs
($/BCY)
500
3.50
0.70
0.989
1.10
0.143
6.432
9.33
66
513
942
1.84
$1.773
1000
3.50
0.70
1.979
1.10
0.286
7.565
7.93
66
436
942
2.16
$1.893
1500
3.50
0.70
2.969
1.10
0.429
8.697
6.90
66
379
942
2.48
$2.013
2000
3.50
0.70
3.957
1.10
0.571
9.828
6.11
66
336
942
2.81
$2.137
2500
3.50
0.70
4.946
1.10
0.714
10.96
5.47
66
301
942
3.13
$2.257
3000
3.50
0.70
5.936
1.10
0.857
12.093
4.96
66
273
942
3.45
$2.377
3500
3.50
0.70
6.925
1.10
1.00
13.225
4.54
66
249
942
3.78
$2.501
4000
3.50
0.70
7.914
1.10
1.143
14.357
4.18
66
230
942
4.10
$2.621
4500
3.50
0.70
8.964
1.10
1.286
15.49
3.87
66
213
942
4.42
$2.741
5000
3.50
0.70
9.893
1.10
1.429
16.622
3.61
66
198
942
4.75
$2.865
5500
3.50
0.70
10.882
1.10
1.571
17.753
3.38
66
862
942
5.07
$2.985
6000
3.50
0.70
11.871
1.10
1.714
18.885
3.18
66
175
942
5.39
$3.105
6500
3.50
0.70
12.861
1.10
1.857
20.018
3.00
66
165
942
5.72
$3.229
7000
3.50
0.70
13.85
1.10
2.00
21.15
2.84
66
156
942
6.04
$3.349

DE 10/2014 18
Appendix B Calculations for Moving Materials with a Caterpillar 657G Push-Pull Scraper Fleet NOTE: DRILLING AND BLASTING COSTS ARE NOT INCLUDED IN THESE CALCULATIONS. THE LQD DOES NOT CONSIDER DRILLING AND BLASTING COSTS NECESSARY
WHEN USING APPENDIX B. Material Movement by Scrapers
1) Caterpillar 657G Push-Pull Scraper 2) Material Density 2,850. LB/BCY CPH 40 3) Payload 104,000. LB CPH 40 35.0 BCY 4) Maximum Vehicle Speed Loaded 33.0 MPH CPH 40 5) Operating Efficiency Factor (50 Min./Hr.) 0.83 CPH 40 6) 657G PP Operating Costs $419.32 per Hour 100% E-W 7) Labor Costs $44.97 per Hour WYDOT-WDD 8) Supervision Labor Costs $6.25 per Hour 1/8 of WYDOT-WDD 9) Supervisor Transportation $3.35 per Hour 1/8 of 100% E-W 10) 1/8 of 1 - 14,000 Gal. Water Trucks + 1 Operator $31.96 per Hour 1/8 of 100%E-W 11) 1/8 of 1 – 16M Blade for Road Work + 1 Operator $24.59 per Hour 1/8 of 100% E-W 12) 2 - D9T for Ripping Orb. and Misc. Work + 1 Operator $125.42 per Hour 2 of 100% E-W 13) Total Hourly Costs $655.86 TO USE TABLE: Locate your approximate grade by reference to case number. Determine cost per BCY by using distance column that approximates your distance. No calculations are necessary. Case #1: Level Ground Loaded (0% grade + 4% rolling = 4% total) Empty (0% grade + 4% rolling = 4% total)
One-Way Distance
(Ft.)
Load Time (Min.)
Travel Time
Loaded (Min.)
Maneuver & Spread
Time (Min.)
Travel Time
Empty (Min.)
Total Cycle Time
(Min.)
Trips Per
Hour
Payload (BCY)
Efficiency Factor
(50 min/Hr.)
Adjusted Productivity (BCY/Hr.)
Operating Costs
($/BCY)
500
1.10
0.42
0.60
0.36
2.48
24.2
35.0
0.83
706
$0.929
1000
1.10
0.68
0.60
0.57
2.95
20.3
35.0
0.83
593
$1.106
1500
1.10
0.92
0.60
0.75
3.37
17.8
35.0
0.83
519
$1.264
2000
1.10
1.15
0.60
0.92
3.77
15.9
35.0
0.83
464
$1.413
2500
1.10
1.37
0.60
1.09
4.16
14.4
35.0
0.83
421
$1.558
3000
1.10
1.59
0.60
1.26
4.55
13.2
35.0
0.83
385
$1.703
3500
1.10
1.81
0.60
1.44
4.95
12.1
35.0
0.83
354
$1.853
4000
1.10
2.02
0.60
1.61
5.33
11.3
35.0
0.83
328
$1.999
4500
1.10
2.22
0.60
1.78
5.70
10.5
35.0
0.83
307
$2.136
5000
1.10
2.43
0.60
1.95
6.08
9.9
35.0
0.83
288
$2.277
5500
1.10
2.64
0.60
2.13
6.47
9.3
35.0
0.83
270
$2.429
6000
1.10
2.85
0.60
2.30
6.85
8.8
35.0
0.83
255
$2.572
6500
1.10
3.05
0.60
2.47
7.22
8.3
35.0
0.83
242
$2.710
7000
1.10
3.26
0.60
2.64
7.60
7.9
35.0
0.83
230
$2.852
DE 10/2014 19
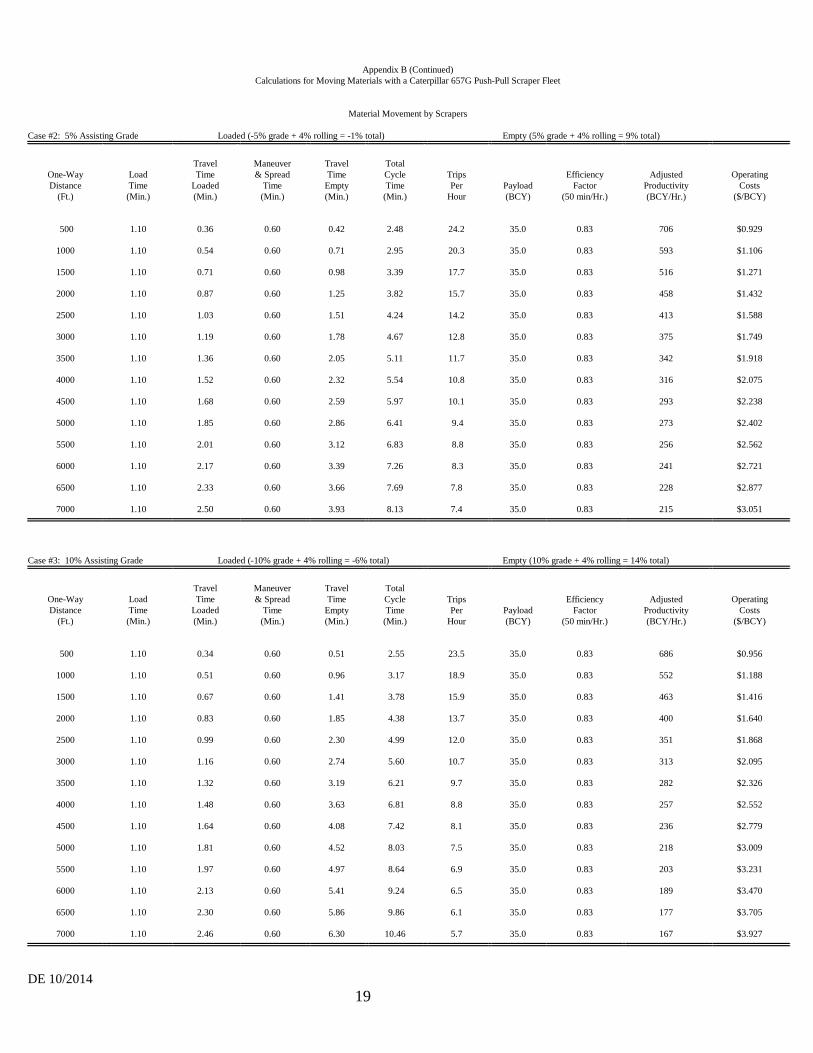
Appendix B (Continued) Calculations for Moving Materials with a Caterpillar 657G Push-Pull Scraper Fleet Material Movement by Scrapers Case #2: 5% Assisting Grade Loaded (-5% grade + 4% rolling = -1% total) Empty (5% grade + 4% rolling = 9% total)
One-Way Distance
(Ft.)
Load Time (Min.)
Travel Time
Loaded (Min.)
Maneuver & Spread
Time (Min.)
Travel Time
Empty (Min.)
Total Cycle Time
(Min.)
Trips Per
Hour
Payload (BCY)
Efficiency Factor
(50 min/Hr.)
Adjusted Productivity (BCY/Hr.)
Operating Costs
($/BCY)
500
1.10
0.36
0.60
0.42
2.48
24.2
35.0
0.83
706
$0.929
1000
1.10
0.54
0.60
0.71
2.95
20.3
35.0
0.83
593
$1.106
1500
1.10
0.71
0.60
0.98
3.39
17.7
35.0
0.83
516
$1.271
2000
1.10
0.87
0.60
1.25
3.82
15.7
35.0
0.83
458
$1.432
2500
1.10
1.03
0.60
1.51
4.24
14.2
35.0
0.83
413
$1.588
3000
1.10
1.19
0.60
1.78
4.67
12.8
35.0
0.83
375
$1.749
3500
1.10
1.36
0.60
2.05
5.11
11.7
35.0
0.83
342
$1.918
4000
1.10
1.52
0.60
2.32
5.54
10.8
35.0
0.83
316
$2.075
4500
1.10
1.68
0.60
2.59
5.97
10.1
35.0
0.83
293
$2.238
5000
1.10
1.85
0.60
2.86
6.41
9.4
35.0
0.83
273
$2.402
5500
1.10
2.01
0.60
3.12
6.83
8.8
35.0
0.83
256
$2.562
6000
1.10
2.17
0.60
3.39
7.26
8.3
35.0
0.83
241
$2.721
6500
1.10
2.33
0.60
3.66
7.69
7.8
35.0
0.83
228
$2.877
7000
1.10
2.50
0.60
3.93
8.13
7.4
35.0
0.83
215
$3.051
Case #3: 10% Assisting Grade Loaded (-10% grade + 4% rolling = -6% total) Empty (10% grade + 4% rolling = 14% total)
One-Way Distance
(Ft.)
Load Time (Min.)
Travel Time
Loaded (Min.)
Maneuver & Spread
Time (Min.)
Travel Time
Empty (Min.)
Total Cycle Time
(Min.)
Trips Per
Hour
Payload (BCY)
Efficiency Factor
(50 min/Hr.)
Adjusted Productivity (BCY/Hr.)
Operating Costs
($/BCY)
500
1.10
0.34
0.60
0.51
2.55
23.5
35.0
0.83
686 $0.956
1000
1.10
0.51
0.60
0.96
3.17
18.9
35.0
0.83
552 $1.188
1500
1.10
0.67
0.60
1.41
3.78
15.9
35.0
0.83
463 $1.416
2000
1.10
0.83
0.60
1.85
4.38
13.7
35.0
0.83
400 $1.640
2500
1.10
0.99
0.60
2.30
4.99
12.0
35.0
0.83
351 $1.868
3000
1.10
1.16
0.60
2.74
5.60
10.7
35.0
0.83
313 $2.095
3500
1.10
1.32
0.60
3.19
6.21
9.7
35.0
0.83
282 $2.326
4000
1.10
1.48
0.60
3.63
6.81
8.8
35.0
0.83
257 $2.552
4500
1.10
1.64
0.60
4.08
7.42
8.1
35.0
0.83
236 $2.779
5000
1.10
1.81
0.60
4.52
8.03
7.5
35.0
0.83
218 $3.009
5500
1.10
1.97
0.60
4.97
8.64
6.9
35.0
0.83
203 $3.231
6000
1.10
2.13
0.60
5.41
9.24
6.5
35.0
0.83
189 $3.470
6500
1.10
2.30
0.60
5.86
9.86
6.1
35.0
0.83
177 $3.705
7000
1.10
2.46
0.60
6.30
10.46
5.7
35.0
0.83
167 $3.927
DE 10/2014 20
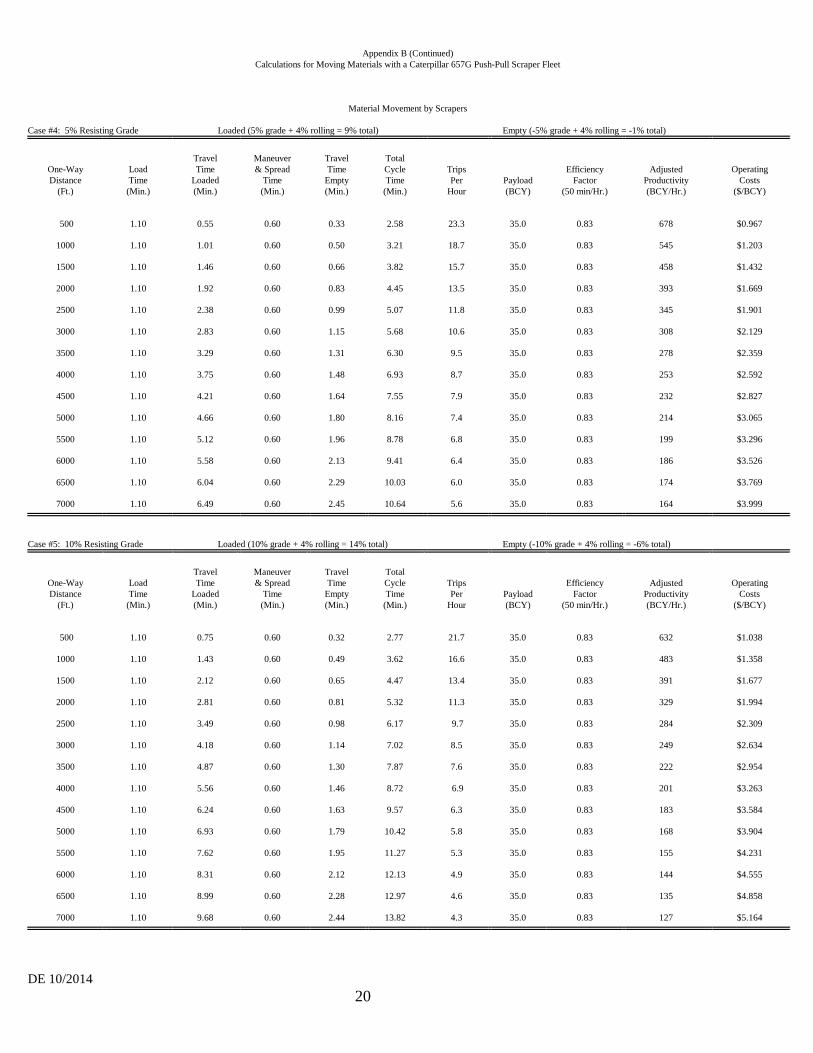
Appendix B (Continued) Calculations for Moving Materials with a Caterpillar 657G Push-Pull Scraper Fleet Material Movement by Scrapers Case #4: 5% Resisting Grade Loaded (5% grade + 4% rolling = 9% total) Empty (-5% grade + 4% rolling = -1% total)
One-Way Distance
(Ft.)
Load Time (Min.)
Travel Time
Loaded (Min.)
Maneuver & Spread
Time (Min.)
Travel Time
Empty (Min.)
Total Cycle Time
(Min.)
Trips Per
Hour
Payload (BCY)
Efficiency Factor
(50 min/Hr.)
Adjusted Productivity (BCY/Hr.)
Operating Costs
($/BCY)
500
1.10
0.55
0.60
0.33
2.58
23.3
35.0
0.83
678 $0.967
1000
1.10
1.01
0.60
0.50
3.21
18.7
35.0
0.83
545 $1.203
1500
1.10
1.46
0.60
0.66
3.82
15.7
35.0
0.83
458 $1.432
2000
1.10
1.92
0.60
0.83
4.45
13.5
35.0
0.83
393 $1.669
2500
1.10
2.38
0.60
0.99
5.07
11.8
35.0
0.83
345 $1.901
3000
1.10
2.83
0.60
1.15
5.68
10.6
35.0
0.83
308 $2.129
3500
1.10
3.29
0.60
1.31
6.30
9.5
35.0
0.83
278 $2.359
4000
1.10
3.75
0.60
1.48
6.93
8.7
35.0
0.83
253 $2.592
4500
1.10
4.21
0.60
1.64
7.55
7.9
35.0
0.83
232 $2.827
5000
1.10
4.66
0.60
1.80
8.16
7.4
35.0
0.83
214 $3.065
5500
1.10
5.12
0.60
1.96
8.78
6.8
35.0
0.83
199 $3.296
6000
1.10
5.58
0.60
2.13
9.41
6.4
35.0
0.83
186 $3.526
6500
1.10
6.04
0.60
2.29
10.03
6.0
35.0
0.83
174 $3.769
7000
1.10
6.49
0.60
2.45
10.64
5.6
35.0
0.83
164 $3.999
Case #5: 10% Resisting Grade Loaded (10% grade + 4% rolling = 14% total) Empty (-10% grade + 4% rolling = -6% total)
One-Way Distance
(Ft.)
Load Time (Min.)
Travel Time
Loaded (Min.)
Maneuver & Spread
Time (Min.)
Travel Time
Empty (Min.)
Total Cycle Time
(Min.)
Trips Per
Hour
Payload (BCY)
Efficiency Factor
(50 min/Hr.)
Adjusted Productivity (BCY/Hr.)
Operating Costs
($/BCY)
500
1.10
0.75
0.60
0.32
2.77
21.7
35.0
0.83
632 $1.038
1000
1.10
1.43
0.60
0.49
3.62
16.6
35.0
0.83
483 $1.358
1500
1.10
2.12
0.60
0.65
4.47
13.4
35.0
0.83
391 $1.677
2000
1.10
2.81
0.60
0.81
5.32
11.3
35.0
0.83
329 $1.994
2500
1.10
3.49
0.60
0.98
6.17
9.7
35.0
0.83
284 $2.309
3000
1.10
4.18
0.60
1.14
7.02
8.5
35.0
0.83
249 $2.634
3500
1.10
4.87
0.60
1.30
7.87
7.6
35.0
0.83
222 $2.954
4000
1.10
5.56
0.60
1.46
8.72
6.9
35.0
0.83
201 $3.263
4500
1.10
6.24
0.60
1.63
9.57
6.3
35.0
0.83
183 $3.584
5000
1.10
6.93
0.60
1.79
10.42
5.8
35.0
0.83
168 $3.904
5500
1.10
7.62
0.60
1.95
11.27
5.3
35.0
0.83
155 $4.231
6000
1.10
8.31
0.60
2.12
12.13
4.9
35.0
0.83
144 $4.555
6500
1.10
8.99
0.60
2.28
12.97
4.6
35.0
0.83
135 $4.858
7000
1.10
9.68
0.60
2.44
13.82
4.3
35.0
0.83
127 $5.164

DE 10/2014 21
Appendix C Calculations for Moving Materials with a Caterpillar 637G Push-Pull Scraper Fleet NOTE: DRILLING AND BLASTING COSTS ARE NOT INCLUDED IN THESE CALCULATIONS. THE LQD DOES NOT CONSIDER DRILLING AND BLASTING COSTS NECESSARY
WHEN USING APPENDIX C. Material Movement by Scrapers
1) Caterpillar 637E Push-Pull Scraper 2) Material Density 2,850. LB/BCY CPH 40 3) Payload 75,000. LB CPH 40 25.0 BCY 4) Maximum Vehicle Speed Loaded 33.0 MPH CPH 40 5) Operating Efficiency Factor (50 Min./Hr.) 0.83 CPH 40 6) 637G PP Operating Costs $337.52 per Hour 100% E-W 7) Labor Costs $44.97 per Hour WYDOT-WDD 8) Supervision Labor Costs $6.25 per Hour 1/8 of WYDOT-WDD 9) Supervisor Transportation $3.35 per Hour 1/8 of 100% E-W 10) 1/8 of 1 - 14,000 Gal. Water Trucks + 1 Operator $31.96 per Hour 1/8 of 100% E-W 11) 1/8 of 1 – 16M Blade for Road Work + 1 Operator $24.59 per Hour 1/8 of 100% E-W 12) 2 - D9T for Ripping Ovb. and Misc. Work + 1 Operator $125.42 per Hour 2 of 100% E-W 13) Total Hourly Costs $574.06 TO USE TABLE: Locate your approximate grade by reference to case number. Determine cost per BCY by using distance column that approximates your distance. No calculations are necessary. Case #1: Level Ground Loaded (0% grade + 4% rolling = 4% total) Empty (0% grade + 4% rolling = 4% total)
One-Way Distance
(Ft.)
Load Time (Min.)
Travel Time
Loaded (Min.)
Maneuver & Spread
Time (Min.)
Travel Time
Empty (Min.)
Total Cycle Time
(Min.)
Trips Per
Hour
Payload (BCY)
Efficiency Factor
(50 min/Hr.)
Adjusted Productivity (BCY/Hr.)
Operating Costs
($/BCY)
500
1.0
0.42
0.60
0.36
2.38
25.2
25.0
0.83
523 $1.098
1000
1.0
0.68
0.60
0.57
2.85
21.1
25.0
0.83
438 $1.311
1500
1.0
0.92
0.60
0.75
3.27
18.4
25.0
0.83
382 $1.503
2000
1.0
1.15
0.60
0.92
3.67
16.3
25.0
0.83
338 $1.698
2500
1.0
1.37
0.60
1.09
4.06
14.8
25.0
0.83
307 $1.870
3000
1.0
1.59
0.60
1.26
4.45
13.5
25.0
0.83
280 $2.050
3500
1.0
1.81
0.60
1.44
4.85
12.4
25.0
0.83
257 $2.234
4000
1.0
2.02
0.60
1.61
5.23
11.5
25.0
0.83
239 $2.402
4500
1.0
2.22
0.60
1.78
5.60
10.7
25.0
0.83
222 $2.586
5000
1.0
2.43
0.60
1.95
5.98
10.0
25.0
0.83
208 $2.760
5500
1.0
2.64
0.60
2.13
6.37
9.4
25.0
0.83
195 $2.944
6000
1.0
2.85
0.60
2.30
6.75
8.9
25.0
0.83
185 $3.103
6500
1.0
3.05
0.60
2.47
7.12
8.4
25.0
0.83
174 $3.299
7000
1.0
3.26
0.60
2.64
7.50
8.0
25.0
0.83
166 $3.458

DE 10/2014 22
Appendix C (Continued) Calculations for Moving Materials with a Caterpillar 637G Push-Pull Scraper Fleet Material Movement by Scrapers Case #2: 5% Assisting Grade Loaded (-5% grade + 4% rolling = -1% total) Empty (5% grade + 4% rolling = 9% total)
One-Way Distance
(Ft.)
Load Time (Min.)
Travel Time
Loaded (Min.)
Maneuver & Spread
Time (Min.)
Travel Time
Empty (Min.)
Total Cycle Time
(Min.)
Trips Per
Hour
Payload (BCY)
Efficiency Factor
(50 min/Hr.)
Adjusted Productivity (BCY/Hr.)
Operating Costs
($/BCY)
500
1.0
0.36
0.60
0.42
2.38
25.2
25.0
0.83
523 $1.098
1000
1.0
0.54
0.60
0.71
2.85
21.0
25.0
0.83
436 $1.317
1500
1.0
0.71
0.60
0.98
3.29
18.2
25.0
0.83
378 $1.519
2000
1.0
0.87
0.60
1.25
3.72
16.1
25.0
0.83
334 $1.719
2500
1.0
1.03
0.60
1.51
4.14
14.5
25.0
0.83
301 $1.907
3000
1.0
1.19
0.60
1.78
4.57
13.1
25.0
0.83
272 $2.111
3500
1.0
1.36
0.60
2.05
5.01
12.0
25.0
0.83
249 $2.306
4000
1.0
1.52
0.60
2.32
5.44
11.0
25.0
0.83
228 $2.518
4500
1.0
1.68
0.60
2.59
5.87
10.2
25.0
0.83
212 $2.708
5000
1.0
1.85
0.60
2.86
6.31
9.5
25.0
0.83
197 $2.914
5500
1.0
2.01
0.60
3.12
6.73
8.9
25.0
0.83
185 $3.103
6000
1.0
2.17
0.60
3.39
7.16
8.4
25.0
0.83
174 $3.300
6500
1.0
2.33
0.60
3.66
7.59
7.9
25.0
0.83
164 $3.500
7000
1.0
2.50
0.60
3.93
8.03
7.5
25.0
0.83
156 $3.680
Case #3: 10% Assisting Grade Loaded (-10% grade + 4% rolling = -6% total) Empty (10% grade + 4% rolling = 14% total)
One-Way Distance
(Ft.)
Load Time (Min.)
Travel Time
Loaded (Min.)
Maneuver & Spread
Time (Min.)
Travel Time
Empty (Min.)
Total Cycle Time
(Min.)
Trips Per
Hour
Payload (BCY)
Efficiency Factor
(50 min/Hr.)
Adjusted Productivity (BCY/Hr.)
Operating Costs
($/BCY)
500
1.0
0.34
0.60
0.51
2.45
24.5
25.0
0.83
508 $1.130
1000
1.0
0.51
0.60
0.96
3.07
19.5
25.0
0.83
405 $1.417
1500
1.0
0.67
0.60
1.41
3.68
16.3
25.0
0.83
338 $1.698
2000
1.0
0.83
0.60
1.85
4.28
14.0
25.0
0.83
291 $1.973
2500
1.0
0.99
0.60
2.30
4.89
12.3
25.0
0.83
255 $2.251
3000
1.0
1.16
0.60
2.74
5.50
10.9
25.0
0.83
226 $2.540
3500
1.0
1.32
0.60
3.19
6.11
9.8
25.0
0.83
203 $2.828
4000
1.0
1.48
0.60
3.63
6.71
8.9
25.0
0.83
185 $3.103
4500
1.0
1.64
0.60
4.08
7.32
8.2
25.0
0.83
170 $3.377
5000
1.0
1.81
0.60
4.52
7.93
7.6
25.0
0.83
158 $3.633
5500
1.0
1.97
0.60
4.97
8.54
7.0
25.0
0.83
145 $3.959
6000
1.0
2.13
0.60
5.41
9.14
6.5
25.0
0.83
135 $4.252
6500
1.0
2.30
0.60
5.86
9.76
6.2
25.0
0.83
129 $4.450
7000
1.0
2.46
0.60
6.30
10.36
5.8
25.0
0.83
120 $4.784

DE 10/2014 23
Appendix C (Continued) Calculations for Moving Materials with a Caterpillar 637G Push-Pull Scraper Fleet Material Movement by Scrapers Case #4: 5% Resisting Grade Loaded (5% grade + 4% rolling = 9% total) Empty (-5% grade + 4% rolling = -1% total)
One-Way Distance
(Ft.)
Load Time (Min.)
Travel Time
Loaded (Min.)
Maneuver & Spread
Time (Min.)
Travel Time
Empty (Min.)
Total Cycle Time
(Min.)
Trips Per
Hour
Payload (BCY)
Efficiency Factor
(50 min/Hr.)
Adjusted Productivity (BCY/Hr.)
Operating Costs
($/BCY)
500
1.0
0.55
0.60
0.33
2.48
24.2
25.0
0.83
502 $1.144
1000
1.0
1.01
0.60
0.50
3.11
19.3
25.0
0.83
400 $1.435
1500
1.0
1.46
0.60
0.66
3.72
16.1
25.0
0.83
334 $1.719
2000
1.0
1.92
0.60
0.83
4.35
13.8
25.0
0.83
286 $2.007
2500
1.0
2.38
0.60
0.99
4.97
12.1
25.0
0.83
251 $2.287
3000
1.0
2.83
0.60
1.15
5.58
10.8
25.0
0.83
224 $2.563
3500
1.0
3.29
0.60
1.31
6.20
9.7
25.0
0.83
201 $2.856
4000
1.0
3.75
0.60
1.48
6.83
8.8
25.0
0.83
183 $3.137
4500
1.0
4.21
0.60
1.64
7.45
8.1
25.0
0.83
168 $3.417
5000
1.0
4.66
0.60
1.80
8.06
7.4
25.0
0.83
154 $3.728
5500
1.0
5.12
0.60
1.96
8.68
6.9
25.0
0.83
143 $4.014
6000
1.0
5.58
0.60
2.13
9.31
6.4
25.0
0.83
133 $4.316
6500
1.0
6.04
0.60
2.29
9.93
6.0
25.0
0.83
125 $4.593
7000
1.0
6.49
0.60
2.45
10.54
5.7
25.0
0.83
118 $4.865
Case #5: 10% Resisting Grade Loaded (10% grade + 4% rolling = 14% total) Empty (-10% grade + 4% rolling = -6% total)
One-Way Distance
(Ft.)
Load Time (Min.)
Travel Time
Loaded (Min.)
Maneuver & Spread
Time (Min.)
Travel Time
Empty (Min.)
Total Cycle Time
(Min.)
Trips Per
Hour
Payload (BCY)
Efficiency Factor
(50 min/Hr.)
Adjusted Productivity (BCY/Hr.)
Operating Costs
($/BCY)
500
1.0
0.75
0.60
0.32
2.67
22.5
25.0
0.83
467 $1.229
1000
1.0
1.43
0.60
0.49
3.52
17.0
25.0
0.83
353 $1.626
1500
1.0
2.12
0.60
0.65
4.37
13.7
25.0
0.83
284 $2.021
2000
1.0
2.81
0.60
0.81
5.22
11.5
25.0
0.83
238 $2.412
2500
1.0
3.49
0.60
0.98
6.07
9.9
25.0
0.83
205 $2.800
3000
1.0
4.18
0.60
1.14
6.92
8.7
25.0
0.83
181 $3.172
3500
1.0
4.87
0.60
1.30
7.77
7.7
25.0
0.83
160 $3.588
4000
1.0
5.56
0.60
1.46
8.62
7.0
25.0
0.83
145 $3.959
4500
1.0
6.24
0.60
1.63
9.47
6.3
25.0
0.83
131 $4.382
5000
1.0
6.93
0.60
1.79
10.32
5.8
25.0
0.83
120 $4.784
5500
1.0
7.62
0.60
1.95
11.17
5.4
25.0
0.83
112 $5.125
6000
1.0
8.31
0.60
2.12
12.03
4.9
25.0
0.83
102 $5.628
6500
1.0
8.99
0.60
2.28
12.87
4.7
25.0
0.83
98 $5.858
7000
1.0
9.68
0.60
2.44
13.72
4.4
25.0
0.83
91 $6.308

DE 10/2014 24
Appendix D Calculations for Moving Materials with a 58 CY Electric Cable Shovel and Caterpillar 240T (793F) Trucks NOTE: THESE COSTS ARE FOR EXCAVATION ONLY. MATERIAL REQUIRING BLASTING SHOULD HAVE AN ADDITIONAL $0.259/BCY ADDED FOR DRILLING AND BLASTING COSTS. Material Movement by Shovel-Truck Combination
1) 58 CY Shovel 58.0 LCY Heaped 2) Caterpillar 793F - 240-Ton End Dumps 193.0 LCY/156.8 BCY 3) Material Density 2,850.0 LB/BCY CPH 40 4) Operating Efficiency Factor 0.83 CPH 40 5) Rolling Resistance Factor 4.00 % CPH 40 6) 58 CY Shovel Operating Costs (No Ownership Cost) $516.28 IM 7) 793F Lease + Operating Costs $509.30 IM 8) Labor Costs $44.97 per Hour WYDOT-WDD 9) 2 of 1 - 14,000 Gal. Water Truck + 1 Operator $127.83 per Hour 2 of 100% E-W + Operator 10) 1 - 24H Blade + 1 Operator $261.49 per Hour IM 11) 1 - D9T + 1 Operator $250.84 per Hour 100% E-W + Operator 12) 1 854G Rubber Tired Dozer + 1 Operator $391.83 per Hour 100% E-W + Operator 13) Supervision Labor Costs $24.99 per Hour 2 of WYDOT-WDD 14) Supervisor Transportation $13.40 per Hour 2 of 100% E-W 15) Total Fleet Hourly Costs (Except Trucks) $1,631.63 per Hour TO USE TABLE: Locate your approximate grade by reference to case number. Determine cost per BCY by using distance column that approximates your distance. No calculations are necessary. Case #1: Level Ground Loaded (0% grade + 4% rolling = 4% total resistance) Empty (0% grade + 4% = 4% total)
One-Way Distance
(Ft.)
Load Time (Min.)
Maneuver Time
(Min.)
Travel Time
Loaded (Min.)
Dump Time (Min.)
Travel Time
Empty (Min.)
Total Cycle Time
(Min.)
Trips Per
Hour
Payload (BCY)
Adjusted
Truck Productivity (BCY/Hr.)
Adjusted Shovel
Productivity (BCY/Hr.)
Number of Trucks Required
Operating Costs
($/BCY)
500
1.70
0.60
0.25
1.20
0.2
3.95
15.2
156.8
1985
4184
2.11 $0.670
1000
1.70
0.60
0.5
1.20
0.35
4.35
13.8
156.8
1802
4184
2.32 $0.697
1500
1.70
0.60
0.75
1.20
0.6
4.85
12.4
156.8
1620
4184
2.58 $0.732
2000
1.70
0.60
1.0
1.20
0.7
5.20
11.5
156.8
1502
4184
2.79 $0.760
2500
1.70
0.60
1.25
1.20
0.86
5.61
10.69
156.8
1396
4184
3.00 $0.787
3000
1.70
0.60
1.5
1.20
1.03
6.03
9.95
156.8
1300
4184
3.22 $0.817
3500
1.70
0.60
1.75
1.20
1.21
6.46
9.29
156.8
1213
4184
3.45 $0.847
4000
1.70
0.60
2.0
1.20
1.38
6.88
8.72
156.8
1139
4184
3.67 $0.876
4500
1.70
0.60
2.25
1.20
1.55
7.3
8.22
156.8
1074
4184
3.90 $0.907
5000
1.70
0.60
2.5
1.20
1.72
7.72
7.77
156.8
1015
4184
4.12 $0.936
5500
1.70
0.60
2.75
1.20
1.89
8.14
7.37
156.8
962
4184
4.35 $0.966
6000
1.70
0.60
3.0
1.20
2.07
8.57
7.0
156.8
914
4184
4.58 $0.997
6500
1.70
0.60
3.25
1.20
2.24
8.99
6.67
156.8
871
4184
4.80 $1.026
7000
1.70
0.60
3.5
1.20
2.41
9.41
6.3
156.8
833
4184
5.02 $1.055
Operating Costs = (((# Trucks x (Truck costs + Labor costs)) + Total Fleet costs)/Shovel Productivity)
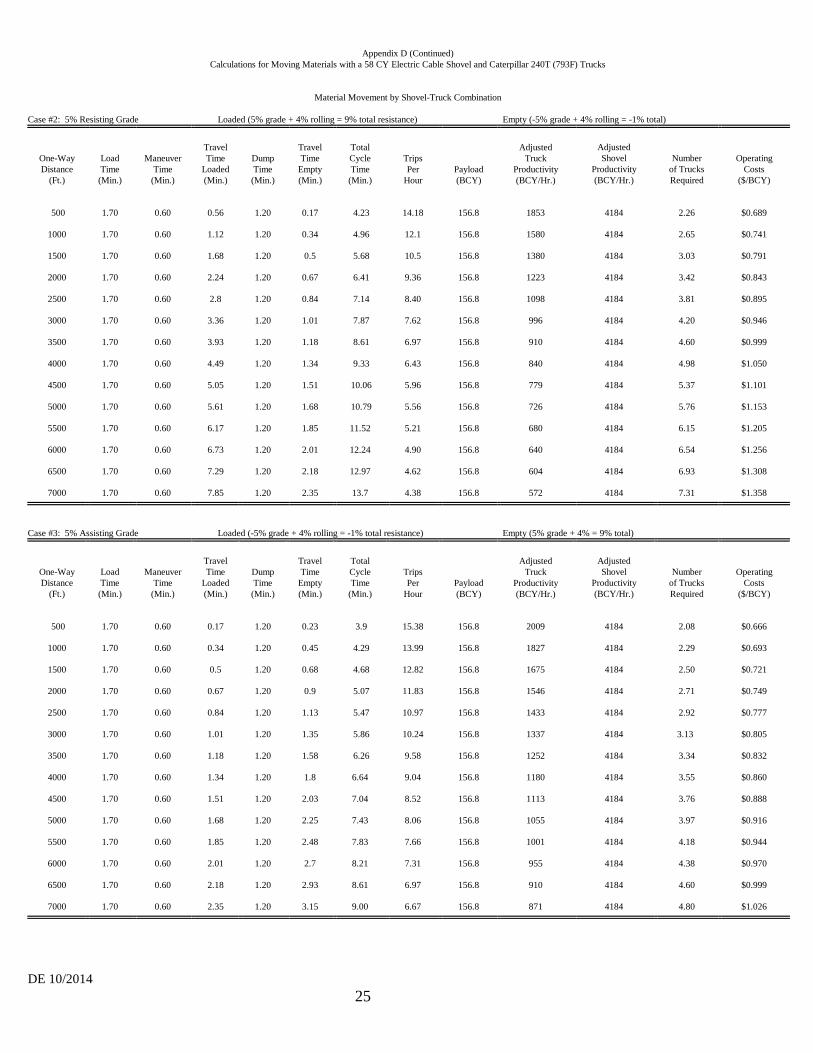
DE 10/2014 25
Appendix D (Continued) Calculations for Moving Materials with a 58 CY Electric Cable Shovel and Caterpillar 240T (793F) Trucks Material Movement by Shovel-Truck Combination Case #2: 5% Resisting Grade Loaded (5% grade + 4% rolling = 9% total resistance) Empty (-5% grade + 4% rolling = -1% total)
One-Way Distance
(Ft.)
Load Time (Min.)
Maneuver Time
(Min.)
Travel Time
Loaded (Min.)
Dump Time (Min.)
Travel Time
Empty (Min.)
Total Cycle Time
(Min.)
Trips Per
Hour
Payload (BCY)
Adjusted
Truck Productivity (BCY/Hr.)
Adjusted Shovel
Productivity (BCY/Hr.)
Number of Trucks Required
Operating Costs
($/BCY)
500
1.70
0.60
0.56
1.20
0.17
4.23
14.18
156.8
1853
4184
2.26 $0.689
1000
1.70
0.60
1.12
1.20
0.34
4.96
12.1
156.8
1580
4184
2.65 $0.741
1500
1.70
0.60
1.68
1.20
0.5
5.68
10.5
156.8
1380
4184
3.03 $0.791
2000
1.70
0.60
2.24
1.20
0.67
6.41
9.36
156.8
1223
4184
3.42 $0.843
2500
1.70
0.60
2.8
1.20
0.84
7.14
8.40
156.8
1098
4184
3.81 $0.895
3000
1.70
0.60
3.36
1.20
1.01
7.87
7.62
156.8
996
4184
4.20 $0.946
3500
1.70
0.60
3.93
1.20
1.18
8.61
6.97
156.8
910
4184
4.60 $0.999
4000
1.70
0.60
4.49
1.20
1.34
9.33
6.43
156.8
840
4184
4.98 $1.050
4500
1.70
0.60
5.05
1.20
1.51
10.06
5.96
156.8
779
4184
5.37 $1.101
5000
1.70
0.60
5.61
1.20
1.68
10.79
5.56
156.8
726
4184
5.76 $1.153
5500
1.70
0.60
6.17
1.20
1.85
11.52
5.21
156.8
680
4184
6.15 $1.205
6000
1.70
0.60
6.73
1.20
2.01
12.24
4.90
156.8
640
4184
6.54 $1.256
6500
1.70
0.60
7.29
1.20
2.18
12.97
4.62
156.8
604
4184
6.93 $1.308
7000
1.70
0.60
7.85
1.20
2.35
13.7
4.38
156.8
572
4184
7.31 $1.358
Case #3: 5% Assisting Grade Loaded (-5% grade + 4% rolling = -1% total resistance) Empty (5% grade + 4% = 9% total)
One-Way Distance
(Ft.)
Load Time (Min.)
Maneuver Time
(Min.)
Travel Time
Loaded (Min.)
Dump Time (Min.)
Travel Time
Empty (Min.)
Total Cycle Time
(Min.)
Trips Per
Hour
Payload (BCY)
Adjusted
Truck Productivity (BCY/Hr.)
Adjusted Shovel
Productivity (BCY/Hr.)
Number of Trucks Required
Operating Costs
($/BCY)
500
1.70
0.60
0.17
1.20
0.23
3.9
15.38
156.8
2009
4184
2.08 $0.666
1000
1.70
0.60
0.34
1.20
0.45
4.29
13.99
156.8
1827
4184
2.29 $0.693
1500
1.70
0.60
0.5
1.20
0.68
4.68
12.82
156.8
1675
4184
2.50 $0.721
2000
1.70
0.60
0.67
1.20
0.9
5.07
11.83
156.8
1546
4184
2.71 $0.749
2500
1.70
0.60
0.84
1.20
1.13
5.47
10.97
156.8
1433
4184
2.92 $0.777
3000
1.70
0.60
1.01
1.20
1.35
5.86
10.24
156.8
1337
4184
3.13 $0.805
3500
1.70
0.60
1.18
1.20
1.58
6.26
9.58
156.8
1252
4184
3.34 $0.832
4000
1.70
0.60
1.34
1.20
1.8
6.64
9.04
156.8
1180
4184
3.55 $0.860
4500
1.70
0.60
1.51
1.20
2.03
7.04
8.52
156.8
1113
4184
3.76 $0.888
5000
1.70
0.60
1.68
1.20
2.25
7.43
8.06
156.8
1055
4184
3.97 $0.916
5500
1.70
0.60
1.85
1.20
2.48
7.83
7.66
156.8
1001
4184
4.18 $0.944
6000
1.70
0.60
2.01
1.20
2.7
8.21
7.31
156.8
955
4184
4.38 $0.970
6500
1.70
0.60
2.18
1.20
2.93
8.61
6.97
156.8
910
4184
4.60 $0.999
7000
1.70
0.60
2.35
1.20
3.15
9.00
6.67
156.8
871
4184
4.80 $1.026

DE 10/2014 26
Appendix D1 Calculations for Moving Materials with an 80 CY Electric Cable Shovel and Caterpillar 380T (797F) Trucks NOTE: THESE COSTS ARE FOR EXCAVATION ONLY. MATERIAL REQUIRING BLASTING SHOULD HAVE AN ADDITIONAL $0.259/BCY ADDED FOR DRILLING AND BLASTING COSTS. Material Movement by Shovel-Truck Combination
1) 80 CY Shovel 80.0 LCY Heaped 2) Caterpillar 797F - 360-Ton End Dumps 316.3 LCY/275.8 BCY 3) Material Density 2,850.0 LB/BCY CPH 40 4) Operating Efficiency Factor 0.83 CPH 40 5) Rolling Resistance Factor 4.00 % CPH 40 6) 80 CY Shovel Operating Costs (No Ownership Cost) $517.86 IM 7) 797F Lease + Operating Costs $872.49 IM 8) Labor Costs $44.97 per Hour WYDOT-WDD 9) 2 of 1 - 14,000 Gal. Water Truck + 1 Operator $127.83 per Hour 2 of 100% E-W + Operator 10) 1 - 24H Blade + 1 Operator $261.49 per Hour IM 11) 1 - D9T + 1 Operator $250.84 per Hour 100% E-W + Operator 12) 1 854G Rubber Tired Dozer + 1 Operator $391.83 per Hour 100% E-W + Operator 13) Supervision Labor Costs $24.99 per Hour 2 of WYDOT-WDD 14) Supervisor Transportation $13.40 per Hour 2 of 100% E-W 15) Total Fleet Hourly Costs (Except Trucks) $1,633.21 per Hour TO USE TABLE: Locate your approximate grade by reference to case number. Determine cost per BCY by using distance column that approximates your distance. No calculations are necessary. Case #1: Level Ground Loaded (0% grade + 4% rolling = 4% total resistance) Empty (0% grade + 4% = 4% total)
One-Way Distance
(Ft.)
Load Time (Min.)
Maneuver Time
(Min.)
Travel Time
Loaded (Min.)
Dump Time (Min.)
Travel Time
Empty (Min.)
Total Cycle Time
(Min.)
Trips Per
Hour
Payload (BCY)
Adjusted
Truck Productivity (BCY/Hr.)
Adjusted Shovel
Productivity (BCY/Hr.)
Number of Trucks Required
Operating Costs
($/BCY)
500
2.00
0.60
0.26
1.20
0.14
4.2
14.29
275.8
3282
5865
1.79 $0.559
1000
2.00
0.60
0.52
1.20
0.27
4.59
13.07
275.8
3003
5865
1.95 $0.584
1500
2.00
0.60
0.79
1.20
0.41
5.0
12.0
275.8
2757
5865
2.13 $0.612
2000
2.00
0.60
1.05
1.20
0.55
5.4
11.11
275.8
2553
5865
2.30 $0.638
2500
2.00
0.60
1.31
1.20
0.69
5.8
10.34
275.8
2377
5865
2.47 $0.665
3000
2.00
0.60
1.57
1.20
0.82
6.19
9.69
275.8
2227
5865
2.63 $0.690
3500
2.00
0.60
1.84
1.20
0.96
6.6
9.09
275.8
2089
5865
2.81 $0.718
4000
2.00
0.60
2.1
1.20
1.1
7.0
8.57
275.8
1969
5865
2.98 $0.745
4500
2.00
0.60
2.36
1.20
1.23
7.39
8.12
275.8
1865
5865
3.14 $0.770
5000
2.00
0.60
2.62
1.20
1.37
7.79
7.70
275.8
1770
5865
3.31 $0.796
5500
2.00
0.60
2.88
1.20
1.51
8.19
7.33
275.8
1683
5865
3.48 $0.823
6000
2.00
0.60
3.15
1.20
1.65
8.6
6.98
275.8
1603
5865
3.66 $0.851
6500
2.00
0.60
3.41
1.20
1.78
8.99
6.67
275.8
1533
5865
3.83 $0.878
7000
2.00
0.60
3.67
1.20
1.92
9.39
6.39
275.8
1468
5865
4.00 $0.904
Operating Costs = (((# Trucks x (Truck costs + Labor costs)) + Total Fleet costs)/Shovel Productivity)

DE 10/2014 27
Appendix D1 (Continued) Calculations for Moving Materials with an 80 CY Electric Cable Shovel and Caterpillar 360T (797F) Trucks Material Movement by Shovel-Truck Combination Case #2: 5% Resisting Grade Loaded (5% grade + 4% rolling = 9% total resistance) Empty (-5% grade + 4% rolling = -1% total)
One-Way Distance
(Ft.)
Load Time (Min.)
Maneuver Time
(Min.)
Travel Time
Loaded (Min.)
Dump Time (Min.)
Travel Time
Empty (Min.)
Total Cycle Time
(Min.)
Trips Per
Hour
Payload (BCY)
Adjusted
Truck Productivity (BCY/Hr.)
Adjusted Shovel
Productivity (BCY/Hr.)
Number of Trucks Required
Operating Costs
($/BCY)
500
2.00
0.60
0.57
1.20
0.13
4.5
13.33
275.8
3063
5865
1.91 $0.577
1000
2.00
0.60
1.13
1.20
0.27
5.2
11.54
275.8
2651
5865
2.21 $0.624
1500
2.00
0.60
1.7
1.20
0.4
5.9
10.17
275.8
2336
5865
2.51 $0.671
2000
2.00
0.60
2.26
1.20
0.54
6.6
9.09
275.8
2089
5865
2.81 $0.718
2500
2.00
0.60
2.83
1.20
0.67
7.3
8.22
275.8
1888
5865
3.11 $0.765
3000
2.00
0.60
3.39
1.20
0.81
8.0
7.5
275.8
1723
5865
3.40 $0.810
3500
2.00
0.60
3.96
1.20
0.94
8.7
6.90
275.8
1584
5865
3.70 $0.857
4000
2.00
0.60
4.52
1.20
1.07
9.39
6.39
275.8
1468
5865
4.00 $0.904
4500
2.00
0.60
5.09
1.20
1.21
10.1
5.94
275.8
1365
5865
4.30 $0.951
5000
2.00
0.60
5.65
1.20
1.34
10.79
5.56
275.8
1278
5865
4.59 $0.997
5500
2.00
0.60
6.22
1.20
1.48
11.5
5.22
275.8
1199
5865
4.89 $1.043
6000
2.00
0.60
6.78
1.20
1.61
12.19
4.92
275.8
1131
5865
5.19 $1.090
6500
2.00
0.60
7.35
1.20
1.75
12.9
4.65
275.8
1069
5865
5.49 $1.137
7000
2.00
0.60
7.91
1.20
1.88
13.59
4.42
275.8
1014
5865
5.78 $1.183
Case #3: 5% Assisting Grade Loaded (-5% grade + 4% rolling = -1% total resistance) Empty (5% grade + 4% = 9% total)
One-Way Distance
(Ft.)
Load Time (Min.)
Maneuver Time
(Min.)
Travel Time
Loaded (Min.)
Dump Time (Min.)
Travel Time
Empty (Min.)
Total Cycle Time
(Min.)
Trips Per
Hour
Payload (BCY)
Adjusted
Truck Productivity (BCY/Hr.)
Adjusted Shovel
Productivity (BCY/Hr.)
Number of Trucks Required
Operating Costs
($/BCY)
500
2.00
0.60
0.14
1.20
0.24
4.18
14.35
275.8
3298
5865
1.78 $0.557
1000
2.00
0.60
0.27
1.20
0.47
4.54
13.22
275.8
3036
5865
1.93 $0.580
1500
2.00
0.60
0.41
1.20
0.71
4.92
12.20
275.8
2802
5865
2.09 $0.605
2000
2.00
0.60
0.54
1.20
0.94
5.28
11.36
275.8
2611
5865
2.25 $0.630
2500
2.00
0.60
0.68
1.20
1.18
5.66
10.6
275.8
2435
5865
2.41 $0.656
3000
2.00
0.60
0.81
1.20
1.41
6.02
9.97
275.8
2290
5865
2.56 $0.679
3500
2.00
0.60
0.95
1.20
1.65
6.4
9.38
2758
2154
5865
2.72 $0.704
4000
2.00
0.60
1.09
1.20
1.88
6.77
8.86
275.8
2036
5865
2.88 $0.729
4500
2.00
0.60
1.22
1.20
2.12
7.14
8.4
275.8
1930
5865
3.04 $0.754
5000
2.00
0.60
1.36
1.20
2.35
7.51
7.99
275.8
1835
5865
3.20 $0.779
5500
2.00
0.60
1.49
1.20
2.59
7.88
7.61
275.8
1749
5865
3.35 $0.803
6000
2.00
0.60
1.63
1.20
2.82
8.25
7.27
275.8
1671
5865
3.51 $0.828
6500
2.00
0.60
1.76
1.20
3.06
8.62
6.96
275.8
1599
5865
3.67 $0.853
7000
2.00
0.60
1.90
1.20
3.29
8.99
6.67
275.8
1533
5865
3.83 $0.878

DE 10/2014 28
Appendix E Calculations for Moving Material with a Caterpillar D9T Dozer These costs are for dozing only. Material requiring drilling and blasting should have an additional $0.259/BCY added for D&B. If cast blasting will be used the D&B cost should be $0.400/BCY. Material Movement by Dozing 1) Caterpillar D9T Dozer with U Blade 2) Operating Costs $205.87 Per Hour 100% ofE-W 3) Labor Costs $44.97 per Hour WYDOT-WDD 4) Supervisor Labor Costs $6.25 per Hour 1/8 of WYDOT-WDD 5) Supervisor Transportation $3.35 per Hour 1/8 of 100% E-W 6) Total Hourly Costs $260.44 per Hour TO USE TABLE: Locate your approximate grade by referencing "Grade" column. Determine cost per LCY by using the distance that best approximates your distance.
Job Correction Factors1
Distance (Ft.)
Productivity (LCY/Hr.)
Operator
Material
Visibility
Efficiency
Grade (0%)
Adjusted
Productivity (LCY/Hr.)
Costs ($/LCY)
50
2200
1.0
1.0
0.90
0.83
1.00
1649 $0.158
100
1300
1.0
1.0
0.90
0.83
1.00
975 $0.267
150
1000
1.0
1.0
0.90
0.83
1.00
750 $0.347
200
750
1.0
1.0
0.90
0.83
1.00
562 $0.463
250
570
1.0
1.0
0.90
0.83
1.00
427 $0.610
300
480
1.0
1.0
0.90
0.83
1.00
360 $0.723
350
390
1.0
1.0
0.90
0.83
1.00
292 $0.892
400
330
1.0
1.0
0.90
0.83
1.00
247 $1.054
450
290
1.0
1.0
0.90
0.83
1.00
217 $1.200
500
250
1.0
1.0
0.90
0.83
1.00
187 $1.393
Job Correction Factors1
Distance
(Ft.)
Productivity (LCY/Hr.)
Operator
Material
Visibility
Efficiency
Grade (-10%)
Adjusted
Productivity (LCY/Hr.)
Costs ($/LCY)
50
2200
1.0
1.0
0.90
0.83
1.20
1979 $0.132
100
1300
1.0
1.0
0.90
0.83
1.20
1170 $0.223
150
1000
1.0
1.0
0.90
0.83
1.20
900 $0.289
200
750
1.0
1.0
0.90
0.83
1.20
675 $0.386
250
570
1.0
1.0
0.90
0.83
1.20
513 $0.508
300
480
1.0
1.0
0.90
0.83
1.20
432 $0.603
350
390
1.0
1.0
0.90
0.83
1.20
351 $0.742
400
330
1.0
1.0
0.90
0.83
1.20
297 $0.877
450
290
1.0
1.0
0.90
0.83
1.20
261 $0.998
500
250
1.0
1.0
0.90
0.83
1.20
225 $1.158
1 Job Correction Factors: Operator Excellent = 1.00 Material Good = 1.00 Visibility Fair = 0.90 Efficiency 50 min/hr. = 0.83

DE 10/2014 29
Appendix E (Continued) Calculations for Moving Material with a Caterpillar D9T Dozer These costs are for dozing only. Material requiring drilling and blasting should have an additional $0.259BCY added for D&B. If cast blasting will be used the D&B cost should be $0.400/BCY. Material Movement by Dozing
Job Correction Factors1
Distance (Ft.)
Productivity (LCY/Hr.)
Operator
Material
Visibility
Efficiency
Grade (-20%)
Adjusted
Productivity (LCY/Hr.)
Costs ($/LCY)
50
2200
1.0
1.0
0.90
0.83
1.40
2309 $0.113
100
1300
1.0
1.0
0.90
0.83
1.40
1365 $0.191
150
1000
1.0
1.0
0.90
0.83
1.40
1050 $0.248
200
750
1.0
1.0
0.90
0.83
1.40
787 $0.331
250
570
1.0
1.0
0.90
0.83
1.40
599 $0.435
300
480
1.0
1.0
0.90
0.83
1.40
504 $0.517
350
390
1.0
1.0
0.90
0.83
1.40
409 $0.637
400
330
1.0
1.0
0.90
0.83
1.40
346 $0.753
450
290
1.0
1.0
0.90
0.83
1.40
304 $0.857
500
250
1.0
1.0
0.90
0.83
1.40
262 $0.994
Job Correction Factors1
Distance (Ft.)
Productivity (LCY/Hr.)
Operator
Material
Visibility
Efficiency
Grade (10%)
Adjusted
Productivity (LCY/Hr.)
Costs ($/LCY)
50
2200
1.0
1.0
0.90
0.83
0.75
1237 $0.211
100
1300
1.0
1.0
0.90
0.83
0.75
731 $0.356
150
1000
1.0
1.0
0.90
0.83
0.75
562 $0.463
200
750
1.0
1.0
0.90
0.83
0.75
422 $0.617
250
570
1.0
1.0
0.90
0.83
0.75
321 $0.811
300
480
1.0
1.0
0.90
0.83
0.75
270 $0.965
350
390
1.0
1.0
0.90
0.83
0.75
219 $1.189
400
330
1.0
1.0
0.90
0.83
0.75
186 $1.400
450
290
1.0
1.0
0.90
0.83
0.75
163 $1.598
500
250
1.0
1.0
0.90
0.83
0.75
141 $1.847
1 Job Correction Factors: Operator Excellent = 1.00 Material Good = 1.00 Visibility Fair = 0.90 Efficiency 50 min/hr. = 0.83

DE 10/2014 30
Appendix F Calculations for Moving Material with a Caterpillar D11R Dozer These costs are for dozing only. Material requiring drilling and blasting should have an additional $0.259BCY added for D&B. If cast blasting will be used the D&B cost should be $0.400/BCY. Material Movement by Dozing With D11R 1) Caterpillar D11R Dozer with U Blade 2) Operating Costs $457.68 per Hour 100% E-W 3) Labor Costs $44.97 per Hour WYDOT-WDD 4) Supervisor Labor Costs $6.25 per Hour 1/8 of WYDOR-WDD 5) Supervisor Transportation $3.35 per Hour 1/8 of 100% E-W 6) Total Hourly Costs $512.25 per Hour TO USE TABLE: Locate your approximate grade by referencing "Grade" column. Determine cost per LCY by using the distance that best approximates your distance.
Job Correction Factors1
Distance (Ft.)
Productivity (LCY/Hr.)
Operator
Material
Visibility
Efficiency
Grade (0%)
Adjusted
Productivity (LCY/Hr.)
Costs ($/LCY)
50
4500
1.0
1.0
0.90
0.83
1.00
3374 $0.152
100
3000
1.0
1.0
0.90
0.83
1.00
2249 $0.228
150
2000
1.0
1.0
0.90
0.83
1.00
1499 $0.342
200
1550
1.0
1.0
0.90
0.83
1.00
1162 $0.441
250
1250
1.0
1.0
0.90
0.83
1.00
937 $0.547
300
1080
1.0
1.0
0.90
0.83
1.00
810 $0.633
350
900
1.0
1.0
0.90
0.83
1.00
675 $0.759
400
800
1.0
1.0
0.90
0.83
1.00
600 $0.854
450
720
1.0
1.0
0.90
0.83
1.00
540 $0.949
500
650
1.0
1.0
0.90
0.83
1.00
487 $1.052
Job Correction Factors1
Distance
(Ft.)
Productivity (LCY/Hr.)
Operator
Material
Visibility
Efficiency
Grade (-10%)
Adjusted
Productivity (LCY/Hr.)
Costs ($/LCY)
50
4500
1.0
1.0
0.90
0.83
1.20
4048 $0.127
100
3000
1.0
1.0
0.90
0.83
1.20
2699 $0.190
150
2000
1.0
1.0
0.90
0.83
1.20
1799 $0.285
200
1550
1.0
1.0
0.90
0.83
1.20
1394 $0.368
250
1250
1.0
1.0
0.90
0.83
1.20
1125 $0.455
300
1080
1.0
1.0
0.90
0.83
1.20
972 $0.527
350
900
1.0
1.0
0.90
0.83
1.20
810 $0.632
400
800
1.0
1.0
0.90
0.83
1.20
720 $0.712
450
720
1.0
1.0
0.90
0.83
1.20
648 $0.791
500
650
1.0
1.0
0.90
0.83
1.20
585 $0.876
1 Job Correction Factors: Operator Excellent = 1.00 Material Good = 1.00 Visibility Fair = 0.90 Efficiency 50 min/hr. = 0.83

DE 10/2014 31
Appendix F (Continued) Calculations for Moving Material with a Caterpillar D11R Dozer These costs are for dozing only. Material requiring drilling and blasting should have an additional $0.259/BCY added for D&B. If cast blasting will be used the D&B cost should be $0.400/BCY. Material Movement by Dozing With D11R
Job Correction Factors1
Distance (Ft.)
Productivity (LCY/Hr.)
Operator
Material
Visibility
Efficiency
Grade (-20%)
Adjusted
Productivity (LCY/Hr.)
Costs ($/LCY)
50
4500
1.0
1.0
0.90
0.83
1.40
4723 $0.109
100
3000
1.0
1.0
0.90
0.83
1.40
3149 $0.163
150
2000
1.0
1.0
0.90
0.83
1.40
2099 $0.244
200
1550
1.0
1.0
0.90
0.83
1.40
1627 $0.315
250
1250
1.0
1.0
0.90
0.83
1.40
1312 $0.390
300
1080
1.0
1.0
0.90
0.83
1.40
1134 $0.452
350
900
1.0
1.0
0.90
0.83
1.40
945 $0.542
400
800
1.0
1.0
0.90
0.83
1.40
840 $0.610
450
720
1.0
1.0
0.90
0.83
1.40
756 $0.678
500
650
1.0
1.0
0.90
0.83
1.40
682 $0.751
Job Correction Factors1
Distance
(Ft.)
Productivity (LCY/Hr.)
Operator
Material
Visibility
Efficiency
Grade (10%)
Adjusted
Productivity (LCY/Hr.)
Costs ($/LCY)
50
4500
1.0
1.0
0.90
0.83
0.75
2530 $0.203
100
3000
1.0
1.0
0.90
0.83
0.75
1687 $0.304
150
2000
1.0
1.0
0.90
0.83
0.75
1125 $0.455
200
1550
1.0
1.0
0.90
0.83
0.75
872 $0.587
250
1250
1.0
1.0
0.90
0.83
0.75
703 $0.729
300
1080
1.0
1.0
0.90
0.83
0.75
607 $0.844
350
900
1.0
1.0
0.90
0.83
0.75
506 $1.012
400
800
1.0
1.0
0.90
0.83
0.75
450 $1.138
450
720
1.0
1.0
0.90
0.83
0.75
405 $1.265
500
650
1.0
1.0
0.90
0.83
0.75
365 $1.403
1 Job Correction Factors: Operator Excellent = 1.00 Material Good = 1.00 Visibility Fair = 0.90 Efficiency 50 min/hr. = 0.83
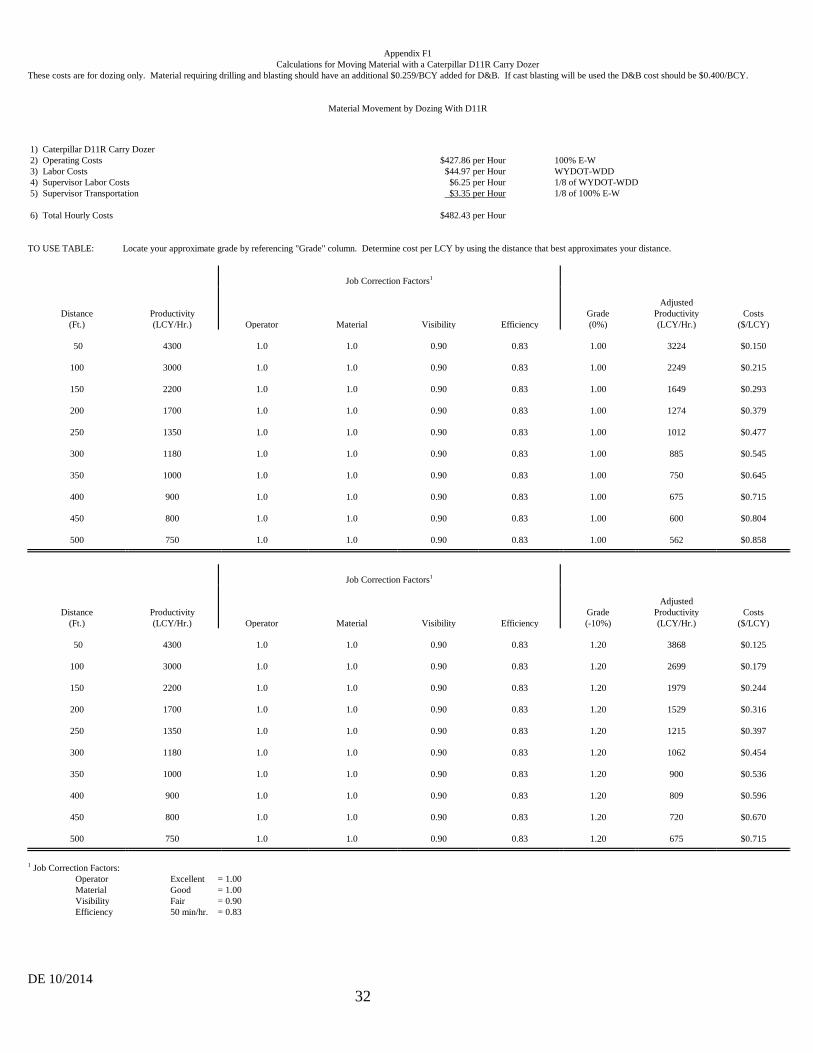
DE 10/2014 32
Appendix F1 Calculations for Moving Material with a Caterpillar D11R Carry Dozer These costs are for dozing only. Material requiring drilling and blasting should have an additional $0.259/BCY added for D&B. If cast blasting will be used the D&B cost should be $0.400/BCY. Material Movement by Dozing With D11R 1) Caterpillar D11R Carry Dozer 2) Operating Costs $427.86 per Hour 100% E-W 3) Labor Costs $44.97 per Hour WYDOT-WDD 4) Supervisor Labor Costs $6.25 per Hour 1/8 of WYDOT-WDD 5) Supervisor Transportation $3.35 per Hour 1/8 of 100% E-W 6) Total Hourly Costs $482.43 per Hour TO USE TABLE: Locate your approximate grade by referencing "Grade" column. Determine cost per LCY by using the distance that best approximates your distance.
Job Correction Factors1
Distance (Ft.)
Productivity (LCY/Hr.)
Operator
Material
Visibility
Efficiency
Grade (0%)
Adjusted
Productivity (LCY/Hr.)
Costs ($/LCY)
50
4300
1.0
1.0
0.90
0.83
1.00
3224 $0.150
100
3000
1.0
1.0
0.90
0.83
1.00
2249 $0.215
150
2200
1.0
1.0
0.90
0.83
1.00
1649 $0.293
200
1700
1.0
1.0
0.90
0.83
1.00
1274 $0.379
250
1350
1.0
1.0
0.90
0.83
1.00
1012 $0.477
300
1180
1.0
1.0
0.90
0.83
1.00
885 $0.545
350
1000
1.0
1.0
0.90
0.83
1.00
750 $0.645
400
900
1.0
1.0
0.90
0.83
1.00
675 $0.715
450
800
1.0
1.0
0.90
0.83
1.00
600 $0.804
500
750
1.0
1.0
0.90
0.83
1.00
562 $0.858
Job Correction Factors1
Distance
(Ft.)
Productivity (LCY/Hr.)
Operator
Material
Visibility
Efficiency
Grade (-10%)
Adjusted
Productivity (LCY/Hr.)
Costs ($/LCY)
50
4300
1.0
1.0
0.90
0.83
1.20
3868 $0.125
100
3000
1.0
1.0
0.90
0.83
1.20
2699 $0.179
150
2200
1.0
1.0
0.90
0.83
1.20
1979 $0.244
200
1700
1.0
1.0
0.90
0.83
1.20
1529 $0.316
250
1350
1.0
1.0
0.90
0.83
1.20
1215 $0.397
300
1180
1.0
1.0
0.90
0.83
1.20
1062 $0.454
350
1000
1.0
1.0
0.90
0.83
1.20
900 $0.536
400
900
1.0
1.0
0.90
0.83
1.20
809 $0.596
450
800
1.0
1.0
0.90
0.83
1.20
720 $0.670
500
750
1.0
1.0
0.90
0.83
1.20
675 $0.715
1 Job Correction Factors: Operator Excellent = 1.00 Material Good = 1.00 Visibility Fair = 0.90 Efficiency 50 min/hr. = 0.83

DE 10/2014 33
Appendix F1 (Continued) Calculations for Moving Material with a Caterpillar D11R Carry Dozer These costs are for dozing only. Material requiring drilling and blasting should have an additional $0.259/BCY added for D&B. If cast blasting will be used the D&B cost should be $0.400/BCY. Material Movement by Dozing With D11R
Job Correction Factors1
Distance (Ft.)
Productivity (LCY/Hr.)
Operator
Material
Visibility
Efficiency
Grade (-20%)
Adjusted
Productivity (LCY/Hr.)
Costs ($/LCY)
50
4300
1.0
1.0
0.90
0.83
1.40
4513 $0.107
100
3000
1.0
1.0
0.90
0.83
1.40
3149 $0.153
150
2200
1.0
1.0
0.90
0.83
1.40
2309 $0.209
200
1700
1.0
1.0
0.90
0.83
1.40
1784 $0.270
250
1350
1.0
1.0
0.90
0.83
1.40
1417 $0.341
300
1180
1.0
1.0
0.90
0.83
1.40
1239 $0.389
350
1000
1.0
1.0
0.90
0.83
1.40
1050 $0.460
400
900
1.0
1.0
0.90
0.83
1.40
945 $0.511
450
800
1.0
1.0
0.90
0.83
1.40
840 $0.574
500
750
1.0
1.0
0.90
0.83
1.40
787 $0.613
Job Correction Factors1
Distance
(Ft.)
Productivity (LCY/Hr.)
Operator
Material
Visibility
Efficiency
Grade (10%)
Adjusted
Productivity (LCY/Hr.)
Costs ($/LCY)
50
4300
1.0
1.0
0.90
0.83
0.75
2418 $0.200
100
3000
1.0
1.0
0.90
0.83
0.75
1687 $0.286
150
2200
1.0
1.0
0.90
0.83
0.75
1237 $0.390
200
1700
1.0
1.0
0.90
0.83
0.75
956 $0.505
250
1350
1.0
1.0
0.90
0.83
0.75
759 $0.636
300
1180
1.0
1.0
0.90
0.83
0.75
663 $0.728
350
1000
1.0
1.0
0.90
0.83
0.75
562 $0.858
400
900
1.0
1.0
0.90
0.83
0.75
506 $0.953
450
800
1.0
1.0
0.90
0.83
0.75
450 $1.072
500
750
1.0
1.0
0.90
0.83
0.75
422 $1.143
1 Job Correction Factors: Operator Excellent = 1.00 Material Good = 1.00 Visibility Fair = 0.90 Efficiency 50 min/hr. = 0.83

DE 10/2014 34
Appendix G Calculations for Final Grading With a Caterpillar 16M Motor Grader
Final Grading
INPUT, UNIT AS INDICATED
COMMENT/ SOURCE
Caterpillar 16M Motor Grader
Speed in Miles Per Hour (Second Gear) 3.3 Miles/Hour CPH 40
Width of Grading Per Pass 8 Feet CPH 40
Feet Per Mile 5,280 Feet
Square Feet Per Acre 43,560 Sq. Ft.
Operating Efficiency Factor 50 Min./Hr. 0.83 CPH 40
Operating Costs $151.77 Per Hour 100% of E-W
Labor Costs $44.97 Per Hour WYDOT-WDD
Supervision Labor Costs $6.25 Per Hour 1/8 of WYDOT-WDD
Supervisor Transportation $3.35 Per Hour 1/8 of 100% of E-W
Total Hourly Costs $206.34
Grading Rate
(3.3 Miles/Hour)x(5,280 Ft./Mile)x(8 Ft./Pass) 139,392 Ft2/Hour
(139,392 Ft2/Hour)/(43,560 Ft2/Acre) 3.2 Acres/Hour
(3.2 Acres/Hour)x(0.83 Efficiency Factor) 2.66 Acres/Hour
Operating Costs
($206.34/Hour)/(2.66 Acres/Hour) $77.57 Per Acre

DE 10/2014 35
Appendix H Cost Estimates for Handling Wire Fencing and Electrical Power Lines
FENCING
SOURCES Construction 4-Strand Barbed Removal
Overall Average - $2.01/LF Overall Average - $0.38/LF Power Line Removal
Wyoming Highway Department Weighted Average Bid Prices, 2013 Wyoming Highway Department, Average Bid Prices, 2013
Distribution Lines: Transmission Lines:
No Charge No Charge
From: Tri-County Electric From: Tri-County Electric
Note: Cost estimates for power line removal are based on phone contact with Tri-County Electric. Distribution lines are owned by Tri-County Electric and would be removed upon request at no charge by Tri-County Electric. Transmission lines (lines which go from the main metering point to various electrical substations and are not owned by Tri-County Electric) would be removed by Tri-County Electric at no cost for their salvage value.

DE 10/2014 36
Appendix I Cost Estimate for Ripping Asphalt Using a Caterpillar D9T Dozer
Asphalt Ripping (3"-4" Mat)
INPUT, UNIT AS INDICATED
COMMENT/ SOURCE
Caterpillar D9T Dozer With 3 Shank Ripper
Speed in Miles Per Hour 1 Mile/Hour CPH 40
Width of Ripping Pass 3 Feet CPH 40
Feet Per Mile 5,280 Feet
Square Feet Per Acre 43,560 Sq. Ft.
Operating Efficiency Factor 50 Min./Hr. 0.83 CPH 40
Operating Costs $205.87 Per Hour 100% of E-W
Labor Costs $44.97 Per Hour WYDOT-WDD
Supervision Labor Costs $6.25 Per Hour 1/8 of WYDOT-WDD
Supervisor Transportation $3.35 Per Hour 1/8 of 100% of E-W
Total Hourly Costs $260.44
Ripper Productivity
(1.0 Mile/Hour)x(5,280 Ft./Mile)x(3 Ft./Pass) 15,840 Ft2/Hour
(15,840 Ft2/Hour)/(43,560 Ft2/Acre) 0.36 Acres/Hour
(0.36 Acres/Hour)x(0.83 Efficiency Factor) 0.299 Acres/Hour
Operating Costs
($260.44/Hour)/(0.299 Acres/Hour) $871.04 Per Acre
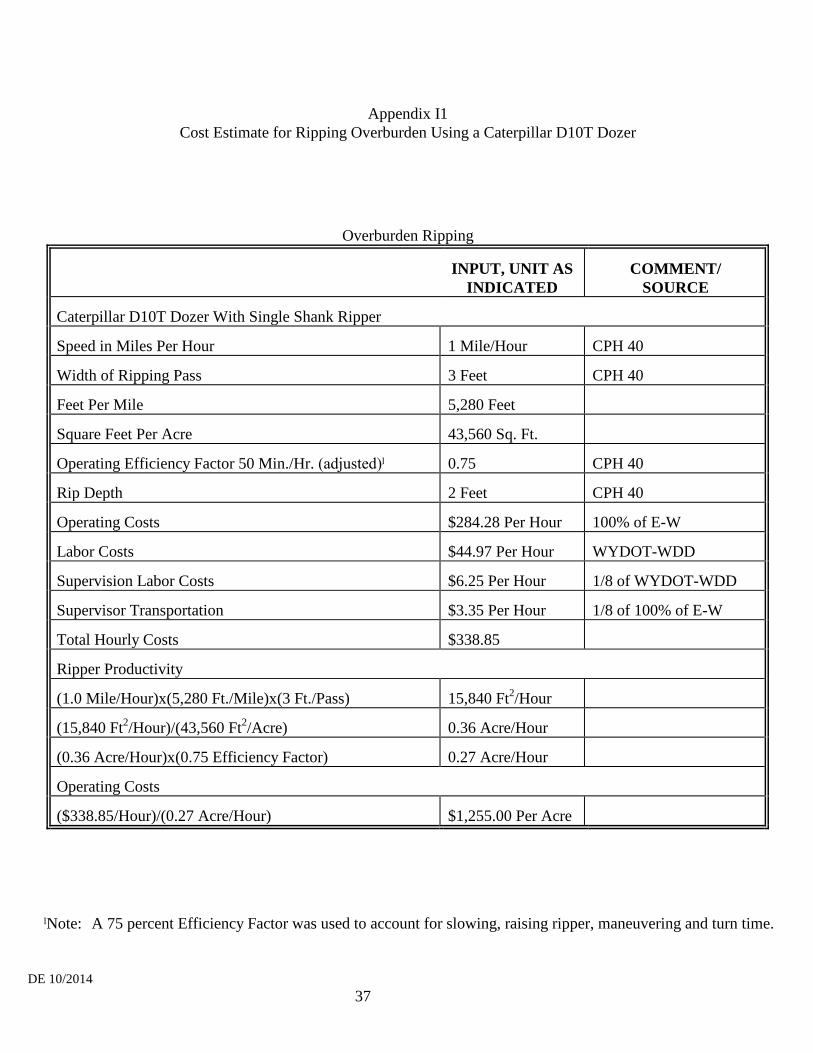
DE 10/2014 37
Appendix I1 Cost Estimate for Ripping Overburden Using a Caterpillar D10T Dozer
Overburden Ripping
INPUT, UNIT AS INDICATED
COMMENT/ SOURCE
Caterpillar D10T Dozer With Single Shank Ripper
Speed in Miles Per Hour 1 Mile/Hour CPH 40
Width of Ripping Pass 3 Feet CPH 40
Feet Per Mile 5,280 Feet
Square Feet Per Acre 43,560 Sq. Ft.
Operating Efficiency Factor 50 Min./Hr. (adjusted)ˡ 0.75 CPH 40
Rip Depth 2 Feet CPH 40
Operating Costs $284.28 Per Hour 100% of E-W
Labor Costs $44.97 Per Hour WYDOT-WDD
Supervision Labor Costs $6.25 Per Hour 1/8 of WYDOT-WDD
Supervisor Transportation $3.35 Per Hour 1/8 of 100% of E-W
Total Hourly Costs $338.85
Ripper Productivity
(1.0 Mile/Hour)x(5,280 Ft./Mile)x(3 Ft./Pass) 15,840 Ft2/Hour
(15,840 Ft2/Hour)/(43,560 Ft2/Acre) 0.36 Acre/Hour
(0.36 Acre/Hour)x(0.75 Efficiency Factor) 0.27 Acre/Hour
Operating Costs
($338.85/Hour)/(0.27 Acre/Hour) $1,255.00 Per Acre
ˡNote: A 75 percent Efficiency Factor was used to account for slowing, raising ripper, maneuvering and turn time.

DE 10/2014 38
Appendix J Cost Estimate for Culvert Removal
Culvert Removal
INPUT, UNIT AS INDICATED
COMMENT/ SOURCE
Average Length of CMP Section 20 Feet
Assumed Culvert Diameter 48 Inches
Time to Cut One Band 10 Minutes
Time to Load One 20' Section (2 People) 20 Minutes
Average Haul, Dump and Return Time 30 Minutes
Number of Sections of CMP Per Load 2
Operating Efficiency Factor 50 Min./Hr. 0.83
Labor $44.97 Per Hour WYDOT-WDD
Dump Truck (10-12 yd3) $77.10 Per Hour 100% of E-W
Caterpillar 980G Front-End Loader $117.64 Per Hour 100% of E-W
Cost to Remove One 20' Section of CMP
Labor Cost x Time to Cut One Band $7.50
+ ((Labor Cost x 2) + FEL Cost) x Time to Load 1 Section $69.12
+ (Labor Cost + Truck Cost) x Haul Time $61.04
Cost to Remove One 20' Section of CMP (not including dirt removal)
$137.66
Note: Culverts may be smashed and buried in place when feasible.

DE 10/2014 39
Appendix K Cost Estimates for Demolition and Removal of Railroad Spurs and Facilities Buildings
TASK
COST PER UNIT
($)
REGIONAL COST
ADJUSTMENT1
ADJUSTED COST PER UNIT
($)
Track Removal 9.18/lin. ft. 95.6% 8.78/lin. ft.
Ballast Removal 4.55/cy 95.6% 4.35/cy
Building Demolition and Disposal1, 2, 3
Mixture of Types 0.30/ft3 95.6% 0.287/ft3
Explosive Demolition, Concrete or Steel 0.30/ft3 95.6% 0.287/ft3
Disposal (Average) 10.21/cy 95.6% 9.76/cy
City Landfill Dump Charges $74.00/ton 95.6% $70.74/ton
Concrete Footings and Foundations
6" Thick With Rebar 5.80sq. ft. 95.6% 5.55/sq. ft.
Footings - 2' Thick, 3' Wide 21.40/lin. ft. 95.6% 20.46/lin. ft.
Concrete Disposal On-Site 9.04/cy 95.6% 8.64/cy
Note: Operators may also provide a verifiable cost estimate from a qualified contractor for these demolition
tasks. This estimate may be used for one to three consecutive years, assuming few substantial changes in mine facilities.
1 Costs From: 2015 Means Heavy Construction Cost Data & Building Construction Cost Data 2 Based on Total Volume of Building, does not include disposal cost 3 Based on Concrete Structures Volume Only, does not include disposal cost
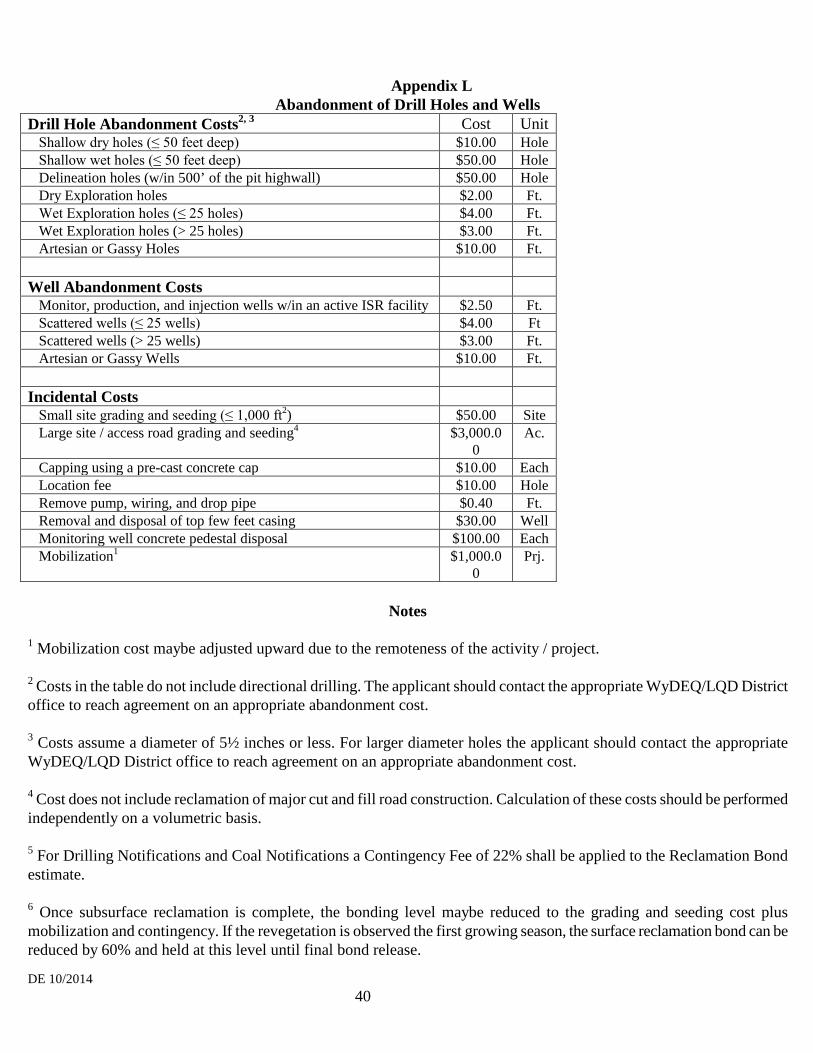
DE 10/2014 40
Appendix L
Abandonment of Drill Holes and Wells Drill Hole Abandonment Costs2, 3 Cost Unit Shallow dry holes (≤ 50 feet deep) $10.00 Hole Shallow wet holes (≤ 50 feet deep) $50.00 Hole Delineation holes (w/in 500’ of the pit highwall) $50.00 Hole Dry Exploration holes $2.00 Ft. Wet Exploration holes (≤ 25 holes) $4.00 Ft. Wet Exploration holes (> 25 holes) $3.00 Ft. Artesian or Gassy Holes $10.00 Ft. Well Abandonment Costs Monitor, production, and injection wells w/in an active ISR facility $2.50 Ft. Scattered wells (≤ 25 wells) $4.00 Ft Scattered wells (> 25 wells) $3.00 Ft. Artesian or Gassy Wells $10.00 Ft. Incidental Costs Small site grading and seeding (≤ 1,000 ft2) $50.00 Site Large site / access road grading and seeding4 $3,000.0
0 Ac.
Capping using a pre-cast concrete cap $10.00 Each Location fee $10.00 Hole Remove pump, wiring, and drop pipe $0.40 Ft. Removal and disposal of top few feet casing $30.00 Well Monitoring well concrete pedestal disposal $100.00 Each Mobilization1 $1,000.0
0 Prj.
Notes
1 Mobilization cost maybe adjusted upward due to the remoteness of the activity / project. 2 Costs in the table do not include directional drilling. The applicant should contact the appropriate WyDEQ/LQD District office to reach agreement on an appropriate abandonment cost. 3 Costs assume a diameter of 5½ inches or less. For larger diameter holes the applicant should contact the appropriate WyDEQ/LQD District office to reach agreement on an appropriate abandonment cost. 4 Cost does not include reclamation of major cut and fill road construction. Calculation of these costs should be performed independently on a volumetric basis. 5 For Drilling Notifications and Coal Notifications a Contingency Fee of 22% shall be applied to the Reclamation Bond estimate. 6 Once subsurface reclamation is complete, the bonding level maybe reduced to the grading and seeding cost plus mobilization and contingency. If the revegetation is observed the first growing season, the surface reclamation bond can be reduced by 60% and held at this level until final bond release.

DE 10/2014 41
Appendix M Cost Estimate for Rough Grading Backfill Using Caterpillar D9R Dozer or Caterpillar 854G
ITEMS
CATERPILLAR D9T
DOZER
CATERPILLAR 854G
RUBBER TIRED DOZER
COMMENT/SOURCE
Speed in Miles Per Hour (First Gear) 2.0 Miles/Hour 4.0 Miles/Hour CPH 40
Width of Dozer Pass 14 Feet 14 Feet CPH 40
Feet Per Mile 5,280 Feet 5,280 Feet
Square Feet Per Acre 43,560 Sq. Ft. 43,560 Sq. Ft.
Operating Efficiency Factor 50 Min./Hr. 0.83 0.83 CPH 40
Operating Costs $205.87 Per Hour $346.86 Per Hour 100% of E-W
Labor Costs $44.97 Per Hour $44.97 Per Hour WYDOT-WDD
Supervision Labor Costs $6.25 Per Hour $6.25 Per Hour 1/8 of WYDOT-WDD
Supervisor Transportation $3.35 Per Hour $3.35 Per Hour 1/8 of 100% of E-W
Total Hourly Costs $260.44 $401.43
SCARIFICATION RATE
(2.0 Miles/Hour)x(5,280 Ft./Mile)x(14 Ft./Pass)1 (4.0 Miles/Hour)x(5,280 Ft./Mile)x(14 Ft./Pass)2
147,840 Ft2/Hour 295,680 Ft2/Hour
(147,890 Ft2/Hour)/(43,560 Ft2/Acre)1 (295,680 Ft2/Hour)/(43,560 Ft2/Acre)2
3.39 Acres/Hour 6.79 Acres/Hour
(3.39 Acres/Hour)x(0.83 Efficiency Factor)1 (6.79 Acres/Hour)x(0.83 Efficiency Factor)2
2.82 Acres/Hour 5.66 Acres/Hour
OPERATING COSTS
($260.44/Hour)/(2.82 Acres/Hour)1
($401.43/Hour)/(5.66 Acres/Hour)2 $92.35 Per Acre $70.92 Per Acre
1 Caterpillar D9T Dozer 2 Caterpillar 854G Rubber Tired Dozer

DE 10/2014 42
Appendix N Cost Estimates for Demolition and Removal of One "Standard" Surface Water Monitoring Station
INPUT, UNIT AS INDICATED
COMMENT/ SOURCE
Assumed Time to Remove One Station 8 Hours
Labor $44.97 Per Hour WYDOT-WDD
Dump Truck (10-12 yd3) $77.10 Per Hour 100% of E-W
Caterpillar 980H Front-End Loader $117.64 Per Hour 100% of E-W
Cost to Remove One Surface Water Station = (Labor Cost x Time to Remove Station) + (Labor Cost + Truck Cost) x Time to Remove Station + (Labor Cost + Loader Cost) x Time to Remove Station
$359.76 $976.56 $1,300.88
Cost to Remove One Surface Water Station = $2,637.20
Appendix O
Cost Estimates for Demolition and Removal of One "Standard" Meteorological or Air Quality Monitoring Site
INPUT, UNIT AS INDICATED
COMMENT/ SOURCE
Assumed Time to Remove One Station 4 Hours
Labor $44.97 Per Hour WYDOT-WDD
Dump Truck (10-12 yd3) $77.10 Per Hour 100% of E-W
Caterpillar 430D (4WD) Backhoe Loader $35.80 Per Hour 100% of E-W
Cost to Remove One Meteorological or Air Quality Station = (Labor Cost x Time to Remove Station) + (Labor Cost + Truck Cost) x Time to Remove Station + (Labor Cost + Loader Cost) x Time to Remove Station
$179.88 $488.28 $323.08
Cost to Remove One Meteorological or Air Quality Station = $991.24

DE 10/2014 43
Appendix P Cost Estimate for Scarification of Compacted Surfaces
INPUT, UNIT AS INDICATED
COMMENT/ SOURCE
CATERPILLAR 16M MOTOR GRADER
Speed in Miles Per Hour (First Gear) 2.4 Miles/Hour CPH 40
Width of Scarifying Pass 12 Feet CPH 40
Feet Per Mile 5,280 Feet
Square Feet Per Acre 43,560 Sq. Ft.
Operating Efficiency Factor 50 Min./Hr. 0.83 CPH 40
Operating Costs $151.77 Per Hour 100% of E-W
Labor Costs $44.97 Per Hour WYDOT-WDD
Supervision Labor Costs $6.25 Per Hour 1/8 of WYDOT-WDD
Supervisor Transportation $3.35 Per Hour 1/8 of 100% of E-W
Total Hourly Costs $206.34
SCARIFICATION RATE
(2.4 Miles/Hour)x(5,280 Ft./Mile)x(12 Ft./Pass) 152,064 Ft2/Hour
(152,064 Ft2/Hour)/(43,560 Ft2/Acre) 3.49 Acres/Hour
(3.49 Acres/Hour)x(0.83 Efficiency Factor) 2.90 Acres/Hour
OPERATING COSTS
($206.34/Hour)/(2.90 Acres/Hour) $71.15
Per Acre

DE 10/2014 44
Appendix Q Revegetation Tasks and Costs The permittee should fill in the cost per acre for each mine-specific Revegetation Activity as listed in the approved permit document. If a permittee does not use a specific Revegetation Activity, there should be no cost entry. The permittee should add these costs together to obtain a total cost per acre for revegetation. A flat estimate per acre for revegetation costs is not acceptable. The LQD may request verification of submitted revegetation costs (WS ' 35-11-417(c)(i)).
General Revegetation Activity
Calculate According
To Specific Permit Commitments
1) Seedbed Preparation Ripping
$
Chisel Plowing
$
Disking
$
Harrowing or Cultipacking
$
2) Drill Seed Stubble Mulch Mix Seed Costs
$
Drill Seeding
$
Mowing Prior to Planting Permanent Seed Mix
$
3) Seeding Permanent Mixes: Detail for each seed mix, if different seed mixes will be applied. The costs/acre for each individual mix should then be proportioned on the basis of acreage per parcels to derive a single weighted average cost/acre. Drill Seeding
$
Broadcast Seeding
$
Seed Costs
$
4) Mulching Mulch Purchase
$
Hydromulch Application
$
Straw Mulch Placement and Crimping
$
5) Fertilizer Fertilizer Purchase by Defined Composition
$
Application
$
6) Fencing Construction
$
Removal
$
Subtotal
$
7) Maintenance Operations at 10% of Total Revegetation Costs: This cost addresses standard husbandry practices applied over the minimum 10-year bonding period, such as remedial seeding, mowing, selective weed treatment, etc. The 10 percent figure is derived from historical operator experience for the Powder River Basin.
$
Total Revegetation Cost Per Acre
$

DE 10/2014 45
Appendix R Reclamation Management Costs

DE 10/2014 46