department: water affairs and forestry dam/10. regional and national... · p wma 10/c31/00/0408...
TRANSCRIPT

REPORT NUMBER: P WMA 10/C31/00/1408
DEPARTMENT: WATER AFFAIRS AND FORESTRY
Directorate: Options Analysis
Lead Consultant: In association with:
JULY 2008 - Final
VAAL RIVER SYSTEM: FEASIBILITY STUDY FOR
UTILIZATION OF TAUNG DAM WATER
REGIONAL AND NATIONAL ECONOMY

Feasibility Study for Utilisation of Taung Dam Water (i)
PWMA 10/C31/00/1408 Regional and National Economy July 2008
LIST OF REPORTS
REPORT NO DESCRIPTION REPORT NAME
P WMA 10/C31/00/0408 Main Feasibility Report FEASIBILITY STUDY FOR UTILIZATION OF TAUNG DAM WATER: MAIN REPORT
P WMA 10/C31/00/0508 Supporting Report 1 DEMOGRAPHICS
P WMA 10/C31/00/0608 Supporting Report 2 WATER DEMAND AND USE
P WMA 10/C31/00/0708 Supporting Report 3 YIELD AND SYSTEM ANALYSIS
P WMA 10/C31/00/0808 Supporting Report 4 GROUNDWATER RESOURCES
P WMA 10/C31/00/0908 Supporting Report 5 IRRIGATION
P WMA 10/C31/00/1008 Supporting Report 6 WATER DEVELOPMENT AND SUPPLY PLANS
P WMA 10/C31/00/1108 Supporting Report 7 WATER QUALITY AND POLLUTION
P WMA 10/C31/00/1208 Supporting Report 8 EXISTING AND PROPOSED INFRASTRUCTURE
P WMA 10/C31/00/1308 Supporting Report 9 CONVEYANCE SYSTEM SCENARIOS AND ECONOMIC ANALYSIS
P WMA 10/C31/00/1408 Supporting Report 10 REGIONAL AND NATIONAL ECONOMY
P WMA 10/C31/00/1508 Supporting Report 11 EIA AND PUBLIC PARTICIPATION
REFERENCE
This report is to be referred to in bibliographies as:
Department: Water Affairs and Forestry, South Africa, 2007. Feasibility Study for Utilisation of Taung Dam Water: Regional and National Economy: prepared by Kayamandi Development Services (Pty) LTD.
Report No.: P WMA 10/000/00/0407/10
Project No.: WP8950
Project File: 14/2/C300/2/2

Feasibility Study for Utilisation of Taung Dam Water (i)
PWMA 10/C31/00/1408 Regional and National Economy July 2008
EXECUTIVE SUMMARY
Naledi local municipality has consistently been the highest GGP contributor in the study area
followed by Phokwane local municipality, and Greater Taung local municipality. Naledi Local
Municipality experienced the highest average annual GGP growth rate of all the three
municipalities in the study area on par with that of the country as a whole between the ten-year
period from 1995 to 2005. However, the economy of the Greater Taung Local Municipality only
grew at nearly a quarter than that of the country as a whole and Phokwane Local Municipality
experience growth at nearly half than that of the country as a whole. The study area, mostly
Phokwane and Greater Taung Local Municipalities are thus areas with relatively low growth
compared to the country as a whole. The study area also has a small economy in relation to its
GGP contribution to the Districts and Provinces in which they are situated. Unemployment is also a
major problem in the area, hence the low GGP contribution, which serves as fertile ground for
other social problems that hinder economic development and social well being. Many people in the
area are uneducated, or have low level of skills that are incompatible with the desired level of
economic activity in the municipality. Those who are employed are usually employed in low-income
industries such as farm workers or domestic workers. There are very few professional workers in
the area. The result is that a large portion of the population has limited to no income.
This area will thus benefit from economic injection in the form of this proposed bulk water
infrastructure development. The following regional and national economic impacts are foreseen
should the demand for increased water be met:
• Stimulation of economy: The potential economic benefits that are perceived include:
increased financial spending in the economy, increased infrastructure investment, and
increased expenditure by employees. The additional GDP arising from the capital investment
during the construction phase of the bulk water supply infrastructure could be approximately
R60 million. Approximately R5 million of this impact will accrue to the North-West Province.
The additional GDP arising from the operating expenditure during the operational phase is
approximately R400 000 per annum. Furthermore, based on expected procurement,
approximately R40 000 per annum will accrue to the North-West Province.
• Employment and decrease in local unemployment level: Increased employment is expected
in the economy during construction and operation of the bulk water infrastructure. With an
increase in employment, a definite transfer of skills will result. The proposed infrastructure
development and mechanical manufacturing of infrastructure requirements will lead to the
creation of additional jobs to the approximate amount of 1,800 during the construction phase.
Feasibility Study for Utilisation of Taung Dam Water (ii)
PWMA 10/C31/00/1408 Regional and National Economy July 2008
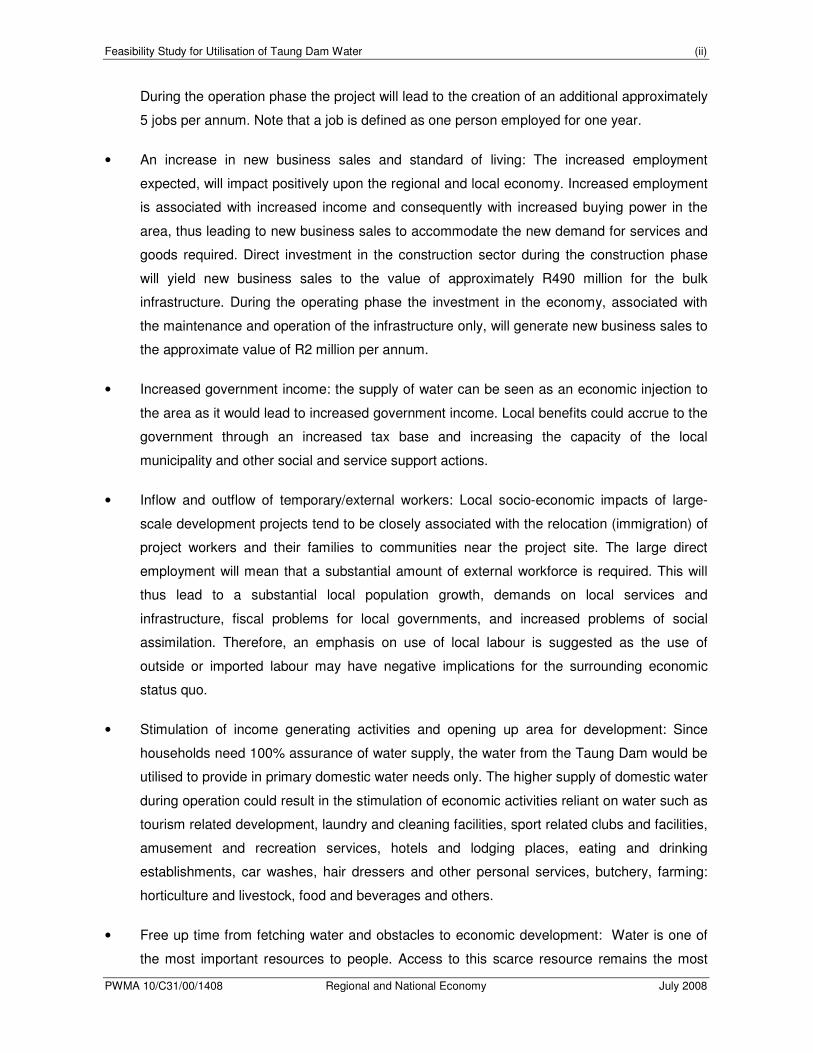
During the operation phase the project will lead to the creation of an additional approximately
5 jobs per annum. Note that a job is defined as one person employed for one year.
• An increase in new business sales and standard of living: The increased employment
expected, will impact positively upon the regional and local economy. Increased employment
is associated with increased income and consequently with increased buying power in the
area, thus leading to new business sales to accommodate the new demand for services and
goods required. Direct investment in the construction sector during the construction phase
will yield new business sales to the value of approximately R490 million for the bulk
infrastructure. During the operating phase the investment in the economy, associated with
the maintenance and operation of the infrastructure only, will generate new business sales to
the approximate value of R2 million per annum.
• Increased government income: the supply of water can be seen as an economic injection to
the area as it would lead to increased government income. Local benefits could accrue to the
government through an increased tax base and increasing the capacity of the local
municipality and other social and service support actions.
• Inflow and outflow of temporary/external workers: Local socio-economic impacts of large-
scale development projects tend to be closely associated with the relocation (immigration) of
project workers and their families to communities near the project site. The large direct
employment will mean that a substantial amount of external workforce is required. This will
thus lead to a substantial local population growth, demands on local services and
infrastructure, fiscal problems for local governments, and increased problems of social
assimilation. Therefore, an emphasis on use of local labour is suggested as the use of
outside or imported labour may have negative implications for the surrounding economic
status quo.
• Stimulation of income generating activities and opening up area for development: Since
households need 100% assurance of water supply, the water from the Taung Dam would be
utilised to provide in primary domestic water needs only. The higher supply of domestic water
during operation could result in the stimulation of economic activities reliant on water such as
tourism related development, laundry and cleaning facilities, sport related clubs and facilities,
amusement and recreation services, hotels and lodging places, eating and drinking
establishments, car washes, hair dressers and other personal services, butchery, farming:
horticulture and livestock, food and beverages and others.
• Free up time from fetching water and obstacles to economic development: Water is one of
the most important resources to people. Access to this scarce resource remains the most

Feasibility Study for Utilisation of Taung Dam Water (iii)
PWMA 10/C31/00/1408 Regional and National Economy July 2008
critical and worrying constraint for many rural people, and many of them spend several hours
a day securing supplies. Women (and children) are mostly affected by having to walk longer
distances to collect smaller amounts of water. The time lost is invaluable to most women and
children. The provision of water will release women and children from spending several
hours a day securing supplies to being able to search for work, undertake education, etc. All
of these will have profound effects on the regional economy. With access to potable water
the obstacles in the development of the following impoverished communities will be
addressed: 14 villages south-east of Taung Dam, 6 villages being supplied by the Bogosing
Water Supply, and 11 villages in the Taung area. The provision of domestic water will also
improve the spatial distribution of water and enable improved matching of supply with
demand.
• Decrease economic decline related to water shortages: Water projects have long been
advocated for their claimed contribution to regional economic development. However
investment in water supply does not automatically guarantee economic growth. While water
does not automatically generate growth, it may be the case that areas which persist in
lacking an adequate water supply (regardless of whether or not they started out with
adequate water) will not flourish economically, people will eventually leave those areas and
migrate to other areas that do have an adequate water supply. Thus, lack of water could be a
sufficient condition for economic decline or, to put it another way, water may be necessary,
but not sufficient for economic growth.
• Provide essential final good and opening up additional household end-uses: Water obviously
fits the definition of an essential final good as human life is not possible without access to
water. In addition to being essential for human life, water contributes in important ways to the
enjoyment of the satisfactions of life. Consequently, there are many other residential end
uses of water besides its use for drinking. When a piped water supply first became available,
the initial household uses were the same that had existed when family members had to fetch
water from an external source – drinking, cooking, hand washing, and limited bathing. As
time passed, many other uses came up – tubs for bathing, outdoor landscape and garden
watering, automatic clothes washers, swimming pools, automatic dish washers, car washing,
garbage disposal, indoor evaporative cooling, hot-tubs, lawn sprinklers, etc.
• Decrease in poor health related economic burdens: The lack of access to adequate water
supply brings the risk of ill-health or even death and undermines people’s dignity. Ill-health
and death have a profound impact on the regional and national economy. The positive
impact which providing a workable amount of clean water will have on the overall health of
the population far outweighs the direct financial costs of providing the water. Women

Feasibility Study for Utilisation of Taung Dam Water (iv)
PWMA 10/C31/00/1408 Regional and National Economy July 2008
therefore have the most to gain from a successful water project since they are primarily
responsible for health and hygiene.
• Open-up opportunity for home gardening: The access to water could also enable water for
home-grown vegetables and micro agriculture. It should, however, be noted that water
usually used for irrigation is cheaper than urban water supply. The reason is the difference in
costs. Water used for agriculture does not need to be treated. Enabling water usage for
home gardening would require two separate supply networks, one for potable water supply
via the water purification works. This two-tier system would however be too costly and thus
not possible to establish separate physical infrastructure and capital for the establishment of
a separate hard water supply to households. The result will be that home gardens will require
utilising more expensive treated domestic water and thus use thereof for other than domestic
uses will result in lower assurance for domestic supply. Opportunities for home gardening are
thus limited to the development of home-grown vegetables for own consumption making use
of domestic water supply.
• Freeing up water supply for other user sectors: The Taung Dam was initially constructed to
augment supply to the Taung Irrigation Scheme. However, currently there is no infrastructure
to convey water from the Taung Dam to the irrigation area. A need within the study area
exists for irrigation water supply. However the water from the Taung Dam has been identified
as being best put to use for domestic needs. However, using the water from the Taung Dam
to augment water to the Bogosing area and the Taung area could possibly free up water to
be transferred to Vryburg to augment water demand in that area. The exact water sector
beneficiary of this possibility is however not known. With regards to water for the irrigation
sector, it should be known that, separate from this study, Vaalharts Water is currently
working with the Department of Agriculture to compile a business plan for the upgrading of
the entire Vaalharts Irrigation Scheme’s canal network.

Feasibility Study for Utilisation of Taung Dam Water (v)
PWMA 10/C31/00/1408 Regional and National Economy July 2008
FEASIBILITY STUDY FOR UTILISATION OF TAUNG DAM
WATER
Table of Contents
PAGE
EXECUTIVE SUMMARY ...............................................................................................................(I)
TABLE OF CONTENTS................................................................................................................(v)
1. INTRODUCTION.............................................................................................................. 1.1
1.1. BACKGROUND OF STUDY ................................................................................................. 1.1
1.2. STUDY AREA .................................................................................................................... 1.1
1.3. PROPOSED INFRASTRUCTURE DEVELOPMENT: TAUNG DAM PURIFICATION WORKS ...... 1.2
2. REGIONAL ECONOMIC PROFILE.................................................................................. 2.1
2.1. GROSS GEOGRAPHIC PRODUCT ...................................................................................... 2.1
2.1.1. GGP Per Sector Of Naledi Local Municipality ................................................................... 2.6
2.1.2. GGP Per Sector Of Phokwane Local Municipality............................................................. 2.9
2.1.3. GGP Per Sector Of Greater Taung Local Municipality .................................................... 2.13
2.2. EMPLOYMENT................................................................................................................. 2.16
2.3. INCOME DISTRIBUTION................................................................................................... 2.20
2.4. LEVEL OF EDUCATION .................................................................................................... 2.22
2.5. CONCLUSION.................................................................................................................. 2.23
3. REGIONAL AND NATIONAL ECONOMIC IMPACTS ..................................................... 3.1
3.1 IMPACT ASSESSMENT ASSUMPTIONS .............................................................................. 3.1
3.2 IMPACT ASSESSMENT TECHNIQUE FOR QUANTIFICATION OF ECONOMIC IMPACTS........ 3.1
3.3 NATIONAL AND REGIONAL ECONOMIC IMPACTS DURING CONSTRUCTION ...................... 3.3
3.3.1. Stimulation Of The Economy ............................................................................................ 3.3
3.3.2. Employment Creation, Decrease In Local Unemployment Level And Skills Transfer ........ 3.5

Feasibility Study for Utilisation of Taung Dam Water (vi)
PWMA 10/C31/00/1408 Regional and National Economy July 2008
3.3.3. Business Output/Sales And Increased Standards Of Living.............................................. 3.7
3.3.4. Government Income And Expenditure .............................................................................. 3.8
3.3.5. Inflow And Outflow Of Temporary Workers....................................................................... 3.9
3.4. NATIONAL AND REGIONAL ECONOMIC IMPACTS DURING OPERATION ........................... 3.10
3.4.1. Stimulation Of The Economy .......................................................................................... 3.11
3.4.2. Employment Creation, Decrease In Local Unemployment Level And Skills Transfer ...... 3.11
3.4.3. Business Output/Sales And Increased Standards Of Living............................................ 3.12
3.4.4. Government Income And Expenditure ............................................................................ 3.13
3.5. ECONOMIC VALUE OF DOMESTIC WATER SUPPLY ......................................................... 3.13
3.5.1. Stimulation Of Income Generating Activities And Open Up Area For Development ........ 3.14
3.5.2. Free Up Time From Fetching Water And Obstacles To Economic Development ............ 3.16
3.5.3. Decrease Economic Decline Related To Water Shortages ............................................. 3.17
3.5.4. Provide Essential Final Good And Opening Up Additional Household End-Uses............ 3.18
3.5.5. Decrease In Poor Health Related Economic Burdens..................................................... 3.20
3.5.6. Open-Up Opportunity For Home Gardening.................................................................... 3.20
3.5.7. Freeing Up Water Supply For Other User Sectors .......................................................... 3.21
BIBLIOGRAPHY .......................................................................................................................... 23

Feasibility Study for Utilisation of Taung Dam Water (vii)
PWMA 10/C31/00/1408 Regional and National Economy July 2008
LIST OF ABBREVIATIONS
BD Bophirima District
DWAF Department: Water Affairs and Forestry
GTLM Greater Taung Local Municipality
FBD Frances Baard District
LMI Local Municipality
NLM Naledi Local Municipality
PLM Phokwane Local Municipality
NC Northern Cape
NW North West
RSA Republic of South Africa
Feasibility Study for Utilisation of Taung Dam Water 1.1
PWMA 10/C31/00/1408 Regional and National Economy July 2008
1. INTRODUCTION
1.1. Background of Study
The Taung Dam is a rollcrete dam located on the Harts River upstream of the Vaalharts
Irrigation Scheme in the Lower Vaal System. A recent survey indicated that the capacity
of the dam at full supply level is 62.97 million m3. The Taung Dam was constructed to
augment supply to the Taung Irrigation Scheme, but there is currently no infrastructure to
convey water from the Taung Dam to the irrigation area.
As a result, the Taung Dam is at present not utilised and the purpose of the feasibility
study was to establish if the resource could be economically used for water supply,
irrigation or other purposes within the project area.
Downstream from the Taung Dam the Spitskop Dam collects return flows from the Vaal-
Harts Irrigation Scheme, as well as runoff from the upstream catchments which has not
been utilised by existing developments. Surplus water is available in Spitskop Dam but is
of poor quality.
The project area extends over the whole of Taung Dam catchment and the Vaal-Harts
River system and the study took existing and planned regional development of the area
into account. Peri-urban areas around Greater Taung are currently served only with
groundwater, but in future both surface and groundwater resources will be required to
satisfy the increasing demand.
The purpose of this report, prepared by Kayamandi Development Services (Pty) Ltd, is to
provide the impacts of the regional and national economy from the utilisation of the Taung
Dam Water.
1.2. Study Area
The study area extends over the whole Taung Dam catchment and the Vaal-Harts River
System and includes the Naledi Local Municipality (NLM), Greater Taung Local
Municipality (GTLM) and Phokwane Local Municipality (PLM). The former two
municipalities form part of the Bophirima District Municipality in the North-West Province
and the latter forms part of the Frances Baard District Municipality in the Northern Cape.
Urban centres in the region include Vryburg and Stella in Naledi, Pudimoe and Taung
Station in Greater Taung, with Pampierstad, Hartswater and Jan Kempdorp in Phokwane.

Feasibility Study for Utilisation of Taung Dam Water 1.2
PWMA 10/C31/00/1408 Regional and National Economy July 2008
1.3. Proposed infrastructure development
Taung Dam has a capacity of 62.97 million m³ and a historic firm yield of 6.13 million m3/a
of which none is currently used due to the absence of infrastructure to convey water to
potential users. A system is thus required to transfer water from the dam to the Taung
Main Supply System (TMSS) and extension of the TMSS needs to be considered to
supply new irrigation areas not served by the current system. It is understood that there
were two options available to supply the additional water demand, namely: increasing the
capacity of the Main Vaalharts Canal to supply additional demand from the Vaal River;
and provide a system to transfer water from the Taung Dam to the Taung Main Supply
System in order to utilise water from the Taung Dam on the Harts River upstream of
Taung. This regional and economic impact is based on the option of transferring water
from the Taung Dam to the Taung Main Supply System.
Figure 1.1 below provides an indication of the proposed infrastructure development for the
utilisation of the Taung dam water. Three areas have been identified as possible
beneficiaries of water from the Taung Dam, these are as follows:
• Villages south-east of Taung Dam: There are 14 villages in this south eastern corner
of the Greater Taung area that source all of their water from rudimentary borehole
schemes. If water from the Taung Dam is supplied to a storage reservoir at a high
enough point in the area, distribution networks would be installed to supply the area.
• Bogosing Water Supply Area: The Bogosing Water Supply Scheme supplies water to
six villages. Water is abstracted from the Vaalharts Canal and is then purified at a
package treatment plant with a capacity of 1.2 Ml/day. However, this package plant is
highly inefficient with water losses accumulating to approximately 35-40% and turbidity
in the water being a problem for communities along certain sections of the scheme. If
water from the Taung Dam is used to supply the Bogosing area, then Bogosing’s
allocation from the Vaalharts Canal Scheme could be transferred to Vryburg to
augment the water demand in this area. This would require upgrading of the Pudimoe
Water Treatments Works and the Pudimoe Canal delivering water to the treatment
works (both planned for the near future), as well as the Pudimoe-Vryburg pipeline
which was recently upgraded only to replace the old pipe. The capacity of this pipe is
not enough to carry the extra supply.
• Taung Water Supply Area: The Pudimoe Water Supply Scheme supplies water to 11
villages in Taung area. Water is supplied through the Vaalharts North Canal and the

Feasibility Study for Utilisation of Taung Dam Water 1.3
PWMA 10/C31/00/1408 Regional and National Economy July 2008
Taung Main Canal via the Pudimoe Canal and purified at the Pudimoe Treatment
Works near Pudimoe. Water could be sourced from the Taung Dam to augment the
future demand. If water from the Dam is used to augment supply to the Taung area,
then water from the Vaalharts Canal Scheme could possibly be freed up to be
transferred to Vryburg to augment water demand in this area.
The proposed option for the utilisation of water from Taung Dam (as shown in Figure 1.1
below), on which the regional economic impact is based entails constructing a new water
treatment plant at the Taung Dam from where purified water could be distributed to the
Bogosing and Taung Water Supply Schemes as well as to the villages south-east of the
dam. Storage reservoirs will be constructed in both areas.
The main components of this scheme would be as follows.
• Water Treatment Works at Taung Dam;
• New storage reservoir on the highest point near Manokwane from where water would
gravitate to the Bogosing Water Supply Scheme as well as to the existing 5 Kl Taung
Reservoir in Taung Village;
• New storage reservoir on the highest point south-east of Taung Dam near Manokweng
to supply water to surrounding villages;
• Pump station at the WTW at the Taung Dam to pump purified water to the proposed
reservoirs at Manokwane and Manokweng villages;
• Pumping mains to convey purified water from the proposed WTW at the Taung Dam to
the proposed reservoirs at Manokwane and Manokweng villages;
• Gravity main from proposed reservoir at Manokwane to the sump of the existing pump
station at the Bogosing Water Treatment Works from where the water could be
pumped into the existing Bogosing Water Supply Scheme;
• Gravity main from proposed reservoir at Manokwane to the existing 5 Kl Taung
Reservoir in Taung Village; and
• Gravity main from proposed Manokweng reservoir to supply surrounding villages.

Feasibility Study for Utilisation of Taung Dam Water 1.4
PWMA 10/C31/00/1408 Regional and National Economy July 2008
Figure 1.1 Infrastructure developments for utilisation of Taung Dam water
GROUND RESEVOR
TOWER RESEVOR
PUMP STATION
WATER TREATMENT WORKS
BALANCING DAM
PUMP MAIN
GRAVITY MAIN

Feasibility Study for Utilisation of Taung Dam Water 1.5
PWMA 10/C31/00/1408 Regional and National Economy July 2008
The advantages of this option include that water losses of approximately 7% should be
allowed for at any water treatment plant. Pumping raw water to treatment works far away
from the source would result in pumping more water than would eventually be available to
use and is therefore considered an expensive exercise. Constructing a new treatment
works to purify the water near the Taung Dam would eliminate this long-term loss of
energy. Water will be purified relatively close to the end users. This will result in the cost
of the distribution network (pumping and gravity mains) to be less. The only disadvantage
of this option is that new treatment works at Taung Dam would require operation and
maintenance.

Feasibility Study for Utilisation of Taung Dam Water 2.1
PWMA 10/C31/00/1408 Regional and National Economy July 2008
2. REGIONAL ECONOMIC PROFILE
This economic profile delves into the underlying structures and sectors that make up the
study area’s macro economy providing insight into trends and issues of economic
significance, relating to:
• Gross Geographic Product (GGP);
• Employment per sector;
• Level of education; and
• Income distribution.
2.1. Gross Geographic Product
Gross Geographic Product (GGP) is defined as the total value of final production goods
and services produced within a geographic boundary in a given period. Changes in the
local economy can therefore be expressed as an increase or decrease in GGP. Only the
results of the activities which are intended to satisfy the needs of other people through
trade are considered to form part of the GGP.
The Gross Geographic Product (GGP) contribution per sector between 1995 and 2005 for
each of the three local municipalities that form the study area is presented below in Figure
2.1.
Figure 2.1 GGP contribution (Rand million)
0
200
400
600
800
1000
1200
1400
1600
1995 1996 1997 1998 1999 2000 2001 2002 2003 2004 2005
PLM NLM GTLM
Source: Quantec 2007 and Kayamandi calculations

Feasibility Study for Utilisation of Taung Dam Water 2.2
PWMA 10/C31/00/1408 Regional and National Economy July 2008
It is evident that Naledi LM has consistently been the highest GGP contributor in the study
area followed by Phokwane LM. Greater Taung LM has consistently been the lowest GGP
contributor.
Table 2.1 provides an indication of the annual growth rate of GGP in the study area.
Table 2.1 Annual growth rate of GGP per municipality and country
Annual Growth rate of GGP LOCAL MUNICIPALITY
1995-2000 2000- 2005 1995-2005
PHOKWANE 1.9% 2.2% 2.0%
NALEDI 3.0% 4.2% 3.6%
GREATER TAUNG 0.7% 1.4% 1.0%
FRANCES BAARD DISTRICT
2.1% 2.0% 2.1%
BOPHIRIMA DISTRICT 2.7% 2.9% 2.8%
NORTHERN CAPE 2.8% 2.3% 2.6%
NORTH WEST PROVINCE
1.8% 3.9% 2.8%
RSA 2.9% 4.8% 3.7%
Source: Quantec 2007 and Kayamandi calculations
Between 1995 and 2005, Naledi Local Municipality experienced the highest average
annual GGP growth rate of all the three municipalities in the study area, at 3.6% on par
with that of the country as a whole. Naledi Local Municipality’s economy grew at a higher
average per annum than that of the Bophirima District (2.8%) and that of the North West
Province (2.8%). Higher per annum average growth rates in Naledi were experienced in
the 2000 to 2005 period when compared to the 1995 to 2000 period.
Between the ten-year period from 1995 to 2005, the economy of the Greater Taung Local
Municipality only grew at an average per annum of 1%, which is far lower than that of the
Bophirima District and the North West Province in which it is located. A higher than
average growth rate was however experienced in the latter half of the ten year period
which equates an average per annum growth rate double than that of the first 5 years.
Greater Taung’s economy grew at nearly a quarter than that of the country as a whole.
Phokwane Local Municipality experienced higher than average economic growth rates
than that of Greater Taung, but lower than that of Naledi Local Municipality at 2% per
Feasibility Study for Utilisation of Taung Dam Water 2.3
PWMA 10/C31/00/1408 Regional and National Economy July 2008
annum over the ten-year period. The growth of Phokwane’s economy is similar to that of
the Frances Baard District at 2.1% growth and slightly lower than that of the Northern
Cape Province in which it is situated at 2.6%. The economy of Phokwane grew at nearly
half that of the country as a whole.
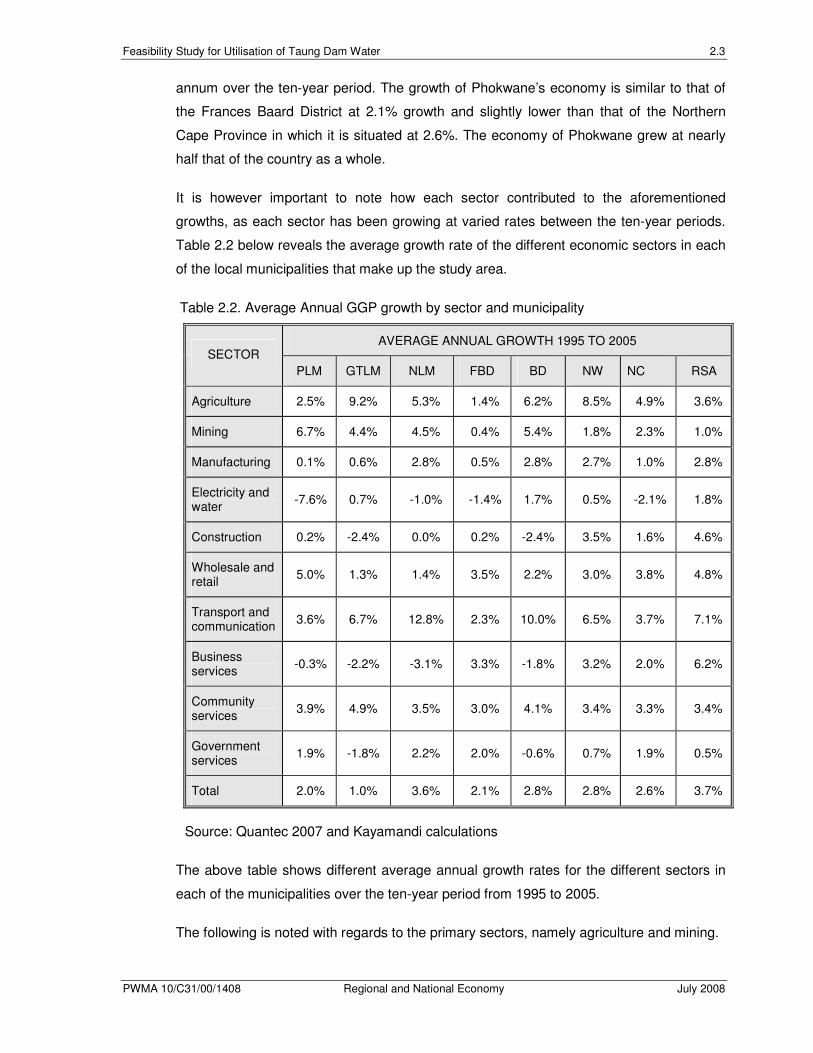
It is however important to note how each sector contributed to the aforementioned
growths, as each sector has been growing at varied rates between the ten-year periods.
Table 2.2 below reveals the average growth rate of the different economic sectors in each
of the local municipalities that make up the study area.
Table 2.2. Average Annual GGP growth by sector and municipality
AVERAGE ANNUAL GROWTH 1995 TO 2005 SECTOR
PLM GTLM NLM FBD BD NW NC RSA
Agriculture 2.5% 9.2% 5.3% 1.4% 6.2% 8.5% 4.9% 3.6%
Mining 6.7% 4.4% 4.5% 0.4% 5.4% 1.8% 2.3% 1.0%
Manufacturing 0.1% 0.6% 2.8% 0.5% 2.8% 2.7% 1.0% 2.8%
Electricity and water
-7.6% 0.7% -1.0% -1.4% 1.7% 0.5% -2.1% 1.8%
Construction 0.2% -2.4% 0.0% 0.2% -2.4% 3.5% 1.6% 4.6%
Wholesale and retail
5.0% 1.3% 1.4% 3.5% 2.2% 3.0% 3.8% 4.8%
Transport and communication
3.6% 6.7% 12.8% 2.3% 10.0% 6.5% 3.7% 7.1%
Business services
-0.3% -2.2% -3.1% 3.3% -1.8% 3.2% 2.0% 6.2%
Community services
3.9% 4.9% 3.5% 3.0% 4.1% 3.4% 3.3% 3.4%
Government services
1.9% -1.8% 2.2% 2.0% -0.6% 0.7% 1.9% 0.5%
Total 2.0% 1.0% 3.6% 2.1% 2.8% 2.8% 2.6% 3.7%
Source: Quantec 2007 and Kayamandi calculations
The above table shows different average annual growth rates for the different sectors in
each of the municipalities over the ten-year period from 1995 to 2005.
The following is noted with regards to the primary sectors, namely agriculture and mining.
Feasibility Study for Utilisation of Taung Dam Water 2.4
PWMA 10/C31/00/1408 Regional and National Economy July 2008
Agriculture, hunting, fishing and forestry involve enterprises primarily engaged in farming
activities or the rendering of agricultural services. Commercial hunting, game farming,
forestry, logging and fishing are also included in this category. Regarding the agriculture
sector, Greater Taung LM had the highest growth with 9.2% followed by Naledi and
Phokwane each with 5.3% and 2.5% growth respectively in this sector. The high average
per annum growth in the agriculture sector is far higher than that of the Bophirima District
and slightly higher than that of the North West Province at 8.5% growth. In relation to the
growth of agriculture in the country as a whole, at 3.6%, the study area has shown quite
an aggressive growth in agriculture which far outweighs that of the country’s growth in
agriculture.
Mining and quarrying involves the extracting, dressing and benediction of minerals
occurring naturally. Phokwane’s mining sector has the highest growth, at 6,7% with Naledi
and Greater Taung’s mining sectors growing at 4.5% and 4.4% respectively. The growth
in mining in Phokwane is far higher than that of the growth in the Frances Baard District
and the Northern Cape at 0.4% and 2.3% respectively. The growth experienced in the
mining sector in Greater Taung and Naledi show similar patterns to the growth in the
mining sector of the Bophirima District at 5.4% albeit at a far higher growth than that of the
North West Province (1.8%). The study area experienced far higher growth rates in the
mining sector, compared to the low average per annum growth over the aforementioned
period for the country as a whole at 1%.
The following is noted with regards to the secondary services sectors in the study area,
namely manufacturing, electricity and water, and the construction industry.
Manufacturing is defined as a process of transforming materials physically, chemically or
by means of assembly into new products. Insignificant growth in the manufacturing sector
is noted over the aforementioned ten-year period in Phokwane and Greater Taung Local
Municipalities with 0.1% and 0.6% growth respectively. The manufacturing sector of
Naledi local municipality has however grown at an average per annum of 2.8%, which is in
line with the growth experienced in the Bophirima, North West and the country as a whole,
with 2.8%, 2.7% and 2.8% respectively.
Electricity, water and gas involve production, collection and distribution of electricity as
well as the manufacture of gas and the collection and distribution of water. The electricity
and water services sectors showed average per annum declines in both Phokwane with -
7.6% decline and Naledi with -1% decline. Greater Taung only showed relatively
insignificant growth over the aforementioned period at 0.7% growth in line with that of the
North West Province in which it is located. The study area as a whole experienced lower

Feasibility Study for Utilisation of Taung Dam Water 2.5
PWMA 10/C31/00/1408 Regional and National Economy July 2008
than per annum average growth in the electricity and water services sectors for the
country as a whole.
The construction industry is also considered a secondary activity. It involves site
preparation, demolition, building, civil engineering, installation, plumbing, decorating, etc.
The construction sector also experienced insignificant growths in Phokwane and in Naledi
Local municipalities over the aforementioned period, whilst Greater Taung municipalities
experienced relatively high decrease in the construction sector in line with that of the
Bophirima District. The North West Province however showed significantly higher growth
over the period than of Naledi and Greater Taung local municipalities. The country as a
whole also experienced far higher annual growth rates than of the study area at 4.6%
growth per annum.
The following is noted with regards to the tertiary sector industries, namely wholesale and
retail trade, transport and communication, business and financial services, and
government and community sectors.
Trade entails the wholesale or retail sale of new and used goods in stores, stalls, markets
by mail order or by other means as well as hotels, restaurants, bars and other tourist
activities. The wholesale and retail sectors have shown significant growth in Phokwane
Local Municipality at 5% growth, which is on par with the growth in the aforementioned
sector for the country as a whole. Phokwane’s wholesale and retail sector experience
higher than average growth rates than its district and province. Both Greater Taung and
Naledi Local Municipalities showed relatively low growth rates in the wholesale and retail
sector at 1.3% and 1.4% respectively, far below that of the province and the country as a
whole.
Transport and communication involves the provision of passenger and or freight transport
by rail, road, water or air. It includes cargo handling and storage and postal activities,
courier activities and the transmission of sound images and data or other information.
Higher than average growth in the country in the transport and communication sector at
approximately 12.8% was experienced in the Naledi Local Municipality which is greater
than the national average of 7%. Greater Taung Local Municipality also grew at a
relatively high rate in the aforementioned sector. Both Naledi and Greater Taung local
municipalities grew in line with the average per annum growth experienced in the
aforementioned sector in the Bophirima District and that of the North West Province.
Phokwane Local Municipality’s transport and communication sector grew in line with that
of the Frances Baard District and Northern Cape, albeit at nearly half the growth rate of
the country as a whole for this sector.

Feasibility Study for Utilisation of Taung Dam Water 2.6
PWMA 10/C31/00/1408 Regional and National Economy July 2008
Business and financial services sector includes the activity of obtaining and redistributing
funds, financial intermediation, insurance and pension funding. The buying, selling, renting
and operating of owned and leased real estate. The business services sector showed
declining rates over the last ten years since 1995 for all three of the local municipalities,
which jointly comprise the study area. The decline within these tertiary sectors are
concerning, especially if viewed in relation to far higher average per annum growth rates
in the sector in the district, provinces and for the country as a whole.
Community services involve provision of community services e.g. education, health
services, social work and activities of professional organisations. The community services
sector in each of the three local municipalities within the study area grew at relatively
average per annum growth rates in comparison with that of the country as a whole.
Government services involve activities of central, provincial and local government. The
government service has grown relatively insignificantly over the ten-year period, and in
Greater Taung this sector has actually declined by nearly 2% per annum. This is a good
indication in that lower dependencies in the government service sector are created, since
government services sector is not responsible for growing the economy.
Having looked into the average annual growth rate, the following is a detailed account of
the growth of GGP per sector over a ten year period (1995 to 2005) for each of the three
municipalities that comprise the study area.
2.1.1. GGP per sector of Naledi Local Municipality
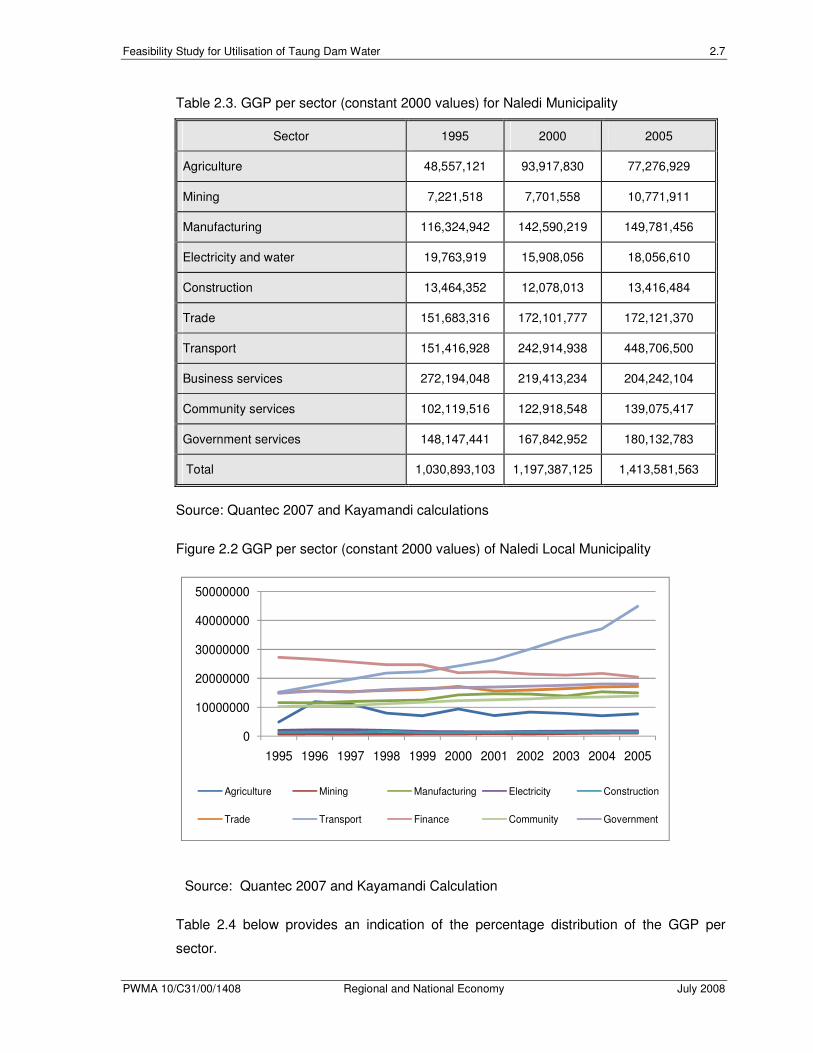
Table 2.3 below provides an indication of the GGP contribution per sector and Figure 2.2
below provide an indication of the growth of GGP per sector from 1995 to 2005.
In Naledi municipality the Transport and Communication sector has shown a steady
increase from R 151,4 million in 1995 to R 448,7 million in 2005. It has been leading
contributor to the GGP from the year 2000 to 2005. The Finance and business services
sector was the leading contributor to the GGP from 1995 to 2000 and gradually declined
to second place. The government services sector, the wholesale and retail sector,
manufacturing sector as well as the community social and personal services sector have
been consistent middle order contributors to the economy. The agriculture and forestry
and fishing sector, which falls below the middle order contributors showed a rapid
increase between 1995 and 1996 (R 48,5 million to R 119.1 million) and then declined
gradually. The mining sector, the construction sector as well as electricity and water have
consistently been the lowest contributors to the municipality’s economy.
Feasibility Study for Utilisation of Taung Dam Water 2.7
PWMA 10/C31/00/1408 Regional and National Economy July 2008
Table 2.3. GGP per sector (constant 2000 values) for Naledi Municipality
Sector 1995 2000 2005
Agriculture 48,557,121 93,917,830 77,276,929
Mining 7,221,518 7,701,558 10,771,911
Manufacturing 116,324,942 142,590,219 149,781,456
Electricity and water 19,763,919 15,908,056 18,056,610
Construction 13,464,352 12,078,013 13,416,484
Trade 151,683,316 172,101,777 172,121,370
Transport 151,416,928 242,914,938 448,706,500
Business services 272,194,048 219,413,234 204,242,104
Community services 102,119,516 122,918,548 139,075,417
Government services 148,147,441 167,842,952 180,132,783
Total 1,030,893,103 1,197,387,125 1,413,581,563
Source: Quantec 2007 and Kayamandi calculations
Figure 2.2 GGP per sector (constant 2000 values) of Naledi Local Municipality
0
10000000
20000000
30000000
40000000
50000000
1995 1996 1997 1998 1999 2000 2001 2002 2003 2004 2005
Agriculture Mining Manufacturing Electricity Construction
Trade Transport Finance Community Government
Source: Quantec 2007 and Kayamandi Calculation
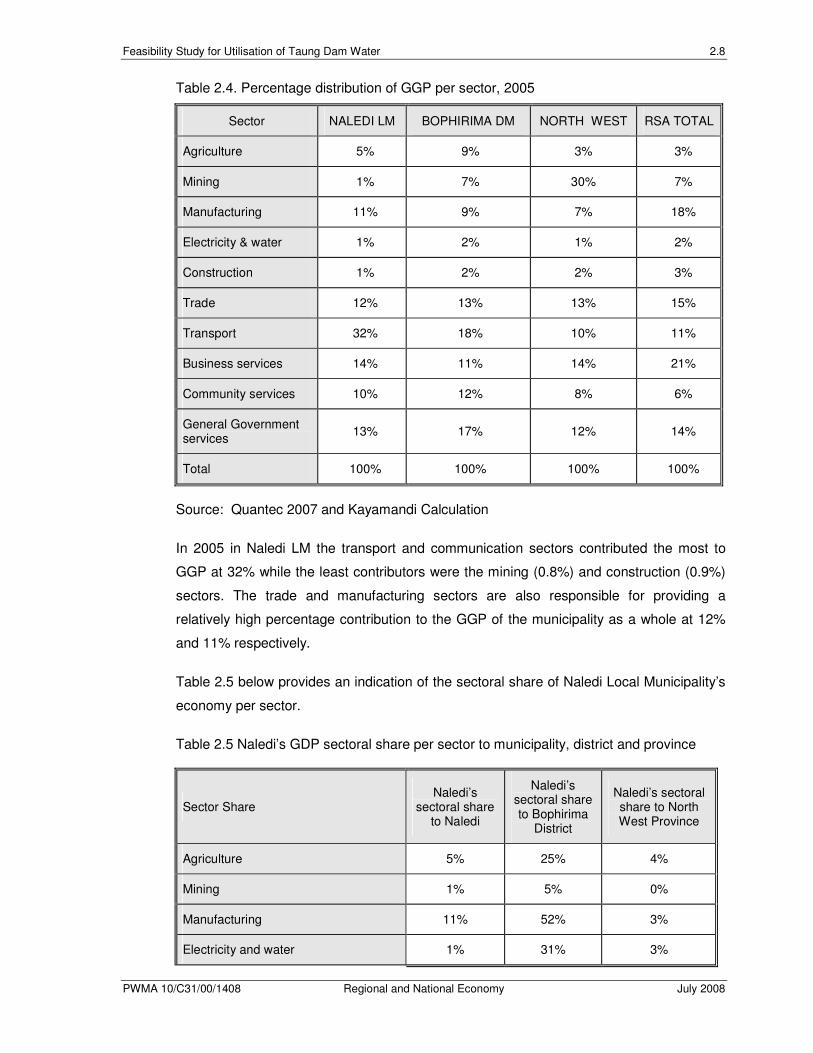
Table 2.4 below provides an indication of the percentage distribution of the GGP per
sector.
Feasibility Study for Utilisation of Taung Dam Water 2.8
PWMA 10/C31/00/1408 Regional and National Economy July 2008
Table 2.4. Percentage distribution of GGP per sector, 2005
Sector NALEDI LM BOPHIRIMA DM NORTH WEST RSA TOTAL
Agriculture 5% 9% 3% 3%
Mining 1% 7% 30% 7%
Manufacturing 11% 9% 7% 18%
Electricity & water 1% 2% 1% 2%
Construction 1% 2% 2% 3%
Trade 12% 13% 13% 15%
Transport 32% 18% 10% 11%
Business services 14% 11% 14% 21%
Community services 10% 12% 8% 6%
General Government services
13% 17% 12% 14%
Total 100% 100% 100% 100%
Source: Quantec 2007 and Kayamandi Calculation
In 2005 in Naledi LM the transport and communication sectors contributed the most to
GGP at 32% while the least contributors were the mining (0.8%) and construction (0.9%)
sectors. The trade and manufacturing sectors are also responsible for providing a
relatively high percentage contribution to the GGP of the municipality as a whole at 12%
and 11% respectively.
Table 2.5 below provides an indication of the sectoral share of Naledi Local Municipality’s
economy per sector.
Table 2.5 Naledi’s GDP sectoral share per sector to municipality, district and province
Sector Share Naledi’s
sectoral share to Naledi
Naledi’s sectoral share to Bophirima
District
Naledi’s sectoral share to North West Province
Agriculture 5% 25% 4%
Mining 1% 5% 0%
Manufacturing 11% 52% 3%
Electricity and water 1% 31% 3%

Feasibility Study for Utilisation of Taung Dam Water 2.9
PWMA 10/C31/00/1408 Regional and National Economy July 2008
Sector Share Naledi’s
sectoral share to Naledi
Naledi’s sectoral share to Bophirima
District
Naledi’s sectoral share to North West Province
Construction 1% 18% 1%
Trade 12% 39% 2%
Transport 32% 73% 7%
Business services 14% 56% 2%
Community services 10% 35% 3%
Government services 13% 32% 2%
Total 100% 42% 2%
Source: Quantec 2007 and Kayamandi Calculation
As is evident from the above, Naledi local municipality is responsible for more than 40% of
the district’s GDP and nearly more than 2% of the Provinces GDP. With regards to the
municipality’s sectoral share to the Provincial GDP per sector, it is noted that transport
followed by agriculture, manufacturing, electricity and water, and community services, are
responsible for larger than average provincial GDP share of the same sectors. The
following sectors, from highest to lowest, have also contributed to higher than average
GDP contribution to the district’s economy (42%), namely:
• Transport 73%
• Business Services 56%
• Manufacturing 52%
2.1.2. GGP per sector of Phokwane Local Municipality
Table 2.6 below provides an indication of the GGP contribution per sector and Figure 2.3
below provides an indication of the growth of GGP per sector from 1995 to 2005.
Table 2.6. GGP per sector (constant 2000 values) for Phokwane Municipality
Sector 1995 2000 2005
Agriculture 8,592,777 98,162,937 97,747,265
Mining 22,655,979 31,536,938 40,730,272
Manufacturing 46,907,058 47,429,609 47,459,022

Feasibility Study for Utilisation of Taung Dam Water 2.10
PWMA 10/C31/00/1408 Regional and National Economy July 2008
Sector 1995 2000 2005
Electricity and water 88,132,117 65,616,248 43,346,105
Construction 24,195,784 21,615,516 24,547,909
Trade 165,811,944 213,528,400 256,723,415
Transport 88,702,425 101,030,485 122,448,670
Business services 128,127,417 116,949,865 124,239,895
Community services 70,325,637 85,880,876 99,260,668
Government services 220,992,733 245,449,931 262,059,704
Total 934,443,871 1,027,200,805 1,118,562,925
Source: Quantec 2007 and Kayamandi calculations
As indicated above and depicted below, the general government services sector has
consistently been the leading contributor to the local municipality’s GGP. The wholesale
and retail, trade, catering and accommodation sector is the second highest contributor to
the economy. The finance and business services, the transport and communication sector
as well as the agriculture, and the community, social and other personal services have
been consistent middle order contributors to the municipality’s economy. The electricity
and water sector underwent a rapid decline from R 88,8 million in 1995 to R43.3 million in
2005 and became part of the lowest contributors. The lower contributors to the
municipality’s economy are: manufacturing, mining and the construction sectors.
Figure 2.3 GGP per sector (constant 2000 values) of Phokwane
0
50000000
10000000
15000000
20000000
25000000
30000000
1995 1996 1997 1998 1999 2000 2001 2002 2003 2004 2005
Agriculture Mining Manufacturing Electricity Construction
Trade Transport Finance Community Government
Source: Quantec 2007 and Kayamandi Calculations

Feasibility Study for Utilisation of Taung Dam Water 2.11
PWMA 10/C31/00/1408 Regional and National Economy July 2008
Table 2.7 below provides an indication of the percentage distribution of the GGP per
sector.
Table 2.7. Percentage distribution of GGP per sector, 2005
Sector PHOKWANE
LM FRANCES BAARD DM
NORTHERN CAPE
RSA TOTAL
Agriculture 9% 2% 7% 3%
Mining 4% 16% 28% 7%
Manufacturing 4% 3% 3% 18%
Electricity & water 4% 3% 2% 2%
Construction 2% 2% 2% 3%
Trade 23% 13% 12% 15%
Transport 11% 14% 10% 11%
Business services 11% 19% 13% 21%
Community services 9% 10% 9% 6%
General Government services
23% 17% 13% 14%
Total 100% 100% 100% 100%
Source: Quantec 2007 and Kayamandi Calculation
In 2005 in Phokwane LM the trade and government services sectors contributed the most
to GGP at 23% each while the least contributor was the construction sector at 2% of the
GDP for the municipality as a whole. The transport and business services sectors are also
responsible for providing a relatively high percentage contribution to the GGP of the
municipality each contributing 11% to the GDP. The agriculture sector is also a relatively
high contributor at 9%. Phokwane municipality’s GDP contribution differs significantly to
the rest of the district and the province which have relatively higher contributions to their
respective GDPs from the mining sector.
Table 2.8 below provides an indication of the sectoral share of Phokwane Local
Municipality’s economy per sector.

Feasibility Study for Utilisation of Taung Dam Water 2.12
PWMA 10/C31/00/1408 Regional and National Economy July 2008
Table 2.8 PLM’s GDP sector share per sector to that municipality, district, province, 2005
Sector share Phokwane’s
sectoral share to Phokwane
Phokwane’s sectoral share
to Frances Baard District
Phokwane’s sectoral share to Northern Cape
Agriculture 9% 56% 7%
Mining 4% 3% 1%
Manufacturing 4% 21% 6%
Electricity and water 4% 18% 9%
Construction 2% 21% 7%
Trade 23% 26% 10%
Transport 11% 12% 6%
Business services 11% 9% 4%
Community services 9% 13% 5%
Government services 23% 20% 9%
Total 100% 15% 5%
Source: Quantec 2007 and Kayamandi Calculation
As is evident from the above, Phokwane local municipality is responsible for only 15% of
the district’s GDP and more than 5% of the province’s GDP. With regards to the
municipality’s sectoral share to the provincial GDP per sector, it is noted that trade,
followed by electricity and water, government services, agriculture, construction, and
transport, are responsible for larger than average provincial GDP share of the same
sectors. The following sectors, from highest to lowest, have also contributed to higher
than average GDP contribution to the district’s economy (15%), namely:
• Agriculture 56%;
• Trade 26%;
• Construction 21%;
• Manufacturing 21%;
• Government services 20%; and
• Electiricty and wtaer 18%.

Feasibility Study for Utilisation of Taung Dam Water 2.13
PWMA 10/C31/00/1408 Regional and National Economy July 2008
The municipality’s contributes to more than half of the district’s share of agriculture, which
shows the relative importance of the agriculture sector in this municipality to the
agriculture sector of the district.
2.1.3. GGP per sector of Greater Taung Local Municipality
Table 2.9 below provides an indication of the GGP contribution per sector and Figure 2.4
below provides an indication of the growth of GGP per sector from 1995 to 2005.
As indicated and depicted below, the government services sector proved to be the
consistently overwhelming contributor to the GGP of the Greater Taung Local Municipality
(contributing R183,5 million to the economy in 2005). The other sectors are closely knit
together in terms of contribution to the economy. The community, social and other
personnel services sector as well as the mining sector have shown a marked increase in
production from the year 2000 to 2005. The electricity and water sector is the lowest
contributor to the economy in this municipality.
Table 2.9. GGP per sector (constant 2000 values)
Sector 1995 2000 2005
Agriculture 13,229,900 29,805,023 29,291,764
Mining 49,924,581 52,134,180 73,368,835
Manufacturing 18,630,210 18,994,859 19,639,204
Electricity and water 9,734,039 8,403,147 10,369,403
Construction 28,765,826 23,635,528 23,105,656
Trade 62,051,296 68,744,040 69,531,215
Transport 31,387,235 42,804,341 56,428,843
Business services 68,389,895 56,196,129 55,748,108
Community services 54,292,785 69,631,779 83,614,969
Government services 216,121,186 201,027,825 183,514,447
Total 13,229,900 29,805,023 29,291,764
Source: Quantec 2007 and Kayamandi calculations

Feasibility Study for Utilisation of Taung Dam Water 2.14
PWMA 10/C31/00/1408 Regional and National Economy July 2008
Figure 2.4 Growth of GGP per sector of Greater Taung Municipality
0
50000000
10000000
15000000
20000000
25000000
1995 1996 1997 1998 1999 2000 2001 2002 2003 2004 2005
Agriculture Mining Manufacturing Electricity Construction
Trade Transport Finance Community Government
Source: Quantec 2007 and Kayamandi Calculation
Table 2.10 below provides an indication of the percentage distribution of the GGP per
sector.
Table 2.10. Percentage distribution of GGP per sector, 2005
Sector GREATER TAUNG LM
BOPHIRIMA DM NORTH WEST RSA TOTAL
Agriculture 5% 9% 3% 3%
Mining 12% 7% 30% 7%
Manufacturing 3% 9% 7% 18%
Electricity & water 2% 2% 1% 2%
Construction 4% 2% 2% 3%
Trade 12% 13% 13% 15%
Transport 9% 18% 10% 11%
Business services 9% 11% 14% 21%
Community services 14% 12% 8% 6%
General Government services
30% 17% 12% 14%
Total 100% 100% 100% 100%
Source: Quantec 2007 and Kayamandi Calculation
In Greater Taung LM in 2005, the government services sector contributed the most to
GGP at 30.4% while the electricity and water sector is the least contributor at 1.7%.

Feasibility Study for Utilisation of Taung Dam Water 2.15
PWMA 10/C31/00/1408 Regional and National Economy July 2008
Community services (13.8%), trade (12.1%) and Mining (12.1%) are also significant
contributors to the GGP in Greater Taung LM. The contribution of the government
services to the economy of Greater Taung indicates a skewed economy, with a high
dependence on the government sector, which is not the case in the district, nor the
province or the country as a whole.
Table 2.11 below provides an indication of the sectoral share of Greater Taung Local
Municipality’s economy per sector.
Table 2.11 GTLM’s GDP sectoral share per sector to municipality, district, province, 2005
Sector share GTLM’s
sectoral share to GTLM
GTLM’s sectoral share to Bophirima
District
GTLM’s sectoral share to North
West
Agriculture 5% 9% 1%
Mining 12% 32% 0%
Manufacturing 3% 7% 0%
Electricity and water 2% 18% 1%
Construction 4% 31% 2%
Trade 12% 16% 1%
Transport 9% 9% 1%
Business services 9% 15% 1%
Community services 14% 21% 2%
Government services 30% 33% 2%
Total 100% 18% 1%
Source: Quantec 2007 and Kayamandi Calculations
As is evident from the above table, Greater Taung local municipality is responsible for only
18% of the districts GDP and only 1% of the province’s GDP. With regards to the
municipality’s sectoral share to the provincial GDP per sector, it is noted that construction
and government and community services sectors are responsible for larger than average
provincial GDP share of the same sectors. The following sectors, from highest to lowest,
have also contributed to higher than average GDP contribution to the district’s economy
(18%), namely:
• Government services 33%;

Feasibility Study for Utilisation of Taung Dam Water 2.16
PWMA 10/C31/00/1408 Regional and National Economy July 2008
• Mining 32%;
• Construction 31%;
• Community services 21%; and
• Electricity and water 18%
The municipality’s contributes approximately a third to the district’s share of government
services and mining. This shows the relative importance of the mining sector in this
municipality to the mining sector of the district.
2.2. Employment
According to Statistics South Africa 2004, employment is defined as an activity in which
an economic active person is engaged for pay, profit or family gain or a combination of
any of the three. The definition applies to both the informal and formal sectors. Formal
employment is an important sector in the economy of a local municipality as it fosters
more sophisticated economic activities that would eventually improve the macro economy
of a particular local municipality.
Unemployment is a major problem in the area, which serves as fertile ground for other
social problems that hinder economic development and social well being. Many people in
the area are uneducated and have no income. Those who are employed are usually
employed in low-income industries i.e. as farm workers or domestic workers. There are
very few professional workers in the area.
Table 2.12. below provides an indication of the employment status of the potentially
economically active population of persons aged between the ages of 15-64 years as well
as the employment status of the economically active population (actively employed
population). It should be understood that the potentially economically active people
together with the total number of workers in an area and the number of people believed to
be available for work create what is known as the labour force, i.e. the population between
the ages of 15 to 64 years (as defined by Stats SA).
Table 2.12 below reveals that a significant percentage of the potentially active population
are not economically active. Greater Taung Municipality has the highest disparity of a
potentially active population as only 25% of the potentially economically active population
are indeed economically active, whereas in Phokwane and Naledi local municipalities this
is 55% and 59% respectively.

Feasibility Study for Utilisation of Taung Dam Water 2.17
PWMA 10/C31/00/1408 Regional and National Economy July 2008
Table 2.12. Percentage distribution of formal employment status of economically active
population, 2007
PLM NLM GTLM FBD BD NW NC RSA
Employment status (%) of potentially economically active population (total population aged 15-64 years of age)
Employed 38% 31% 14% 37% 22% 37% 39% 40%
Unemployed 17% 28% 11% 18% 16% 20% 17% 19%
Not economically active
42% 38% 73% 41% 60% 39% 40% 37%
Not applicable 3% 3% 2% 3% 2% 4% 4% 4%
Total 100% 100% 100% 100% 100% 100% 100% 100%
Employment status (%) - Economically active population
Employed 69% 53% 55% 67% 58% 65% 69% 67%
Unemployed 31% 47% 45% 33% 42% 35% 31% 33%
Total 100% 100% 100% 100% 100% 100% 100% 100%
Source: Community survey 2007 and Kayamandi calculations
Phokwane LM has a significant percentage of the population of working age employed,
accounting for 38% of the potentially economically active population. This is in line with
that of the Frances Baard District (37%), the Northern Cape (39%) and South Africa (40%)
as a whole, in which it is situated.
Within Naledi local municipality only 31% of the potentially economically active population
is employed. This is however far higher than that of the Bophirima District (22%) although
far lower than that of the North West Province (37%) and the country as a whole.
Greater Taung LM has only 14% of its potentially economically active population
employed, which is far lower than that of its district and province. The above table also
reveals that the higher the disparity between the potentially economically active to the
economically active, the lower the amount of people actively employed or searching for
employment in order to improve their economic situation.
The level of unemployment prevalent in a particular area is a good indicator of the
intensity for the demand of job creation. Statistics South Africa defines the unemployed as
economically active people who: did not work in the past seven days, want to work and

Feasibility Study for Utilisation of Taung Dam Water 2.18
PWMA 10/C31/00/1408 Regional and National Economy July 2008
are available to start work within a week from the interview, and have taken steps to look
for work or to start some form of work within the past 4 weeks. As shown in the above
table, 31% of Phokwane’s, 47% of Naledi’s and 45% of Greater Taung’s economically
active population are unemployed.
Table 2.13 indicates the sectoral distribution of the formal employment.
Table 2.13: Sectoral distribution of formal employment, 2005
PLM NLM GTLM FBD BD NW NC RSA
Agriculture 17% 19% 8% 8% 18% 7% 19% 8%
Mining 1% 0% 5% 9% 8% 32% 10% 5%
Manufacturing 12% 9% 4% 8% 7% 7% 7% 14%
Electricity 3% 1% 1% 1% 1% 0% 1% 1%
Construction 3% 3% 7% 5% 5% 3% 5% 5%
Wholesale, retail, trade
17% 17% 15% 14% 14% 14% 13% 16%
Transport 3% 3% 2% 4% 2% 2% 3% 4%
Finance 9% 13% 8% 13% 8% 10% 10% 17%
Community services
12% 14% 13% 13% 15% 10% 12% 14%
Government services
24% 19% 37% 25% 21% 14% 20% 17%
TOTAL 100% 100% 100% 100% 100% 100% 100% 100%
Source: Kayamandi Development Services Calculations from Quantec, 2005
The main sectoral employment providers in Phokwane are government services (24%),
trade (17%), agriculture (17%), and manufacturing and community services each at 12%.
Agriculture is not such a high contributor to employment within the Frances Baard District
(8%), although within the Northern Cape it contributes 19% of all employment generated.
This shows the relative importance of the agriculture sector for employment in the study
area. The employment in trade is more in line with that of the district, province and country
as a whole. Trade however, remains an important contributor to employment within the
study area.

Feasibility Study for Utilisation of Taung Dam Water 2.19
PWMA 10/C31/00/1408 Regional and National Economy July 2008
The top three sectors of employment in Naledi local municipality are agriculture and
government services sectors each contributing 19% of the municipality’s employment,
followed by the trade sector which employs 17% of the formal employees. The agriculture
sector is also a key employment sector for the Bophirima District (18%), but it is not such
a major employment sector in the North West Province (7%). Trade is also a key sectoral
employment sector in the district, province and country as a whole.
Figure 2.5 below provides an indication of the sectoral distribution of those formally
employed and enables comparison of the sectoral employment per municipality within the
study area and South Africa as a whole.
Figure 2.5 Percentage distribution of formal employment per sector, 2005
0%5%
10%15%20%25%30%35%40%
PLM NLM GTLM RSA
Source: Quantec 2005 and Kayamandi calculations
From the above Figure, the relative importance of the agriculture and manufacturing
sector in Phokwane, and Naledi Local Municipalities can be noted. The importance of the
trade sector to all the municipalities within the study area is also noted. High dependence
of Greater Taung on employment from the government services sector is also noted.
Figure 2.6 below provides an indication of change in formal employment from 1995 to
2005.
From the figure below it is noted that Phokwane Local Municipality has a greater number
of persons formally employed, followed by Naledi Local Municipality and then Greater
Taung Municipality. A general decline in the number of persons formally employed is
however noted from 1995 to 2005. This reveals that the level of employment is worsening,
which will have dire consequence for the economy of the municipalities and the region if
not addressed adequately and timeously.

Feasibility Study for Utilisation of Taung Dam Water 2.20
PWMA 10/C31/00/1408 Regional and National Economy July 2008
Figure 2.6 Formal employment per municipality
Source: Quantec 2005 and Kayamandi calculations
2.3. Income distribution
Based on the relatively high unemployment figures and relatively high percentage of
employment in lower paying primary sectors such as agriculture the income distribution of
the municipalities within the study area is expected to be relatively low and needs to be
taken into consideration.
Disposable income is defined as the net income available to a particular person to either
save or spend. Income is an important factor to consider in a macroeconomic analysis as
it indicates the amount of money households have available to participate (buy and sell) in
the local economy.
Table 2.14 below provides an indication of the distribution of annual household income
per municipality.
Table 2.14 Percentage Distribution of annual household income per municipality
INCOME CATEGORY
PLM NLM GTLM FBD BD NW NC RSA
No income 14% 13% 34% 17% 28% 23% 17% 23%
R 1- R 4800 15% 16% 11% 9% 14% 9% 9% 8%
R 4801-R 9600 25% 25% 26% 21% 25% 19% 22% 18%

Feasibility Study for Utilisation of Taung Dam Water 2.21
PWMA 10/C31/00/1408 Regional and National Economy July 2008
INCOME CATEGORY
PLM NLM GTLM FBD BD NW NC RSA
R9601-R 19200 17% 18% 15% 18% 16% 19% 18% 16%
R19201-R 38400 12% 12% 7% 14% 9% 16% 14% 13%
R38401- 76800 8% 7% 4% 10% 5% 7% 9% 9%
R76801- R 153600
5% 5% 2% 7% 3% 4% 6% 6%
R 153601 and more
3% 3% 1% 5% 2% 3% 4% 6%
TOTAL 100% 100% 100% 100% 100% 100% 100% 100%
Source: Census 2001 and Kayamandi Calculations
Greater Taung Local Municipality has the highest percentage of households with no
income accounting for approximately one third of the households (34%) as compared to
only approximately 14% of households in both Naledi and Phokwane Local Municipalities
with no household income. This reveals that the study area has a high indigent status. In
Phokwane (14%) and Naledi (13%) Local Municipalities there are however fewer
households without income than that of the country as a whole (23%).
In Phokwane, Naledi and Greater Taung approximately 15%, 16% and 11% respectively
of the municipality’s households are situated under the R1- R4 800 income category while
the most common income scale is between R4801 and R9600 of the study area. This
category describes the household income levels of approximately a quarter of each of the
municipality’s households. The R9 601 to R19 200 category has a significant amount of
the study area’s households indicating about 17%, 18%, and 15% of the population of
Phokwane, Naledi and Greater Taung Local Municipalities respectively.
Figure 2.7 below provides an indication of the household income distribution per
municipality.
In each of the municipalities a scenario is presented in which the majority of the
municipality’s households have an income (lower than R9600) while a minority have high
incomes. On the one hand there is a significant amount of people with no household
income while on the other hand there are a few households in the study area with very
high annual incomes of R153 600 and more. This indicates a huge income disparity which
is an obstacle to economic development in the study area.

Feasibility Study for Utilisation of Taung Dam Water 2.22
PWMA 10/C31/00/1408 Regional and National Economy July 2008
Figure 2.7 Household income distribution per municipality
Source: Census 2001 and Kayamandi calculations
2.4. Level of Education
The following section provides an indication of the level of education. Education has a
huge bearing employment and income level. It enables people through training to be more
productive in the various sectors of the economy. Education is an important factor to
consider in a regional economic analysis as it plays a crucial role in the potential rate for
development. Table 2.15 provides an indication of the highest education levels reached.
Table 2.15 Level of education of the population aged 20 years and older
LEVEL PLM NLM GTLM FBD BD NW NC RSA
No Schooling 22% 21% 25% 13% 27% 15% 14% 11%
Primary 31% 29% 36% 27% 32% 31% 31% 26%
Secondary 37% 39% 31% 47% 32% 42% 44% 48%
Tertiary 9% 9% 6% 10% 7% 8% 9% 12%
Unspecified 1% 1% 2% 3% 2% 4% 3% 3%
TOTAL 100% 100% 100% 100% 100% 100% 100% 100%
Source: Kayamandi Development Services Calculations from Community Survey 2007
Figure 2.8 provides an indication of the percentage distribution of education of people
aged 20 years and above.

Feasibility Study for Utilisation of Taung Dam Water 2.23
PWMA 10/C31/00/1408 Regional and National Economy July 2008
Figure 2.8: Percentage distribution of level of education (20 years and older)
Source: Community Survey 2007 and Kayamandi calculations
The above table and figure reveals that approximately 25% of the population aged 20
years and older living in Greater Taung Local Municipality have had no schooling, which is
extremely high compared to the national average of 11%. Approximately 36% of the
population have however had primary school education and 31% secondary education.
The tertiary level of education is very low at 6%. These figures reveal a generally low
level of skills that are incompatible with some economic activities in the municipality.
For Naledi Local Municipality the figures reveal a similar picture to the Greater Taung
Local Municipality as half the people living in the municipality, have either had no
schooling or only primary school education. The level of secondary school accounts for
39% of the population. The tertiary level of education is however more on par with that of
the country as a whole at 9%.
Phokwane Local Municipality shows a population above the age of 20 with 22% of
persons with no schooling. Approximately 9% of the population aged 20 years and older
have obtained tertiary education.
2.5. Conclusion
Naledi LM has consistently been the highest GGP contributor in the study area followed
by Phokwane LM. Greater Taung LM has consistently been the lowest GGP contributor.
Greater Taung thus has a very low GGP in relation to its population size which exceeds
that of the other two municipalities. The economy of Naledi Local Municipality experienced
the highest average annual GGP growth of all the three municipalities in the study area on
par with that of the country as a whole between the ten-year period from 1995 to 2005.

Feasibility Study for Utilisation of Taung Dam Water 2.24
PWMA 10/C31/00/1408 Regional and National Economy July 2008
However, the economy of the Greater Taung Local Municipality only grew at nearly a
quarter than that of the country as a whole and Phokwane Local Municipality experienced
growth at nearly half than that of the country as a whole. The study area, mostly
Phokwane and Greater Taung Local Municipalities are thus areas with relatively low
growth compared to the country as a whole. The area also has a small economy in
relation to its contribution to the districts and provinces in which they are situated. This
area will thus benefit from economic injections in the form of the proposed development.
Unemployment is also a major problem in the area, hence the low GGP contribution,
which serves as fertile ground for other social problems that hinder economic
development and social well being. Many people in the area are uneducated, or have low
levels of skills that are incompatible with the desired level of economic activity in the
municipality. Those who are employed are usually employed in low-income industries
such as farm workers or domestic workers. There are very few professional workers in the
area. The result is that that a large portion of the population has limited to no income.

Feasibility Study for Utilisation of Taung Dam Water 3.1
PWMA 10/C31/00/1408 Regional and National Economy July 2008
3. REGIONAL AND NATIONAL ECONOMIC IMPACTS
This section outlines the possible economic impacts that can be expected to occur in the
local and regional economy as a result of utilisation of water from the Taung dam. It is
important to note that the quantification of economic impacts on the regional and national
economy as determined with the input/output analysis is not based on local population
figures, but on additional expenditure in the economy during the construction and
operation phase associated with the infrastructure development required to enable supply
of domestic use of water from the Taung Dam to the villages south-east of Taung Dam,
Bogosing Water Supply area, and the Taung Water Supply area.
The following aspects are covered in this Section:
• Impact assessment assumptions;
• Impact assessment technique for quantification of regional and national impacts;
• National and Regional Economic Impacts during Construction;
• National and Regional Economic Impact during Operation; and
• Economic value of domestic water supply.
3.1 Impact Assessment Assumptions
This economic impact is based on the following knowledge and assumptions of utilisation
of Taung dam water at this stage:
• The pipeline will be installed outside of the road reserve outside of towns and
villages and inside the road reserve where the road goes through towns and
villages;
• A 12 metre wide servitude is required for the pipeline;
• No new fences will be installed alongside the servitude;
• The water of the Taung Dam will be utilised to provide in primary water needs only; and
• The construction phase will take place during 2010 and 2011.
3.2 Impact assessment technique for quantification of regional and economic impacts
In terms of quantifying the impacts on the regional and national economy an input-output
model was utilised. An input-output model has various analytical applications that can be
used to determine the direct, indirect and induced impact of the proposed transformation
process on the economy. The approach takes into account the interdependence between

Feasibility Study for Utilisation of Taung Dam Water 3.2
PWMA 10/C31/00/1408 Regional and National Economy July 2008
different sectors (i.e. agriculture, mining, manufacturing, government, etc) in the local
economy as well as economic flows of goods and services to and from the economy.
This technique provides a snapshot of economic production at a given point in time and,
as such, has numerous application possibilities. The most prominent application of this
technique involves modelling the impact of changing production functions on general
economic equilibrium. In other words, the impacts that increased expenditure in the
economy resulting from the construction and operation of the civil and mechanical
components required for the utilisation of water from the Taung Dam were modelled.
Economic impacts are those impacts that affect the level of economic activity in a region.
For instance they directly affect the economic well-being of area residents and businesses
by changing employment levels and retail expenditures. An economic impact assessment
traces spending through an economy and measures the cumulative effects of that
spending.
Estimating the economic impact of a project or development is very helpful in
understanding the potential benefits of various forms of growth. It should be noted,
however, that the means of estimating these benefits are more useful in understanding
the likely order of magnitude of impacts rather than specific amounts.
Typically the effects of the input/output technique are as follows:
• The direct effects: this takes into account direct purchases made within the economy
by the project, the number of people employed, etc. This effect is the initial,
immediate economic activities (jobs and income) generated by a project or
development. Direct impacts associated with the development coincide with the first
round of spending in the economy.
• The indirect effects (backward linkages): this takes into account the fact that the
supplying industries (such as construction related industries, catering industries,
transport industries, etc) will also have to purchase more inputs, employ more labour
and pay more wages, and that there will be a chain reaction or multiplier of effects
as a result of increased spending in the economy. In other words indirect impacts
are the production, employment and income changes occurring in other
businesses/industries in the community that supply inputs to the project industry.
• The induced effects (forward linkages): this takes into account the fact that the
increased household income leads to an increase in household expenditure and to
increases in national production. Furthermore, the project will pay large amounts of

Feasibility Study for Utilisation of Taung Dam Water 3.3
PWMA 10/C31/00/1408 Regional and National Economy July 2008
revenue to the different tiers of government, which in turn will increase overall
government expenditure in the economy. For instance, the induced effects arise
when employees who are working on the project spend their new income.
• The sum of the direct, indirect and induced effects is the total effect.
3.3 National and Regional Economic Impacts during construction
The following national and regional economic impacts (described hereunder) are
anticipated during the short-term construction phase:
• Stimulation of economy;
• Employment creation, decrease in local unemployment level and skills transfer;
• Business output/sales and increased standards of living;
• Government income and expenditure; and
• Inflow and outflow of temporary workers.
3.3.1. Stimulation of the economy
The construction of the infrastructure required for the provision of domestic water supply
will have a positive impact on the economy due to: increased financial spending in the
economy related to increased infrastructure investment, civil construction, mechanical
purchases, and increased expenditure by employees. This impact on the economy can be
manifested in terms of the sectoral impact on GDP.
In many instances goods do not reach the consumer via the market and it is also difficult
to calculate the value of these goods. As a rule therefore only the results of the activities,
which are intended to satisfy the needs of other people through trade, are considered to
form part of the GDP. If this is to be stated by way of formula, taking into account the
concept of value added, it can be put as follows: Gross value of production less value of
intermediate goods and services equates to gross value added. If the gross value added
of all the trading sectors is added together the GDP is obtained.
Change in gross domestic product essentially reflects the sum of wage income and
corporate profit generated in the study area as a result of an exogenous change in the
economy, in this case bulk water infrastructure.
In order to determine the increased financial spending in the economy the current
estimates of expenditure during construction were obtained.
Feasibility Study for Utilisation of Taung Dam Water 3.4
PWMA 10/C31/00/1408 Regional and National Economy July 2008
It is important to realise that the construction impact is experienced during the
construction period. Thus, it is only sustainable for the duration of the development, i.e.
two years. Once the development phase nears its end, the construction impact
diminishes.
The local area and its activities (businesses and shops, etc) are expected to be stimulated
economically, due to the increased spending expected from the increased salaries and
wages paid to employees during construction and service industries in the region will thus
benefit from the activity. This will have a knock-on effect on suppliers of goods and
services in other areas.
The capital investment during the construction is thus expected to have a positive impact
on the economy resulting in increased financial spending in the economy in terms of
construction related activities, the increased infrastructure investment as well as increased
expenditure from the construction workers. This positive impact is likely to be experienced
in terms of the increased markets for the sale of local goods to construction staff and
direct employment by construction contractors.
The exogenous change in the economy will impact different sectors in different ways, with
some sectors such as manufacturing, trade and finance and business services benefiting
more than others. Sectoral impacts could include:
• Agriculture - during the construction phase the agriculture sector will be stimulated due
to the need for minor primary inputs from the agriculture sector for the infrastructure
development (such as lubricants) as well as for the increased purchases from
construction workers;
• Mining - During the construction phase the mining sector will be stimulated due to the
need for construction materials such as quarry for sand and gravel, and materials
used in the production of cement, iron, steel, etc;
• Manufacturing – Positive stimulation. Possible industries to be stimulated include
construction vehicles, concrete and cement, iron, steel and machinery, including
pumps;
• Construction – this sector will receive a large boost during the construction phase of
the option which include canals, pipelines, weirs, reservoirs, etc as well as indirect
construction. As construction is fairly labour intensive it is expected that a large
number of employment opportunities will be created although only temporary in nature
during construction;
Feasibility Study for Utilisation of Taung Dam Water 3.5
PWMA 10/C31/00/1408 Regional and National Economy July 2008
• Trade- the trade sector includes retailers, wholesalers, restaurants and
accommodation establishments which are all expected to be stimulated mainly during
construction. The increase in people employed will lead to increased buying power in
the area which directly stimulates the wholesalers and retailers. Trade will be
stimulated by the large number of people either staying or moving around the area;
and
• Transport, finance and services: These sectors will be simulated mainly during the
construction phase through the increased number of people in the area.
The additional GDP arising from the capital investment during the construction phase of
the bulk water supply infrastructure could be approximately R60 million, approximately
half of which is due to the direct impact, R25 million due to the indirect impacts and R5
million due to the induced impacts. Approximately R5 million of this impact will accrue to
the North-West Province. During the construction phase the majority of the impact will be
felt in the construction, manufacturing, trade, and transport sectors.
The multiplier or spin-off effects associated with this economic contribution (namely capital
expenditure, salaries and wages, etc) include improved standards of living, decreased
dependence on pensions, increased disposable income and ability to purchase additional
goods and/or establish other business enterprises. Apart from having the potential to
create occupational opportunities, the proposed development could also stimulate
economic growth in the region by attracting other commercial activities. If this is the case,
indirect local benefits may accrue in the form of job opportunities in other sectors and
industries. The proposed development may also serve as a catalyst for the improvement
of services and infrastructure in the longer term.
3.3.2. Employment creation and skills transfer
During the construction phase, temporary employment will be created. The increased
temporary employment in the area during the construction phase will also result in
increased expenditure, which, in addition, will mean that more than just the proposed jobs
required for the construction will be created due to economic spin-offs that will result.
During and towards the end of the construction period, the temporary employment
contracts awarded need to be terminated. This could result in sudden loss of income,
wealth, new business sales, etc. The employees, surrounding community, businesses, etc
would all need to be informed of this from the start so that expectations are not created
and that the negative effects associated with the termination of temporary employment
contracts can be absorbed as far as possible.

Feasibility Study for Utilisation of Taung Dam Water 3.6
PWMA 10/C31/00/1408 Regional and National Economy July 2008
The unemployment rate of the economically active population within the communities in
the affected municipalities is currently high. The proposed development will thus bring
some relief to the high unemployment figures in the area during the construction phase.
Most of the indirect and induced jobs will be created in the manufacturing, finance and
business sector, mining, trade and accommodation sectors and transport sectors. During
the construction phase, local contractors and service providers need to be utilised as far
as practically possible.
The benefit of increased jobs in the area can also be translated into economic terms, and
the additional jobs would in essence result in additional income creation. This increase in
income in the area can be translated into specific impacts ranging from black economic
empowerment (BEE) to poverty alleviation depending on the procurement policy and the
construction technology applied. More previously disadvantaged people could be provided
with an opportunity to become involved in the formal economy and also provided with an
annual income that would place them in the financial position to acquire all the goods and
services that are required to maintain a basic level of living.
Total employment generation reflects the number of jobs created or lost as a result of the
exogenous change in the economy. A job is defined as one person employed for one
year. This does not mean that new job opportunities arise per year, but that new man
days of work arise each year some of which could be fulfilled by existing employees
others requiring new temporary employment, etc.
The proposed infrastructure development and mechanical manufacturing of infrastructure
requirements will lead to the creation of additional jobs to the approximate amount of
1,800 during the construction phase. The direct temporary employment opportunity during
the construction phase is approximately 600 jobs. Approximately 10% of the national
employment effect will accrue to the North West Province. The sectors mostly stimulated
by additional employment generation during the construction phase are the construction
sector, services and household sector and the manufacturing sector.
With an increase in employment, a definite transfer of skills will result. Skills development
is a requisite for human resource development, and will have a lasting impact on the
economy. Allied to the additional jobs created during the construction phase there will be
an element of skill acquisition. This skill acquisition is valuable in that people that have
acquired these skills will be able to search elsewhere for similar construction employment
after the completion of the construction phase, and will be better equipped to handle the
D.I.Y household jobs. It should however be noted that the skill acquisition will probably be

Feasibility Study for Utilisation of Taung Dam Water 3.7
PWMA 10/C31/00/1408 Regional and National Economy July 2008
limited to on the job training although skill acquisition is expected to take place since the
construction phase is estimated to last two years.
3.3.3. Business output/sales and increased standards of living
The increased employment expected with the construction of the bulk water infrastructure,
will impact positively upon the regional and local economy.
Increased employment is associated with increased income and consequently with
increased buying power in the area, thus leading to new business sales. With the
increased employment and a subsequent increase in monthly incomes, increased
business opportunities can be experienced. The economic benefits mostly include an
increase in trade such as local shops, restaurants, accommodation and transport
services. These increases in businesses are as a result of the following factors:
• Increased market size;
• Higher disposable incomes;
• Satisfaction of identified needs (such as building materials, or foodstuffs); and
• Increased consumer spending and increase entrepreneurial opportunities.
New Business Sales refers to the value of all inter- and intra-sectoral business sales
generated in the economy as a consequence of the introduction of an exogenous change
in the economy. Explained more simply, new business sales equates to additional
business turnover as a result of the introduction of a change in the economy.
Direct investment in the construction sector during the construction phase will yield new
business sales to the value of approximately R490 million for the bulk infrastructure.
Approximately R50 million of the total national effect is likely to accrue to the North West
Province. During the construction phase the sectors that will mostly be stimulated by new
business sales include the electricity and water sector, the construction sector, the
manufacturing sector, and the household sector.
As such it is evident that over and above the originally invested money during the
construction phase, a large amount of revenue is generated due to the multiplier effect in
the different sectors of the economy.
The sectors that will experience the highest demand for additional output are
manufacturing (i.e. manufacturing and supply of building materials), trade (i.e. supply of
Feasibility Study for Utilisation of Taung Dam Water 3.8
PWMA 10/C31/00/1408 Regional and National Economy July 2008
final goods and services), finance, real estate and business services (i.e. professional
services).
It is also anticipated that a positive local impact will be felt at Taung due to increased local
shopping and accommodation requirements during construction. The injection of
employment and money into the local community will be beneficial to the
towns/settlements as a whole. The increased employment expected with the
development, will also impact positively upon the regional and local economy. Increased
employment is associated with increased income and consequently with increased buying
powers in the area, thus raising the standards of living of the area. Given the current high
unemployment rate in the surrounding towns/settlements, the project therefore has the
potential to bring much needed economic relief to the local population.
With the increased employment and a subsequent increase in monthly income, increased
business opportunities can be experienced with the development. The economic benefits
that could be obtained include an increase in trade, and the development of new trade
such as local spazas, shops, stalls, etc as a result of the patronage of construction staff.
3.3.4. Government income and expenditure
The bulk water infrastructure can be seen as an economic injection to the area as it would
lead to increased government income.
The economic impacts will lead to fiscal impacts, which are changes in government
revenues and expenditures. For example, economic impacts on total business sales,
wealth or personal income can affect government revenues by expanding or contracting
the tax base. Due to the jobs that will be created as a result of the proposed development
as well as the increased business activity levels, the salaries and wages of those jobs
along with the increased turnover of the companies can be translated into increased
personal and business income tax.
In other words, government income will be increased as a result of the increase in tax it
will receive from the proposed construction of the bulk water infrastructure. The increased
government income from tax will mostly be as a result of increased economic activity.
Increased tax received by the government will be in the form of:
• Company tax;
• PAYE;
• UIF (Unemployment Insurance Fund);
• Skills development Levy (SDL); and

Feasibility Study for Utilisation of Taung Dam Water 3.9
PWMA 10/C31/00/1408 Regional and National Economy July 2008
• Rates and taxes.
The proposed bulk infrastructure can thus be seen as an economic injection into the area
as it would lead to increased government income. The development could thus lead to the
creation of other economic spin-offs that benefit the entire region. Local benefits could
accrue to the government through an increased tax base increasing the capacity of the
local municipality and other social and service support actions. In other words, the
increased income received by the government will enable increased spending locally. This
means that increased government services such as community facilities could be provided
by the increased income generated.
3.3.5. Inflow and outflow of temporary workers
Impacts of large-scale development projects tend to be closely associated with the
relocation (immigration) of project workers and their families to communities near the
project site. This will thus lead to a substantial local population growth, demands on local
services and infrastructure, fiscal problems for local governments, and increased
problems of social assimilation.
These problems are typically exacerbated by fluctuations in workforce size, which could
occur during the construction based on the different construction components and the
length of the construction period. The influx of people could be brought about by a number
of factors. Through its positive economic impacts, the construction phase can attract
squatters in search for employment (both directly and indirectly related to the project).
Squatter camps can have a number of environmental impacts, which in turn impact upon
the economy, such as an increase in crime, increase in STDs and related illnesses,
increased pressure on social facilities and bulk infrastructure, potential loss of power
amongst local traditional leaders, etc.
Key factors affecting the number of workers and dependents who move to the site include
the size of the project workforce, the magnitude of secondary employment effects, the
proportion of the jobs that are filled by local project workers (including daily commuters),
the extent to which non-local project workers are accompanied by their families, and the
size of those families.
In the event of imported workers entering the area during the construction phase, conflict
may arise with the local population due to different cultures, traditions and habits.
Imported workers may be relatively well paid compared to the local workforce around
towns and farms, which could lead to conflict.
Feasibility Study for Utilisation of Taung Dam Water 3.10
PWMA 10/C31/00/1408 Regional and National Economy July 2008
Therefore, an emphasis on use of local labour is suggested as the use of outside or
imported labour may have negative implications for the surrounding economic status quo.
The ‘outside’ persons could create a new social class with different behaviours and
lifestyles. Employment of a large outside workforce could lead to conflict between
‘outsiders’ and locals due to differences in culture and values, competition for employment
opportunities, a perception among local residents that facilities are being provided for
outsiders while their own needs are not being addressed, etc.
The accommodation of staff in the absence of their family members - has the potential to
result in more incidences of sexually transmitted diseases (STDs) and AIDS. In these
instances employees are away from home and are not accountable to family structures
that assist in providing the checks-and-balances often necessary for the control of sexual
promiscuity. In addition, the disposable income available to employees makes them an
attractive target for sex workers. Furthermore, local men and women may become
romantically involved with construction staff that have previously contracted STDs or
AIDS. These may all negatively impact the regional economy.
Increase in local population could also trigger indirect impacts such as a higher crime rate.
This will be impacted by the rate of influx of persons due to the construction activities.
Crime in the area is currently controlled by virtue of the fact that residents know each
other and are familiar with the comings-and-goings of their neighbours and fellow
residents. The in-migration of outsiders (including construction staff) will therefore dilute
the extent of familiarity within the area and undermine the role of familiarity as a system of
control. In addition, outsiders may not respect the judiciary roles of the traditional leaders
and the part that they play in controlling the extent of crime in the area.
3.4. National and Regional Economic Impacts during operation
The following national and regional economic impacts (described hereunder) are
anticipated during the long-term operation phase:
• Stimulation of economy;
• Employment creation, decrease in local unemployment level and skills transfer;
• Business output/sales and increased standards of living; and
• Government income and expenditure.

Feasibility Study for Utilisation of Taung Dam Water 3.11
PWMA 10/C31/00/1408 Regional and National Economy July 2008
3.4.1. Stimulation of the economy
The operation and maintenance of the infrastructure associated with the delivery of
domestic water supply will have a positive impact on the economy due to increased
financial spending in the economy, and increased expenditure by employees. During the
operation phase, GDP will be stimulated but to a far lesser degree than in the construction
phase due to far less jobs being created and far less expenditure. However, the operation
impact will be sustained for a longer period and the impacts associated are thus far more
sustainable.
Possible regional economic influences that may impact on the growth of the study area
during operation include:
• Regional development initiatives - the development policies of the North West
compared to other provinces as well as the status of the study area in the province;
• Agriculture- possible expansion of irrigation (although not as a direct result of the
infrastructure developed for the supply of domestic water); and
• Capital development projects – the study area will receive an economic boost from
employment of local labour and purchasing of supplies. The injection of capital in the
operation phase is however small in comparison to the value of the project.
The additional GDP arising from the operating expenditure during the operational phase is
approximately R400 000 per annum. This means that the economy will experience a
direct growth effect during the operation period of approximately R200 000, and an
indirect growth effect of approximately R150 000 and a relatively small induced effect of
R50 000. Furthermore, based on expected procurement, approximately R40 000 per
annum will accrue to the North-West Province. During the operation phase the sector
mostly stimulated by additional GDP generation is the water and electricity sector.
3.4.2. Employment creation, decrease in local unemployment level and skills transfer
Full-time employment during the operation of bulk water distribution and purification works
will have a permanent effect on the economy, although probably far less than during the
construction phase. Apart from the permanent directly created jobs there will be scope for
other jobs to be created by the local population due to spin-off effects in the economy as
well as due to stimulation of additional income generating activities consequent upon
greater water supply. Stated differently, during operation the access to potable water will
Feasibility Study for Utilisation of Taung Dam Water 3.12
PWMA 10/C31/00/1408 Regional and National Economy July 2008
also result in the avoidance of job losses due to current water supply not meeting
demands.
During the operation phase the project will lead to the creation of an additional 5 jobs per
annum approximately. Note that a job is defined as one person employed for one year. It
is relevant to note here that the operating expenditure impact is expected to be relatively
small and will most probably be absorbed by the existing management and maintenance
personnel. It is also assumed that most of the operating expenditure will be spent on the
maintenance of the facilities/infrastructure.
Apart from the permanent directly created jobs there will be scope for other
entrepreneurial jobs to be created by the local population. The majority of the indirect and
induced employment will be in the retail and trade sector. For instance, women can
engage in economic activity, household chores, obtain education rather than spend time
and energy collecting water – opportunity benefits of piped water. These are explained in
detail in the following sub-section relating to the economic value of increased domestic
water provision.
Transfer of skills during the operation/maintenance phase will probably take place but on
a far smaller and relatively insignificant level as permanent positions will probably be filled
by existing staff.
3.4.3. Business output/sales and increased standards of living
During operation, it is anticipated that fewer people will be employed than during the
construction, although persons will be permanently employed during operation. These
persons will experience a substantial and lasting increase in their standards of living. In
addition the increased income earned by permanent employees as well as the increased
income earned from the stimulation of income generating activities consequent upon
larger quantities of water supply will result in increased buying powers and hence an
increase in local business sales and standards of living.
During the operation phase the investment in the economy, associated with the
maintenance and operation of the infrastructure only, will generate new business sales to
the approximate value of R2 million per annum of which approximately R1 million is a
direct impact and the remaining is due to indirect and induced effects. Approximately
R240 000 of the total national effect is likely to accrue to the North West Province per
annum. During the operation phase the sectors that will mostly be stimulated by new
business sales include the electricity and water sectors, the household sector, the
manufacturing sector and the financial services sector.

Feasibility Study for Utilisation of Taung Dam Water 3.13
PWMA 10/C31/00/1408 Regional and National Economy July 2008
As such it is evident that over and above the annual investment during the operation
phase, additional revenue is generated due to the multiplier effect in the different sectors
of the economy.
3.4.4. Government income and expenditure
The operation and maintenance of the bulk water infrastructure can be seen as an
economic injection into the area as it would lead to increased government income.
The economic impacts will lead to fiscal impacts, which are changes in government
revenues and expenditures. During the operation phase, the expected permanent jobs per
annum will bring in a constant income to the government in the form of personal tax. In
addition company tax and VAT, other indirect taxes and services will also be a sustained
income for the government during the operation.
The operation and maintenance of the proposed bulk infrastructure can thus be seen as
an economic injection into the area as it would lead to increased government income. The
development could thus lead to the creation of other economic spin-offs that benefit the
entire region. Local benefits could accrue to the government through an increased tax
base increasing the capacity of the local municipality and other social and service support
actions. In other words, the increased income received by the government will enable
increased spending locally for a sustained long-term period.
3.5. Economic value of domestic water supply
The following economic impacts (described hereunder) are anticipated once the bulk
water supply infrastructure is operational and domestic water supply is provided to the
villages south-east of Taung Dam, Bogosing Water Supply area, and the Taung Water
Supply area:
• Stimulation of income generating activities and opening up area for development;
• Freeing up time from fetching water and obstacles for economic development;
• Decrease economic decline related to water shortages;
• Provide essential final good and opening up additional household end-uses;
• Decrease in poor health related economic burdens;
• Opening up opportunity for home gardening; and
• Freeing up water supply for other user sectors.

Feasibility Study for Utilisation of Taung Dam Water 3.14
PWMA 10/C31/00/1408 Regional and National Economy July 2008
3.5.1. Stimulation of income generating activities and opening up area for development
Currently the Taung Dam has spare capacity and the purpose of the project is to best use
the spare capacity of water. Water is a scarce resource and it can be reasoned that water
should be rationed to competing uses according to economic criteria or maximisation of
returns. However water is not a private good but a public or merit good since it is a scarce
natural resource consumed collectively and provision necessitates both government
intervention and finance. The price of water is thus not determined by the market forces of
supply and demand. Since the market mechanism is not functioning in the water market,
the price of water is not known. It is therefore necessary to determine the economic value
of water which will serve as a proxy for the market price of water. The value of water is
important in two distinct, albeit related roles:
• Firstly where the supply of water is insufficient in relation to the demand in certain
short-term circumstances such as severe drought, the value of water serves as a
proxy for a component of the price system in targeting water restrictions so as to
cause least harm; and
• Secondly, the financial resources spent on providing the appropriate level of water
supply in the long-term to consumers and the economic optimal level of development.
Demand from each water using sector must be viewed in relation to the total available
water supply. Sectors compete for available water supplies, but each sector’s continued
existence is partially dependent upon the output of other sectors and hence their need for
water. Sectors are thus economically interdependent and each is dependent upon water
availability. A shortage of water in a particular sector may indirectly restrict output of
several sectors.
It is however generally not economically feasible to develop and operate a water resource
system to meet all the sectoral demands at all times. This means that 100% of the
demand cannot be supplied for 100% of the time and shortfalls in the supply will occur
from time to time. If shortfalls occur frequently the supply will have a low assurance and
relatively few shortfalls represent a high assurance in supply. It is important here to note
that different types of user groups or categories will require a different assurance of
supply. Irrigation will typically be supplied at a lower assurance than water for domestic
and industrial purposes and water for strategic industries such as power generation will be
supplied at even a higher assurance. It is also logical to sub-divide the supply to irrigation
into different assurance levels, as permanent crops such as export grapes would require a
higher assurance than for example a cash crop.

Feasibility Study for Utilisation of Taung Dam Water 3.15
PWMA 10/C31/00/1408 Regional and National Economy July 2008
Since households need 100% assurance of water supply, the water of the Taung Dam
would be utilised to provide in primary domestic water needs only. Households supplied
with water in house need a guaranteed supply and it is thus not sensible to take some of
the water from the Taung Dam for other uses such as irrigation when some households
could suddenly have insufficient water for essential domestic use.
The higher supply of domestic water during operation could result in the stimulation of
economic activities reliant on water such as tourism related development, as well as a
stimulation of irrigation (indirectly due to freeing up water supply in other areas), industrial
and agricultural water users, and other economic activities. This will cause a permanent
economic upliftment in the area.
The Taung Dam is reportedly an attractive dam site and tourism developments are
already in place and underway. As the dam offers tourism and recreational opportunities,
the North West Parks and Tourism Board is in the process of establishing a protected
environment around the Taung Dam. This will mean additional job opportunities for local
people in the tourism sector. It is expected that the development of existing towns within
the area as service centres for tourism will be crucial in ensuring maximized use of
products and services from the area and avoiding leakages. This will ensure that tourism
development in the area is to the maximum benefit of the area.
Access to water could lead to economic spin-offs for the local community, particularly
women. Water is a holistic resources - water supply is not just about drinking water and
domestic use. Effective projects around the world have shown that water supply can also
be linked to income generating activities and local economic upliftment. Water is an
essential input in agriculture, and also in several manufacturing industries. Economic
development opportunities in sectors that are heavily dependent upon water to provide
their services include:
• Laundry and cleaning facilities;
• Sport related clubs and facilities;
• Amusement and recreation services;
• Hotels and lodging places;
• Eating and drinking establishments;
• Car washes;
• Hair dressers and other personal services;
• Butchery;

Feasibility Study for Utilisation of Taung Dam Water 3.16
PWMA 10/C31/00/1408 Regional and National Economy July 2008
• Farming: horticulture and livestock and irrigation; and
• Food and beverages.
3.5.2. Free up time from fetching water and obstacles to economic development
In textbook economics, entrepreneurs use resources to produce goods and services that
they have to sell at a profit in order to survive. The owners of those resources earn an
income by either selling or hiring out their resources or by using them themselves in
production. Without productive resources there can be no economic activity. Some of the
most important resources available to people are land, water, capital (finance) and human
skills. In the study area (and South Africa as a whole) there has been a long history of
proscribed access to these resources. This has affected rural people and rural areas in
many different ways, and lies at the heart of the ‘rural problem’.
Access to potable water remains the most critical and worrying constraint for many rural
people, and many of them spend several hours a day securing supplies. Women (and
children) are mostly affected by having to walk longer distances to collect smaller amounts
of water. The time lost is invaluable to most women and children.
The provision of potable water for domestic use will have profound and far reaching
impacts on the population and will release them for spending several hours a day securing
supplies to being able to search for work, undertake education, etc. All of these will have
profound effects on the regional economy.
Economics is essentially about the way in which tradeoffs, seen from a human welfare
point of view, influence decision-making. Tradeoffs are always made when making
decisions about scarce resources, and the funds that are expended on ensuring access to
potable water represent a scarce resource. Thus in allocating the water to domestic use,
the opportunity to use them for another use is foregone, and the value of this other use is
the opportunity cost of putting them to the first use.
Key aspects to be noted in supply of domestic water are:
• The element of equity: addressing the past inequity between communities in service
access which encompasses the social component of water use;
• The element of sustainability: the environmental need for water (as well as that of
downstream users including neighbouring states); and

Feasibility Study for Utilisation of Taung Dam Water 3.17
PWMA 10/C31/00/1408 Regional and National Economy July 2008
• Economic efficiency, cost recovery, user-payments and private sector involvement:
water is seen as an economic good, to be used in the most efficient setting possible
to promote the overall economic development of the country.
The regional economic effects of potable water provision have most obviously been noted
under the previous system where water ownership was tied to ownership of land, and as a
result the majority of South Africans were “condemned to a life of poverty, insecurity and
contentious exposure to diseases that would otherwise be avoidable. With access to
potable water the obstacles in the development of the following impoverished
communities will be addressed:
• 14 villages south-east of Taung Dam who currently obtain all their water from
rudimentary borehole schemes;
• 6 villages being supplied by the Bogosing Water Supply which is highly inefficient and
turbidity in the water is problematic for the communities; and
• 11 villages in the Taung area currently being supplied by the Pudimoe Water Supply
Scheme with insufficient capacity for future water demand.
Unemployment is high in these villages and many people rely on income from family
members working in the cities. Many communities struggle to find water for domestic use.
Development opportunities in the area have been few, hampered inter alia by a lack of
water. The provision of potable water to these communities will also result in a key
regional economic impact namely the improved spatial distribution of water and the
matching of supply with demand. This project will thus improve the quality of life of the
poor and will enable keeping intact the onslaught in the fight against poverty.
Furthermore, access to domestic water includes water that people use in their homes for
things such as cooking, bathing, drinking and removing household waste and for outdoor
purposes including lawn watering, car-washing and swimming pools. Shortage of water
would mean that households would probably have to eliminate some or all outdoor water
use, which could have implicit and explicit economic costs including losses to the
horticultural and landscaping industry.
3.5.3. Decrease economic decline related to water shortages
The effects of water shortages can be social or economic. Distinctions between the two
are both semantic and analytical in nature – more so analytic in the sense that social
impacts are much harder to measure in quantitative terms. Nevertheless, social effects

Feasibility Study for Utilisation of Taung Dam Water 3.18
PWMA 10/C31/00/1408 Regional and National Economy July 2008
associated with drought, water shortages or limited access to water (as in this case)
usually have close ties to economic impacts. For example, they might include:
• Demographic effects such as changes in population -which impact upon the
economy;
• Disruptions in institutional settings including activity in schools and government;
• Conflicts between water users such as farmers and urban consumers;
• Health related low flow problems (e.g., cross connection contamination, diminished
sewage flows, increased pollutant concentrations);
• Mental and physical stress (e.g., anxiety, depression, domestic violence);
• Loss of aesthetic and property values;
• Reduced recreational opportunities; and
• Decrease in demand for workers due to unmet water needs which could affect
migration patterns in a region.
However, the notion that water supply contributes to economic growth and development is
highly intuitive. It is known that many of the world’s major cities owe their origin to their
location along coasts or rivers where water-borne transportation was facilitated. But, the
relevant question is whether an increment in water availability would generate an
increment in economic activity today, and how much. Water projects have long been
advocated for their claimed contribution to regional economic development. However
investment in water supply does not automatically guarantee economic growth. But this
does not mean that there is never an economic case for investing in water supply. While
water does not automatically generate growth, it may be the case that areas which persist
in lacking an adequate water supply (regardless of whether or not they started out with
adequate water) will not flourish economically. For example, one can expect that people
will eventually leave those areas and migrate to other areas that do have an adequate
water supply. Thus, lack of water could be a sufficient condition for economic decline or,
to put it another way, water may be necessary, but not sufficient for economic growth.
3.5.4. Provide essential final good and opening up additional household end uses
Water is essential for life – human, animal, or plant. In economics, there is a concept, also
called essentialness that formalizes this notion. The concept can be applied either to
something that is an input to production or to something that is directly enjoyed by people

Feasibility Study for Utilisation of Taung Dam Water 3.19
PWMA 10/C31/00/1408 Regional and National Economy July 2008
as a consumption commodity. In the case of an input, if an item has the property that no
production is possible when this input is lacking, the item is said to be an essential input.
In the case of a final good, if it has the property that no amount of any other final good can
compensate for having a zero level of consumption of this commodity, then it is said to be
an essential commodity. Water obviously fits the definition of an essential final good:
human life is not possible without access to water.
In addition to being essential for human life, water contributes in important ways to the
enjoyment of the satisfactions of life. Consequently, there are many other residential end
uses of water besides its use for drinking. Water consumption has grown over time
through the steady accretion of end uses, each representing the discovery of a new way
to employ water for people’s use and enjoyment. When a piped water supply first became
available, the initial household uses were the same ones that had existed when family
members had to fetch water from an external source – drinking, cooking, hand washing,
and limited bathing. As time passed, many other uses were found – tubs for bathing,
water borne sanitary waste disposal, outdoor landscape and garden watering, automatic
clothes washers, swimming pools, automatic dish washers, car washing, garbage
disposal, indoor evaporative cooling, hot-tubs, lawn sprinklers, etc. The result has been a
constantly rising trajectory of per capita household water use.
It is common to talk of the value of water as though it were a single, homogenous
commodity. This is obviously false: water has many dimensions besides just quantity.
These include: (a) location, (b) timing, (c) quality, and (d) variability/uncertainty. To a user,
one litre of water is not necessarily the same as another litre of water if it is available at a
different location, at a different point in time, with a different quality, or with a different
probability of occurrence.
There are numerous ways in which an increment in water might produce benefits, whether
to those who use the water directly or to others. Examples include: the use of water for
agricultural or industrial production, its use for hydropower or for navigation, residential
use, water based recreation, or aquatic habitat.
It is however important to note that it is not the responsibility of the Department of Water
Affairs and Forestry to provide water to individual households. This remains the
responsibility of the relevant local authorities. The project will include reservoirs from
which local authorities will be able to source water for domestic reticulation. Importantly,
the Department should however engage with the relevant stakeholders to ensure the
required plans and programmes are in place. The Department should also support

Feasibility Study for Utilisation of Taung Dam Water 3.20
PWMA 10/C31/00/1408 Regional and National Economy July 2008
municipalities in securing funding for water services infrastructure. This is an important
aspect in terms of successful cooperative governance.
3.5.5. Decrease in poor health related economic burdens
The lack of access to adequate water supply brings the risk of ill-health or even death and
undermines people’s dignity. Ill-health and death have a profound impact on the regional
and national economy.
The access to an assured supply of domestic water could be sufficient to respond to
special needs for the sick, particularly relevant in the light of the HIV/AIDS crisis. The
positive impact which providing a workable amount of clean water will have on the overall
health of the population far outweighs the direct financial costs of providing the water.
However, for water supply to be effective in improving health, interactive/participatory
health and hygiene education is critical.
Women and children are the primary managers of water at household level and have to
bear the burden of increased sickness in the household associated with waterborne
diseases. Women therefore have the most to gain from a successful water project.
Women are also primarily responsible for health and hygiene, so their meaningful
involvement is equally important.
3.5.6. Open-up opportunity for home gardening
The access to water could also enable water for home-grown vegetables and micro
agriculture. Micro agriculture can be described as farming on a small scale incorporating
irrigated community gardens, food plots and homestead based livestock enterprises.
When potable water supply is made available to the aforementioned communities, micro-
agriculture has the potential to substantially alter the water usage patterns in the study
area if implemented on a large scale. The broad concept of micro-agriculture in an urban
or peri-urban area has been referred to as agro-urban development which embraces the
following key components:
• The identification and allocation of an area or areas adjacent to or within an informal
settlement or an area demarcated for informal settlement for the purposes of irrigated
food production or other appropriate forms of agriculture. The selected site should
have soils that are appropriate for irrigated agriculture;
• The supply of affordable water for irrigation;

Feasibility Study for Utilisation of Taung Dam Water 3.21
PWMA 10/C31/00/1408 Regional and National Economy July 2008
• The identification and development of such a site should form part of the basic
skeleton of the informal settlement;
• The development of such an area should be undertaken with maximum involvement
and commitment of the community itself with emphasis on community based self-help
development;
• Food production for home consumption and the sale of surpluses for cash generation;
and
• Production can be by individuals, food garden clubs or co-operatives from community
gardens or individually owned food-plots or even the smaller individual homestead
gardens.
It should, however, be noted that water usually used for irrigation is cheaper than urban
water supply. The reason is the difference in costs. Water used for agriculture does not
need to be treated. Enabling water usage for home gardening would require two separate
supply networks, one for potable water supply via the water purification works. The
second system is the direct supply for garden water via a separate reticulation system. In
other words raw water used for gardening and potable water used for consumption
purposes. This two-tier system would however be too costly and it won’t be feasible to
establish a separate physical infrastructure and capital for the establishment of a separate
raw water supply to households. The result will be that home gardens, will require utilising
more expensive treated domestic water and thus use thereof for other than domestic uses
will result in less assurance for domestic supply.
Opportunities for home gardening are thus limited to the development of home-grown
vegetables for own consumption making use of domestic water supply.
3.5.7. Freeing up water supply for other user sectors
The Taung Dam was initially constructed to augment supply to the Taung Irrigation
Scheme. However, currently there is no infrastructure to convey water from the Taung
Dam to the irrigation area. A need within the study area exists for irrigation water supply.
In the late 1970’s the existing flood irrigation scheme in the Taung area was converted
into a centre pivot scheme. Through the redesign activities, 175 households were
excluded and have been waiting since the 1970’s for restitution. The re-constituted flood
irrigation scheme was designed on the basis of 10 ha per person, thus the expectations of
these 175 individuals are for similar allocations. It is thus considered by the local people
that the Taung Dam will be the source of water for this expansion.

Feasibility Study for Utilisation of Taung Dam Water 3.22
PWMA 10/C31/00/1408 Regional and National Economy July 2008
However the water from the Taung dam has been identified as being best put to use for
domestic needs. However, according to the Existing and Proposed Infrastructure Study
as part of this feasibility study, if water from the Taung Dam is used to supply the
Bogosing area, then Bogosing’s allocation from the Vaalharts Canal Scheme could be
transferred to Vryburg to augment the water demand in this area. Furthermore, if water
from the Taung Dam is used to augment supply to the Taung area, then water from the
Vaalharts Canal Scheme could possibly be freed up to be transferred to Vryburg to
augment the water demand in this area.
In other words, using the water from the Taung Dam to augment water to the Bogosing
area and the Taung area could possibly free up water to be transferred to Vryburg to
augment water demand in that area. The exact water sector beneficiary of this possibility
is however not known.
It is however important to note that, separate from this study, Vaalharts Water is currently
working with the Department of Agriculture to compile a business plan for the upgrading of
the entire Vaalharts Irrigation Scheme’s canal network, including the main canal, side
canals and drainage canals. This business plan should be submitted before the end of
2008 for construction to commence early in 2009. In short, the provision of water for
irrigation, should this be implemented, would have far reaching regional economic effects.
Water security however is a pressing need for the irrigation sector as without it, farming is
uneconomic. In collaboration with farmers and other stakeholders a look at alternative
crops of high value that will increase profitability in the Vaalharts scheme has already
been initiated to empower black farmers and contribute to sustainable jobs in the area.
Feasibility Study for Utilisation of Taung Dam Water 3.23
PWMA 10/C31/00/1408 Regional and National Economy July 2008
BIBLIOGRAPHY
Department: Water Affairs and Forestry, South Africa, 2007. Feasibility Study for Utilisation of Taung Dam Water: Existing and Proposed Infrastructure: prepared by Kwezi V3 Engineers
Department: Water Affairs and Forestry, South Africa, 2007. Feasibility Study for Utilisation of Taung Dam Water: Water demand and use: prepared by WRP Consulting Engineers
Greater Taung Local Municipality, 2006. Reviewed Integrated Development Plan. 2006/2007
Naledi Local Municipality, 2006. Integrated Development Plan Review 2006/2007.
Phokwane Local Municipality, 2006. Integrated Development Plan.
Stats SA, 2001. Census 2001
Stats SA, 2007. Community Survey 2007
Quantec database, 2007.
Urban Dynamics Town and Regional Planners, 2006. Spatial Development Framework of Phokwane Local Municipality.

0.90% 57 356 Year STUDY AREA PHOKWANE LM NALEDI LM LM GREATER TAUNG 183 313 1996 2.80% 264 077 5.20% 31 045 2.80% 53 921 2.35% 179 111 1995 Growth 0.40% 185 948 1999 1.00% 277 262 3.50% 35 391 1.00% 56 772 0.50% 185 099 1998 1.10% 274 277 3.80% 34 082 1.20% 56 117 0.60% 184 078 7 199 1.10% 271 385 4.30% 32 664 1.30% 55 408 0.42% AREA Persons Growth Persons Growth Persons Growth Persons 36 614 3.20% 279 918 0.90% 2000 186 651 0.30% 57 893 0.70% 37 773 2.90% 282 317 0.70% 2001 187 119 0.10% 58 312 0.60% 38 873 2.60% 284 304 0.50% 2002 187 291 0.00% 58 678 0.40% 39 887 2.40% 285 856 0.40% 2003 187 298 - 0.20% 58 941 0.30% 40 833 2.10% 287 072 0.30% 2004 187 000 - 59 114 -
Feasibility Study for Utilisation of Taung Dam Water
PWMA 10/C31/00/1408 Regional and National Economy July 2008
Project Name: FEASIBILITY STUDY FOR UTILISATION OF TAUNG DAM WATER
Authors: Russell Aird (Kayamandi Development Services)
Title: REGIONAL AND NATIONAL ECONOMY
DWAF Report No: P WMA 10/C31/00/1408
Status of Report: FINAL
First Issue: June 2008
Final Issue: July 2008
Consultants:
Kwezi V3 Engineers in association with Kayamandi Development Services, WRP Consulting Engineers, Golder Associates, WSM Leshika, DMM Development Consultants
Approved for Consultants:
…………………………………………
A J Smook Study Leader
DEPARTMENT: WATER AFFAIRS AND FORESTRY Directorate: Options Analysis Approved for the Department: Water Affairs and Forestry by:
…………………………………………………
P Pyke Chief Engineer: Options Analysis (Central) (Project Manager)
…………………………………………………
L S Mabuda Director: Options Analysis

Feasibility Study for Utilisation of Taung Dam Water (i)
PWMA 10/C31/00/1408 Regional and National Economy July 2008
LIST OF REPORTS
REPORT NO DESCRIPTION REPORT NAME
P WMA 10/C31/00/0408 Main Feasibility Report FEASIBILITY STUDY FOR UTILIZATION OF TAUNG DAM WATER: MAIN REPORT
P WMA 10/C31/00/0508 Supporting Report 1 DEMOGRAPHICS
P WMA 10/C31/00/0608 Supporting Report 2 WATER DEMAND AND USE
P WMA 10/C31/00/0708 Supporting Report 3 YIELD AND SYSTEM ANALYSIS
P WMA 10/C31/00/0808 Supporting Report 4 GROUNDWATER RESOURCES
P WMA 10/C31/00/0908 Supporting Report 5 IRRIGATION
P WMA 10/C31/00/1008 Supporting Report 6 WATER DEVELOPMENT AND SUPPLY PLANS
P WMA 10/C31/00/1108 Supporting Report 7 WATER QUALITY AND POLLUTION
P WMA 10/C31/00/1208 Supporting Report 8 EXISTING AND PROPOSED INFRASTRUCTURE
P WMA 10/C31/00/1308 Supporting Report 9 CONVEYANCE SYSTEM SCENARIOS AND ECONOMIC ANALYSIS
P WMA 10/C31/00/1408 Supporting Report 10 REGIONAL AND NATIONAL ECONOMY
P WMA 10/C31/00/1508 Supporting Report 11 EIA AND PUBLIC PARTICIPATION
REFERENCE
This report is to be referred to in bibliographies as:
Department: Water Affairs and Forestry, South Africa, 2007. Feasibility Study for Utilisation of Taung Dam Water: Regional and National Economy: prepared by Kayamandi Development Services (Pty) LTD.
Report No.: P WMA 10/000/00/0407/10
Project No.: WP8950
Project File: 14/2/C300/2/2

Feasibility Study for Utilisation of Taung Dam Water (i)
PWMA 10/C31/00/1408 Regional and National Economy July 2008
EXECUTIVE SUMMARY
Naledi local municipality has consistently been the highest GGP contributor in the study area
followed by Phokwane local municipality, and Greater Taung local municipality. Naledi Local
Municipality experienced the highest average annual GGP growth rate of all the three
municipalities in the study area on par with that of the country as a whole between the ten-year
period from 1995 to 2005. However, the economy of the Greater Taung Local Municipality only
grew at nearly a quarter than that of the country as a whole and Phokwane Local Municipality
experience growth at nearly half than that of the country as a whole. The study area, mostly
Phokwane and Greater Taung Local Municipalities are thus areas with relatively low growth
compared to the country as a whole. The study area also has a small economy in relation to its
GGP contribution to the Districts and Provinces in which they are situated. Unemployment is also a
major problem in the area, hence the low GGP contribution, which serves as fertile ground for
other social problems that hinder economic development and social well being. Many people in the
area are uneducated, or have low level of skills that are incompatible with the desired level of
economic activity in the municipality. Those who are employed are usually employed in low-income
industries such as farm workers or domestic workers. There are very few professional workers in
the area. The result is that a large portion of the population has limited to no income.
This area will thus benefit from economic injection in the form of this proposed bulk water
infrastructure development. The following regional and national economic impacts are foreseen
should the demand for increased water be met:
• Stimulation of economy: The potential economic benefits that are perceived include:
increased financial spending in the economy, increased infrastructure investment, and
increased expenditure by employees. The additional GDP arising from the capital investment
during the construction phase of the bulk water supply infrastructure could be approximately
R60 million. Approximately R5 million of this impact will accrue to the North-West Province.
The additional GDP arising from the operating expenditure during the operational phase is
approximately R400 000 per annum. Furthermore, based on expected procurement,
approximately R40 000 per annum will accrue to the North-West Province.
• Employment and decrease in local unemployment level: Increased employment is expected
in the economy during construction and operation of the bulk water infrastructure. With an
increase in employment, a definite transfer of skills will result. The proposed infrastructure
development and mechanical manufacturing of infrastructure requirements will lead to the
creation of additional jobs to the approximate amount of 1,800 during the construction phase.

Feasibility Study for Utilisation of Taung Dam Water (ii)
PWMA 10/C31/00/1408 Regional and National Economy July 2008
During the operation phase the project will lead to the creation of an additional approximately
5 jobs per annum. Note that a job is defined as one person employed for one year.
• An increase in new business sales and standard of living: The increased employment
expected, will impact positively upon the regional and local economy. Increased employment
is associated with increased income and consequently with increased buying power in the
area, thus leading to new business sales to accommodate the new demand for services and
goods required. Direct investment in the construction sector during the construction phase
will yield new business sales to the value of approximately R490 million for the bulk
infrastructure. During the operating phase the investment in the economy, associated with
the maintenance and operation of the infrastructure only, will generate new business sales to
the approximate value of R2 million per annum.
• Increased government income: the supply of water can be seen as an economic injection to
the area as it would lead to increased government income. Local benefits could accrue to the
government through an increased tax base and increasing the capacity of the local
municipality and other social and service support actions.
• Inflow and outflow of temporary/external workers: Local socio-economic impacts of large-
scale development projects tend to be closely associated with the relocation (immigration) of
project workers and their families to communities near the project site. The large direct
employment will mean that a substantial amount of external workforce is required. This will
thus lead to a substantial local population growth, demands on local services and
infrastructure, fiscal problems for local governments, and increased problems of social
assimilation. Therefore, an emphasis on use of local labour is suggested as the use of
outside or imported labour may have negative implications for the surrounding economic
status quo.
• Stimulation of income generating activities and opening up area for development: Since
households need 100% assurance of water supply, the water from the Taung Dam would be
utilised to provide in primary domestic water needs only. The higher supply of domestic water
during operation could result in the stimulation of economic activities reliant on water such as
tourism related development, laundry and cleaning facilities, sport related clubs and facilities,
amusement and recreation services, hotels and lodging places, eating and drinking
establishments, car washes, hair dressers and other personal services, butchery, farming:
horticulture and livestock, food and beverages and others.
• Free up time from fetching water and obstacles to economic development: Water is one of
the most important resources to people. Access to this scarce resource remains the most

Feasibility Study for Utilisation of Taung Dam Water (iii)
PWMA 10/C31/00/1408 Regional and National Economy July 2008
critical and worrying constraint for many rural people, and many of them spend several hours
a day securing supplies. Women (and children) are mostly affected by having to walk longer
distances to collect smaller amounts of water. The time lost is invaluable to most women and
children. The provision of water will release women and children from spending several
hours a day securing supplies to being able to search for work, undertake education, etc. All
of these will have profound effects on the regional economy. With access to potable water
the obstacles in the development of the following impoverished communities will be
addressed: 14 villages south-east of Taung Dam, 6 villages being supplied by the Bogosing
Water Supply, and 11 villages in the Taung area. The provision of domestic water will also
improve the spatial distribution of water and enable improved matching of supply with
demand.
• Decrease economic decline related to water shortages: Water projects have long been
advocated for their claimed contribution to regional economic development. However
investment in water supply does not automatically guarantee economic growth. While water
does not automatically generate growth, it may be the case that areas which persist in
lacking an adequate water supply (regardless of whether or not they started out with
adequate water) will not flourish economically, people will eventually leave those areas and
migrate to other areas that do have an adequate water supply. Thus, lack of water could be a
sufficient condition for economic decline or, to put it another way, water may be necessary,
but not sufficient for economic growth.
• Provide essential final good and opening up additional household end-uses: Water obviously
fits the definition of an essential final good as human life is not possible without access to
water. In addition to being essential for human life, water contributes in important ways to the
enjoyment of the satisfactions of life. Consequently, there are many other residential end
uses of water besides its use for drinking. When a piped water supply first became available,
the initial household uses were the same that had existed when family members had to fetch
water from an external source – drinking, cooking, hand washing, and limited bathing. As
time passed, many other uses came up – tubs for bathing, outdoor landscape and garden
watering, automatic clothes washers, swimming pools, automatic dish washers, car washing,
garbage disposal, indoor evaporative cooling, hot-tubs, lawn sprinklers, etc.
• Decrease in poor health related economic burdens: The lack of access to adequate water
supply brings the risk of ill-health or even death and undermines people’s dignity. Ill-health
and death have a profound impact on the regional and national economy. The positive
impact which providing a workable amount of clean water will have on the overall health of
the population far outweighs the direct financial costs of providing the water. Women

Feasibility Study for Utilisation of Taung Dam Water (iv)
PWMA 10/C31/00/1408 Regional and National Economy July 2008
therefore have the most to gain from a successful water project since they are primarily
responsible for health and hygiene.
• Open-up opportunity for home gardening: The access to water could also enable water for
home-grown vegetables and micro agriculture. It should, however, be noted that water
usually used for irrigation is cheaper than urban water supply. The reason is the difference in
costs. Water used for agriculture does not need to be treated. Enabling water usage for
home gardening would require two separate supply networks, one for potable water supply
via the water purification works. This two-tier system would however be too costly and thus
not possible to establish separate physical infrastructure and capital for the establishment of
a separate hard water supply to households. The result will be that home gardens will require
utilising more expensive treated domestic water and thus use thereof for other than domestic
uses will result in lower assurance for domestic supply. Opportunities for home gardening are
thus limited to the development of home-grown vegetables for own consumption making use
of domestic water supply.
• Freeing up water supply for other user sectors: The Taung Dam was initially constructed to
augment supply to the Taung Irrigation Scheme. However, currently there is no infrastructure
to convey water from the Taung Dam to the irrigation area. A need within the study area
exists for irrigation water supply. However the water from the Taung Dam has been identified
as being best put to use for domestic needs. However, using the water from the Taung Dam
to augment water to the Bogosing area and the Taung area could possibly free up water to
be transferred to Vryburg to augment water demand in that area. The exact water sector
beneficiary of this possibility is however not known. With regards to water for the irrigation
sector, it should be known that, separate from this study, Vaalharts Water is currently
working with the Department of Agriculture to compile a business plan for the upgrading of
the entire Vaalharts Irrigation Scheme’s canal network.

Feasibility Study for Utilisation of Taung Dam Water (v)
PWMA 10/C31/00/1408 Regional and National Economy July 2008
FEASIBILITY STUDY FOR UTILISATION OF TAUNG DAM
WATER
Table of Contents
PAGE
EXECUTIVE SUMMARY ...............................................................................................................(I)
TABLE OF CONTENTS................................................................................................................(v)
1. INTRODUCTION.............................................................................................................. 1.1
1.1. BACKGROUND OF STUDY ................................................................................................. 1.1
1.2. STUDY AREA .................................................................................................................... 1.1
1.3. PROPOSED INFRASTRUCTURE DEVELOPMENT: TAUNG DAM PURIFICATION WORKS ...... 1.2
2. REGIONAL ECONOMIC PROFILE.................................................................................. 2.1
2.1. GROSS GEOGRAPHIC PRODUCT ...................................................................................... 2.1
2.1.1. GGP Per Sector Of Naledi Local Municipality ................................................................... 2.6
2.1.2. GGP Per Sector Of Phokwane Local Municipality............................................................. 2.9
2.1.3. GGP Per Sector Of Greater Taung Local Municipality .................................................... 2.13
2.2. EMPLOYMENT................................................................................................................. 2.16
2.3. INCOME DISTRIBUTION................................................................................................... 2.20
2.4. LEVEL OF EDUCATION .................................................................................................... 2.22
2.5. CONCLUSION.................................................................................................................. 2.23
3. REGIONAL AND NATIONAL ECONOMIC IMPACTS ..................................................... 3.1
3.1 IMPACT ASSESSMENT ASSUMPTIONS .............................................................................. 3.1
3.2 IMPACT ASSESSMENT TECHNIQUE FOR QUANTIFICATION OF ECONOMIC IMPACTS........ 3.1
3.3 NATIONAL AND REGIONAL ECONOMIC IMPACTS DURING CONSTRUCTION ...................... 3.3
3.3.1. Stimulation Of The Economy ............................................................................................ 3.3
3.3.2. Employment Creation, Decrease In Local Unemployment Level And Skills Transfer ........ 3.5

Feasibility Study for Utilisation of Taung Dam Water (vi)
PWMA 10/C31/00/1408 Regional and National Economy July 2008
3.3.3. Business Output/Sales And Increased Standards Of Living.............................................. 3.7
3.3.4. Government Income And Expenditure .............................................................................. 3.8
3.3.5. Inflow And Outflow Of Temporary Workers....................................................................... 3.9
3.4. NATIONAL AND REGIONAL ECONOMIC IMPACTS DURING OPERATION ........................... 3.10
3.4.1. Stimulation Of The Economy .......................................................................................... 3.11
3.4.2. Employment Creation, Decrease In Local Unemployment Level And Skills Transfer ...... 3.11
3.4.3. Business Output/Sales And Increased Standards Of Living............................................ 3.12
3.4.4. Government Income And Expenditure ............................................................................ 3.13
3.5. ECONOMIC VALUE OF DOMESTIC WATER SUPPLY ......................................................... 3.13
3.5.1. Stimulation Of Income Generating Activities And Open Up Area For Development ........ 3.14
3.5.2. Free Up Time From Fetching Water And Obstacles To Economic Development ............ 3.16
3.5.3. Decrease Economic Decline Related To Water Shortages ............................................. 3.17
3.5.4. Provide Essential Final Good And Opening Up Additional Household End-Uses............ 3.18
3.5.5. Decrease In Poor Health Related Economic Burdens..................................................... 3.20
3.5.6. Open-Up Opportunity For Home Gardening.................................................................... 3.20
3.5.7. Freeing Up Water Supply For Other User Sectors .......................................................... 3.21
BIBLIOGRAPHY .......................................................................................................................... 23

Feasibility Study for Utilisation of Taung Dam Water (vii)
PWMA 10/C31/00/1408 Regional and National Economy July 2008
LIST OF ABBREVIATIONS
BD Bophirima District
DWAF Department: Water Affairs and Forestry
GTLM Greater Taung Local Municipality
FBD Frances Baard District
LMI Local Municipality
NLM Naledi Local Municipality
PLM Phokwane Local Municipality
NC Northern Cape
NW North West
RSA Republic of South Africa

Feasibility Study for Utilisation of Taung Dam Water 1.1
PWMA 10/C31/00/1408 Regional and National Economy July 2008
1. INTRODUCTION
1.1. Background of Study
The Taung Dam is a rollcrete dam located on the Harts River upstream of the Vaalharts
Irrigation Scheme in the Lower Vaal System. A recent survey indicated that the capacity
of the dam at full supply level is 62.97 million m3. The Taung Dam was constructed to
augment supply to the Taung Irrigation Scheme, but there is currently no infrastructure to
convey water from the Taung Dam to the irrigation area.
As a result, the Taung Dam is at present not utilised and the purpose of the feasibility
study was to establish if the resource could be economically used for water supply,
irrigation or other purposes within the project area.
Downstream from the Taung Dam the Spitskop Dam collects return flows from the Vaal-
Harts Irrigation Scheme, as well as runoff from the upstream catchments which has not
been utilised by existing developments. Surplus water is available in Spitskop Dam but is
of poor quality.
The project area extends over the whole of Taung Dam catchment and the Vaal-Harts
River system and the study took existing and planned regional development of the area
into account. Peri-urban areas around Greater Taung are currently served only with
groundwater, but in future both surface and groundwater resources will be required to
satisfy the increasing demand.
The purpose of this report, prepared by Kayamandi Development Services (Pty) Ltd, is to
provide the impacts of the regional and national economy from the utilisation of the Taung
Dam Water.
1.2. Study Area
The study area extends over the whole Taung Dam catchment and the Vaal-Harts River
System and includes the Naledi Local Municipality (NLM), Greater Taung Local
Municipality (GTLM) and Phokwane Local Municipality (PLM). The former two
municipalities form part of the Bophirima District Municipality in the North-West Province
and the latter forms part of the Frances Baard District Municipality in the Northern Cape.
Urban centres in the region include Vryburg and Stella in Naledi, Pudimoe and Taung
Station in Greater Taung, with Pampierstad, Hartswater and Jan Kempdorp in Phokwane.
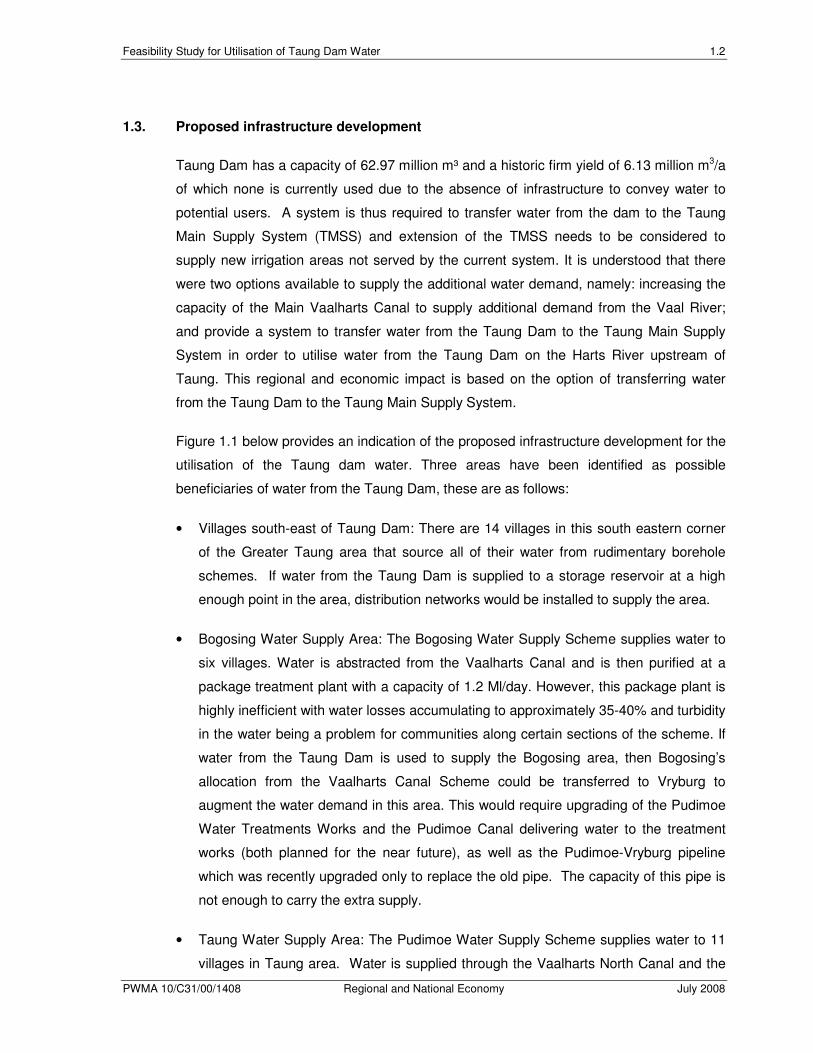
Feasibility Study for Utilisation of Taung Dam Water 1.2
PWMA 10/C31/00/1408 Regional and National Economy July 2008
1.3. Proposed infrastructure development
Taung Dam has a capacity of 62.97 million m³ and a historic firm yield of 6.13 million m3/a
of which none is currently used due to the absence of infrastructure to convey water to
potential users. A system is thus required to transfer water from the dam to the Taung
Main Supply System (TMSS) and extension of the TMSS needs to be considered to
supply new irrigation areas not served by the current system. It is understood that there
were two options available to supply the additional water demand, namely: increasing the
capacity of the Main Vaalharts Canal to supply additional demand from the Vaal River;
and provide a system to transfer water from the Taung Dam to the Taung Main Supply
System in order to utilise water from the Taung Dam on the Harts River upstream of
Taung. This regional and economic impact is based on the option of transferring water
from the Taung Dam to the Taung Main Supply System.
Figure 1.1 below provides an indication of the proposed infrastructure development for the
utilisation of the Taung dam water. Three areas have been identified as possible
beneficiaries of water from the Taung Dam, these are as follows:
• Villages south-east of Taung Dam: There are 14 villages in this south eastern corner
of the Greater Taung area that source all of their water from rudimentary borehole
schemes. If water from the Taung Dam is supplied to a storage reservoir at a high
enough point in the area, distribution networks would be installed to supply the area.
• Bogosing Water Supply Area: The Bogosing Water Supply Scheme supplies water to
six villages. Water is abstracted from the Vaalharts Canal and is then purified at a
package treatment plant with a capacity of 1.2 Ml/day. However, this package plant is
highly inefficient with water losses accumulating to approximately 35-40% and turbidity
in the water being a problem for communities along certain sections of the scheme. If
water from the Taung Dam is used to supply the Bogosing area, then Bogosing’s
allocation from the Vaalharts Canal Scheme could be transferred to Vryburg to
augment the water demand in this area. This would require upgrading of the Pudimoe
Water Treatments Works and the Pudimoe Canal delivering water to the treatment
works (both planned for the near future), as well as the Pudimoe-Vryburg pipeline
which was recently upgraded only to replace the old pipe. The capacity of this pipe is
not enough to carry the extra supply.
• Taung Water Supply Area: The Pudimoe Water Supply Scheme supplies water to 11
villages in Taung area. Water is supplied through the Vaalharts North Canal and the
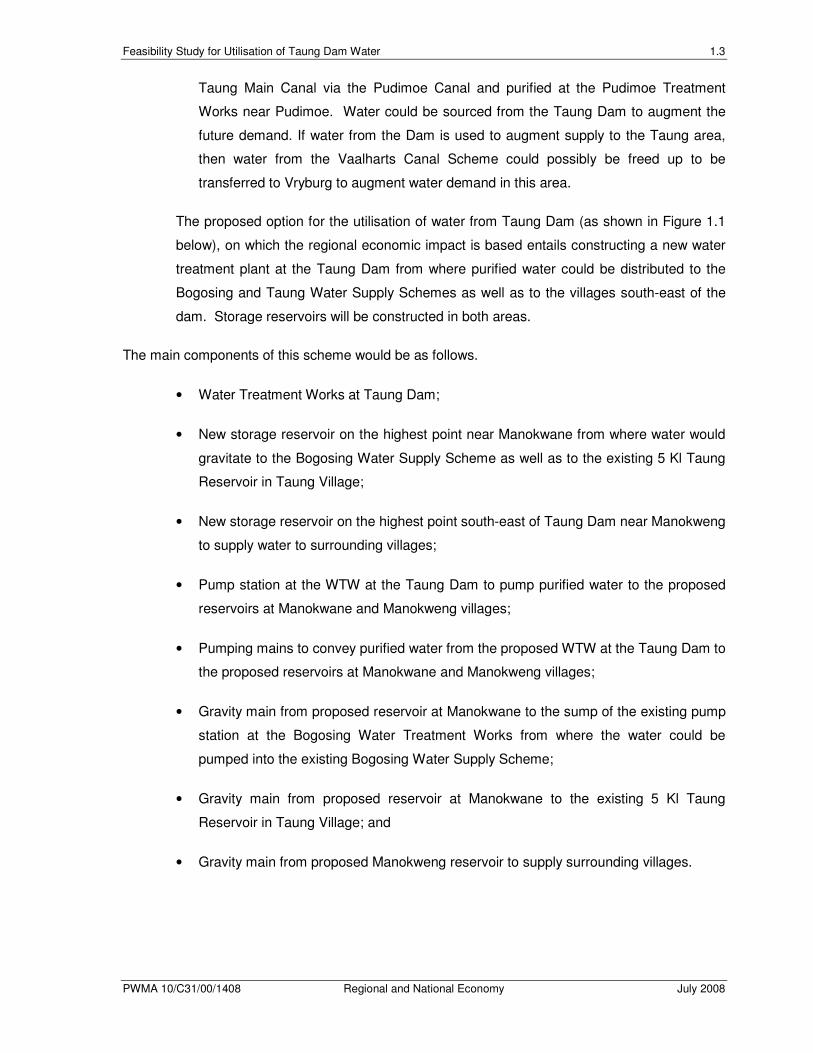
Feasibility Study for Utilisation of Taung Dam Water 1.3
PWMA 10/C31/00/1408 Regional and National Economy July 2008
Taung Main Canal via the Pudimoe Canal and purified at the Pudimoe Treatment
Works near Pudimoe. Water could be sourced from the Taung Dam to augment the
future demand. If water from the Dam is used to augment supply to the Taung area,
then water from the Vaalharts Canal Scheme could possibly be freed up to be
transferred to Vryburg to augment water demand in this area.
The proposed option for the utilisation of water from Taung Dam (as shown in Figure 1.1
below), on which the regional economic impact is based entails constructing a new water
treatment plant at the Taung Dam from where purified water could be distributed to the
Bogosing and Taung Water Supply Schemes as well as to the villages south-east of the
dam. Storage reservoirs will be constructed in both areas.
The main components of this scheme would be as follows.
• Water Treatment Works at Taung Dam;
• New storage reservoir on the highest point near Manokwane from where water would
gravitate to the Bogosing Water Supply Scheme as well as to the existing 5 Kl Taung
Reservoir in Taung Village;
• New storage reservoir on the highest point south-east of Taung Dam near Manokweng
to supply water to surrounding villages;
• Pump station at the WTW at the Taung Dam to pump purified water to the proposed
reservoirs at Manokwane and Manokweng villages;
• Pumping mains to convey purified water from the proposed WTW at the Taung Dam to
the proposed reservoirs at Manokwane and Manokweng villages;
• Gravity main from proposed reservoir at Manokwane to the sump of the existing pump
station at the Bogosing Water Treatment Works from where the water could be
pumped into the existing Bogosing Water Supply Scheme;
• Gravity main from proposed reservoir at Manokwane to the existing 5 Kl Taung
Reservoir in Taung Village; and
• Gravity main from proposed Manokweng reservoir to supply surrounding villages.
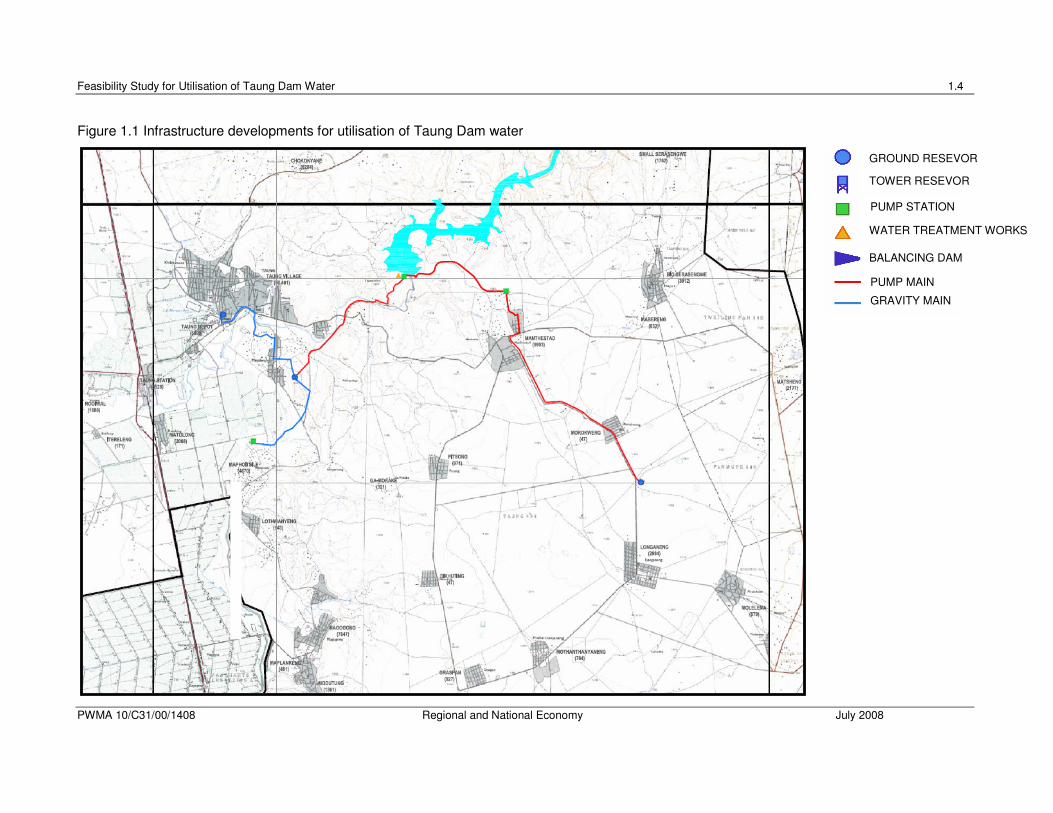
Feasibility Study for Utilisation of Taung Dam Water 1.4
PWMA 10/C31/00/1408 Regional and National Economy July 2008
Figure 1.1 Infrastructure developments for utilisation of Taung Dam water
GROUND RESEVOR
TOWER RESEVOR
PUMP STATION
WATER TREATMENT WORKS
BALANCING DAM
PUMP MAIN
GRAVITY MAIN

Feasibility Study for Utilisation of Taung Dam Water 1.5
PWMA 10/C31/00/1408 Regional and National Economy July 2008
The advantages of this option include that water losses of approximately 7% should be
allowed for at any water treatment plant. Pumping raw water to treatment works far away
from the source would result in pumping more water than would eventually be available to
use and is therefore considered an expensive exercise. Constructing a new treatment
works to purify the water near the Taung Dam would eliminate this long-term loss of
energy. Water will be purified relatively close to the end users. This will result in the cost
of the distribution network (pumping and gravity mains) to be less. The only disadvantage
of this option is that new treatment works at Taung Dam would require operation and
maintenance.

Feasibility Study for Utilisation of Taung Dam Water 2.1
PWMA 10/C31/00/1408 Regional and National Economy July 2008
2. REGIONAL ECONOMIC PROFILE
This economic profile delves into the underlying structures and sectors that make up the
study area’s macro economy providing insight into trends and issues of economic
significance, relating to:
• Gross Geographic Product (GGP);
• Employment per sector;
• Level of education; and
• Income distribution.
2.1. Gross Geographic Product
Gross Geographic Product (GGP) is defined as the total value of final production goods
and services produced within a geographic boundary in a given period. Changes in the
local economy can therefore be expressed as an increase or decrease in GGP. Only the
results of the activities which are intended to satisfy the needs of other people through
trade are considered to form part of the GGP.
The Gross Geographic Product (GGP) contribution per sector between 1995 and 2005 for
each of the three local municipalities that form the study area is presented below in Figure
2.1.
Figure 2.1 GGP contribution (Rand million)
0
200
400
600
800
1000
1200
1400
1600
1995 1996 1997 1998 1999 2000 2001 2002 2003 2004 2005
PLM NLM GTLM
Source: Quantec 2007 and Kayamandi calculations

Feasibility Study for Utilisation of Taung Dam Water 2.2
PWMA 10/C31/00/1408 Regional and National Economy July 2008
It is evident that Naledi LM has consistently been the highest GGP contributor in the study
area followed by Phokwane LM. Greater Taung LM has consistently been the lowest GGP
contributor.
Table 2.1 provides an indication of the annual growth rate of GGP in the study area.
Table 2.1 Annual growth rate of GGP per municipality and country
Annual Growth rate of GGP LOCAL MUNICIPALITY
1995-2000 2000- 2005 1995-2005
PHOKWANE 1.9% 2.2% 2.0%
NALEDI 3.0% 4.2% 3.6%
GREATER TAUNG 0.7% 1.4% 1.0%
FRANCES BAARD DISTRICT
2.1% 2.0% 2.1%
BOPHIRIMA DISTRICT 2.7% 2.9% 2.8%
NORTHERN CAPE 2.8% 2.3% 2.6%
NORTH WEST PROVINCE
1.8% 3.9% 2.8%
RSA 2.9% 4.8% 3.7%
Source: Quantec 2007 and Kayamandi calculations
Between 1995 and 2005, Naledi Local Municipality experienced the highest average
annual GGP growth rate of all the three municipalities in the study area, at 3.6% on par
with that of the country as a whole. Naledi Local Municipality’s economy grew at a higher
average per annum than that of the Bophirima District (2.8%) and that of the North West
Province (2.8%). Higher per annum average growth rates in Naledi were experienced in
the 2000 to 2005 period when compared to the 1995 to 2000 period.
Between the ten-year period from 1995 to 2005, the economy of the Greater Taung Local
Municipality only grew at an average per annum of 1%, which is far lower than that of the
Bophirima District and the North West Province in which it is located. A higher than
average growth rate was however experienced in the latter half of the ten year period
which equates an average per annum growth rate double than that of the first 5 years.
Greater Taung’s economy grew at nearly a quarter than that of the country as a whole.
Phokwane Local Municipality experienced higher than average economic growth rates
than that of Greater Taung, but lower than that of Naledi Local Municipality at 2% per

Feasibility Study for Utilisation of Taung Dam Water 2.3
PWMA 10/C31/00/1408 Regional and National Economy July 2008
annum over the ten-year period. The growth of Phokwane’s economy is similar to that of
the Frances Baard District at 2.1% growth and slightly lower than that of the Northern
Cape Province in which it is situated at 2.6%. The economy of Phokwane grew at nearly
half that of the country as a whole.
It is however important to note how each sector contributed to the aforementioned
growths, as each sector has been growing at varied rates between the ten-year periods.
Table 2.2 below reveals the average growth rate of the different economic sectors in each
of the local municipalities that make up the study area.
Table 2.2. Average Annual GGP growth by sector and municipality
AVERAGE ANNUAL GROWTH 1995 TO 2005 SECTOR
PLM GTLM NLM FBD BD NW NC RSA
Agriculture 2.5% 9.2% 5.3% 1.4% 6.2% 8.5% 4.9% 3.6%
Mining 6.7% 4.4% 4.5% 0.4% 5.4% 1.8% 2.3% 1.0%
Manufacturing 0.1% 0.6% 2.8% 0.5% 2.8% 2.7% 1.0% 2.8%
Electricity and water
-7.6% 0.7% -1.0% -1.4% 1.7% 0.5% -2.1% 1.8%
Construction 0.2% -2.4% 0.0% 0.2% -2.4% 3.5% 1.6% 4.6%
Wholesale and retail
5.0% 1.3% 1.4% 3.5% 2.2% 3.0% 3.8% 4.8%
Transport and communication
3.6% 6.7% 12.8% 2.3% 10.0% 6.5% 3.7% 7.1%
Business services
-0.3% -2.2% -3.1% 3.3% -1.8% 3.2% 2.0% 6.2%
Community services
3.9% 4.9% 3.5% 3.0% 4.1% 3.4% 3.3% 3.4%
Government services
1.9% -1.8% 2.2% 2.0% -0.6% 0.7% 1.9% 0.5%
Total 2.0% 1.0% 3.6% 2.1% 2.8% 2.8% 2.6% 3.7%
Source: Quantec 2007 and Kayamandi calculations
The above table shows different average annual growth rates for the different sectors in
each of the municipalities over the ten-year period from 1995 to 2005.
The following is noted with regards to the primary sectors, namely agriculture and mining.

Feasibility Study for Utilisation of Taung Dam Water 2.4
PWMA 10/C31/00/1408 Regional and National Economy July 2008
Agriculture, hunting, fishing and forestry involve enterprises primarily engaged in farming
activities or the rendering of agricultural services. Commercial hunting, game farming,
forestry, logging and fishing are also included in this category. Regarding the agriculture
sector, Greater Taung LM had the highest growth with 9.2% followed by Naledi and
Phokwane each with 5.3% and 2.5% growth respectively in this sector. The high average
per annum growth in the agriculture sector is far higher than that of the Bophirima District
and slightly higher than that of the North West Province at 8.5% growth. In relation to the
growth of agriculture in the country as a whole, at 3.6%, the study area has shown quite
an aggressive growth in agriculture which far outweighs that of the country’s growth in
agriculture.
Mining and quarrying involves the extracting, dressing and benediction of minerals
occurring naturally. Phokwane’s mining sector has the highest growth, at 6,7% with Naledi
and Greater Taung’s mining sectors growing at 4.5% and 4.4% respectively. The growth
in mining in Phokwane is far higher than that of the growth in the Frances Baard District
and the Northern Cape at 0.4% and 2.3% respectively. The growth experienced in the
mining sector in Greater Taung and Naledi show similar patterns to the growth in the
mining sector of the Bophirima District at 5.4% albeit at a far higher growth than that of the
North West Province (1.8%). The study area experienced far higher growth rates in the
mining sector, compared to the low average per annum growth over the aforementioned
period for the country as a whole at 1%.
The following is noted with regards to the secondary services sectors in the study area,
namely manufacturing, electricity and water, and the construction industry.
Manufacturing is defined as a process of transforming materials physically, chemically or
by means of assembly into new products. Insignificant growth in the manufacturing sector
is noted over the aforementioned ten-year period in Phokwane and Greater Taung Local
Municipalities with 0.1% and 0.6% growth respectively. The manufacturing sector of
Naledi local municipality has however grown at an average per annum of 2.8%, which is in
line with the growth experienced in the Bophirima, North West and the country as a whole,
with 2.8%, 2.7% and 2.8% respectively.
Electricity, water and gas involve production, collection and distribution of electricity as
well as the manufacture of gas and the collection and distribution of water. The electricity
and water services sectors showed average per annum declines in both Phokwane with -
7.6% decline and Naledi with -1% decline. Greater Taung only showed relatively
insignificant growth over the aforementioned period at 0.7% growth in line with that of the
North West Province in which it is located. The study area as a whole experienced lower

Feasibility Study for Utilisation of Taung Dam Water 2.5
PWMA 10/C31/00/1408 Regional and National Economy July 2008
than per annum average growth in the electricity and water services sectors for the
country as a whole.
The construction industry is also considered a secondary activity. It involves site
preparation, demolition, building, civil engineering, installation, plumbing, decorating, etc.
The construction sector also experienced insignificant growths in Phokwane and in Naledi
Local municipalities over the aforementioned period, whilst Greater Taung municipalities
experienced relatively high decrease in the construction sector in line with that of the
Bophirima District. The North West Province however showed significantly higher growth
over the period than of Naledi and Greater Taung local municipalities. The country as a
whole also experienced far higher annual growth rates than of the study area at 4.6%
growth per annum.
The following is noted with regards to the tertiary sector industries, namely wholesale and
retail trade, transport and communication, business and financial services, and
government and community sectors.
Trade entails the wholesale or retail sale of new and used goods in stores, stalls, markets
by mail order or by other means as well as hotels, restaurants, bars and other tourist
activities. The wholesale and retail sectors have shown significant growth in Phokwane
Local Municipality at 5% growth, which is on par with the growth in the aforementioned
sector for the country as a whole. Phokwane’s wholesale and retail sector experience
higher than average growth rates than its district and province. Both Greater Taung and
Naledi Local Municipalities showed relatively low growth rates in the wholesale and retail
sector at 1.3% and 1.4% respectively, far below that of the province and the country as a
whole.
Transport and communication involves the provision of passenger and or freight transport
by rail, road, water or air. It includes cargo handling and storage and postal activities,
courier activities and the transmission of sound images and data or other information.
Higher than average growth in the country in the transport and communication sector at
approximately 12.8% was experienced in the Naledi Local Municipality which is greater
than the national average of 7%. Greater Taung Local Municipality also grew at a
relatively high rate in the aforementioned sector. Both Naledi and Greater Taung local
municipalities grew in line with the average per annum growth experienced in the
aforementioned sector in the Bophirima District and that of the North West Province.
Phokwane Local Municipality’s transport and communication sector grew in line with that
of the Frances Baard District and Northern Cape, albeit at nearly half the growth rate of
the country as a whole for this sector.
Feasibility Study for Utilisation of Taung Dam Water 2.6
PWMA 10/C31/00/1408 Regional and National Economy July 2008
Business and financial services sector includes the activity of obtaining and redistributing
funds, financial intermediation, insurance and pension funding. The buying, selling, renting
and operating of owned and leased real estate. The business services sector showed
declining rates over the last ten years since 1995 for all three of the local municipalities,
which jointly comprise the study area. The decline within these tertiary sectors are
concerning, especially if viewed in relation to far higher average per annum growth rates
in the sector in the district, provinces and for the country as a whole.
Community services involve provision of community services e.g. education, health
services, social work and activities of professional organisations. The community services
sector in each of the three local municipalities within the study area grew at relatively
average per annum growth rates in comparison with that of the country as a whole.
Government services involve activities of central, provincial and local government. The
government service has grown relatively insignificantly over the ten-year period, and in
Greater Taung this sector has actually declined by nearly 2% per annum. This is a good
indication in that lower dependencies in the government service sector are created, since
government services sector is not responsible for growing the economy.
Having looked into the average annual growth rate, the following is a detailed account of
the growth of GGP per sector over a ten year period (1995 to 2005) for each of the three
municipalities that comprise the study area.
2.1.1. GGP per sector of Naledi Local Municipality
Table 2.3 below provides an indication of the GGP contribution per sector and Figure 2.2
below provide an indication of the growth of GGP per sector from 1995 to 2005.
In Naledi municipality the Transport and Communication sector has shown a steady
increase from R 151,4 million in 1995 to R 448,7 million in 2005. It has been leading
contributor to the GGP from the year 2000 to 2005. The Finance and business services
sector was the leading contributor to the GGP from 1995 to 2000 and gradually declined
to second place. The government services sector, the wholesale and retail sector,
manufacturing sector as well as the community social and personal services sector have
been consistent middle order contributors to the economy. The agriculture and forestry
and fishing sector, which falls below the middle order contributors showed a rapid
increase between 1995 and 1996 (R 48,5 million to R 119.1 million) and then declined
gradually. The mining sector, the construction sector as well as electricity and water have
consistently been the lowest contributors to the municipality’s economy.

Feasibility Study for Utilisation of Taung Dam Water 2.7
PWMA 10/C31/00/1408 Regional and National Economy July 2008
Table 2.3. GGP per sector (constant 2000 values) for Naledi Municipality
Sector 1995 2000 2005
Agriculture 48,557,121 93,917,830 77,276,929
Mining 7,221,518 7,701,558 10,771,911
Manufacturing 116,324,942 142,590,219 149,781,456
Electricity and water 19,763,919 15,908,056 18,056,610
Construction 13,464,352 12,078,013 13,416,484
Trade 151,683,316 172,101,777 172,121,370
Transport 151,416,928 242,914,938 448,706,500
Business services 272,194,048 219,413,234 204,242,104
Community services 102,119,516 122,918,548 139,075,417
Government services 148,147,441 167,842,952 180,132,783
Total 1,030,893,103 1,197,387,125 1,413,581,563
Source: Quantec 2007 and Kayamandi calculations
Figure 2.2 GGP per sector (constant 2000 values) of Naledi Local Municipality
0
10000000
20000000
30000000
40000000
50000000
1995 1996 1997 1998 1999 2000 2001 2002 2003 2004 2005
Agriculture Mining Manufacturing Electricity Construction
Trade Transport Finance Community Government
Source: Quantec 2007 and Kayamandi Calculation
Table 2.4 below provides an indication of the percentage distribution of the GGP per
sector.

Feasibility Study for Utilisation of Taung Dam Water 2.8
PWMA 10/C31/00/1408 Regional and National Economy July 2008
Table 2.4. Percentage distribution of GGP per sector, 2005
Sector NALEDI LM BOPHIRIMA DM NORTH WEST RSA TOTAL
Agriculture 5% 9% 3% 3%
Mining 1% 7% 30% 7%
Manufacturing 11% 9% 7% 18%
Electricity & water 1% 2% 1% 2%
Construction 1% 2% 2% 3%
Trade 12% 13% 13% 15%
Transport 32% 18% 10% 11%
Business services 14% 11% 14% 21%
Community services 10% 12% 8% 6%
General Government services
13% 17% 12% 14%
Total 100% 100% 100% 100%
Source: Quantec 2007 and Kayamandi Calculation
In 2005 in Naledi LM the transport and communication sectors contributed the most to
GGP at 32% while the least contributors were the mining (0.8%) and construction (0.9%)
sectors. The trade and manufacturing sectors are also responsible for providing a
relatively high percentage contribution to the GGP of the municipality as a whole at 12%
and 11% respectively.
Table 2.5 below provides an indication of the sectoral share of Naledi Local Municipality’s
economy per sector.
Table 2.5 Naledi’s GDP sectoral share per sector to municipality, district and province
Sector Share Naledi’s
sectoral share to Naledi
Naledi’s sectoral share to Bophirima
District
Naledi’s sectoral share to North West Province
Agriculture 5% 25% 4%
Mining 1% 5% 0%
Manufacturing 11% 52% 3%
Electricity and water 1% 31% 3%

Feasibility Study for Utilisation of Taung Dam Water 2.9
PWMA 10/C31/00/1408 Regional and National Economy July 2008
Sector Share Naledi’s
sectoral share to Naledi
Naledi’s sectoral share to Bophirima
District
Naledi’s sectoral share to North West Province
Construction 1% 18% 1%
Trade 12% 39% 2%
Transport 32% 73% 7%
Business services 14% 56% 2%
Community services 10% 35% 3%
Government services 13% 32% 2%
Total 100% 42% 2%
Source: Quantec 2007 and Kayamandi Calculation
As is evident from the above, Naledi local municipality is responsible for more than 40% of
the district’s GDP and nearly more than 2% of the Provinces GDP. With regards to the
municipality’s sectoral share to the Provincial GDP per sector, it is noted that transport
followed by agriculture, manufacturing, electricity and water, and community services, are
responsible for larger than average provincial GDP share of the same sectors. The
following sectors, from highest to lowest, have also contributed to higher than average
GDP contribution to the district’s economy (42%), namely:
• Transport 73%
• Business Services 56%
• Manufacturing 52%
2.1.2. GGP per sector of Phokwane Local Municipality
Table 2.6 below provides an indication of the GGP contribution per sector and Figure 2.3
below provides an indication of the growth of GGP per sector from 1995 to 2005.
Table 2.6. GGP per sector (constant 2000 values) for Phokwane Municipality
Sector 1995 2000 2005
Agriculture 8,592,777 98,162,937 97,747,265
Mining 22,655,979 31,536,938 40,730,272
Manufacturing 46,907,058 47,429,609 47,459,022
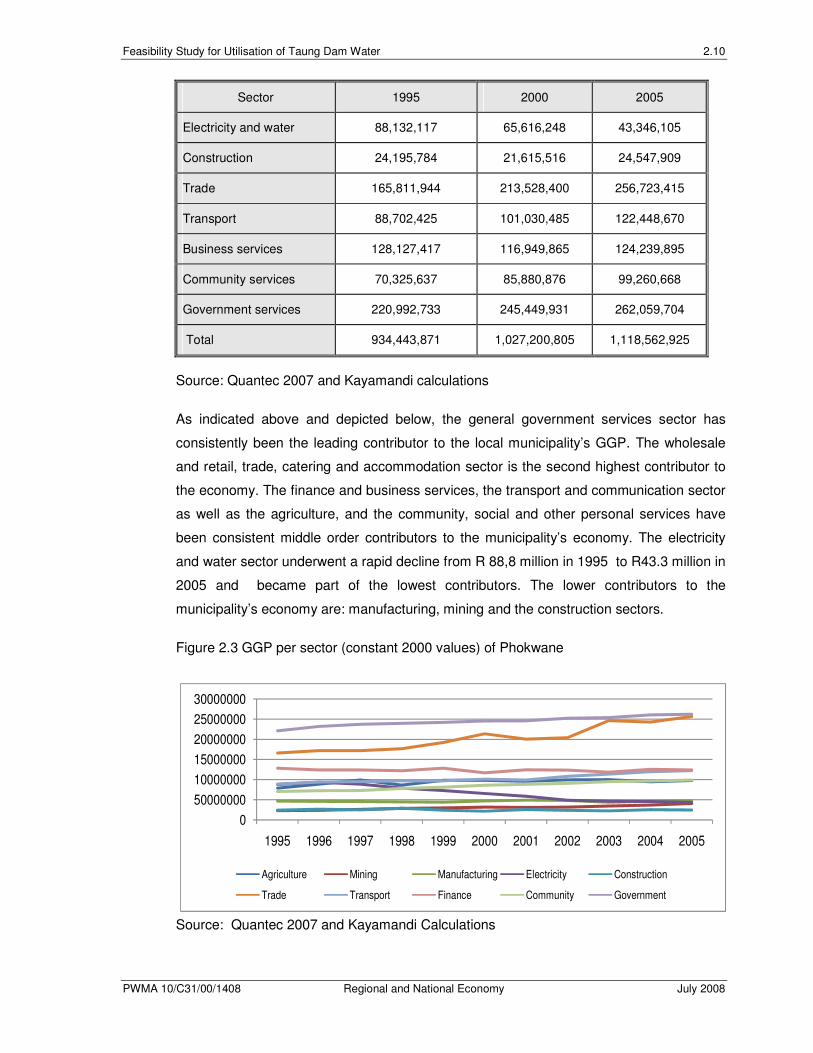
Feasibility Study for Utilisation of Taung Dam Water 2.10
PWMA 10/C31/00/1408 Regional and National Economy July 2008
Sector 1995 2000 2005
Electricity and water 88,132,117 65,616,248 43,346,105
Construction 24,195,784 21,615,516 24,547,909
Trade 165,811,944 213,528,400 256,723,415
Transport 88,702,425 101,030,485 122,448,670
Business services 128,127,417 116,949,865 124,239,895
Community services 70,325,637 85,880,876 99,260,668
Government services 220,992,733 245,449,931 262,059,704
Total 934,443,871 1,027,200,805 1,118,562,925
Source: Quantec 2007 and Kayamandi calculations
As indicated above and depicted below, the general government services sector has
consistently been the leading contributor to the local municipality’s GGP. The wholesale
and retail, trade, catering and accommodation sector is the second highest contributor to
the economy. The finance and business services, the transport and communication sector
as well as the agriculture, and the community, social and other personal services have
been consistent middle order contributors to the municipality’s economy. The electricity
and water sector underwent a rapid decline from R 88,8 million in 1995 to R43.3 million in
2005 and became part of the lowest contributors. The lower contributors to the
municipality’s economy are: manufacturing, mining and the construction sectors.
Figure 2.3 GGP per sector (constant 2000 values) of Phokwane
0
50000000
10000000
15000000
20000000
25000000
30000000
1995 1996 1997 1998 1999 2000 2001 2002 2003 2004 2005
Agriculture Mining Manufacturing Electricity Construction
Trade Transport Finance Community Government
Source: Quantec 2007 and Kayamandi Calculations
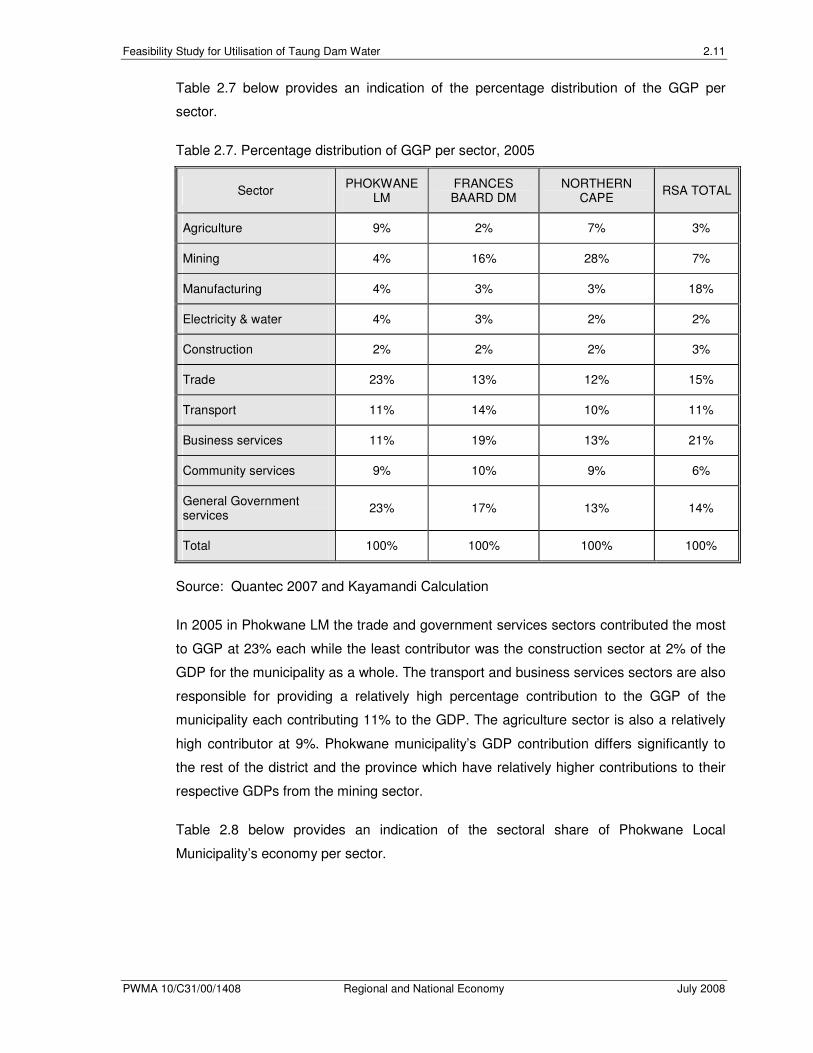
Feasibility Study for Utilisation of Taung Dam Water 2.11
PWMA 10/C31/00/1408 Regional and National Economy July 2008
Table 2.7 below provides an indication of the percentage distribution of the GGP per
sector.
Table 2.7. Percentage distribution of GGP per sector, 2005
Sector PHOKWANE
LM FRANCES BAARD DM
NORTHERN CAPE
RSA TOTAL
Agriculture 9% 2% 7% 3%
Mining 4% 16% 28% 7%
Manufacturing 4% 3% 3% 18%
Electricity & water 4% 3% 2% 2%
Construction 2% 2% 2% 3%
Trade 23% 13% 12% 15%
Transport 11% 14% 10% 11%
Business services 11% 19% 13% 21%
Community services 9% 10% 9% 6%
General Government services
23% 17% 13% 14%
Total 100% 100% 100% 100%
Source: Quantec 2007 and Kayamandi Calculation
In 2005 in Phokwane LM the trade and government services sectors contributed the most
to GGP at 23% each while the least contributor was the construction sector at 2% of the
GDP for the municipality as a whole. The transport and business services sectors are also
responsible for providing a relatively high percentage contribution to the GGP of the
municipality each contributing 11% to the GDP. The agriculture sector is also a relatively
high contributor at 9%. Phokwane municipality’s GDP contribution differs significantly to
the rest of the district and the province which have relatively higher contributions to their
respective GDPs from the mining sector.
Table 2.8 below provides an indication of the sectoral share of Phokwane Local
Municipality’s economy per sector.

Feasibility Study for Utilisation of Taung Dam Water 2.12
PWMA 10/C31/00/1408 Regional and National Economy July 2008
Table 2.8 PLM’s GDP sector share per sector to that municipality, district, province, 2005
Sector share Phokwane’s
sectoral share to Phokwane
Phokwane’s sectoral share
to Frances Baard District
Phokwane’s sectoral share to Northern Cape
Agriculture 9% 56% 7%
Mining 4% 3% 1%
Manufacturing 4% 21% 6%
Electricity and water 4% 18% 9%
Construction 2% 21% 7%
Trade 23% 26% 10%
Transport 11% 12% 6%
Business services 11% 9% 4%
Community services 9% 13% 5%
Government services 23% 20% 9%
Total 100% 15% 5%
Source: Quantec 2007 and Kayamandi Calculation
As is evident from the above, Phokwane local municipality is responsible for only 15% of
the district’s GDP and more than 5% of the province’s GDP. With regards to the
municipality’s sectoral share to the provincial GDP per sector, it is noted that trade,
followed by electricity and water, government services, agriculture, construction, and
transport, are responsible for larger than average provincial GDP share of the same
sectors. The following sectors, from highest to lowest, have also contributed to higher
than average GDP contribution to the district’s economy (15%), namely:
• Agriculture 56%;
• Trade 26%;
• Construction 21%;
• Manufacturing 21%;
• Government services 20%; and
• Electiricty and wtaer 18%.

Feasibility Study for Utilisation of Taung Dam Water 2.13
PWMA 10/C31/00/1408 Regional and National Economy July 2008
The municipality’s contributes to more than half of the district’s share of agriculture, which
shows the relative importance of the agriculture sector in this municipality to the
agriculture sector of the district.
2.1.3. GGP per sector of Greater Taung Local Municipality
Table 2.9 below provides an indication of the GGP contribution per sector and Figure 2.4
below provides an indication of the growth of GGP per sector from 1995 to 2005.
As indicated and depicted below, the government services sector proved to be the
consistently overwhelming contributor to the GGP of the Greater Taung Local Municipality
(contributing R183,5 million to the economy in 2005). The other sectors are closely knit
together in terms of contribution to the economy. The community, social and other
personnel services sector as well as the mining sector have shown a marked increase in
production from the year 2000 to 2005. The electricity and water sector is the lowest
contributor to the economy in this municipality.
Table 2.9. GGP per sector (constant 2000 values)
Sector 1995 2000 2005
Agriculture 13,229,900 29,805,023 29,291,764
Mining 49,924,581 52,134,180 73,368,835
Manufacturing 18,630,210 18,994,859 19,639,204
Electricity and water 9,734,039 8,403,147 10,369,403
Construction 28,765,826 23,635,528 23,105,656
Trade 62,051,296 68,744,040 69,531,215
Transport 31,387,235 42,804,341 56,428,843
Business services 68,389,895 56,196,129 55,748,108
Community services 54,292,785 69,631,779 83,614,969
Government services 216,121,186 201,027,825 183,514,447
Total 13,229,900 29,805,023 29,291,764
Source: Quantec 2007 and Kayamandi calculations

Feasibility Study for Utilisation of Taung Dam Water 2.14
PWMA 10/C31/00/1408 Regional and National Economy July 2008
Figure 2.4 Growth of GGP per sector of Greater Taung Municipality
0
50000000
10000000
15000000
20000000
25000000
1995 1996 1997 1998 1999 2000 2001 2002 2003 2004 2005
Agriculture Mining Manufacturing Electricity Construction
Trade Transport Finance Community Government
Source: Quantec 2007 and Kayamandi Calculation
Table 2.10 below provides an indication of the percentage distribution of the GGP per
sector.
Table 2.10. Percentage distribution of GGP per sector, 2005
Sector GREATER TAUNG LM
BOPHIRIMA DM NORTH WEST RSA TOTAL
Agriculture 5% 9% 3% 3%
Mining 12% 7% 30% 7%
Manufacturing 3% 9% 7% 18%
Electricity & water 2% 2% 1% 2%
Construction 4% 2% 2% 3%
Trade 12% 13% 13% 15%
Transport 9% 18% 10% 11%
Business services 9% 11% 14% 21%
Community services 14% 12% 8% 6%
General Government services
30% 17% 12% 14%
Total 100% 100% 100% 100%
Source: Quantec 2007 and Kayamandi Calculation
In Greater Taung LM in 2005, the government services sector contributed the most to
GGP at 30.4% while the electricity and water sector is the least contributor at 1.7%.
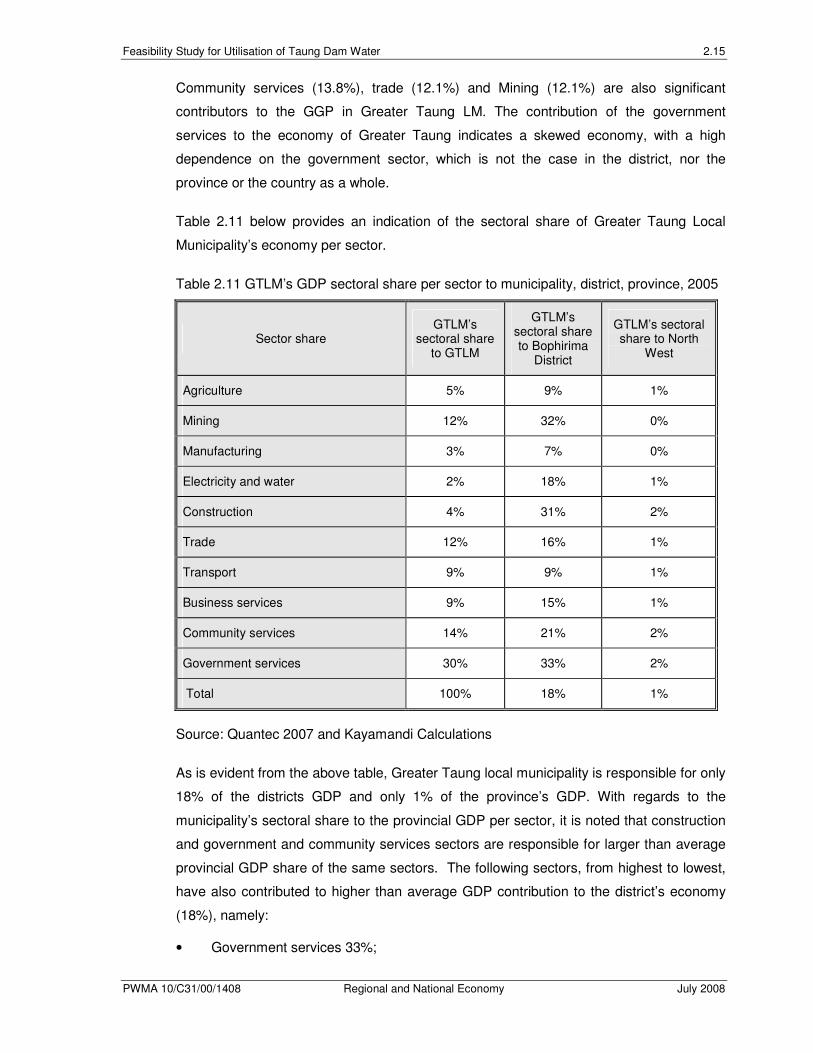
Feasibility Study for Utilisation of Taung Dam Water 2.15
PWMA 10/C31/00/1408 Regional and National Economy July 2008
Community services (13.8%), trade (12.1%) and Mining (12.1%) are also significant
contributors to the GGP in Greater Taung LM. The contribution of the government
services to the economy of Greater Taung indicates a skewed economy, with a high
dependence on the government sector, which is not the case in the district, nor the
province or the country as a whole.
Table 2.11 below provides an indication of the sectoral share of Greater Taung Local
Municipality’s economy per sector.
Table 2.11 GTLM’s GDP sectoral share per sector to municipality, district, province, 2005
Sector share GTLM’s
sectoral share to GTLM
GTLM’s sectoral share to Bophirima
District
GTLM’s sectoral share to North
West
Agriculture 5% 9% 1%
Mining 12% 32% 0%
Manufacturing 3% 7% 0%
Electricity and water 2% 18% 1%
Construction 4% 31% 2%
Trade 12% 16% 1%
Transport 9% 9% 1%
Business services 9% 15% 1%
Community services 14% 21% 2%
Government services 30% 33% 2%
Total 100% 18% 1%
Source: Quantec 2007 and Kayamandi Calculations
As is evident from the above table, Greater Taung local municipality is responsible for only
18% of the districts GDP and only 1% of the province’s GDP. With regards to the
municipality’s sectoral share to the provincial GDP per sector, it is noted that construction
and government and community services sectors are responsible for larger than average
provincial GDP share of the same sectors. The following sectors, from highest to lowest,
have also contributed to higher than average GDP contribution to the district’s economy
(18%), namely:
• Government services 33%;
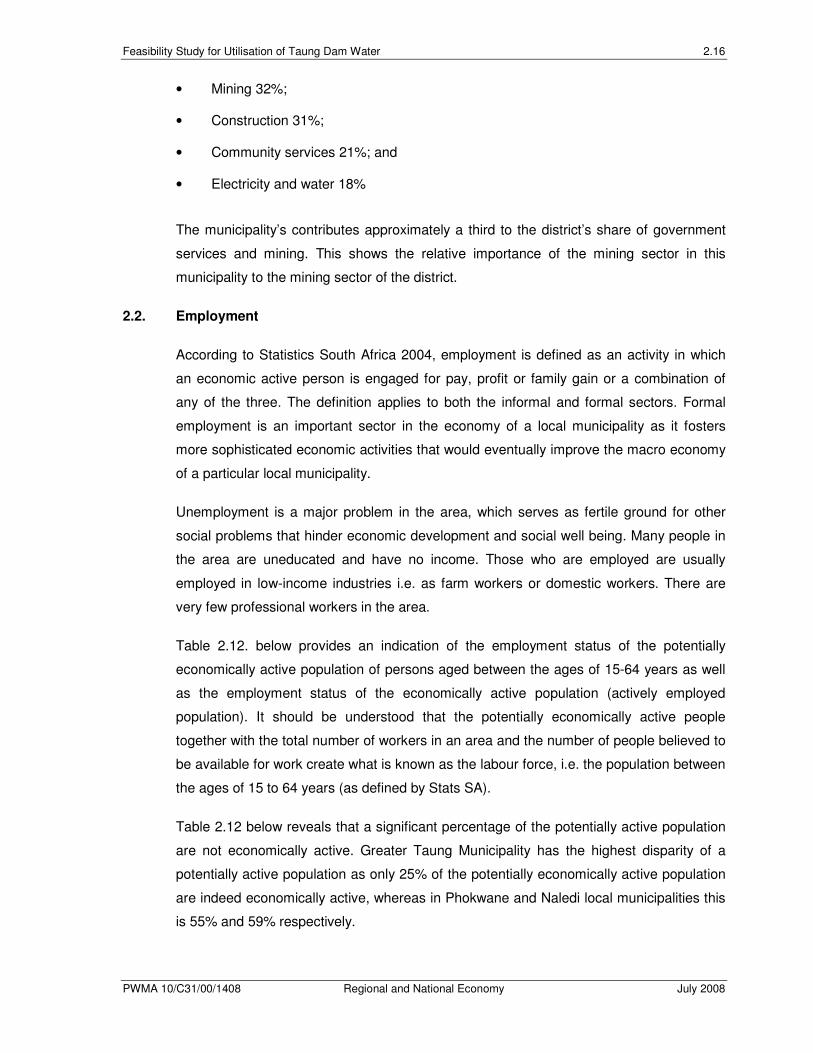
Feasibility Study for Utilisation of Taung Dam Water 2.16
PWMA 10/C31/00/1408 Regional and National Economy July 2008
• Mining 32%;
• Construction 31%;
• Community services 21%; and
• Electricity and water 18%
The municipality’s contributes approximately a third to the district’s share of government
services and mining. This shows the relative importance of the mining sector in this
municipality to the mining sector of the district.
2.2. Employment
According to Statistics South Africa 2004, employment is defined as an activity in which
an economic active person is engaged for pay, profit or family gain or a combination of
any of the three. The definition applies to both the informal and formal sectors. Formal
employment is an important sector in the economy of a local municipality as it fosters
more sophisticated economic activities that would eventually improve the macro economy
of a particular local municipality.
Unemployment is a major problem in the area, which serves as fertile ground for other
social problems that hinder economic development and social well being. Many people in
the area are uneducated and have no income. Those who are employed are usually
employed in low-income industries i.e. as farm workers or domestic workers. There are
very few professional workers in the area.
Table 2.12. below provides an indication of the employment status of the potentially
economically active population of persons aged between the ages of 15-64 years as well
as the employment status of the economically active population (actively employed
population). It should be understood that the potentially economically active people
together with the total number of workers in an area and the number of people believed to
be available for work create what is known as the labour force, i.e. the population between
the ages of 15 to 64 years (as defined by Stats SA).
Table 2.12 below reveals that a significant percentage of the potentially active population
are not economically active. Greater Taung Municipality has the highest disparity of a
potentially active population as only 25% of the potentially economically active population
are indeed economically active, whereas in Phokwane and Naledi local municipalities this
is 55% and 59% respectively.
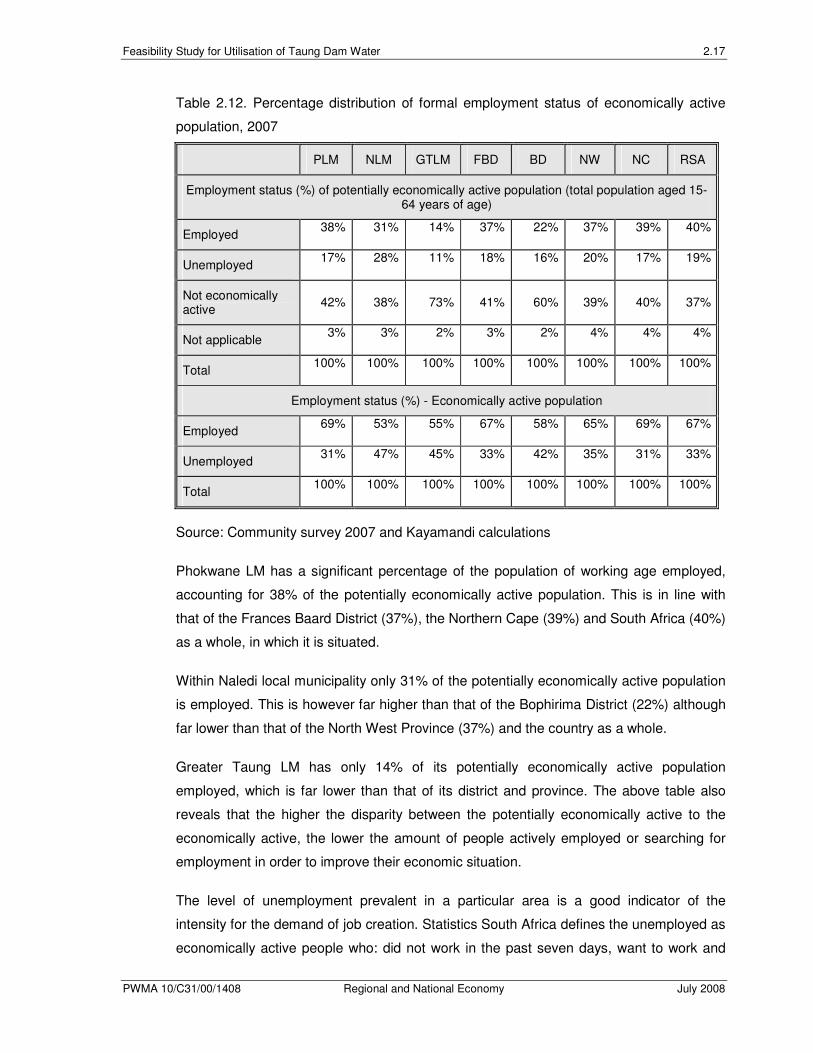
Feasibility Study for Utilisation of Taung Dam Water 2.17
PWMA 10/C31/00/1408 Regional and National Economy July 2008
Table 2.12. Percentage distribution of formal employment status of economically active
population, 2007
PLM NLM GTLM FBD BD NW NC RSA
Employment status (%) of potentially economically active population (total population aged 15-64 years of age)
Employed 38% 31% 14% 37% 22% 37% 39% 40%
Unemployed 17% 28% 11% 18% 16% 20% 17% 19%
Not economically active
42% 38% 73% 41% 60% 39% 40% 37%
Not applicable 3% 3% 2% 3% 2% 4% 4% 4%
Total 100% 100% 100% 100% 100% 100% 100% 100%
Employment status (%) - Economically active population
Employed 69% 53% 55% 67% 58% 65% 69% 67%
Unemployed 31% 47% 45% 33% 42% 35% 31% 33%
Total 100% 100% 100% 100% 100% 100% 100% 100%
Source: Community survey 2007 and Kayamandi calculations
Phokwane LM has a significant percentage of the population of working age employed,
accounting for 38% of the potentially economically active population. This is in line with
that of the Frances Baard District (37%), the Northern Cape (39%) and South Africa (40%)
as a whole, in which it is situated.
Within Naledi local municipality only 31% of the potentially economically active population
is employed. This is however far higher than that of the Bophirima District (22%) although
far lower than that of the North West Province (37%) and the country as a whole.
Greater Taung LM has only 14% of its potentially economically active population
employed, which is far lower than that of its district and province. The above table also
reveals that the higher the disparity between the potentially economically active to the
economically active, the lower the amount of people actively employed or searching for
employment in order to improve their economic situation.
The level of unemployment prevalent in a particular area is a good indicator of the
intensity for the demand of job creation. Statistics South Africa defines the unemployed as
economically active people who: did not work in the past seven days, want to work and

Feasibility Study for Utilisation of Taung Dam Water 2.18
PWMA 10/C31/00/1408 Regional and National Economy July 2008
are available to start work within a week from the interview, and have taken steps to look
for work or to start some form of work within the past 4 weeks. As shown in the above
table, 31% of Phokwane’s, 47% of Naledi’s and 45% of Greater Taung’s economically
active population are unemployed.
Table 2.13 indicates the sectoral distribution of the formal employment.
Table 2.13: Sectoral distribution of formal employment, 2005
PLM NLM GTLM FBD BD NW NC RSA
Agriculture 17% 19% 8% 8% 18% 7% 19% 8%
Mining 1% 0% 5% 9% 8% 32% 10% 5%
Manufacturing 12% 9% 4% 8% 7% 7% 7% 14%
Electricity 3% 1% 1% 1% 1% 0% 1% 1%
Construction 3% 3% 7% 5% 5% 3% 5% 5%
Wholesale, retail, trade
17% 17% 15% 14% 14% 14% 13% 16%
Transport 3% 3% 2% 4% 2% 2% 3% 4%
Finance 9% 13% 8% 13% 8% 10% 10% 17%
Community services
12% 14% 13% 13% 15% 10% 12% 14%
Government services
24% 19% 37% 25% 21% 14% 20% 17%
TOTAL 100% 100% 100% 100% 100% 100% 100% 100%
Source: Kayamandi Development Services Calculations from Quantec, 2005
The main sectoral employment providers in Phokwane are government services (24%),
trade (17%), agriculture (17%), and manufacturing and community services each at 12%.
Agriculture is not such a high contributor to employment within the Frances Baard District
(8%), although within the Northern Cape it contributes 19% of all employment generated.
This shows the relative importance of the agriculture sector for employment in the study
area. The employment in trade is more in line with that of the district, province and country
as a whole. Trade however, remains an important contributor to employment within the
study area.

Feasibility Study for Utilisation of Taung Dam Water 2.19
PWMA 10/C31/00/1408 Regional and National Economy July 2008
The top three sectors of employment in Naledi local municipality are agriculture and
government services sectors each contributing 19% of the municipality’s employment,
followed by the trade sector which employs 17% of the formal employees. The agriculture
sector is also a key employment sector for the Bophirima District (18%), but it is not such
a major employment sector in the North West Province (7%). Trade is also a key sectoral
employment sector in the district, province and country as a whole.
Figure 2.5 below provides an indication of the sectoral distribution of those formally
employed and enables comparison of the sectoral employment per municipality within the
study area and South Africa as a whole.
Figure 2.5 Percentage distribution of formal employment per sector, 2005
0%5%
10%15%20%25%30%35%40%
PLM NLM GTLM RSA
Source: Quantec 2005 and Kayamandi calculations
From the above Figure, the relative importance of the agriculture and manufacturing
sector in Phokwane, and Naledi Local Municipalities can be noted. The importance of the
trade sector to all the municipalities within the study area is also noted. High dependence
of Greater Taung on employment from the government services sector is also noted.
Figure 2.6 below provides an indication of change in formal employment from 1995 to
2005.
From the figure below it is noted that Phokwane Local Municipality has a greater number
of persons formally employed, followed by Naledi Local Municipality and then Greater
Taung Municipality. A general decline in the number of persons formally employed is
however noted from 1995 to 2005. This reveals that the level of employment is worsening,
which will have dire consequence for the economy of the municipalities and the region if
not addressed adequately and timeously.
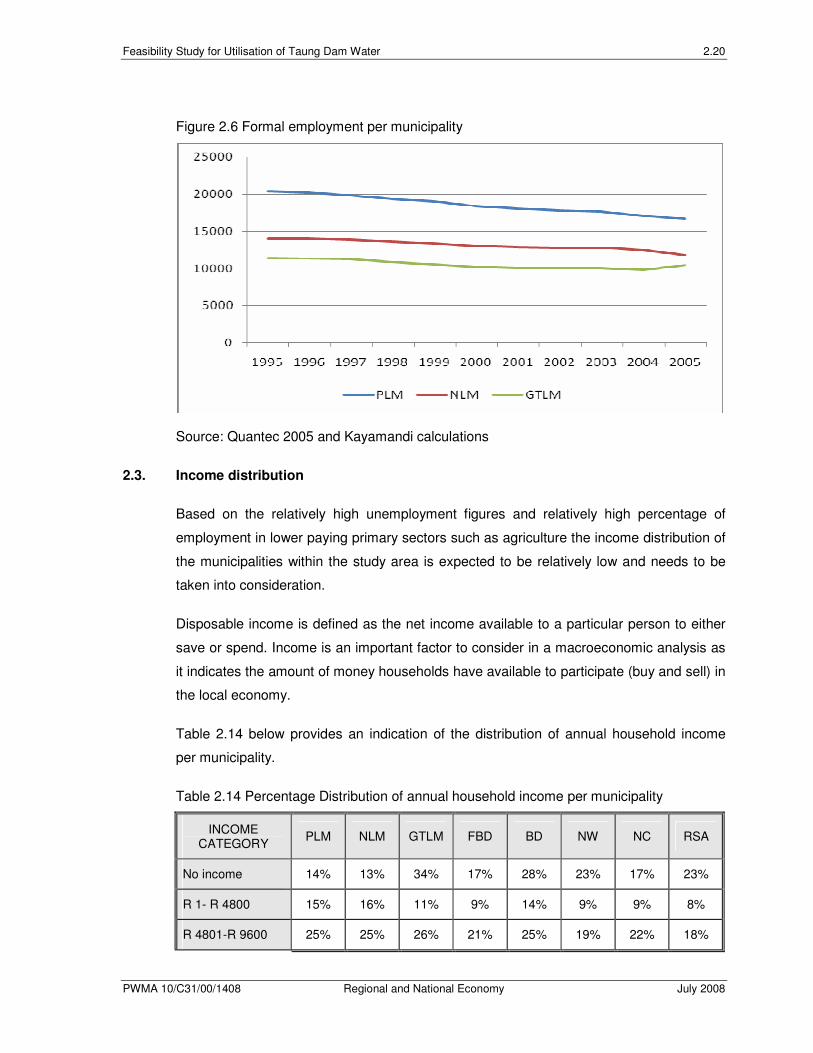
Feasibility Study for Utilisation of Taung Dam Water 2.20
PWMA 10/C31/00/1408 Regional and National Economy July 2008
Figure 2.6 Formal employment per municipality
Source: Quantec 2005 and Kayamandi calculations
2.3. Income distribution
Based on the relatively high unemployment figures and relatively high percentage of
employment in lower paying primary sectors such as agriculture the income distribution of
the municipalities within the study area is expected to be relatively low and needs to be
taken into consideration.
Disposable income is defined as the net income available to a particular person to either
save or spend. Income is an important factor to consider in a macroeconomic analysis as
it indicates the amount of money households have available to participate (buy and sell) in
the local economy.
Table 2.14 below provides an indication of the distribution of annual household income
per municipality.
Table 2.14 Percentage Distribution of annual household income per municipality
INCOME CATEGORY
PLM NLM GTLM FBD BD NW NC RSA
No income 14% 13% 34% 17% 28% 23% 17% 23%
R 1- R 4800 15% 16% 11% 9% 14% 9% 9% 8%
R 4801-R 9600 25% 25% 26% 21% 25% 19% 22% 18%

Feasibility Study for Utilisation of Taung Dam Water 2.21
PWMA 10/C31/00/1408 Regional and National Economy July 2008
INCOME CATEGORY
PLM NLM GTLM FBD BD NW NC RSA
R9601-R 19200 17% 18% 15% 18% 16% 19% 18% 16%
R19201-R 38400 12% 12% 7% 14% 9% 16% 14% 13%
R38401- 76800 8% 7% 4% 10% 5% 7% 9% 9%
R76801- R 153600
5% 5% 2% 7% 3% 4% 6% 6%
R 153601 and more
3% 3% 1% 5% 2% 3% 4% 6%
TOTAL 100% 100% 100% 100% 100% 100% 100% 100%
Source: Census 2001 and Kayamandi Calculations
Greater Taung Local Municipality has the highest percentage of households with no
income accounting for approximately one third of the households (34%) as compared to
only approximately 14% of households in both Naledi and Phokwane Local Municipalities
with no household income. This reveals that the study area has a high indigent status. In
Phokwane (14%) and Naledi (13%) Local Municipalities there are however fewer
households without income than that of the country as a whole (23%).
In Phokwane, Naledi and Greater Taung approximately 15%, 16% and 11% respectively
of the municipality’s households are situated under the R1- R4 800 income category while
the most common income scale is between R4801 and R9600 of the study area. This
category describes the household income levels of approximately a quarter of each of the
municipality’s households. The R9 601 to R19 200 category has a significant amount of
the study area’s households indicating about 17%, 18%, and 15% of the population of
Phokwane, Naledi and Greater Taung Local Municipalities respectively.
Figure 2.7 below provides an indication of the household income distribution per
municipality.
In each of the municipalities a scenario is presented in which the majority of the
municipality’s households have an income (lower than R9600) while a minority have high
incomes. On the one hand there is a significant amount of people with no household
income while on the other hand there are a few households in the study area with very
high annual incomes of R153 600 and more. This indicates a huge income disparity which
is an obstacle to economic development in the study area.
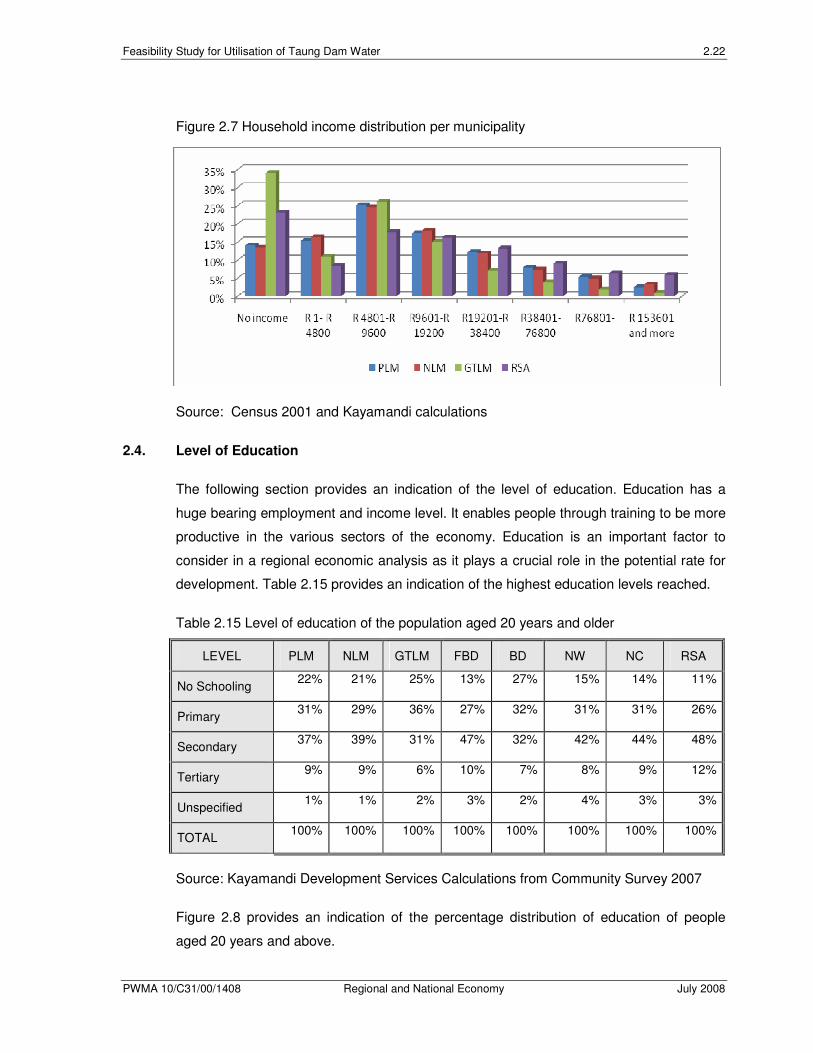
Feasibility Study for Utilisation of Taung Dam Water 2.22
PWMA 10/C31/00/1408 Regional and National Economy July 2008
Figure 2.7 Household income distribution per municipality
Source: Census 2001 and Kayamandi calculations
2.4. Level of Education
The following section provides an indication of the level of education. Education has a
huge bearing employment and income level. It enables people through training to be more
productive in the various sectors of the economy. Education is an important factor to
consider in a regional economic analysis as it plays a crucial role in the potential rate for
development. Table 2.15 provides an indication of the highest education levels reached.
Table 2.15 Level of education of the population aged 20 years and older
LEVEL PLM NLM GTLM FBD BD NW NC RSA
No Schooling 22% 21% 25% 13% 27% 15% 14% 11%
Primary 31% 29% 36% 27% 32% 31% 31% 26%
Secondary 37% 39% 31% 47% 32% 42% 44% 48%
Tertiary 9% 9% 6% 10% 7% 8% 9% 12%
Unspecified 1% 1% 2% 3% 2% 4% 3% 3%
TOTAL 100% 100% 100% 100% 100% 100% 100% 100%
Source: Kayamandi Development Services Calculations from Community Survey 2007
Figure 2.8 provides an indication of the percentage distribution of education of people
aged 20 years and above.
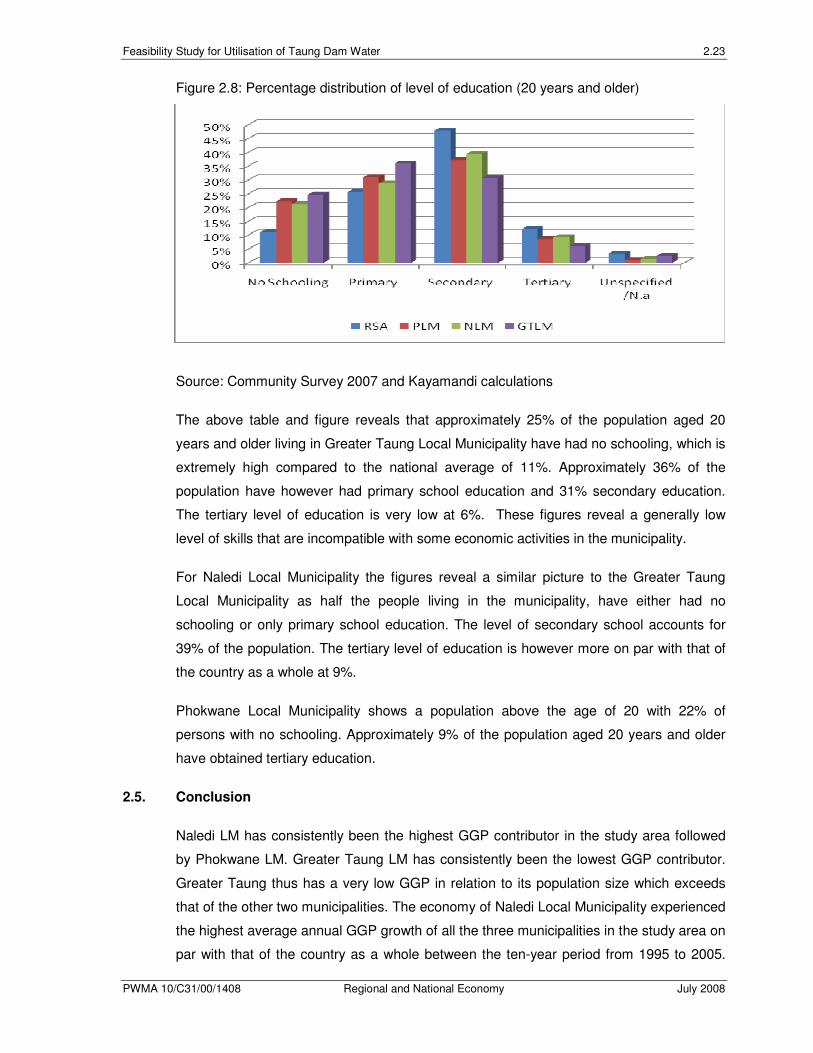
Feasibility Study for Utilisation of Taung Dam Water 2.23
PWMA 10/C31/00/1408 Regional and National Economy July 2008
Figure 2.8: Percentage distribution of level of education (20 years and older)
Source: Community Survey 2007 and Kayamandi calculations
The above table and figure reveals that approximately 25% of the population aged 20
years and older living in Greater Taung Local Municipality have had no schooling, which is
extremely high compared to the national average of 11%. Approximately 36% of the
population have however had primary school education and 31% secondary education.
The tertiary level of education is very low at 6%. These figures reveal a generally low
level of skills that are incompatible with some economic activities in the municipality.
For Naledi Local Municipality the figures reveal a similar picture to the Greater Taung
Local Municipality as half the people living in the municipality, have either had no
schooling or only primary school education. The level of secondary school accounts for
39% of the population. The tertiary level of education is however more on par with that of
the country as a whole at 9%.
Phokwane Local Municipality shows a population above the age of 20 with 22% of
persons with no schooling. Approximately 9% of the population aged 20 years and older
have obtained tertiary education.
2.5. Conclusion
Naledi LM has consistently been the highest GGP contributor in the study area followed
by Phokwane LM. Greater Taung LM has consistently been the lowest GGP contributor.
Greater Taung thus has a very low GGP in relation to its population size which exceeds
that of the other two municipalities. The economy of Naledi Local Municipality experienced
the highest average annual GGP growth of all the three municipalities in the study area on
par with that of the country as a whole between the ten-year period from 1995 to 2005.

Feasibility Study for Utilisation of Taung Dam Water 2.24
PWMA 10/C31/00/1408 Regional and National Economy July 2008
However, the economy of the Greater Taung Local Municipality only grew at nearly a
quarter than that of the country as a whole and Phokwane Local Municipality experienced
growth at nearly half than that of the country as a whole. The study area, mostly
Phokwane and Greater Taung Local Municipalities are thus areas with relatively low
growth compared to the country as a whole. The area also has a small economy in
relation to its contribution to the districts and provinces in which they are situated. This
area will thus benefit from economic injections in the form of the proposed development.
Unemployment is also a major problem in the area, hence the low GGP contribution,
which serves as fertile ground for other social problems that hinder economic
development and social well being. Many people in the area are uneducated, or have low
levels of skills that are incompatible with the desired level of economic activity in the
municipality. Those who are employed are usually employed in low-income industries
such as farm workers or domestic workers. There are very few professional workers in the
area. The result is that that a large portion of the population has limited to no income.

Feasibility Study for Utilisation of Taung Dam Water 3.1
PWMA 10/C31/00/1408 Regional and National Economy July 2008
3. REGIONAL AND NATIONAL ECONOMIC IMPACTS
This section outlines the possible economic impacts that can be expected to occur in the
local and regional economy as a result of utilisation of water from the Taung dam. It is
important to note that the quantification of economic impacts on the regional and national
economy as determined with the input/output analysis is not based on local population
figures, but on additional expenditure in the economy during the construction and
operation phase associated with the infrastructure development required to enable supply
of domestic use of water from the Taung Dam to the villages south-east of Taung Dam,
Bogosing Water Supply area, and the Taung Water Supply area.
The following aspects are covered in this Section:
• Impact assessment assumptions;
• Impact assessment technique for quantification of regional and national impacts;
• National and Regional Economic Impacts during Construction;
• National and Regional Economic Impact during Operation; and
• Economic value of domestic water supply.
3.1 Impact Assessment Assumptions
This economic impact is based on the following knowledge and assumptions of utilisation
of Taung dam water at this stage:
• The pipeline will be installed outside of the road reserve outside of towns and
villages and inside the road reserve where the road goes through towns and
villages;
• A 12 metre wide servitude is required for the pipeline;
• No new fences will be installed alongside the servitude;
• The water of the Taung Dam will be utilised to provide in primary water needs only; and
• The construction phase will take place during 2010 and 2011.
3.2 Impact assessment technique for quantification of regional and economic impacts
In terms of quantifying the impacts on the regional and national economy an input-output
model was utilised. An input-output model has various analytical applications that can be
used to determine the direct, indirect and induced impact of the proposed transformation
process on the economy. The approach takes into account the interdependence between

Feasibility Study for Utilisation of Taung Dam Water 3.2
PWMA 10/C31/00/1408 Regional and National Economy July 2008
different sectors (i.e. agriculture, mining, manufacturing, government, etc) in the local
economy as well as economic flows of goods and services to and from the economy.
This technique provides a snapshot of economic production at a given point in time and,
as such, has numerous application possibilities. The most prominent application of this
technique involves modelling the impact of changing production functions on general
economic equilibrium. In other words, the impacts that increased expenditure in the
economy resulting from the construction and operation of the civil and mechanical
components required for the utilisation of water from the Taung Dam were modelled.
Economic impacts are those impacts that affect the level of economic activity in a region.
For instance they directly affect the economic well-being of area residents and businesses
by changing employment levels and retail expenditures. An economic impact assessment
traces spending through an economy and measures the cumulative effects of that
spending.
Estimating the economic impact of a project or development is very helpful in
understanding the potential benefits of various forms of growth. It should be noted,
however, that the means of estimating these benefits are more useful in understanding
the likely order of magnitude of impacts rather than specific amounts.
Typically the effects of the input/output technique are as follows:
• The direct effects: this takes into account direct purchases made within the economy
by the project, the number of people employed, etc. This effect is the initial,
immediate economic activities (jobs and income) generated by a project or
development. Direct impacts associated with the development coincide with the first
round of spending in the economy.
• The indirect effects (backward linkages): this takes into account the fact that the
supplying industries (such as construction related industries, catering industries,
transport industries, etc) will also have to purchase more inputs, employ more labour
and pay more wages, and that there will be a chain reaction or multiplier of effects
as a result of increased spending in the economy. In other words indirect impacts
are the production, employment and income changes occurring in other
businesses/industries in the community that supply inputs to the project industry.
• The induced effects (forward linkages): this takes into account the fact that the
increased household income leads to an increase in household expenditure and to
increases in national production. Furthermore, the project will pay large amounts of

Feasibility Study for Utilisation of Taung Dam Water 3.3
PWMA 10/C31/00/1408 Regional and National Economy July 2008
revenue to the different tiers of government, which in turn will increase overall
government expenditure in the economy. For instance, the induced effects arise
when employees who are working on the project spend their new income.
• The sum of the direct, indirect and induced effects is the total effect.
3.3 National and Regional Economic Impacts during construction
The following national and regional economic impacts (described hereunder) are
anticipated during the short-term construction phase:
• Stimulation of economy;
• Employment creation, decrease in local unemployment level and skills transfer;
• Business output/sales and increased standards of living;
• Government income and expenditure; and
• Inflow and outflow of temporary workers.
3.3.1. Stimulation of the economy
The construction of the infrastructure required for the provision of domestic water supply
will have a positive impact on the economy due to: increased financial spending in the
economy related to increased infrastructure investment, civil construction, mechanical
purchases, and increased expenditure by employees. This impact on the economy can be
manifested in terms of the sectoral impact on GDP.
In many instances goods do not reach the consumer via the market and it is also difficult
to calculate the value of these goods. As a rule therefore only the results of the activities,
which are intended to satisfy the needs of other people through trade, are considered to
form part of the GDP. If this is to be stated by way of formula, taking into account the
concept of value added, it can be put as follows: Gross value of production less value of
intermediate goods and services equates to gross value added. If the gross value added
of all the trading sectors is added together the GDP is obtained.
Change in gross domestic product essentially reflects the sum of wage income and
corporate profit generated in the study area as a result of an exogenous change in the
economy, in this case bulk water infrastructure.
In order to determine the increased financial spending in the economy the current
estimates of expenditure during construction were obtained.

Feasibility Study for Utilisation of Taung Dam Water 3.4
PWMA 10/C31/00/1408 Regional and National Economy July 2008
It is important to realise that the construction impact is experienced during the
construction period. Thus, it is only sustainable for the duration of the development, i.e.
two years. Once the development phase nears its end, the construction impact
diminishes.
The local area and its activities (businesses and shops, etc) are expected to be stimulated
economically, due to the increased spending expected from the increased salaries and
wages paid to employees during construction and service industries in the region will thus
benefit from the activity. This will have a knock-on effect on suppliers of goods and
services in other areas.
The capital investment during the construction is thus expected to have a positive impact
on the economy resulting in increased financial spending in the economy in terms of
construction related activities, the increased infrastructure investment as well as increased
expenditure from the construction workers. This positive impact is likely to be experienced
in terms of the increased markets for the sale of local goods to construction staff and
direct employment by construction contractors.
The exogenous change in the economy will impact different sectors in different ways, with
some sectors such as manufacturing, trade and finance and business services benefiting
more than others. Sectoral impacts could include:
• Agriculture - during the construction phase the agriculture sector will be stimulated due
to the need for minor primary inputs from the agriculture sector for the infrastructure
development (such as lubricants) as well as for the increased purchases from
construction workers;
• Mining - During the construction phase the mining sector will be stimulated due to the
need for construction materials such as quarry for sand and gravel, and materials
used in the production of cement, iron, steel, etc;
• Manufacturing – Positive stimulation. Possible industries to be stimulated include
construction vehicles, concrete and cement, iron, steel and machinery, including
pumps;
• Construction – this sector will receive a large boost during the construction phase of
the option which include canals, pipelines, weirs, reservoirs, etc as well as indirect
construction. As construction is fairly labour intensive it is expected that a large
number of employment opportunities will be created although only temporary in nature
during construction;

Feasibility Study for Utilisation of Taung Dam Water 3.5
PWMA 10/C31/00/1408 Regional and National Economy July 2008
• Trade- the trade sector includes retailers, wholesalers, restaurants and
accommodation establishments which are all expected to be stimulated mainly during
construction. The increase in people employed will lead to increased buying power in
the area which directly stimulates the wholesalers and retailers. Trade will be
stimulated by the large number of people either staying or moving around the area;
and
• Transport, finance and services: These sectors will be simulated mainly during the
construction phase through the increased number of people in the area.
The additional GDP arising from the capital investment during the construction phase of
the bulk water supply infrastructure could be approximately R60 million, approximately
half of which is due to the direct impact, R25 million due to the indirect impacts and R5
million due to the induced impacts. Approximately R5 million of this impact will accrue to
the North-West Province. During the construction phase the majority of the impact will be
felt in the construction, manufacturing, trade, and transport sectors.
The multiplier or spin-off effects associated with this economic contribution (namely capital
expenditure, salaries and wages, etc) include improved standards of living, decreased
dependence on pensions, increased disposable income and ability to purchase additional
goods and/or establish other business enterprises. Apart from having the potential to
create occupational opportunities, the proposed development could also stimulate
economic growth in the region by attracting other commercial activities. If this is the case,
indirect local benefits may accrue in the form of job opportunities in other sectors and
industries. The proposed development may also serve as a catalyst for the improvement
of services and infrastructure in the longer term.
3.3.2. Employment creation and skills transfer
During the construction phase, temporary employment will be created. The increased
temporary employment in the area during the construction phase will also result in
increased expenditure, which, in addition, will mean that more than just the proposed jobs
required for the construction will be created due to economic spin-offs that will result.
During and towards the end of the construction period, the temporary employment
contracts awarded need to be terminated. This could result in sudden loss of income,
wealth, new business sales, etc. The employees, surrounding community, businesses, etc
would all need to be informed of this from the start so that expectations are not created
and that the negative effects associated with the termination of temporary employment
contracts can be absorbed as far as possible.

Feasibility Study for Utilisation of Taung Dam Water 3.6
PWMA 10/C31/00/1408 Regional and National Economy July 2008
The unemployment rate of the economically active population within the communities in
the affected municipalities is currently high. The proposed development will thus bring
some relief to the high unemployment figures in the area during the construction phase.
Most of the indirect and induced jobs will be created in the manufacturing, finance and
business sector, mining, trade and accommodation sectors and transport sectors. During
the construction phase, local contractors and service providers need to be utilised as far
as practically possible.
The benefit of increased jobs in the area can also be translated into economic terms, and
the additional jobs would in essence result in additional income creation. This increase in
income in the area can be translated into specific impacts ranging from black economic
empowerment (BEE) to poverty alleviation depending on the procurement policy and the
construction technology applied. More previously disadvantaged people could be provided
with an opportunity to become involved in the formal economy and also provided with an
annual income that would place them in the financial position to acquire all the goods and
services that are required to maintain a basic level of living.
Total employment generation reflects the number of jobs created or lost as a result of the
exogenous change in the economy. A job is defined as one person employed for one
year. This does not mean that new job opportunities arise per year, but that new man
days of work arise each year some of which could be fulfilled by existing employees
others requiring new temporary employment, etc.
The proposed infrastructure development and mechanical manufacturing of infrastructure
requirements will lead to the creation of additional jobs to the approximate amount of
1,800 during the construction phase. The direct temporary employment opportunity during
the construction phase is approximately 600 jobs. Approximately 10% of the national
employment effect will accrue to the North West Province. The sectors mostly stimulated
by additional employment generation during the construction phase are the construction
sector, services and household sector and the manufacturing sector.
With an increase in employment, a definite transfer of skills will result. Skills development
is a requisite for human resource development, and will have a lasting impact on the
economy. Allied to the additional jobs created during the construction phase there will be
an element of skill acquisition. This skill acquisition is valuable in that people that have
acquired these skills will be able to search elsewhere for similar construction employment
after the completion of the construction phase, and will be better equipped to handle the
D.I.Y household jobs. It should however be noted that the skill acquisition will probably be
Feasibility Study for Utilisation of Taung Dam Water 3.7
PWMA 10/C31/00/1408 Regional and National Economy July 2008
limited to on the job training although skill acquisition is expected to take place since the
construction phase is estimated to last two years.
3.3.3. Business output/sales and increased standards of living
The increased employment expected with the construction of the bulk water infrastructure,
will impact positively upon the regional and local economy.
Increased employment is associated with increased income and consequently with
increased buying power in the area, thus leading to new business sales. With the
increased employment and a subsequent increase in monthly incomes, increased
business opportunities can be experienced. The economic benefits mostly include an
increase in trade such as local shops, restaurants, accommodation and transport
services. These increases in businesses are as a result of the following factors:
• Increased market size;
• Higher disposable incomes;
• Satisfaction of identified needs (such as building materials, or foodstuffs); and
• Increased consumer spending and increase entrepreneurial opportunities.
New Business Sales refers to the value of all inter- and intra-sectoral business sales
generated in the economy as a consequence of the introduction of an exogenous change
in the economy. Explained more simply, new business sales equates to additional
business turnover as a result of the introduction of a change in the economy.
Direct investment in the construction sector during the construction phase will yield new
business sales to the value of approximately R490 million for the bulk infrastructure.
Approximately R50 million of the total national effect is likely to accrue to the North West
Province. During the construction phase the sectors that will mostly be stimulated by new
business sales include the electricity and water sector, the construction sector, the
manufacturing sector, and the household sector.
As such it is evident that over and above the originally invested money during the
construction phase, a large amount of revenue is generated due to the multiplier effect in
the different sectors of the economy.
The sectors that will experience the highest demand for additional output are
manufacturing (i.e. manufacturing and supply of building materials), trade (i.e. supply of

Feasibility Study for Utilisation of Taung Dam Water 3.8
PWMA 10/C31/00/1408 Regional and National Economy July 2008
final goods and services), finance, real estate and business services (i.e. professional
services).
It is also anticipated that a positive local impact will be felt at Taung due to increased local
shopping and accommodation requirements during construction. The injection of
employment and money into the local community will be beneficial to the
towns/settlements as a whole. The increased employment expected with the
development, will also impact positively upon the regional and local economy. Increased
employment is associated with increased income and consequently with increased buying
powers in the area, thus raising the standards of living of the area. Given the current high
unemployment rate in the surrounding towns/settlements, the project therefore has the
potential to bring much needed economic relief to the local population.
With the increased employment and a subsequent increase in monthly income, increased
business opportunities can be experienced with the development. The economic benefits
that could be obtained include an increase in trade, and the development of new trade
such as local spazas, shops, stalls, etc as a result of the patronage of construction staff.
3.3.4. Government income and expenditure
The bulk water infrastructure can be seen as an economic injection to the area as it would
lead to increased government income.
The economic impacts will lead to fiscal impacts, which are changes in government
revenues and expenditures. For example, economic impacts on total business sales,
wealth or personal income can affect government revenues by expanding or contracting
the tax base. Due to the jobs that will be created as a result of the proposed development
as well as the increased business activity levels, the salaries and wages of those jobs
along with the increased turnover of the companies can be translated into increased
personal and business income tax.
In other words, government income will be increased as a result of the increase in tax it
will receive from the proposed construction of the bulk water infrastructure. The increased
government income from tax will mostly be as a result of increased economic activity.
Increased tax received by the government will be in the form of:
• Company tax;
• PAYE;
• UIF (Unemployment Insurance Fund);
• Skills development Levy (SDL); and
Feasibility Study for Utilisation of Taung Dam Water 3.9
PWMA 10/C31/00/1408 Regional and National Economy July 2008
• Rates and taxes.
The proposed bulk infrastructure can thus be seen as an economic injection into the area
as it would lead to increased government income. The development could thus lead to the
creation of other economic spin-offs that benefit the entire region. Local benefits could
accrue to the government through an increased tax base increasing the capacity of the
local municipality and other social and service support actions. In other words, the
increased income received by the government will enable increased spending locally. This
means that increased government services such as community facilities could be provided
by the increased income generated.
3.3.5. Inflow and outflow of temporary workers
Impacts of large-scale development projects tend to be closely associated with the
relocation (immigration) of project workers and their families to communities near the
project site. This will thus lead to a substantial local population growth, demands on local
services and infrastructure, fiscal problems for local governments, and increased
problems of social assimilation.
These problems are typically exacerbated by fluctuations in workforce size, which could
occur during the construction based on the different construction components and the
length of the construction period. The influx of people could be brought about by a number
of factors. Through its positive economic impacts, the construction phase can attract
squatters in search for employment (both directly and indirectly related to the project).
Squatter camps can have a number of environmental impacts, which in turn impact upon
the economy, such as an increase in crime, increase in STDs and related illnesses,
increased pressure on social facilities and bulk infrastructure, potential loss of power
amongst local traditional leaders, etc.
Key factors affecting the number of workers and dependents who move to the site include
the size of the project workforce, the magnitude of secondary employment effects, the
proportion of the jobs that are filled by local project workers (including daily commuters),
the extent to which non-local project workers are accompanied by their families, and the
size of those families.
In the event of imported workers entering the area during the construction phase, conflict
may arise with the local population due to different cultures, traditions and habits.
Imported workers may be relatively well paid compared to the local workforce around
towns and farms, which could lead to conflict.

Feasibility Study for Utilisation of Taung Dam Water 3.10
PWMA 10/C31/00/1408 Regional and National Economy July 2008
Therefore, an emphasis on use of local labour is suggested as the use of outside or
imported labour may have negative implications for the surrounding economic status quo.
The ‘outside’ persons could create a new social class with different behaviours and
lifestyles. Employment of a large outside workforce could lead to conflict between
‘outsiders’ and locals due to differences in culture and values, competition for employment
opportunities, a perception among local residents that facilities are being provided for
outsiders while their own needs are not being addressed, etc.
The accommodation of staff in the absence of their family members - has the potential to
result in more incidences of sexually transmitted diseases (STDs) and AIDS. In these
instances employees are away from home and are not accountable to family structures
that assist in providing the checks-and-balances often necessary for the control of sexual
promiscuity. In addition, the disposable income available to employees makes them an
attractive target for sex workers. Furthermore, local men and women may become
romantically involved with construction staff that have previously contracted STDs or
AIDS. These may all negatively impact the regional economy.
Increase in local population could also trigger indirect impacts such as a higher crime rate.
This will be impacted by the rate of influx of persons due to the construction activities.
Crime in the area is currently controlled by virtue of the fact that residents know each
other and are familiar with the comings-and-goings of their neighbours and fellow
residents. The in-migration of outsiders (including construction staff) will therefore dilute
the extent of familiarity within the area and undermine the role of familiarity as a system of
control. In addition, outsiders may not respect the judiciary roles of the traditional leaders
and the part that they play in controlling the extent of crime in the area.
3.4. National and Regional Economic Impacts during operation
The following national and regional economic impacts (described hereunder) are
anticipated during the long-term operation phase:
• Stimulation of economy;
• Employment creation, decrease in local unemployment level and skills transfer;
• Business output/sales and increased standards of living; and
• Government income and expenditure.

Feasibility Study for Utilisation of Taung Dam Water 3.11
PWMA 10/C31/00/1408 Regional and National Economy July 2008
3.4.1. Stimulation of the economy
The operation and maintenance of the infrastructure associated with the delivery of
domestic water supply will have a positive impact on the economy due to increased
financial spending in the economy, and increased expenditure by employees. During the
operation phase, GDP will be stimulated but to a far lesser degree than in the construction
phase due to far less jobs being created and far less expenditure. However, the operation
impact will be sustained for a longer period and the impacts associated are thus far more
sustainable.
Possible regional economic influences that may impact on the growth of the study area
during operation include:
• Regional development initiatives - the development policies of the North West
compared to other provinces as well as the status of the study area in the province;
• Agriculture- possible expansion of irrigation (although not as a direct result of the
infrastructure developed for the supply of domestic water); and
• Capital development projects – the study area will receive an economic boost from
employment of local labour and purchasing of supplies. The injection of capital in the
operation phase is however small in comparison to the value of the project.
The additional GDP arising from the operating expenditure during the operational phase is
approximately R400 000 per annum. This means that the economy will experience a
direct growth effect during the operation period of approximately R200 000, and an
indirect growth effect of approximately R150 000 and a relatively small induced effect of
R50 000. Furthermore, based on expected procurement, approximately R40 000 per
annum will accrue to the North-West Province. During the operation phase the sector
mostly stimulated by additional GDP generation is the water and electricity sector.
3.4.2. Employment creation, decrease in local unemployment level and skills transfer
Full-time employment during the operation of bulk water distribution and purification works
will have a permanent effect on the economy, although probably far less than during the
construction phase. Apart from the permanent directly created jobs there will be scope for
other jobs to be created by the local population due to spin-off effects in the economy as
well as due to stimulation of additional income generating activities consequent upon
greater water supply. Stated differently, during operation the access to potable water will

Feasibility Study for Utilisation of Taung Dam Water 3.12
PWMA 10/C31/00/1408 Regional and National Economy July 2008
also result in the avoidance of job losses due to current water supply not meeting
demands.
During the operation phase the project will lead to the creation of an additional 5 jobs per
annum approximately. Note that a job is defined as one person employed for one year. It
is relevant to note here that the operating expenditure impact is expected to be relatively
small and will most probably be absorbed by the existing management and maintenance
personnel. It is also assumed that most of the operating expenditure will be spent on the
maintenance of the facilities/infrastructure.
Apart from the permanent directly created jobs there will be scope for other
entrepreneurial jobs to be created by the local population. The majority of the indirect and
induced employment will be in the retail and trade sector. For instance, women can
engage in economic activity, household chores, obtain education rather than spend time
and energy collecting water – opportunity benefits of piped water. These are explained in
detail in the following sub-section relating to the economic value of increased domestic
water provision.
Transfer of skills during the operation/maintenance phase will probably take place but on
a far smaller and relatively insignificant level as permanent positions will probably be filled
by existing staff.
3.4.3. Business output/sales and increased standards of living
During operation, it is anticipated that fewer people will be employed than during the
construction, although persons will be permanently employed during operation. These
persons will experience a substantial and lasting increase in their standards of living. In
addition the increased income earned by permanent employees as well as the increased
income earned from the stimulation of income generating activities consequent upon
larger quantities of water supply will result in increased buying powers and hence an
increase in local business sales and standards of living.
During the operation phase the investment in the economy, associated with the
maintenance and operation of the infrastructure only, will generate new business sales to
the approximate value of R2 million per annum of which approximately R1 million is a
direct impact and the remaining is due to indirect and induced effects. Approximately
R240 000 of the total national effect is likely to accrue to the North West Province per
annum. During the operation phase the sectors that will mostly be stimulated by new
business sales include the electricity and water sectors, the household sector, the
manufacturing sector and the financial services sector.

Feasibility Study for Utilisation of Taung Dam Water 3.13
PWMA 10/C31/00/1408 Regional and National Economy July 2008
As such it is evident that over and above the annual investment during the operation
phase, additional revenue is generated due to the multiplier effect in the different sectors
of the economy.
3.4.4. Government income and expenditure
The operation and maintenance of the bulk water infrastructure can be seen as an
economic injection into the area as it would lead to increased government income.
The economic impacts will lead to fiscal impacts, which are changes in government
revenues and expenditures. During the operation phase, the expected permanent jobs per
annum will bring in a constant income to the government in the form of personal tax. In
addition company tax and VAT, other indirect taxes and services will also be a sustained
income for the government during the operation.
The operation and maintenance of the proposed bulk infrastructure can thus be seen as
an economic injection into the area as it would lead to increased government income. The
development could thus lead to the creation of other economic spin-offs that benefit the
entire region. Local benefits could accrue to the government through an increased tax
base increasing the capacity of the local municipality and other social and service support
actions. In other words, the increased income received by the government will enable
increased spending locally for a sustained long-term period.
3.5. Economic value of domestic water supply
The following economic impacts (described hereunder) are anticipated once the bulk
water supply infrastructure is operational and domestic water supply is provided to the
villages south-east of Taung Dam, Bogosing Water Supply area, and the Taung Water
Supply area:
• Stimulation of income generating activities and opening up area for development;
• Freeing up time from fetching water and obstacles for economic development;
• Decrease economic decline related to water shortages;
• Provide essential final good and opening up additional household end-uses;
• Decrease in poor health related economic burdens;
• Opening up opportunity for home gardening; and
• Freeing up water supply for other user sectors.

Feasibility Study for Utilisation of Taung Dam Water 3.14
PWMA 10/C31/00/1408 Regional and National Economy July 2008
3.5.1. Stimulation of income generating activities and opening up area for development
Currently the Taung Dam has spare capacity and the purpose of the project is to best use
the spare capacity of water. Water is a scarce resource and it can be reasoned that water
should be rationed to competing uses according to economic criteria or maximisation of
returns. However water is not a private good but a public or merit good since it is a scarce
natural resource consumed collectively and provision necessitates both government
intervention and finance. The price of water is thus not determined by the market forces of
supply and demand. Since the market mechanism is not functioning in the water market,
the price of water is not known. It is therefore necessary to determine the economic value
of water which will serve as a proxy for the market price of water. The value of water is
important in two distinct, albeit related roles:
• Firstly where the supply of water is insufficient in relation to the demand in certain
short-term circumstances such as severe drought, the value of water serves as a
proxy for a component of the price system in targeting water restrictions so as to
cause least harm; and
• Secondly, the financial resources spent on providing the appropriate level of water
supply in the long-term to consumers and the economic optimal level of development.
Demand from each water using sector must be viewed in relation to the total available
water supply. Sectors compete for available water supplies, but each sector’s continued
existence is partially dependent upon the output of other sectors and hence their need for
water. Sectors are thus economically interdependent and each is dependent upon water
availability. A shortage of water in a particular sector may indirectly restrict output of
several sectors.
It is however generally not economically feasible to develop and operate a water resource
system to meet all the sectoral demands at all times. This means that 100% of the
demand cannot be supplied for 100% of the time and shortfalls in the supply will occur
from time to time. If shortfalls occur frequently the supply will have a low assurance and
relatively few shortfalls represent a high assurance in supply. It is important here to note
that different types of user groups or categories will require a different assurance of
supply. Irrigation will typically be supplied at a lower assurance than water for domestic
and industrial purposes and water for strategic industries such as power generation will be
supplied at even a higher assurance. It is also logical to sub-divide the supply to irrigation
into different assurance levels, as permanent crops such as export grapes would require a
higher assurance than for example a cash crop.

Feasibility Study for Utilisation of Taung Dam Water 3.15
PWMA 10/C31/00/1408 Regional and National Economy July 2008
Since households need 100% assurance of water supply, the water of the Taung Dam
would be utilised to provide in primary domestic water needs only. Households supplied
with water in house need a guaranteed supply and it is thus not sensible to take some of
the water from the Taung Dam for other uses such as irrigation when some households
could suddenly have insufficient water for essential domestic use.
The higher supply of domestic water during operation could result in the stimulation of
economic activities reliant on water such as tourism related development, as well as a
stimulation of irrigation (indirectly due to freeing up water supply in other areas), industrial
and agricultural water users, and other economic activities. This will cause a permanent
economic upliftment in the area.
The Taung Dam is reportedly an attractive dam site and tourism developments are
already in place and underway. As the dam offers tourism and recreational opportunities,
the North West Parks and Tourism Board is in the process of establishing a protected
environment around the Taung Dam. This will mean additional job opportunities for local
people in the tourism sector. It is expected that the development of existing towns within
the area as service centres for tourism will be crucial in ensuring maximized use of
products and services from the area and avoiding leakages. This will ensure that tourism
development in the area is to the maximum benefit of the area.
Access to water could lead to economic spin-offs for the local community, particularly
women. Water is a holistic resources - water supply is not just about drinking water and
domestic use. Effective projects around the world have shown that water supply can also
be linked to income generating activities and local economic upliftment. Water is an
essential input in agriculture, and also in several manufacturing industries. Economic
development opportunities in sectors that are heavily dependent upon water to provide
their services include:
• Laundry and cleaning facilities;
• Sport related clubs and facilities;
• Amusement and recreation services;
• Hotels and lodging places;
• Eating and drinking establishments;
• Car washes;
• Hair dressers and other personal services;
• Butchery;

Feasibility Study for Utilisation of Taung Dam Water 3.16
PWMA 10/C31/00/1408 Regional and National Economy July 2008
• Farming: horticulture and livestock and irrigation; and
• Food and beverages.
3.5.2. Free up time from fetching water and obstacles to economic development
In textbook economics, entrepreneurs use resources to produce goods and services that
they have to sell at a profit in order to survive. The owners of those resources earn an
income by either selling or hiring out their resources or by using them themselves in
production. Without productive resources there can be no economic activity. Some of the
most important resources available to people are land, water, capital (finance) and human
skills. In the study area (and South Africa as a whole) there has been a long history of
proscribed access to these resources. This has affected rural people and rural areas in
many different ways, and lies at the heart of the ‘rural problem’.
Access to potable water remains the most critical and worrying constraint for many rural
people, and many of them spend several hours a day securing supplies. Women (and
children) are mostly affected by having to walk longer distances to collect smaller amounts
of water. The time lost is invaluable to most women and children.
The provision of potable water for domestic use will have profound and far reaching
impacts on the population and will release them for spending several hours a day securing
supplies to being able to search for work, undertake education, etc. All of these will have
profound effects on the regional economy.
Economics is essentially about the way in which tradeoffs, seen from a human welfare
point of view, influence decision-making. Tradeoffs are always made when making
decisions about scarce resources, and the funds that are expended on ensuring access to
potable water represent a scarce resource. Thus in allocating the water to domestic use,
the opportunity to use them for another use is foregone, and the value of this other use is
the opportunity cost of putting them to the first use.
Key aspects to be noted in supply of domestic water are:
• The element of equity: addressing the past inequity between communities in service
access which encompasses the social component of water use;
• The element of sustainability: the environmental need for water (as well as that of
downstream users including neighbouring states); and

Feasibility Study for Utilisation of Taung Dam Water 3.17
PWMA 10/C31/00/1408 Regional and National Economy July 2008
• Economic efficiency, cost recovery, user-payments and private sector involvement:
water is seen as an economic good, to be used in the most efficient setting possible
to promote the overall economic development of the country.
The regional economic effects of potable water provision have most obviously been noted
under the previous system where water ownership was tied to ownership of land, and as a
result the majority of South Africans were “condemned to a life of poverty, insecurity and
contentious exposure to diseases that would otherwise be avoidable. With access to
potable water the obstacles in the development of the following impoverished
communities will be addressed:
• 14 villages south-east of Taung Dam who currently obtain all their water from
rudimentary borehole schemes;
• 6 villages being supplied by the Bogosing Water Supply which is highly inefficient and
turbidity in the water is problematic for the communities; and
• 11 villages in the Taung area currently being supplied by the Pudimoe Water Supply
Scheme with insufficient capacity for future water demand.
Unemployment is high in these villages and many people rely on income from family
members working in the cities. Many communities struggle to find water for domestic use.
Development opportunities in the area have been few, hampered inter alia by a lack of
water. The provision of potable water to these communities will also result in a key
regional economic impact namely the improved spatial distribution of water and the
matching of supply with demand. This project will thus improve the quality of life of the
poor and will enable keeping intact the onslaught in the fight against poverty.
Furthermore, access to domestic water includes water that people use in their homes for
things such as cooking, bathing, drinking and removing household waste and for outdoor
purposes including lawn watering, car-washing and swimming pools. Shortage of water
would mean that households would probably have to eliminate some or all outdoor water
use, which could have implicit and explicit economic costs including losses to the
horticultural and landscaping industry.
3.5.3. Decrease economic decline related to water shortages
The effects of water shortages can be social or economic. Distinctions between the two
are both semantic and analytical in nature – more so analytic in the sense that social
impacts are much harder to measure in quantitative terms. Nevertheless, social effects

Feasibility Study for Utilisation of Taung Dam Water 3.18
PWMA 10/C31/00/1408 Regional and National Economy July 2008
associated with drought, water shortages or limited access to water (as in this case)
usually have close ties to economic impacts. For example, they might include:
• Demographic effects such as changes in population -which impact upon the
economy;
• Disruptions in institutional settings including activity in schools and government;
• Conflicts between water users such as farmers and urban consumers;
• Health related low flow problems (e.g., cross connection contamination, diminished
sewage flows, increased pollutant concentrations);
• Mental and physical stress (e.g., anxiety, depression, domestic violence);
• Loss of aesthetic and property values;
• Reduced recreational opportunities; and
• Decrease in demand for workers due to unmet water needs which could affect
migration patterns in a region.
However, the notion that water supply contributes to economic growth and development is
highly intuitive. It is known that many of the world’s major cities owe their origin to their
location along coasts or rivers where water-borne transportation was facilitated. But, the
relevant question is whether an increment in water availability would generate an
increment in economic activity today, and how much. Water projects have long been
advocated for their claimed contribution to regional economic development. However
investment in water supply does not automatically guarantee economic growth. But this
does not mean that there is never an economic case for investing in water supply. While
water does not automatically generate growth, it may be the case that areas which persist
in lacking an adequate water supply (regardless of whether or not they started out with
adequate water) will not flourish economically. For example, one can expect that people
will eventually leave those areas and migrate to other areas that do have an adequate
water supply. Thus, lack of water could be a sufficient condition for economic decline or,
to put it another way, water may be necessary, but not sufficient for economic growth.
3.5.4. Provide essential final good and opening up additional household end uses
Water is essential for life – human, animal, or plant. In economics, there is a concept, also
called essentialness that formalizes this notion. The concept can be applied either to
something that is an input to production or to something that is directly enjoyed by people
Feasibility Study for Utilisation of Taung Dam Water 3.19
PWMA 10/C31/00/1408 Regional and National Economy July 2008
as a consumption commodity. In the case of an input, if an item has the property that no
production is possible when this input is lacking, the item is said to be an essential input.
In the case of a final good, if it has the property that no amount of any other final good can
compensate for having a zero level of consumption of this commodity, then it is said to be
an essential commodity. Water obviously fits the definition of an essential final good:
human life is not possible without access to water.
In addition to being essential for human life, water contributes in important ways to the
enjoyment of the satisfactions of life. Consequently, there are many other residential end
uses of water besides its use for drinking. Water consumption has grown over time
through the steady accretion of end uses, each representing the discovery of a new way
to employ water for people’s use and enjoyment. When a piped water supply first became
available, the initial household uses were the same ones that had existed when family
members had to fetch water from an external source – drinking, cooking, hand washing,
and limited bathing. As time passed, many other uses were found – tubs for bathing,
water borne sanitary waste disposal, outdoor landscape and garden watering, automatic
clothes washers, swimming pools, automatic dish washers, car washing, garbage
disposal, indoor evaporative cooling, hot-tubs, lawn sprinklers, etc. The result has been a
constantly rising trajectory of per capita household water use.
It is common to talk of the value of water as though it were a single, homogenous
commodity. This is obviously false: water has many dimensions besides just quantity.
These include: (a) location, (b) timing, (c) quality, and (d) variability/uncertainty. To a user,
one litre of water is not necessarily the same as another litre of water if it is available at a
different location, at a different point in time, with a different quality, or with a different
probability of occurrence.
There are numerous ways in which an increment in water might produce benefits, whether
to those who use the water directly or to others. Examples include: the use of water for
agricultural or industrial production, its use for hydropower or for navigation, residential
use, water based recreation, or aquatic habitat.
It is however important to note that it is not the responsibility of the Department of Water
Affairs and Forestry to provide water to individual households. This remains the
responsibility of the relevant local authorities. The project will include reservoirs from
which local authorities will be able to source water for domestic reticulation. Importantly,
the Department should however engage with the relevant stakeholders to ensure the
required plans and programmes are in place. The Department should also support

Feasibility Study for Utilisation of Taung Dam Water 3.20
PWMA 10/C31/00/1408 Regional and National Economy July 2008
municipalities in securing funding for water services infrastructure. This is an important
aspect in terms of successful cooperative governance.
3.5.5. Decrease in poor health related economic burdens
The lack of access to adequate water supply brings the risk of ill-health or even death and
undermines people’s dignity. Ill-health and death have a profound impact on the regional
and national economy.
The access to an assured supply of domestic water could be sufficient to respond to
special needs for the sick, particularly relevant in the light of the HIV/AIDS crisis. The
positive impact which providing a workable amount of clean water will have on the overall
health of the population far outweighs the direct financial costs of providing the water.
However, for water supply to be effective in improving health, interactive/participatory
health and hygiene education is critical.
Women and children are the primary managers of water at household level and have to
bear the burden of increased sickness in the household associated with waterborne
diseases. Women therefore have the most to gain from a successful water project.
Women are also primarily responsible for health and hygiene, so their meaningful
involvement is equally important.
3.5.6. Open-up opportunity for home gardening
The access to water could also enable water for home-grown vegetables and micro
agriculture. Micro agriculture can be described as farming on a small scale incorporating
irrigated community gardens, food plots and homestead based livestock enterprises.
When potable water supply is made available to the aforementioned communities, micro-
agriculture has the potential to substantially alter the water usage patterns in the study
area if implemented on a large scale. The broad concept of micro-agriculture in an urban
or peri-urban area has been referred to as agro-urban development which embraces the
following key components:
• The identification and allocation of an area or areas adjacent to or within an informal
settlement or an area demarcated for informal settlement for the purposes of irrigated
food production or other appropriate forms of agriculture. The selected site should
have soils that are appropriate for irrigated agriculture;
• The supply of affordable water for irrigation;
Feasibility Study for Utilisation of Taung Dam Water 3.21
PWMA 10/C31/00/1408 Regional and National Economy July 2008
• The identification and development of such a site should form part of the basic
skeleton of the informal settlement;
• The development of such an area should be undertaken with maximum involvement
and commitment of the community itself with emphasis on community based self-help
development;
• Food production for home consumption and the sale of surpluses for cash generation;
and
• Production can be by individuals, food garden clubs or co-operatives from community
gardens or individually owned food-plots or even the smaller individual homestead
gardens.
It should, however, be noted that water usually used for irrigation is cheaper than urban
water supply. The reason is the difference in costs. Water used for agriculture does not
need to be treated. Enabling water usage for home gardening would require two separate
supply networks, one for potable water supply via the water purification works. The
second system is the direct supply for garden water via a separate reticulation system. In
other words raw water used for gardening and potable water used for consumption
purposes. This two-tier system would however be too costly and it won’t be feasible to
establish a separate physical infrastructure and capital for the establishment of a separate
raw water supply to households. The result will be that home gardens, will require utilising
more expensive treated domestic water and thus use thereof for other than domestic uses
will result in less assurance for domestic supply.
Opportunities for home gardening are thus limited to the development of home-grown
vegetables for own consumption making use of domestic water supply.
3.5.7. Freeing up water supply for other user sectors
The Taung Dam was initially constructed to augment supply to the Taung Irrigation
Scheme. However, currently there is no infrastructure to convey water from the Taung
Dam to the irrigation area. A need within the study area exists for irrigation water supply.
In the late 1970’s the existing flood irrigation scheme in the Taung area was converted
into a centre pivot scheme. Through the redesign activities, 175 households were
excluded and have been waiting since the 1970’s for restitution. The re-constituted flood
irrigation scheme was designed on the basis of 10 ha per person, thus the expectations of
these 175 individuals are for similar allocations. It is thus considered by the local people
that the Taung Dam will be the source of water for this expansion.
Feasibility Study for Utilisation of Taung Dam Water 3.22
PWMA 10/C31/00/1408 Regional and National Economy July 2008
However the water from the Taung dam has been identified as being best put to use for
domestic needs. However, according to the Existing and Proposed Infrastructure Study
as part of this feasibility study, if water from the Taung Dam is used to supply the
Bogosing area, then Bogosing’s allocation from the Vaalharts Canal Scheme could be
transferred to Vryburg to augment the water demand in this area. Furthermore, if water
from the Taung Dam is used to augment supply to the Taung area, then water from the
Vaalharts Canal Scheme could possibly be freed up to be transferred to Vryburg to
augment the water demand in this area.
In other words, using the water from the Taung Dam to augment water to the Bogosing
area and the Taung area could possibly free up water to be transferred to Vryburg to
augment water demand in that area. The exact water sector beneficiary of this possibility
is however not known.
It is however important to note that, separate from this study, Vaalharts Water is currently
working with the Department of Agriculture to compile a business plan for the upgrading of
the entire Vaalharts Irrigation Scheme’s canal network, including the main canal, side
canals and drainage canals. This business plan should be submitted before the end of
2008 for construction to commence early in 2009. In short, the provision of water for
irrigation, should this be implemented, would have far reaching regional economic effects.
Water security however is a pressing need for the irrigation sector as without it, farming is
uneconomic. In collaboration with farmers and other stakeholders a look at alternative
crops of high value that will increase profitability in the Vaalharts scheme has already
been initiated to empower black farmers and contribute to sustainable jobs in the area.

Feasibility Study for Utilisation of Taung Dam Water 3.23
PWMA 10/C31/00/1408 Regional and National Economy July 2008
BIBLIOGRAPHY
Department: Water Affairs and Forestry, South Africa, 2007. Feasibility Study for Utilisation of Taung Dam Water: Existing and Proposed Infrastructure: prepared by Kwezi V3 Engineers
Department: Water Affairs and Forestry, South Africa, 2007. Feasibility Study for Utilisation of Taung Dam Water: Water demand and use: prepared by WRP Consulting Engineers
Greater Taung Local Municipality, 2006. Reviewed Integrated Development Plan. 2006/2007
Naledi Local Municipality, 2006. Integrated Development Plan Review 2006/2007.
Phokwane Local Municipality, 2006. Integrated Development Plan.
Stats SA, 2001. Census 2001
Stats SA, 2007. Community Survey 2007
Quantec database, 2007.
Urban Dynamics Town and Regional Planners, 2006. Spatial Development Framework of Phokwane Local Municipality.

0.90% 57 356 Year STUDY AREA PHOKWANE LM NALEDI LM LM GREATER TAUNG 183 313 1996 2.80% 264 077 5.20% 31 045 2.80% 53 921 2.35% 179 111 1995 Growth 0.40% 185 948 1999 1.00% 277 262 3.50% 35 391 1.00% 56 772 0.50% 185 099 1998 1.10% 274 277 3.80% 34 082 1.20% 56 117 0.60% 184 078 7 199 1.10% 271 385 4.30% 32 664 1.30% 55 408 0.42% AREA Persons Growth Persons Growth Persons Growth Persons 36 614 3.20% 279 918 0.90% 2000 186 651 0.30% 57 893 0.70% 37 773 2.90% 282 317 0.70% 2001 187 119 0.10% 58 312 0.60% 38 873 2.60% 284 304 0.50% 2002 187 291 0.00% 58 678 0.40% 39 887 2.40% 285 856 0.40% 2003 187 298 - 0.20% 58 941 0.30% 40 833 2.10% 287 072 0.30% 2004 187 000 - 59 114 -

Feasibility Study for Utilisation of Taung Dam Water
PWMA 10/C31/00/1408 Regional and National Economy July 2008
Project Name: FEASIBILITY STUDY FOR UTILISATION OF TAUNG DAM WATER
Authors: Russell Aird (Kayamandi Development Services)
Title: REGIONAL AND NATIONAL ECONOMY
DWAF Report No: P WMA 10/C31/00/1408
Status of Report: FINAL
First Issue: June 2008
Final Issue: July 2008
Consultants:
Kwezi V3 Engineers in association with Kayamandi Development Services, WRP Consulting Engineers, Golder Associates, WSM Leshika, DMM Development Consultants
Approved for Consultants:
…………………………………………
A J Smook Study Leader
DEPARTMENT: WATER AFFAIRS AND FORESTRY Directorate: Options Analysis Approved for the Department: Water Affairs and Forestry by:
…………………………………………………
P Pyke Chief Engineer: Options Analysis (Central) (Project Manager)
…………………………………………………
L S Mabuda Director: Options Analysis

Feasibility Study for Utilisation of Taung Dam Water (i)
PWMA 10/C31/00/1408 Regional and National Economy July 2008
LIST OF REPORTS
REPORT NO DESCRIPTION REPORT NAME
P WMA 10/C31/00/0408 Main Feasibility Report FEASIBILITY STUDY FOR UTILIZATION OF TAUNG DAM WATER: MAIN REPORT
P WMA 10/C31/00/0508 Supporting Report 1 DEMOGRAPHICS
P WMA 10/C31/00/0608 Supporting Report 2 WATER DEMAND AND USE
P WMA 10/C31/00/0708 Supporting Report 3 YIELD AND SYSTEM ANALYSIS
P WMA 10/C31/00/0808 Supporting Report 4 GROUNDWATER RESOURCES
P WMA 10/C31/00/0908 Supporting Report 5 IRRIGATION
P WMA 10/C31/00/1008 Supporting Report 6 WATER DEVELOPMENT AND SUPPLY PLANS
P WMA 10/C31/00/1108 Supporting Report 7 WATER QUALITY AND POLLUTION
P WMA 10/C31/00/1208 Supporting Report 8 EXISTING AND PROPOSED INFRASTRUCTURE
P WMA 10/C31/00/1308 Supporting Report 9 CONVEYANCE SYSTEM SCENARIOS AND ECONOMIC ANALYSIS
P WMA 10/C31/00/1408 Supporting Report 10 REGIONAL AND NATIONAL ECONOMY
P WMA 10/C31/00/1508 Supporting Report 11 EIA AND PUBLIC PARTICIPATION
REFERENCE
This report is to be referred to in bibliographies as:
Department: Water Affairs and Forestry, South Africa, 2007. Feasibility Study for Utilisation of Taung Dam Water: Regional and National Economy: prepared by Kayamandi Development Services (Pty) LTD.
Report No.: P WMA 10/000/00/0407/10
Project No.: WP8950
Project File: 14/2/C300/2/2

Feasibility Study for Utilisation of Taung Dam Water (i)
PWMA 10/C31/00/1408 Regional and National Economy July 2008
EXECUTIVE SUMMARY
Naledi local municipality has consistently been the highest GGP contributor in the study area
followed by Phokwane local municipality, and Greater Taung local municipality. Naledi Local
Municipality experienced the highest average annual GGP growth rate of all the three
municipalities in the study area on par with that of the country as a whole between the ten-year
period from 1995 to 2005. However, the economy of the Greater Taung Local Municipality only
grew at nearly a quarter than that of the country as a whole and Phokwane Local Municipality
experience growth at nearly half than that of the country as a whole. The study area, mostly
Phokwane and Greater Taung Local Municipalities are thus areas with relatively low growth
compared to the country as a whole. The study area also has a small economy in relation to its
GGP contribution to the Districts and Provinces in which they are situated. Unemployment is also a
major problem in the area, hence the low GGP contribution, which serves as fertile ground for
other social problems that hinder economic development and social well being. Many people in the
area are uneducated, or have low level of skills that are incompatible with the desired level of
economic activity in the municipality. Those who are employed are usually employed in low-income
industries such as farm workers or domestic workers. There are very few professional workers in
the area. The result is that a large portion of the population has limited to no income.
This area will thus benefit from economic injection in the form of this proposed bulk water
infrastructure development. The following regional and national economic impacts are foreseen
should the demand for increased water be met:
• Stimulation of economy: The potential economic benefits that are perceived include:
increased financial spending in the economy, increased infrastructure investment, and
increased expenditure by employees. The additional GDP arising from the capital investment
during the construction phase of the bulk water supply infrastructure could be approximately
R60 million. Approximately R5 million of this impact will accrue to the North-West Province.
The additional GDP arising from the operating expenditure during the operational phase is
approximately R400 000 per annum. Furthermore, based on expected procurement,
approximately R40 000 per annum will accrue to the North-West Province.
• Employment and decrease in local unemployment level: Increased employment is expected
in the economy during construction and operation of the bulk water infrastructure. With an
increase in employment, a definite transfer of skills will result. The proposed infrastructure
development and mechanical manufacturing of infrastructure requirements will lead to the
creation of additional jobs to the approximate amount of 1,800 during the construction phase.

Feasibility Study for Utilisation of Taung Dam Water (ii)
PWMA 10/C31/00/1408 Regional and National Economy July 2008
During the operation phase the project will lead to the creation of an additional approximately
5 jobs per annum. Note that a job is defined as one person employed for one year.
• An increase in new business sales and standard of living: The increased employment
expected, will impact positively upon the regional and local economy. Increased employment
is associated with increased income and consequently with increased buying power in the
area, thus leading to new business sales to accommodate the new demand for services and
goods required. Direct investment in the construction sector during the construction phase
will yield new business sales to the value of approximately R490 million for the bulk
infrastructure. During the operating phase the investment in the economy, associated with
the maintenance and operation of the infrastructure only, will generate new business sales to
the approximate value of R2 million per annum.
• Increased government income: the supply of water can be seen as an economic injection to
the area as it would lead to increased government income. Local benefits could accrue to the
government through an increased tax base and increasing the capacity of the local
municipality and other social and service support actions.
• Inflow and outflow of temporary/external workers: Local socio-economic impacts of large-
scale development projects tend to be closely associated with the relocation (immigration) of
project workers and their families to communities near the project site. The large direct
employment will mean that a substantial amount of external workforce is required. This will
thus lead to a substantial local population growth, demands on local services and
infrastructure, fiscal problems for local governments, and increased problems of social
assimilation. Therefore, an emphasis on use of local labour is suggested as the use of
outside or imported labour may have negative implications for the surrounding economic
status quo.
• Stimulation of income generating activities and opening up area for development: Since
households need 100% assurance of water supply, the water from the Taung Dam would be
utilised to provide in primary domestic water needs only. The higher supply of domestic water
during operation could result in the stimulation of economic activities reliant on water such as
tourism related development, laundry and cleaning facilities, sport related clubs and facilities,
amusement and recreation services, hotels and lodging places, eating and drinking
establishments, car washes, hair dressers and other personal services, butchery, farming:
horticulture and livestock, food and beverages and others.
• Free up time from fetching water and obstacles to economic development: Water is one of
the most important resources to people. Access to this scarce resource remains the most

Feasibility Study for Utilisation of Taung Dam Water (iii)
PWMA 10/C31/00/1408 Regional and National Economy July 2008
critical and worrying constraint for many rural people, and many of them spend several hours
a day securing supplies. Women (and children) are mostly affected by having to walk longer
distances to collect smaller amounts of water. The time lost is invaluable to most women and
children. The provision of water will release women and children from spending several
hours a day securing supplies to being able to search for work, undertake education, etc. All
of these will have profound effects on the regional economy. With access to potable water
the obstacles in the development of the following impoverished communities will be
addressed: 14 villages south-east of Taung Dam, 6 villages being supplied by the Bogosing
Water Supply, and 11 villages in the Taung area. The provision of domestic water will also
improve the spatial distribution of water and enable improved matching of supply with
demand.
• Decrease economic decline related to water shortages: Water projects have long been
advocated for their claimed contribution to regional economic development. However
investment in water supply does not automatically guarantee economic growth. While water
does not automatically generate growth, it may be the case that areas which persist in
lacking an adequate water supply (regardless of whether or not they started out with
adequate water) will not flourish economically, people will eventually leave those areas and
migrate to other areas that do have an adequate water supply. Thus, lack of water could be a
sufficient condition for economic decline or, to put it another way, water may be necessary,
but not sufficient for economic growth.
• Provide essential final good and opening up additional household end-uses: Water obviously
fits the definition of an essential final good as human life is not possible without access to
water. In addition to being essential for human life, water contributes in important ways to the
enjoyment of the satisfactions of life. Consequently, there are many other residential end
uses of water besides its use for drinking. When a piped water supply first became available,
the initial household uses were the same that had existed when family members had to fetch
water from an external source – drinking, cooking, hand washing, and limited bathing. As
time passed, many other uses came up – tubs for bathing, outdoor landscape and garden
watering, automatic clothes washers, swimming pools, automatic dish washers, car washing,
garbage disposal, indoor evaporative cooling, hot-tubs, lawn sprinklers, etc.
• Decrease in poor health related economic burdens: The lack of access to adequate water
supply brings the risk of ill-health or even death and undermines people’s dignity. Ill-health
and death have a profound impact on the regional and national economy. The positive
impact which providing a workable amount of clean water will have on the overall health of
the population far outweighs the direct financial costs of providing the water. Women

Feasibility Study for Utilisation of Taung Dam Water (iv)
PWMA 10/C31/00/1408 Regional and National Economy July 2008
therefore have the most to gain from a successful water project since they are primarily
responsible for health and hygiene.
• Open-up opportunity for home gardening: The access to water could also enable water for
home-grown vegetables and micro agriculture. It should, however, be noted that water
usually used for irrigation is cheaper than urban water supply. The reason is the difference in
costs. Water used for agriculture does not need to be treated. Enabling water usage for
home gardening would require two separate supply networks, one for potable water supply
via the water purification works. This two-tier system would however be too costly and thus
not possible to establish separate physical infrastructure and capital for the establishment of
a separate hard water supply to households. The result will be that home gardens will require
utilising more expensive treated domestic water and thus use thereof for other than domestic
uses will result in lower assurance for domestic supply. Opportunities for home gardening are
thus limited to the development of home-grown vegetables for own consumption making use
of domestic water supply.
• Freeing up water supply for other user sectors: The Taung Dam was initially constructed to
augment supply to the Taung Irrigation Scheme. However, currently there is no infrastructure
to convey water from the Taung Dam to the irrigation area. A need within the study area
exists for irrigation water supply. However the water from the Taung Dam has been identified
as being best put to use for domestic needs. However, using the water from the Taung Dam
to augment water to the Bogosing area and the Taung area could possibly free up water to
be transferred to Vryburg to augment water demand in that area. The exact water sector
beneficiary of this possibility is however not known. With regards to water for the irrigation
sector, it should be known that, separate from this study, Vaalharts Water is currently
working with the Department of Agriculture to compile a business plan for the upgrading of
the entire Vaalharts Irrigation Scheme’s canal network.

Feasibility Study for Utilisation of Taung Dam Water (v)
PWMA 10/C31/00/1408 Regional and National Economy July 2008
FEASIBILITY STUDY FOR UTILISATION OF TAUNG DAM
WATER
Table of Contents
PAGE
EXECUTIVE SUMMARY ...............................................................................................................(I)
TABLE OF CONTENTS................................................................................................................(v)
1. INTRODUCTION.............................................................................................................. 1.1
1.1. BACKGROUND OF STUDY ................................................................................................. 1.1
1.2. STUDY AREA .................................................................................................................... 1.1
1.3. PROPOSED INFRASTRUCTURE DEVELOPMENT: TAUNG DAM PURIFICATION WORKS ...... 1.2
2. REGIONAL ECONOMIC PROFILE.................................................................................. 2.1
2.1. GROSS GEOGRAPHIC PRODUCT ...................................................................................... 2.1
2.1.1. GGP Per Sector Of Naledi Local Municipality ................................................................... 2.6
2.1.2. GGP Per Sector Of Phokwane Local Municipality............................................................. 2.9
2.1.3. GGP Per Sector Of Greater Taung Local Municipality .................................................... 2.13
2.2. EMPLOYMENT................................................................................................................. 2.16
2.3. INCOME DISTRIBUTION................................................................................................... 2.20
2.4. LEVEL OF EDUCATION .................................................................................................... 2.22
2.5. CONCLUSION.................................................................................................................. 2.23
3. REGIONAL AND NATIONAL ECONOMIC IMPACTS ..................................................... 3.1
3.1 IMPACT ASSESSMENT ASSUMPTIONS .............................................................................. 3.1
3.2 IMPACT ASSESSMENT TECHNIQUE FOR QUANTIFICATION OF ECONOMIC IMPACTS........ 3.1
3.3 NATIONAL AND REGIONAL ECONOMIC IMPACTS DURING CONSTRUCTION ...................... 3.3
3.3.1. Stimulation Of The Economy ............................................................................................ 3.3
3.3.2. Employment Creation, Decrease In Local Unemployment Level And Skills Transfer ........ 3.5
Feasibility Study for Utilisation of Taung Dam Water (vi)
PWMA 10/C31/00/1408 Regional and National Economy July 2008
3.3.3. Business Output/Sales And Increased Standards Of Living.............................................. 3.7
3.3.4. Government Income And Expenditure .............................................................................. 3.8
3.3.5. Inflow And Outflow Of Temporary Workers....................................................................... 3.9
3.4. NATIONAL AND REGIONAL ECONOMIC IMPACTS DURING OPERATION ........................... 3.10
3.4.1. Stimulation Of The Economy .......................................................................................... 3.11
3.4.2. Employment Creation, Decrease In Local Unemployment Level And Skills Transfer ...... 3.11
3.4.3. Business Output/Sales And Increased Standards Of Living............................................ 3.12
3.4.4. Government Income And Expenditure ............................................................................ 3.13
3.5. ECONOMIC VALUE OF DOMESTIC WATER SUPPLY ......................................................... 3.13
3.5.1. Stimulation Of Income Generating Activities And Open Up Area For Development ........ 3.14
3.5.2. Free Up Time From Fetching Water And Obstacles To Economic Development ............ 3.16
3.5.3. Decrease Economic Decline Related To Water Shortages ............................................. 3.17
3.5.4. Provide Essential Final Good And Opening Up Additional Household End-Uses............ 3.18
3.5.5. Decrease In Poor Health Related Economic Burdens..................................................... 3.20
3.5.6. Open-Up Opportunity For Home Gardening.................................................................... 3.20
3.5.7. Freeing Up Water Supply For Other User Sectors .......................................................... 3.21
BIBLIOGRAPHY .......................................................................................................................... 23

Feasibility Study for Utilisation of Taung Dam Water (vii)
PWMA 10/C31/00/1408 Regional and National Economy July 2008
LIST OF ABBREVIATIONS
BD Bophirima District
DWAF Department: Water Affairs and Forestry
GTLM Greater Taung Local Municipality
FBD Frances Baard District
LMI Local Municipality
NLM Naledi Local Municipality
PLM Phokwane Local Municipality
NC Northern Cape
NW North West
RSA Republic of South Africa

Feasibility Study for Utilisation of Taung Dam Water 1.1
PWMA 10/C31/00/1408 Regional and National Economy July 2008
1. INTRODUCTION
1.1. Background of Study
The Taung Dam is a rollcrete dam located on the Harts River upstream of the Vaalharts
Irrigation Scheme in the Lower Vaal System. A recent survey indicated that the capacity
of the dam at full supply level is 62.97 million m3. The Taung Dam was constructed to
augment supply to the Taung Irrigation Scheme, but there is currently no infrastructure to
convey water from the Taung Dam to the irrigation area.
As a result, the Taung Dam is at present not utilised and the purpose of the feasibility
study was to establish if the resource could be economically used for water supply,
irrigation or other purposes within the project area.
Downstream from the Taung Dam the Spitskop Dam collects return flows from the Vaal-
Harts Irrigation Scheme, as well as runoff from the upstream catchments which has not
been utilised by existing developments. Surplus water is available in Spitskop Dam but is
of poor quality.
The project area extends over the whole of Taung Dam catchment and the Vaal-Harts
River system and the study took existing and planned regional development of the area
into account. Peri-urban areas around Greater Taung are currently served only with
groundwater, but in future both surface and groundwater resources will be required to
satisfy the increasing demand.
The purpose of this report, prepared by Kayamandi Development Services (Pty) Ltd, is to
provide the impacts of the regional and national economy from the utilisation of the Taung
Dam Water.
1.2. Study Area
The study area extends over the whole Taung Dam catchment and the Vaal-Harts River
System and includes the Naledi Local Municipality (NLM), Greater Taung Local
Municipality (GTLM) and Phokwane Local Municipality (PLM). The former two
municipalities form part of the Bophirima District Municipality in the North-West Province
and the latter forms part of the Frances Baard District Municipality in the Northern Cape.
Urban centres in the region include Vryburg and Stella in Naledi, Pudimoe and Taung
Station in Greater Taung, with Pampierstad, Hartswater and Jan Kempdorp in Phokwane.

Feasibility Study for Utilisation of Taung Dam Water 1.2
PWMA 10/C31/00/1408 Regional and National Economy July 2008
1.3. Proposed infrastructure development
Taung Dam has a capacity of 62.97 million m³ and a historic firm yield of 6.13 million m3/a
of which none is currently used due to the absence of infrastructure to convey water to
potential users. A system is thus required to transfer water from the dam to the Taung
Main Supply System (TMSS) and extension of the TMSS needs to be considered to
supply new irrigation areas not served by the current system. It is understood that there
were two options available to supply the additional water demand, namely: increasing the
capacity of the Main Vaalharts Canal to supply additional demand from the Vaal River;
and provide a system to transfer water from the Taung Dam to the Taung Main Supply
System in order to utilise water from the Taung Dam on the Harts River upstream of
Taung. This regional and economic impact is based on the option of transferring water
from the Taung Dam to the Taung Main Supply System.
Figure 1.1 below provides an indication of the proposed infrastructure development for the
utilisation of the Taung dam water. Three areas have been identified as possible
beneficiaries of water from the Taung Dam, these are as follows:
• Villages south-east of Taung Dam: There are 14 villages in this south eastern corner
of the Greater Taung area that source all of their water from rudimentary borehole
schemes. If water from the Taung Dam is supplied to a storage reservoir at a high
enough point in the area, distribution networks would be installed to supply the area.
• Bogosing Water Supply Area: The Bogosing Water Supply Scheme supplies water to
six villages. Water is abstracted from the Vaalharts Canal and is then purified at a
package treatment plant with a capacity of 1.2 Ml/day. However, this package plant is
highly inefficient with water losses accumulating to approximately 35-40% and turbidity
in the water being a problem for communities along certain sections of the scheme. If
water from the Taung Dam is used to supply the Bogosing area, then Bogosing’s
allocation from the Vaalharts Canal Scheme could be transferred to Vryburg to
augment the water demand in this area. This would require upgrading of the Pudimoe
Water Treatments Works and the Pudimoe Canal delivering water to the treatment
works (both planned for the near future), as well as the Pudimoe-Vryburg pipeline
which was recently upgraded only to replace the old pipe. The capacity of this pipe is
not enough to carry the extra supply.
• Taung Water Supply Area: The Pudimoe Water Supply Scheme supplies water to 11
villages in Taung area. Water is supplied through the Vaalharts North Canal and the

Feasibility Study for Utilisation of Taung Dam Water 1.3
PWMA 10/C31/00/1408 Regional and National Economy July 2008
Taung Main Canal via the Pudimoe Canal and purified at the Pudimoe Treatment
Works near Pudimoe. Water could be sourced from the Taung Dam to augment the
future demand. If water from the Dam is used to augment supply to the Taung area,
then water from the Vaalharts Canal Scheme could possibly be freed up to be
transferred to Vryburg to augment water demand in this area.
The proposed option for the utilisation of water from Taung Dam (as shown in Figure 1.1
below), on which the regional economic impact is based entails constructing a new water
treatment plant at the Taung Dam from where purified water could be distributed to the
Bogosing and Taung Water Supply Schemes as well as to the villages south-east of the
dam. Storage reservoirs will be constructed in both areas.
The main components of this scheme would be as follows.
• Water Treatment Works at Taung Dam;
• New storage reservoir on the highest point near Manokwane from where water would
gravitate to the Bogosing Water Supply Scheme as well as to the existing 5 Kl Taung
Reservoir in Taung Village;
• New storage reservoir on the highest point south-east of Taung Dam near Manokweng
to supply water to surrounding villages;
• Pump station at the WTW at the Taung Dam to pump purified water to the proposed
reservoirs at Manokwane and Manokweng villages;
• Pumping mains to convey purified water from the proposed WTW at the Taung Dam to
the proposed reservoirs at Manokwane and Manokweng villages;
• Gravity main from proposed reservoir at Manokwane to the sump of the existing pump
station at the Bogosing Water Treatment Works from where the water could be
pumped into the existing Bogosing Water Supply Scheme;
• Gravity main from proposed reservoir at Manokwane to the existing 5 Kl Taung
Reservoir in Taung Village; and
• Gravity main from proposed Manokweng reservoir to supply surrounding villages.

Feasibility Study for Utilisation of Taung Dam Water 1.4
PWMA 10/C31/00/1408 Regional and National Economy July 2008
Figure 1.1 Infrastructure developments for utilisation of Taung Dam water
GROUND RESEVOR
TOWER RESEVOR
PUMP STATION
WATER TREATMENT WORKS
BALANCING DAM
PUMP MAIN
GRAVITY MAIN

Feasibility Study for Utilisation of Taung Dam Water 1.5
PWMA 10/C31/00/1408 Regional and National Economy July 2008
The advantages of this option include that water losses of approximately 7% should be
allowed for at any water treatment plant. Pumping raw water to treatment works far away
from the source would result in pumping more water than would eventually be available to
use and is therefore considered an expensive exercise. Constructing a new treatment
works to purify the water near the Taung Dam would eliminate this long-term loss of
energy. Water will be purified relatively close to the end users. This will result in the cost
of the distribution network (pumping and gravity mains) to be less. The only disadvantage
of this option is that new treatment works at Taung Dam would require operation and
maintenance.

Feasibility Study for Utilisation of Taung Dam Water 2.1
PWMA 10/C31/00/1408 Regional and National Economy July 2008
2. REGIONAL ECONOMIC PROFILE
This economic profile delves into the underlying structures and sectors that make up the
study area’s macro economy providing insight into trends and issues of economic
significance, relating to:
• Gross Geographic Product (GGP);
• Employment per sector;
• Level of education; and
• Income distribution.
2.1. Gross Geographic Product
Gross Geographic Product (GGP) is defined as the total value of final production goods
and services produced within a geographic boundary in a given period. Changes in the
local economy can therefore be expressed as an increase or decrease in GGP. Only the
results of the activities which are intended to satisfy the needs of other people through
trade are considered to form part of the GGP.
The Gross Geographic Product (GGP) contribution per sector between 1995 and 2005 for
each of the three local municipalities that form the study area is presented below in Figure
2.1.
Figure 2.1 GGP contribution (Rand million)
0
200
400
600
800
1000
1200
1400
1600
1995 1996 1997 1998 1999 2000 2001 2002 2003 2004 2005
PLM NLM GTLM
Source: Quantec 2007 and Kayamandi calculations
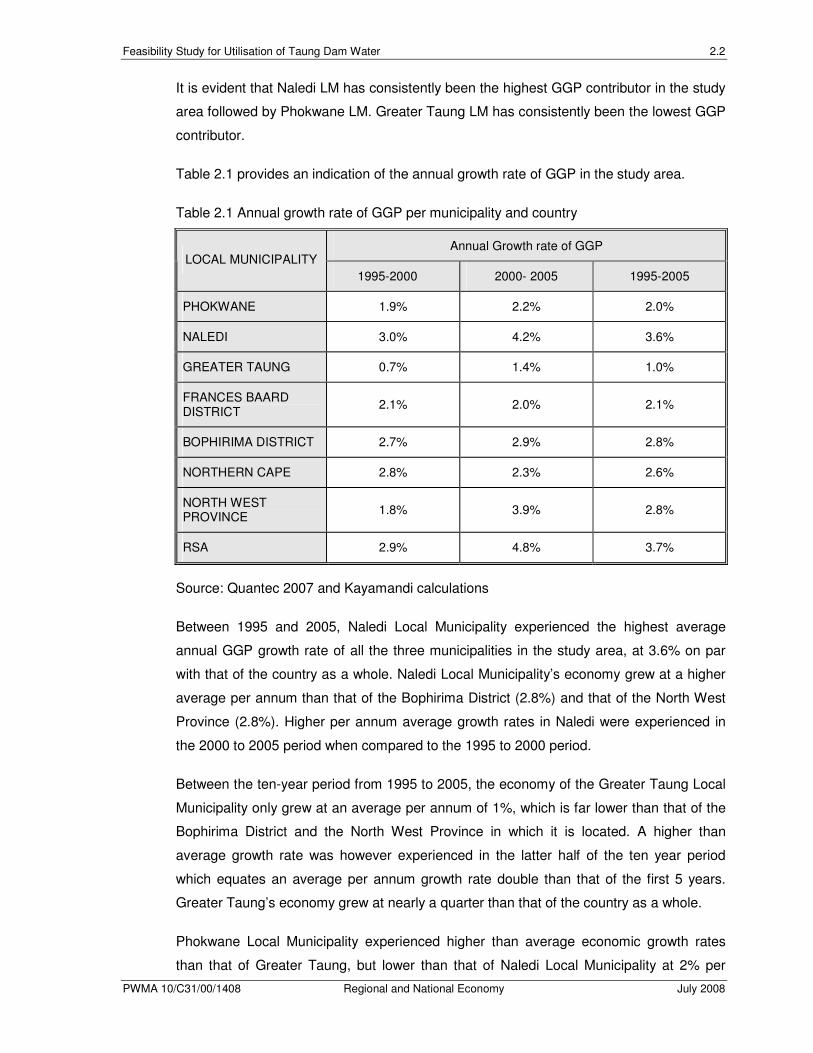
Feasibility Study for Utilisation of Taung Dam Water 2.2
PWMA 10/C31/00/1408 Regional and National Economy July 2008
It is evident that Naledi LM has consistently been the highest GGP contributor in the study
area followed by Phokwane LM. Greater Taung LM has consistently been the lowest GGP
contributor.
Table 2.1 provides an indication of the annual growth rate of GGP in the study area.
Table 2.1 Annual growth rate of GGP per municipality and country
Annual Growth rate of GGP LOCAL MUNICIPALITY
1995-2000 2000- 2005 1995-2005
PHOKWANE 1.9% 2.2% 2.0%
NALEDI 3.0% 4.2% 3.6%
GREATER TAUNG 0.7% 1.4% 1.0%
FRANCES BAARD DISTRICT
2.1% 2.0% 2.1%
BOPHIRIMA DISTRICT 2.7% 2.9% 2.8%
NORTHERN CAPE 2.8% 2.3% 2.6%
NORTH WEST PROVINCE
1.8% 3.9% 2.8%
RSA 2.9% 4.8% 3.7%
Source: Quantec 2007 and Kayamandi calculations
Between 1995 and 2005, Naledi Local Municipality experienced the highest average
annual GGP growth rate of all the three municipalities in the study area, at 3.6% on par
with that of the country as a whole. Naledi Local Municipality’s economy grew at a higher
average per annum than that of the Bophirima District (2.8%) and that of the North West
Province (2.8%). Higher per annum average growth rates in Naledi were experienced in
the 2000 to 2005 period when compared to the 1995 to 2000 period.
Between the ten-year period from 1995 to 2005, the economy of the Greater Taung Local
Municipality only grew at an average per annum of 1%, which is far lower than that of the
Bophirima District and the North West Province in which it is located. A higher than
average growth rate was however experienced in the latter half of the ten year period
which equates an average per annum growth rate double than that of the first 5 years.
Greater Taung’s economy grew at nearly a quarter than that of the country as a whole.
Phokwane Local Municipality experienced higher than average economic growth rates
than that of Greater Taung, but lower than that of Naledi Local Municipality at 2% per

Feasibility Study for Utilisation of Taung Dam Water 2.3
PWMA 10/C31/00/1408 Regional and National Economy July 2008
annum over the ten-year period. The growth of Phokwane’s economy is similar to that of
the Frances Baard District at 2.1% growth and slightly lower than that of the Northern
Cape Province in which it is situated at 2.6%. The economy of Phokwane grew at nearly
half that of the country as a whole.
It is however important to note how each sector contributed to the aforementioned
growths, as each sector has been growing at varied rates between the ten-year periods.
Table 2.2 below reveals the average growth rate of the different economic sectors in each
of the local municipalities that make up the study area.
Table 2.2. Average Annual GGP growth by sector and municipality
AVERAGE ANNUAL GROWTH 1995 TO 2005 SECTOR
PLM GTLM NLM FBD BD NW NC RSA
Agriculture 2.5% 9.2% 5.3% 1.4% 6.2% 8.5% 4.9% 3.6%
Mining 6.7% 4.4% 4.5% 0.4% 5.4% 1.8% 2.3% 1.0%
Manufacturing 0.1% 0.6% 2.8% 0.5% 2.8% 2.7% 1.0% 2.8%
Electricity and water
-7.6% 0.7% -1.0% -1.4% 1.7% 0.5% -2.1% 1.8%
Construction 0.2% -2.4% 0.0% 0.2% -2.4% 3.5% 1.6% 4.6%
Wholesale and retail
5.0% 1.3% 1.4% 3.5% 2.2% 3.0% 3.8% 4.8%
Transport and communication
3.6% 6.7% 12.8% 2.3% 10.0% 6.5% 3.7% 7.1%
Business services
-0.3% -2.2% -3.1% 3.3% -1.8% 3.2% 2.0% 6.2%
Community services
3.9% 4.9% 3.5% 3.0% 4.1% 3.4% 3.3% 3.4%
Government services
1.9% -1.8% 2.2% 2.0% -0.6% 0.7% 1.9% 0.5%
Total 2.0% 1.0% 3.6% 2.1% 2.8% 2.8% 2.6% 3.7%
Source: Quantec 2007 and Kayamandi calculations
The above table shows different average annual growth rates for the different sectors in
each of the municipalities over the ten-year period from 1995 to 2005.
The following is noted with regards to the primary sectors, namely agriculture and mining.

Feasibility Study for Utilisation of Taung Dam Water 2.4
PWMA 10/C31/00/1408 Regional and National Economy July 2008
Agriculture, hunting, fishing and forestry involve enterprises primarily engaged in farming
activities or the rendering of agricultural services. Commercial hunting, game farming,
forestry, logging and fishing are also included in this category. Regarding the agriculture
sector, Greater Taung LM had the highest growth with 9.2% followed by Naledi and
Phokwane each with 5.3% and 2.5% growth respectively in this sector. The high average
per annum growth in the agriculture sector is far higher than that of the Bophirima District
and slightly higher than that of the North West Province at 8.5% growth. In relation to the
growth of agriculture in the country as a whole, at 3.6%, the study area has shown quite
an aggressive growth in agriculture which far outweighs that of the country’s growth in
agriculture.
Mining and quarrying involves the extracting, dressing and benediction of minerals
occurring naturally. Phokwane’s mining sector has the highest growth, at 6,7% with Naledi
and Greater Taung’s mining sectors growing at 4.5% and 4.4% respectively. The growth
in mining in Phokwane is far higher than that of the growth in the Frances Baard District
and the Northern Cape at 0.4% and 2.3% respectively. The growth experienced in the
mining sector in Greater Taung and Naledi show similar patterns to the growth in the
mining sector of the Bophirima District at 5.4% albeit at a far higher growth than that of the
North West Province (1.8%). The study area experienced far higher growth rates in the
mining sector, compared to the low average per annum growth over the aforementioned
period for the country as a whole at 1%.
The following is noted with regards to the secondary services sectors in the study area,
namely manufacturing, electricity and water, and the construction industry.
Manufacturing is defined as a process of transforming materials physically, chemically or
by means of assembly into new products. Insignificant growth in the manufacturing sector
is noted over the aforementioned ten-year period in Phokwane and Greater Taung Local
Municipalities with 0.1% and 0.6% growth respectively. The manufacturing sector of
Naledi local municipality has however grown at an average per annum of 2.8%, which is in
line with the growth experienced in the Bophirima, North West and the country as a whole,
with 2.8%, 2.7% and 2.8% respectively.
Electricity, water and gas involve production, collection and distribution of electricity as
well as the manufacture of gas and the collection and distribution of water. The electricity
and water services sectors showed average per annum declines in both Phokwane with -
7.6% decline and Naledi with -1% decline. Greater Taung only showed relatively
insignificant growth over the aforementioned period at 0.7% growth in line with that of the
North West Province in which it is located. The study area as a whole experienced lower

Feasibility Study for Utilisation of Taung Dam Water 2.5
PWMA 10/C31/00/1408 Regional and National Economy July 2008
than per annum average growth in the electricity and water services sectors for the
country as a whole.
The construction industry is also considered a secondary activity. It involves site
preparation, demolition, building, civil engineering, installation, plumbing, decorating, etc.
The construction sector also experienced insignificant growths in Phokwane and in Naledi
Local municipalities over the aforementioned period, whilst Greater Taung municipalities
experienced relatively high decrease in the construction sector in line with that of the
Bophirima District. The North West Province however showed significantly higher growth
over the period than of Naledi and Greater Taung local municipalities. The country as a
whole also experienced far higher annual growth rates than of the study area at 4.6%
growth per annum.
The following is noted with regards to the tertiary sector industries, namely wholesale and
retail trade, transport and communication, business and financial services, and
government and community sectors.
Trade entails the wholesale or retail sale of new and used goods in stores, stalls, markets
by mail order or by other means as well as hotels, restaurants, bars and other tourist
activities. The wholesale and retail sectors have shown significant growth in Phokwane
Local Municipality at 5% growth, which is on par with the growth in the aforementioned
sector for the country as a whole. Phokwane’s wholesale and retail sector experience
higher than average growth rates than its district and province. Both Greater Taung and
Naledi Local Municipalities showed relatively low growth rates in the wholesale and retail
sector at 1.3% and 1.4% respectively, far below that of the province and the country as a
whole.
Transport and communication involves the provision of passenger and or freight transport
by rail, road, water or air. It includes cargo handling and storage and postal activities,
courier activities and the transmission of sound images and data or other information.
Higher than average growth in the country in the transport and communication sector at
approximately 12.8% was experienced in the Naledi Local Municipality which is greater
than the national average of 7%. Greater Taung Local Municipality also grew at a
relatively high rate in the aforementioned sector. Both Naledi and Greater Taung local
municipalities grew in line with the average per annum growth experienced in the
aforementioned sector in the Bophirima District and that of the North West Province.
Phokwane Local Municipality’s transport and communication sector grew in line with that
of the Frances Baard District and Northern Cape, albeit at nearly half the growth rate of
the country as a whole for this sector.

Feasibility Study for Utilisation of Taung Dam Water 2.6
PWMA 10/C31/00/1408 Regional and National Economy July 2008
Business and financial services sector includes the activity of obtaining and redistributing
funds, financial intermediation, insurance and pension funding. The buying, selling, renting
and operating of owned and leased real estate. The business services sector showed
declining rates over the last ten years since 1995 for all three of the local municipalities,
which jointly comprise the study area. The decline within these tertiary sectors are
concerning, especially if viewed in relation to far higher average per annum growth rates
in the sector in the district, provinces and for the country as a whole.
Community services involve provision of community services e.g. education, health
services, social work and activities of professional organisations. The community services
sector in each of the three local municipalities within the study area grew at relatively
average per annum growth rates in comparison with that of the country as a whole.
Government services involve activities of central, provincial and local government. The
government service has grown relatively insignificantly over the ten-year period, and in
Greater Taung this sector has actually declined by nearly 2% per annum. This is a good
indication in that lower dependencies in the government service sector are created, since
government services sector is not responsible for growing the economy.
Having looked into the average annual growth rate, the following is a detailed account of
the growth of GGP per sector over a ten year period (1995 to 2005) for each of the three
municipalities that comprise the study area.
2.1.1. GGP per sector of Naledi Local Municipality
Table 2.3 below provides an indication of the GGP contribution per sector and Figure 2.2
below provide an indication of the growth of GGP per sector from 1995 to 2005.
In Naledi municipality the Transport and Communication sector has shown a steady
increase from R 151,4 million in 1995 to R 448,7 million in 2005. It has been leading
contributor to the GGP from the year 2000 to 2005. The Finance and business services
sector was the leading contributor to the GGP from 1995 to 2000 and gradually declined
to second place. The government services sector, the wholesale and retail sector,
manufacturing sector as well as the community social and personal services sector have
been consistent middle order contributors to the economy. The agriculture and forestry
and fishing sector, which falls below the middle order contributors showed a rapid
increase between 1995 and 1996 (R 48,5 million to R 119.1 million) and then declined
gradually. The mining sector, the construction sector as well as electricity and water have
consistently been the lowest contributors to the municipality’s economy.

Feasibility Study for Utilisation of Taung Dam Water 2.7
PWMA 10/C31/00/1408 Regional and National Economy July 2008
Table 2.3. GGP per sector (constant 2000 values) for Naledi Municipality
Sector 1995 2000 2005
Agriculture 48,557,121 93,917,830 77,276,929
Mining 7,221,518 7,701,558 10,771,911
Manufacturing 116,324,942 142,590,219 149,781,456
Electricity and water 19,763,919 15,908,056 18,056,610
Construction 13,464,352 12,078,013 13,416,484
Trade 151,683,316 172,101,777 172,121,370
Transport 151,416,928 242,914,938 448,706,500
Business services 272,194,048 219,413,234 204,242,104
Community services 102,119,516 122,918,548 139,075,417
Government services 148,147,441 167,842,952 180,132,783
Total 1,030,893,103 1,197,387,125 1,413,581,563
Source: Quantec 2007 and Kayamandi calculations
Figure 2.2 GGP per sector (constant 2000 values) of Naledi Local Municipality
0
10000000
20000000
30000000
40000000
50000000
1995 1996 1997 1998 1999 2000 2001 2002 2003 2004 2005
Agriculture Mining Manufacturing Electricity Construction
Trade Transport Finance Community Government
Source: Quantec 2007 and Kayamandi Calculation
Table 2.4 below provides an indication of the percentage distribution of the GGP per
sector.

Feasibility Study for Utilisation of Taung Dam Water 2.8
PWMA 10/C31/00/1408 Regional and National Economy July 2008
Table 2.4. Percentage distribution of GGP per sector, 2005
Sector NALEDI LM BOPHIRIMA DM NORTH WEST RSA TOTAL
Agriculture 5% 9% 3% 3%
Mining 1% 7% 30% 7%
Manufacturing 11% 9% 7% 18%
Electricity & water 1% 2% 1% 2%
Construction 1% 2% 2% 3%
Trade 12% 13% 13% 15%
Transport 32% 18% 10% 11%
Business services 14% 11% 14% 21%
Community services 10% 12% 8% 6%
General Government services
13% 17% 12% 14%
Total 100% 100% 100% 100%
Source: Quantec 2007 and Kayamandi Calculation
In 2005 in Naledi LM the transport and communication sectors contributed the most to
GGP at 32% while the least contributors were the mining (0.8%) and construction (0.9%)
sectors. The trade and manufacturing sectors are also responsible for providing a
relatively high percentage contribution to the GGP of the municipality as a whole at 12%
and 11% respectively.
Table 2.5 below provides an indication of the sectoral share of Naledi Local Municipality’s
economy per sector.
Table 2.5 Naledi’s GDP sectoral share per sector to municipality, district and province
Sector Share Naledi’s
sectoral share to Naledi
Naledi’s sectoral share to Bophirima
District
Naledi’s sectoral share to North West Province
Agriculture 5% 25% 4%
Mining 1% 5% 0%
Manufacturing 11% 52% 3%
Electricity and water 1% 31% 3%

Feasibility Study for Utilisation of Taung Dam Water 2.9
PWMA 10/C31/00/1408 Regional and National Economy July 2008
Sector Share Naledi’s
sectoral share to Naledi
Naledi’s sectoral share to Bophirima
District
Naledi’s sectoral share to North West Province
Construction 1% 18% 1%
Trade 12% 39% 2%
Transport 32% 73% 7%
Business services 14% 56% 2%
Community services 10% 35% 3%
Government services 13% 32% 2%
Total 100% 42% 2%
Source: Quantec 2007 and Kayamandi Calculation
As is evident from the above, Naledi local municipality is responsible for more than 40% of
the district’s GDP and nearly more than 2% of the Provinces GDP. With regards to the
municipality’s sectoral share to the Provincial GDP per sector, it is noted that transport
followed by agriculture, manufacturing, electricity and water, and community services, are
responsible for larger than average provincial GDP share of the same sectors. The
following sectors, from highest to lowest, have also contributed to higher than average
GDP contribution to the district’s economy (42%), namely:
• Transport 73%
• Business Services 56%
• Manufacturing 52%
2.1.2. GGP per sector of Phokwane Local Municipality
Table 2.6 below provides an indication of the GGP contribution per sector and Figure 2.3
below provides an indication of the growth of GGP per sector from 1995 to 2005.
Table 2.6. GGP per sector (constant 2000 values) for Phokwane Municipality
Sector 1995 2000 2005
Agriculture 8,592,777 98,162,937 97,747,265
Mining 22,655,979 31,536,938 40,730,272
Manufacturing 46,907,058 47,429,609 47,459,022

Feasibility Study for Utilisation of Taung Dam Water 2.10
PWMA 10/C31/00/1408 Regional and National Economy July 2008
Sector 1995 2000 2005
Electricity and water 88,132,117 65,616,248 43,346,105
Construction 24,195,784 21,615,516 24,547,909
Trade 165,811,944 213,528,400 256,723,415
Transport 88,702,425 101,030,485 122,448,670
Business services 128,127,417 116,949,865 124,239,895
Community services 70,325,637 85,880,876 99,260,668
Government services 220,992,733 245,449,931 262,059,704
Total 934,443,871 1,027,200,805 1,118,562,925
Source: Quantec 2007 and Kayamandi calculations
As indicated above and depicted below, the general government services sector has
consistently been the leading contributor to the local municipality’s GGP. The wholesale
and retail, trade, catering and accommodation sector is the second highest contributor to
the economy. The finance and business services, the transport and communication sector
as well as the agriculture, and the community, social and other personal services have
been consistent middle order contributors to the municipality’s economy. The electricity
and water sector underwent a rapid decline from R 88,8 million in 1995 to R43.3 million in
2005 and became part of the lowest contributors. The lower contributors to the
municipality’s economy are: manufacturing, mining and the construction sectors.
Figure 2.3 GGP per sector (constant 2000 values) of Phokwane
0
50000000
10000000
15000000
20000000
25000000
30000000
1995 1996 1997 1998 1999 2000 2001 2002 2003 2004 2005
Agriculture Mining Manufacturing Electricity Construction
Trade Transport Finance Community Government
Source: Quantec 2007 and Kayamandi Calculations

Feasibility Study for Utilisation of Taung Dam Water 2.11
PWMA 10/C31/00/1408 Regional and National Economy July 2008
Table 2.7 below provides an indication of the percentage distribution of the GGP per
sector.
Table 2.7. Percentage distribution of GGP per sector, 2005
Sector PHOKWANE
LM FRANCES BAARD DM
NORTHERN CAPE
RSA TOTAL
Agriculture 9% 2% 7% 3%
Mining 4% 16% 28% 7%
Manufacturing 4% 3% 3% 18%
Electricity & water 4% 3% 2% 2%
Construction 2% 2% 2% 3%
Trade 23% 13% 12% 15%
Transport 11% 14% 10% 11%
Business services 11% 19% 13% 21%
Community services 9% 10% 9% 6%
General Government services
23% 17% 13% 14%
Total 100% 100% 100% 100%
Source: Quantec 2007 and Kayamandi Calculation
In 2005 in Phokwane LM the trade and government services sectors contributed the most
to GGP at 23% each while the least contributor was the construction sector at 2% of the
GDP for the municipality as a whole. The transport and business services sectors are also
responsible for providing a relatively high percentage contribution to the GGP of the
municipality each contributing 11% to the GDP. The agriculture sector is also a relatively
high contributor at 9%. Phokwane municipality’s GDP contribution differs significantly to
the rest of the district and the province which have relatively higher contributions to their
respective GDPs from the mining sector.
Table 2.8 below provides an indication of the sectoral share of Phokwane Local
Municipality’s economy per sector.
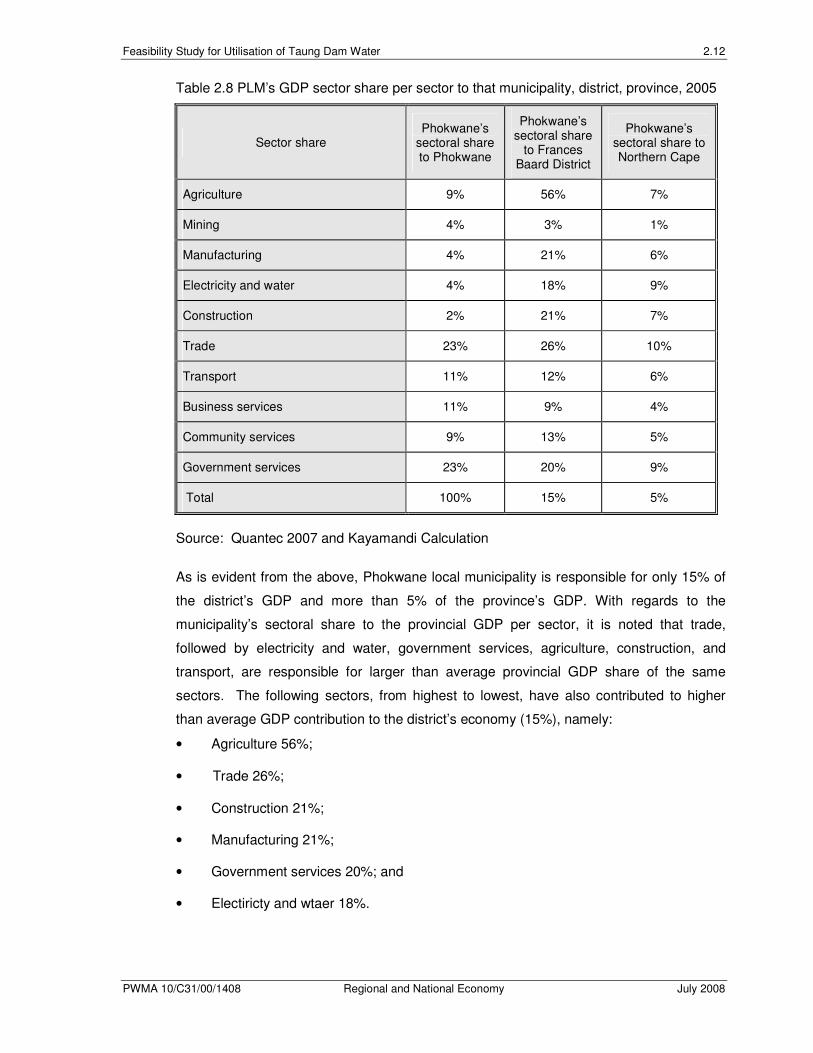
Feasibility Study for Utilisation of Taung Dam Water 2.12
PWMA 10/C31/00/1408 Regional and National Economy July 2008
Table 2.8 PLM’s GDP sector share per sector to that municipality, district, province, 2005
Sector share Phokwane’s
sectoral share to Phokwane
Phokwane’s sectoral share
to Frances Baard District
Phokwane’s sectoral share to Northern Cape
Agriculture 9% 56% 7%
Mining 4% 3% 1%
Manufacturing 4% 21% 6%
Electricity and water 4% 18% 9%
Construction 2% 21% 7%
Trade 23% 26% 10%
Transport 11% 12% 6%
Business services 11% 9% 4%
Community services 9% 13% 5%
Government services 23% 20% 9%
Total 100% 15% 5%
Source: Quantec 2007 and Kayamandi Calculation
As is evident from the above, Phokwane local municipality is responsible for only 15% of
the district’s GDP and more than 5% of the province’s GDP. With regards to the
municipality’s sectoral share to the provincial GDP per sector, it is noted that trade,
followed by electricity and water, government services, agriculture, construction, and
transport, are responsible for larger than average provincial GDP share of the same
sectors. The following sectors, from highest to lowest, have also contributed to higher
than average GDP contribution to the district’s economy (15%), namely:
• Agriculture 56%;
• Trade 26%;
• Construction 21%;
• Manufacturing 21%;
• Government services 20%; and
• Electiricty and wtaer 18%.

Feasibility Study for Utilisation of Taung Dam Water 2.13
PWMA 10/C31/00/1408 Regional and National Economy July 2008
The municipality’s contributes to more than half of the district’s share of agriculture, which
shows the relative importance of the agriculture sector in this municipality to the
agriculture sector of the district.
2.1.3. GGP per sector of Greater Taung Local Municipality
Table 2.9 below provides an indication of the GGP contribution per sector and Figure 2.4
below provides an indication of the growth of GGP per sector from 1995 to 2005.
As indicated and depicted below, the government services sector proved to be the
consistently overwhelming contributor to the GGP of the Greater Taung Local Municipality
(contributing R183,5 million to the economy in 2005). The other sectors are closely knit
together in terms of contribution to the economy. The community, social and other
personnel services sector as well as the mining sector have shown a marked increase in
production from the year 2000 to 2005. The electricity and water sector is the lowest
contributor to the economy in this municipality.
Table 2.9. GGP per sector (constant 2000 values)
Sector 1995 2000 2005
Agriculture 13,229,900 29,805,023 29,291,764
Mining 49,924,581 52,134,180 73,368,835
Manufacturing 18,630,210 18,994,859 19,639,204
Electricity and water 9,734,039 8,403,147 10,369,403
Construction 28,765,826 23,635,528 23,105,656
Trade 62,051,296 68,744,040 69,531,215
Transport 31,387,235 42,804,341 56,428,843
Business services 68,389,895 56,196,129 55,748,108
Community services 54,292,785 69,631,779 83,614,969
Government services 216,121,186 201,027,825 183,514,447
Total 13,229,900 29,805,023 29,291,764
Source: Quantec 2007 and Kayamandi calculations
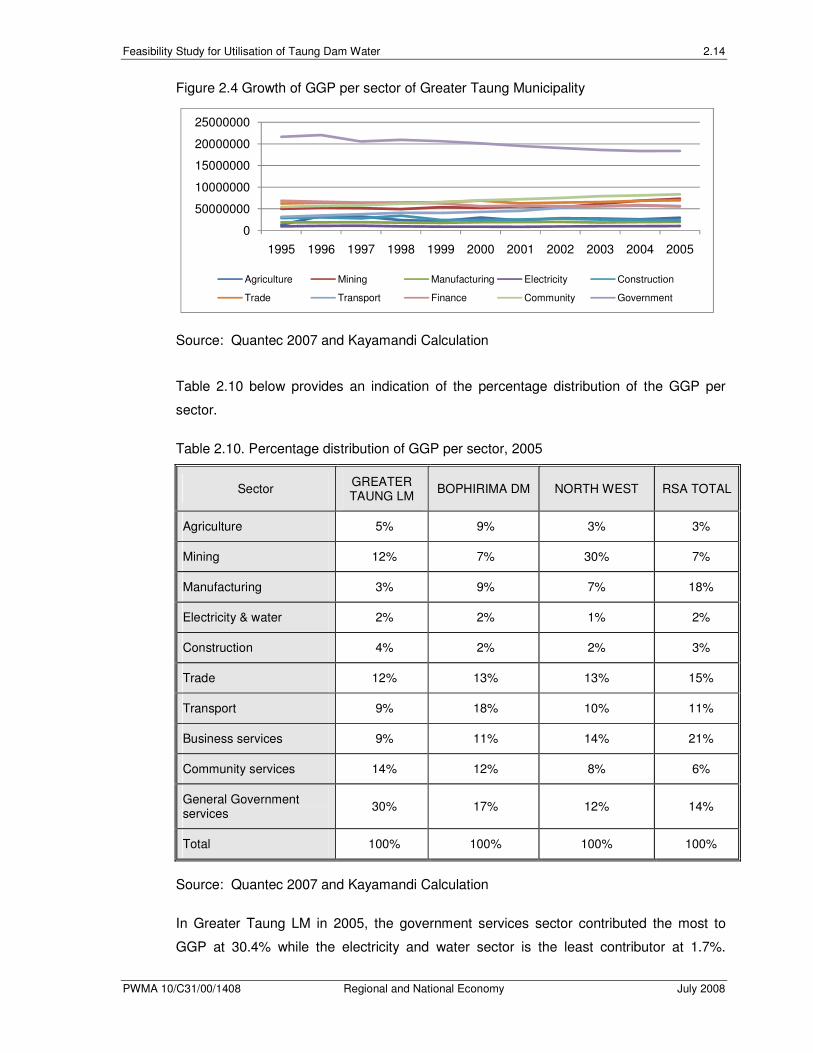
Feasibility Study for Utilisation of Taung Dam Water 2.14
PWMA 10/C31/00/1408 Regional and National Economy July 2008
Figure 2.4 Growth of GGP per sector of Greater Taung Municipality
0
50000000
10000000
15000000
20000000
25000000
1995 1996 1997 1998 1999 2000 2001 2002 2003 2004 2005
Agriculture Mining Manufacturing Electricity Construction
Trade Transport Finance Community Government
Source: Quantec 2007 and Kayamandi Calculation
Table 2.10 below provides an indication of the percentage distribution of the GGP per
sector.
Table 2.10. Percentage distribution of GGP per sector, 2005
Sector GREATER TAUNG LM
BOPHIRIMA DM NORTH WEST RSA TOTAL
Agriculture 5% 9% 3% 3%
Mining 12% 7% 30% 7%
Manufacturing 3% 9% 7% 18%
Electricity & water 2% 2% 1% 2%
Construction 4% 2% 2% 3%
Trade 12% 13% 13% 15%
Transport 9% 18% 10% 11%
Business services 9% 11% 14% 21%
Community services 14% 12% 8% 6%
General Government services
30% 17% 12% 14%
Total 100% 100% 100% 100%
Source: Quantec 2007 and Kayamandi Calculation
In Greater Taung LM in 2005, the government services sector contributed the most to
GGP at 30.4% while the electricity and water sector is the least contributor at 1.7%.

Feasibility Study for Utilisation of Taung Dam Water 2.15
PWMA 10/C31/00/1408 Regional and National Economy July 2008
Community services (13.8%), trade (12.1%) and Mining (12.1%) are also significant
contributors to the GGP in Greater Taung LM. The contribution of the government
services to the economy of Greater Taung indicates a skewed economy, with a high
dependence on the government sector, which is not the case in the district, nor the
province or the country as a whole.
Table 2.11 below provides an indication of the sectoral share of Greater Taung Local
Municipality’s economy per sector.
Table 2.11 GTLM’s GDP sectoral share per sector to municipality, district, province, 2005
Sector share GTLM’s
sectoral share to GTLM
GTLM’s sectoral share to Bophirima
District
GTLM’s sectoral share to North
West
Agriculture 5% 9% 1%
Mining 12% 32% 0%
Manufacturing 3% 7% 0%
Electricity and water 2% 18% 1%
Construction 4% 31% 2%
Trade 12% 16% 1%
Transport 9% 9% 1%
Business services 9% 15% 1%
Community services 14% 21% 2%
Government services 30% 33% 2%
Total 100% 18% 1%
Source: Quantec 2007 and Kayamandi Calculations
As is evident from the above table, Greater Taung local municipality is responsible for only
18% of the districts GDP and only 1% of the province’s GDP. With regards to the
municipality’s sectoral share to the provincial GDP per sector, it is noted that construction
and government and community services sectors are responsible for larger than average
provincial GDP share of the same sectors. The following sectors, from highest to lowest,
have also contributed to higher than average GDP contribution to the district’s economy
(18%), namely:
• Government services 33%;

Feasibility Study for Utilisation of Taung Dam Water 2.16
PWMA 10/C31/00/1408 Regional and National Economy July 2008
• Mining 32%;
• Construction 31%;
• Community services 21%; and
• Electricity and water 18%
The municipality’s contributes approximately a third to the district’s share of government
services and mining. This shows the relative importance of the mining sector in this
municipality to the mining sector of the district.
2.2. Employment
According to Statistics South Africa 2004, employment is defined as an activity in which
an economic active person is engaged for pay, profit or family gain or a combination of
any of the three. The definition applies to both the informal and formal sectors. Formal
employment is an important sector in the economy of a local municipality as it fosters
more sophisticated economic activities that would eventually improve the macro economy
of a particular local municipality.
Unemployment is a major problem in the area, which serves as fertile ground for other
social problems that hinder economic development and social well being. Many people in
the area are uneducated and have no income. Those who are employed are usually
employed in low-income industries i.e. as farm workers or domestic workers. There are
very few professional workers in the area.
Table 2.12. below provides an indication of the employment status of the potentially
economically active population of persons aged between the ages of 15-64 years as well
as the employment status of the economically active population (actively employed
population). It should be understood that the potentially economically active people
together with the total number of workers in an area and the number of people believed to
be available for work create what is known as the labour force, i.e. the population between
the ages of 15 to 64 years (as defined by Stats SA).
Table 2.12 below reveals that a significant percentage of the potentially active population
are not economically active. Greater Taung Municipality has the highest disparity of a
potentially active population as only 25% of the potentially economically active population
are indeed economically active, whereas in Phokwane and Naledi local municipalities this
is 55% and 59% respectively.

Feasibility Study for Utilisation of Taung Dam Water 2.17
PWMA 10/C31/00/1408 Regional and National Economy July 2008
Table 2.12. Percentage distribution of formal employment status of economically active
population, 2007
PLM NLM GTLM FBD BD NW NC RSA
Employment status (%) of potentially economically active population (total population aged 15-64 years of age)
Employed 38% 31% 14% 37% 22% 37% 39% 40%
Unemployed 17% 28% 11% 18% 16% 20% 17% 19%
Not economically active
42% 38% 73% 41% 60% 39% 40% 37%
Not applicable 3% 3% 2% 3% 2% 4% 4% 4%
Total 100% 100% 100% 100% 100% 100% 100% 100%
Employment status (%) - Economically active population
Employed 69% 53% 55% 67% 58% 65% 69% 67%
Unemployed 31% 47% 45% 33% 42% 35% 31% 33%
Total 100% 100% 100% 100% 100% 100% 100% 100%
Source: Community survey 2007 and Kayamandi calculations
Phokwane LM has a significant percentage of the population of working age employed,
accounting for 38% of the potentially economically active population. This is in line with
that of the Frances Baard District (37%), the Northern Cape (39%) and South Africa (40%)
as a whole, in which it is situated.
Within Naledi local municipality only 31% of the potentially economically active population
is employed. This is however far higher than that of the Bophirima District (22%) although
far lower than that of the North West Province (37%) and the country as a whole.
Greater Taung LM has only 14% of its potentially economically active population
employed, which is far lower than that of its district and province. The above table also
reveals that the higher the disparity between the potentially economically active to the
economically active, the lower the amount of people actively employed or searching for
employment in order to improve their economic situation.
The level of unemployment prevalent in a particular area is a good indicator of the
intensity for the demand of job creation. Statistics South Africa defines the unemployed as
economically active people who: did not work in the past seven days, want to work and
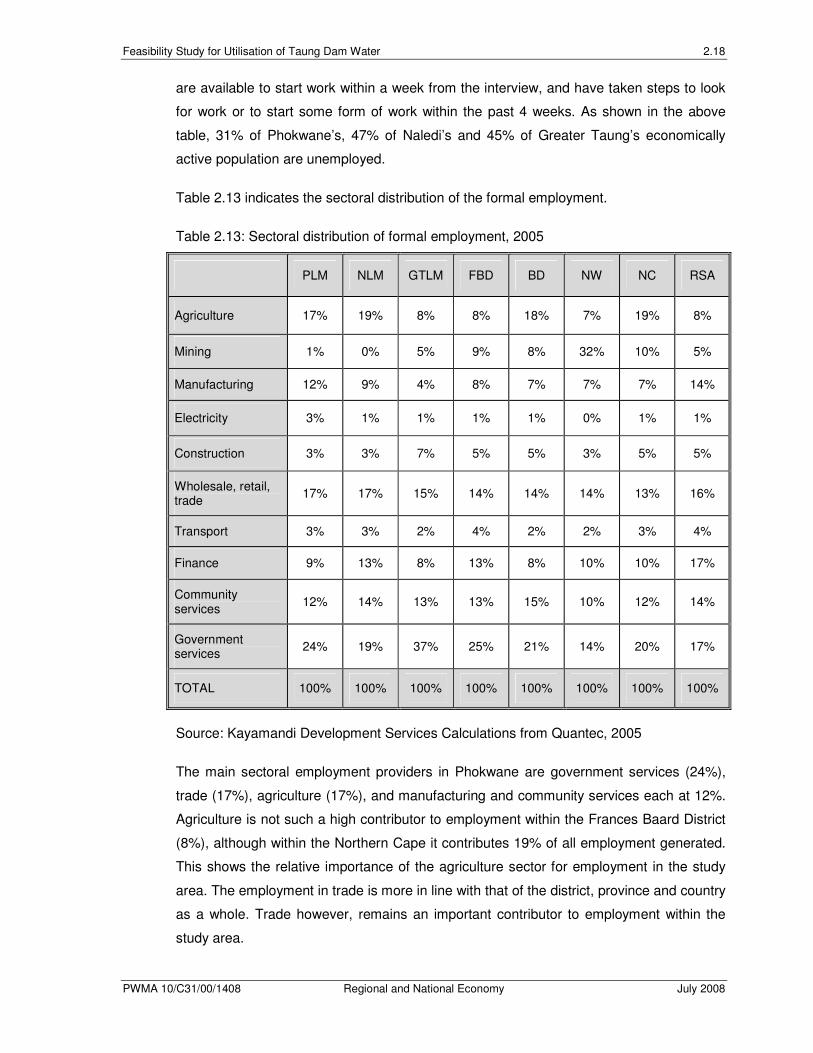
Feasibility Study for Utilisation of Taung Dam Water 2.18
PWMA 10/C31/00/1408 Regional and National Economy July 2008
are available to start work within a week from the interview, and have taken steps to look
for work or to start some form of work within the past 4 weeks. As shown in the above
table, 31% of Phokwane’s, 47% of Naledi’s and 45% of Greater Taung’s economically
active population are unemployed.
Table 2.13 indicates the sectoral distribution of the formal employment.
Table 2.13: Sectoral distribution of formal employment, 2005
PLM NLM GTLM FBD BD NW NC RSA
Agriculture 17% 19% 8% 8% 18% 7% 19% 8%
Mining 1% 0% 5% 9% 8% 32% 10% 5%
Manufacturing 12% 9% 4% 8% 7% 7% 7% 14%
Electricity 3% 1% 1% 1% 1% 0% 1% 1%
Construction 3% 3% 7% 5% 5% 3% 5% 5%
Wholesale, retail, trade
17% 17% 15% 14% 14% 14% 13% 16%
Transport 3% 3% 2% 4% 2% 2% 3% 4%
Finance 9% 13% 8% 13% 8% 10% 10% 17%
Community services
12% 14% 13% 13% 15% 10% 12% 14%
Government services
24% 19% 37% 25% 21% 14% 20% 17%
TOTAL 100% 100% 100% 100% 100% 100% 100% 100%
Source: Kayamandi Development Services Calculations from Quantec, 2005
The main sectoral employment providers in Phokwane are government services (24%),
trade (17%), agriculture (17%), and manufacturing and community services each at 12%.
Agriculture is not such a high contributor to employment within the Frances Baard District
(8%), although within the Northern Cape it contributes 19% of all employment generated.
This shows the relative importance of the agriculture sector for employment in the study
area. The employment in trade is more in line with that of the district, province and country
as a whole. Trade however, remains an important contributor to employment within the
study area.
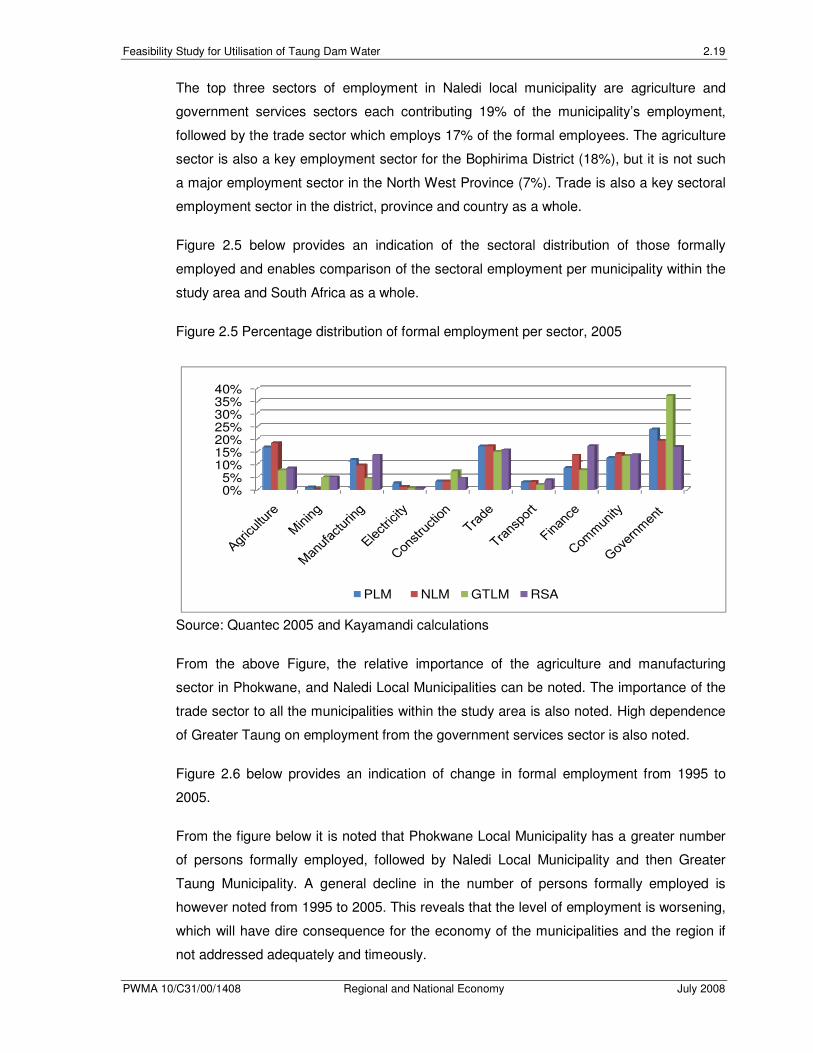
Feasibility Study for Utilisation of Taung Dam Water 2.19
PWMA 10/C31/00/1408 Regional and National Economy July 2008
The top three sectors of employment in Naledi local municipality are agriculture and
government services sectors each contributing 19% of the municipality’s employment,
followed by the trade sector which employs 17% of the formal employees. The agriculture
sector is also a key employment sector for the Bophirima District (18%), but it is not such
a major employment sector in the North West Province (7%). Trade is also a key sectoral
employment sector in the district, province and country as a whole.
Figure 2.5 below provides an indication of the sectoral distribution of those formally
employed and enables comparison of the sectoral employment per municipality within the
study area and South Africa as a whole.
Figure 2.5 Percentage distribution of formal employment per sector, 2005
0%5%
10%15%20%25%30%35%40%
PLM NLM GTLM RSA
Source: Quantec 2005 and Kayamandi calculations
From the above Figure, the relative importance of the agriculture and manufacturing
sector in Phokwane, and Naledi Local Municipalities can be noted. The importance of the
trade sector to all the municipalities within the study area is also noted. High dependence
of Greater Taung on employment from the government services sector is also noted.
Figure 2.6 below provides an indication of change in formal employment from 1995 to
2005.
From the figure below it is noted that Phokwane Local Municipality has a greater number
of persons formally employed, followed by Naledi Local Municipality and then Greater
Taung Municipality. A general decline in the number of persons formally employed is
however noted from 1995 to 2005. This reveals that the level of employment is worsening,
which will have dire consequence for the economy of the municipalities and the region if
not addressed adequately and timeously.

Feasibility Study for Utilisation of Taung Dam Water 2.20
PWMA 10/C31/00/1408 Regional and National Economy July 2008
Figure 2.6 Formal employment per municipality
Source: Quantec 2005 and Kayamandi calculations
2.3. Income distribution
Based on the relatively high unemployment figures and relatively high percentage of
employment in lower paying primary sectors such as agriculture the income distribution of
the municipalities within the study area is expected to be relatively low and needs to be
taken into consideration.
Disposable income is defined as the net income available to a particular person to either
save or spend. Income is an important factor to consider in a macroeconomic analysis as
it indicates the amount of money households have available to participate (buy and sell) in
the local economy.
Table 2.14 below provides an indication of the distribution of annual household income
per municipality.
Table 2.14 Percentage Distribution of annual household income per municipality
INCOME CATEGORY
PLM NLM GTLM FBD BD NW NC RSA
No income 14% 13% 34% 17% 28% 23% 17% 23%
R 1- R 4800 15% 16% 11% 9% 14% 9% 9% 8%
R 4801-R 9600 25% 25% 26% 21% 25% 19% 22% 18%

Feasibility Study for Utilisation of Taung Dam Water 2.21
PWMA 10/C31/00/1408 Regional and National Economy July 2008
INCOME CATEGORY
PLM NLM GTLM FBD BD NW NC RSA
R9601-R 19200 17% 18% 15% 18% 16% 19% 18% 16%
R19201-R 38400 12% 12% 7% 14% 9% 16% 14% 13%
R38401- 76800 8% 7% 4% 10% 5% 7% 9% 9%
R76801- R 153600
5% 5% 2% 7% 3% 4% 6% 6%
R 153601 and more
3% 3% 1% 5% 2% 3% 4% 6%
TOTAL 100% 100% 100% 100% 100% 100% 100% 100%
Source: Census 2001 and Kayamandi Calculations
Greater Taung Local Municipality has the highest percentage of households with no
income accounting for approximately one third of the households (34%) as compared to
only approximately 14% of households in both Naledi and Phokwane Local Municipalities
with no household income. This reveals that the study area has a high indigent status. In
Phokwane (14%) and Naledi (13%) Local Municipalities there are however fewer
households without income than that of the country as a whole (23%).
In Phokwane, Naledi and Greater Taung approximately 15%, 16% and 11% respectively
of the municipality’s households are situated under the R1- R4 800 income category while
the most common income scale is between R4801 and R9600 of the study area. This
category describes the household income levels of approximately a quarter of each of the
municipality’s households. The R9 601 to R19 200 category has a significant amount of
the study area’s households indicating about 17%, 18%, and 15% of the population of
Phokwane, Naledi and Greater Taung Local Municipalities respectively.
Figure 2.7 below provides an indication of the household income distribution per
municipality.
In each of the municipalities a scenario is presented in which the majority of the
municipality’s households have an income (lower than R9600) while a minority have high
incomes. On the one hand there is a significant amount of people with no household
income while on the other hand there are a few households in the study area with very
high annual incomes of R153 600 and more. This indicates a huge income disparity which
is an obstacle to economic development in the study area.

Feasibility Study for Utilisation of Taung Dam Water 2.22
PWMA 10/C31/00/1408 Regional and National Economy July 2008
Figure 2.7 Household income distribution per municipality
Source: Census 2001 and Kayamandi calculations
2.4. Level of Education
The following section provides an indication of the level of education. Education has a
huge bearing employment and income level. It enables people through training to be more
productive in the various sectors of the economy. Education is an important factor to
consider in a regional economic analysis as it plays a crucial role in the potential rate for
development. Table 2.15 provides an indication of the highest education levels reached.
Table 2.15 Level of education of the population aged 20 years and older
LEVEL PLM NLM GTLM FBD BD NW NC RSA
No Schooling 22% 21% 25% 13% 27% 15% 14% 11%
Primary 31% 29% 36% 27% 32% 31% 31% 26%
Secondary 37% 39% 31% 47% 32% 42% 44% 48%
Tertiary 9% 9% 6% 10% 7% 8% 9% 12%
Unspecified 1% 1% 2% 3% 2% 4% 3% 3%
TOTAL 100% 100% 100% 100% 100% 100% 100% 100%
Source: Kayamandi Development Services Calculations from Community Survey 2007
Figure 2.8 provides an indication of the percentage distribution of education of people
aged 20 years and above.

Feasibility Study for Utilisation of Taung Dam Water 2.23
PWMA 10/C31/00/1408 Regional and National Economy July 2008
Figure 2.8: Percentage distribution of level of education (20 years and older)
Source: Community Survey 2007 and Kayamandi calculations
The above table and figure reveals that approximately 25% of the population aged 20
years and older living in Greater Taung Local Municipality have had no schooling, which is
extremely high compared to the national average of 11%. Approximately 36% of the
population have however had primary school education and 31% secondary education.
The tertiary level of education is very low at 6%. These figures reveal a generally low
level of skills that are incompatible with some economic activities in the municipality.
For Naledi Local Municipality the figures reveal a similar picture to the Greater Taung
Local Municipality as half the people living in the municipality, have either had no
schooling or only primary school education. The level of secondary school accounts for
39% of the population. The tertiary level of education is however more on par with that of
the country as a whole at 9%.
Phokwane Local Municipality shows a population above the age of 20 with 22% of
persons with no schooling. Approximately 9% of the population aged 20 years and older
have obtained tertiary education.
2.5. Conclusion
Naledi LM has consistently been the highest GGP contributor in the study area followed
by Phokwane LM. Greater Taung LM has consistently been the lowest GGP contributor.
Greater Taung thus has a very low GGP in relation to its population size which exceeds
that of the other two municipalities. The economy of Naledi Local Municipality experienced
the highest average annual GGP growth of all the three municipalities in the study area on
par with that of the country as a whole between the ten-year period from 1995 to 2005.

Feasibility Study for Utilisation of Taung Dam Water 2.24
PWMA 10/C31/00/1408 Regional and National Economy July 2008
However, the economy of the Greater Taung Local Municipality only grew at nearly a
quarter than that of the country as a whole and Phokwane Local Municipality experienced
growth at nearly half than that of the country as a whole. The study area, mostly
Phokwane and Greater Taung Local Municipalities are thus areas with relatively low
growth compared to the country as a whole. The area also has a small economy in
relation to its contribution to the districts and provinces in which they are situated. This
area will thus benefit from economic injections in the form of the proposed development.
Unemployment is also a major problem in the area, hence the low GGP contribution,
which serves as fertile ground for other social problems that hinder economic
development and social well being. Many people in the area are uneducated, or have low
levels of skills that are incompatible with the desired level of economic activity in the
municipality. Those who are employed are usually employed in low-income industries
such as farm workers or domestic workers. There are very few professional workers in the
area. The result is that that a large portion of the population has limited to no income.

Feasibility Study for Utilisation of Taung Dam Water 3.1
PWMA 10/C31/00/1408 Regional and National Economy July 2008
3. REGIONAL AND NATIONAL ECONOMIC IMPACTS
This section outlines the possible economic impacts that can be expected to occur in the
local and regional economy as a result of utilisation of water from the Taung dam. It is
important to note that the quantification of economic impacts on the regional and national
economy as determined with the input/output analysis is not based on local population
figures, but on additional expenditure in the economy during the construction and
operation phase associated with the infrastructure development required to enable supply
of domestic use of water from the Taung Dam to the villages south-east of Taung Dam,
Bogosing Water Supply area, and the Taung Water Supply area.
The following aspects are covered in this Section:
• Impact assessment assumptions;
• Impact assessment technique for quantification of regional and national impacts;
• National and Regional Economic Impacts during Construction;
• National and Regional Economic Impact during Operation; and
• Economic value of domestic water supply.
3.1 Impact Assessment Assumptions
This economic impact is based on the following knowledge and assumptions of utilisation
of Taung dam water at this stage:
• The pipeline will be installed outside of the road reserve outside of towns and
villages and inside the road reserve where the road goes through towns and
villages;
• A 12 metre wide servitude is required for the pipeline;
• No new fences will be installed alongside the servitude;
• The water of the Taung Dam will be utilised to provide in primary water needs only; and
• The construction phase will take place during 2010 and 2011.
3.2 Impact assessment technique for quantification of regional and economic impacts
In terms of quantifying the impacts on the regional and national economy an input-output
model was utilised. An input-output model has various analytical applications that can be
used to determine the direct, indirect and induced impact of the proposed transformation
process on the economy. The approach takes into account the interdependence between
Feasibility Study for Utilisation of Taung Dam Water 3.2
PWMA 10/C31/00/1408 Regional and National Economy July 2008
different sectors (i.e. agriculture, mining, manufacturing, government, etc) in the local
economy as well as economic flows of goods and services to and from the economy.
This technique provides a snapshot of economic production at a given point in time and,
as such, has numerous application possibilities. The most prominent application of this
technique involves modelling the impact of changing production functions on general
economic equilibrium. In other words, the impacts that increased expenditure in the
economy resulting from the construction and operation of the civil and mechanical
components required for the utilisation of water from the Taung Dam were modelled.
Economic impacts are those impacts that affect the level of economic activity in a region.
For instance they directly affect the economic well-being of area residents and businesses
by changing employment levels and retail expenditures. An economic impact assessment
traces spending through an economy and measures the cumulative effects of that
spending.
Estimating the economic impact of a project or development is very helpful in
understanding the potential benefits of various forms of growth. It should be noted,
however, that the means of estimating these benefits are more useful in understanding
the likely order of magnitude of impacts rather than specific amounts.
Typically the effects of the input/output technique are as follows:
• The direct effects: this takes into account direct purchases made within the economy
by the project, the number of people employed, etc. This effect is the initial,
immediate economic activities (jobs and income) generated by a project or
development. Direct impacts associated with the development coincide with the first
round of spending in the economy.
• The indirect effects (backward linkages): this takes into account the fact that the
supplying industries (such as construction related industries, catering industries,
transport industries, etc) will also have to purchase more inputs, employ more labour
and pay more wages, and that there will be a chain reaction or multiplier of effects
as a result of increased spending in the economy. In other words indirect impacts
are the production, employment and income changes occurring in other
businesses/industries in the community that supply inputs to the project industry.
• The induced effects (forward linkages): this takes into account the fact that the
increased household income leads to an increase in household expenditure and to
increases in national production. Furthermore, the project will pay large amounts of

Feasibility Study for Utilisation of Taung Dam Water 3.3
PWMA 10/C31/00/1408 Regional and National Economy July 2008
revenue to the different tiers of government, which in turn will increase overall
government expenditure in the economy. For instance, the induced effects arise
when employees who are working on the project spend their new income.
• The sum of the direct, indirect and induced effects is the total effect.
3.3 National and Regional Economic Impacts during construction
The following national and regional economic impacts (described hereunder) are
anticipated during the short-term construction phase:
• Stimulation of economy;
• Employment creation, decrease in local unemployment level and skills transfer;
• Business output/sales and increased standards of living;
• Government income and expenditure; and
• Inflow and outflow of temporary workers.
3.3.1. Stimulation of the economy
The construction of the infrastructure required for the provision of domestic water supply
will have a positive impact on the economy due to: increased financial spending in the
economy related to increased infrastructure investment, civil construction, mechanical
purchases, and increased expenditure by employees. This impact on the economy can be
manifested in terms of the sectoral impact on GDP.
In many instances goods do not reach the consumer via the market and it is also difficult
to calculate the value of these goods. As a rule therefore only the results of the activities,
which are intended to satisfy the needs of other people through trade, are considered to
form part of the GDP. If this is to be stated by way of formula, taking into account the
concept of value added, it can be put as follows: Gross value of production less value of
intermediate goods and services equates to gross value added. If the gross value added
of all the trading sectors is added together the GDP is obtained.
Change in gross domestic product essentially reflects the sum of wage income and
corporate profit generated in the study area as a result of an exogenous change in the
economy, in this case bulk water infrastructure.
In order to determine the increased financial spending in the economy the current
estimates of expenditure during construction were obtained.

Feasibility Study for Utilisation of Taung Dam Water 3.4
PWMA 10/C31/00/1408 Regional and National Economy July 2008
It is important to realise that the construction impact is experienced during the
construction period. Thus, it is only sustainable for the duration of the development, i.e.
two years. Once the development phase nears its end, the construction impact
diminishes.
The local area and its activities (businesses and shops, etc) are expected to be stimulated
economically, due to the increased spending expected from the increased salaries and
wages paid to employees during construction and service industries in the region will thus
benefit from the activity. This will have a knock-on effect on suppliers of goods and
services in other areas.
The capital investment during the construction is thus expected to have a positive impact
on the economy resulting in increased financial spending in the economy in terms of
construction related activities, the increased infrastructure investment as well as increased
expenditure from the construction workers. This positive impact is likely to be experienced
in terms of the increased markets for the sale of local goods to construction staff and
direct employment by construction contractors.
The exogenous change in the economy will impact different sectors in different ways, with
some sectors such as manufacturing, trade and finance and business services benefiting
more than others. Sectoral impacts could include:
• Agriculture - during the construction phase the agriculture sector will be stimulated due
to the need for minor primary inputs from the agriculture sector for the infrastructure
development (such as lubricants) as well as for the increased purchases from
construction workers;
• Mining - During the construction phase the mining sector will be stimulated due to the
need for construction materials such as quarry for sand and gravel, and materials
used in the production of cement, iron, steel, etc;
• Manufacturing – Positive stimulation. Possible industries to be stimulated include
construction vehicles, concrete and cement, iron, steel and machinery, including
pumps;
• Construction – this sector will receive a large boost during the construction phase of
the option which include canals, pipelines, weirs, reservoirs, etc as well as indirect
construction. As construction is fairly labour intensive it is expected that a large
number of employment opportunities will be created although only temporary in nature
during construction;

Feasibility Study for Utilisation of Taung Dam Water 3.5
PWMA 10/C31/00/1408 Regional and National Economy July 2008
• Trade- the trade sector includes retailers, wholesalers, restaurants and
accommodation establishments which are all expected to be stimulated mainly during
construction. The increase in people employed will lead to increased buying power in
the area which directly stimulates the wholesalers and retailers. Trade will be
stimulated by the large number of people either staying or moving around the area;
and
• Transport, finance and services: These sectors will be simulated mainly during the
construction phase through the increased number of people in the area.
The additional GDP arising from the capital investment during the construction phase of
the bulk water supply infrastructure could be approximately R60 million, approximately
half of which is due to the direct impact, R25 million due to the indirect impacts and R5
million due to the induced impacts. Approximately R5 million of this impact will accrue to
the North-West Province. During the construction phase the majority of the impact will be
felt in the construction, manufacturing, trade, and transport sectors.
The multiplier or spin-off effects associated with this economic contribution (namely capital
expenditure, salaries and wages, etc) include improved standards of living, decreased
dependence on pensions, increased disposable income and ability to purchase additional
goods and/or establish other business enterprises. Apart from having the potential to
create occupational opportunities, the proposed development could also stimulate
economic growth in the region by attracting other commercial activities. If this is the case,
indirect local benefits may accrue in the form of job opportunities in other sectors and
industries. The proposed development may also serve as a catalyst for the improvement
of services and infrastructure in the longer term.
3.3.2. Employment creation and skills transfer
During the construction phase, temporary employment will be created. The increased
temporary employment in the area during the construction phase will also result in
increased expenditure, which, in addition, will mean that more than just the proposed jobs
required for the construction will be created due to economic spin-offs that will result.
During and towards the end of the construction period, the temporary employment
contracts awarded need to be terminated. This could result in sudden loss of income,
wealth, new business sales, etc. The employees, surrounding community, businesses, etc
would all need to be informed of this from the start so that expectations are not created
and that the negative effects associated with the termination of temporary employment
contracts can be absorbed as far as possible.
Feasibility Study for Utilisation of Taung Dam Water 3.6
PWMA 10/C31/00/1408 Regional and National Economy July 2008
The unemployment rate of the economically active population within the communities in
the affected municipalities is currently high. The proposed development will thus bring
some relief to the high unemployment figures in the area during the construction phase.
Most of the indirect and induced jobs will be created in the manufacturing, finance and
business sector, mining, trade and accommodation sectors and transport sectors. During
the construction phase, local contractors and service providers need to be utilised as far
as practically possible.
The benefit of increased jobs in the area can also be translated into economic terms, and
the additional jobs would in essence result in additional income creation. This increase in
income in the area can be translated into specific impacts ranging from black economic
empowerment (BEE) to poverty alleviation depending on the procurement policy and the
construction technology applied. More previously disadvantaged people could be provided
with an opportunity to become involved in the formal economy and also provided with an
annual income that would place them in the financial position to acquire all the goods and
services that are required to maintain a basic level of living.
Total employment generation reflects the number of jobs created or lost as a result of the
exogenous change in the economy. A job is defined as one person employed for one
year. This does not mean that new job opportunities arise per year, but that new man
days of work arise each year some of which could be fulfilled by existing employees
others requiring new temporary employment, etc.
The proposed infrastructure development and mechanical manufacturing of infrastructure
requirements will lead to the creation of additional jobs to the approximate amount of
1,800 during the construction phase. The direct temporary employment opportunity during
the construction phase is approximately 600 jobs. Approximately 10% of the national
employment effect will accrue to the North West Province. The sectors mostly stimulated
by additional employment generation during the construction phase are the construction
sector, services and household sector and the manufacturing sector.
With an increase in employment, a definite transfer of skills will result. Skills development
is a requisite for human resource development, and will have a lasting impact on the
economy. Allied to the additional jobs created during the construction phase there will be
an element of skill acquisition. This skill acquisition is valuable in that people that have
acquired these skills will be able to search elsewhere for similar construction employment
after the completion of the construction phase, and will be better equipped to handle the
D.I.Y household jobs. It should however be noted that the skill acquisition will probably be

Feasibility Study for Utilisation of Taung Dam Water 3.7
PWMA 10/C31/00/1408 Regional and National Economy July 2008
limited to on the job training although skill acquisition is expected to take place since the
construction phase is estimated to last two years.
3.3.3. Business output/sales and increased standards of living
The increased employment expected with the construction of the bulk water infrastructure,
will impact positively upon the regional and local economy.
Increased employment is associated with increased income and consequently with
increased buying power in the area, thus leading to new business sales. With the
increased employment and a subsequent increase in monthly incomes, increased
business opportunities can be experienced. The economic benefits mostly include an
increase in trade such as local shops, restaurants, accommodation and transport
services. These increases in businesses are as a result of the following factors:
• Increased market size;
• Higher disposable incomes;
• Satisfaction of identified needs (such as building materials, or foodstuffs); and
• Increased consumer spending and increase entrepreneurial opportunities.
New Business Sales refers to the value of all inter- and intra-sectoral business sales
generated in the economy as a consequence of the introduction of an exogenous change
in the economy. Explained more simply, new business sales equates to additional
business turnover as a result of the introduction of a change in the economy.
Direct investment in the construction sector during the construction phase will yield new
business sales to the value of approximately R490 million for the bulk infrastructure.
Approximately R50 million of the total national effect is likely to accrue to the North West
Province. During the construction phase the sectors that will mostly be stimulated by new
business sales include the electricity and water sector, the construction sector, the
manufacturing sector, and the household sector.
As such it is evident that over and above the originally invested money during the
construction phase, a large amount of revenue is generated due to the multiplier effect in
the different sectors of the economy.
The sectors that will experience the highest demand for additional output are
manufacturing (i.e. manufacturing and supply of building materials), trade (i.e. supply of

Feasibility Study for Utilisation of Taung Dam Water 3.8
PWMA 10/C31/00/1408 Regional and National Economy July 2008
final goods and services), finance, real estate and business services (i.e. professional
services).
It is also anticipated that a positive local impact will be felt at Taung due to increased local
shopping and accommodation requirements during construction. The injection of
employment and money into the local community will be beneficial to the
towns/settlements as a whole. The increased employment expected with the
development, will also impact positively upon the regional and local economy. Increased
employment is associated with increased income and consequently with increased buying
powers in the area, thus raising the standards of living of the area. Given the current high
unemployment rate in the surrounding towns/settlements, the project therefore has the
potential to bring much needed economic relief to the local population.
With the increased employment and a subsequent increase in monthly income, increased
business opportunities can be experienced with the development. The economic benefits
that could be obtained include an increase in trade, and the development of new trade
such as local spazas, shops, stalls, etc as a result of the patronage of construction staff.
3.3.4. Government income and expenditure
The bulk water infrastructure can be seen as an economic injection to the area as it would
lead to increased government income.
The economic impacts will lead to fiscal impacts, which are changes in government
revenues and expenditures. For example, economic impacts on total business sales,
wealth or personal income can affect government revenues by expanding or contracting
the tax base. Due to the jobs that will be created as a result of the proposed development
as well as the increased business activity levels, the salaries and wages of those jobs
along with the increased turnover of the companies can be translated into increased
personal and business income tax.
In other words, government income will be increased as a result of the increase in tax it
will receive from the proposed construction of the bulk water infrastructure. The increased
government income from tax will mostly be as a result of increased economic activity.
Increased tax received by the government will be in the form of:
• Company tax;
• PAYE;
• UIF (Unemployment Insurance Fund);
• Skills development Levy (SDL); and

Feasibility Study for Utilisation of Taung Dam Water 3.9
PWMA 10/C31/00/1408 Regional and National Economy July 2008
• Rates and taxes.
The proposed bulk infrastructure can thus be seen as an economic injection into the area
as it would lead to increased government income. The development could thus lead to the
creation of other economic spin-offs that benefit the entire region. Local benefits could
accrue to the government through an increased tax base increasing the capacity of the
local municipality and other social and service support actions. In other words, the
increased income received by the government will enable increased spending locally. This
means that increased government services such as community facilities could be provided
by the increased income generated.
3.3.5. Inflow and outflow of temporary workers
Impacts of large-scale development projects tend to be closely associated with the
relocation (immigration) of project workers and their families to communities near the
project site. This will thus lead to a substantial local population growth, demands on local
services and infrastructure, fiscal problems for local governments, and increased
problems of social assimilation.
These problems are typically exacerbated by fluctuations in workforce size, which could
occur during the construction based on the different construction components and the
length of the construction period. The influx of people could be brought about by a number
of factors. Through its positive economic impacts, the construction phase can attract
squatters in search for employment (both directly and indirectly related to the project).
Squatter camps can have a number of environmental impacts, which in turn impact upon
the economy, such as an increase in crime, increase in STDs and related illnesses,
increased pressure on social facilities and bulk infrastructure, potential loss of power
amongst local traditional leaders, etc.
Key factors affecting the number of workers and dependents who move to the site include
the size of the project workforce, the magnitude of secondary employment effects, the
proportion of the jobs that are filled by local project workers (including daily commuters),
the extent to which non-local project workers are accompanied by their families, and the
size of those families.
In the event of imported workers entering the area during the construction phase, conflict
may arise with the local population due to different cultures, traditions and habits.
Imported workers may be relatively well paid compared to the local workforce around
towns and farms, which could lead to conflict.

Feasibility Study for Utilisation of Taung Dam Water 3.10
PWMA 10/C31/00/1408 Regional and National Economy July 2008
Therefore, an emphasis on use of local labour is suggested as the use of outside or
imported labour may have negative implications for the surrounding economic status quo.
The ‘outside’ persons could create a new social class with different behaviours and
lifestyles. Employment of a large outside workforce could lead to conflict between
‘outsiders’ and locals due to differences in culture and values, competition for employment
opportunities, a perception among local residents that facilities are being provided for
outsiders while their own needs are not being addressed, etc.
The accommodation of staff in the absence of their family members - has the potential to
result in more incidences of sexually transmitted diseases (STDs) and AIDS. In these
instances employees are away from home and are not accountable to family structures
that assist in providing the checks-and-balances often necessary for the control of sexual
promiscuity. In addition, the disposable income available to employees makes them an
attractive target for sex workers. Furthermore, local men and women may become
romantically involved with construction staff that have previously contracted STDs or
AIDS. These may all negatively impact the regional economy.
Increase in local population could also trigger indirect impacts such as a higher crime rate.
This will be impacted by the rate of influx of persons due to the construction activities.
Crime in the area is currently controlled by virtue of the fact that residents know each
other and are familiar with the comings-and-goings of their neighbours and fellow
residents. The in-migration of outsiders (including construction staff) will therefore dilute
the extent of familiarity within the area and undermine the role of familiarity as a system of
control. In addition, outsiders may not respect the judiciary roles of the traditional leaders
and the part that they play in controlling the extent of crime in the area.
3.4. National and Regional Economic Impacts during operation
The following national and regional economic impacts (described hereunder) are
anticipated during the long-term operation phase:
• Stimulation of economy;
• Employment creation, decrease in local unemployment level and skills transfer;
• Business output/sales and increased standards of living; and
• Government income and expenditure.
Feasibility Study for Utilisation of Taung Dam Water 3.11
PWMA 10/C31/00/1408 Regional and National Economy July 2008
3.4.1. Stimulation of the economy
The operation and maintenance of the infrastructure associated with the delivery of
domestic water supply will have a positive impact on the economy due to increased
financial spending in the economy, and increased expenditure by employees. During the
operation phase, GDP will be stimulated but to a far lesser degree than in the construction
phase due to far less jobs being created and far less expenditure. However, the operation
impact will be sustained for a longer period and the impacts associated are thus far more
sustainable.
Possible regional economic influences that may impact on the growth of the study area
during operation include:
• Regional development initiatives - the development policies of the North West
compared to other provinces as well as the status of the study area in the province;
• Agriculture- possible expansion of irrigation (although not as a direct result of the
infrastructure developed for the supply of domestic water); and
• Capital development projects – the study area will receive an economic boost from
employment of local labour and purchasing of supplies. The injection of capital in the
operation phase is however small in comparison to the value of the project.
The additional GDP arising from the operating expenditure during the operational phase is
approximately R400 000 per annum. This means that the economy will experience a
direct growth effect during the operation period of approximately R200 000, and an
indirect growth effect of approximately R150 000 and a relatively small induced effect of
R50 000. Furthermore, based on expected procurement, approximately R40 000 per
annum will accrue to the North-West Province. During the operation phase the sector
mostly stimulated by additional GDP generation is the water and electricity sector.
3.4.2. Employment creation, decrease in local unemployment level and skills transfer
Full-time employment during the operation of bulk water distribution and purification works
will have a permanent effect on the economy, although probably far less than during the
construction phase. Apart from the permanent directly created jobs there will be scope for
other jobs to be created by the local population due to spin-off effects in the economy as
well as due to stimulation of additional income generating activities consequent upon
greater water supply. Stated differently, during operation the access to potable water will

Feasibility Study for Utilisation of Taung Dam Water 3.12
PWMA 10/C31/00/1408 Regional and National Economy July 2008
also result in the avoidance of job losses due to current water supply not meeting
demands.
During the operation phase the project will lead to the creation of an additional 5 jobs per
annum approximately. Note that a job is defined as one person employed for one year. It
is relevant to note here that the operating expenditure impact is expected to be relatively
small and will most probably be absorbed by the existing management and maintenance
personnel. It is also assumed that most of the operating expenditure will be spent on the
maintenance of the facilities/infrastructure.
Apart from the permanent directly created jobs there will be scope for other
entrepreneurial jobs to be created by the local population. The majority of the indirect and
induced employment will be in the retail and trade sector. For instance, women can
engage in economic activity, household chores, obtain education rather than spend time
and energy collecting water – opportunity benefits of piped water. These are explained in
detail in the following sub-section relating to the economic value of increased domestic
water provision.
Transfer of skills during the operation/maintenance phase will probably take place but on
a far smaller and relatively insignificant level as permanent positions will probably be filled
by existing staff.
3.4.3. Business output/sales and increased standards of living
During operation, it is anticipated that fewer people will be employed than during the
construction, although persons will be permanently employed during operation. These
persons will experience a substantial and lasting increase in their standards of living. In
addition the increased income earned by permanent employees as well as the increased
income earned from the stimulation of income generating activities consequent upon
larger quantities of water supply will result in increased buying powers and hence an
increase in local business sales and standards of living.
During the operation phase the investment in the economy, associated with the
maintenance and operation of the infrastructure only, will generate new business sales to
the approximate value of R2 million per annum of which approximately R1 million is a
direct impact and the remaining is due to indirect and induced effects. Approximately
R240 000 of the total national effect is likely to accrue to the North West Province per
annum. During the operation phase the sectors that will mostly be stimulated by new
business sales include the electricity and water sectors, the household sector, the
manufacturing sector and the financial services sector.

Feasibility Study for Utilisation of Taung Dam Water 3.13
PWMA 10/C31/00/1408 Regional and National Economy July 2008
As such it is evident that over and above the annual investment during the operation
phase, additional revenue is generated due to the multiplier effect in the different sectors
of the economy.
3.4.4. Government income and expenditure
The operation and maintenance of the bulk water infrastructure can be seen as an
economic injection into the area as it would lead to increased government income.
The economic impacts will lead to fiscal impacts, which are changes in government
revenues and expenditures. During the operation phase, the expected permanent jobs per
annum will bring in a constant income to the government in the form of personal tax. In
addition company tax and VAT, other indirect taxes and services will also be a sustained
income for the government during the operation.
The operation and maintenance of the proposed bulk infrastructure can thus be seen as
an economic injection into the area as it would lead to increased government income. The
development could thus lead to the creation of other economic spin-offs that benefit the
entire region. Local benefits could accrue to the government through an increased tax
base increasing the capacity of the local municipality and other social and service support
actions. In other words, the increased income received by the government will enable
increased spending locally for a sustained long-term period.
3.5. Economic value of domestic water supply
The following economic impacts (described hereunder) are anticipated once the bulk
water supply infrastructure is operational and domestic water supply is provided to the
villages south-east of Taung Dam, Bogosing Water Supply area, and the Taung Water
Supply area:
• Stimulation of income generating activities and opening up area for development;
• Freeing up time from fetching water and obstacles for economic development;
• Decrease economic decline related to water shortages;
• Provide essential final good and opening up additional household end-uses;
• Decrease in poor health related economic burdens;
• Opening up opportunity for home gardening; and
• Freeing up water supply for other user sectors.
Feasibility Study for Utilisation of Taung Dam Water 3.14
PWMA 10/C31/00/1408 Regional and National Economy July 2008
3.5.1. Stimulation of income generating activities and opening up area for development
Currently the Taung Dam has spare capacity and the purpose of the project is to best use
the spare capacity of water. Water is a scarce resource and it can be reasoned that water
should be rationed to competing uses according to economic criteria or maximisation of
returns. However water is not a private good but a public or merit good since it is a scarce
natural resource consumed collectively and provision necessitates both government
intervention and finance. The price of water is thus not determined by the market forces of
supply and demand. Since the market mechanism is not functioning in the water market,
the price of water is not known. It is therefore necessary to determine the economic value
of water which will serve as a proxy for the market price of water. The value of water is
important in two distinct, albeit related roles:
• Firstly where the supply of water is insufficient in relation to the demand in certain
short-term circumstances such as severe drought, the value of water serves as a
proxy for a component of the price system in targeting water restrictions so as to
cause least harm; and
• Secondly, the financial resources spent on providing the appropriate level of water
supply in the long-term to consumers and the economic optimal level of development.
Demand from each water using sector must be viewed in relation to the total available
water supply. Sectors compete for available water supplies, but each sector’s continued
existence is partially dependent upon the output of other sectors and hence their need for
water. Sectors are thus economically interdependent and each is dependent upon water
availability. A shortage of water in a particular sector may indirectly restrict output of
several sectors.
It is however generally not economically feasible to develop and operate a water resource
system to meet all the sectoral demands at all times. This means that 100% of the
demand cannot be supplied for 100% of the time and shortfalls in the supply will occur
from time to time. If shortfalls occur frequently the supply will have a low assurance and
relatively few shortfalls represent a high assurance in supply. It is important here to note
that different types of user groups or categories will require a different assurance of
supply. Irrigation will typically be supplied at a lower assurance than water for domestic
and industrial purposes and water for strategic industries such as power generation will be
supplied at even a higher assurance. It is also logical to sub-divide the supply to irrigation
into different assurance levels, as permanent crops such as export grapes would require a
higher assurance than for example a cash crop.
Feasibility Study for Utilisation of Taung Dam Water 3.15
PWMA 10/C31/00/1408 Regional and National Economy July 2008
Since households need 100% assurance of water supply, the water of the Taung Dam
would be utilised to provide in primary domestic water needs only. Households supplied
with water in house need a guaranteed supply and it is thus not sensible to take some of
the water from the Taung Dam for other uses such as irrigation when some households
could suddenly have insufficient water for essential domestic use.
The higher supply of domestic water during operation could result in the stimulation of
economic activities reliant on water such as tourism related development, as well as a
stimulation of irrigation (indirectly due to freeing up water supply in other areas), industrial
and agricultural water users, and other economic activities. This will cause a permanent
economic upliftment in the area.
The Taung Dam is reportedly an attractive dam site and tourism developments are
already in place and underway. As the dam offers tourism and recreational opportunities,
the North West Parks and Tourism Board is in the process of establishing a protected
environment around the Taung Dam. This will mean additional job opportunities for local
people in the tourism sector. It is expected that the development of existing towns within
the area as service centres for tourism will be crucial in ensuring maximized use of
products and services from the area and avoiding leakages. This will ensure that tourism
development in the area is to the maximum benefit of the area.
Access to water could lead to economic spin-offs for the local community, particularly
women. Water is a holistic resources - water supply is not just about drinking water and
domestic use. Effective projects around the world have shown that water supply can also
be linked to income generating activities and local economic upliftment. Water is an
essential input in agriculture, and also in several manufacturing industries. Economic
development opportunities in sectors that are heavily dependent upon water to provide
their services include:
• Laundry and cleaning facilities;
• Sport related clubs and facilities;
• Amusement and recreation services;
• Hotels and lodging places;
• Eating and drinking establishments;
• Car washes;
• Hair dressers and other personal services;
• Butchery;

Feasibility Study for Utilisation of Taung Dam Water 3.16
PWMA 10/C31/00/1408 Regional and National Economy July 2008
• Farming: horticulture and livestock and irrigation; and
• Food and beverages.
3.5.2. Free up time from fetching water and obstacles to economic development
In textbook economics, entrepreneurs use resources to produce goods and services that
they have to sell at a profit in order to survive. The owners of those resources earn an
income by either selling or hiring out their resources or by using them themselves in
production. Without productive resources there can be no economic activity. Some of the
most important resources available to people are land, water, capital (finance) and human
skills. In the study area (and South Africa as a whole) there has been a long history of
proscribed access to these resources. This has affected rural people and rural areas in
many different ways, and lies at the heart of the ‘rural problem’.
Access to potable water remains the most critical and worrying constraint for many rural
people, and many of them spend several hours a day securing supplies. Women (and
children) are mostly affected by having to walk longer distances to collect smaller amounts
of water. The time lost is invaluable to most women and children.
The provision of potable water for domestic use will have profound and far reaching
impacts on the population and will release them for spending several hours a day securing
supplies to being able to search for work, undertake education, etc. All of these will have
profound effects on the regional economy.
Economics is essentially about the way in which tradeoffs, seen from a human welfare
point of view, influence decision-making. Tradeoffs are always made when making
decisions about scarce resources, and the funds that are expended on ensuring access to
potable water represent a scarce resource. Thus in allocating the water to domestic use,
the opportunity to use them for another use is foregone, and the value of this other use is
the opportunity cost of putting them to the first use.
Key aspects to be noted in supply of domestic water are:
• The element of equity: addressing the past inequity between communities in service
access which encompasses the social component of water use;
• The element of sustainability: the environmental need for water (as well as that of
downstream users including neighbouring states); and

Feasibility Study for Utilisation of Taung Dam Water 3.17
PWMA 10/C31/00/1408 Regional and National Economy July 2008
• Economic efficiency, cost recovery, user-payments and private sector involvement:
water is seen as an economic good, to be used in the most efficient setting possible
to promote the overall economic development of the country.
The regional economic effects of potable water provision have most obviously been noted
under the previous system where water ownership was tied to ownership of land, and as a
result the majority of South Africans were “condemned to a life of poverty, insecurity and
contentious exposure to diseases that would otherwise be avoidable. With access to
potable water the obstacles in the development of the following impoverished
communities will be addressed:
• 14 villages south-east of Taung Dam who currently obtain all their water from
rudimentary borehole schemes;
• 6 villages being supplied by the Bogosing Water Supply which is highly inefficient and
turbidity in the water is problematic for the communities; and
• 11 villages in the Taung area currently being supplied by the Pudimoe Water Supply
Scheme with insufficient capacity for future water demand.
Unemployment is high in these villages and many people rely on income from family
members working in the cities. Many communities struggle to find water for domestic use.
Development opportunities in the area have been few, hampered inter alia by a lack of
water. The provision of potable water to these communities will also result in a key
regional economic impact namely the improved spatial distribution of water and the
matching of supply with demand. This project will thus improve the quality of life of the
poor and will enable keeping intact the onslaught in the fight against poverty.
Furthermore, access to domestic water includes water that people use in their homes for
things such as cooking, bathing, drinking and removing household waste and for outdoor
purposes including lawn watering, car-washing and swimming pools. Shortage of water
would mean that households would probably have to eliminate some or all outdoor water
use, which could have implicit and explicit economic costs including losses to the
horticultural and landscaping industry.
3.5.3. Decrease economic decline related to water shortages
The effects of water shortages can be social or economic. Distinctions between the two
are both semantic and analytical in nature – more so analytic in the sense that social
impacts are much harder to measure in quantitative terms. Nevertheless, social effects

Feasibility Study for Utilisation of Taung Dam Water 3.18
PWMA 10/C31/00/1408 Regional and National Economy July 2008
associated with drought, water shortages or limited access to water (as in this case)
usually have close ties to economic impacts. For example, they might include:
• Demographic effects such as changes in population -which impact upon the
economy;
• Disruptions in institutional settings including activity in schools and government;
• Conflicts between water users such as farmers and urban consumers;
• Health related low flow problems (e.g., cross connection contamination, diminished
sewage flows, increased pollutant concentrations);
• Mental and physical stress (e.g., anxiety, depression, domestic violence);
• Loss of aesthetic and property values;
• Reduced recreational opportunities; and
• Decrease in demand for workers due to unmet water needs which could affect
migration patterns in a region.
However, the notion that water supply contributes to economic growth and development is
highly intuitive. It is known that many of the world’s major cities owe their origin to their
location along coasts or rivers where water-borne transportation was facilitated. But, the
relevant question is whether an increment in water availability would generate an
increment in economic activity today, and how much. Water projects have long been
advocated for their claimed contribution to regional economic development. However
investment in water supply does not automatically guarantee economic growth. But this
does not mean that there is never an economic case for investing in water supply. While
water does not automatically generate growth, it may be the case that areas which persist
in lacking an adequate water supply (regardless of whether or not they started out with
adequate water) will not flourish economically. For example, one can expect that people
will eventually leave those areas and migrate to other areas that do have an adequate
water supply. Thus, lack of water could be a sufficient condition for economic decline or,
to put it another way, water may be necessary, but not sufficient for economic growth.
3.5.4. Provide essential final good and opening up additional household end uses
Water is essential for life – human, animal, or plant. In economics, there is a concept, also
called essentialness that formalizes this notion. The concept can be applied either to
something that is an input to production or to something that is directly enjoyed by people

Feasibility Study for Utilisation of Taung Dam Water 3.19
PWMA 10/C31/00/1408 Regional and National Economy July 2008
as a consumption commodity. In the case of an input, if an item has the property that no
production is possible when this input is lacking, the item is said to be an essential input.
In the case of a final good, if it has the property that no amount of any other final good can
compensate for having a zero level of consumption of this commodity, then it is said to be
an essential commodity. Water obviously fits the definition of an essential final good:
human life is not possible without access to water.
In addition to being essential for human life, water contributes in important ways to the
enjoyment of the satisfactions of life. Consequently, there are many other residential end
uses of water besides its use for drinking. Water consumption has grown over time
through the steady accretion of end uses, each representing the discovery of a new way
to employ water for people’s use and enjoyment. When a piped water supply first became
available, the initial household uses were the same ones that had existed when family
members had to fetch water from an external source – drinking, cooking, hand washing,
and limited bathing. As time passed, many other uses were found – tubs for bathing,
water borne sanitary waste disposal, outdoor landscape and garden watering, automatic
clothes washers, swimming pools, automatic dish washers, car washing, garbage
disposal, indoor evaporative cooling, hot-tubs, lawn sprinklers, etc. The result has been a
constantly rising trajectory of per capita household water use.
It is common to talk of the value of water as though it were a single, homogenous
commodity. This is obviously false: water has many dimensions besides just quantity.
These include: (a) location, (b) timing, (c) quality, and (d) variability/uncertainty. To a user,
one litre of water is not necessarily the same as another litre of water if it is available at a
different location, at a different point in time, with a different quality, or with a different
probability of occurrence.
There are numerous ways in which an increment in water might produce benefits, whether
to those who use the water directly or to others. Examples include: the use of water for
agricultural or industrial production, its use for hydropower or for navigation, residential
use, water based recreation, or aquatic habitat.
It is however important to note that it is not the responsibility of the Department of Water
Affairs and Forestry to provide water to individual households. This remains the
responsibility of the relevant local authorities. The project will include reservoirs from
which local authorities will be able to source water for domestic reticulation. Importantly,
the Department should however engage with the relevant stakeholders to ensure the
required plans and programmes are in place. The Department should also support

Feasibility Study for Utilisation of Taung Dam Water 3.20
PWMA 10/C31/00/1408 Regional and National Economy July 2008
municipalities in securing funding for water services infrastructure. This is an important
aspect in terms of successful cooperative governance.
3.5.5. Decrease in poor health related economic burdens
The lack of access to adequate water supply brings the risk of ill-health or even death and
undermines people’s dignity. Ill-health and death have a profound impact on the regional
and national economy.
The access to an assured supply of domestic water could be sufficient to respond to
special needs for the sick, particularly relevant in the light of the HIV/AIDS crisis. The
positive impact which providing a workable amount of clean water will have on the overall
health of the population far outweighs the direct financial costs of providing the water.
However, for water supply to be effective in improving health, interactive/participatory
health and hygiene education is critical.
Women and children are the primary managers of water at household level and have to
bear the burden of increased sickness in the household associated with waterborne
diseases. Women therefore have the most to gain from a successful water project.
Women are also primarily responsible for health and hygiene, so their meaningful
involvement is equally important.
3.5.6. Open-up opportunity for home gardening
The access to water could also enable water for home-grown vegetables and micro
agriculture. Micro agriculture can be described as farming on a small scale incorporating
irrigated community gardens, food plots and homestead based livestock enterprises.
When potable water supply is made available to the aforementioned communities, micro-
agriculture has the potential to substantially alter the water usage patterns in the study
area if implemented on a large scale. The broad concept of micro-agriculture in an urban
or peri-urban area has been referred to as agro-urban development which embraces the
following key components:
• The identification and allocation of an area or areas adjacent to or within an informal
settlement or an area demarcated for informal settlement for the purposes of irrigated
food production or other appropriate forms of agriculture. The selected site should
have soils that are appropriate for irrigated agriculture;
• The supply of affordable water for irrigation;

Feasibility Study for Utilisation of Taung Dam Water 3.21
PWMA 10/C31/00/1408 Regional and National Economy July 2008
• The identification and development of such a site should form part of the basic
skeleton of the informal settlement;
• The development of such an area should be undertaken with maximum involvement
and commitment of the community itself with emphasis on community based self-help
development;
• Food production for home consumption and the sale of surpluses for cash generation;
and
• Production can be by individuals, food garden clubs or co-operatives from community
gardens or individually owned food-plots or even the smaller individual homestead
gardens.
It should, however, be noted that water usually used for irrigation is cheaper than urban
water supply. The reason is the difference in costs. Water used for agriculture does not
need to be treated. Enabling water usage for home gardening would require two separate
supply networks, one for potable water supply via the water purification works. The
second system is the direct supply for garden water via a separate reticulation system. In
other words raw water used for gardening and potable water used for consumption
purposes. This two-tier system would however be too costly and it won’t be feasible to
establish a separate physical infrastructure and capital for the establishment of a separate
raw water supply to households. The result will be that home gardens, will require utilising
more expensive treated domestic water and thus use thereof for other than domestic uses
will result in less assurance for domestic supply.
Opportunities for home gardening are thus limited to the development of home-grown
vegetables for own consumption making use of domestic water supply.
3.5.7. Freeing up water supply for other user sectors
The Taung Dam was initially constructed to augment supply to the Taung Irrigation
Scheme. However, currently there is no infrastructure to convey water from the Taung
Dam to the irrigation area. A need within the study area exists for irrigation water supply.
In the late 1970’s the existing flood irrigation scheme in the Taung area was converted
into a centre pivot scheme. Through the redesign activities, 175 households were
excluded and have been waiting since the 1970’s for restitution. The re-constituted flood
irrigation scheme was designed on the basis of 10 ha per person, thus the expectations of
these 175 individuals are for similar allocations. It is thus considered by the local people
that the Taung Dam will be the source of water for this expansion.

Feasibility Study for Utilisation of Taung Dam Water 3.22
PWMA 10/C31/00/1408 Regional and National Economy July 2008
However the water from the Taung dam has been identified as being best put to use for
domestic needs. However, according to the Existing and Proposed Infrastructure Study
as part of this feasibility study, if water from the Taung Dam is used to supply the
Bogosing area, then Bogosing’s allocation from the Vaalharts Canal Scheme could be
transferred to Vryburg to augment the water demand in this area. Furthermore, if water
from the Taung Dam is used to augment supply to the Taung area, then water from the
Vaalharts Canal Scheme could possibly be freed up to be transferred to Vryburg to
augment the water demand in this area.
In other words, using the water from the Taung Dam to augment water to the Bogosing
area and the Taung area could possibly free up water to be transferred to Vryburg to
augment water demand in that area. The exact water sector beneficiary of this possibility
is however not known.
It is however important to note that, separate from this study, Vaalharts Water is currently
working with the Department of Agriculture to compile a business plan for the upgrading of
the entire Vaalharts Irrigation Scheme’s canal network, including the main canal, side
canals and drainage canals. This business plan should be submitted before the end of
2008 for construction to commence early in 2009. In short, the provision of water for
irrigation, should this be implemented, would have far reaching regional economic effects.
Water security however is a pressing need for the irrigation sector as without it, farming is
uneconomic. In collaboration with farmers and other stakeholders a look at alternative
crops of high value that will increase profitability in the Vaalharts scheme has already
been initiated to empower black farmers and contribute to sustainable jobs in the area.

Feasibility Study for Utilisation of Taung Dam Water 3.23
PWMA 10/C31/00/1408 Regional and National Economy July 2008
BIBLIOGRAPHY
Department: Water Affairs and Forestry, South Africa, 2007. Feasibility Study for Utilisation of Taung Dam Water: Existing and Proposed Infrastructure: prepared by Kwezi V3 Engineers
Department: Water Affairs and Forestry, South Africa, 2007. Feasibility Study for Utilisation of Taung Dam Water: Water demand and use: prepared by WRP Consulting Engineers
Greater Taung Local Municipality, 2006. Reviewed Integrated Development Plan. 2006/2007
Naledi Local Municipality, 2006. Integrated Development Plan Review 2006/2007.
Phokwane Local Municipality, 2006. Integrated Development Plan.
Stats SA, 2001. Census 2001
Stats SA, 2007. Community Survey 2007
Quantec database, 2007.
Urban Dynamics Town and Regional Planners, 2006. Spatial Development Framework of Phokwane Local Municipality.

0.90% 57 356 Year STUDY AREA PHOKWANE LM NALEDI LM LM GREATER TAUNG 183 313 1996 2.80% 264 077 5.20% 31 045 2.80% 53 921 2.35% 179 111 1995 Growth 0.40% 185 948 1999 1.00% 277 262 3.50% 35 391 1.00% 56 772 0.50% 185 099 1998 1.10% 274 277 3.80% 34 082 1.20% 56 117 0.60% 184 078 7 199 1.10% 271 385 4.30% 32 664 1.30% 55 408 0.42% AREA Persons Growth Persons Growth Persons Growth Persons 36 614 3.20% 279 918 0.90% 2000 186 651 0.30% 57 893 0.70% 37 773 2.90% 282 317 0.70% 2001 187 119 0.10% 58 312 0.60% 38 873 2.60% 284 304 0.50% 2002 187 291 0.00% 58 678 0.40% 39 887 2.40% 285 856 0.40% 2003 187 298 - 0.20% 58 941 0.30% 40 833 2.10% 287 072 0.30% 2004 187 000 - 59 114 -