departmentof molecularand usa671.pdf · inclusion of calcium tail currents andasaturable buffer...
TRANSCRIPT

Time course of transmitter release calculated from simulations of acalcium diffusion model
Walter M. Yamada and Robert S. ZuckerDepartment of Molecular and Cell Biology, University of California, Berkeley, California 94720 USA
ABSTRACT A three-dimensional presynaptic calcium diffusion model developed to account for characteristics of transmitter releasewas modified to provide for binding of calcium to a receptor and subsequent triggering of exocytosis. When low affinity (20 FLM) andrapid kinetics were assumed for the calcium receptor triggering exocytosis, and stimulus parameters were selected to match thoseof experiments, the simulations predicted a virtual invariance of the time course of transmitter release to paired stimulation,stimulation with pulses of different amplitude, and stimulation in different calcium solutions. The large temperature sensitivity ofexperimental release time course was explained by a temperature sensitivity of the model's final rate limiting exocytotic process.Inclusion of calcium tail currents and a saturable buffer with finite binding kinetics resulted in high peak calcium transients nearrelease sites, exceeding 100 ,uM. Models with a single class of calcium binding site to the secretory trigger molecule failed toproduce sufficient synaptic facilitation under this condition. When at least one calcium ion binds to a different site having higheraffinity and slow kinetics, facilitation again reaches levels similar to those seen experimentally. It is possible that the neurosecretorytrigger molecule reacts with calcium at more than one class of binding site.
INTRODUCTION
One of the most striking characteristics of some chemi-cal synapses is the speed of transmitter release. Thebrevity of the synaptic delay forces the conclusion thatrelease originates from the immediate neighborhood ofcalcium channel mouths, at a time when internal calciumconcentrations are locally quite high (Simon and Llinas,1985). The short duration of the phasic release periodalso argues for some process to rapidly terminate re-lease. Measurements of intracellular calcium (Charltonet al., 1982) suggest that it remains high for seconds afterpresynaptic action potentials, so this appears not to limitthe duration of release. And the release process itselfcan easily be prolonged by prolonging the presynapticdepolarization (Llinas et al., 1981), so release is some-how self limiting. All these results are consistent withthe idea that presynaptic potential directly limits thetime course of release (Parnas et al., 1986).An alternative possibility is that transmitter release is
triggered by the sharp rise and fall of presynapticcalcium in the immediate neighborhood of open calciumchannels (Chad and Eckert, 1984; Fogelson and Zucker,1985; Simon and Llinas, 1985). This "calcium spike" atrelease sites would not be detected by fluorimetric or
spectrophotometric measures of the average calcium inpresynaptic terminals, because as calcium ions rapidlydiffuse away from channel mouths after they close, theions remain in cytoplasm and are still detected until theyare eventually taken up into organelles or extruded byactive transport pumps. Simulations of calcium diffusion
from clusters of calcium channels in presynaptic activezones indicate that the "calcium domains," or clouds ofcalcium ions surrounding open calcium channels, dissi-pate within milliseconds after channel closure. Transmit-ter release depends on up to the fourth or fifth power ofcalcium concentration, whether measured as externalcalcium, calcium influx in voltage clamp, or changes inintracellular calcium concentration (Dodge and Rahami-moff, 1967; Augustine and Charlton, 1986; Zucker et al.,1991). Such a highly cooperative calcium-dependentprocess would terminate more rapidly than the drop incalcium concentration. In fact, theoretical simulationsindicate that the calcium concentration in active zones("active calcium") raised to the fourth or fifth powerlasts for less time than phasic transmitter release,suggesting that some step in exocytosis subsequent tothe calcium trigger limits the time course of release(Fogelson and Zucker, 1985).Recent results indicate that the time course of phasic
transmitter release is practically invariant under a num-ber of changing conditions. It varies little during pairs ofaction potentials that elicit facilitated release, or whenthe amplitude of the presynaptic depolarization is al-tered, or when the external calcium concentration isvaried (Datyner and Gage, 1980; van der Kloot, 1988;Parnas et al., 1989). Only changes in temperature have amarked effect on the synaptic delay and the duration ofrelease (Katz and Miledi, 1965; van der Kloot, 1988;Parnas et al., 1989), pointing again to some process
Biophys. J. G Biophysical SocietyVolume 61 March 1992 671-682
0006-3495/92/03/671/12 $2.000006-3495/92/03/671/12 $2.00 671

other than diffusional collapse of calcium domains indetermining the time course of phasic release.
Early simulations (Fogelson and Zucker, 1985) didnot consider the effect of steps subsequent to calciuminflux and diffusion on the time course of neurosecre-
tion, and included no temperature-sensitive processes.Recent simulations (Parnas et al., 1989) reformulatedthe "calcium hypothesis of transmitter release" by explic-itly adding steps of calcium in active zones binding to a
calcium-sensing receptor, with several of these combin-ing to activate exocytosis. These simulations showed thatchanges in pulse amplitude and calcium concentration,and whether the pulse was the first or second of a pair,caused changes in the predicted time course of release.That such changes were not noted experimentally was
taken as proof that some process independent of cal-cium must govern the duration of release, and that thisprocess is not simply calcium binding or exocytosisacting as a rate-limiting step.Because these results were presented as irreconcil-
able with the "calcium hypothesis of transmitter release,"it seemed important to explore further the properties ofthese simulations, to determine whether the mismatchbetween theory and results is due to a defect in theformulation or application of the theory, or whether itreally must be concluded that some other voltage-dependent process independently governs the timecourse of transmitter release.
METHODSWe have duplicated as closely as possible the Parnas et al. (1989)implementation of the Fogelson and Zucker (1985) and Zucker and
Fogelson (1986) presynaptic simulation model. The original modelsolved the diffusion equation (Fick's Law) in rectilinear coordinateswith boundary conditions appropriate to the presynaptic terminal ofthe giant synapse in the squid stellate ganglion. Calcium influx occursthrough arrays of calcium channels in the synaptic face of the terminal.The number of channels opened by a given depolarizing pulse was
determined from the ratio of total presynaptic calcium current tosingle channel currents measured in related molluscan preparations.These channels were distributed in a regular array in active zones
disposed in a square pattern in the synaptic face. These considerationslead to 64 channels opening per active zone for pulses to 0 mV, andfour channels for pulses to -25 mV (Zucker and Fogelson, 1986). Thedimensions of active zones (800 x 800 nm2) and the spacing betweenthem was based on ultrastructural measurements (Fogelson andZucker, 1985). Transmitter release was considered to be triggered bycalcium acting at the membrane surface at a distance of 56 nm from an
open channel mouth, at a putative vesicle release site near the centerof the active zone (see Fig. 1). In our initial simulations, pulse-evokedinflux was taken to last 1 ms, about the open lifetime of a singlechannel at resting potential following a brief pulse, and tail current atthe end of the pulse was ignored (as in Parnas et al., 1989). Calciumdiffused from the array of channel mouths at a rate of 0.6 pm2 ms-1 foraqueous solution, which was subsequently damped by rapid binding toan immobile buffer. A binding ratio (of bound to free calcium) of 500was assumed, asin Parnas et al. (1989), although we regard this figureas a bit higher than what is justified by experimental measurements(see Fogelson and Zucker, 1985). Calcium was extruded at the frontand rear terminal surfaces by a pump at the rate of 80 nm ms-'.We used the numerical approximation to the diffusion equation and
its boundary conditions represented by Eqs. 1-4 and 5-8 in Parnas etal. (1989), rather than the analytical solution developed by Fogelsonand Zucker (1985). The numerical approach is more flexible inallowing the incorporation of kinetics and saturation in processes suchas calcium buffering and extrusion. The numerical solution requiresthat the nerve terminal be divided into a large number of cells or
compartments. Sufficient resolution is provided by making the celllength equal to 115 the 100-nm separation between calcium channelmouths (at 0 mV), or 20 nm. Then, calcium concentration will berepresented as an array of 2.2 x 10¹¹ cells in a terminal of 50-pmdiameter and 700-p.m long. Cell 10, 0} was centered on the origin.
67 Bip_ ia Jora Voum 61 Mac 1992
a IIII
*: :*6I..________~19 ____ ____* I . .
II
b I~~~~~~~~~~~~~I
I
.0 I 0.
I
CII
* *.*1.*.*. . . I . . .* * .* * * |1*4-** * t * *
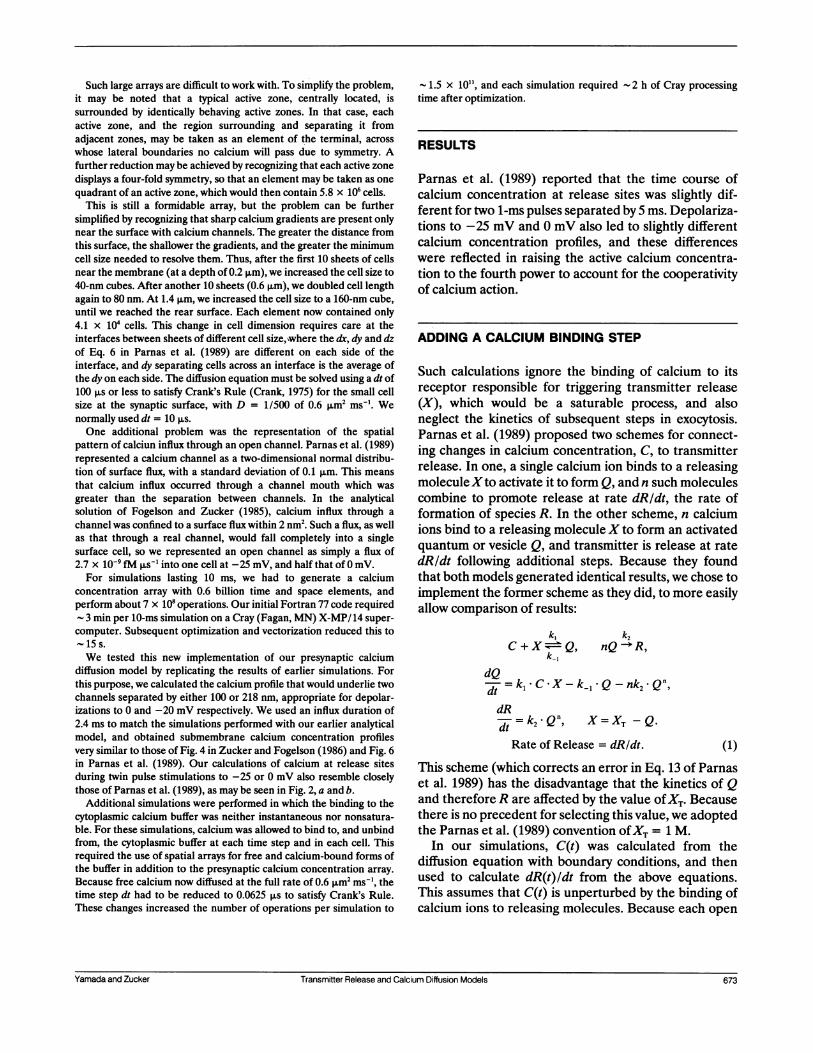
. Ca channel I* Release site l 400 nm
II
FIGURE 1 Disposition of open calcium channels (small dots) and exemplary transmitter release sites (filled circles) in an active zone at three pulsepotentials: 64 channels at 0 mV in a, four channels at -25 mV in b, and 49 channels at -7.5 mV in c. The typical release site is centrally located, 56nm from a calcium channel. The dotted lines showx and z axes, and the four-fold symmetry of an active zone.
672 Biophysical Journal Volume 61 March 1992
Such large arrays are difficult to work with. To simplify the problem,it may be noted that a typical active zone, centrally located, issurrounded by identically behaving active zones. In that case, eachactive zone, and the region surrounding and separating it fromadjacent zones, may be taken as an element of the terminal, across
whose lateral boundaries no calcium will pass due to symmetry. Afurther reduction may be achieved by recognizing that each active zonedisplays a four-fold symmetry, so that an element may be taken as one
quadrant of an active zone, which would then contain 5.8 x 10⁶ cells.This is still a formidable array, but the problem can be further
simplified by recognizing that sharp calcium gradients are present onlynear the surface with calcium channels. The greater the distance fromthis surface, the shallower the gradients, and the greater the minimumcell size needed to resolve them. Thus, after the first 10 sheets of cellsnear the membrane (at a depth of 0.2 p.m), we increased the cell size to40-nm cubes. After another 10 sheets (0.6 Rm), we doubled cell lengthagain to 80 nm. At 1.4 p.m, we increased the cell size to a 160-nm cube,until we reached the rear surface. Each element now contained only4.1 x 104 cells. This change in cell dimension requires care at theinterfaces between sheets of different cell size,\where the dx, dy and dzof Eq. 6 in Parnas et al. (1989) are different on each side of theinterface, and dy separating cells across an interface is the average ofthe dy on each side. The diffusion equation must be solved using a dt of100 Rs or less to satisfy Crank's Rule (Crank, 1975) for the small cellsize at the synaptic surface, with D = 1/500 of 0.6 p.m2 ms-'. Wenormally used dt = 10 pRs.One additional problem was the representation of the spatial
pattern of calciun influx through an open channel. Pamas et al. (1989)represented a calcium channel as a two-dimensional normal distribu-tion of surface flux, with a standard deviation of 0.1 pm. This means
that calcium influx occurred through a channel mouth which was
greater than the separation between channels. In the analyticalsolution of Fogelson and Zucker (1985), calcium influx through a
channel was confined to a surface flux within 2 nm2. Such a flux, as wellas that through a real channel, would fall completely into a singlesurface cell, so we represented an open channel as simply a flux of2.7 x 10- fM .s-' into one cell at -25 mV, and half that of 0 mV.For simulations lasting 10 ms, we had to generate a calcium
concentration array with 0.6 billion time and space elements, andperform about 7 x 10⁸ operations. Our initial Fortran 77 code required
3 min per 10-ms simulation on a Cray (Fagan, MN) X-MP/14 super-
computer. Subsequent optimization and vectorization reduced this to15 s.
We tested this new implementation of our presynaptic calciumdiffusion model by replicating the results of earlier simulations. Forthis purpose, we calculated the calcium profile that would underlie twochannels separated by either 100 or 218 nm, appropriate for depolar-izations to 0 and -20 mV respectively. We used an influx duration of2.4 ms to match the simulations performed with our earlier analyticalmodel, and obtained submembrane calcium concentration profilesvery similar to those of Fig. 4 in Zucker and Fogelson (1986) and Fig. 6in Parnas et al. (1989). Our calculations of calcium at release sitesduring twin pulse stimulations to -25 or 0 mV also resemble closelythose of Parnas et al. (1989), as may be seen in Fig. 2, a and b.
Additional simulations were performed in which the binding to thecytoplasmic calcium buffer was neither instantaneous nor nonsatura-ble. For these simulations, calcium was allowed to bind to, and unbindfrom, the cytoplasmic buffer at each time step and in each cell. Thisrequired the use of spatial arrays for free and calcium-bound forms ofthe buffer in addition to the presynaptic calcium concentration array.
Because free calcium now diffused at the full rate of 0.6 pm2 ms-1, thetime step dt had to be reduced to 0.0625 ps to satisfy Crank's Rule.These changes increased the number of operations per simulation to
- 1.5 x 10¹¹, and each simulation required - 2 h of Cray processingtime after optimization.
RESULTS
Parnas et al. (1989) reported that the time course ofcalcium concentration at release sites was slightly dif-ferent for two 1-ms pulses separated by 5 ms. Depolariza-tions to -25 mV and 0 mV also led to slightly differentcalcium concentration profiles, and these differenceswere reflected in raising the active calcium concentra-tion to the fourth power to account for the cooperativityof calcium action.
ADDING A CALCIUM BINDING STEP
Such calculations ignore the binding of calcium to itsreceptor responsible for triggering transmitter release(X), which would be a saturable process, and alsoneglect the kinetics of subsequent steps in exocytosis.Parnas et al. (1989) proposed two schemes for connect-ing changes in calcium concentration, C, to transmitterrelease. In one, a single calcium ion binds to a releasingmoleculeXto activate it to form Q, and n such moleculescombine to promote release at rate dRldt, the rate offormation of species R. In the other scheme, n calciumions bind to a releasing moleculeX to form an activatedquantum or vesicle Q, and transmitter is release at ratedR/dt following additional steps. Because they foundthat both models generated identical results, we chose toimplement the former scheme as they did, to more easilyallow comparison of results:
k, k2C+X'Q, nQ R,
dQdt C X-k- Q - nk2. Qnf
dRdt =k2*Q,n X=XT -Q.
Rate of Release = dR/dt. (1)This scheme (which corrects an error in Eq. 13 of Parnaset al. 1989) has the disadvantage that the kinetics of Qand therefore R are affected by the value ofXT. Becausethere is no precedent for selecting this value, we adoptedthe Parnas et al. (1989) convention ofXT = 1 M.
In our simulations, C(t) was calculated from thediffusion equation with boundary conditions, and thenused to calculate dR(t)/dt from the above equations.This assumes that C(t) is unperturbed by the binding ofcalcium ions to releasing molecules. Because each open
Yamada and Zucker Transmitter Release and Calcium Diffusion Models 673Transmifter Release and Calcium Diffusion ModelsYamada and Zucker 673

SMALL PULSESSLOW UNBINDING
1.6a1.4
12
I 8~~~~~%
I 0~~~~~~~~.2.
.i (0Tirn em;s) S 0 zo
SMALL PULSESFAST UNBINDING
LARGE PULSESSLOW UNBINDING
14.0
12.0
j10.011" 8.0
I6.0460
,u 4.0
2.0
0.0'
LARGE PULSESFAST UNBINDING
b ~~~~~~~~14.0b3.0 12.0 " 3.0S
O~10.02.0w 02.0k
-. ~~~~6.0 '
a -- ~~~~~~ 4~.0
a~~~~~~~laoo- t
3'2040 C 6. 1o8.0 0.0 ' b0.0 0 ~ .0 20 4. .0 108m (in) z Time (ins) z
SMALL PULSESFAST UNBINDING
10o- First Pulse
---- Secod Pulse
Lo.
T0.6E
la= 02
00 1.0 2.0 5 4.0 5.bTime (ins)
@1.010a
a0.a
b!o.ff.20.4
= 0.2
10.0
LARGE PULSESSLOW UNBINDING
First Pulsed I - Second Pulse
I
I
,'I
1.0 2.'0 .'0* 4.'0 5.'0Time (mu)
FAST UNBINDING- Small Pulses- Medium Pulses---- Large Pulses
2.0 4.0 6.0 6.0 10.0Time (ms)
FAST UNBINDING
SLOW UNBINDINGo1@0
02
t0.8
.;E0.6c
2e0.4
= 0.2
aoo
FAST UNBINDING
Normal [Ca5i.II - - High [Ca'].
Low [Cai1,1
3 1--.0 ''2.'0 3.0 4.o0 5.Time (ins)
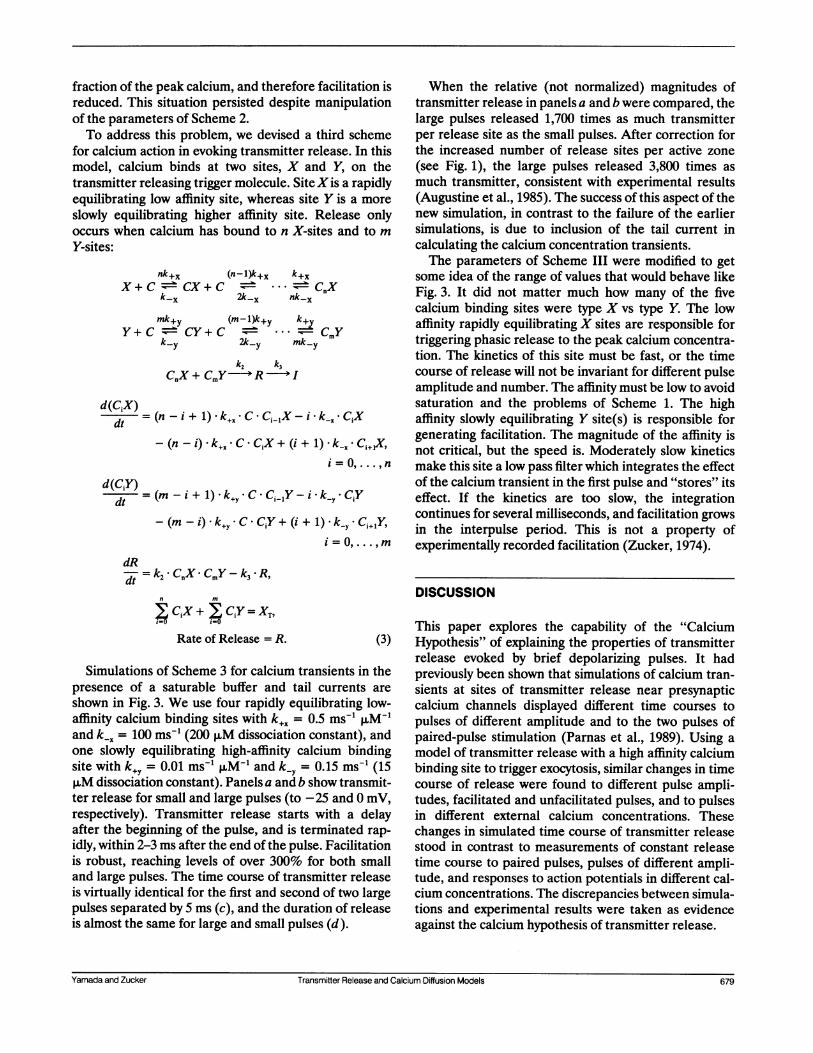
FIGURE 2 Simulations of the time courses of calcium concentration at a release site (solid lines in a, b) and of transmitter release (all remainingtraces) to various patterns of stimulation. In all panels, the left-hand graph used a high affinity slow unbinding of calcium from its receptor (Scheme1 with k-1 = 0.4 ms-') and the right-hand graph shows low affinity fast unbinding with rate-limiting exocytosis (Scheme 2 with k-l = 10 ms-').(a) "active calcium" and transmitter release to paired small (-25 mV) pulses lasting 1 ms and separated by 5 ms. (b) responses to large (O mV)pulses. (c) comparison of transmitter release to the first and second pulses to 0 mV. (d) release evoked by the first and second pulses to -25 mV;the right panel includes release to a late second pulse that follows the first by 15 ms (lowest dotted line). (e) comparison of responses to the -25 mVand 0 mV pulses; the right panel includes a response to -7.5 mV medium pulses (uppermost dotted line). The horizontal lines indicate half-widths.(f) responses in normal [Ca2"] and five times normal [Ca2"] in the medium; the right panel includes release in a half-normal [Ca2"] medium.(g) transmitter release to large pulses at normal and low temperature, using Scheme 2 with low affinity fast unbinding of calcium from its receptor.
674 Biophysical Journal Volume 61 March 1992
5.0'
4.0'
1.0
.00.
SMALL PULSESSLOW UNBINDING
LARGE PULSESFAST UNBINDING
SLOW UNBINDING
,2.0 -
1.0o
2 .o
674 Biophysical Journal Volume 61 March 1992

calcium channel admits 1,600 ions during its 1 msopen time (twice as many at -25 mV), and each vesiclebinds only four ions, and only a few vesicles could beinfluenced by calcium entering any one channel, thisassumption seems justified. Experimentally, dR/dt maybe compared to histograms of quantal release timesfollowing presynaptic action potentials.
Simulations of the behavior of dRldt continued toshow differences between release activated by each ofthe paired pulses, and between pulses to differentvoltage levels. We have repeated these simulations usingthe same parameter values as Parnas et al. (1989): k, =0.5 ms1 P,M-', k_l = 0.4 ms-1, and k2 = 1 ms1'M'-1. Ourresults are shown in the left-hand column of Fig. 2, andthey resemble those reported previously (cf Fig. 13 ofParnas et al., 1989). Slight differences appear in the caseof small pulses, probably because we chose a differentposition for the location of the transmitter release sitenear an open channel, and also reflecting our correctionin the equations for the release scheme.The following properties are evident from the left-
hand graphs in Fig. 2: (1) Transmitter release is similarin time course to that of calcium at release sites (a andb), despite the cooperativity of calcium action. (2) Forsmall pulses, release has nearly terminated by 2 ms afterthe peak, but for large pulses, release has dropped toonly about half its peak even 4 ms later (e). This does notmatch experimental results obtained at crayfish neuro-muscular junctions, where the half-width of release isonly 1 ms at 19°C (Parnas et al., 1989). (3) Release tothe second pulse rises somewhat earlier and decayssomewhat slower (c and d), especially to large pulses.Experimentally, release time course is similar for twopulses. (4) Release to the second pulse was only slightlyfacilitated (a and b: 20% for small pulses, 40% for largeones resembling action potentials), whereas spike-evoked release is actually facilitated by 400% at 5-ms
intervals (Zucker, 1974). (5) Release rises slightly faster,and decays substantially more gradually for large pulsesthan small pulses (e), also contradicting the experimen-tally observed similar time courses of release. (6) Fi-nally, high external calcium, represented by scaling upthe influx 5 x and therefore multiplying the accumula-tion of intracellular calcium 5 x, evokes release whichrises sooner and lasts much longer (f ), again contradict-ing experimental observation.
A RATE-LIMITING EXOCYTOTIC STEP
These results were surprising for a scheme in whichsteps subsequent to calcium entry and diffusion weresupposed to be rate limiting. However, the time courseof transmitter release in Scheme 1 is actually deter-
mined entirely by the time course of calcium at releasesites and the calcium binding rates, k, and k. The rateof transmitter release, dRldt, is merely proportional tothe number of activated calcium complexes, Q, raised tothe power n; k2 has no effect on the time course ofrelease. For exocytosis to be a rate limiting step, asParnas et al. (1989) said they intended, it is necessary toeither make the conversion between nQ and R revers-ible, or allow R to be terminated by inactivation (orperhaps depletion) to a nonreleasable state I. We havechosen the latter approach, and modify the reactionscheme as follows:
C + X Q,k2 k3
nQ -R -- I
dQdt.ClcX -k .Q -nk2 Qfl
dR_t =k2 Qn-k3R, X=XT -Q.
Rate of Release = R. (2)In this formulation, calcium (C) binds to release sites(X) to form activated sites (Q); n of these combine toform a release promoter (R) which inactivates at rate k3to state I. The rate of transmitter release is proportionalto the level of R. The rate constant of the step terminat-ing exocytosis, k3, was chosen to be 10/ms to provide a
time course of transmitter release similar to that ob-served experimentally.With an instantaneous, nonsaturable cytoplasmic cal-
cium buffer, calcium concentration at release sites is 2
jxM for much of the phasic release period, whereas theaffinity of the calcium receptor is only 800 nM for thevalues chosen by Parnas et al. (1989). This means thatthese receptors would be nearly fully occupied withcalcium during action potentials or depolarizing pulses,so that transmitter release would be almost fully satu-rated. Under these conditions, the time course ofchanges in Q, and hence of dR/dt in Scheme 1, is similarto the time course of the calcium transient. This makesthe simulated time course of transmitter release sensi-tive to pulse number, pulse amplitude, and externalcalcium level.
This postulated saturation of calcium binding sites isnot consistent with the very high sensitivity of transmit-ter release to external calcium concentration (Dudel,1981), or to the large amounts of facilitation (up to100-fold) attainable with tetanic stimulation (Zucker,1974). These characteristics of transmission, at least atthe crayfish neuromuscular junction, indicate that trans-mitter release to one or two pulses at normal calciumlevels is far from saturated. To better agree with theseproperties of transmitter release, we have selected a
value of 10 ms-' for k-1. This reduces the affinity of the
Yamada and Zucker Transmitter Release and Calcium Diffusion ModelsYamada and Zucker Transmitter Release and Calcium Diffusion Models 675

calcium binding site to 20 ,uM, and speeds the timeconstant of the binding reaction (at 2 ,uM calcium) from1.4 ms to 48 ps, so that excytosis is truly rate limiting.Recent results of Adler et al. (1991) confirm that thecalcium receptor for exocytosis has low affinity.The right-hand graphs of Fig. 2 show our results when
the off rate for calcium binding was increased to 10 ms-'.These simulations using Scheme 2 show the followingdifferences from those obtained with slow unbinding ofcalcium from its receptor and Scheme 1: (1) Transmitterrelease is now triggered by the very rapid changes in Qfand is substantially faster than the calcium transient (aand b), but it now really is rate-limited primarily by thefinal exocytotic step, rather than by the formation anddissipation of calcium-activated release sites. (2) Inparticular, release is almost complete after 4 ms, even
for large pulses. (3) The differences in release timecourse between first and second pulses are much re-
duced (c and d), and for small pulses would be undetect-able experimentally. (4) Release to the second pulse ismuch more facilitated (a and b); in particular, release tolarge spike-like depolarizations resembles levels ob-served experimentally. (5) The difference in release timecourse between small and large pulses (e) is also greatlyreduced, but not eliminated. (6) Finally, the differencesin release time course at calcium levels differing byfive-fold (f) are reduced to the point that they are
unlikely to be detectable experimentally in release timehistograms (Datyner and Gage, 1980).We found that the differences in rise time in Scheme 1
(c and d) were eliminated when the release promoter Rwas made to inactivate, allowing exocytosis to become a
rate-limiting step. Decreasing the affinity of the calciumbinding site by speeding the off-rate was responsible fordesaturating this site, speeding the time course ofrelease (a and b), and reducing differences in releasetime course between facilitated and unfacilitated release(c and d), between large and small pulses (e), and atdifferent levels of external calcium (f ).
ADJUSTING SIMULATIONS TO MATCHEXPERIMENTS
It is important to recognize that some differences inrelease time course still persist in these simulations. Forexample, Fig. 2 e compares release time course to pulsesto 0 and -25 mV. The simulations show a 50% increasein release duration for the first pulse, and nearly adoubling for the second pulse (compare small and largepulse traces for Scheme 2 in Fig. 2 e). But for thesepulses, the total calcium influx differs by over 10-fold,and transmitter release differs by three orders of magni-tude when extrapolated from experimental results (Au-
gustine et al., 1985). The large and small depolarizingpulses used in the experiments of Parnas et al. (1989)differed by only 20% of the larger pulse, and the largepulses released only twice as much transmitter as smallpulses.
For simulations to match the conditions of the experi-ment, we used an array of calcium channels and typicalrelease site shown in Fig. 1 c. This corresponds to a
pulse to -7.5 mV, which admits 80% as much calcium as
a pulse of 0 mV. This released about half as muchtransmitter in experiments on the squid giant synapse
(Augustine et al., 1985), and so is comparable to thesmall pulses of Parnas et al., 1989). Fig. 2 e includes a
prediction of the time course of transmitter release forsuch a medium pulse, which releases 50% as much trans-mitter as the large pulse in the figure. The time course isvirtually indistinguishable from that evoked by the largerpulses, in agreement with experimental results.The simulations also show a 28% increase in release
duration to the second of two large pulses (compare firstand second pulses of Scheme 2 in Fig. 2 d), which one
might expect to be detectable. However, pulses in thesesimulations were separated by only 5 ms, whereas theexperimental results to which they were compared were
for pairs of pulses separated by 15 ms (Parnas et al.,1989). When we performed simulations using largepulses separated by 15 ms (Fig. 2 d, Scheme 2, "LateSecond Pulse") to match the experimental conditions,release time course was more similar to that of the firstpulse, again in agreement with experimental results ofParnas et al. (1989) and Datyner and Gage (1980). Nowrelease to the second pulse was facilitated about two-fold, also in agreement with experimental observation(Zucker, 1974; Parnas et al., 1989).
It is remarkable that in experiments in which a train offive pulses separated by 10 ms followed a first pulse by 20ms, the duration of release to the last pulse in the trainwas almost doubled (Fig. 3 of Parnas et al., 1989).Apparently, conditioning stimulation is in fact capableof prolonging transmitter release to a pulse, much as
predicted in the simulation of Fig. 2 b to large pairedpulses separated by a very brief interval.
Fig. 2f shows that increasing the calcium unbindingrate nearly eliminated the differences in rise time seen
when calcium concentration, and therefore influx throughcalcium channels, is raised five-fold. The falling phase ofrelease was slowed sufficiently in high calcium mediumthat this effect might be detectable (compare "Normal[Ca2le'" with "High [Ca2lIe" traces). However, experi-mental measurements of the time course of transmitterrelease are available for only a two-fold reduction incalcium concentration (Datyner and Gage, 1980, Fig. 8).Simulations of this condition (Fig. 2 g, Scheme 2, "Low[Ca2+Ie") predict no distinguishable change in time
676 Biophysical Journal Volume 61 March 1992676 Biophysical Journal Volume 61 March 1992

course of release for a halving of external calcium con-
centration. It is not surprising that no data exist for thetime course of release for a five-fold change in calciumlevel: Increasing external calcium this much has littleeffect on transmitter release (Dodge and Rahamimoff,1967), due to saturation of influx through calciumchannels (Hagiwara and Byerly, 1981); decreasing exter-nal calcium to one-fifth would entail measuring releasethat is reduced to 0.15% of normal, where an accurate
estimate of release time course would be difficult toobtain.Another property of the time course of transmitter
release is that it is very sensitive to temperature (Katzand Miledi, 1965; Parnas et al., 1989). Scheme 2 easilyaccounts for this sensitivity by assigning the temperaturesensitivity of duration of release to rate constants k2 andk3, the rates of the final exocytotic steps. We have foundthat reducing these from 10 ms-1 to 1 ms-1 doubles thehalfwidth of the release time course (Fig. 2 g). Increasesin the minimum synaptic delay at low temperature mayalso arise from delays in one or more steps separatingcalcium binding from transmitter release. Cooling alsoincreased somewhat the magnitude of facilitation. Suchan effect has been observed experimentally (compareZucker, 1973 to Zucker, 1974).
Fig. 2 e indicates that the magnitude of facilitationexperienced by the second pulse depends on the ampli-tude of the pulses, with moderate pulses displaying themost facilitation. Such behavior has been observedexperimentally (Dudel, 1986, 1989), and was previouslyattributed to effects of resting calcium levels and satura-tion of transmitter release. However, in our simulationswith Scheme 2, this behavior is mirrored in the calciumtransients triggering release (data not illustrated). Itarises from the fact that as the membrane is depolarized,the single-channel current is reduced, but more openchannels contribute faster calcium transients as theyopen nearer to a typical release site. The first factorreduces the calcium gradient near release sites, but thesecond factor sharpens the gradient at very large volt-ages. This leads to the shallowest [Ca21J profiles nearchannel mouths occurring at moderately large pulseamplitudes, which then collapse at the slowest rate. Thisresults in the largest fraction of peak calcium remainingas residual calcium at the time of the second pulse, andhence moderately large pulses show the largest degreeof facilitation.
SATURABLE CYTOPLASMIC BUFFER ANDCALCIUM TAIL CURRENT
Our simulations up to this point suffer from a number oflimitations. Perhaps the most serious is that they ignore
the characteristics of a real cytoplasmic calcium buffer.Such a buffer must have finite binding and unbindingrates, just as the calcium binding site for transmitterrelease. One might expect this buffer to be temporarilysaturated in the vicinity of calcium channel mouths.Also, its rate of calcium binding might not be fastenough to compete with calcium binding to the releasesites, and might not be able to keep up with the rapidcalcium transients at channel mouths. Then peak cal-cium concentration during depolarizing pulses wouldreach much higher levels than in the simulations ofFig. 2.Our calculations of calcium transients were modified
to account for the action of such a saturable cytoplasmicbuffer. We used 2 mM of a buffer with a binding rate of0.5 ms1 p,M-1, similar to that of the T-sites of calcium-binding protein in muscle (Robertson et al., 1981). Theunbinding rate was set to 25 ms-1, to yield a dissociationconstant of 50 p,M. This is similar to the affinity of themain calcium binding component of squid axoplasm(Alema et al., 1973), and gives a buffer capacity similarto that measured in molluscan neurons (Smith andZucker, 1980).Our simulations thus far treat only the time course of
normalized transmitter release. When the relative mag-nitudes of release to pulses of different sizes are consid-ered, another failing of the model immediately becomesevident. In simulations with Scheme 2 and with thecalcium transients calculated thus far, the large pulsesevoked transmitter release per release site at a maxi-mum rate of only two times that of small pulses, or fivetimes after correction for the increase in number ofrelease sites per active zone in large pulses (see Fig. 1).Experimentally, pulses to 0 mV release over one thou-sand times as much transmitter as pulses to -25 mV(extrapolated from Augustine et al., 1985). We believethis defect is due largely to ignoring the effects of thecalcium tail currents. Most of the calcium influx actuallyenters as a tail current following action potentials orbrief depolarizing pulses (Llinas et al., 1981, 1982).After an action potential or depolarizing pulse, themembrane potential returns to -75 mV. At thispotential, the single channel flux should increase to
4.6 x 10- fM pus' (extrapolated from Zucker and
Fogelson, 1986). In the following simulations, we repre-
sent calcium tail currents as a flux of this magnitudelasting 0.4 ms and following the 1-ms flux of calciumthrough channels open during the depolarization.
Fig. 3, a and b, shows the calcium transients at puta-tive release sites near calcium channels during pulses to-25 mV and 0 mV. The peak calcium concentration toone pulse reaches 16 and 115 ,M, respectively. Theseare much higher levels than those achieved when bufferkinetics and tail currents are ignored (Fig. 2, a and b).
Yaad an Zuke Trnmte Relas an Cacu Difso Moel 677....Yamada and Zucker Transmitter Release and Calcium Diffusion Models 677

SMALL PULSES
I
a)
(0
E
U)aa)4-a
-,
E0CVL-
I-
a)N
Eoz
LARGE PULSES
a)II
0
L.
Ec
a)
a).-'
E0z
LARGE PULSES1.0
Coa)
0
0.4
Z0
NO20
z0.0".
FIGURE 3 Simulations of calcium transients and transmitter release using Scheme 3. The pulses now evoke a tail current, and the cytoplasmcontains a saturable calcium buffer with finite binding kinetics. (a and b) the solid lines show calcium concentration at release sites for small (-25mV) and large (O mV) paired pulses. The dashed lines show transmitter release when calcium binds to two different classes of sites on theexocytotic trigger molecule. (c) responses to the first and second large (O mV) pulses separated by 5 ms. (d) transmitter release to small and largepulses. The horizontal lines indicate half widths.
For small pulses, most of the additional calcium is due tothe incomplete binding of calcium to the cytoplasmicbuffer near calcium channels while the channels remainopen. For large pulses, the tail current at the end of thepulse is chiefly responsible for the high levels of calciumreached, and for the much bigger difference betweensmall and large pulses than the simulations of Fig. 2, aandb.
TWO CALCIUM BINDING SITES
We next attempted to use Scheme 2 to predict the timecourse of transmitter release from the calcium transients
of Fig. 3, a and b. To accommodate the high calciumlevels without saturating the calcium binding sites of therelease mechanism, its affinitywas reduced to 200 p,M byincreasing k-1 to 100 ms-1. Transmitter release termi-nated rapidly, and its time course was relatively indepen-dent of pulse number or amplitude. However, facilita-tion exhibited by the second pulse was reduced to only150%, significantly less than that observed experimen-tally (Zucker, 1974). This result is a consequence of thegreatly increased peak calcium concentration when a
saturable buffer and tail currents are included, whereasthe residual calcium, even that bound to release sites, islittle affected by buffer kinetics or tail currents. Thisleads to a reduced residual calcium expressed as a
678 Biophysical Journal Volume 61 March 1992
1I
-V
LJ-
678 Biophysical Journal Volume 61 March 1992
fraction of the peak calcium, and therefore facilitation isreduced. This situation persisted despite manipulationof the parameters of Scheme 2.To address this problem, we devised a third scheme
for calcium action in evoking transmitter release. In thismodel, calcium binds at two sites, X and Y, on thetransmitter releasing trigger molecule. Site Xis a rapidlyequilibrating low affinity site, whereas site Y is a moreslowly equilibrating higher affinity site. Release onlyoccurs when calcium has bound to n X-sites and to mY-sites:
nk+x (n-1)k+x k+xX+C = CX+C = *@ =' CnX
k-x 2k-x nk-x
mk+y (m-l)k+y kY+C= CY+C = CY
k-Y 2k_ mk-,m
k2 k3CnX+ CmY ) R I
d(C.X)dt = (n-i + 1). k+ C QCX - i k- CX
- (n - i)-k+x C CX+ (i + 1) kx C,+1X,
d(CY)
- (m - i) -k+Y CCiY+ (i + l) k-Y Ci+,lY
dR= k2 - CnX CmY - k3 R,
n m
CiX + Y, C.Y = XT,i-O
Rate of Release = R. (3)
Simulations of Scheme 3 for calcium transients in thepresence of a saturable buffer and tail currents areshown in Fig. 3. We use four rapidly equilibrating low-affinity calcium binding sites with k+x = 0.5 ms-1 pM-1and k_x = 100 ms' (200 p,M dissociation constant), andone slowly equilibrating high-affinity calcium bindingsite with k+y = 0.01 ms1'uM-' and k.y = 0.15 ms-1 (151xM dissociation constant). Panels a and b show transmit-ter release for small and large pulses (to -25 and 0 mV,respectively). Transmitter release starts with a delayafter the beginning of the pulse, and is terminated rap-idly, within 2-3 ms after the end of the pulse. Facilitationis robust, reaching levels of over 300% for both smalland large pulses. The time course of transmitter releaseis virtually identical for the first and second of two largepulses separated by 5 ms (c), and the duration of releaseis almost the same for large and small pulses (d).
When the relative (not normalized) magnitudes oftransmitter release in panels a and b were compared, thelarge pulses released 1,700 times as much transmitterper release site as the small pulses. After correction forthe increased number of release sites per active zone(see Fig. 1), the large pulses released 3,800 times asmuch transmitter, consistent with experimental results(Augustine et al., 1985). The success of this aspect of thenew simulation, in contrast to the failure of the earliersimulations, is due to inclusion of the tail current in
calculating the calcium concentration transients.The parameters of Scheme III were modified to get
some idea of the range of values that would behave likeFig. 3. It did not matter much how many of the fivecalcium binding sites were type X vs type Y. The lowaffinity rapidly equilibrating X sites are responsible fortriggering phasic release to the peak calcium concentra-tion. The kinetics of this site must be fast, or the timecourse of release will not be invariant for different pulseamplitude and number. The affinity must be low to avoidsaturation and the problems of Scheme 1. The highaffinity slowly equilibrating Y site(s) is responsible forgenerating facilitation. The magnitude of the affinity isnot critical, but the speed is. Moderately slow kineticsmake this site a low pass filter which integrates the effectof the calcium transient in the first pulse and "stores" itseffect. If the kinetics are too slow, the integrationcontinues for several milliseconds, and facilitation growsin the interpulse period. This is not a property ofexperimentally recorded facilitation (Zucker, 1974).
DISCUSSION
This paper explores the capability of the "CalciumHypothesis" of explaining the properties of transmitterrelease evoked by brief depolarizing pulses. It hadpreviously been shown that simulations of calcium tran-sients at sites of transmitter release near presynapticcalcium channels displayed different time courses topulses of different amplitude and to the two pulses ofpaired-pulse stimulation (Parnas et al., 1989). Using amodel of transmitter release with a high affinity calciumbinding site to trigger exocytosis, similar changes in timecourse of release were found to different pulse ampli-tudes, facilitated and unfacilitated pulses, and to pulsesin different external calcium concentrations. Thesechanges in simulated time course of transmitter releasestood in contrast to measurements of constant releasetime course to paired pulses, pulses of different ampli-tude, and responses to action potentials in different cal-cium concentrations. The discrepancies between simula-tions and experimental results were taken as evidenceagainst the calcium hypothesis of transmitter release.
Yamada and Zucker Transmitter Release and Calcium Diffusion Models 679Yamada and Zucker Transmifter Release and Calcium Diffusion Models 679

We have found that the results of the earlier simula-tions depended on the choice of model parameters used.When a low affinity calcium binding site was substitutedfor the previously saturated site, and when a separaterate-limiting exocytotic step was added, the time course
of release became less influenced by pulse number andamplitude, and by changes in external calcium level.When the stimulation parameters of the simulation wereadjusted to match those of experiments, in terms of therelative sizes of pulses of different amplitude, theinterval between paired pulses, and the differences inexternal calcium concentration, the release time courses
under different conditions became so similar that theywould not be experimentally distinguishable. Thus theobjections raised to the calcium hypothesis vanish whenthe affinity of the calcium receptor is reduced and themodel is adjusted to fit experimental conditions.We have refined the simulations of transmitter release
to include a saturable cytoplasmic calcium buffer withfinite binding rate constants, and have modified theinflux of calcium through open channels to account forthe calcium tail current at the end of a brief pulse or
action potential. We found that calcium concentrationat release sites could exceed 100 ixM in a pulse, whereasthe residual calcium at release sites following a pulsewas much less affected. This caused the model tounderpredict facilitation of release in paired-pulse stim-ulation. This discrepancy could be eliminated by revisingthe release scheme to include two classes of calciumbinding sites: rapidly equilibrating low affinity sites, andslowly equilibrating high affinity sites. In this scheme,the latter are responsible for facilitation, but both mustbe fully occupied by calcium ions before transmitterrelease can occur.
There is good experimental support for several as-
pects of this new scheme of calcium action. First, thatthe endogenous calcium buffers do not bind calciuminstantaneously and without saturation even in thevicinity ofcalcium channel mouths can hardly be doubted.Second, that transmitter release occurs in the neighbor-hood of such channels, where and when the localcalcium concentration is quite high, is indicated by thesubmillisecond delay between opening of calcium chan-nels and the commencement of transmitter release(Simon and Llinas, 1985). Third, that calcium rises andfalls very rapidly at transmitter release sites during andafter a depolarization is a direct consequence of thediffusional collapse of the sharp concentration gradientsthat must exist at release sites near calcium channelmouths (Zucker and Fogelson, 1985). Fourth, thatcalcium concentration reaches a level of 100 p,M atrelease sites near calcium channels is confirmed by theuse of calcium-dependent calcium current to calibratethe level of calcium reached near clusters of calcium
channels at hair cell terminals (Roberts et al., 1990).Fifth, that calcium tail currents contribute much of thecalcium triggering release is shown by the fact thatrelease can be delayed to the end of a pulse, when themembrane is repolarizing and the calcium current sud-denly increases (Katz and Miledi, 1967a,b; Llina's et al.,1981). Sixth, that calcium ions act cooperatively to evokerelease is indicated by the highly nonlinear relationshipbetween release and external calcium concentration(Dodge and Rahamimoff, 1956; Dudel, 1981), presynap-
tic calcium current (Augustine and Charlton, 1986), or
intracellular calcium accumulation on repetitive stimula-tion (Zucker et al., 1991). Seventh, that calcium bindsrapidly to a low affinity receptor to trigger transmitterrelease is indicated by the effects on transmission ofexogenous buffers injected into the squid giant presynap-tic terminal (Adler et al., 1991), as well as by the highsensitivity of release to changes in extracellular calciumconcentration (Dodge and Rahamimoff, 1967; Dudel,1981). Eighth, that calcium remains bound to other sitesafter stimulation is suggested by the observation that theapparent cooperativity of calcium action is lower forfacilitated responses (Stanley, 1986). A more compli-cated model, in which calcium triggers subsequentchanges in the release-promoting calcium receptor thatrelax at different rates following the unbinding ofcalcium from its various binding sites, cannot be ex-
cluded by either experimental results or simulations atthis time. And finally, that the rate of transmitter releaseis limited by a late exocytotic step is indicated by the hightemperature sensitivity of the time course of release(Katz and Miledi, 1965; Datyner and Gage, 1980; van
der Kloot, 1988).Nevertheless, the model of calcium concentration
changes and transmitter release developed here is stillquite rudimentary. In the model, calcium channels are
disposed in a regular array and assumed to open
simultaneously and for a fixed time. In reality, calciumchannels will flutter open asynchronously and remainopen for different times. Channels are randomly dis-persed in active zones, and transmitter release is likelyto occur from vesicles that happen to be docked near
where a number of clustered calcium channels open
together, rather than at a fixed distance from open
calcium channel mouths. Thus we probably underesti-mate the real peaks of calcium achieved in active zones,
and certainly ignore the stochastic complexity of calciumchannel locations and openings and vesicle position. Wehave neglected the effects of vesicle depletion andmobilization. We oversimplify the calcium removal pro-cess by placing membrane pumps only at the front andrear surfaces of the nerve terminal, and neglect internaluptake processes and the effects of mobility of thecytoplasmic buffer. It is inappropriate to expect a close
68 ipyia oralVlm
680 Biophysical Journal Volume 61 March 1992

quantitative agreement between simulations of such asimplified model, most of whose parameters are basedon measurements at squid giant synapses, and resultsfrom crayfish neuromuscular junctions. Rather, thepurpose of such modeling is to explore the consequencesof certain notions of how synapses work, and to see whatgeneral characteristics of experiments they can explain.Major discrepancies between predictions and observa-tions indicate the need to refine the model. Only when itcan be shown that no version of the calcium hypothesisfor transmitter release qualitatively resembles experimen-tal results will it be warranted to throw out the hypothe-sis and formulate a new one. In particular, the idea thatthe time course of transmitter release is determinedmainly by presynaptic potential acting independently ofcalcium (Dudel et al., 1986; Hochner et al., 1989) is nowrefuted by a large body of direct experimental evidence(Zucker and Haydon, 1988; Delaney and Zucker, 1990;Mulkey and Zucker, 1991).
We thank Alex Guo for initial help with program coding, and JerryBerkman of the Cray consulting service at the University of California,Berkeley for advice on optimizing the Fortran code.
This work was supported by National Institutes of Health researchgrant NS 15114, by a grant from Cray Research Incorporated, byUniversity of California educational computing funds, and by aUniversity of California predoctoral fellowship to W.M. Yamada.
Received for publication 20 August 1991 and in final form 15November 1991.
REFERENCES
Adler, E. M., G. J. Augustine, S. N. Duffy, and M. P. Charlton. 1991.Alien intracellular calcium chelators attenuate neurotransmitterrelease at the squid giant synapse. J. Neurosci. 11:1496-1507.
Alema, S., P. Calissano, G. Rusca, and A. Giuditta. 1973. Identifica-tion of a calcium-binding, brain specific protein in the axoplasm ofsquid giant axons. J. Neurochem. 20:681-689.
Augustine, G. J., and M. P. Charlton. 1986. Calcium-dependence ofpresynaptic calcium current and post-synaptic response at the squidgiant synapse. J. Physiol. (Lond.) 381:619-640.
Augustine, G. J., M. P. Charlton, and S. J. Smith. 1985. Calcium entryand transmitter release at voltage-clamped nerve terminals of squid.J. PhysioL (Lond.) 367:163-181.
Chad, J. E., and R. Eckert. 1984. Calcium domains associated withindividual channels can account for anomalous voltage relations ofCa-dependent responses. Biophys. J. 45:993-999.
Charlton, M. P., S. J. Smith, and R. S. Zucker. 1982. Role of presyn-aptic calcium ions and channels in synaptic facilitation and depres-sion at the squid giant synapse. J. Physiol. (Lond.) 323:173-193.
Crank, J. 1975. The Mathematics of Diffusion. Oxford UniversityPress, Oxford. 143.
Datyner, N. B., and P. W. Gage. 1980. Phasic secretion of acetylcholineat a mammalian neuromuscular junction. J. PhysioL (Lond.) 303:299-314.
Delaney, KR., and R. S. Zucker. 1990. Calcium released by photolysisof DM-nitrophen stimulates transmitter release at squid giantsynapse. J. Physiol. (Lond.). 426:473-498.
Dodge, F. A., Jr., and R. Rahamimoff. 1967. Co-operative action ofcalcium ions in transmitter release at the neuromuscular junction. J.Physiol. (Lond.). 193:419-432.
Dudel, J. 1981. The effect of reduced calcium on quantal unit currentand release at the crayfish neuromuscular junction. Pfluegers Arch.Eur. J. PhysioL 391:35-40.
Dudel, J. 1986. Dependence of double-pulse facilitation on amplitudeand duration of the depolarization pulses at frog's motor nerveterminals. PfluegersArch. Eur. J. Physiol. 406:449-457.
Dudel, J. 1989. Calcium and depolarization dependence of twin-pulsefacilitation of synaptic release at nerve terminals of crayfish and frogmuscle. PfluegersArch. Eur. J. PhysioL 415:304-309.
Fogelson, A. L., and R. S. Zucker. 1985. Presynaptic calcium diffusionfrom various arrays of single channels: implications for transmitterrelease and synaptic facilitation. Biophys. J. 48:1003-1017.
Hagiwara, S., and L. Byerly. 1981. Calcium channel. Annu. Rev.Neurosci. 4:69-125.
Hochner, B., H. Parnas, and I. Parnas. 1989. Membrane depolariza-tion evokes neurotransmitter release in the absence of calciumentry. Nature (Lond.). 342:433-435.
Katz, B., and R. Miledi. 1965. The effect of temperature on thesynaptic delay at the neuromuscular junction. J. Physiol. (Lond.)181:656-670.
Katz, B., and R. Miledi. 1967a. The release of acetylcholine from nerveendings by graded electric pulses. Proc. R Soc. Lond. B. Biol. Sci.167:23-38.
Katz, B. and R. Miledi. 1967b. A study of synaptic transmission in theabsence of nerve impulses. J. Physiol. (Lond.). 192:407-436.
Llina's, R., I. Z. Steinberg, and K. Walton. 1981. Relationship betweenpresynaptic calcium current and postsynaptic potential in squidgiant synapse. Biophys. J. 33:323-352.
Llinas, R., M. Sugimori, and S. M. Simon. 1982. Transmission bypresynaptic spike-like depolarization in the squid giant synapse.Proc. Natl. Acad. Sci. USA. 79:2415-2419.
Mulkey, R. M., and R. S. Zucker. 1991. Action potentials must admitcalcium to evoke transmitter release. Nature (Lond.). 350:153-155.
Parnas, H., G. Hovav, and I. Pamas. 1989. Effect of Ca2" diffusion onthe time course of neurotransmitter release. Biophys. J. 55:859-874.
Parnas, I., H. Parnas, and J. Dudel. 1986. Neurotransmitter releaseand its facilitation in crayfish. VIII. Another voltage dependentprocess beside Ca entry controls the time course of phasic release.PfluegersArch. Eur. J. Physiol. 406:121-130.
Roberts, W. M., R. A. Jacobs, and A. J. Hudspeth. 1990. Colocaliza-tion of ion channels involved in frequency selectivity and synaptictransmission at presynaptic active zones of hair cells. J. Neurosci.10:3664-3684.
Robertson, S. P., J. D. Johnson, and J. D. Potter. 1981. Thetime-course of Ca2" exchange with calmodulin, troponin, parvalbu-min, and myosin in response to transient increases in Ca2". Biophys.J. 34:559-569.
Smith, S. J. and R. S. Zucker. 1980. Aequorin response facilitation andintracellular calcium accumulation in molluscan neurones. J. Phys-iol. (Lond.) 300:167-196.
Simon, S. M. and R. R. Llinas. 1985. Compartmentalization of thesubmembrane calcium activity during calcium influx and its signifi-cance in transmitter release. Biophys. J. 48:485-498.
Stanley, E. F. 1986. Decline in calcium cooperativity as the basis offacilitation at the squid giant synapse. J. Neurosci. 6:782-789.
Yamada and Zucker Transmitter Release and Calcium Diffusion Models 681

van der Kloot, W. 1988. The kinetics of quantal release duringend-plate currents at the frog neuromuscular junction. J. Physiol.(Lond.) 402:605-626.
Zucker, R. S. 1973. Changes in the statistics of transmitter releaseduring facilitation. J. Physiol. (Lond.). 229:787-810.
Zucker, R. S. 1974. Characteristics of crayfish neuromuscular facilita-tion and their calcium dependence. J. PhysioL (Lond.). 241:91-110.
Zucker, R. S., K. R. Delaney, R. Mulkey, and D. W. Tank. 1991.
Presynaptic calcium in transmitter release and posttetanic potentia-tion.Ann. N. Y Acad. Sci. 635:191-207.
Zucker, R. S., and A. L. Fogelson. 1986. Relationship betweentransmitter release and presynaptic calcium influx when calciumenters through discrete channels. Proc. Natl. Acad. Sci. USA.83:3032-3036.
Zucker, R. S., and P. Haydon. 1988. Membrane potential has no directrole in evoking neurotransmitter release. Nature (Lond.) 335:360-362.
682 Biophysical Journal Volume 61 March 1992