derivation of three compartment model...
TRANSCRIPT

Derivation of a Three Compartment Model Describing
Disappearance of Plasma Insulin-'31I in Man
ABRAHAmSIvEms, ROBERTS. SWENSON,JoH W. FARQUHAR,andGERALDM. REAvENwith the technical assistance ofROSEMABiE E. HESS
From the Department of Medicine, Stanford University School of Medicine,and Veterans Administration Hospital, Palo Alto, California 94305
ABS T R A C T Insulin-LuI was administered intrave-nously to normal subjects, to patients with maturity-onset diabetes and normal renal function, and to non-diabetic patients with renal failure. The ensuing plasmadisappearance curves of immunoprecipitable radioactiveinsulin were determined, and these data were analyzedin a variety of ways. Firstly, fractional irreversible lossrates of insulin from plasma were calculated and foundto be greatly diminished in patients with renal failure(t4 = 39 min), as compared with normal (t4 = 15 min)and diabetic subjects (ti = 12 min). Secondly, plasmainsulin-2'I disappearance curves were resolved intosums of three exponentials by the method of "peeling,"and values for the resultant three slopes and half-liveswere determined. Patients with normal renal functionhad similar values for all parameters, while those pa-tients with renal failure were differentiated on the basisof the slope of the last component, with a prolongationof its half-life to 275 min (approximately twice normal).Finally, a three pool model was formulated to describethe kinetics of plasma insulin disappearance in man.representing plasma (pool 1), interstitial fluid (pool 2),and all tissues in which insulin is utilized and degraded(pool 3). The proposed model adequately describing thedisappearance curves of insulin-'I observed in all pa-tients indicated that volumes (per cent body weight) ofpool 1 (4.04) and pool 2 (10.11), calculated on the basisof the model and the experimental data, correspondedclosely to estimates of plasma and interstitial fluid vol-
This study was supported by U. S. Public Health ServiceSpecial Fellowships 5-F3-GM-34, 279-02, 5-F3-H-24,297,U. S. Public Health Service Research Grant HE 08506,U. S. Public Health Service Training Grant AM05021, Re-search Career Awards Branch HE 6003, and General Clini-cal Research Centers Branch, Division of Research Fa-cilities and Resources FR-70.
Received for publication 28 February 1969 and in revisedform 14 April 1969.
umes obtained by independent means. It also demon-strated that patients with renal failure were character-ized by a decreased removal rate of insulin from pool3 and an increased recycling rate of insulin from pool3 to pool 2. It is concluded that the proposed model rep-resents a reasonable description of the kinetics of insu-lin distribution and degradation, and that its use pro-vides quantitative insights into the physiology of insulinmetabolism.
INTRODUCTIONIn a recent paper we demonstrated that disappearanceof insulin-w'I from plasma of man clearly reflected anon-first order process (1). The potential errors re-sulting from the use of first order concepts to analyzesuch situations were pointed out, and alternative methods were described which did permit estimation of therate at which insulin was being delivered into the gen-eral circulation. This analysis represented the most
primitive approach to a description of the multicompart-mental system involved in insulin distribution and degra-dation in man. In an effort to begin construction of amore sophisticated model of insulin kinetics, we haveextended our studies of insulin-'I plasma disappear-ance to include patients with terminal renal failure. Thesepatients were selected because there is considerable evi-dence suggesting that the kidney plays an importantrole in insulin degradation and excretion (2) and, con-
sequently, plasma insulin-MI disappearance curves ofsuch patients might be reasonably expected to differsubstantially from those we had previously describedin normal and maturity-onset diabetic subjects. Wehoped that comparison of results in patients with nor-mal renal function with similar studies of patients withessentially no renal function would aid in our initial at-
tempts at model building. The results indicated that in-
The Journal of Clinical Investigation Volume 48 1969 1461

TABLE IClinical Characteristics
Numberof Fasting plasma Serum
patients Age* glucose: creatininet
yr mg/100 ml mg/100 ml
Normal 6 53.0 417.1 82.2 46.3 1.03 40.09Diabetic 8 55.6 ±8.7 179.9 ±43.9 1.11 ±0.06Renal failure 4 29.3 ±10.7 104.0 ±4.1 18.42 ±2.3
* Mean -SD.Mean ±IsiE.
sulin-l`I disappearance curves from plasma of patientswith terminal renal failure were significantly differentfrom either diabetic or normal subjects with normal re-nal function. Further analysis of the results from allsubjects led to the formulation of a three pool model ofinsulin kinetics in man. Although there were significantdifferences in the rate constants between various poolsin the three population groups, the three pool modeladequately described the disappearance curves of insulin-'I observed in all patients. In this paper we shall de-scribe the manner in which the model was derived, aswell as some attempts to validate its appropriateness.
METHODSExperimental subjects. 14 patients with normal renal
function were studied. Six had normal oral glucose tolerancetests (3), while the other eight had maturity-onset diabetesmellitus. None of the patients with diabetes had ever receivedinsulin. Four subjects in end-stage renal failure awaitingrenal transplantation were studied twice, once beforenephrectomy and again, in the anephric state, immediatelybefore transplantation. These subjects had chronic paren-chymal renal disease without evidence of systemic disease ordiabetes. Table I summarizes the characteristics of the threepopulation groups.
Experimental protocol. All patients received over 300 gof carbohydrate daily for at least 1 wk before measurementof plasma insulin-1'I disappearance. Studies were performedafter a 15 hr fast. Insulin-'I (0.75 ,uc/kg body weight)'was given by rapid intravenous injection and blood obtainedvia an indwelling polyethylene catheter. Samples were ob-tained 2, 4, 6, 10, 15, 20, and 30 min after injection of thetracer and then every 15 min for the next 21 hr.
Technical procedures. Blood was drawn into tubes con-taining ethylenediamenetetraacetate (EDTA). Plasma,promptly separated in a refrigerated centrifuge, was imme-diately frozen in acetone-dry ice. Disappearance of immuno-precipitable radioactivity from plasma was determined thefollowing day by the method of Grodsky and Forsham (4,5), in which plasma is reacted with guinea pig anti-insulinantibody and the resultant antigen-antibody complex precipi-tated with 25%o sodium sulfate. This method was modifiedby omitting the initial acid-alcohol extraction and by carry-ing out the reaction in the presence of excess anti-insulin
1Bovine-insulin-'"I, approximately 4 mc/mg, AbbottLaboratory, North Chicago, Ill.
antibody. Under these conditions, recovery of immuno-precipitable radioactivity was greater than 95% over a widerange of "cold" porcine insulin concentrations (10-1000,oU/ml). The total dose of immunoprecipitable radioactivityadministered to each subject was determined by applying theabove method to aliquots of injected material saved fromeach experiment.
Computational methods. The data, expressed in counts perminute per milliliter of plasma, described a nonlinear curveon semilog paper. The curve was resolved into a sum ofexponentials by the method of "peeling" (6). The resultsof peeling were used as initial estimates to a nonlinear leastsquare program developed by Powell (7) and adapted foruse on the IBM 360/50 on line computer. We obtained afitted sum of exponentials which were used to compute frac-tional turnover rates on the same on line computer. Thesefractional rates were then used as initial estimates to theSAAMprogram of Berman and Weiss (8). This programobtained final estimates of the parameters. Final sum ofsquares and estimates of parameter variance were also pro-vided which were used as indices of good fit. The finalestimates of the fractional rates were used to compute asimulated curve of plasma insulin disappearance, which wasvisually displayed with the data on a cathode ray tube atthe Stanford Medical School computer facility. Some of thefigures in this text are photographic reproductions of thedisplay.
A stepwise discriminant analysis (9) was applied toparameters obtained from the Berman program. The analysiswas performed on an IBM 360/67 computer in which thebiomedical program library is stored.
RESULTS
Fig. 1 shows three typical plasma insulin-WI disap-pearance curves obtained, respectively, from subjectswith normal glucose tolerance and renal function, ab-normal glucose tolerance and normal renal function, andthose with abnormal renal function. These curves areclearly nonlinear on semilog paper and cannot representa first order process. There are at least three ways toanalyze these results in a quantitative fashion. Thesemethods represent three levels of sophistication in termsof kinetic analysis and are capable of yielding increas-ingly more detailed information relevant to the multi-compartmental system being investigated.
The simplest approach is to plot the disappearancecurve of plasma immunoprecipitable radioactivity ongraph paper with ordinary coordinates. The area underthe circumscribed curve, estimated by planimetry, can be
TABLE I IFractional Irreversible Loss Rate of Insulin from Plasma (Xe)
X,(1/nmin)* 0-693 (min)*
Normal 0.048 ±0.005 15.193 +1.439Diabetic 0.060 ±0.002 11.627 +0.285Renal failure 0.020 ±0.003 39.210 ±6.158
* Mean 4SE.
1462 A. Silvers, R. S. Swenson, J. W. Farquhar, and G. M. Reaven

7
0Q
W.C.
--0 50 100 150 200minutes
NORMAL DIABETIC RENAL FAILURE
FIGURE 1 Typical insulin-"31I plasma disappearance curves for each patient group.
divided into the dose of administered tracer, and thisanswer, with appropriate conditions, represents frac-tional irreversible loss rate of insulin from plasma. (Themathematical basis for this method has been discussedin detail in a recent paper from our laboratory [1].)Fractional irreversible loss rates from plasma for thethree patient groups have been estimated by this method,and the results appear in Table II. An estimate of thehalf-life of this fractional rate can be determined, andthis is also shown in Table II. It can be seen that thefractional irreversible loss rate of plasma insulin andthe half-life of this loss are essentially similar in thetwo groups of patients with normal renal function,whereas patients with terminal renal failure had greatlydecreased fractional rates of loss and increased half-lives. (Patients with renal failure had essentially identi-cal plasma insulin-WI disappearance curves before andafter nephrectomy, and data from both experiments foreach patient are used in this and all subsequent analyses.)
Although this method provides valid quantitative in-formation which clearly distinguishes patients with re-
nal failure from those with normal renal function, itdoes not begin to describe the multicompartmental sys-
tem which must exist for insulin metabolism. A secondand more complicated quantitative approach is based
upon resolution of plasma insulin-~'I disappearancecurves into various numbers of components by themethod of peeling. Fig. 2A displays one of the curves
of Fig. 1 (W. C.) in terms of two components. Themathematical equation describing this latter set is givenby: plasma insulin---UI (cpm/ml) = h1ie-gt + h2e-:'t,where gi and hi are the slope and intercept, respec-
tively, of the first component and g2 and h2 the equiva-lent parameters for the second component. The same
data in Fig. 1 can also be resolved by the peeling pro-
cedure into three components. This result is shown inFig. 2 B. The mathematical description for this set isplasma insulin-'I (cpm/ml) =hie-91t + h2e-2t + h3e'st,whereas in the previous case, gi and hi are, respectively,the slope and intercept of the it' component, and i iseither the index 1, 2, or 3. Further resolution of thesecurves is not possible, since a fourth component is notdiscernible by eye nor can it be obtained by the peelingprocedure. Solution of these equations provides datawhich are useful in a variety of ways. For example, val-ues for slopes and half-lives of the components can beobtained and patients compared on this basis. Results ofsuch an analysis of the three component case are seen inTable III. Patients with normal renal function had com-
parable values for half-lives, while patients with renal
Plasma Insulin-"'1 Disappearance in Man 1463
8000,
6000
4000
2000
I l00C8SC
60C
4001
2001
W.G. B.R.

TWOCOMPONENT
o EXPERIMENTALDATAPOINTS
° DERIVED POINTS FOR FIRST COW
0
0
0
0I
MPONENT
h3 -
0 50 100 150 200minutes
A
THREE COMPONENT
O EXPERIMENTALDATA POINTS
* DERIVEDPOINTS FOR FIRST COMPONENT
* DERIVED POINTS FORSECONDCOMPONENT
0
0
0
00
B
FIGURE 2 An insulin-'I plasma disappearance curve (subject W. C.) resolved into two andthree components.
failure differed from the other two groups, with themain difference being the half-life of the last component.Additionally, a comparison between the "goodness offit" of the two vs. the three component case can be madeand a decision reached as to which analysis is mostappropriate. Although this procedure may indicatewhich case will generate the most meaningful data, itis apparent that the results of this analysis are notnecessarily relevant to any specific biological system.In order to accomplish this it is necessary to postulate a
multicompartmental model, and the data derived frompeeling is used to provide initial estimates in this pro-
cedure as described in the following section.A multicompartmental model is formulated in terms
of the minimal number of components available; there-fore, resolution of the plasma insulin-tmI disappearancecurves as the sum of two exponentials (Fig. 2 A) indi-cated that a two compartment model might be adequate(10). The model depicted in Fig. 3 seemed reasonableas a first approximation. Fig. 3 depicts a mechanism inwhich insulin travels from plasma (compartment 1) to
an extra-plasma pool (compartment 2) which is thesite of activity and degradation of insulin. The param-eters XiJ are fractional turnover rates, and the sub-scripts denote passage from compartment j to compart-ment i, i.e., X21 = fractional rate of plasma insulin leav-ing plasma and entering compartment 2, Xu = fractionalrate of insulin returning to plasma from compartment 2,
TABLE IIIHalf Life of Component Slopes (tj)*
Three component case
First component: Second components Third component:
2.411 40.192 14.114 ±0.623 132.80 ±-11.881.875 ±0.260 8.281 40.497 101.18 I7.401.557 ±0.217 10.400 ±1.272 275.54 ±31.30
* tj was obtained from the component slopes using the
formula tj = °63 and is expressed in minutes.slopet Mean ± SE.
1464 A. Silvers, R. S. Swenson, J. W. Farquhar, and G. M. Reaven
8000i
6000
4000
2000
1000
800Ea.
4001
2001
h2 -3

X21 \2SITE of 0 X02
_PLASMA X12 UTILIZATION andDEGRADATION
POOL I POOL 2
FIGURE 3 A two compartment model describing insulin-'Iplasma disappearance, in which X,] are fractional rates oftransfer.
and Bo2 is the fractional rate of insulin irreversiblyleaving the site of degradation. The model in Fig. 3 isbased on the assumption that insulin enters plasma fromthe pancreas, leaves plasma, can return unchanged, andis utilized and degraded in the extra-plasma pool.
The appropriateness of this model was tested in thefollowing manner. Estimates of the parameters (hi, gi,i = 1, 2) describing a sum of two exponentials were ini-tially obtained by the process of peeling. The values forthese parameters were refined by the fitting proceduredeveloped by Powell (7). The refined hi and gi wereused to compute initial estimates of Xij by the followingformulae:
X2 2h
9 - g1)hi + h2 )
02 = 9192 .-92 - hi+h (g2-g1)]
X2= g1 + hi+ 92~ - g1) - X02hi + h2( )
The final estimates obtained from the SAAMpro-gram (8) (see computational methods) were used in asimulation procedure to see how well they predicted theactual experimental data. The results of this simulationare seen in Fig. 4. Although the data seem to be satis-factorily reproduced by the theoretical curve during thefirst 50 min, subsequent data points are seen to divertsignificantly from the predicted curve. This inadequatesimulation of the experimental data was true for all
100
0
0
0
.2-
olol
O310 O 010 3101+ 9
_ ~~~~+H ~~~~~+
+x._c
10 30 50 70 90 HO 130 15O 170 190Time (min)
FiGuRE 4 Simulation of a normal patient's disappearanceobtained from the two pool model. The + are the datapoints, and the continuous curve is the calculated curvedescribing the data. The ordinate is expressed in fraction ofdose and the abscissa in minutes. This is a photograph of thedata and simulated curve as displayed on a cathode ray tube.
patients, and a two pool model was rejected as repre-senting the minimal model necessary to explain the data.
A three pool model was then formulated which is il-lustrated in Fig. 5. The first pool in this model is plasma.The second pool, exchanging with plasma, is the inter-stitial fluid compartment, and the third pool is the com-partment in which insulin is utilized and degraded, andfrom which it is irreversibly removed. The fractionaltransfer rates are defined in the same manner as in thetwo pool model. Analogous to Xo in the previous model,Xo is the fractional irreversible loss rate of insulin leav-ing the site of degradation. To initiate the procedurein the fitting program, we provided estimates of theXij to the computer. These estimates were obtained us-ing the methodology described by Skinner, Clark, Baker,and Shipley (11). A summary of the final estimates ofthe parameters X11 obtained from the SAAMprogramis given in Table IV.
TABLE IVSummary of Model Parameters
X21 X12 X32 X23 X03
I 0.225 ±0.053 0.065 ±0.014 0.047 ±0.007 0.014 ±0.003 0.008 ±0.002II 0.283 ±0.054 0.091 ±0.023 0.077 +0.012 0.021 ±0.003 0.010 ±0.002III 0.338 ±0.134 0.136 ±0.047 0.064 +0.024 0.028 ±0.008 0.005 ±0.002
All values are expressed as means -SD.I = Normal glucose tolerance tests (GTT) and normal renal function.II = Abnormal GTTand normal renal function.III = Normal GTTand terminal renal failure.
Plasma Insulin-"'I Disappearance in Man 1465

m1 X21 X32I I~~INTERSTITIALI --h SITE of X03
-~PLASMA \512 jLUID >23 UTILIZATION and--DEGRADATION
POOL I POOL2 POOL 3
FIGURE 5 A three compartment model describing insulin-'Iplasma disappearance.
The simulation obtained from this model is shown inFig. 6, and again is representative of the results for allpatients. The curvature of the data from 50 to 180 minis more closely approximated in the three pool modelthan in the two pool model (Fig. 4). The weighted sumof squares of residuals, provided in the last iteration ofthe nonlinear least square portion of the Berman pro-gram, are used to numerically judge the closeness offit. Fig. 7 shows that the mean sum of squares obtainedfrom the data of all subjects for the two compartmentmodel is approximately seven times the value obtainedfor the three pool model, a finding thus indicating theenhanced fit provided by the latter model. The programalso provides fractional deviations of the parameterswhich are calculated in the final iteration. The mean frac-tional deviation (±SE) of all parameters for all patientsin the three pool model is 0.21 ±0.019. This small figurefurther indicates the compatibility of the model to thedata.
Another way to evaluate the appropriateness of agiven model is to see whether or not the volume of pos-tulated pools, calculated on the basis of the model andexperimental data, correspond to the sizes of anatomicalpools derived from direct measurement. In the case ofthe postulated three pool model we can generate estimatesfor pools 1 (plasma) and 2 (interstitial fluid). Thesizes of these two pools, as well as both their sum andthe ratio between them, can then be compared with in-dependent estimates of these parameters.
In order to compute the size of pool 1 we used thefollowing formula:
dosePlasma volume =
hi + h2 + h,and obtained a value
of 4.04% of body weight as the average plasma volume(VI) for all subjects. The volume, V2, of pool 2 was de-rived from the following equation:
V2/V1_ X21X33X22X33 - X23X32
where X22 = X12 + X32 and X33 = X23 + X03.
This equation is based upon the assumption of a steadyand uniform concentration of insulin throughout the ex-
Time (min)
FIGURE 6 Simulation obtained from the three pool model.The + are the data points, and the continuous curve is thecalculated curve describing the data. The ordinate is ex-pressed in fraction of dose and the abscissa in minutes. Thisis a photograph of the data and simulated curve as displayedon a cathode ray tube.
tracellular space (12). The value of the ratio Vs/Va forpatients was 2.51 ±0.46 (Mean +SD). Thus, the volumeof interstitial fluid was calculated to be equal to 10.14%of body weight (2.51 X 4.04%) and total extracellu-lar fluid volume to be equal to 14.18% of body weight(4.04% + 10.14%). The results of these calculationsare compared to similar data obtained by direct mea-surement in Table V and can be seen to closely cor-respond to the mean of previous estimates of several
T40,000 -
30,O0004-20, 000
10,000 ±
2 POOL 3 POOL
FIGURE 7 A comparison of the sum of squares (Mean ±SE)obtained in the output of the SAAMprogram, indicating thebcetter fit with use of a three pool model.
1466 A. Silvers, R. S. Swenson, J. W. Farquhar, and G. M. Reaven
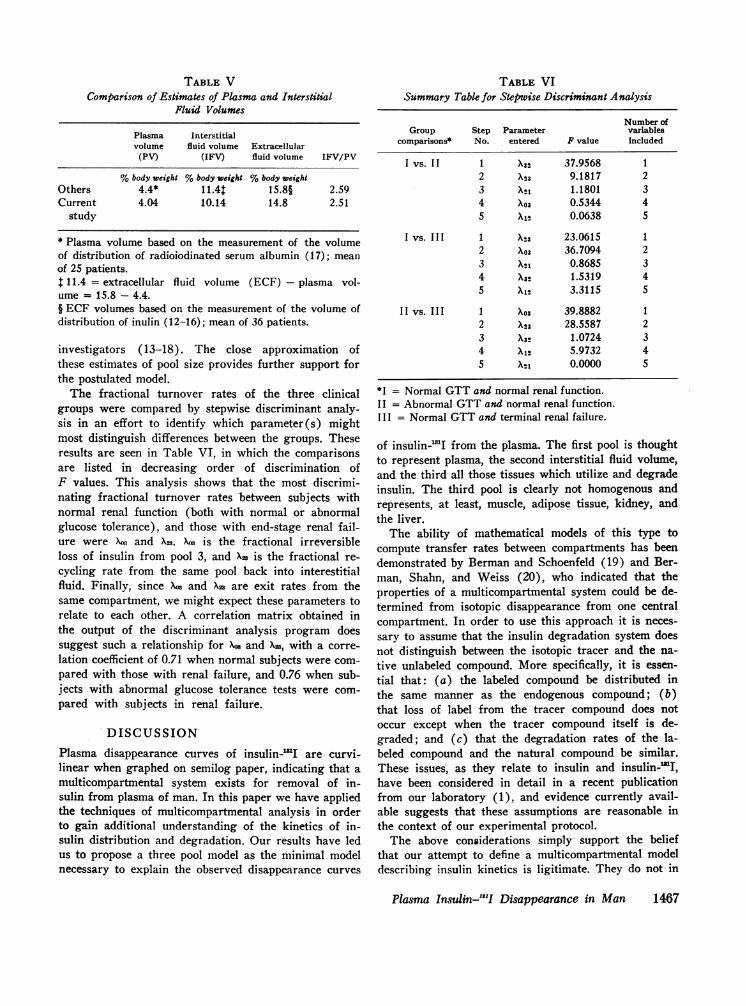
TABLE VComparison of Estimates of Pkasma and Interstitial
Fluid Volumes
Plasma Interstitialvolume fluid volume Extracellular
(PV) (IFV) fluid volume IFV/PV
%body weight %body weight %body weightOthers 4.4* 11.4t 15.8§ 2.59Current 4.04 10.14 14.8 2.51
study
* Plasma volume based on the measurement of the volumeof distribution of radioiodinated serum albumin (17); meanof 25 patients.1 11.4 = extracellular fluid volume (ECF) - plasma vol-ume = 15.8 - 4.4.§ ECF volumes based on the measurement of the volume ofdistribution of inulin (12-16); mean of 36 patients.
investigators (13-18). The close approximation ofthese estimates of pool size provides further support forthe postulated model.
The fractional turnover rates of the three clinicalgroups were compared by stepwise discriminant analy-sis in an effort to identify which parameter(s) mightmost distinguish differences between the groups. Theseresults are seen in Table VI, in which the comparisonsare listed in decreasing order of discrimination ofF values. This analysis shows that the most discrimi-nating fractional turnover rates between subjects withnormal renal function (both with normal or abnormalglucose tolerance), and those with end-stage renal fail-ure were Xw and X23. Xw is the fractional irreversibleloss of insulin from pool 3, and X= is the fractional re-cycling rate from the same pool back into interestitialfluid. Finally, since Xw and X3 are exit rates from thesame compartment, we might expect these parameters torelate to each other. A correlation matrix obtained inthe output of the discriminant analysis program doessuggest such a relationship for Xo and X=, with a corre-lation coefficient of 0.71 when normal subjects were com-pared with those with renal failure, and 0.76 when sub-jects with abnormal glucose tolerance tests were com-pared with subjects in renal failure.
DISCUSSIONPlasma disappearance curves of insulin-WI are curvi-linear when graphed on semilog paper, indicating that amulticompartmental system exists for removal of in-sulin from plasma of man. In this paper we have appliedthe techniques of multicompartmental analysis in orderto gain additional understanding of the kinetics of in-sulin distribution and degradation. Our results have ledus to propose a three pool model as the minimal modelnecessary to explain the observed disappearance curves
TABLE VISummary Table for Stepwise Discriminant Analysis
Number ofGroup Step Parameter variables
comparisons* No. entered F value Included
I vs. II 1 X32 37.9568 12 X23 9.1817 23 XS1 1.1801 34 X03 0.5344 45 X1I 0.0638 5
I vs. III 1 X23 23.0615 12 X03 36.7094 23 X1 0.8685 34 X32 1.5319 45 X12 3.3115 5
II vs. III 1 X03 39.8882 12 X23 28.5587 23 X32 1.0724 34 X12 5.9732 45 X21 0.0000 5
*I = Normal GTTand normal renal function.II = Abnormal GTTand normal renal function.III = Normal GTTand terminal renal failure.
of insulin-WI from the plasma. The first pool is thoughtto represent plasma, the second interstitial fluid volume,and the third all those tissues which utilize and degradeinsulin. The third pool is clearly not homogenous andrepresents, at least, muscle, adipose tissue, kidney, andthe liver.
The ability of mathematical models of this type tocompute transfer rates between compartments has beendemonstrated by Berman and Schoenfeld (19) and Ber-man, Shahn, and Weiss (20), who indicated that theproperties of a multicompartmental system could be de-termined from isotopic disappearance from one centralcompartment. In order to use this approach it is neces-sary to assume that the insulin degradation system doesnot distinguish between the isotopic tracer and the na-tive unlabeled compound. More specifically, it is essen-tial that: (a) the labeled compound be distributed inthe same manner as the endogenous compound; (b)that loss of label from the tracer compound does notoccur except when the tracer compound itself is de-graded; and (c) that the degradation rates of the la-beled compound and the natural compound be similar.These issues, as they relate to insulin and insulin- I,have been considered in detail in a recent publicationfrom our laboratory (1), and evidence currently avail-able suggests that these assumptions are reasonable inthe context of our experimental protocol.
The above considerations simply* support the beliefthat our attempt to define a multicompartmental modeldescribing insulin kinetics is ligitimate. They do not in
Plasma Insulin-"'I Disappearance in Man 1467

any way provide validation of the particular model wehave proposed. Our reason for believing that the postu-lated three pool model represents a reasonable first ap-proximation of the kinetics of insulin distribution anddegradation is based upon the following considerations.The model provided an excellent fit for experimental dataobtained from three different patient groups. This isexemplified by the extremely low weighted sum ofsquares derived from consideration of all patients (Fig.7), as well as by the fact that we were able to closelysimulate the actual experimental data by use of the pos-tulated model (Fig. 6). Furthermore, volumes of postu-lated pools 1 and 2, calculated on the basis of the modeland the experimental data, corresponded very closely toestimates of these pool sizes obtained by the use of verydifferent techniques (Table V).
The primary purpose of these studies was to developa minimal model describing the distribution and degrada-tion of insulin in man. The inclusion of three differentpatient populations was to aid in this process of modeldevelopment and not necessarily to provide comparativedata about possible differences between groups of pa-tients. However, certain results of these comparisonsseem worthy of mention. Patients with normal renalfunction, irrespective of their carbohydrate tolerance, ap-peared to behave similarly in terms of insulin kinetics.However, there was one possible exception. Discrimi-nant analysis, as seen in Table VI, suggested that insu-lin in patients with maturity-onset diabetes exchangesat a more rapid rate between pools 2 (plasma) and 3(interstitial fluid) than it does in subjects with normalglucose tolerance. Our previous work indicated that pa-tients with modest hyperglycemia deliver a greater loadof insulin to the tissue, and that this greater load of in-sulin is degraded at the same rate as observed in nor-mal patients (1). Thus, the greater fractional rate ofexchange noted in the current studies may be a reflectionof the fact that patients with mild maturity-onset dia-betes deliver more insulin to tissue sites of utilizationand degradation.
Differences between patients with and without normalrenal function were much more dramatic. Certain con-clusions seemed to emerge, and these were independentof the method of data analysis. If one simply calculatesthe irreversible loss rate of insulin-"1'I (Table II), itis clear that it is much slower in patients with terminalrenal failure. Conversely, the half-life of this irreversibleloss rate is much greater in patients with renal fail-ure (39.2 min) than in subjects with normal renal func-tion (15.19 and 11.63 min). If the method of curvepeeling is used, three components can be identified.The plasma insulin-.1 I disappearance curves of patientswith terminal renal failure differed most in the slope ofthe terminal component. The average half-life of this
component in patients with renal failure was 275.54 minapproximately two times that of normal subjects (132.8min). Similar results are obtained when discriminantanalysis was used to evaluate the data obtained fromuse of the three pool model. Table VI indicates that theparameters Xw and Xzw are the most important distinguish-ing features between patients with normal and abnormalrenal function. Thus, the fractional rate of loss of insu-lin is less for the subject with terminal renal failure,whereas the per cent of insulin recycled per minute backto the interstitial fluid is greater for this group. Theincreased return of insulin to the systemic circulationwould seem to be a reasonable consequence of the func-tional loss of an organ responsible for degradation ofthis hormone.
Our conclusion that the rate of insulin degradation isdecreased in patients with renal failure is not a newone, and this possibility was first advanced to explainthe apparent decrease in insulin requirements of pa-tients with diabetic nephropathy (21). Considerable evi-dence has accumulated since that time indicating thatthe kidney plays a major role in insulin degradation,and this has been the topic of a recent excellent reviewarticle (2). However, there are only a relatively fewpapers dealing with the quantitative effects of kidneydisease on insulin degradation (22-24), and these stud-ies seem to suffer from certain defects. In the firstplace, disappearance of nonspecific trichloroacetic acid(TCA)-precipitable radioactivity has been followed,despite the fact that several authors have indicated thatthis method does not adequately separate intact immuno-precipitable insulin from its labeled degradation prod-ucts (25-27). Secondly, the use of this techniquewould have the effect of accentuating the already curvi-linear insulin-'I disappearance curve and make lessjustifiable the use of analytical techniques appropriateonly for first order processes. Our experimental ap-proach circumvents these problems and provides resultswhich permit quantification of the effect of kidney dis-ease on insulin degradation rates. However, we can notprovide much insight into the mechanism of this effect.The observation that fractional rate constants of allparameters remained the same after nephrectomy in pa-tients with terminal renal failure suggests that the pres-ence of kidneys is itself not sufficient, and that normalrenal insulin degradation requires functioning kidneys.Precisely what aspect of renal function is necessary fornormal insulin degradation and the role, if any, of theuremic state is the subject of our current investigations.
REFERENCES1. Stern, M. P., J. W. Y9arquhar, A. Silvers, and G. M.
Reaven. 1968. Insulin delivery rate into plasma in nor-mal and diabetic subjects. J. Clin. Invest. 47: 1947.
1468 A. Silvers, R. S. Swenson, J. W. Farquhar, and G. M. Reaven

2. Rubenstein, A. H., and I. Spitz. 1968. Role of the kidneyin insulin metabolism and excretion. Diabetes. 17: 161.
3. Fajans, S. S., and J. W. Conn. 1954. An approach to theprediction of diabetes mellitus by modification of theGTT with cortisone. Diabetes. 3: 296.
4. Grodsky, G. M., and P. H. Forsham. 1960. An immuno-chemical assay of total extractable insulin in man. J.Clin. Invest. 39: 1076.
5. Grodsky, G. M., and P. H. Forsham. 1961. Comparativebinding of beef and human insulin to insulin antibodiesproduced in man and guinea pigs. J. Clin. Invest. 40: 799.
6. Sheppard, C. W. 1962. Basic Principles of the TracerMethod. John Wiley & Sons, Inc., New York. 1st edi-tion. 245.
7. Powell, M. J. D. 1965. A method for minimizing a sumof squares of nonlinear functions without calculatingderivatives. Computer J. 7: 303.
8. Berman, M., and M. F. Weiss. 1967. Users manual forSAAM. U. S. Public Health Service 1703. U. S. De-partment of Health, Education and Welfare, U. S.Government Printing Office, Washington, D. C.
9. Dixon, W. J., editor. 1967. Biomedical computer pro-grams. Health Sciences Computing Facilities, Depart-ment of Preventive Medicine and Public Health, Schoolof Medicine, University of California, Los Angeles, Calif.
10. Barrett, P. V. D., P. D. Berk, M. Menken, and N. I.Berlin. 1968. Bilirubin turnover studies in normal andpathological states using bilirubin-'4C. Ann. Intern. Med.68: 355.
11. Skinner, S. M., R. E. Clark, N. Baker, and R. A. Ship-ley. 1959. Complete solution of the three compartmentmodel in steady state after single injection of radio-active tracer. Amer. J. Physiol. 196: 238.
12. Rasio, E. A., C. L. Hampers, J. S.' Soeldner, and G. F.Cahill, Jr. 1967. Diffusion of glucose, insulin, inulin, andEvans blue protein into thoracic duct lymph of man.J. Clin. Invest. 46: 903.
13. Gaudino, M., I. L. Schwartz, and M. F. Levitt. 1948.Inulin volume of distribution as a measure of extra-cellular fluid in dog and man. Proc. Soc. Exp. Biol. Med.68: 507.
14. Schwartz, I. L., D. Schachter, and N. Freinkel. 1949.The measurement of extracellular fluid in man by meansof a constant infusion technique. J. Clin. Invest. 28: 1117.
15. Schwartz, I. L., E. S. Breed, and M. H. Maxwell. 1950.Comparison of the volume of distribution, renal and
extrarenal clearance of inulin and mannitol in man.J. Clin. Invest. 29: 517.
16. Deane, N., G. E. Schreiner, and J. S. Robertson. 1951.The velocity of distribution of sucrose between plasmaand interstitial fluid, with reference to the use ofsucrose for the measurement of extracellular fluid inman. J. Clin. Invest. 30: 1463.
17. DeGraeff, J. 1957. Inulin space and total exchangeablesodium in patients with essential hypertension. ActaMed. Scand. 156: 337.
18. Brady, L. W., D. Y. Cooper, AM. Colodzin, J. E. Mc-Clenathan, E. R. King, and R. Williams. 1953. Bloodvolume studies in normal humans. Surg. Gynecol. Obstet.Int. Abstr. Surg. 97: 25.
19. Berman, M., and R. Schoenfeld. 1956. Invarients in ex-perimental data on linear kinetics and the formulationof models. J. Appl. Phys. 27: 1361.
20. Berman, M., E. Shahn, and M. F. Weiss. 1962. Theroutine fitting of kinetic data to models. A mathematicalformalism for digital computers. Biophys. J. 2: 275.
21. Zubrod, C. G., S. L. Eversole, and G. W. Dana. 1951.Amelioration of diabetes and striking rarity of acidosis inpatients with Kimmelstiel-Wilson lesions. N. Engl. J.Med. 245: 518.
22. Ricketts, H. T., H. L. Wildberger, and L. Regut. 1963.The role of the kidney in the disposal of insulin in rats.Diabetes. 12: 155.
23. O'Brien, J. P., and A. R. Sharpe. 1967. The influence ofrenal disease on insulin-I' disappearance curve in man.Metab. (Clin. Exp.) 16: 76.
24. Palmer, D. L., and R. E. Bolinger. 1961. Effect ofnephrectomy and splanchnicectomy on plasma disappear-ance of labeled insulin in the rabbit. Proc. Soc. Exp. Biol.Med. 107: 809.
25. Berson, S. A., R. S. Yalow, A. Bauman, M. A. Roths-child, and K. Newerly. 1956. Insulin-I' metabolism inhuman subjects: demonstration of insulin binding globu-lin in the circulation of insulin treated subjects. J. Clin.Invest. 35: 170.
26. Scott, G. W., T. E. Prout, J. A. Weaver, and S. P.Asper. 1958. A comparison of the behaviour of insulinand insulin labeled with I' in serum. Diabetes. 7: 38.
27. Zaharko, D. S., L. V. Beck, and R. Blankenbaker. 1966.Role of the kidney in the disposal of radioiodinated andnonradioiodinated insulin in dogs. Diabetes. 15: 680.
Plasma Insulin-"'I1 Disappearance in Man 1469