derivatives futures and options mba project
TRANSCRIPT
5/13/2018 Derivatives Futures and Options Mba Project - slidepdf.com
http://slidepdf.com/reader/full/derivatives-futures-and-options-mba-project 1/92
Derivatives (Futures & Options)
INTRODUCTION OF DERIVATIVES
The emergence of the market for derivative products, most notably forwards,
futures and options, can be traced back to the willingness of risk-averse economic
agents to guard themselves against uncertainties arising out of fluctuations in asset
prices. By their very nature, the financial markets are marked by a very high
degree of volatility. Through the use of derivative products, it is possible to
partially or fully transfer price risks by locking-in asset Prices. As instruments of
risk management, these generally do not influence the Fluctuations in the
underlying asset prices. However, by locking-in asset prices, Derivative products
minimize the impact of fluctuations in asset prices on the Profitability and cashflow situation of risk-averse investors.
Derivatives are risk management instruments, which derive their value from
an underlying asset. The underlying asset can be bullion, index, share, bonds,
Currency, interest, etc., Banks, Securities firms, companies and investors to hedge
risks, to gain access to cheaper money and to make profit, use derivatives.
Derivatives are likely to grow even at a faster rate in future.
DEFINITION OF DERIVATIVES
“Derivative is a product whose value is derived from the value of an underlying
asset in a contractual manner. The underlying asset can be equity, Forex,
commodity or any other asset.”
Securities Contract ( regulation) Act, 1956 (SC(R) A)defines “debt
instrument, share, loan whether secured or unsecured, risk instrument or
contract for differences or any other form of security”
A contract which derives its value from the prices, or index of prices, of
underlying securities.
1
5/13/2018 Derivatives Futures and Options Mba Project - slidepdf.com
http://slidepdf.com/reader/full/derivatives-futures-and-options-mba-project 2/92
Derivatives (Futures & Options)
HISTORY OF DERIVATIVES MARKETS
Early forward contracts in the US addressed merchants concerns about ensuring
that there were buyers and sellers for commodities. However “credit risk”remained a serious problem. To deal with this problem, a group of Chicago;
businessmen formed the Chicago Board of Trade (CBOT) in 1848. The primary
intention of the CBOT was to provide a centralized location known In advance for
buyers and sellers to negotiate forward contracts. In 1865, the CBOT went one
step further and listed the first “exchange traded” derivatives Contract in the US;
these contracts were called “futures contracts”. In 1919, Chicago Butter and Egg
Board, a spin-off CBOT was reorganized to allow futures trading. Its name was
changed to Chicago Mercantile Exchange (CME). The CBOT and the CME
remain the two largest organized futures exchanges, indeed the two largest
“financial” exchanges of any kind in the world today.
The first stock index futures contract was traded at Kansas City Board of
Trade. Currently the most popular stock index futures contract in the world is
based on S&P 500 index, traded on Chicago Mercantile Exchange. During the
Mid eighties, financial futures became the most active derivative instruments
Generating volumes many times more than the commodity futures. Index futures,
futures on T-bills and Euro-Dollar futures are the three most popular Futures
contracts traded today. Other popular international exchanges that trade
derivatives are LIFFE in England, DTB in Germany, SGX in Singapore,TIFFE in Japan, MATIF in France, Eurex etc.,
1
5/13/2018 Derivatives Futures and Options Mba Project - slidepdf.com
http://slidepdf.com/reader/full/derivatives-futures-and-options-mba-project 3/92
Derivatives (Futures & Options)
THE GROWTH OF DERIVATIVES MARKET
Over the last three decades, the derivatives markets have seen a phenomenal
growth. A large variety of derivative contracts have been launched at exchanges
across the world. Some of the factors driving the growth of financial derivatives
are:
Increased volatility in asset prices in financial markets,
Increased integration of national financial markets with the
international markets,
Marked improvement in communication facilities and sharp decline in
their costs,
Development of more sophisticated risk management tools, providing
economic agents a wider choice of risk management strategies, and
Innovations in the derivatives markets, which optimally combine the
risks and returns over a large number of financial assets leading to
higher returns, reduced risk as well as transactions costs as compared
to individual financial assets.
1
5/13/2018 Derivatives Futures and Options Mba Project - slidepdf.com
http://slidepdf.com/reader/full/derivatives-futures-and-options-mba-project 4/92
Derivatives (Futures & Options)
DERIVATIVE PRODUCTS (TYPES)
The following are the various types of derivatives. They are:
Forwards:A forward contract is a customized contract between two entities, where settlement
takes place on a specific date in the future at today’s pre-agreed price.
Futures:
A futures contract is an agreement between two parties to buy or sell an asset at a
certain time in the future at a certain price. Futures contracts are special types of forward contracts in the sense that the former are standardized exchange-traded
contracts.
Options:
Options are of two types-calls and puts. Calls give the buyer the right but not the
obligation to buy a given quantity of the underlying asset, at a given price on or
before a given future date. Puts give the buyer the right, but not the obligation to
sell a given quantity of the underlying asset at a given price on or before a given
date.
Warrants:
Options generally have lives of upto one year; the majority of options traded on
options exchanges having a maximum maturity of nine months. Longer-dated
options are called warrants and are generally traded Over-the-counter.
Leaps:The acronym LEAPS means Long-Term Equity Anticipation Securities. These are
options having a maturity of upto three years.
1
5/13/2018 Derivatives Futures and Options Mba Project - slidepdf.com
http://slidepdf.com/reader/full/derivatives-futures-and-options-mba-project 5/92
Derivatives (Futures & Options)
Baskets:
Basket options are options on portfolio of underlying assets. The underlying asset
is usually a moving average of a basket of assets. Equity index options are a form
of basket options.
Swaps:
Swaps are private agreement between two parties to exchange cash flows in the
future according to a prearranged formula. They can be regarded as portfolios of
forward contracts. The two commonly used swaps are:
Interest rate swaps:
The entail swapping only the interest related cash flows between the parties in the
same currency.
Currency swaps:
These entail swapping both principal and interest between the parties, with the
cashflows in one direction being in a different currency than those in the opposite
direction.
Swaptions:
Swaptions are options to buy or sell a swap that will become operative at the
expiry of the options. Thus a swaption is an option on a forward swap. Rather than
have calls and puts, the swaptions market has receiver swaptions and payer
swaptions. A receiver swaption is an option to receive fixed and pay floating. A
payer swaption is an option to pay fixed and received floating.
1
5/13/2018 Derivatives Futures and Options Mba Project - slidepdf.com
http://slidepdf.com/reader/full/derivatives-futures-and-options-mba-project 6/92
Derivatives (Futures & Options)
PARTICIPANTS IN THE DERRIVATIVES MARKETS
The following three broad categories of participants:
HEDGERS:Hedgers face risk associated with the price of an asset. They use futures or options
markets to reduce or eliminate this risk.
SPECULATORS:
Speculators wish to bet on future movements in the price of an asset. Futures and
options contracts can give them an extra leverage; that is, they can increase both
the potential gains and potential losses in a speculative venture.ARBITRAGEURS:
Arbitrageurs are in business to take advantage of a discrepancy between prices in
two different markets. If, for example they see the futures prices of an asset
getting out of line with the cash price, they will take offsetting positions in the two
markets to lock in a profit.
FUNCTIONS OF THE DERIVATIVES MARKET
In spite of the fear and criticism with which the derivative markets are commonly
looked at, these markets perform a number of economic functions.
Price in an organized derivative markets reflect the perception of market
participants about the future and lead the prices of underlying to the
perceived future level. The prices of derivatives converge with the
prices of the underlying at the
Expiration of the derivative contract. Thus derivatives help in
discovery of future as well as current prices.
The derivative markets helps to transfer risks from those who have them
but may not like them to those who have an appetite for them.
1
5/13/2018 Derivatives Futures and Options Mba Project - slidepdf.com
http://slidepdf.com/reader/full/derivatives-futures-and-options-mba-project 7/92
Derivatives (Futures & Options)
Derivative due to their inherent nature, are linked to the underlying cash
markets. With the introduction of derivatives, the underlying market
witness higher trading volumes because of participation by more players
who would not otherwise participate for lack of an arrangement to
transfer risk.
Speculative trades shift to a more controlled environment of derivatives
market. In the absence of an organized derivatives market, speculators
trade in the underlying cash markets. Margining, monitoring and
surveillance of the activities of various participants become extremely
difficult in these kinds of mixed markets.
An important incidental benefit that flows from derivatives trading is
that it acts as a catalyst for new entrepreneurial activity. The derivatives
have a history of attracting many bright, creative, Well-educated people
with an entrepreneurial attitude. They often energize others to create
new businesses, new products and new employment opportunities, the
benefit of which are immense.
SCOPE OF THE STUDY
The Study is limited to “Derivatives” with special reference to futures and
Option in the Indian context and the Inter-Connected Stock Exchange have been
Taken as a representative sample for the study. The study can’t be said as totally
perfect. Any alteration may come. The study has only made a humble Attempt at
evaluation derivatives market only in India context. The study is not Based on the
international perspective of derivatives markets, which exists in NASDAQ, CBOT
etc.,
1
5/13/2018 Derivatives Futures and Options Mba Project - slidepdf.com
http://slidepdf.com/reader/full/derivatives-futures-and-options-mba-project 8/92
Derivatives (Futures & Options)
OBJECTIVES OF THE STUDY
To analyze the derivatives market in India.
To analyze the operations of futures and options.
To find the profit/loss position of futures buyer and also
The option writer and option holder.
To study about risk management with the help of derivatives.
LIMITATIONS OF THE STUDY
The following are the limitation of this study.
The scrip chosen for analysis is OIL & NATURAL GASCORPORATION LTD and the contract taken is March 2007
ending one-month contract.
The data collected is completely restricted to the OIL &
NATURAL GAS CORPORATION LTD of March 2007; hence
this analysis cannot be taken universal.
1
5/13/2018 Derivatives Futures and Options Mba Project - slidepdf.com
http://slidepdf.com/reader/full/derivatives-futures-and-options-mba-project 9/92
Derivatives (Futures & Options)
NATURE OF THE PROBLEM
The turnover of the stock exchange has been tremendously increasing form Last
10 years. The number of trades and the number of investors, who are participating,
have increased. The investors are willing to reduce their risk, so they are seeking
for the risk management tools.
Prior to SEBI abolishing the BADLA system, the investors had this system as a
source of reducing the risk, as it has many problems like no strong margining
System, unclear expiration date and generating counter party risk. In view of this problem SEBI abolished the BADLA system.
After the abolition of the BADLA system, the investors are seeking for a
Hedging system, which could reduce their portfolio risk. SEBI thought the
Introduction of the derivatives trading, as a first step it has set up a 24 member
Committee under the chairmanship of Dr.L.C.Gupta to develop the appropriate
Framework for derivatives trading in India, SEBI accepted the recommendation of
the committee on May 11, 1998 and approved the phase introduction of the
Derivatives trading beginning with stock index futures.
There are many investors who are willing to trade in the derivatives segment,
Because of its advantages like limited loss unlimited profit by paying the small
Premiums.
THE DEVELOPMENT OF DERIVATIVES MARKETHolding portfolios of Securities is associated with the risk of the possibility that the
investor may realize his returns, which would be much lesser than what he
expected to get. There are various factors, which affect the returns:
1. Price or dividend (interest)
1
5/13/2018 Derivatives Futures and Options Mba Project - slidepdf.com
http://slidepdf.com/reader/full/derivatives-futures-and-options-mba-project 10/92
Derivatives (Futures & Options)
2. Some are internal to the firm like
• Industrial policy
• Management capabilities
• Consumer’s preference
• Labor strike, etc.,
These forces are to a large extent controllable and are termed as non systematic
risks. An investor can easily manage such non-systematic by having a Well-
diversified portfolio spread across the companies, industries and groups so that a
loss in one may easily be compensated with a gain in other.
There are yet other of influence which are external to the firm, cannot be
controlled and affect large number of securities. They are termed as systematic
Risk. They are:
1. Economic
2. political
3. Sociological changes are sources of systematic risk For instance, inflation, interest rate, etc. Their effect is to cause prices if nearly
All-individual stocks to move together in the same manner. We therefore quite
often find stock prices falling from time to time in spite of company’s earning
rising and vice versa.
Rational Behind the development of derivatives market is to manage this
systematic risk, liquidity in the sense of being able to buy and sell relatively large
amounts quickly without substantial price concession.
In debt market, a large position of the total risk of securities is systematic. Debt
instruments are also finite life securities with limited marketability due to their
small size relative to many common sticks. Those factors favour for the purpose
1
5/13/2018 Derivatives Futures and Options Mba Project - slidepdf.com
http://slidepdf.com/reader/full/derivatives-futures-and-options-mba-project 11/92
Derivatives (Futures & Options)
of both portfolio hedging and speculation, the introduction of a derivatives
securities that is on some broader market rather than an individual security.
GLOBAL DERIVATIVES MARKET
The global financial centers such as Chicago, New York, Tokyo and London
dominate the trading in derivatives. Some of the world’s leading exchanges for the
exchange-traded derivatives are:
Chicago Mercantile exchange (CME) and London
International Financial Futures Exchange (LIFFE) ( for
currency & Interest rate futures)
Philadelphia Stock Exchange(PSE), London Stock Exchange(LSE) & Chicago Board Options Exchange (CBOE) ( for
currency options)
New York Stock Exchange (NYSE) and London Stock
Exchange (LSE) (for equity derivatives)
Chicago Mercantile Exchange(CME) and London Metal
Exchange (LME) ( for Commodities)
These exchanges account for a large portion of the trading volume in the respective
derivatives segment.
NSE’s DERIVATIVES MARKET
The derivatives trading on the NSE commenced with S&P CNX Nifty index
Futures on June 12, 2000. The trading in index options commenced on June 4,
2001 and trading in options on individual securities commenced on July 2, 2001
Single stock futures were launched on November 9, 2001. Today, both in terms of
volume and turnover, NSE is the largest derivatives exchange in India. Currently,
the derivatives contracts have a maximum of 3-month expiration cycles. Three
contracts are available for trading, with 1 month, 2 month and 3 month expiry.
1
5/13/2018 Derivatives Futures and Options Mba Project - slidepdf.com
http://slidepdf.com/reader/full/derivatives-futures-and-options-mba-project 12/92
Derivatives (Futures & Options)
A new contract is introduced on the next trading day following of the near month
contract.
REGULATORY FRAMEWORK The trading of derivatives is governed by the provisions contained in the SC(R)
A, the SEBI Act, the rules and regulations framed there under and the rules and
bye-laws of stock exchanges.
In this chapter we look at the broad regulatory framework for derivatives
trading and the requirement to become a member and an authorized dealer of the
F&O segment and the position limits as they apply to various participants.Regulation for derivatives trading:
SEBI set up a 24-members committee under the Chairmanship of
Dr.L.C.GUPTA to develop the appropriate regulatory framework for derivatives
trading in India. On May 11, 1998 SEBI accepted the recommendations of the
committee and approved the phased introduction of derivatives trading in India
beginning with stock index futures.
The provision in the SC(R) A and the regulatory framework developed there
under govern trading in securities. The amendment of the SC(R) A to include
derivatives within the ambit of “securities” in the SC(R) A made trading in
derivatives possible within the framework of that Act.
Any Exchange fulfilling the eligibility criteria as prescribed in the
L.C.Gupta committee report can apply to SEBI for grant of recognition
under Section 4 of the SC(R) A, 1956 to start trading derivatives. The
derivatives exchange/segment should have a separate governing council
and representation of trading/clearing members shall be limited to
maximum of 40% of the total members of the governing council. The
exchange would have to regulate the sales practices of its members and
1
5/13/2018 Derivatives Futures and Options Mba Project - slidepdf.com
http://slidepdf.com/reader/full/derivatives-futures-and-options-mba-project 13/92
Derivatives (Futures & Options)
would have to obtain prior approval of SEBI before start of trading in
any derivative contract.
The Exchange should have minimum 50 members. The members of an existing segment of the exchange would not
automatically become the members of derivative segment. The
members of the derivative segment would need to fulfill the eligibility
conditions as laid down by the L.C.Gupta committee.
The clearing and settlement of derivatives trades would be through a
SEBI approved clearing corporation/house. Clearingcorporations/houses complying with the eligibility as laid down by the
committee have to apply to SEBI for grant of approval.
Derivatives brokers/dealers and clearing members are required to seek
registration from SEBI. This is in addition to their registration as
brokers of existing stock exchanges. The minimum net worth for
clearing members of the derivatives clearing corporation/house shall be
Rs.300 Lakh. The net worth of the member shall be computed as
follows :
Capital + Free reserves
Less non-allowable assets viz.,
• Fixed assets
• Pledged securities
• Member’s card
• Non-allowable securities ( unlisted securities)
• Bad deliveries
• Doubtful debts and advances
1
5/13/2018 Derivatives Futures and Options Mba Project - slidepdf.com
http://slidepdf.com/reader/full/derivatives-futures-and-options-mba-project 14/92
Derivatives (Futures & Options)
• Prepaid expenses
• Intangible assets
• 30 % marketable securities
The minimum contact value shall not be less than
Rs.2 Lakh. Exchanges have to submit details of the futures contract
they propose to introduce.
The initial margin requirement, exposure limits linked to capital
adequacy and margin demands related to the risk of loss on the
position will be prescribed by SEBI / Exchanged from time to time.
The L.C.Gupta committee report requires strict enforcement of
“Know your customer “rule and requires that every client shall be
registered with the derivatives broker. The members of the derivatives
segment are also required to make their clients aware of the risks
involved in derivatives trading by issuing to the clients the Risk
Disclosure and obtain a copy of the same duly signed by the clients.
The trading members are required to have qualified approved user andsales person who have passed a certification programmed approved by
SEBI.
ELIGIBILITY OF ANY STOCK TO ENTER IN DERIVATIVES MARKET
Non Promoter holding ( free float capitalization ) not less than Rs.750 Crores from last 6 months
Daily Average Trading value not less than 5 Crores in last 6Months
At least 90% of Trading days in last 6 months
Non Promoter Holding at least 30%
1
5/13/2018 Derivatives Futures and Options Mba Project - slidepdf.com
http://slidepdf.com/reader/full/derivatives-futures-and-options-mba-project 15/92
Derivatives (Futures & Options)
BETA not more than 4 ( previous last 6 months )
DESCRIPTION OF THE METHOD
The following are the steps involved in the study.
Selection of the scrip:-
The scrip selection is done on a random and the scrip selected is
OIL & NATURAL GAS CORPORATION LTD. The lot is 225. Profitability
position of the futures buyers and seller and also the option holder and option
writers is studied.
Data Collection:-
The data of the ONGC Ltd has been collected from the “the Economic
Times” and the internet. The data consist of the March Contract and period of
Data collection is from 23rd FEBRUARY 2007 - 29th MARCH 2007.
Analysis:-
The analysis consist of the tabulation of the data assessing the profitability
Positions of the futures buyers and sellers and also option holder and the option
Writer, representing the data with graphs and making the interpretation using
Data.
1
5/13/2018 Derivatives Futures and Options Mba Project - slidepdf.com
http://slidepdf.com/reader/full/derivatives-futures-and-options-mba-project 16/92
Derivatives (Futures & Options)
INTRODUCTION OF FUTURES
Futures markets were designed to solve the problems that exist in forward
markets. A futures contract is an agreement between two parties to buy or sell an
asset at a certain time in the future at a certain price. But unlike forward contract,
the futures contracts are standardized and exchange traded. To facilitate liquidity
in the futures contract, the exchange specifies certain standard features of thecontract. It is standardized contract with standard underlying instrument, a
standard quantity and quality of the underlying instrument that can be delivered,
(Or which can be used for reference purpose in settlement) and a standard timing
of such settlement. A futures contract may be offset prior to maturity by entering
into an equal and opposite transaction. More than 90% of futures transactions are
offset this way.
The standardized items in a futures contract are:
• Quantity of the underlying
• Quality of the underlying
• The date and the month of delivery
• The units of price quotation and minimum price change
• Location of settlement
DIFINITION
A Futures contract is an agreement between two parties to buy or sell an
asset at a certain time in the future at a certain price. Futures contracts are special
1
5/13/2018 Derivatives Futures and Options Mba Project - slidepdf.com
http://slidepdf.com/reader/full/derivatives-futures-and-options-mba-project 17/92
Derivatives (Futures & Options)
types of forward contracts in the sense that the former are standardized exchange-
traded contracts.
HISTORY OF FUTURES
Merton Miller, the 1990 Nobel Laureate had said that “financial futures
represent the most significant financial innovation of the last twenty years.” The
first exchange that traded financial derivatives was launched in Chicago in theyear 1972. A division of the Chicago Mercantile Exchange, it was called the
international monetary market (IMM) and traded currency futures. The brain
behind this was a man called Leo Melamed, acknowledged as the “father of
financial futures” who was then the Chairman of the Chicago Mercantile
Exchange. Before IMM opened in 1972, the Chicago Mercantile Exchange sold
contracts whose value was counted in millions. By 1990, the underlying value of
all contracts traded at the Chicago Mercantile Exchange totaled 50 trillion dollars.
These currency futures paved the way for the successful marketing of a
dizzying array of similar products at the Chicago Mercantile Exchange, the
Chicago Board of Trade and the Chicago Board Options Exchange. By the 1990s,
these exchanges were trading futures and options on everything from Asian and
American stock indexes to interest-rate swaps, and their success transformed
Chicago almost overnight into the risk-transfer capital of the world.
1
5/13/2018 Derivatives Futures and Options Mba Project - slidepdf.com
http://slidepdf.com/reader/full/derivatives-futures-and-options-mba-project 18/92
Derivatives (Futures & Options)
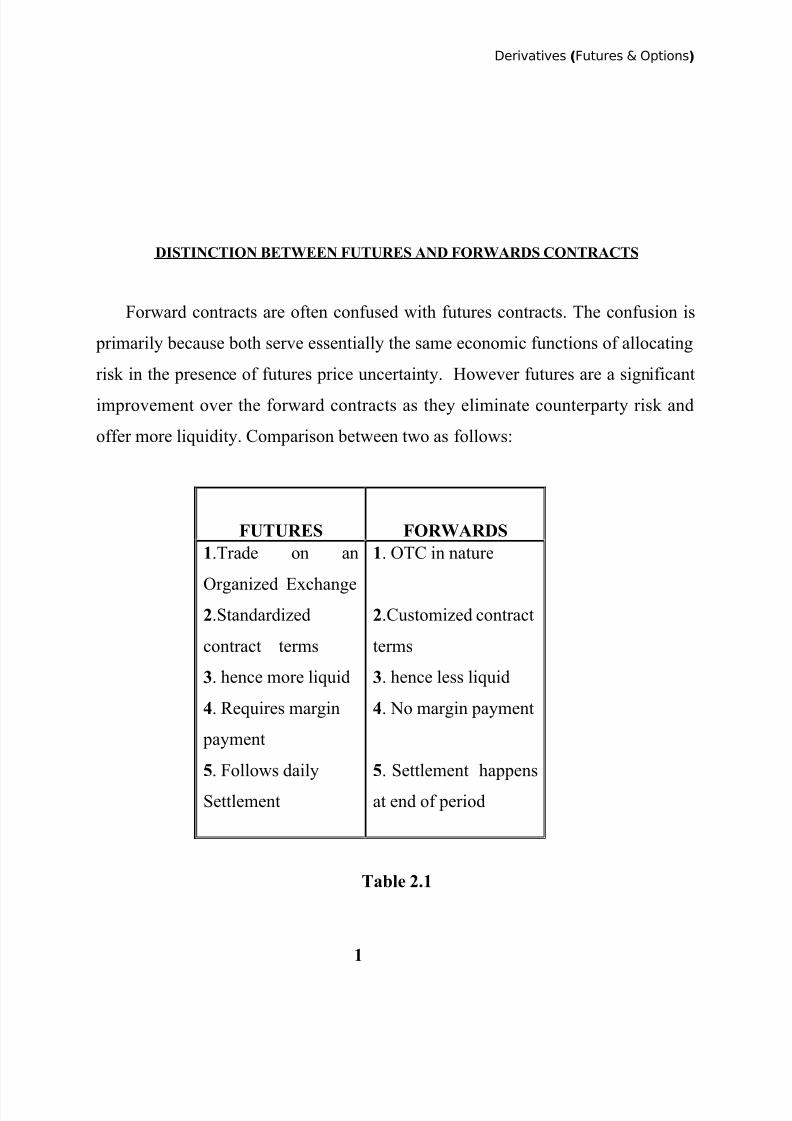
DISTINCTION BETWEEN FUTURES AND FORWARDS CONTRACTS
Forward contracts are often confused with futures contracts. The confusion is
primarily because both serve essentially the same economic functions of allocating
risk in the presence of futures price uncertainty. However futures are a significant
improvement over the forward contracts as they eliminate counterparty risk and
offer more liquidity. Comparison between two as follows:
FUTURES FORWARDS1.Trade on an
Organized Exchange
2.Standardized
contract terms
3. hence more liquid
4. Requires margin
payment
5. Follows daily
Settlement
1. OTC in nature
2.Customized contract
terms
3. hence less liquid
4. No margin payment
5. Settlement happens
at end of period
Table 2.1
1
5/13/2018 Derivatives Futures and Options Mba Project - slidepdf.com
http://slidepdf.com/reader/full/derivatives-futures-and-options-mba-project 19/92
Derivatives (Futures & Options)
FEATURES OF FUTURES
• Futures are highly standardized.
• The contracting parties need not pay any down payment.
• Hedging of price risks.
• They have secondary markets too.
TYPES OF FUTURES
On the basis of the underlying asset they derive, the futures are divided into two
types:
•
Stock Futures• Index Futures
PARTIES IN THE FUTURES CONTRACT
There are two parties in a futures contract, the buyers and the seller. The buyer
of the futures contract is one who is LONG on the futures contract and the seller of
the futures contract is who is SHORT on the futures contract.
The pay-off for the buyers and the seller of the futures of the contracts are as
follows:
1
5/13/2018 Derivatives Futures and Options Mba Project - slidepdf.com
http://slidepdf.com/reader/full/derivatives-futures-and-options-mba-project 20/92
Derivatives (Futures & Options)
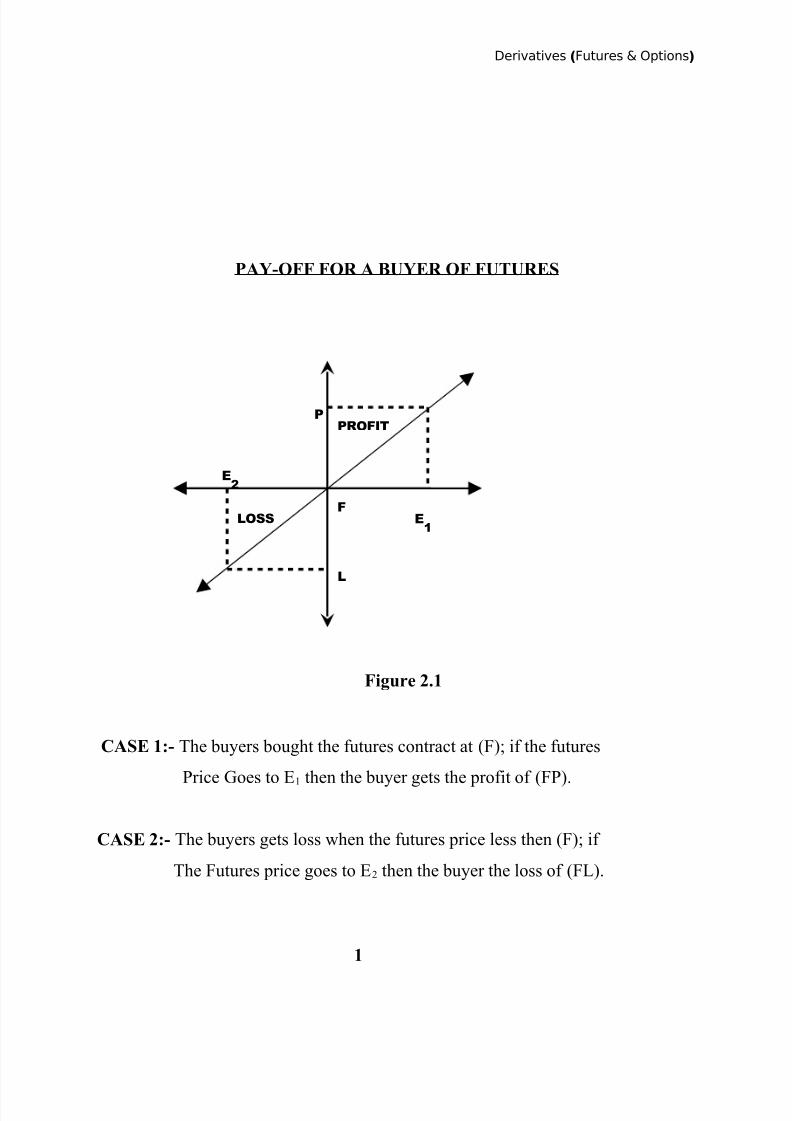
PAY-OFF FOR A BUYER OF FUTURES
Figure 2.1
CASE 1:- The buyers bought the futures contract at (F); if the futures
Price Goes to E1 then the buyer gets the profit of (FP).
CASE 2:- The buyers gets loss when the futures price less then (F); if
The Futures price goes to E2 then the buyer the loss of (FL).
LOSS
PROFIT
F
L
P
E1
E2
1
5/13/2018 Derivatives Futures and Options Mba Project - slidepdf.com
http://slidepdf.com/reader/full/derivatives-futures-and-options-mba-project 21/92
Derivatives (Futures & Options)
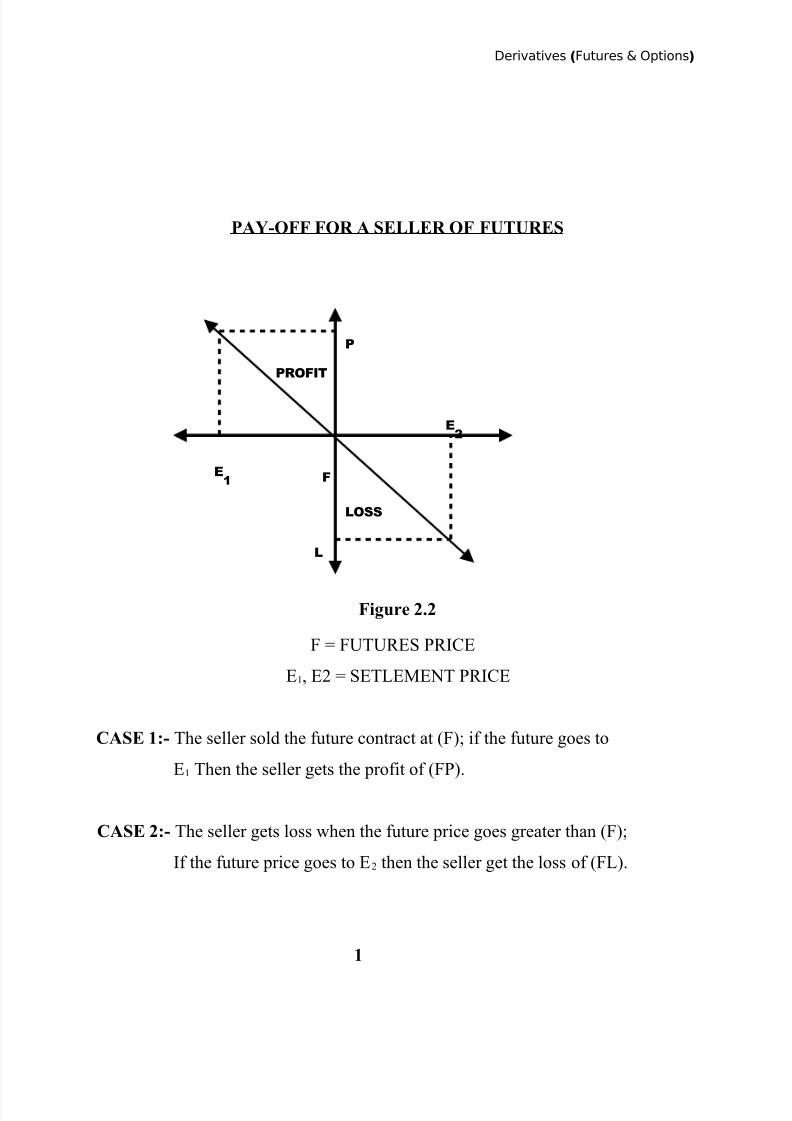
PAY-OFF FOR A SELLER OF FUTURES
Figure 2.2
F = FUTURES PRICE
E1, E2 = SETLEMENT PRICE
CASE 1:- The seller sold the future contract at (F); if the future goes to
E1 Then the seller gets the profit of (FP).
CASE 2:- The seller gets loss when the future price goes greater than (F);
If the future price goes to E2 then the seller get the loss of (FL).
F
LOSS
PROFIT
E1
P
E2
L
1
5/13/2018 Derivatives Futures and Options Mba Project - slidepdf.com
http://slidepdf.com/reader/full/derivatives-futures-and-options-mba-project 22/92
Derivatives (Futures & Options)
MARGINS
Margins are the deposits which reduce counter party risk, arise in a futures
contract. These margins are collect in order to eliminate the counter party risk.
There are three types of margins:
Initial Margins:-
Whenever a future contract is signed, both buyer and seller are required to postinitial margins. Both buyers and seller are required to make security deposits that
are intended to guarantee that they will infect be able to fulfill their obligation.
These deposits are initial margins and they are often referred as purchase price of
futures contract.
Mark to market margins:-
The process of adjusting the equity in an investor’s account in order to reflect the
change in the settlement price of futures contract is known as MTM margin.
Maintenance margin:-
The investor must keep the futures account equity equal to or greater than certain
percentage of the amount deposited as initial margin. If the equity goes less than
that percentage of initial margin, then the investor receives a call for an additional
deposit of cash known as maintenance margin to bring the equity up to the initial
margin.
ROLE OF MARGINS
The role of margins in the futures contract is explained in the following example:
Siva Rama Krishna sold an ONGC July futures contract to Nagesh at Rs.600; the
following table shows the effect of margins on the Contract. The contract size of
1
5/13/2018 Derivatives Futures and Options Mba Project - slidepdf.com
http://slidepdf.com/reader/full/derivatives-futures-and-options-mba-project 23/92
Derivatives (Futures & Options)
ONGC is 1800. The initial margin amount is say Rs. 30,000 the maintenance
margin is 65% of initial margin.
PRICING FUTURES
Pricing of futures contract is very simple. Using the cost-of-carry logic, we
calculate the fair value of a future contract. Every time the observed price deviates
from the fair value, arbitragers would enter into trades to captures the arbitrage
profit. This in turn would push the futures price back to its fair value. The cost of
carry model used for pricing futures is given below.
F = SerT
Where:
F = Futures price
S = Spot Price of the Underlying
r = Cost of financing (using continuously compounded
Interest rate)
T = Time till expiration in years
e = 2.71828
(OR)
F = S (1+r- q) t
Where:
F = Futures price
S = Spot price of the underlying
r = Cost of financing (or) interest Rate
q = Expected dividend yield
1
5/13/2018 Derivatives Futures and Options Mba Project - slidepdf.com
http://slidepdf.com/reader/full/derivatives-futures-and-options-mba-project 24/92
Derivatives (Futures & Options)
t = Holding Period
FUTURES TERMINOLOGY
Spot price:
The price at which an asset trades in the spot market.
Futures Price:
The price at which the futures contract trades in the futures market.
Contract cycle:The period over which a contract trades. The index futures contracts on the NSE
have one-month and three-month expiry cycles which expire on the last
Thursday of the month. Thus a January expiration contract expires on the last
Thursday of January and a February expiration contract ceases trading on the last
Thursday of February. On the Friday following the last Thursday, a new contract
having a three-month expiry is introduced for trading.
Expiry date:
It is the date specified in the futures contract. This is the last day on which the
contract will be traded, at the end of which it will cease to exist.
Contract size:
The amount of asset that has to be delivered under one contract. For instance, the
contract size on NSE’s futures markets is 200 Nifties.
Basis:In the context of financial futures, basis can be defined as the futures price minus
the spot price. These will be a different basis for each delivery month for each
contract. In a normal market, basis will be positive. This reflects that futures prices
normally exceed spot prices.
1

5/13/2018 Derivatives Futures and Options Mba Project - slidepdf.com
http://slidepdf.com/reader/full/derivatives-futures-and-options-mba-project 25/92
Derivatives (Futures & Options)
Cost of carry:
The relationship between futures prices and spot prices can be summarized in
terms of what is known as the cost of carry. This measures the storage cost plus
the interest that is paid to finance the asset less the income earned on the asset.
Initial margin:
The amount that must be deposited in the margin account at the time a futurescontract is first entered into is known as initial margin.
Marking-to-market:
In the futures market, at the end of each trading day, the margin account is adjusted
to reflect the investor’s gain or loss depending upon the futures closing price. This
is called marking-to-market.
Maintenance margin:
This is some what lower than the initial margin. This is set to ensure that the
balance in the margin account never becomes negative. If the balance in the
margin account falls below the maintenance margin, the investor receives a margin
call and is expected to top up the margin account to the initial margin level before
trading commences on the next day.
1
5/13/2018 Derivatives Futures and Options Mba Project - slidepdf.com
http://slidepdf.com/reader/full/derivatives-futures-and-options-mba-project 26/92
Derivatives (Futures & Options)
INTRODUCTION TO OPTIONS
In this section, we look at the next derivative product to be traded on the NSE,
namely options. Options are fundamentally different from forward and futures
contracts. An option gives the holder of the option the right to do something. The
holder does not have to exercise this right. In contrast, in a forward or futurescontract, the two parties have committed themselves to doing something. Whereas
it costs nothing (except margin requirement) to enter into a futures contracts, the
purchase of an option requires as up-front payment.
DEFINITION
Options are of two types- calls and puts. Calls give the buyer the right but not
the obligation to buy a given quantity of the underlying asset, at a given price on or
before a given future date. Puts give the buyers the right, but not the obligation to
sell a given quantity of the underlying asset at a given price on or before a given
date.
HISTORY OF OPTIONS
Although options have existed for a long time, they we traded OTC, without
much knowledge of valuation. The first trading in options began in Europe and
the US as early as the seventeenth century. It was only in the early 1900s that a
group of firms set up what was known as the put and call Brokers and Dealers
Association with the aim of providing a mechanism for bringing buyers and sellers
together. If someone wanted to buy an option, he or she would contact one of the
member firms. The firms would then attempt to find a seller or writer of the option
1
5/13/2018 Derivatives Futures and Options Mba Project - slidepdf.com
http://slidepdf.com/reader/full/derivatives-futures-and-options-mba-project 27/92
Derivatives (Futures & Options)
either from its own clients of those of other member firms. If no seller could be
found, the firm would undertake to write the option itself in return for a price.
This market however suffered form two deficiencies. First, there was no
secondary market and second, there was no mechanism to guarantee that the writer
of the option would honour the contract. In 1973, Black , Merton and scholes
invented the famed Black-Scholes formula. In April 1973, CBOE was set up
specifically for the purpose of trading options. The market for option developed so
rapidly that by early’ 80s, the number of shares underlying the option contract sold
each day exceeded the daily volume of shares traded on the NYSE. Since then,
there has been no looking back.Option made their first major mark in financial history during the tulip-bulb
mania in seventeenth-century Holland. It was one of the most spectacular get
rich quick brings in history. The first tulip was brought Into Holland by a botany
professor from Vienna. Over a decade, the tulip became the most popular and
expensive item in Dutch gardens. The more popular they became, the more Tulip
bulb prices began rising. That was when options came into the picture. They were
initially used for hedging. By purchasing a call option on tulip bulbs, a dealer who
was committed to a sales contract could be assured of obtaining a fixed number of
bulbs for a set price. Similarly, tulip-bulb growers could assure themselves of
selling their bulbs at a set price by purchasing put options. Later, however, options
were increasingly used by speculators who found that call options were an
effective vehicle for obtaining maximum possible gains on investment. As long as
tulip prices continued to skyrocket, a call buyer would realize returns far in excess
of those that could be obtained by purchasing tulip bulbs themselves. The writers
of the put options also prospered as bulb prices spiraled since writers were able to
keep the premiums and the options were never exercised. The tulip-bulb market
collapsed in 1636 and a lot of speculators lost huge sums of money. Hardest hit
1
5/13/2018 Derivatives Futures and Options Mba Project - slidepdf.com
http://slidepdf.com/reader/full/derivatives-futures-and-options-mba-project 28/92
Derivatives (Futures & Options)
were put writers who were unable to meet their commitments to purchase Tulip
bulbs.
PROPERTIES OF OPTION
Options have several unique properties that set them apart from other securities.
The following are the properties of option:
• Limited Loss
• High leverages potential
• Limited Life
PARTIES IN AN OPTION CONTRACT
There are two participants in Option Contract.
Buyer/Holder/Owner of an Option:
The Buyer of an Option is the one who by paying the option premium buys the
right but not the obligation to exercise his option on the seller/writer.
Seller/writer of an Option:
The writer of a call/put option is the one who receives the option premium and is
thereby obliged to sell/buy the asset if the buyer exercises on him.
TYPES OF OPTIONS
The Options are classified into various types on the basis of various variables. The
following are the various types of options.
1. On the basis of the underlying asset:On the basis of the underlying asset the option are divided in to two types:
Index options:
1
5/13/2018 Derivatives Futures and Options Mba Project - slidepdf.com
http://slidepdf.com/reader/full/derivatives-futures-and-options-mba-project 29/92
Derivatives (Futures & Options)
These options have the index as the underlying. Some options are European
while others are American. Like index futures contracts, index options contracts
are also cash settled.
Stock options:
Stock Options are options on individual stocks. Options currently trade on over
500 stocks in the United States. A contract gives the holder the right to buy or sell
shares at the specified price.2. On the basis of the market movements :
On the basis of the market movements the option are divided into two types. They
are:
Call Option:
A call Option gives the holder the right but not the obligation to buy an asset by a
certain date for a certain price. It is brought by an investor when he seems that the
stock price moves upwards.
Put Option:
A put option gives the holder the right but not the obligation to sell an asset by a
certain date for a certain price. It is bought by an investor when he seems that the
stock price moves downwards.
3. On the basis of exercise of option: On the basis of the exercise of the Option, the options are classified into two
Categories.
American Option:
1
5/13/2018 Derivatives Futures and Options Mba Project - slidepdf.com
http://slidepdf.com/reader/full/derivatives-futures-and-options-mba-project 30/92
Derivatives (Futures & Options)
American options are options that can be exercised at any time up to the expiration
date. Most exchange –traded options are American.
European Option:
European options are options that can be exercised only on the expiration date
itself. European options are easier to analyze than American options, and
properties of an American option are frequently deduced from those of its
European counterpart.
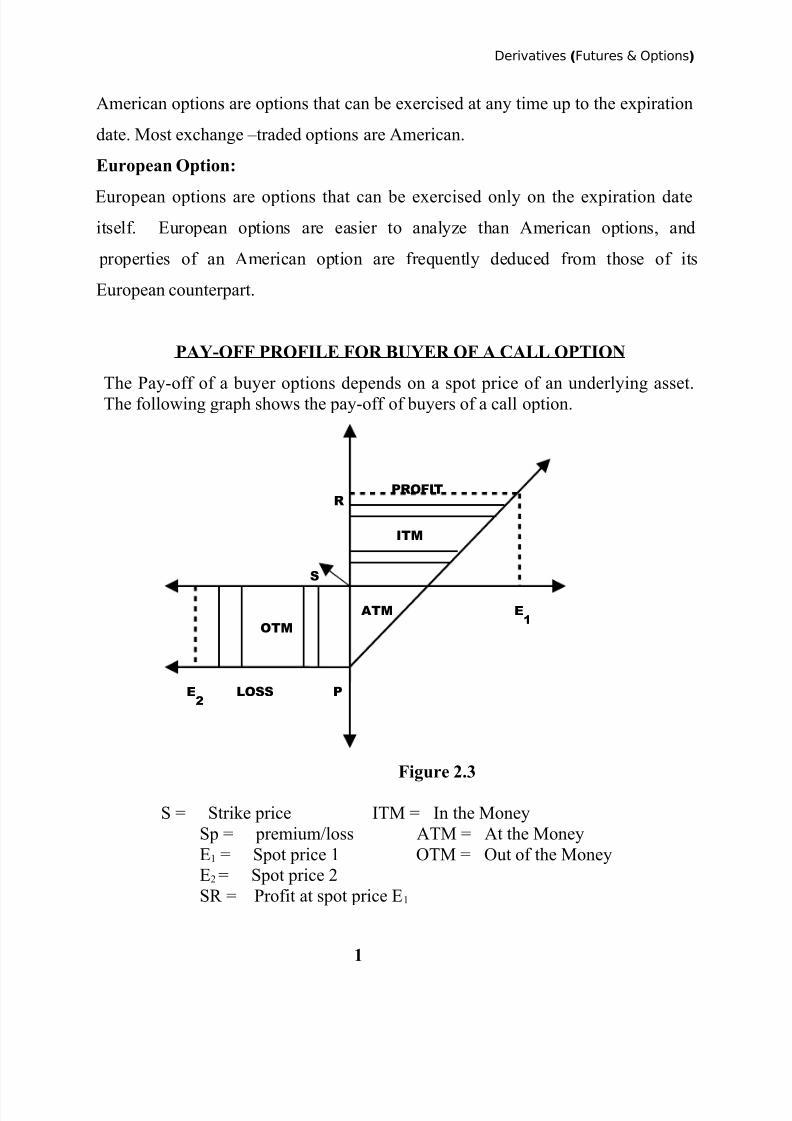
PAY-OFF PROFILE FOR BUYER OF A CALL OPTION
The Pay-off of a buyer options depends on a spot price of an underlying asset.The following graph shows the pay-off of buyers of a call option.
Figure 2.3
S = Strike price ITM = In the Money
Sp = premium/loss ATM = At the Money
E1 = Spot price 1 OTM = Out of the Money
E2 = Spot price 2
SR = Profit at spot price E1
OTM
LOSS
S
PE2
RPROFIT
ITM
ATM E1
1
5/13/2018 Derivatives Futures and Options Mba Project - slidepdf.com
http://slidepdf.com/reader/full/derivatives-futures-and-options-mba-project 31/92
Derivatives (Futures & Options)
CASE 1: (Spot Price > Strike price)
As the Spot price (E1) of the underlying asset is more than strike price (S).
The buyer gets profit of (SR), if price increases more than E 1 then profit also
increase more than (SR)
CASE 2: (Spot Price < Strike Price)
As a spot price (E2) of the underlying asset is less than strike price (S)
The buyer gets loss of (SP); if price goes down less than E2 then also his loss is
limited to his premium (SP)
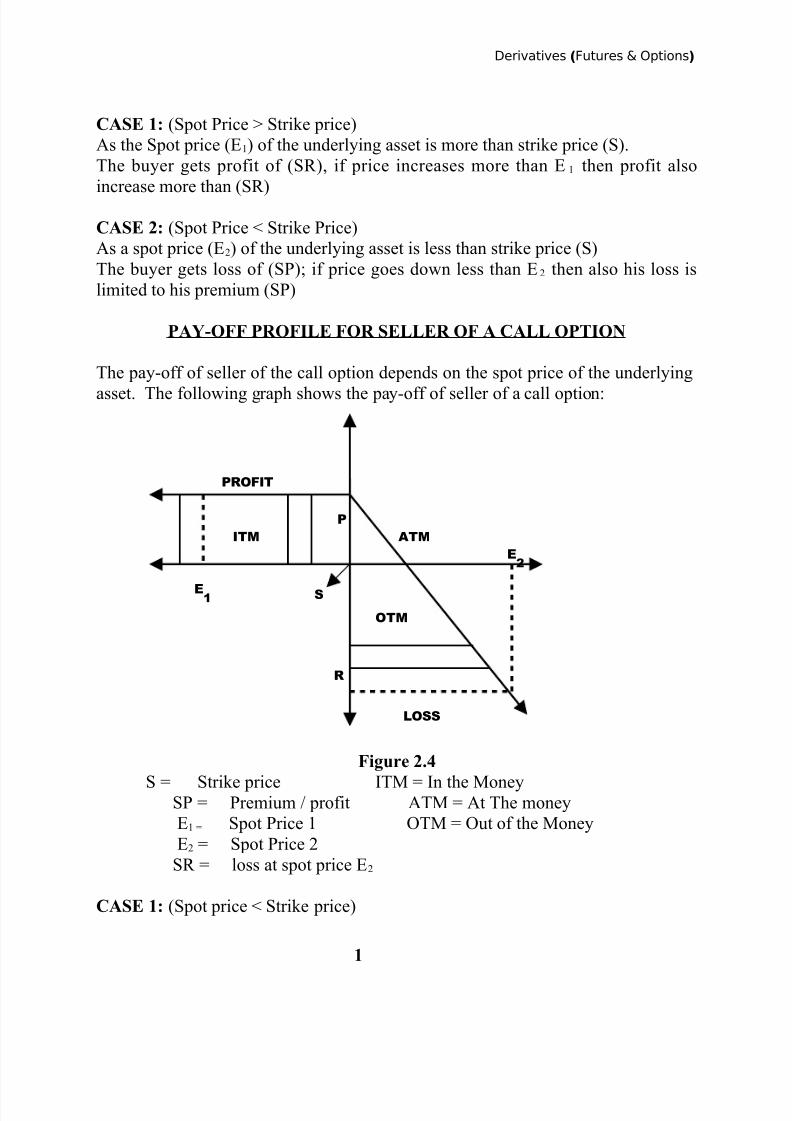
PAY-OFF PROFILE FOR SELLER OF A CALL OPTION
The pay-off of seller of the call option depends on the spot price of the underlying
asset. The following graph shows the pay-off of seller of a call option:
Figure 2.4
S = Strike price ITM = In the MoneySP = Premium / profit ATM = At The money
E1 = Spot Price 1 OTM = Out of the Money
E2 = Spot Price 2
SR = loss at spot price E2
CASE 1: (Spot price < Strike price)
ITM
PROFIT
E1
P
S
ATM
E2
OTM
R
LOSS
1
5/13/2018 Derivatives Futures and Options Mba Project - slidepdf.com
http://slidepdf.com/reader/full/derivatives-futures-and-options-mba-project 32/92
Derivatives (Futures & Options)
As the spot price (E1) of the underlying is less than strike price (S). The seller gets
the profit of (SP), if the price decreases less than E1 then also profit of the seller
does not exceed (SP).
CASE 2: (Spot price > Strike price)As the spot price (E2) of the underlying asset is more than strike price (S) the Seller
gets loss of (SR), if price goes more than E2 then the loss of the seller also increase
more than (SR).
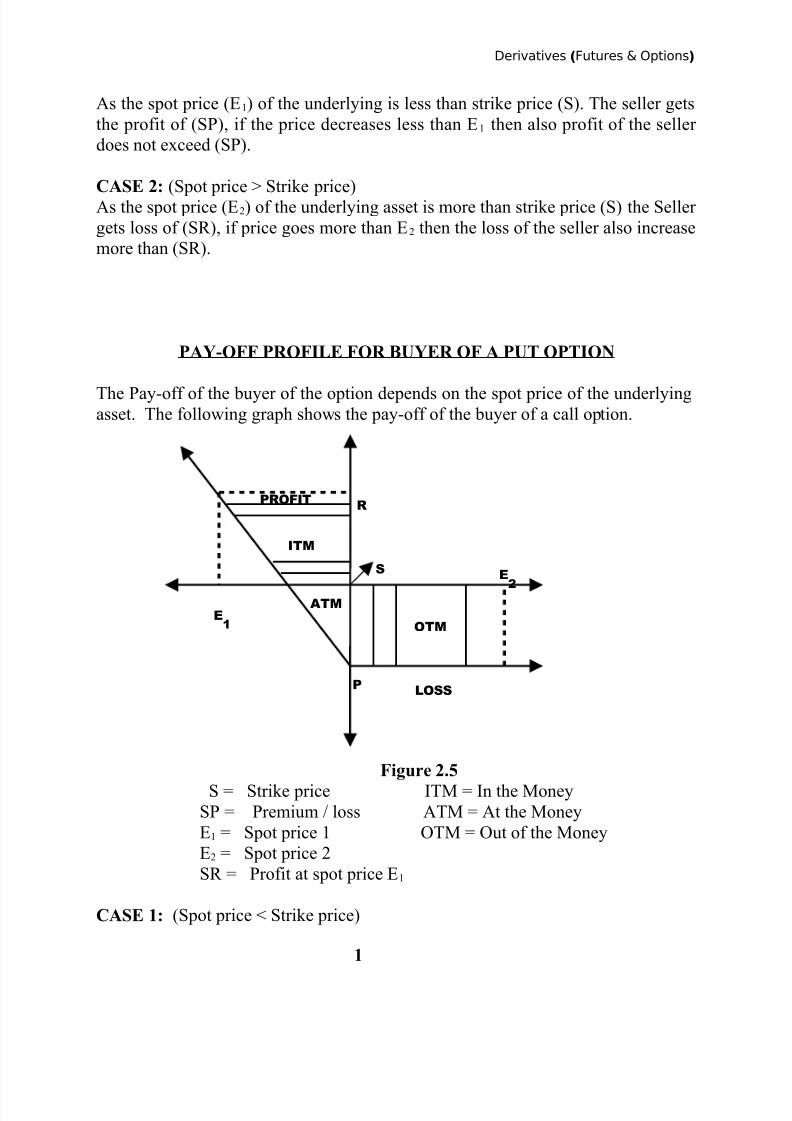
PAY-OFF PROFILE FOR BUYER OF A PUT OPTION
The Pay-off of the buyer of the option depends on the spot price of the underlyingasset. The following graph shows the pay-off of the buyer of a call option.
Figure 2.5S = Strike price ITM = In the Money
SP = Premium / loss ATM = At the Money
E1 = Spot price 1 OTM = Out of the Money
E2 = Spot price 2
SR = Profit at spot price E1
CASE 1: (Spot price < Strike price)
PROFIT
ITM
R
E1
ATM
P LOSS
OTM
E
2
S
1
5/13/2018 Derivatives Futures and Options Mba Project - slidepdf.com
http://slidepdf.com/reader/full/derivatives-futures-and-options-mba-project 33/92
Derivatives (Futures & Options)
As the spot price (E1) of the underlying asset is less than strike price (S). The buyer
gets the profit (SR), if price decreases less than E1 then profit also increases more
than (SR).
CASE 2: (Spot price > Strike price)As the spot price (E2) of the underlying asset is more than strike price (S),
The buyer gets loss of (SP), if price goes more than E 2 than the loss of the buyer is
limited to his premium (SP).
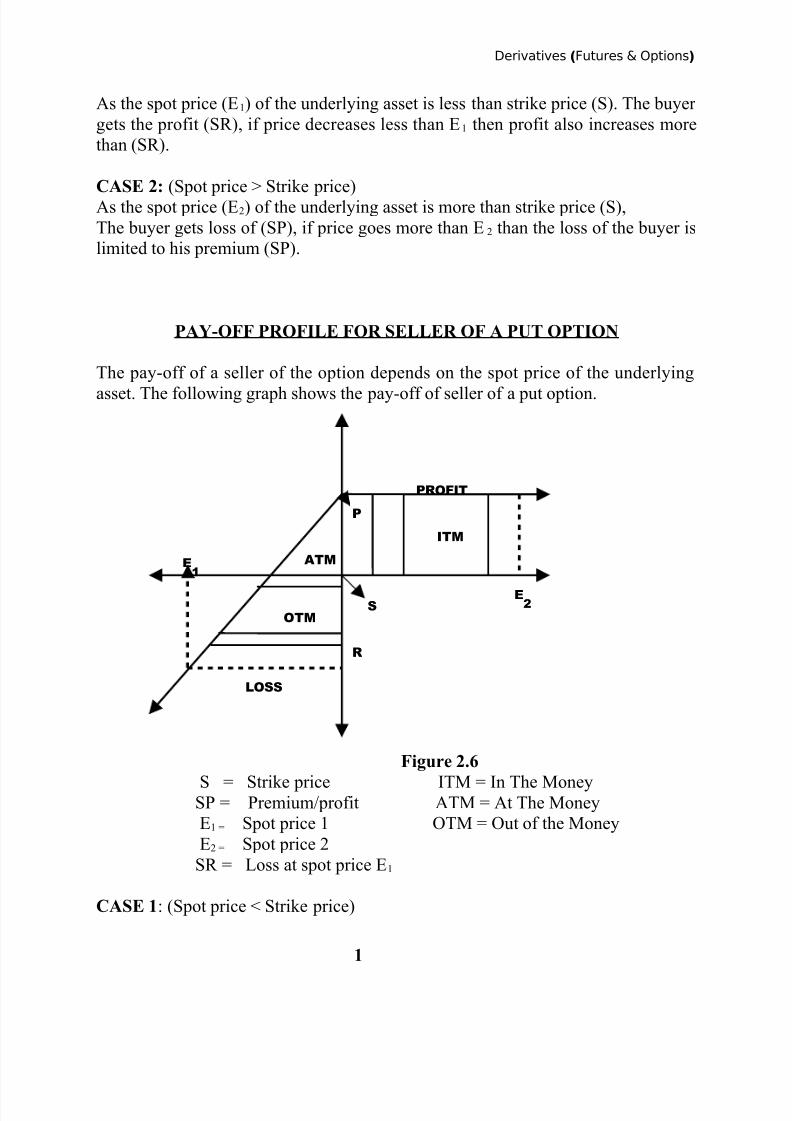
PAY-OFF PROFILE FOR SELLER OF A PUT OPTION
The pay-off of a seller of the option depends on the spot price of the underlying
asset. The following graph shows the pay-off of seller of a put option.
Figure 2.6
S = Strike price ITM = In The MoneySP = Premium/profit ATM = At The Money
E1 = Spot price 1 OTM = Out of the Money
E2 = Spot price 2
SR = Loss at spot price E1
CASE 1: (Spot price < Strike price)
LOSS
OTM
R
S
E1
P
PROFIT
ITM
ATM
E2
1
5/13/2018 Derivatives Futures and Options Mba Project - slidepdf.com
http://slidepdf.com/reader/full/derivatives-futures-and-options-mba-project 34/92
Derivatives (Futures & Options)
As the spot price (E1) of the underlying asset is less than strike price (S), the seller
gets the loss of (SR), if price decreases less than E1 than the loss also increases
more than (SR).
CASE 2: (Spot price > Strike price)As the spot price (E2) of the underlying asset is more than strike price (S), the seller
gets profit of (SP), of price goes more than E2 than the profit of seller is limited to
his premium (SP).
FACTORS AFFECTING THE PRICE OF AN OPTION
The following are the various factors that affect the price of an option they are:
Stock Price:The pay-off from a call option is an amount by which the stock price exceeds the
strike price. Call options therefore become more valuable as the stock price
increases and vice versa. The pay-off from a put option is the amount; by which
the strike price exceeds the stock price. Put options therefore become more
valuable as the stock price increases and vice versa.
Strike price:
In case of a call, as a strike price increases, the stock price has to make a larger
upward move for the option to go in-the –money. Therefore, for a call, as the
strike price increases option becomes less valuable and as strike price decreases,
option become more valuable.
Time to expiration:
Both put and call American options become more valuable as a time to expiration
increases.
Volatility:
The volatility of a stock price is measured of uncertain about future stock price
movements. As volatility increases, the chance that the stock will do very well or
1
5/13/2018 Derivatives Futures and Options Mba Project - slidepdf.com
http://slidepdf.com/reader/full/derivatives-futures-and-options-mba-project 35/92
Derivatives (Futures & Options)
very poor increases. The value of both calls and puts therefore increases as
volatility increase.
Risk- free interest rate:
The put option prices decline as the risk-free rate increases where as the price of
call always increases as the risk-free interest rate increases.
Dividends:
Dividends have the effect of reducing the stock price on the X- dividend rate. Thishas a negative effect on the value of call options and a positive effect on the value
of put options.
PRICING OPTIONS
An option buyer has the right but not the obligation to exercise on the seller.
The worst that can happen to a buyer is the loss of the premium paid by him. His
downside is limited to this premium, but his upside is potentially unlimited. This
optionality is precious and has a value, which is expressed in terms of the option
price. Just like in other free markets, it is the supply and demand in the secondary
market that drives the price of an option.
There are various models which help us get close to the true price of an option.
Most of these are variants of the celebrated Black- Scholes model for pricing
European options. Today most calculators and spread-sheets come with a built-in
Black- Scholes options pricing formula so to price options we don’t really need to
memorize the formula. All we need to know is the variables that go into the
model.
1
5/13/2018 Derivatives Futures and Options Mba Project - slidepdf.com
http://slidepdf.com/reader/full/derivatives-futures-and-options-mba-project 36/92
Derivatives (Futures & Options)
The Black-Scholes formulas for the price of European calls and puts on a non-
dividend paying stock are:
1
5/13/2018 Derivatives Futures and Options Mba Project - slidepdf.com
http://slidepdf.com/reader/full/derivatives-futures-and-options-mba-project 37/92
Derivatives (Futures & Options)
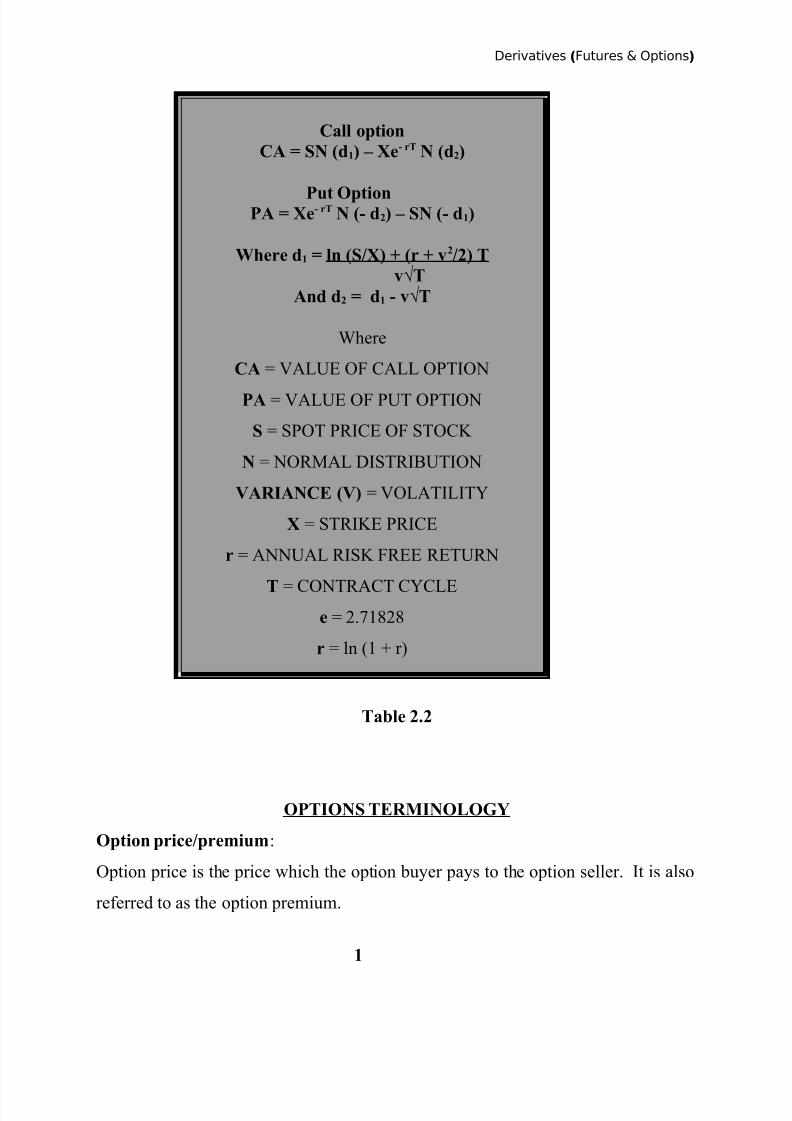
Call optionCA = SN (d1) – Xe- rT N (d2)
Put OptionPA = Xe- rT N (- d2) – SN (- d1)
Where d1 = ln (S/X) + (r + v2/2) Tv√T
And d2 = d1 - v√T
Where
CA = VALUE OF CALL OPTION
PA = VALUE OF PUT OPTION
S = SPOT PRICE OF STOCK
N = NORMAL DISTRIBUTION
VARIANCE (V) = VOLATILITY
X = STRIKE PRICE
r = ANNUAL RISK FREE RETURN
T = CONTRACT CYCLE
e = 2.71828
r = ln (1 + r)
Table 2.2
OPTIONS TERMINOLOGY
Option price/premium:
Option price is the price which the option buyer pays to the option seller. It is also
referred to as the option premium.
1
5/13/2018 Derivatives Futures and Options Mba Project - slidepdf.com
http://slidepdf.com/reader/full/derivatives-futures-and-options-mba-project 38/92
Derivatives (Futures & Options)
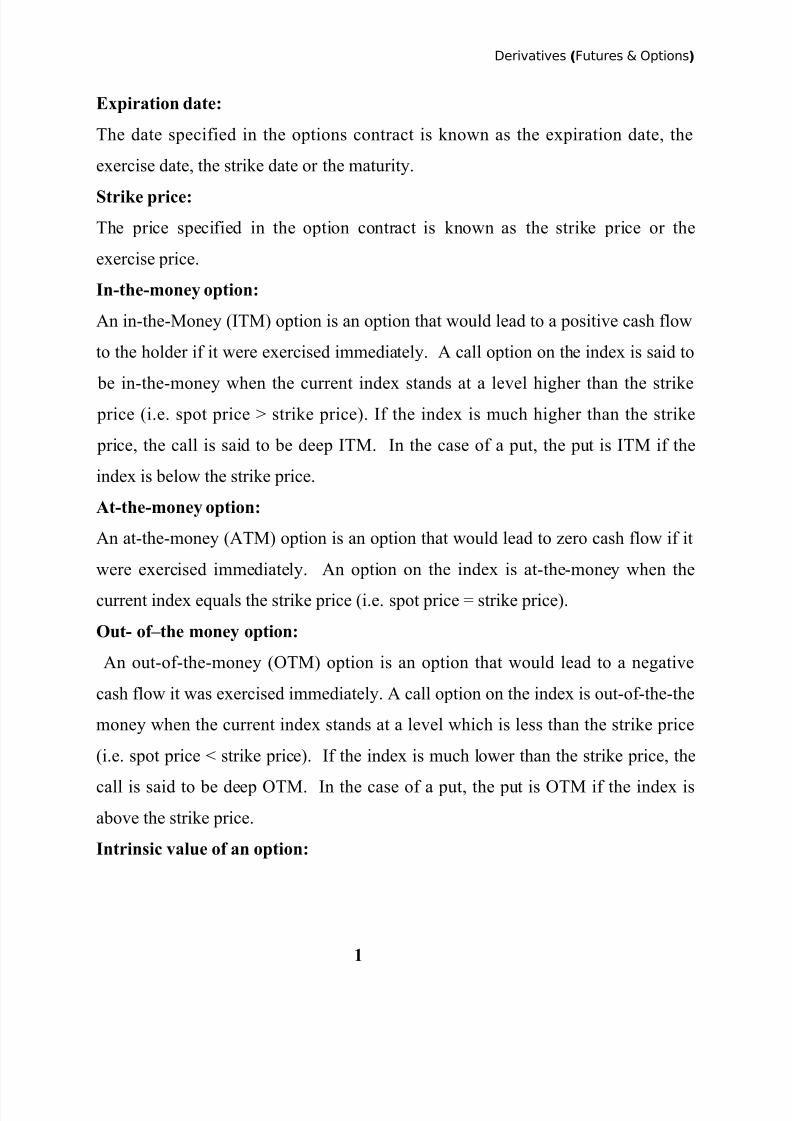
Expiration date:
The date specified in the options contract is known as the expiration date, the
exercise date, the strike date or the maturity.
Strike price:The price specified in the option contract is known as the strike price or the
exercise price.
In-the-money option:
An in-the-Money (ITM) option is an option that would lead to a positive cash flow
to the holder if it were exercised immediately. A call option on the index is said to
be in-the-money when the current index stands at a level higher than the strike price (i.e. spot price > strike price). If the index is much higher than the strike
price, the call is said to be deep ITM. In the case of a put, the put is ITM if the
index is below the strike price.
At-the-money option:
An at-the-money (ATM) option is an option that would lead to zero cash flow if it
were exercised immediately. An option on the index is at-the-money when the
current index equals the strike price (i.e. spot price = strike price).
Out- of–the money option:
An out-of-the-money (OTM) option is an option that would lead to a negative
cash flow it was exercised immediately. A call option on the index is out-of-the-the
money when the current index stands at a level which is less than the strike price
(i.e. spot price < strike price). If the index is much lower than the strike price, the
call is said to be deep OTM. In the case of a put, the put is OTM if the index is
above the strike price.
Intrinsic value of an option:
1
5/13/2018 Derivatives Futures and Options Mba Project - slidepdf.com
http://slidepdf.com/reader/full/derivatives-futures-and-options-mba-project 39/92
Derivatives (Futures & Options)
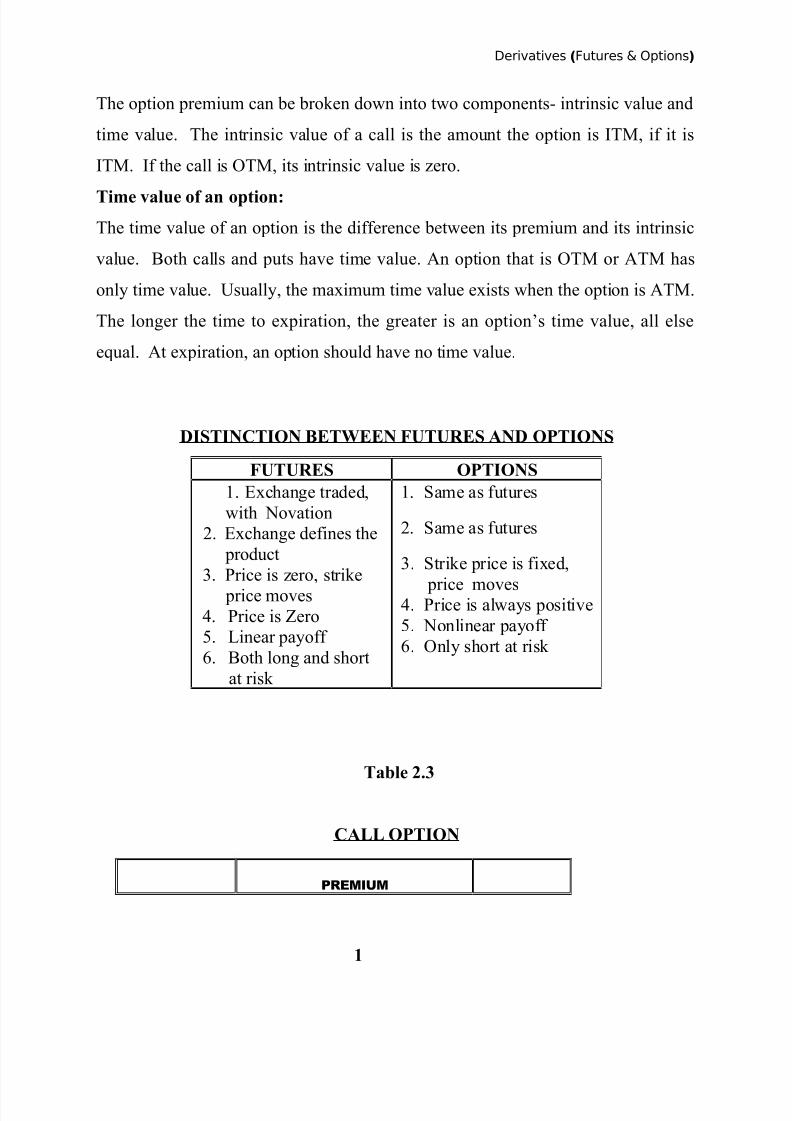
The option premium can be broken down into two components- intrinsic value and
time value. The intrinsic value of a call is the amount the option is ITM, if it is
ITM. If the call is OTM, its intrinsic value is zero.
Time value of an option:The time value of an option is the difference between its premium and its intrinsic
value. Both calls and puts have time value. An option that is OTM or ATM has
only time value. Usually, the maximum time value exists when the option is ATM.
The longer the time to expiration, the greater is an option’s time value, all else
equal. At expiration, an option should have no time value.
DISTINCTION BETWEEN FUTURES AND OPTIONS
Table 2.3
CALL OPTION
PREMIUM
FUTURES OPTIONS1. Exchange traded,
with Novation
2. Exchange defines the
product
3. Price is zero, strike
price moves
4. Price is Zero
5. Linear payoff
6. Both long and short
at risk
1. Same as futures
2. Same as futures
3. Strike price is fixed,
price moves4. Price is always positive
5. Nonlinear payoff
6. Only short at risk
1
5/13/2018 Derivatives Futures and Options Mba Project - slidepdf.com
http://slidepdf.com/reader/full/derivatives-futures-and-options-mba-project 40/92
Derivatives (Futures & Options)
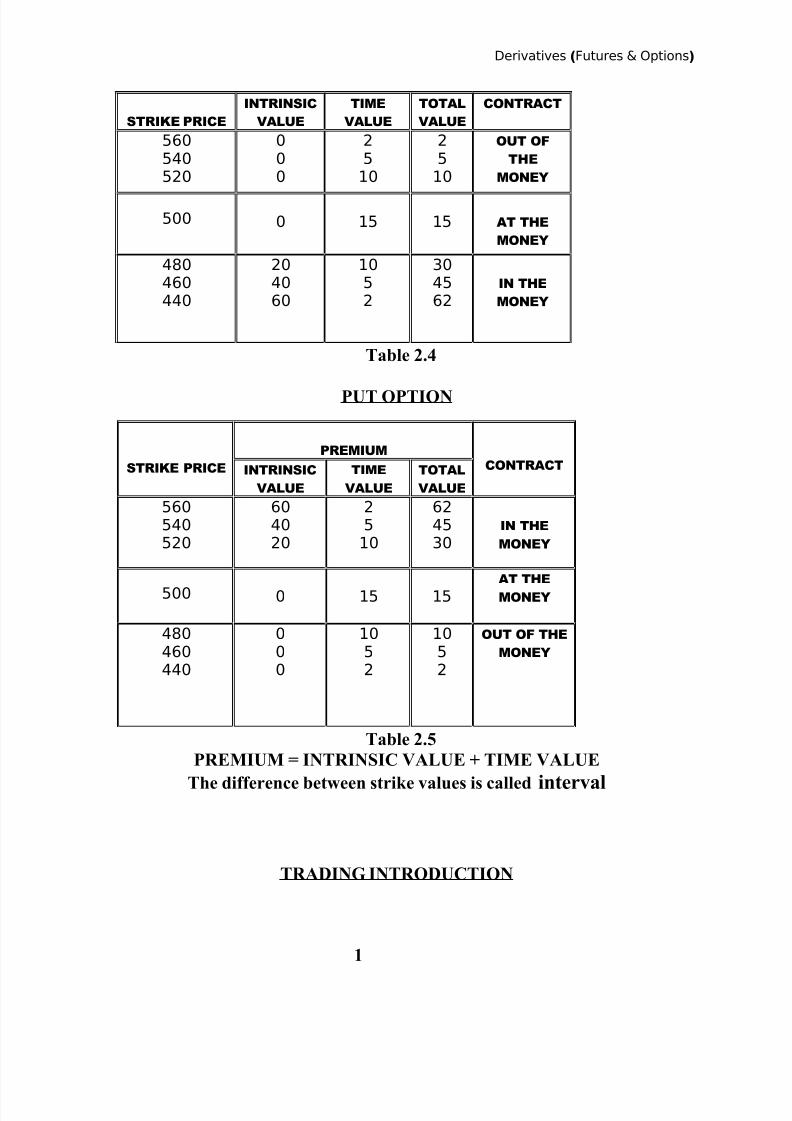
STRIKE PRICE
CONTRACTINTRINSIC
VALUE
TIME
VALUE
TOTAL
VALUE
560540520
000
2510
2510
OUT OF
THE
MONEY
500 0 15 15 AT THE
MONEY
480460440
204060
1052
304562
IN THE
MONEY
Table 2.4
PUT OPTION
STRIKE PRICE
PREMIUMCONTRACTINTRINSIC
VALUE
TIME
VALUE
TOTAL
VALUE
560540520
604020
2510
624530
IN THE
MONEY
500 0 15 15AT THE
MONEY
480460440
000
1052
1052
OUT OF THE
MONEY
Table 2.5PREMIUM = INTRINSIC VALUE + TIME VALUE
The difference between strike values is called interval
TRADING INTRODUCTION
1
5/13/2018 Derivatives Futures and Options Mba Project - slidepdf.com
http://slidepdf.com/reader/full/derivatives-futures-and-options-mba-project 41/92
Derivatives (Futures & Options)
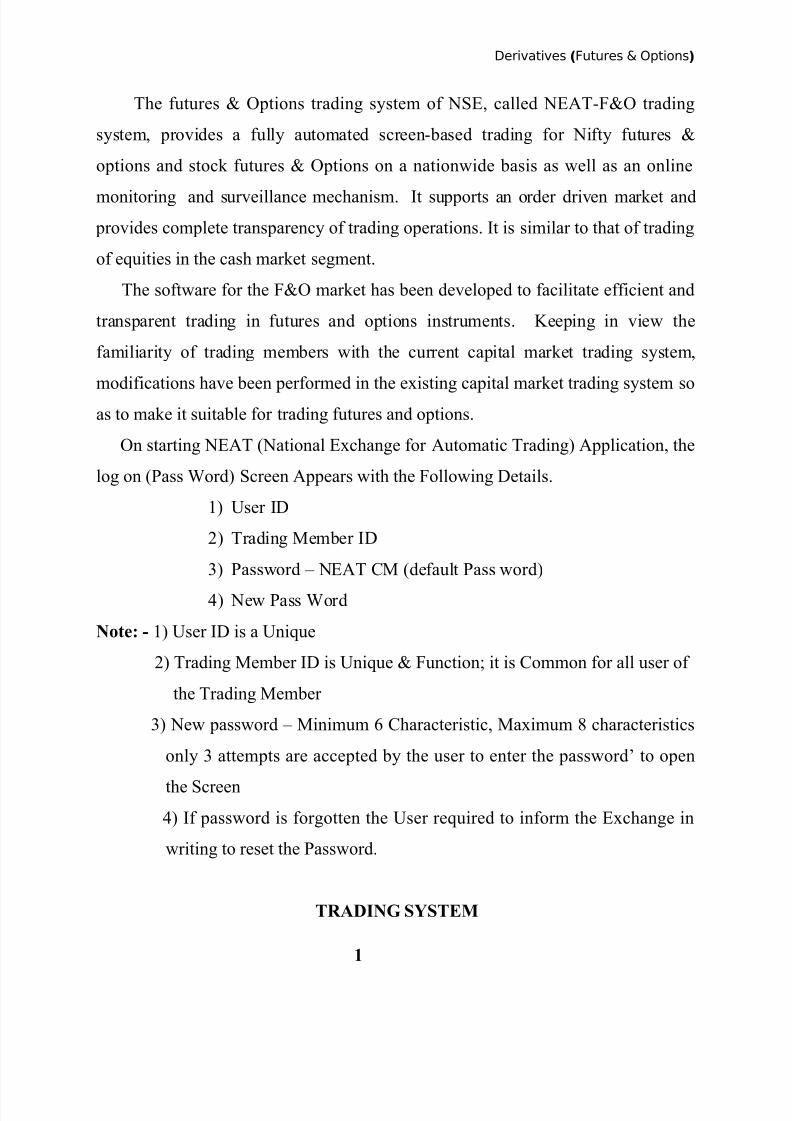
The futures & Options trading system of NSE, called NEAT-F&O trading
system, provides a fully automated screen-based trading for Nifty futures &
options and stock futures & Options on a nationwide basis as well as an online
monitoring and surveillance mechanism. It supports an order driven market and
provides complete transparency of trading operations. It is similar to that of trading
of equities in the cash market segment.
The software for the F&O market has been developed to facilitate efficient and
transparent trading in futures and options instruments. Keeping in view the
familiarity of trading members with the current capital market trading system,
modifications have been performed in the existing capital market trading system soas to make it suitable for trading futures and options.
On starting NEAT (National Exchange for Automatic Trading) Application, the
log on (Pass Word) Screen Appears with the Following Details.
1) User ID
2) Trading Member ID
3) Password – NEAT CM (default Pass word)
4) New Pass Word
Note: - 1) User ID is a Unique
2) Trading Member ID is Unique & Function; it is Common for all user of
the Trading Member
3) New password – Minimum 6 Characteristic, Maximum 8 characteristics
only 3 attempts are accepted by the user to enter the password’ to open
the Screen
4) If password is forgotten the User required to inform the Exchange in
writing to reset the Password.
TRADING SYSTEM
1
5/13/2018 Derivatives Futures and Options Mba Project - slidepdf.com
http://slidepdf.com/reader/full/derivatives-futures-and-options-mba-project 42/92
Derivatives (Futures & Options)
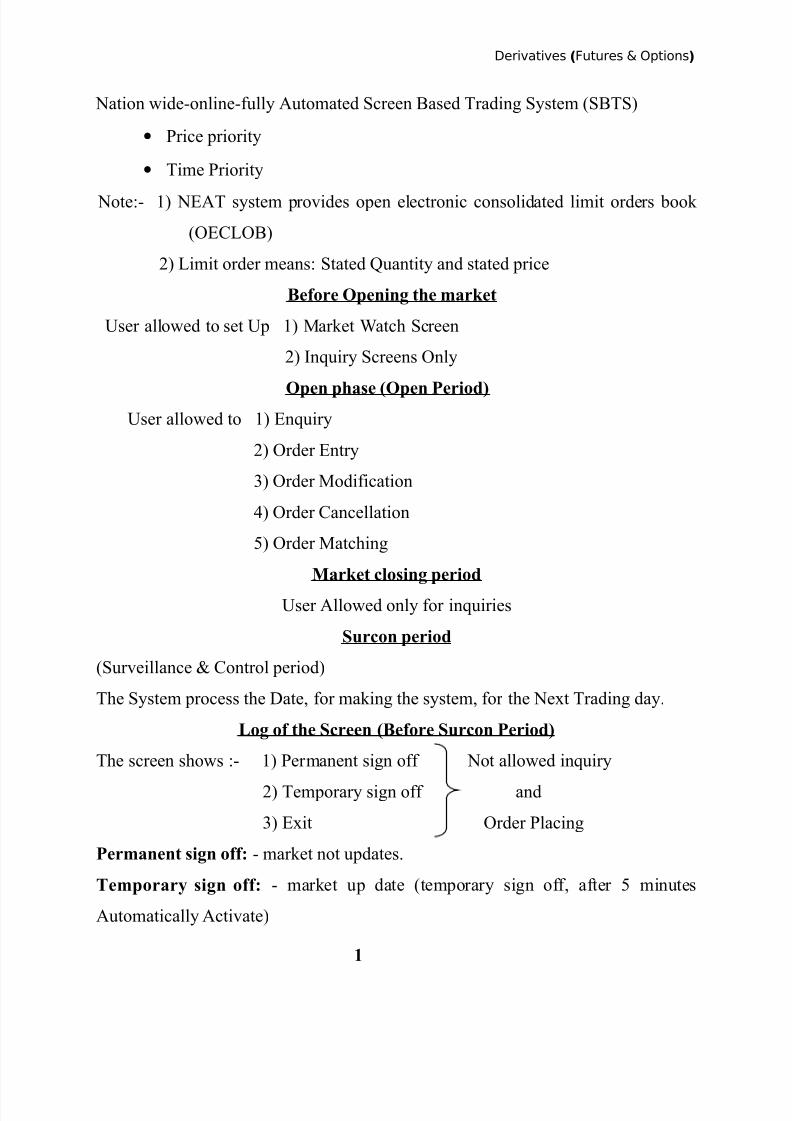
Nation wide-online-fully Automated Screen Based Trading System (SBTS)
• Price priority
• Time Priority
Note:- 1) NEAT system provides open electronic consolidated limit orders book
(OECLOB)
2) Limit order means: Stated Quantity and stated price
Before Opening the market
User allowed to set Up 1) Market Watch Screen
2) Inquiry Screens Only
Open phase (Open Period) User allowed to 1) Enquiry
2) Order Entry
3) Order Modification
4) Order Cancellation
5) Order Matching
Market closing period
User Allowed only for inquiries
Surcon period
(Surveillance & Control period)
The System process the Date, for making the system, for the Next Trading day.
Log of the Screen (Before Surcon Period)
The screen shows :- 1) Permanent sign off Not allowed inquiry
2) Temporary sign off and
3) Exit Order Placing
Permanent sign off: - market not updates.
Temporary sign off: - market up date (temporary sign off, after 5 minutes
Automatically Activate)
1
5/13/2018 Derivatives Futures and Options Mba Project - slidepdf.com
http://slidepdf.com/reader/full/derivatives-futures-and-options-mba-project 43/92
Derivatives (Futures & Options)
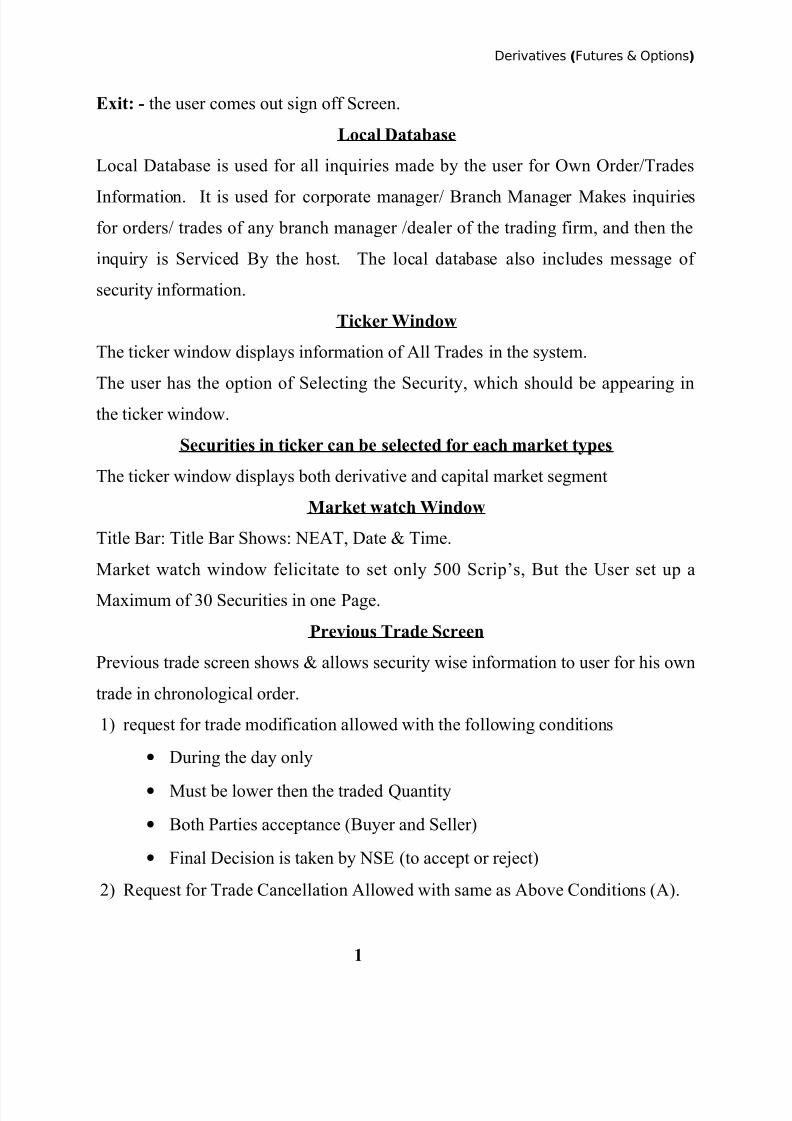
Exit: - the user comes out sign off Screen.
Local Database
Local Database is used for all inquiries made by the user for Own Order/Trades
Information. It is used for corporate manager/ Branch Manager Makes inquiries
for orders/ trades of any branch manager /dealer of the trading firm, and then the
inquiry is Serviced By the host. The local database also includes message of
security information.
Ticker Window
The ticker window displays information of All Trades in the system.
The user has the option of Selecting the Security, which should be appearing inthe ticker window.
Securities in ticker can be selected for each market types
The ticker window displays both derivative and capital market segment
Market watch Window
Title Bar: Title Bar Shows: NEAT, Date & Time.
Market watch window felicitate to set only 500 Scrip’s, But the User set up a
Maximum of 30 Securities in one Page.
Previous Trade Screen
Previous trade screen shows & allows security wise information to user for his own
trade in chronological order.
1) request for trade modification allowed with the following conditions
• During the day only
• Must be lower then the traded Quantity
• Both Parties acceptance (Buyer and Seller)
• Final Decision is taken by NSE (to accept or reject)
2) Request for Trade Cancellation Allowed with same as Above Conditions (A).
1
5/13/2018 Derivatives Futures and Options Mba Project - slidepdf.com
http://slidepdf.com/reader/full/derivatives-futures-and-options-mba-project 44/92
Derivatives (Futures & Options)
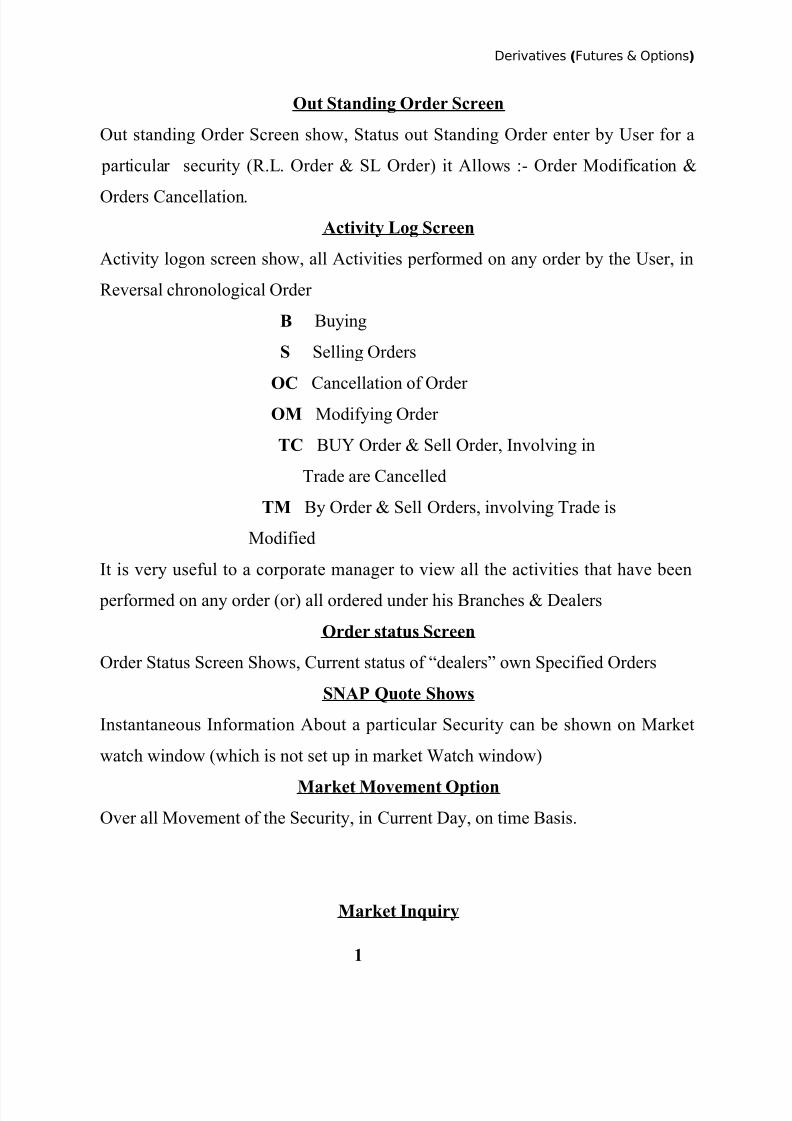
Out Standing Order Screen
Out standing Order Screen show, Status out Standing Order enter by User for a
particular security (R.L. Order & SL Order) it Allows :- Order Modification &
Orders Cancellation.
Activity Log Screen
Activity logon screen show, all Activities performed on any order by the User, in
Reversal chronological Order
B Buying
S Selling Orders
OC Cancellation of Order OM Modifying Order
TC BUY Order & Sell Order, Involving in
Trade are Cancelled
TM By Order & Sell Orders, involving Trade is
Modified
It is very useful to a corporate manager to view all the activities that have been
performed on any order (or) all ordered under his Branches & Dealers
Order status Screen
Order Status Screen Shows, Current status of “dealers” own Specified Orders
SNAP Quote Shows
Instantaneous Information About a particular Security can be shown on Market
watch window (which is not set up in market Watch window)
Market Movement OptionOver all Movement of the Security, in Current Day, on time Basis.
Market Inquiry
1
5/13/2018 Derivatives Futures and Options Mba Project - slidepdf.com
http://slidepdf.com/reader/full/derivatives-futures-and-options-mba-project 45/92
Derivatives (Futures & Options)
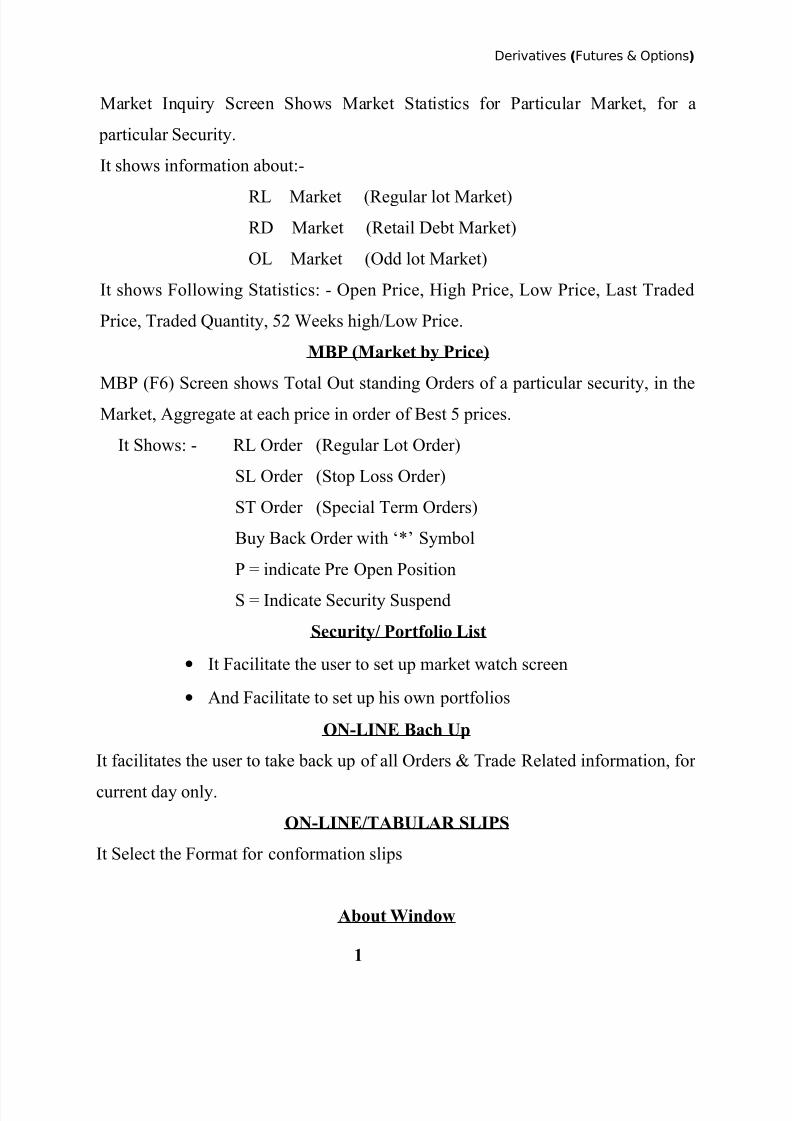
Market Inquiry Screen Shows Market Statistics for Particular Market, for a
particular Security.
It shows information about:-
RL Market (Regular lot Market)
RD Market (Retail Debt Market)
OL Market (Odd lot Market)
It shows Following Statistics: - Open Price, High Price, Low Price, Last Traded
Price, Traded Quantity, 52 Weeks high/Low Price.
MBP (Market by Price)
MBP (F6) Screen shows Total Out standing Orders of a particular security, in theMarket, Aggregate at each price in order of Best 5 prices.
It Shows: - RL Order (Regular Lot Order)
SL Order (Stop Loss Order)
ST Order (Special Term Orders)
Buy Back Order with ‘*’ Symbol
P = indicate Pre Open Position
S = Indicate Security Suspend
Security/ Portfolio List
• It Facilitate the user to set up market watch screen
• And Facilitate to set up his own portfolios
ON-LINE Bach Up
It facilitates the user to take back up of all Orders & Trade Related information, for
current day only.
ON-LINE/TABULAR SLIPS
It Select the Format for conformation slips
About Window
1
5/13/2018 Derivatives Futures and Options Mba Project - slidepdf.com
http://slidepdf.com/reader/full/derivatives-futures-and-options-mba-project 46/92
Derivatives (Futures & Options)
This window displays Software related version numbers details and copy right
information.
Most Activity Securities Screen
It shows most active securities, based on the total traded value during the day
Report Selection Window
It facilitates to print each copy of report at any time. These Reports are
1) Open order report :- For details of out standing orders
2) Order log report:-For details of
orders placed, modified&cancelled
3) Trade Done-today report :- For details of orders traded
4) Market Statistics report: - For details of all securities traded
Information in a Day
Internet Broking
1) NSE introduced internet trading system from February 2000
2) Client place the order through brokers on order routing system
WAP (Wireless Application Protocol)
1) NSE.IT Launches the from November 2000
2) 1st Step-getting the permission from exchange for WAP
3) 2nd step-Approved by the SEBI(SEBI Approved only for SEBI registered
Members)
X.25 Address check
X.25 Address check, is performed in the NEAT system, when the user log on into
the NEAT, system & during report down load request.
FTP (File Transfer protocol)
1) NSE Provide for each member a separate directory (File) to know their trading
DATA, clear DATA, bill trade Report.
1
5/13/2018 Derivatives Futures and Options Mba Project - slidepdf.com
http://slidepdf.com/reader/full/derivatives-futures-and-options-mba-project 47/92
Derivatives (Futures & Options)
2) NSE Provide in Addition a “Common” directory also, to know circulars,
NCFM & Bhava Copy information.
3) FTP is connected to each member through VSAT, leased line and internet.
4) VSAT (FROM 4:15PM to 9:30AM), Internet (24 Hours).
Bhava Copy Data Base
Bhava copy data provides summary information about each security, for each day
(only last 7 days bhava Copy file are stored in report directory.)
Note: - Details in Bhava copy-open price, high and low prices, closing prices
traded value, traded volume and No. of transactions.
Snap Shot Data BaseSnap shot data base provides Snap shot of the limit order book at many time points
in a day.
Index Data Base
Index Data Base provides information about stock market indexes.
Trade Data BaseTrade Data Base provides a data base of every single traded order, take place in
exchange.
BASKET TRADING SYSTEM
1) Taking advantage for easy arbitration between future market and & cash market
difference, NSE introduce basket trading system by off setting positions through
off line-order-entry facility.
2) Orders are created for a selected portfolio to the ratio of their market
Capitalization from 1 lake to 30 crores.
3) Offline-order-entry facility: - generate order file in as specified format out
side the system & up load the order file in to the system by invoking this
facility in Basket trading system.
1

5/13/2018 Derivatives Futures and Options Mba Project - slidepdf.com
http://slidepdf.com/reader/full/derivatives-futures-and-options-mba-project 48/92
Derivatives (Futures & Options)
TRADING NETWORK
Figure 2.7
NSE MAIN FRAME
HUB ANTENNA SATELLITE
BROKER’S PREMISES
1
5/13/2018 Derivatives Futures and Options Mba Project - slidepdf.com
http://slidepdf.com/reader/full/derivatives-futures-and-options-mba-project 49/92
Derivatives (Futures & Options)
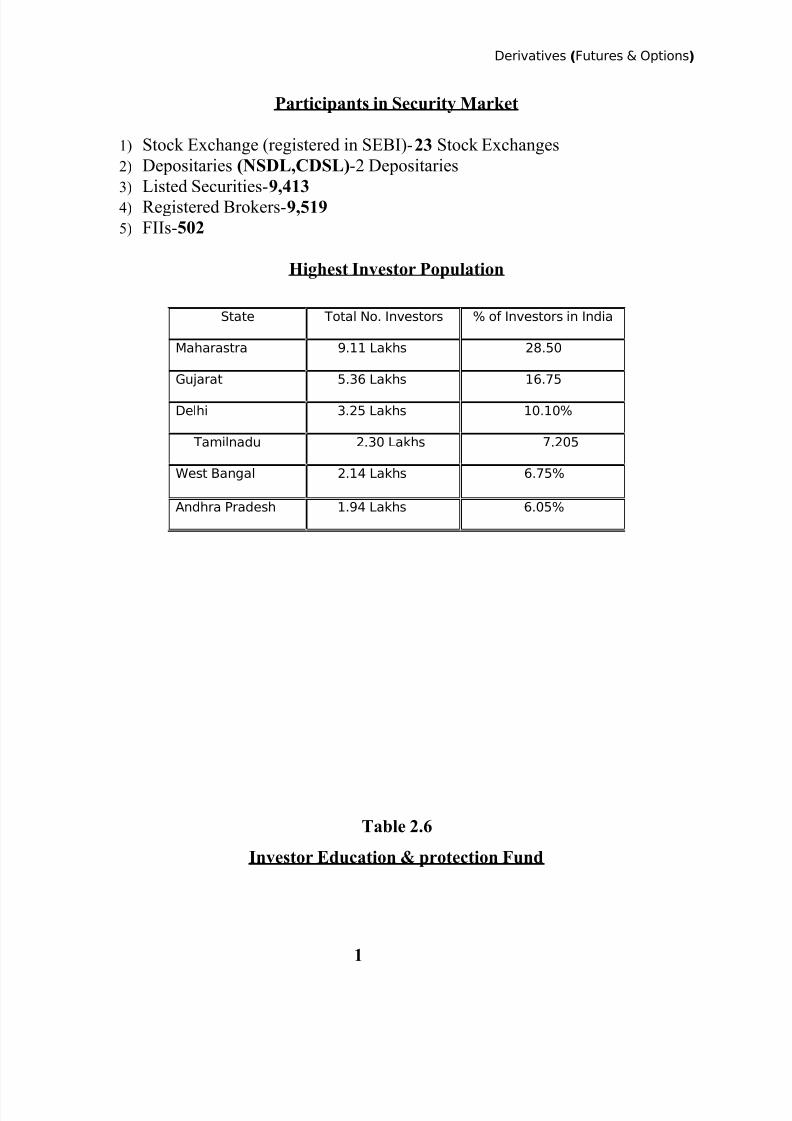
Participants in Security Market
1) Stock Exchange (registered in SEBI)-23 Stock Exchanges
2) Depositaries (NSDL,CDSL)-2 Depositaries
3)Listed Securities-9,4134) Registered Brokers-9,519
5) FIIs-502
Highest Investor Population
Table 2.6
Investor Education & protection Fund
State Total No. Investors % of Investors in India
Maharastra 9.11 Lakhs 28.50
Gujarat 5.36 Lakhs 16.75
Delhi 3.25 Lakhs 10.10%
Tamilnadu 2.30 Lakhs 7.205
West Bangal 2.14 Lakhs 6.75%
Andhra Pradesh 1.94 Lakhs 6.05%
1
5/13/2018 Derivatives Futures and Options Mba Project - slidepdf.com
http://slidepdf.com/reader/full/derivatives-futures-and-options-mba-project 50/92
Derivatives (Futures & Options)
This fund used to educate & develop the awareness of the Investors.
The following funds credited to IE & PF
1) Unpaid dividends
2) Due for refund (application money received for allotment)
3) Matured deposits & debentures with company.
4) Government donations.
company
SHAREKHAN
SSKI, a veteran equities solutions company with over 8 decades of experience
in the Indian stock markets. The SSKI Group comparies of institutional Broking and
Corporate Finance. The institutional broking division caters to domestic and foreign
institutional investors, while the Corporate Finance Division focuses on ninche areas
such as infrastructure, telecom and media, SSKI has been voted as the Top Domestic
Brokerage House in the research category, by the Euro Money survey and AsiaMoney survey.
Share khan is also about focus. Sharekhan does not claim expertise in too
many things. Sharekhan’s exoertise lies in stocks and that’s what he talks about with
authority.So when he says that investing in stocks shouldnot be confused with trading
in stocks or a portfolio-based strategy is better than betting on a single horse, it is
some thing that is spoken with years of focused learning and experience in the stock
markets. And these beliefs are reflected in everything Sharekhan does for you!
Share khan India’s leading stockbroker is the retail arm of SSKI, An
organization with over eighty years experience in the stock market. With over
240share shops in 110.
Cities, and India’s premier online trading destinations-www.sharekhan.com,
ours customer enjoy multi-channel access at the stock markets, share khan offer u
1
5/13/2018 Derivatives Futures and Options Mba Project - slidepdf.com
http://slidepdf.com/reader/full/derivatives-futures-and-options-mba-project 51/92
Derivatives (Futures & Options)
trade execution facilities for cash as well as derivaties on the BSE &NSE and most
importunity we bring you investment advice tempered by eighty years of broking
experience.
Through our portal Sharekhan.com, we’ve been providing investors a powerfulonline trading platform, the latest news, research and other knowledge-based tools for
over 5years now. We have dedicated terms for fundamental and technical research so
that you get all the information your need to take the right investment decisions. With
branches and outlets across the country , our ground network is one of the biggest in
India. We have a talent pool of experienced professionals specially designated to
guide you when you need assistance, which is why investing with us is bound to be a
hassle-free experience for you!
Reason why you should choose Share Khan
1. Experience:
SSKI has more than eight decades of trust and credibility in the Indian stock
market. In the Asia Money Broker’s poll held recently, SSKI won the ‘India’s best
broking division in February 2000, it has been providing institutional-level research
and broking services to individual investors.
2.Technology:
With our online trading account you can buy and sell shares in an instant from
any PC with an Internet connection. You will get acces to our powerful inline tradingtools that will help you take complete control over your investment in shares.
3.Accessibility:In addition to our online and phone trading services, we also have a ground
network of 240 share shops across 110 cities in India where you can get personalized
services.
4.Knowledge:In a business where the right information at the right time can translate into
direct profit, you get access to wide range of information on our content- rich portal,Sharekhan.com. You will also get a useful set of knowledge-based tools that will
empower you to take informed decisions.
5.Convenience:
You can all our Dial-n-Trade number to get investment and execute your
transaction. We have a dedicated call-center to provide this service via a toll-free
number from anywhere in India.
1
5/13/2018 Derivatives Futures and Options Mba Project - slidepdf.com
http://slidepdf.com/reader/full/derivatives-futures-and-options-mba-project 52/92
Derivatives (Futures & Options)
6.Customer service:
Our customer service team will assist you for any help that you need relating to
transactions, billing, demat and other queries, our customer service can be contacted
via a toll-free number, email or live chat on sharekhan.com
7.Investment Advice:Sharekhan has dedicated research teams for fundamental and technical
research.Our analysts constantly track the pulse of the market and provide timely
investment advice to you in the form of daily research emails, online chat, printed
reports on SMS on your phone.Cutomers of Share Khan Experience language,
presentation style, content or for that matter the online trading facility find a common
thread; one that helps the customers make informed decisions and simplifies investing
in stocks. The common thread of empowerment is what Sharekhan’s all about!
Sharekhan is also about focus. Share khan does not claim expertise in too many
things. Sharekhan’s expertise lies in stocks and that’s what he talks about withauthority. So when he says that investing in stocks should not be confused with
trading in stocks or a portfolio-based strategy is better than betting on a single horse, it
is something that is spoken with years of focused learning and experience in the stock
markets. And these beliefs are reflected in everything Sharekhan does for customers.
To sum up, Sharekhan brings to customers a user-friendly online trading
facility, coupled with a wealth of content that will help customers stalk the right
shares.
Those of customers who feel comfortable dealing with a human being andwould rather visit a brick-and-mortar outlet than talk to a PC; Sharekhan offers
customers the facility to visit (or talk to) any of sharekhan’s share shops across the
country. In fact Sharekhan runs India’s largest chain of share shops with over hundred
outlets in 80 cities!
Sharekhan services:Sharekhan, one of India’s leading brokerage houses, is the retail arm of SSKI.
With over 510 share shops in 170 cities, and India’s premier online trading portal
www.sharekhan.com, sharekhan’s customers enjoy multi-channel access to the stock markets.
Online Services to Suit customers Needs:
With a Sharekhan online trading account, customers can buy and sell shares in
an instant! Anytime customers like trading account that suits customer’s trading habits
and preferences – the Classic Account for most investors and Speed trade for active
1
5/13/2018 Derivatives Futures and Options Mba Project - slidepdf.com
http://slidepdf.com/reader/full/derivatives-futures-and-options-mba-project 53/92
Derivatives (Futures & Options)
day traders. Customer’s Classic Account also comes with Dial-n-Trade completely
free, which is an exclusive service for trading shares by using customer’s telephone.
When beginning customer’s foray in investing in shares, customers need a lot
of things – from the right information at customer’s disposal, to assistance when
customers need it and advice on investing.Sharekhan have been in this business for over 80 years now, and with sharekhan customers get a host of serices and tools that
are difficult to fing in one place anywhere else. The Sharekhan First Step program,
built specifically for new investors. All customers have to do is walk into any of
sharekhan’s 510 share shops across 170 cities in India to get a host of trading related
services – sharekhan’s friendly customer service staff will also help customers with
any accounts related queries customers may have.
A Sharekhan outlet offers the following services:
Online BSE and NSE execution (through BOLT & NEAT terminals)Free
access to investment advice from Sharekhan value line (a monthly publication with
reviews of recommendations, stocks to watch out for etc)
Daily research reports and market review(High Noon & Eagle Eye)
Pre-market Report (Morning Cuppa)
Daily trading calls based on Technical Analysis
Cool trading products(Darling Derivatives and Market Strategy)
Personalised Advice
Live Market Information
Depository Services: Demat & Remat Transactions
Derivatives Trading (Futures and Options)
Commodities Trading
IPOs & Mutual Funds Distribution
Interner-based Online Trading: Speed Trade
Investing in Mutual Funds though customers will now be able to invest in
Mutual Funds through Sharekhan; it has started this service for few mutual funds, and
in the near future will be expanding sharekhan’s scope to include a whole lot more.
1
5/13/2018 Derivatives Futures and Options Mba Project - slidepdf.com
http://slidepdf.com/reader/full/derivatives-futures-and-options-mba-project 54/92
Derivatives (Futures & Options)
Applying for a mutual fund through sharekhan is open to everybody, regardless of
whether customers are a Sharekhan customer.
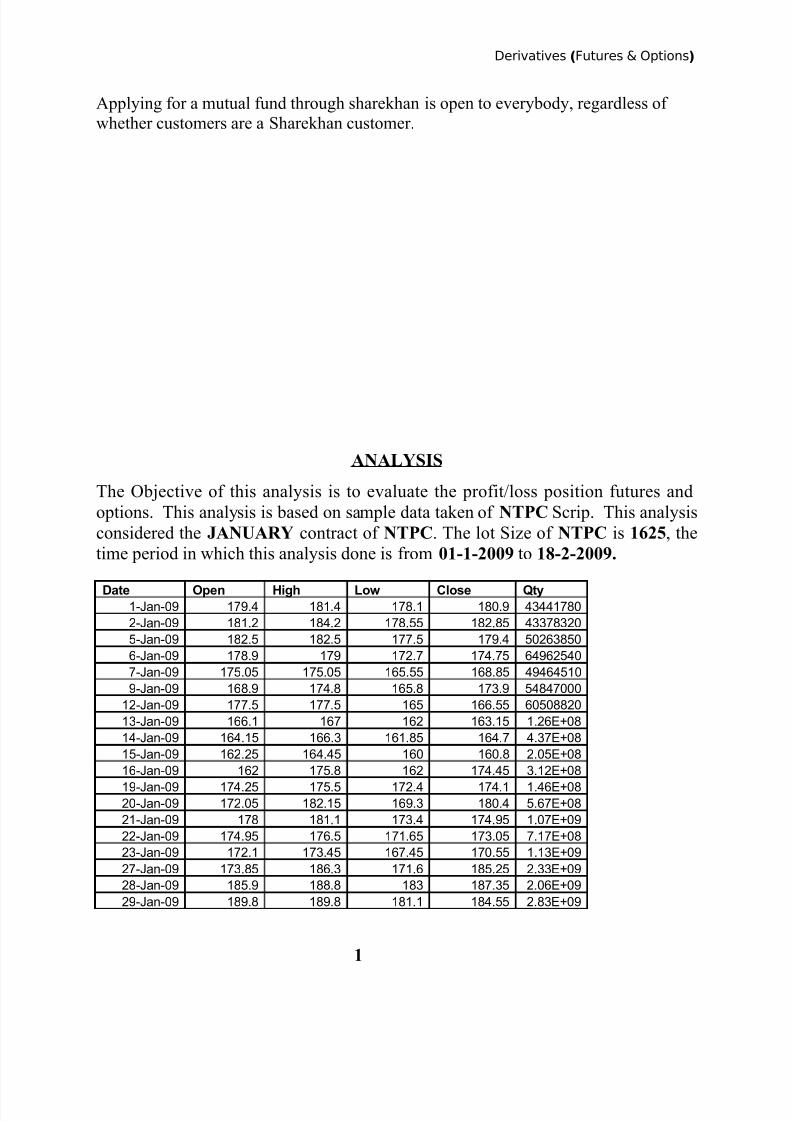
ANALYSIS
The Objective of this analysis is to evaluate the profit/loss position futures and
options. This analysis is based on sample data taken of NTPC Scrip. This analysis
considered the JANUARY contract of NTPC. The lot Size of NTPC is 1625, the
time period in which this analysis done is from 01-1-2009 to 18-2-2009.
Date Open High Low Close Qty1-Jan-09 179.4 181.4 178.1 180.9 43441780
2-Jan-09 181.2 184.2 178.55 182.85 43378320
5-Jan-09 182.5 182.5 177.5 179.4 50263850
6-Jan-09 178.9 179 172.7 174.75 64962540
7-Jan-09 175.05 175.05 165.55 168.85 49464510
9-Jan-09 168.9 174.8 165.8 173.9 54847000
12-Jan-09 177.5 177.5 165 166.55 60508820
13-Jan-09 166.1 167 162 163.15 1.26E+08
14-Jan-09 164.15 166.3 161.85 164.7 4.37E+08
15-Jan-09 162.25 164.45 160 160.8 2.05E+08
16-Jan-09 162 175.8 162 174.45 3.12E+08
19-Jan-09 174.25 175.5 172.4 174.1 1.46E+08
20-Jan-09 172.05 182.15 169.3 180.4 5.67E+08
21-Jan-09 178 181.1 173.4 174.95 1.07E+09
22-Jan-09 174.95 176.5 171.65 173.05 7.17E+08
23-Jan-09 172.1 173.45 167.45 170.55 1.13E+09
27-Jan-09 173.85 186.3 171.6 185.25 2.33E+09
28-Jan-09 185.9 188.8 183 187.35 2.06E+09
29-Jan-09 189.8 189.8 181.1 184.55 2.83E+09
1
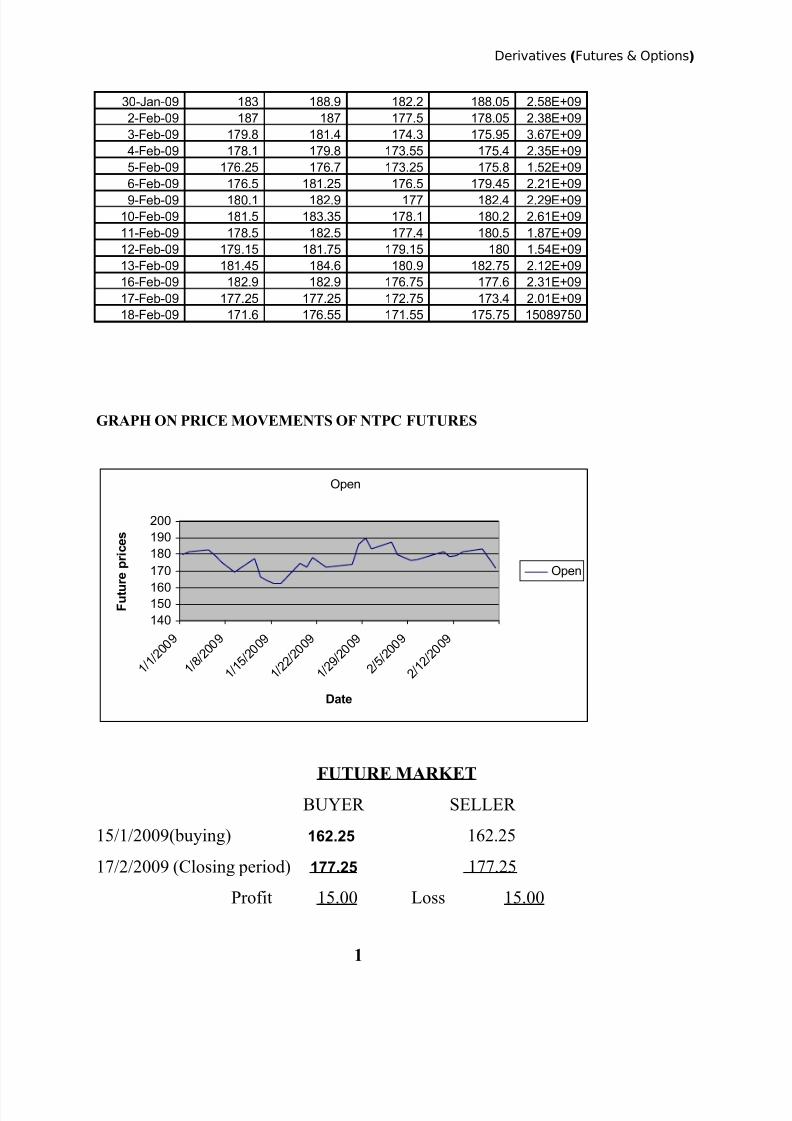
5/13/2018 Derivatives Futures and Options Mba Project - slidepdf.com
http://slidepdf.com/reader/full/derivatives-futures-and-options-mba-project 55/92
Derivatives (Futures & Options)
30-Jan-09 183 188.9 182.2 188.05 2.58E+09
2-Feb-09 187 187 177.5 178.05 2.38E+09
3-Feb-09 179.8 181.4 174.3 175.95 3.67E+09
4-Feb-09 178.1 179.8 173.55 175.4 2.35E+09
5-Feb-09 176.25 176.7 173.25 175.8 1.52E+09
6-Feb-09 176.5 181.25 176.5 179.45 2.21E+09
9-Feb-09 180.1 182.9 177 182.4 2.29E+09
10-Feb-09 181.5 183.35 178.1 180.2 2.61E+09
11-Feb-09 178.5 182.5 177.4 180.5 1.87E+09
12-Feb-09 179.15 181.75 179.15 180 1.54E+09
13-Feb-09 181.45 184.6 180.9 182.75 2.12E+09
16-Feb-09 182.9 182.9 176.75 177.6 2.31E+09
17-Feb-09 177.25 177.25 172.75 173.4 2.01E+09
18-Feb-09 171.6 176.55 171.55 175.75 15089750
GRAPH ON PRICE MOVEMENTS OF NTPC FUTURES
Open
140
150160
170
180
190
200
1 / 1 / 2 0
0 9
1 / 8 / 2 0
0 9
1 / 1 5 / 2 0 0 9
1 / 2 2
/ 2 0 0 9
1 / 2 9
/ 2 0 0 9
2 / 5 / 2 0
0 9
2 / 1 2 / 2 0 0 9
Date
F u t u
r e
p r i c e s
Open
FUTURE MARKET
BUYER SELLER
15/1/2009(buying) 162.25 162.25
17/2/2009 (Closing period) 177.25 177.25
Profit 15.00 Loss 15.00
1
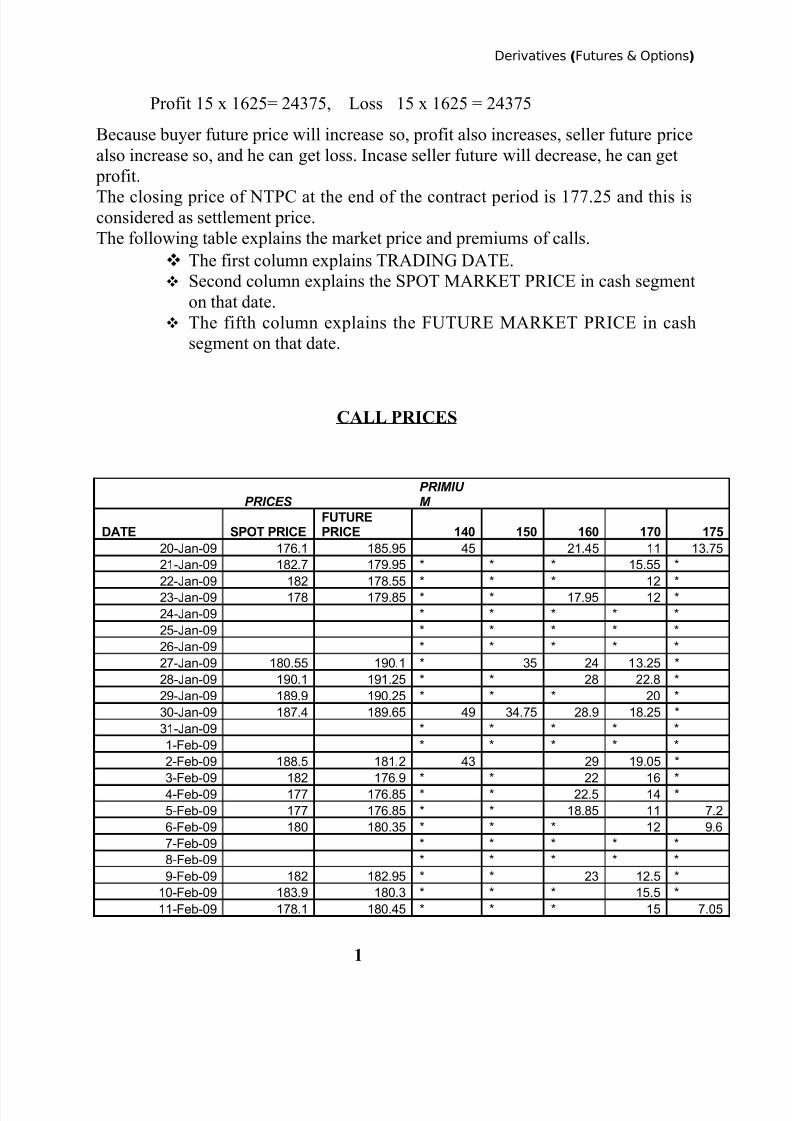
5/13/2018 Derivatives Futures and Options Mba Project - slidepdf.com
http://slidepdf.com/reader/full/derivatives-futures-and-options-mba-project 56/92
Derivatives (Futures & Options)
Profit 15 x 1625= 24375, Loss 15 x 1625 = 24375
Because buyer future price will increase so, profit also increases, seller future price
also increase so, and he can get loss. Incase seller future will decrease, he can get
profit.
The closing price of NTPC at the end of the contract period is 177.25 and this isconsidered as settlement price.
The following table explains the market price and premiums of calls.
The first column explains TRADING DATE.
Second column explains the SPOT MARKET PRICE in cash segment
on that date.
The fifth column explains the FUTURE MARKET PRICE in cash
segment on that date.
CALL PRICES
PRICES
PRIMIU
M
DATE SPOT PRICEFUTUREPRICE 140 150 160 170 175
20-Jan-09 176.1 185.95 45 21.45 11 13.75
21-Jan-09 182.7 179.95 * * * 15.55 *
22-Jan-09 182 178.55 * * * 12 *
23-Jan-09 178 179.85 * * 17.95 12 *
24-Jan-09 * * * * *
25-Jan-09 * * * * *
26-Jan-09 * * * * *
27-Jan-09 180.55 190.1 * 35 24 13.25 *
28-Jan-09 190.1 191.25 * * 28 22.8 *
29-Jan-09 189.9 190.25 * * * 20 *
30-Jan-09 187.4 189.65 49 34.75 28.9 18.25 *
31-Jan-09 * * * * *
1-Feb-09 * * * * *
2-Feb-09 188.5 181.2 43 29 19.05 *
3-Feb-09 182 176.9 * * 22 16 *
4-Feb-09 177 176.85 * * 22.5 14 *
5-Feb-09 177 176.85 * * 18.85 11 7.2
6-Feb-09 180 180.35 * * * 12 9.6
7-Feb-09 * * * * *
8-Feb-09 * * * * *
9-Feb-09 182 182.95 * * 23 12.5 *
10-Feb-09 183.9 180.3 * * * 15.5 *
11-Feb-09 178.1 180.45 * * * 15 7.05
1
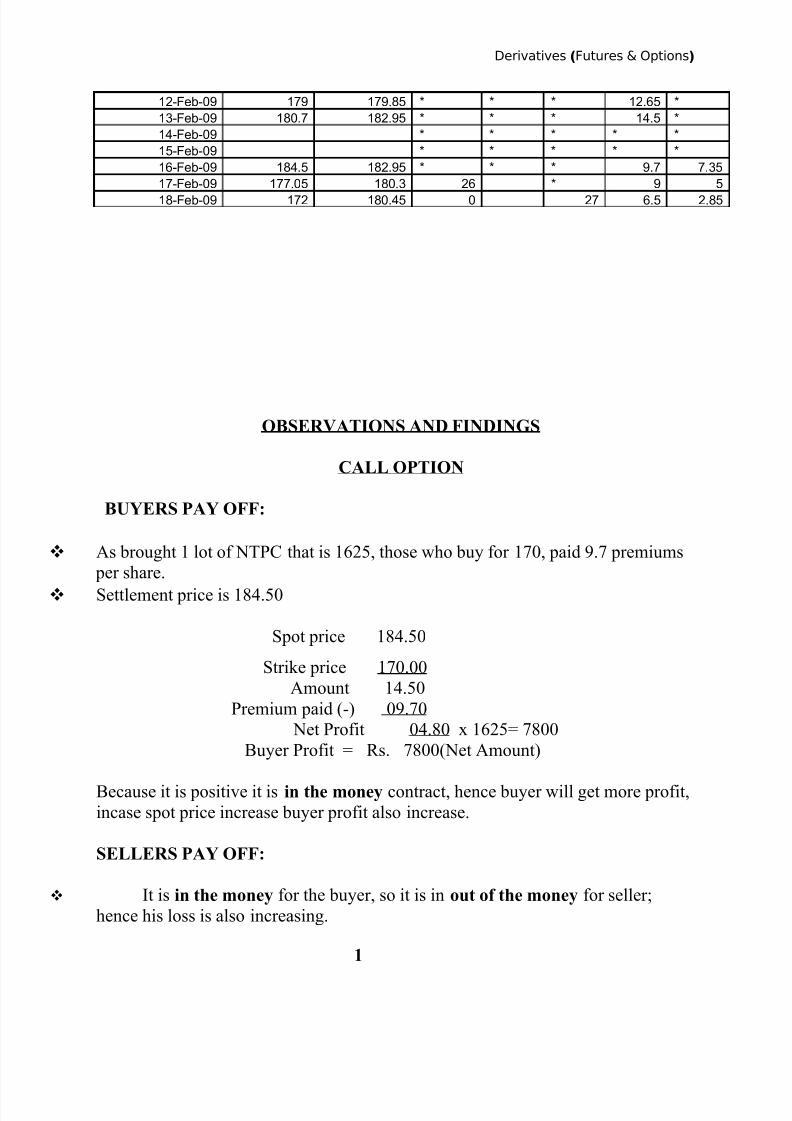
5/13/2018 Derivatives Futures and Options Mba Project - slidepdf.com
http://slidepdf.com/reader/full/derivatives-futures-and-options-mba-project 57/92
Derivatives (Futures & Options)
12-Feb-09 179 179.85 * * * 12.65 *
13-Feb-09 180.7 182.95 * * * 14.5 *
14-Feb-09 * * * * *
15-Feb-09 * * * * *
16-Feb-09 184.5 182.95 * * * 9.7 7.35
17-Feb-09 177.05 180.3 26 * 9 5
18-Feb-09 172 180.45 0 27 6.5 2.85
OBSERVATIONS AND FINDINGS
CALL OPTION
BUYERS PAY OFF:
As brought 1 lot of NTPC that is 1625, those who buy for 170, paid 9.7 premiums
per share.
Settlement price is 184.50
Spot price 184.50
Strike price 170.00
Amount 14.50
Premium paid (-) 09.70
Net Profit 04.80 x 1625= 7800
Buyer Profit = Rs. 7800(Net Amount)
Because it is positive it is in the money contract, hence buyer will get more profit,
incase spot price increase buyer profit also increase.
SELLERS PAY OFF:
It is in the money for the buyer, so it is in out of the money for seller;
hence his loss is also increasing.
1
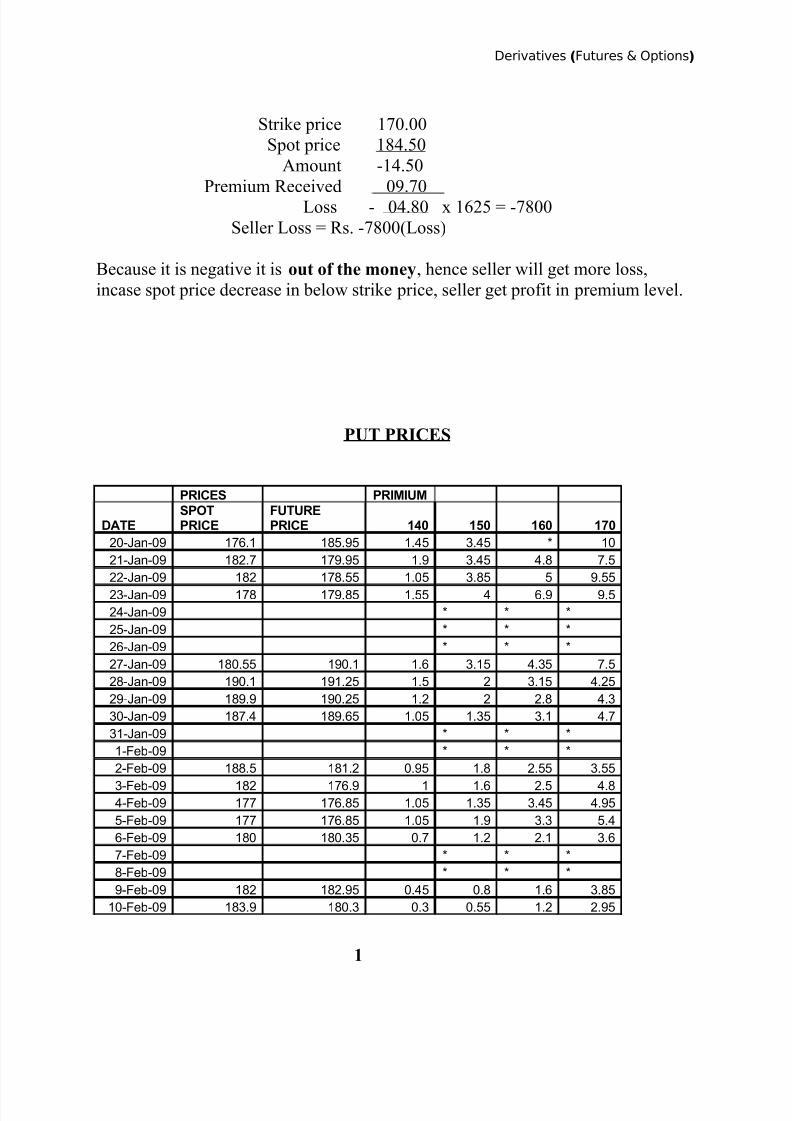
5/13/2018 Derivatives Futures and Options Mba Project - slidepdf.com
http://slidepdf.com/reader/full/derivatives-futures-and-options-mba-project 58/92
Derivatives (Futures & Options)
Strike price 170.00
Spot price 184.50
Amount -14.50
Premium Received 09.70Loss - 04.80 x 1625 = -7800
Seller Loss = Rs. -7800(Loss)
Because it is negative it is out of the money, hence seller will get more loss,
incase spot price decrease in below strike price, seller get profit in premium level.
PUT PRICES
PRICES PRIMIUM
DATESPOTPRICE
FUTUREPRICE 140 150 160 170
20-Jan-09 176.1 185.95 1.45 3.45 * 10
21-Jan-09 182.7 179.95 1.9 3.45 4.8 7.5
22-Jan-09 182 178.55 1.05 3.85 5 9.55
23-Jan-09 178 179.85 1.55 4 6.9 9.5
24-Jan-09 * * *
25-Jan-09 * * *
26-Jan-09 * * *
27-Jan-09 180.55 190.1 1.6 3.15 4.35 7.5
28-Jan-09 190.1 191.25 1.5 2 3.15 4.25
29-Jan-09 189.9 190.25 1.2 2 2.8 4.3
30-Jan-09 187.4 189.65 1.05 1.35 3.1 4.7
31-Jan-09 * * *
1-Feb-09 * * *
2-Feb-09 188.5 181.2 0.95 1.8 2.55 3.55
3-Feb-09 182 176.9 1 1.6 2.5 4.8
4-Feb-09 177 176.85 1.05 1.35 3.45 4.95
5-Feb-09 177 176.85 1.05 1.9 3.3 5.4
6-Feb-09 180 180.35 0.7 1.2 2.1 3.6
7-Feb-09 * * *
8-Feb-09 * * *
9-Feb-09 182 182.95 0.45 0.8 1.6 3.85
10-Feb-09 183.9 180.3 0.3 0.55 1.2 2.95
1
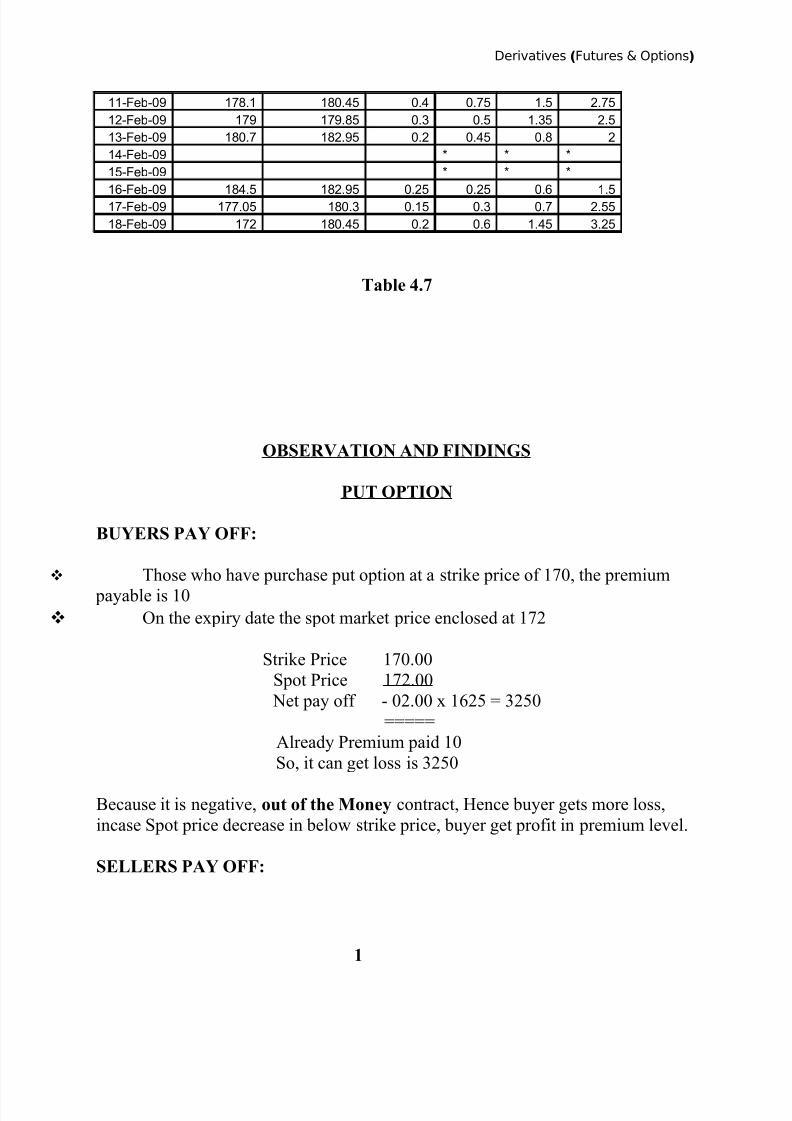
5/13/2018 Derivatives Futures and Options Mba Project - slidepdf.com
http://slidepdf.com/reader/full/derivatives-futures-and-options-mba-project 59/92
Derivatives (Futures & Options)
11-Feb-09 178.1 180.45 0.4 0.75 1.5 2.75
12-Feb-09 179 179.85 0.3 0.5 1.35 2.5
13-Feb-09 180.7 182.95 0.2 0.45 0.8 2
14-Feb-09 * * *
15-Feb-09 * * *
16-Feb-09 184.5 182.95 0.25 0.25 0.6 1.5
17-Feb-09 177.05 180.3 0.15 0.3 0.7 2.55
18-Feb-09 172 180.45 0.2 0.6 1.45 3.25
Table 4.7
OBSERVATION AND FINDINGS
PUT OPTION
BUYERS PAY OFF:
Those who have purchase put option at a strike price of 170, the premium
payable is 10
On the expiry date the spot market price enclosed at 172
Strike Price 170.00
Spot Price 172.00
Net pay off - 02.00 x 1625 = 3250
=====
Already Premium paid 10
So, it can get loss is 3250
Because it is negative, out of the Money contract, Hence buyer gets more loss,
incase Spot price decrease in below strike price, buyer get profit in premium level.
SELLERS PAY OFF:
1
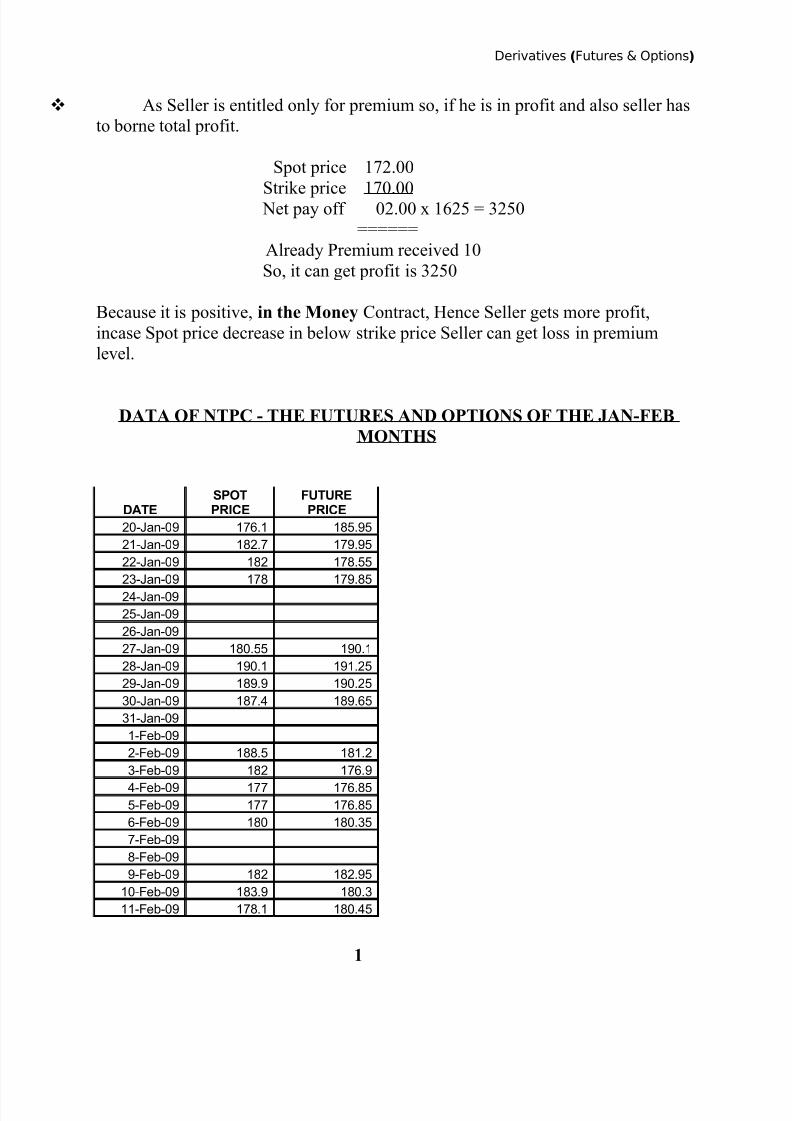
5/13/2018 Derivatives Futures and Options Mba Project - slidepdf.com
http://slidepdf.com/reader/full/derivatives-futures-and-options-mba-project 60/92
Derivatives (Futures & Options)
As Seller is entitled only for premium so, if he is in profit and also seller has
to borne total profit.
Spot price 172.00
Strike price 170.00Net pay off 02.00 x 1625 = 3250
======
Already Premium received 10
So, it can get profit is 3250
Because it is positive, in the Money Contract, Hence Seller gets more profit,
incase Spot price decrease in below strike price Seller can get loss in premium
level.
DATA OF NTPC - THE FUTURES AND OPTIONS OF THE JAN-FEBMONTHS
DATESPOTPRICE
FUTUREPRICE
20-Jan-09 176.1 185.95
21-Jan-09 182.7 179.95
22-Jan-09 182 178.55
23-Jan-09 178 179.85
24-Jan-09
25-Jan-09
26-Jan-09
27-Jan-09 180.55 190.1
28-Jan-09 190.1 191.25
29-Jan-09 189.9 190.25
30-Jan-09 187.4 189.65
31-Jan-09
1-Feb-09
2-Feb-09 188.5 181.2
3-Feb-09 182 176.9
4-Feb-09 177 176.85
5-Feb-09 177 176.85
6-Feb-09 180 180.35
7-Feb-09
8-Feb-09
9-Feb-09 182 182.95
10-Feb-09 183.9 180.3
11-Feb-09 178.1 180.45
1
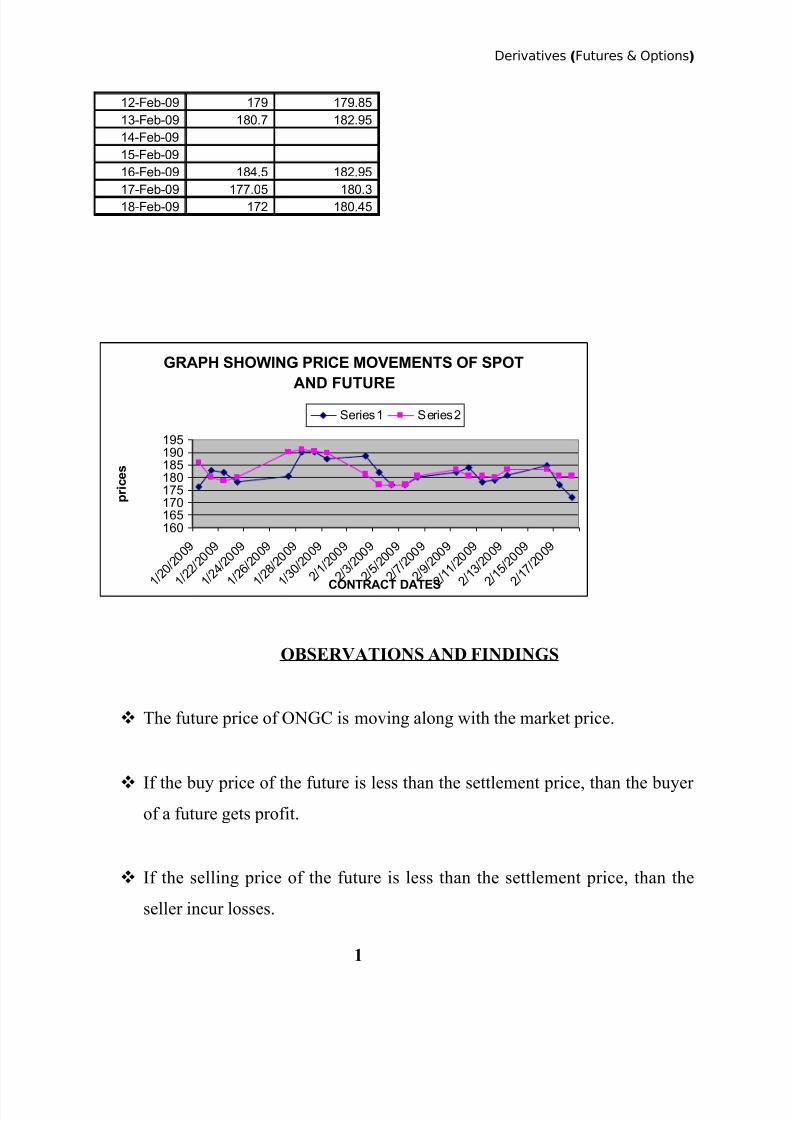
5/13/2018 Derivatives Futures and Options Mba Project - slidepdf.com
http://slidepdf.com/reader/full/derivatives-futures-and-options-mba-project 61/92
Derivatives (Futures & Options)
12-Feb-09 179 179.85
13-Feb-09 180.7 182.95
14-Feb-09
15-Feb-09
16-Feb-09 184.5 182.95
17-Feb-09 177.05 180.3
18-Feb-09 172 180.45
GRAPH SHOWING PRICE MOVEMENTS OF SPOT
AND FUTURE
160165170175180185190195
1 / 2 0
/ 2 0 0 9
1 / 2 2
/ 2 0 0 9
1 / 2 4
/ 2 0 0 9
1 / 2 6
/ 2 0 0 9
1 / 2 8
/ 2 0 0 9
1 / 3 0
/ 2 0 0 9
2 / 1 / 2 0
0 9
2 / 3 / 2 0
0 9
2 / 5 / 2 0
0 9
2 / 7 / 2 0
0 9
2 / 9 / 2 0
0 9
2 / 1 1 / 2 0 0 9
2 / 1 3 / 2 0 0 9
2 / 1 5 / 2 0 0 9
2 / 1 7 / 2 0 0 9
CONTRACT DATES
p r i c e s
Series 1 Series 2
OBSERVATIONS AND FINDINGS
The future price of ONGC is moving along with the market price.
If the buy price of the future is less than the settlement price, than the buyer
of a future gets profit.
If the selling price of the future is less than the settlement price, than the
seller incur losses.
1
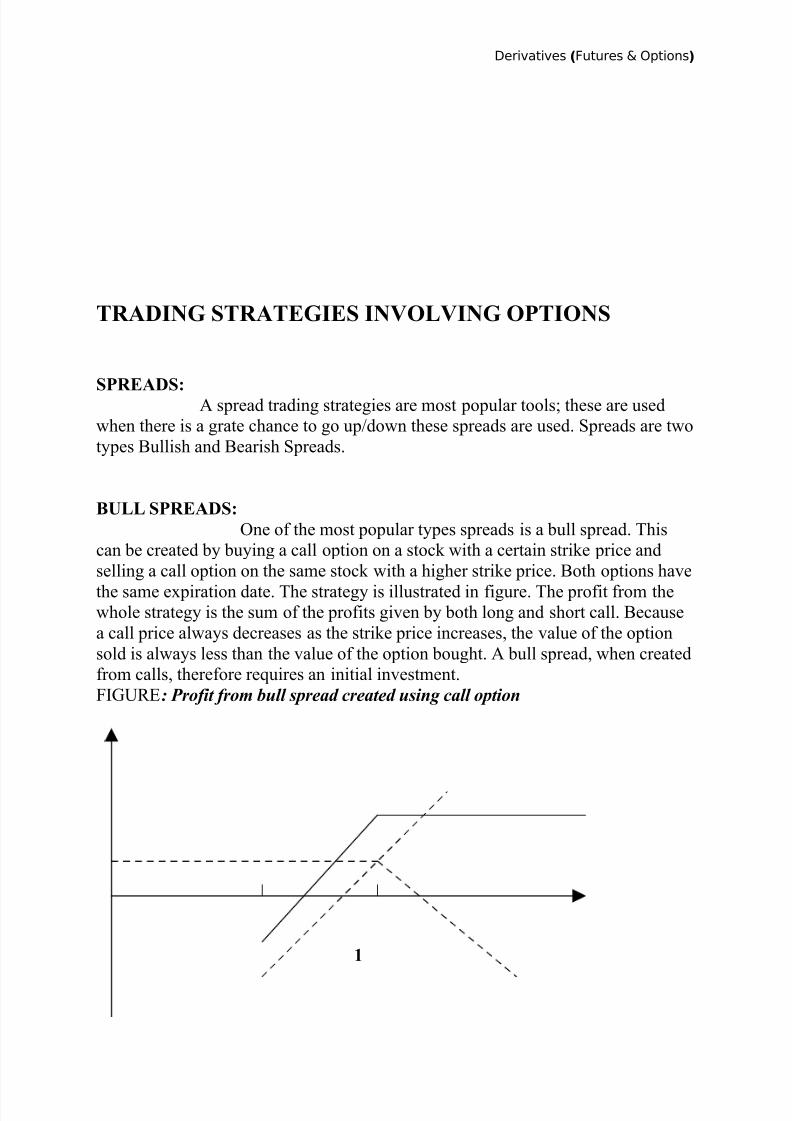
5/13/2018 Derivatives Futures and Options Mba Project - slidepdf.com
http://slidepdf.com/reader/full/derivatives-futures-and-options-mba-project 62/92
Derivatives (Futures & Options)
TRADING STRATEGIES INVOLVING OPTIONS
SPREADS: A spread trading strategies are most popular tools; these are used
when there is a grate chance to go up/down these spreads are used. Spreads are two
types Bullish and Bearish Spreads.
BULL SPREADS:One of the most popular types spreads is a bull spread. This
can be created by buying a call option on a stock with a certain strike price and
selling a call option on the same stock with a higher strike price. Both options have
the same expiration date. The strategy is illustrated in figure. The profit from thewhole strategy is the sum of the profits given by both long and short call. Because
a call price always decreases as the strike price increases, the value of the option
sold is always less than the value of the option bought. A bull spread, when created
from calls, therefore requires an initial investment.
FIGURE: Profit from bull spread created using call option
1
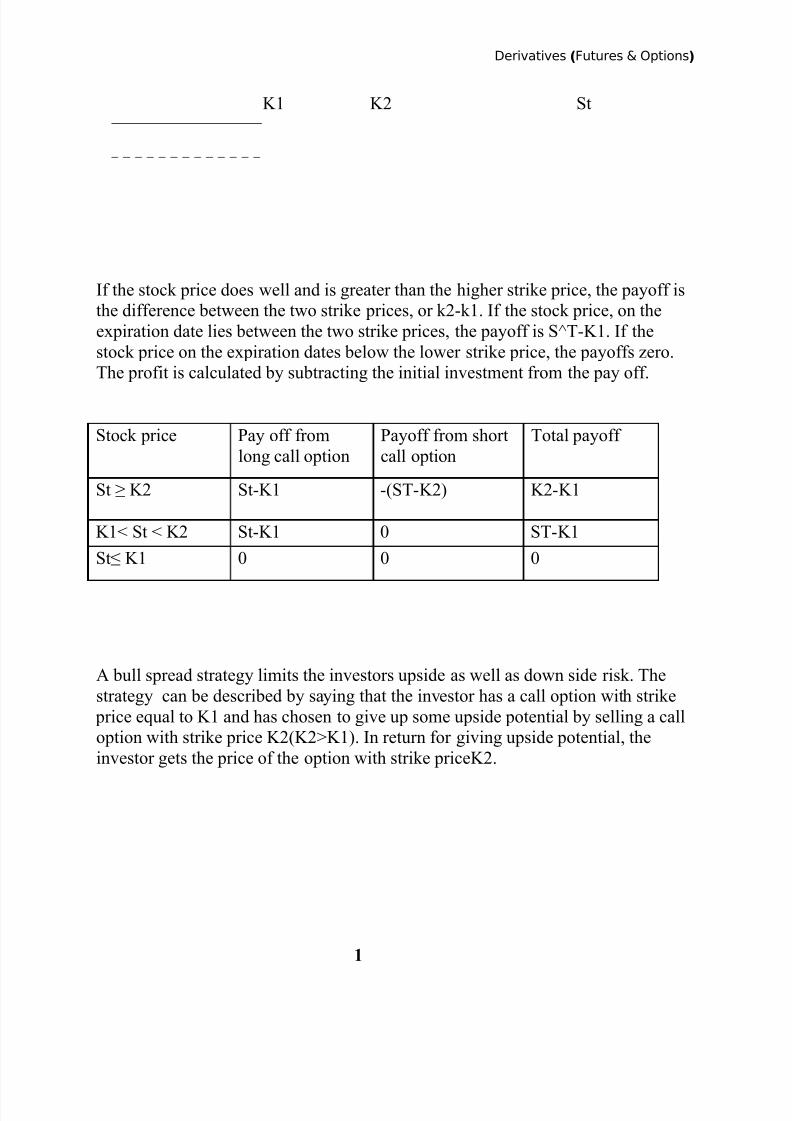
5/13/2018 Derivatives Futures and Options Mba Project - slidepdf.com
http://slidepdf.com/reader/full/derivatives-futures-and-options-mba-project 63/92
Derivatives (Futures & Options)
K1 K2 St
If the stock price does well and is greater than the higher strike price, the payoff is
the difference between the two strike prices, or k2-k1. If the stock price, on the
expiration date lies between the two strike prices, the payoff is S^T-K1. If the
stock price on the expiration dates below the lower strike price, the payoffs zero.
The profit is calculated by subtracting the initial investment from the pay off.
Stock price Pay off from
long call option
Payoff from short
call option
Total payoff
St ≥ K2 St-K1 -(ST-K2) K2-K1
K1< St < K2 St-K1 0 ST-K1
St≤ K1 0 0 0
A bull spread strategy limits the investors upside as well as down side risk. The
strategy can be described by saying that the investor has a call option with strike
price equal to K1 and has chosen to give up some upside potential by selling a call
option with strike price K2(K2>K1). In return for giving upside potential, the
investor gets the price of the option with strike priceK2.
1
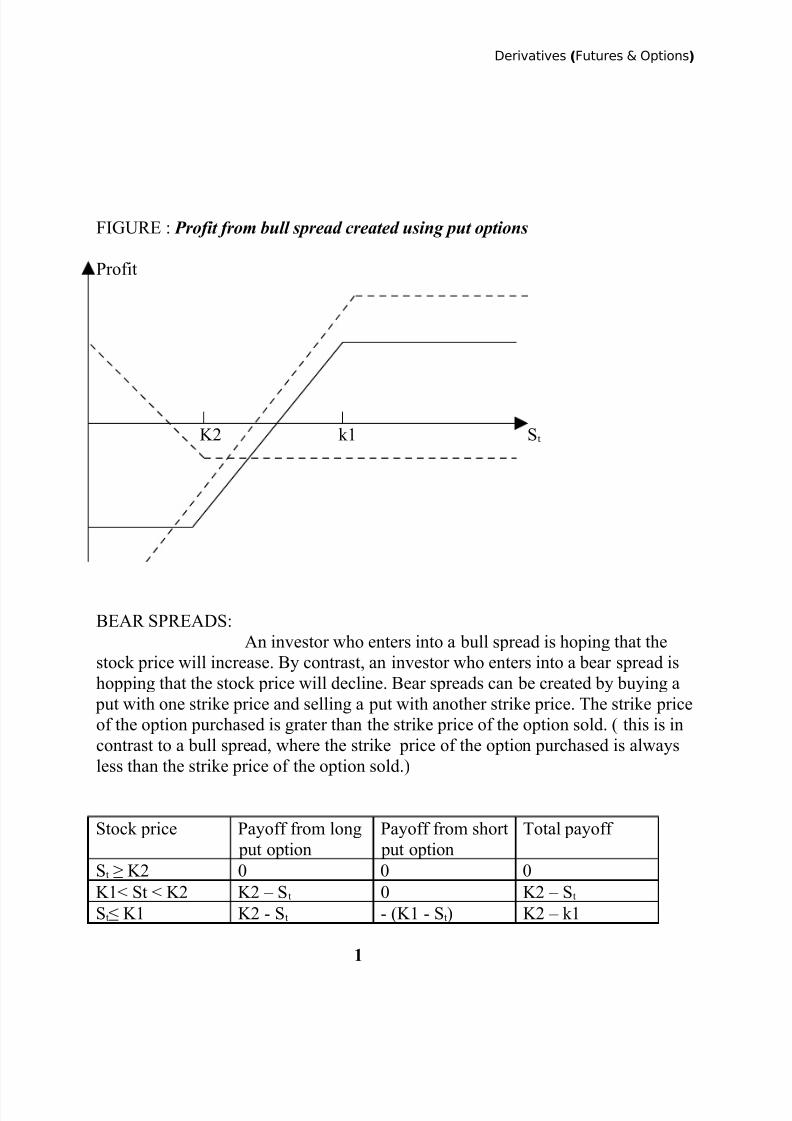
5/13/2018 Derivatives Futures and Options Mba Project - slidepdf.com
http://slidepdf.com/reader/full/derivatives-futures-and-options-mba-project 64/92
Derivatives (Futures & Options)
FIGURE : Profit from bull spread created using put options
Profit
K2 k1 St
BEAR SPREADS:
An investor who enters into a bull spread is hoping that the
stock price will increase. By contrast, an investor who enters into a bear spread is
hopping that the stock price will decline. Bear spreads can be created by buying a
put with one strike price and selling a put with another strike price. The strike price
of the option purchased is grater than the strike price of the option sold. ( this is in
contrast to a bull spread, where the strike price of the option purchased is always
less than the strike price of the option sold.)
Stock price Payoff from long
put option
Payoff from short
put option
Total payoff
St ≥ K2 0 0 0
K1< St < K2 K2 – St 0 K2 – St
St≤ K1 K2 - St - (K1 - St) K2 – k1
1
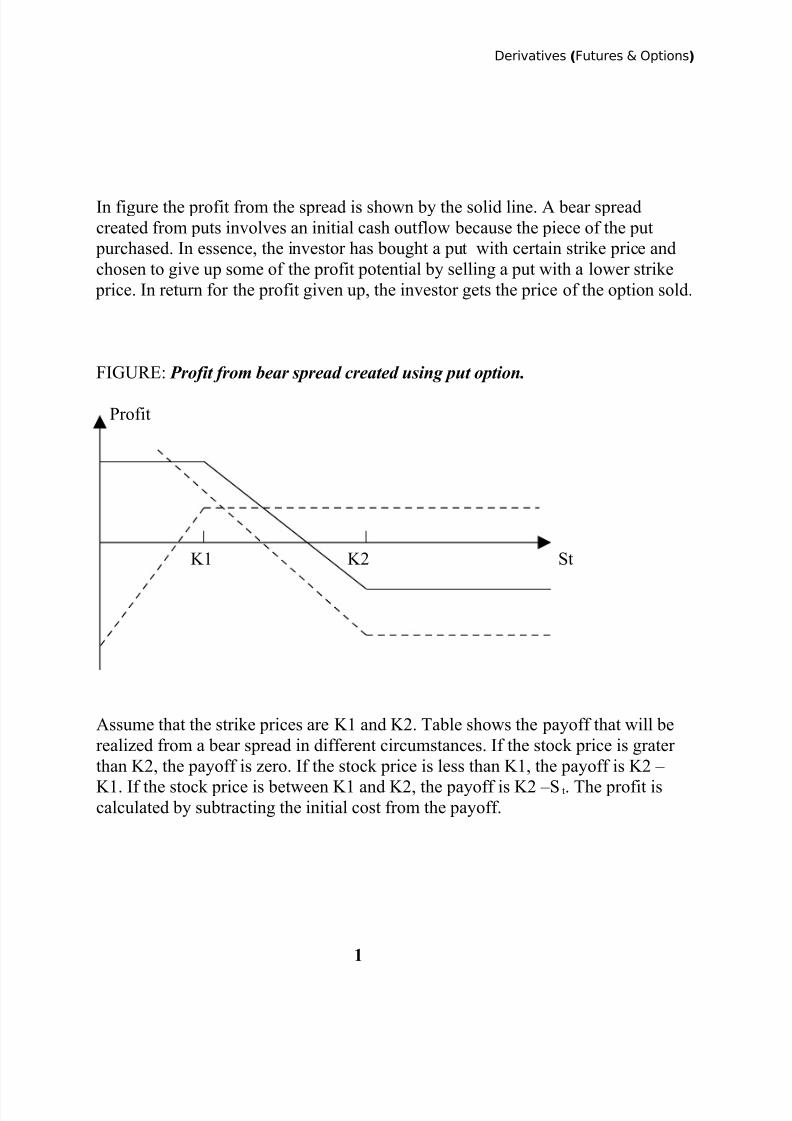
5/13/2018 Derivatives Futures and Options Mba Project - slidepdf.com
http://slidepdf.com/reader/full/derivatives-futures-and-options-mba-project 65/92
Derivatives (Futures & Options)
In figure the profit from the spread is shown by the solid line. A bear spread
created from puts involves an initial cash outflow because the piece of the put
purchased. In essence, the investor has bought a put with certain strike price and
chosen to give up some of the profit potential by selling a put with a lower strike
price. In return for the profit given up, the investor gets the price of the option sold.
FIGURE: Profit from bear spread created using put option.
Profit
K1 K2 St
Assume that the strike prices are K1 and K2. Table shows the payoff that will be
realized from a bear spread in different circumstances. If the stock price is grater
than K2, the payoff is zero. If the stock price is less than K1, the payoff is K2 –
K1. If the stock price is between K1 and K2, the payoff is K2 –St. The profit iscalculated by subtracting the initial cost from the payoff.
1
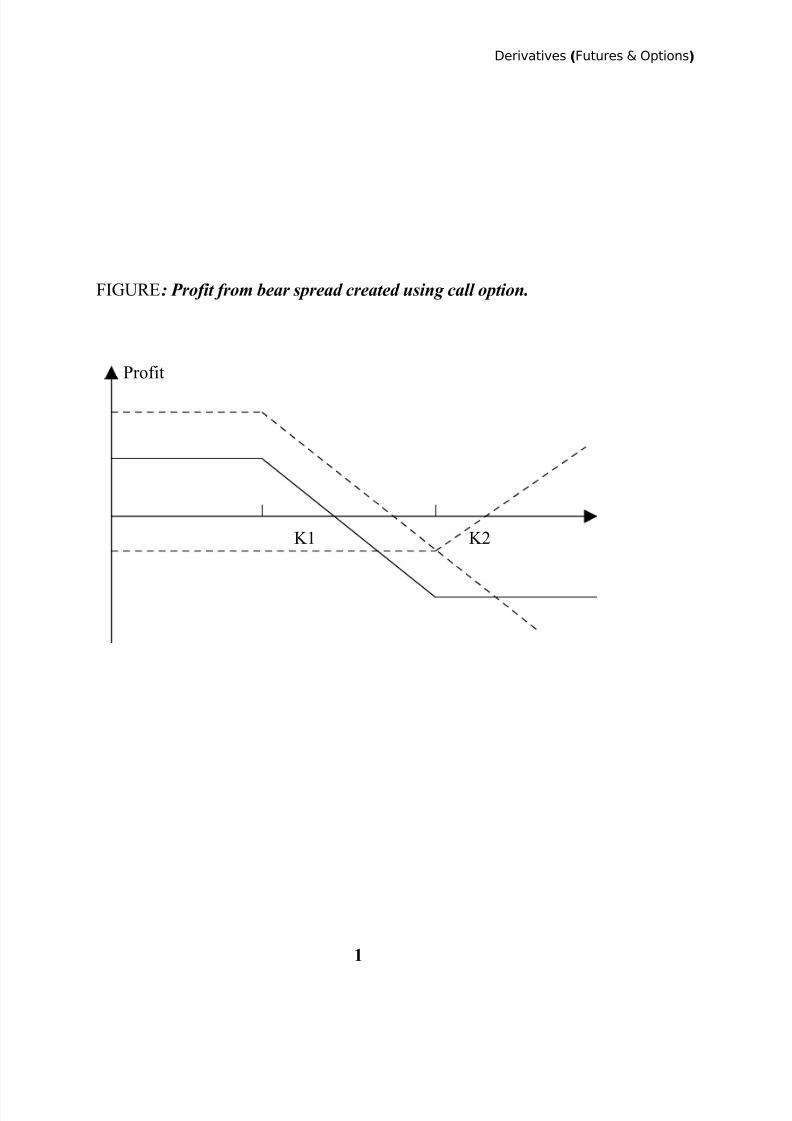
5/13/2018 Derivatives Futures and Options Mba Project - slidepdf.com
http://slidepdf.com/reader/full/derivatives-futures-and-options-mba-project 66/92
Derivatives (Futures & Options)
FIGURE: Profit from bear spread created using call option.
Profit
K1 K2
1
5/13/2018 Derivatives Futures and Options Mba Project - slidepdf.com
http://slidepdf.com/reader/full/derivatives-futures-and-options-mba-project 67/92
Derivatives (Futures & Options)
TECHNICAL ANALYSIS BY USING MOVING AVERAGES:
Price Crosses Moving Average:
Description
A moving average is an indicator that shows the average value of a security's price
over a period of time. This type of Technical Event® occurs when the price crosses
a moving average. Three moving averages are supported: 21, 50 and 200 price
bars. A price cross of a longer moving average indicates a longer term signal, in
that the security may take a longer period of time to move in the anticipateddirection.
A bullish signal is generated when the security's price rises above its moving
average and a bearish signal is generated when the security's price falls below its
moving average.
After a crossover is identified, it is considered "not yet confirmed". Then additional
confirmation is sought by watching the slope of the moving average. A bullish
event is "confirmed" if the moving average turns upward within 'X' price bars,
where 'X' is the period of the moving average. For a bearish event, the movingaverage must turn downward as confirmation. In some cases, the moving average
does not slope in the desired direction soon enough after the crossover, in which
case the event is considered "never confirmed".
These events are based on simple moving averages. A simple moving average is
one where equal weight is given to each price over the calculation period. For
1
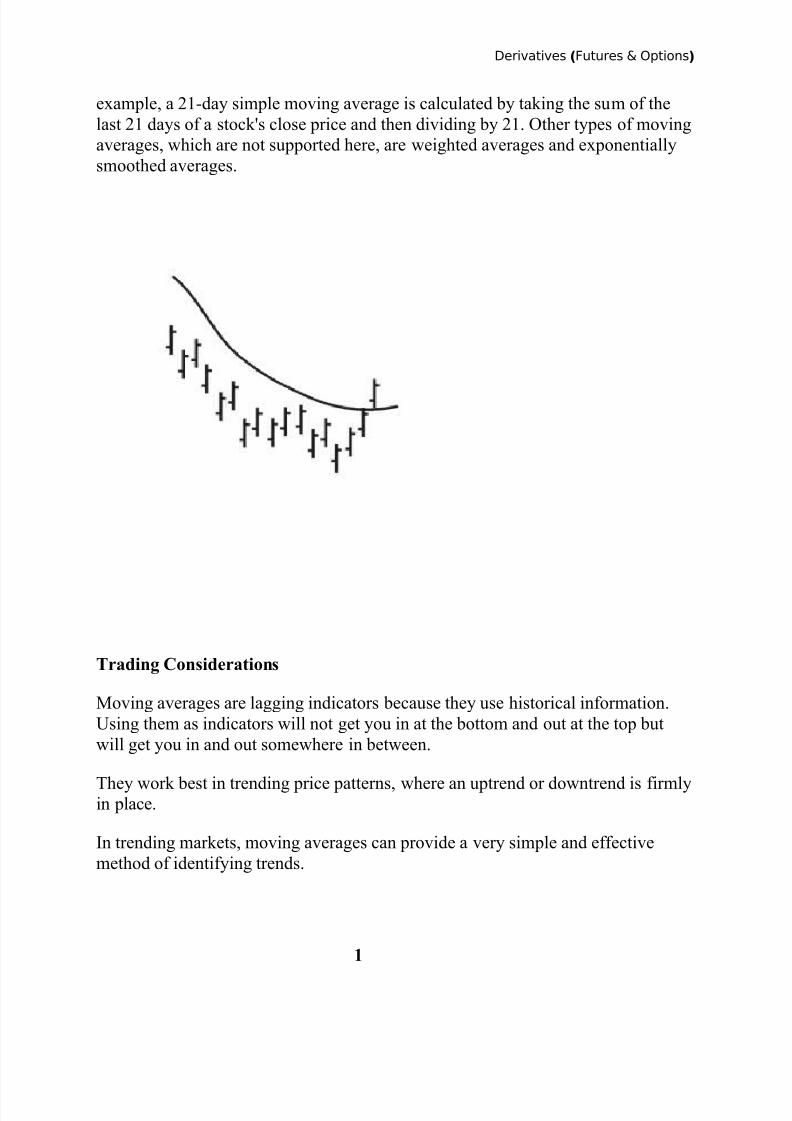
5/13/2018 Derivatives Futures and Options Mba Project - slidepdf.com
http://slidepdf.com/reader/full/derivatives-futures-and-options-mba-project 68/92
Derivatives (Futures & Options)
example, a 21-day simple moving average is calculated by taking the sum of the
last 21 days of a stock's close price and then dividing by 21. Other types of moving
averages, which are not supported here, are weighted averages and exponentially
smoothed averages.
Trading Considerations
Moving averages are lagging indicators because they use historical information.
Using them as indicators will not get you in at the bottom and out at the top but
will get you in and out somewhere in between.
They work best in trending price patterns, where an uptrend or downtrend is firmlyin place.
In trending markets, moving averages can provide a very simple and effective
method of identifying trends.
1
5/13/2018 Derivatives Futures and Options Mba Project - slidepdf.com
http://slidepdf.com/reader/full/derivatives-futures-and-options-mba-project 69/92
Derivatives (Futures & Options)
Moving averages also act as support areas. You will often see a stock in an uptrend
rise well above its 21 day moving average, return to it and then rise again.
Moving averages also act as resistance areas. When a stock trades under a moving
average, that average will serve as a resistance price and it will be difficult for the
stock to move above it. This is often very true when a stock has fallen below its
200 day moving average.
Double Moving Average Crossover:
Description
A moving average is an indicator that shows the average value of a security's price
over a period of time. This type of Technical Event® occurs when a shorter and
longer moving average cross each other. The supported crossovers are 21 crossing
50 (a short term signal) and 50 crossing 200 (a long term signal).
A bullish signal is generated when the shorter moving average crosses above the
longer moving average. A bearish signal is generated when the shorter moving
average crosses below the longer moving average.
These events are based on simple moving averages. A simple moving average isone where equal weight is given to each price over the calculation period. For
example, a 21-day simple moving average is calculated by taking the sum of the
last 21 days of a stock's close price and then dividing by 21. Other types of moving
averages, which are not supported here, are weighted averages and exponentially
smoothed averages.
1
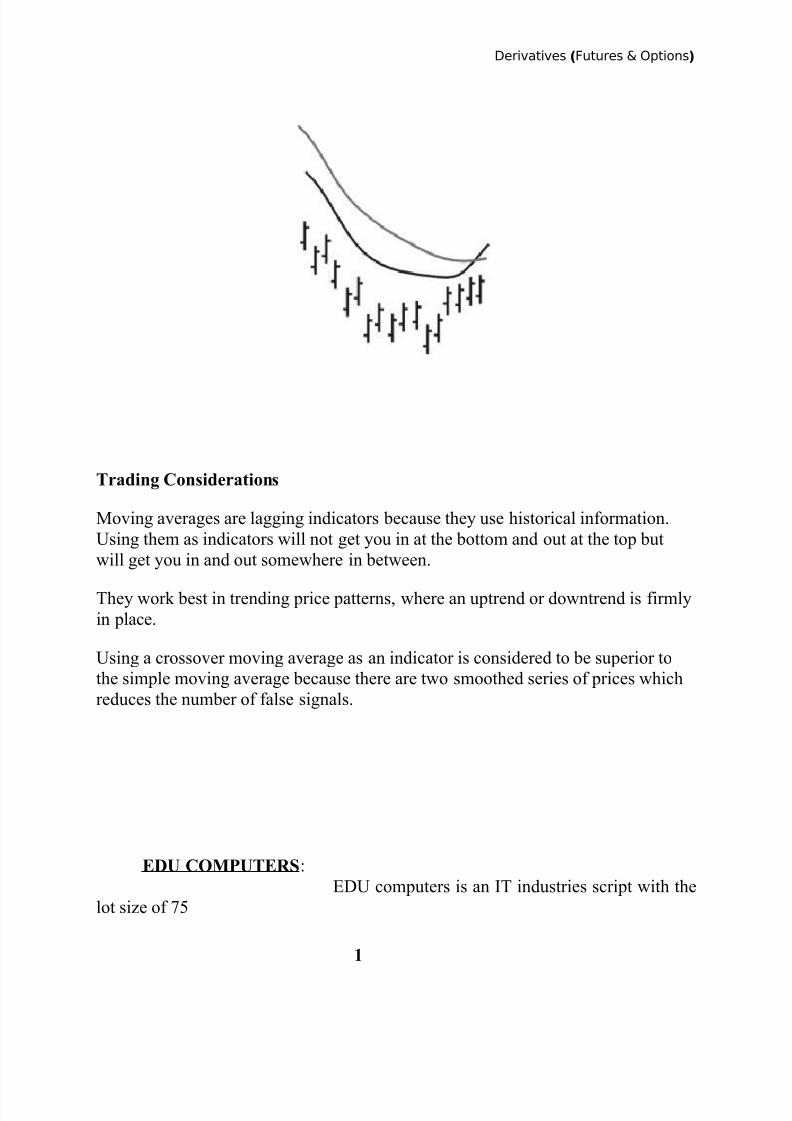
5/13/2018 Derivatives Futures and Options Mba Project - slidepdf.com
http://slidepdf.com/reader/full/derivatives-futures-and-options-mba-project 70/92
Derivatives (Futures & Options)
Trading Considerations
Moving averages are lagging indicators because they use historical information.
Using them as indicators will not get you in at the bottom and out at the top but
will get you in and out somewhere in between.
They work best in trending price patterns, where an uptrend or downtrend is firmly
in place.
Using a crossover moving average as an indicator is considered to be superior to
the simple moving average because there are two smoothed series of prices which
reduces the number of false signals.
EDU COMPUTERS:
EDU computers is an IT industries script with the
lot size of 75
1
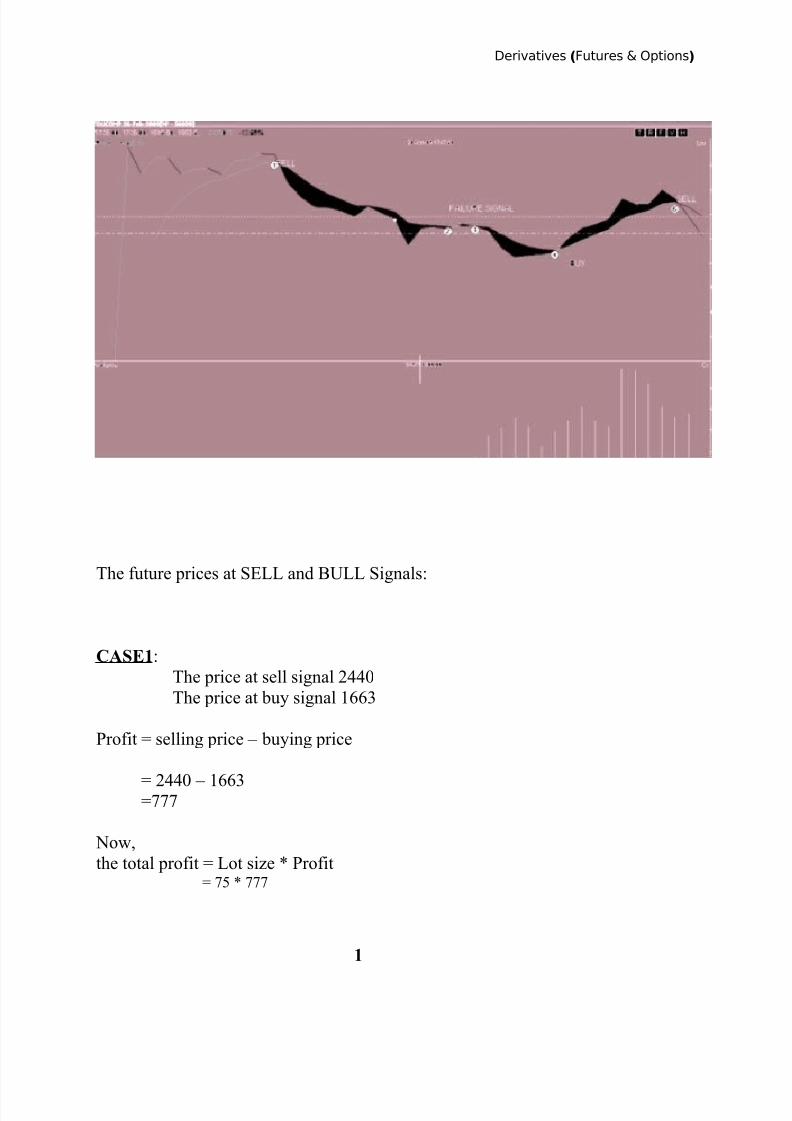
5/13/2018 Derivatives Futures and Options Mba Project - slidepdf.com
http://slidepdf.com/reader/full/derivatives-futures-and-options-mba-project 71/92
Derivatives (Futures & Options)
The future prices at SELL and BULL Signals:
CASE1:
The price at sell signal 2440
The price at buy signal 1663
Profit = selling price – buying price
= 2440 – 1663=777
Now,
the total profit = Lot size * Profit= 75 * 777
1
5/13/2018 Derivatives Futures and Options Mba Project - slidepdf.com
http://slidepdf.com/reader/full/derivatives-futures-and-options-mba-project 72/92
Derivatives (Futures & Options)
TOTAL PROFIT=58275
CASE2:The price at sell signal 1665
The price at buy signal 1663
Profit = selling price – buying price
= 1665-1663
=2
Now,
the total profit = Lot size * Profit= 75 * 2
TOTAL PROFIT=150
CASE3
The price at sell signal 1665
The price at buy signal 1374
Profit = selling price – buying price
= 1665 - 1374
=291 Now,
the total profit = Lot size * Profit= 75 * 291
TOTAL PROFIT=21825
1
5/13/2018 Derivatives Futures and Options Mba Project - slidepdf.com
http://slidepdf.com/reader/full/derivatives-futures-and-options-mba-project 73/92
Derivatives (Futures & Options)
CASE4
The price at sell signal 1945
The price at buy signal 1374
Profit = selling price – buying price
= 1945 - 1374
=571
Now,
the total profit = Lot size * Profit= 75 * 571
TOTAL PROFIT=42825
1
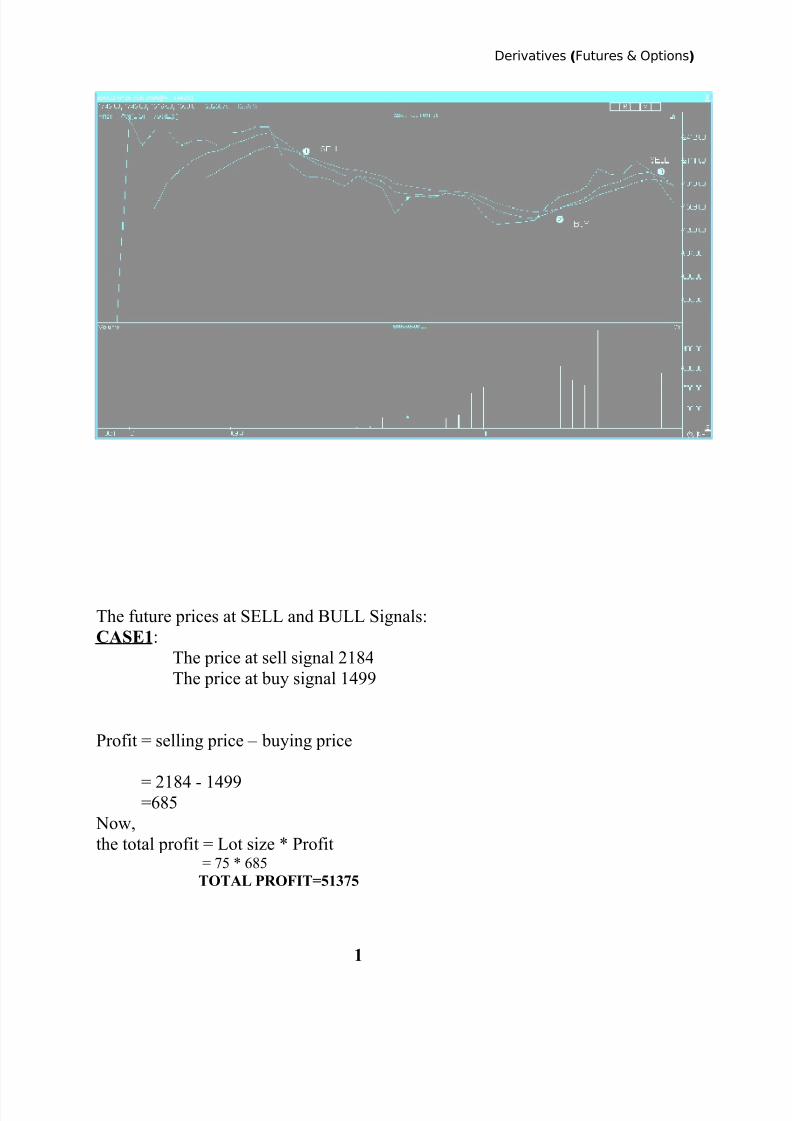
5/13/2018 Derivatives Futures and Options Mba Project - slidepdf.com
http://slidepdf.com/reader/full/derivatives-futures-and-options-mba-project 74/92
Derivatives (Futures & Options)
The future prices at SELL and BULL Signals:
CASE1:
The price at sell signal 2184
The price at buy signal 1499
Profit = selling price – buying price
= 2184 - 1499=685
Now,
the total profit = Lot size * Profit= 75 * 685
TOTAL PROFIT=51375
1
5/13/2018 Derivatives Futures and Options Mba Project - slidepdf.com
http://slidepdf.com/reader/full/derivatives-futures-and-options-mba-project 75/92
Derivatives (Futures & Options)
CASE2:
The price at sell signal 1795The price at buy signal 1499
Profit = selling price – buying price
= 1795 - 1499
=296
Now,
the total profit = Lot size * Profit= 75 * 296
TOTAL PROFIT=22200
1
5/13/2018 Derivatives Futures and Options Mba Project - slidepdf.com
http://slidepdf.com/reader/full/derivatives-futures-and-options-mba-project 76/92
Derivatives (Futures & Options)
CONCLUSIONS
Derivatives market is an innovation to cash market. Approximately
its daily turnover reaches to the equal stage of cash market. The
average daily turnover of the NSE derivative segments
In cash market the profit/loss of the investor depend the market
price of the underlying asset. The investor may incur Hugh profit ts
or he may incur Hugh loss. But in derivatives segment the investor
enjoys Hugh profits with limited downside.
In cash market the investor has to pay the total money, but in
derivatives the investor has to pay premiums or margins, which are
some percentage of total money.
Derivatives are mostly used for hedging purpose.
In derivative segment the profit/loss of the option writer is purely
depend on the fluctuations of the underlying asset.
1
5/13/2018 Derivatives Futures and Options Mba Project - slidepdf.com
http://slidepdf.com/reader/full/derivatives-futures-and-options-mba-project 77/92
Derivatives (Futures & Options)
SUGGESTIONS
In bullish market the call option writer incurs more losses so the
investor is suggested to go for a call option to hold, where as the
put option holder suffers in a bullish market, so he is suggested to
write a put option.
In bearish market the call option holder will incur more losses so
the investor is suggested to go for a call option to write, where as
the put option writer will get more losses, so he is suggested to hold
a put option.
In the above analysis the market price of ONGC is having low volatility,
so the call option writer enjoys more profits to holders.
The derivative market is newly started in India and it is not
known by every investor, so SEBI has to take steps to create
awareness among the investors about the derivative segment.
In order to increase the derivatives market in India, SEBI should
revise some of their regulations like contract size, participation of
FII in the derivatives market.
Contract size should be minimized because small investors
cannot afford this much of huge premiums.
SEBI has to take further steps in the risk management mechanism.
SEBI has to take measures to use effectively the derivatives
segment as a tool of hedging.
1
5/13/2018 Derivatives Futures and Options Mba Project - slidepdf.com
http://slidepdf.com/reader/full/derivatives-futures-and-options-mba-project 78/92
Derivatives (Futures & Options)
BIBLIOGRAPHY
BOOKS :-
Derivatives Dealers Module Work Book - NCFM
Financial Market and Services - GORDAN &
NATRAJAN
Financial Management - PRASANNA CHANDRA
NEWS PAPERS :-
Economic times
Times of India
Business Standard
MAGAZINES :-
Business Today
Business world
Business India
WEBSITES :-
www.derivativesindia.com
www.indianinfoline.com
www.nseindia.com
www.bseindia.com www.sebi.gov.in
www.google.com(Derivatives market)
1
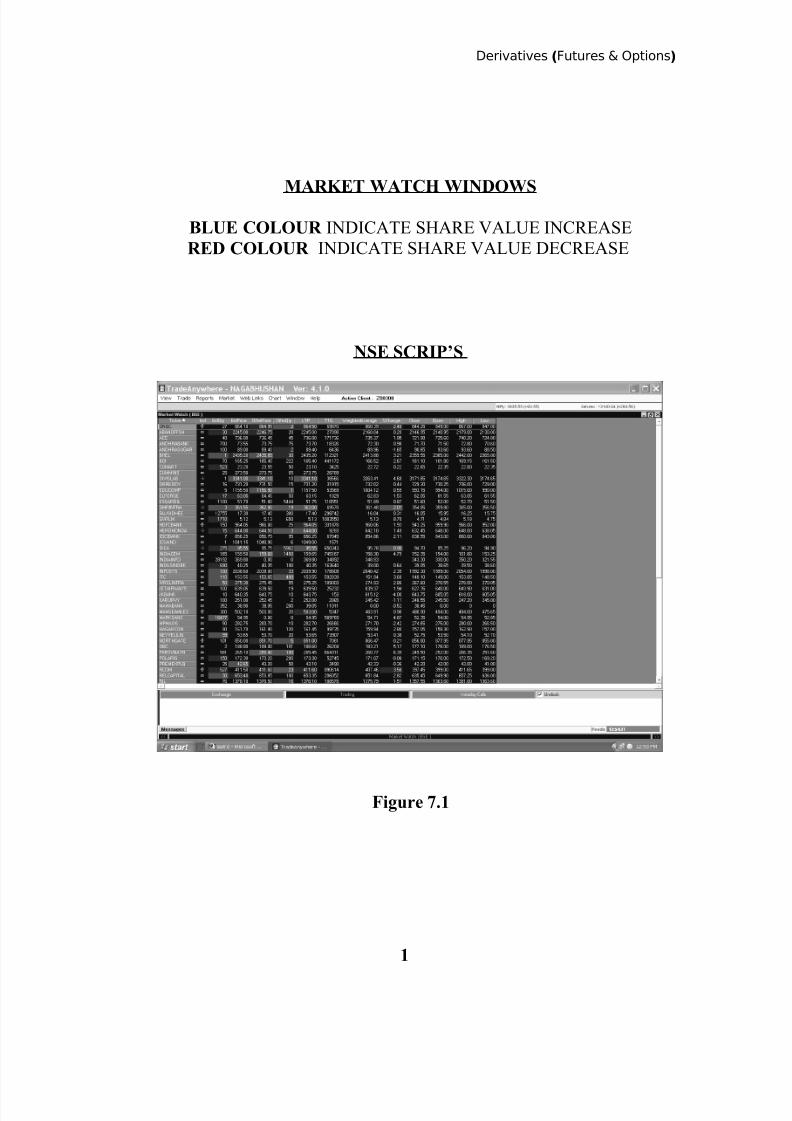
5/13/2018 Derivatives Futures and Options Mba Project - slidepdf.com
http://slidepdf.com/reader/full/derivatives-futures-and-options-mba-project 79/92
Derivatives (Futures & Options)
MARKET WATCH WINDOWSBLUE COLOUR INDICATE SHARE VALUE INCREASE
RED COLOUR INDICATE SHARE VALUE DECREASE
NSE SCRIP’S
Figure 7.1
1

5/13/2018 Derivatives Futures and Options Mba Project - slidepdf.com
http://slidepdf.com/reader/full/derivatives-futures-and-options-mba-project 80/92
Derivatives (Futures & Options)
NSE & BSE SCRIP’S
Figure 7.2
1

5/13/2018 Derivatives Futures and Options Mba Project - slidepdf.com
http://slidepdf.com/reader/full/derivatives-futures-and-options-mba-project 81/92
Derivatives (Futures & Options)
BUY ORDER FORM
Figure 7.3
1
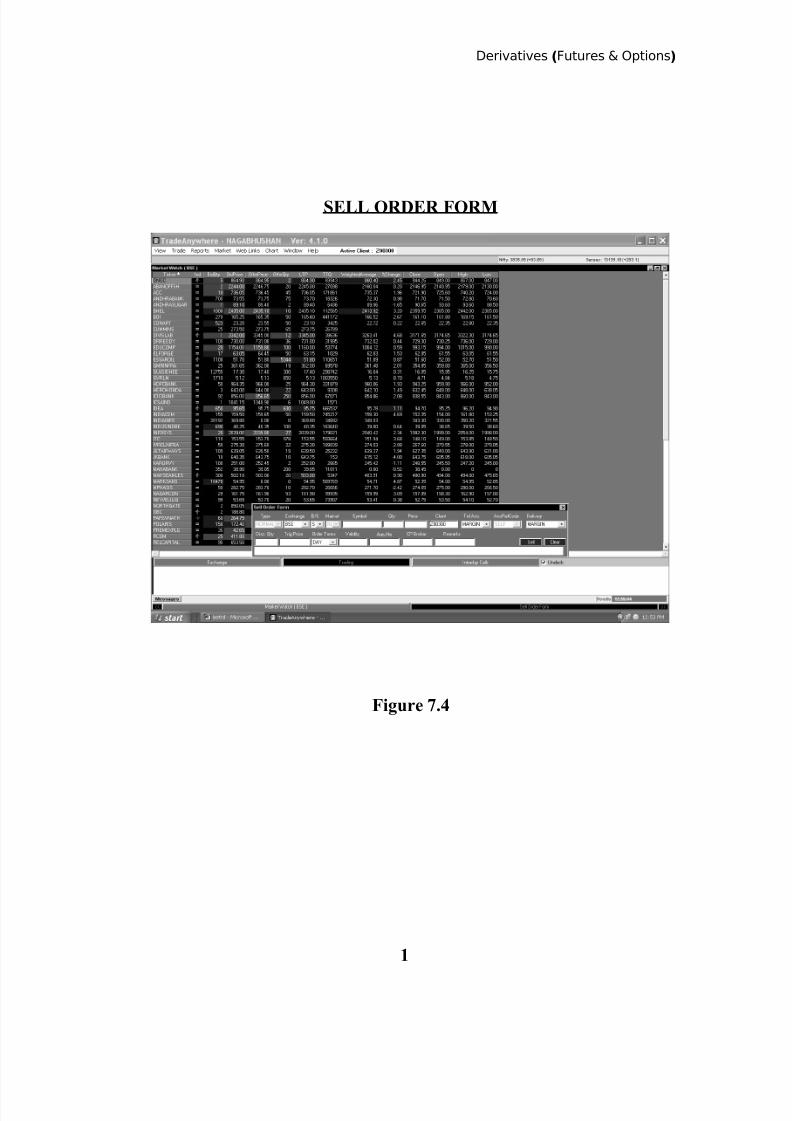
5/13/2018 Derivatives Futures and Options Mba Project - slidepdf.com
http://slidepdf.com/reader/full/derivatives-futures-and-options-mba-project 82/92
Derivatives (Futures & Options)
SELL ORDER FORM
Figure 7.4
1

5/13/2018 Derivatives Futures and Options Mba Project - slidepdf.com
http://slidepdf.com/reader/full/derivatives-futures-and-options-mba-project 83/92
Derivatives (Futures & Options)
MARKET DEPTH
Figure 7.5
1
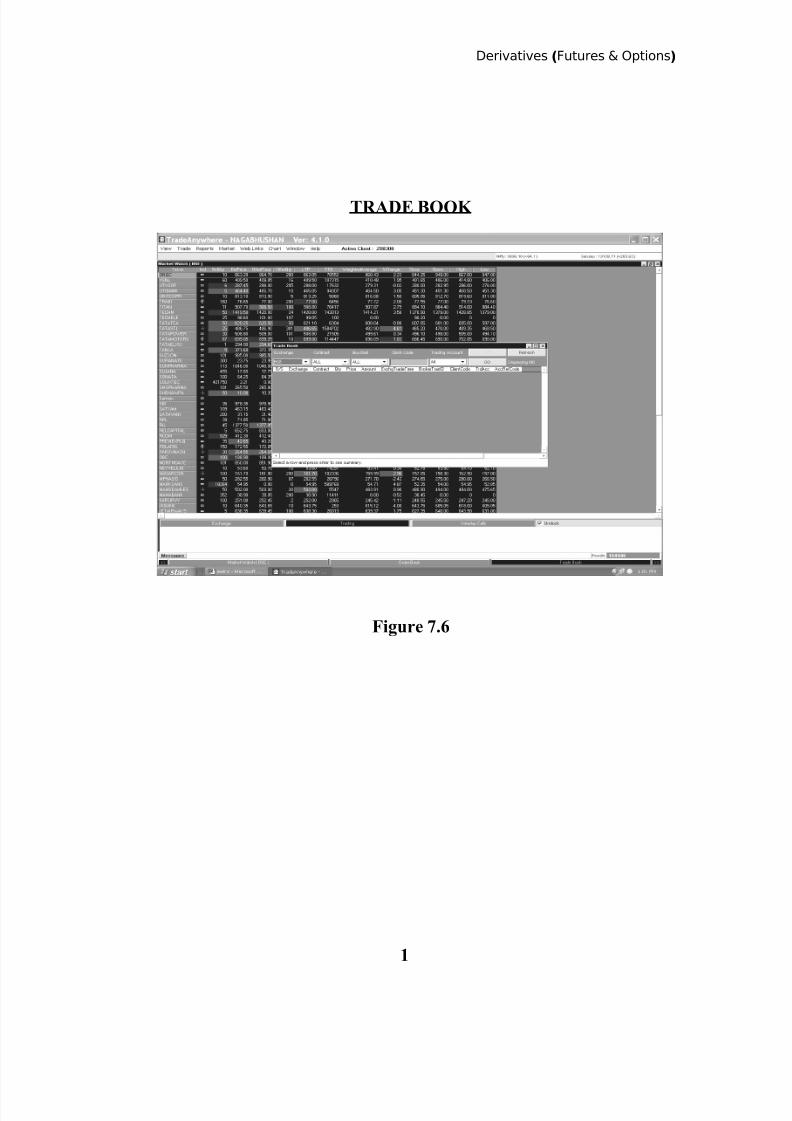
5/13/2018 Derivatives Futures and Options Mba Project - slidepdf.com
http://slidepdf.com/reader/full/derivatives-futures-and-options-mba-project 84/92
Derivatives (Futures & Options)
TRADE BOOK
Figure 7.6
1
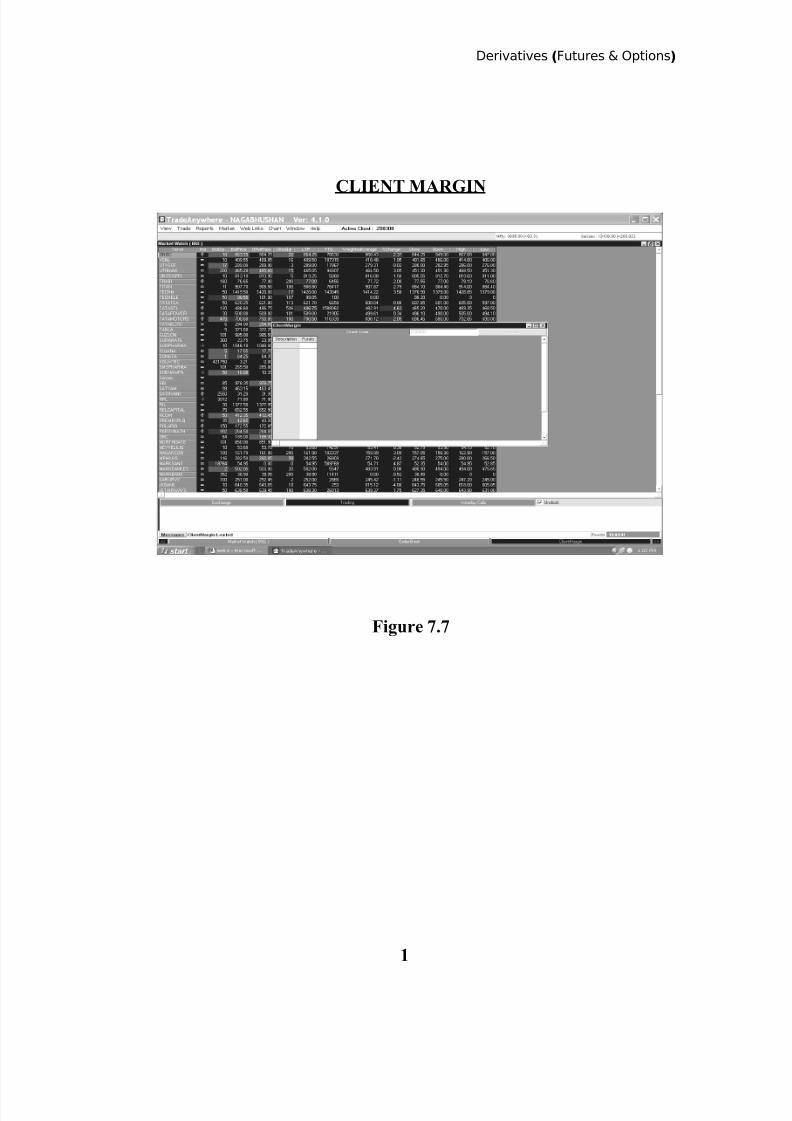
5/13/2018 Derivatives Futures and Options Mba Project - slidepdf.com
http://slidepdf.com/reader/full/derivatives-futures-and-options-mba-project 85/92
Derivatives (Futures & Options)
CLIENT MARGIN
Figure 7.7
1
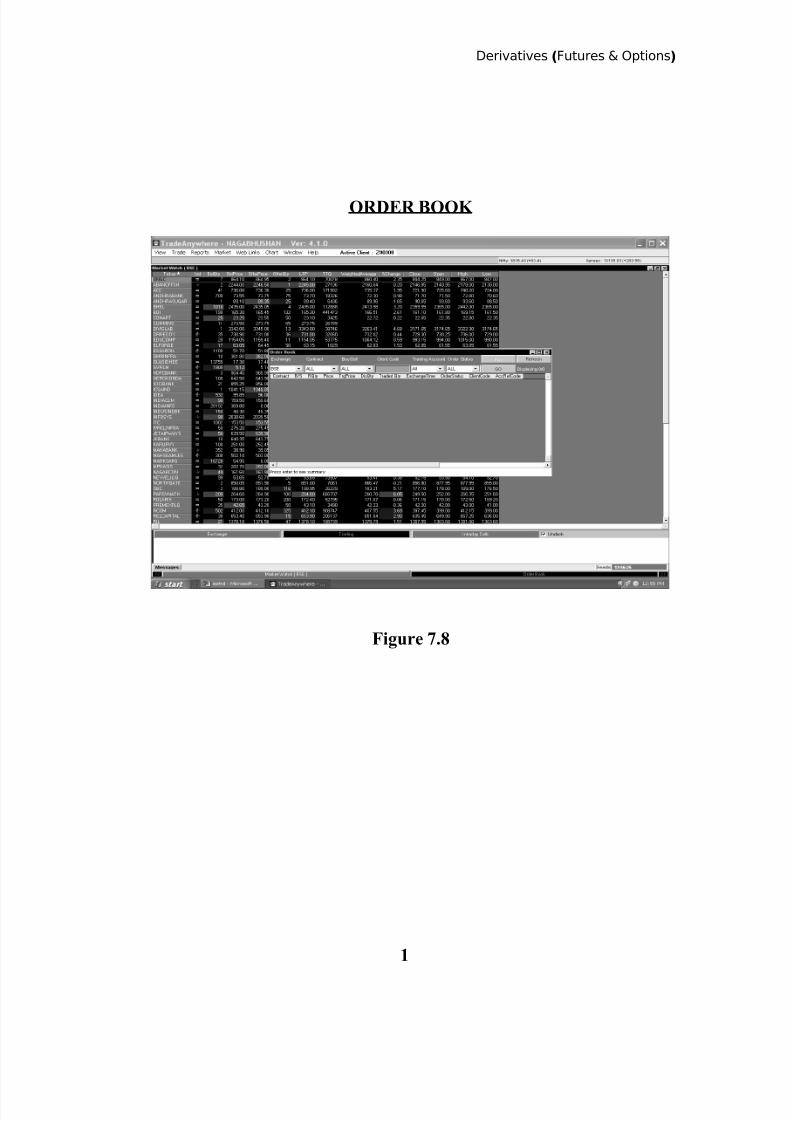
5/13/2018 Derivatives Futures and Options Mba Project - slidepdf.com
http://slidepdf.com/reader/full/derivatives-futures-and-options-mba-project 86/92
Derivatives (Futures & Options)
ORDER BOOK
Figure 7.8
1
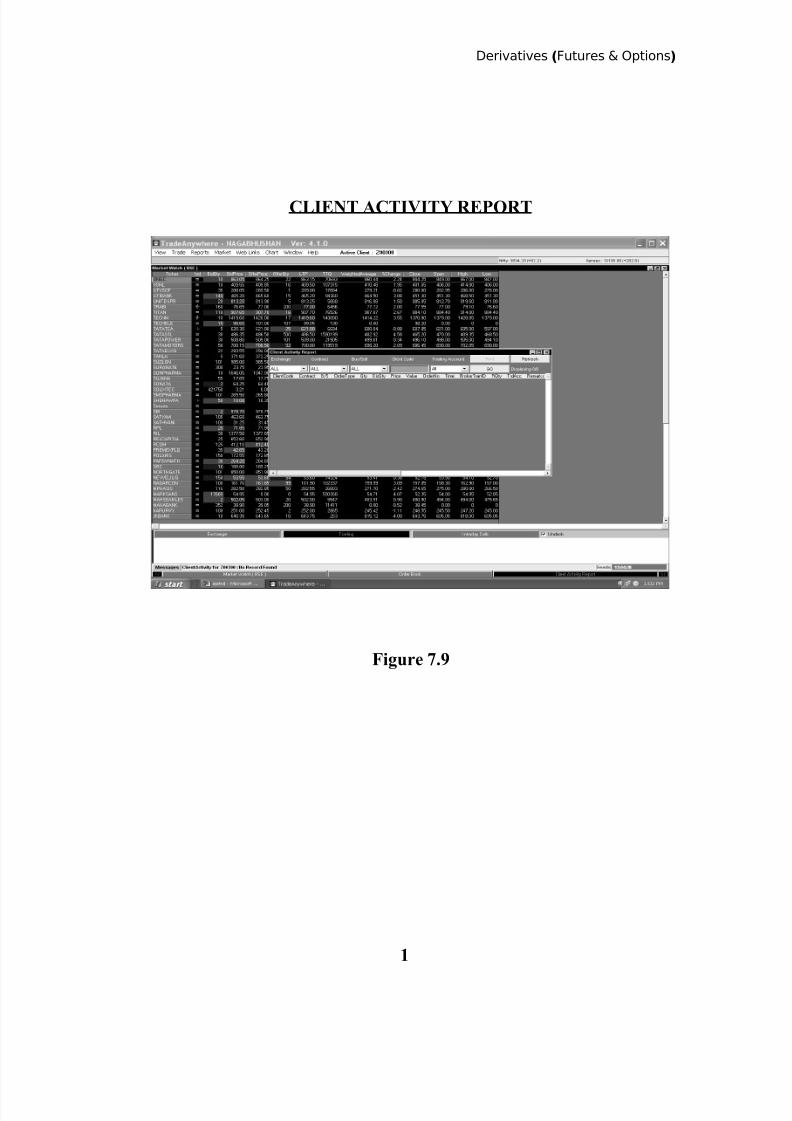
5/13/2018 Derivatives Futures and Options Mba Project - slidepdf.com
http://slidepdf.com/reader/full/derivatives-futures-and-options-mba-project 87/92
Derivatives (Futures & Options)
CLIENT ACTIVITY REPORT
Figure 7.9
1
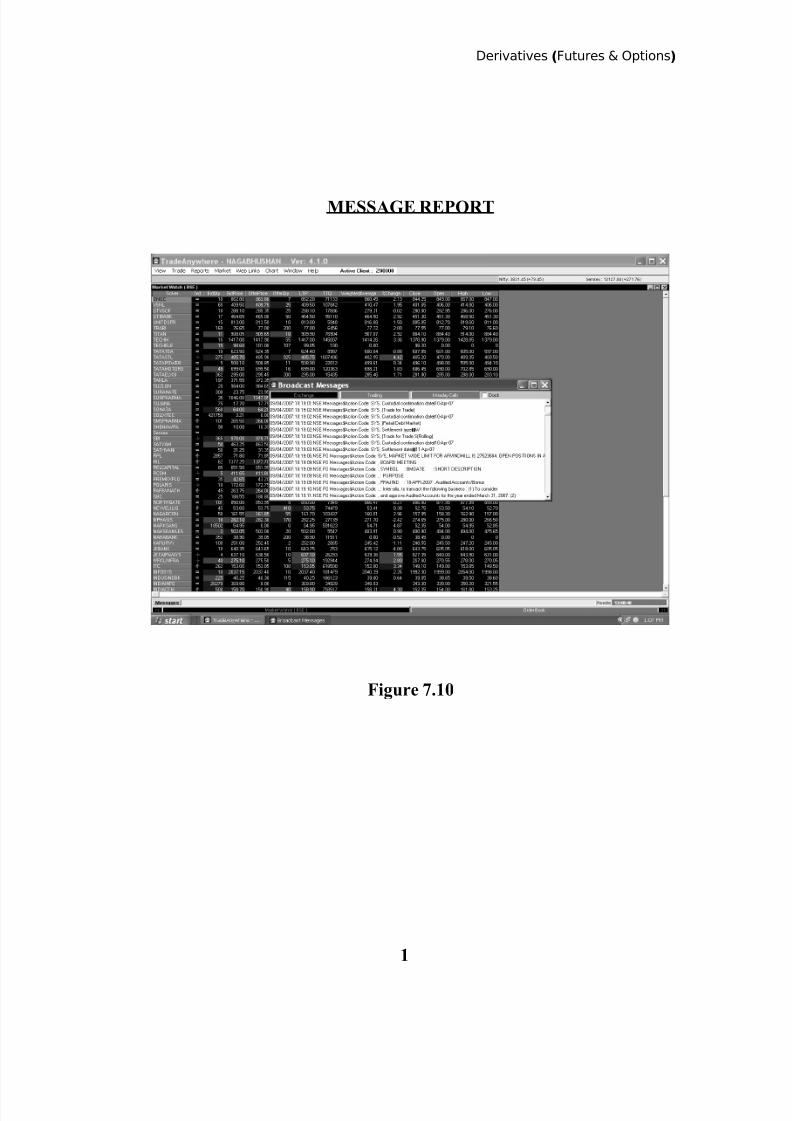
5/13/2018 Derivatives Futures and Options Mba Project - slidepdf.com
http://slidepdf.com/reader/full/derivatives-futures-and-options-mba-project 88/92
Derivatives (Futures & Options)
MESSAGE REPORT
Figure 7.10
1
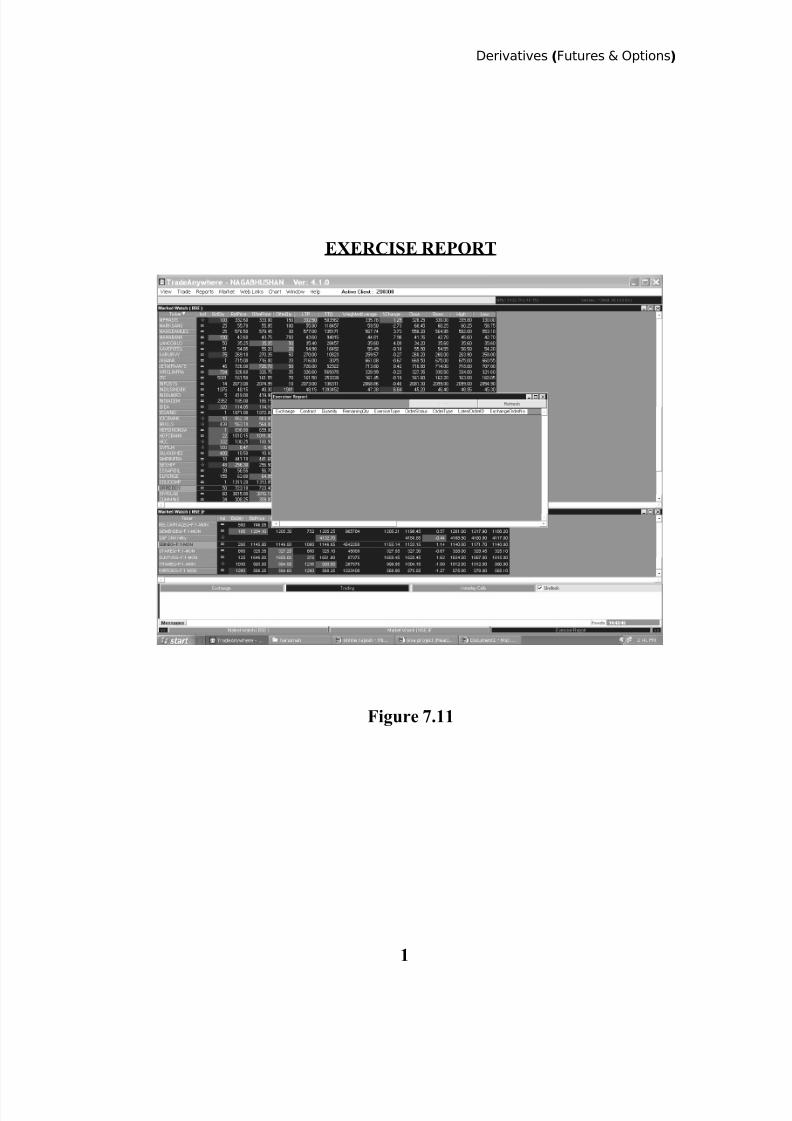
5/13/2018 Derivatives Futures and Options Mba Project - slidepdf.com
http://slidepdf.com/reader/full/derivatives-futures-and-options-mba-project 89/92
Derivatives (Futures & Options)
EXERCISE REPORT
Figure 7.11
1
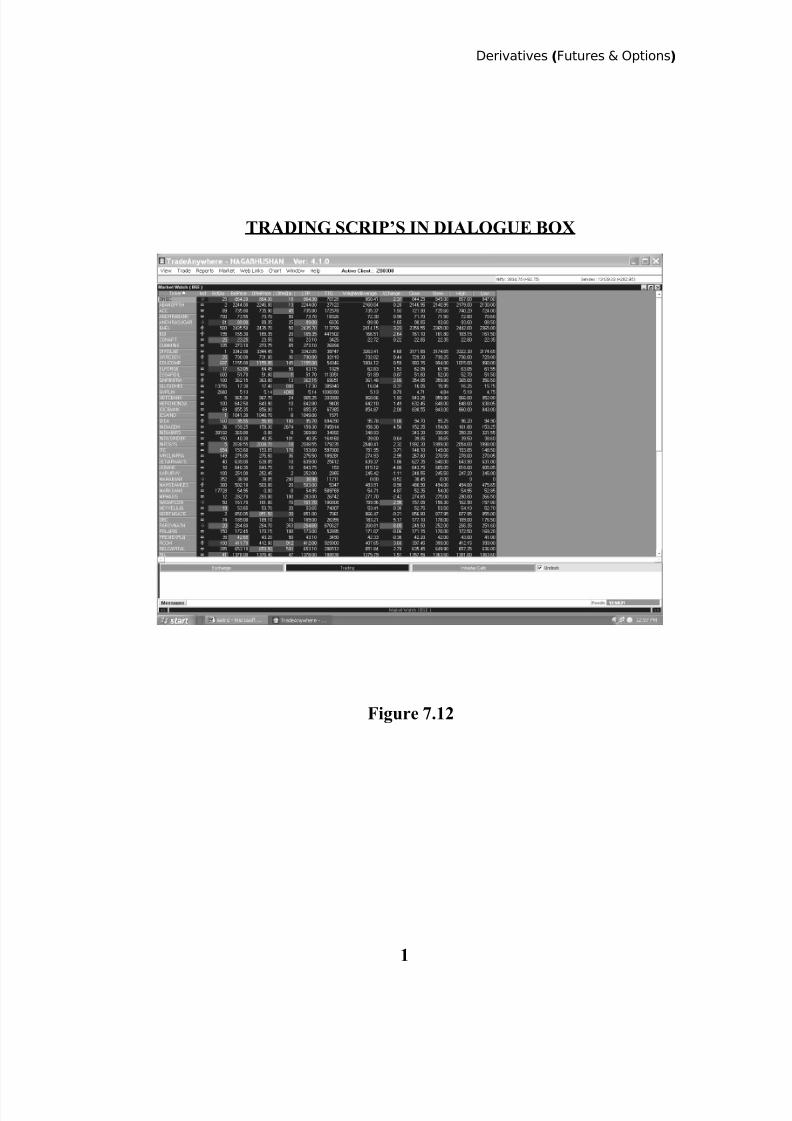
5/13/2018 Derivatives Futures and Options Mba Project - slidepdf.com
http://slidepdf.com/reader/full/derivatives-futures-and-options-mba-project 90/92
Derivatives (Futures & Options)
TRADING SCRIP’S IN DIALOGUE BOX
Figure 7.12
1
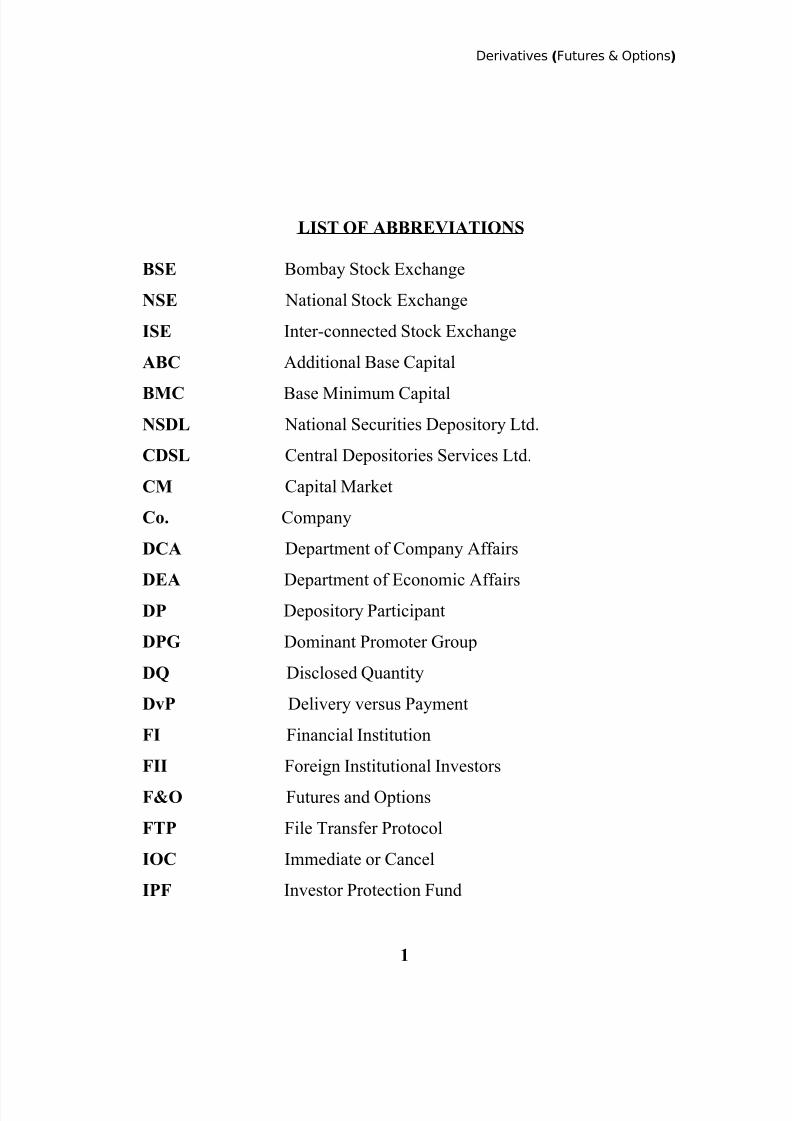
5/13/2018 Derivatives Futures and Options Mba Project - slidepdf.com
http://slidepdf.com/reader/full/derivatives-futures-and-options-mba-project 91/92
Derivatives (Futures & Options)
LIST OF ABBREVIATIONS
BSE Bombay Stock Exchange
NSE National Stock Exchange
ISE Inter-connected Stock Exchange
ABC Additional Base Capital
BMC Base Minimum Capital
NSDL National Securities Depository Ltd.
CDSL Central Depositories Services Ltd.
CM Capital Market
Co. Company
DCA Department of Company Affairs
DEA Department of Economic AffairsDP Depository Participant
DPG Dominant Promoter Group
DQ Disclosed Quantity
DvP Delivery versus Payment
FI Financial Institution
FII Foreign Institutional Investors
F&O Futures and Options
FTP File Transfer Protocol
IOC Immediate or Cancel
IPF Investor Protection Fund
1
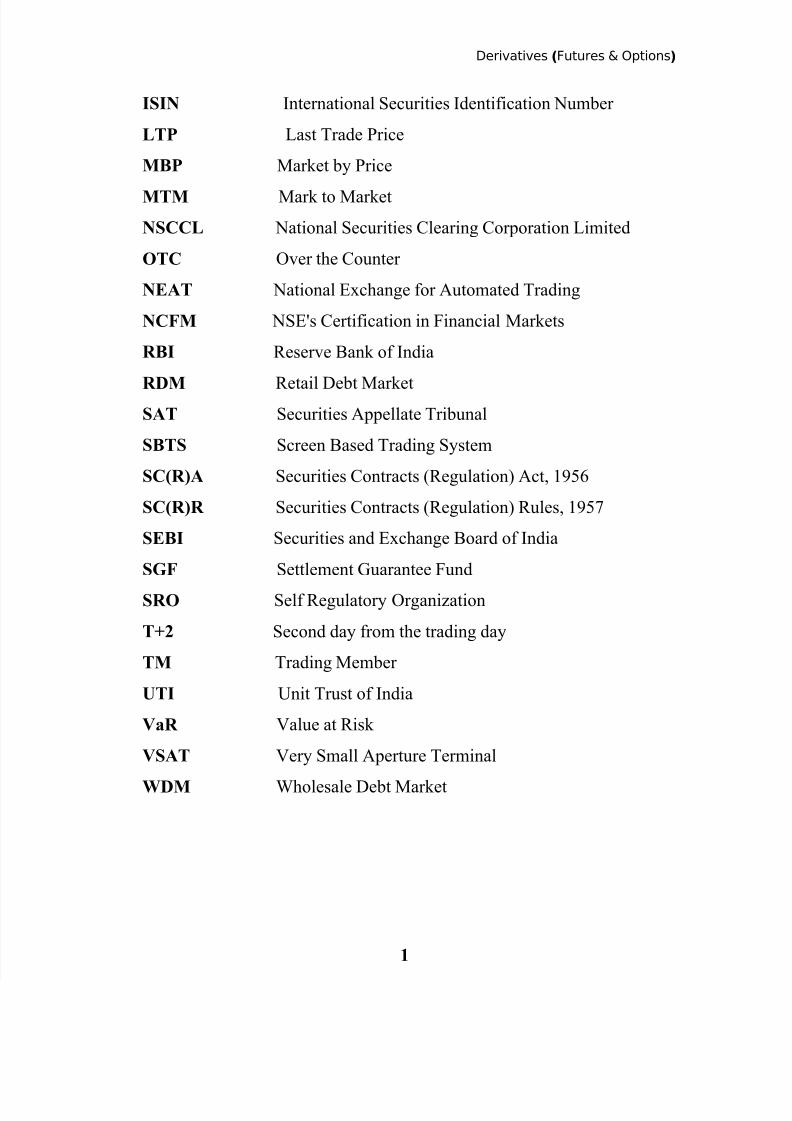
5/13/2018 Derivatives Futures and Options Mba Project - slidepdf.com
http://slidepdf.com/reader/full/derivatives-futures-and-options-mba-project 92/92
Derivatives (Futures & Options)
ISIN International Securities Identification Number
LTP Last Trade Price
MBP Market by Price
MTM Mark to Market
NSCCL National Securities Clearing Corporation Limited
OTC Over the Counter
NEAT National Exchange for Automated Trading
NCFM NSE's Certification in Financial Markets
RBI Reserve Bank of India
RDM Retail Debt MarketSAT Securities Appellate Tribunal
SBTS Screen Based Trading System
SC(R)A Securities Contracts (Regulation) Act, 1956
SC(R)R Securities Contracts (Regulation) Rules, 1957
SEBI Securities and Exchange Board of India
SGF Settlement Guarantee Fund
SRO Self Regulatory Organization
T+2 Second day from the trading day
TM Trading Member
UTI Unit Trust of India
VaR Value at Risk
VSAT Very Small Aperture Terminal
WDM Wholesale Debt Market
1