descanso design and performance summary seriesdescanso design and performance summary series article...
TRANSCRIPT


DESCANSO Design and Performance Summary Series
Article 2Deep Space 1Telecommunications
Jim TaylorJet Propulsion Laboratory
Michela Muñoz FernándezDoctoral CandidateCalifornia Institute of Technology
Ana I. Bolea AlamanacTelefónica de España, Madrid
Kar-Ming CheungJet Propulsion Laboratory
National Aeronautics andSpace Administration
Jet Propulsion LaboratoryCalifornia Institute of TechnologyPasadena, California
October 2001

This research was carried out at the Jet Propulsion Laboratory, California Institute of Technology,
under a contract with the National Aeronautics and Space Administration.

DESCANSO DESIGN AND PERFORMANCE SUMMARY SERIES
Issued by the Deep-Space Communications and Navigation SystemsCenter of Excellence
Jet Propulsion LaboratoryCalifornia Institute of Technology
Joseph H. Yuen, Editor-in-Chief
Previously Published Articles in This Series
Article 1—“Mars Global Surveyor Telecommunications”Jim Taylor, Kar-Ming Cheung, and Chao-Jen Wong


v
Table of Contents
Foreword .................................................................................................................................. ixPreface ....................................................................................................................................... xAcknowledgments ....................................................................................................................... x
Section 1 Mission and Spacecraft Description .................................................................. 11.1 Technology Validation ...................................................................................... 1
1.1.1 Mission Overview .................................................................................. 21.1.2 Telecom System Overview .................................................................... 3
Section 2 Telecom System Requirements ......................................................................... 4
Section 3 Telecom System Description ............................................................................. 6
Section 4 DS1 Telecom Technology ............................................................................... 104.1 Small Deep-Space Transponder ....................................................................... 10
4.1.1 Uplink-Receiving Functions ................................................................ 104.1.2 Downlink-Transmitting Functions ....................................................... 114.1.3 Radio Metrics ....................................................................................... 114.1.4 SDST Performance Monitoring and Spacecraft Data Interfaces ......... 11
4.2 Ka-Band Solid-State Power Amplifier (KaPA) ............................................... 124.2.1 KaPA and Ka-Band Overview ............................................................. 124.2.2 KaPA and Ka-Band In-Flight Technology Validation ........................ 13
4.3 Beacon Monitor Operations Experiment ......................................................... 134.3.1 Beacon System Concept Description ................................................... 134.3.2 The DS1 Beacon Monitor Operations Experiment .............................. 15
4.4 Telecom System Mass and Input Power .......................................................... 16
Section 5 Telecom Ground System Description .............................................................. 175.1 Uplink and Downlink Carrier Operation ......................................................... 17
5.1.1 The 34-Meter Station (DSS-25) ........................................................... 185.1.2 The 70-Meter Stations (DSS-14 and DSS-43) ..................................... 18
5.2 Radiometric Data (Doppler and Ranging) ....................................................... 215.2.1 Ground Systems for Doppler Data ....................................................... 225.2.2 Ground Systems for Ranging Data ...................................................... 235.2.3 Ground Processing of Navigation Data ............................................... 23
5.3 Command Processing and Radiation ............................................................... 245.4 Telemetry Demodulation, Decoding, Synchronization, and Display .............. 25

Table of Contents vi
Section 6 Telecom Link Performance ............................................................................. 28
Section 7 Operational Scenarios ...................................................................................... 427.1 Launch ............................................................................................................. 427.2 Safing ............................................................................................................... 437.3 Anchor Pass (at HGA Earth Point, High Rate) ................................................ 437.4 Midweek Pass (at Thrust Attitude for IPS Operation) ..................................... 447.5 High-Gain-Antenna Activity (January–June 2000, March 2001) ................... 45
7.5.1 Stopping the Antenna Near Earth by Using the Planning Worksheet ............................................................................. 46
7.5.2 Keeping the Antenna Pointed Near Earth by Monitoring Signal Levels ........................................................................................ 46
7.6 Solar Conjunction ............................................................................................ 487.7 Ka-Band Downlink .......................................................................................... 49
Section 8 Lessons Learned .............................................................................................. 518.1 Telecom-Related Lessons Learned .................................................................. 51
8.1.1 Telecom Pre-Launch Testing ............................................................... 518.1.2 Development-to-Operations “Handover” ............................................ 518.1.3 Flight Team Telecom-Support Level ................................................... 528.1.4 Effective Staffing Mix ......................................................................... 528.1.5 Flight Team Co-Location, Near the MSA ........................................... 528.1.6 Effective, Easy-to-Use Data Displays ................................................. 528.1.7 Querying Data ...................................................................................... 538.1.8 Telecom-Sequencing Standardization ................................................. 538.1.9 Need for an As-Flown Sequence ......................................................... 538.1.10 Simultaneous Update ........................................................................... 538.1.11 Service Packages and DSN Keyword Files ......................................... 54
8.2 Project-Level Lessons Learned ........................................................................ 548.2.1 Project Management ............................................................................ 548.2.2 Organization-and-Team Dynamics ...................................................... 548.2.3 Reviews ................................................................................................ 558.2.4 Advanced Technologies ....................................................................... 558.2.5 Communications and Data Transfer .................................................... 558.2.6 Assembly, Test, and Launch Operations ............................................. 558.2.7 Operations ............................................................................................ 558.2.8 Contingency Procedures ...................................................................... 558.2.9 Operations-Testbed Environment ........................................................ 558.2.10 Single-String Teams ............................................................................ 568.2.11 External Communications .................................................................... 568.2.12 Science in a Technology-Validation Mission ...................................... 56
References ................................................................................................................................ 57Additional Resources ............................................................................................................... 59Abbreviations and Acronyms .................................................................................................. 60

Table of Contents vii
List of Figures
Fig. 3-1. DS1 spacecraft telecom system functional block diagram. ............................... 7Fig. 3-2. Launch mode configuration, with telecom system components. ....................... 8Fig. 3-3. LGA downlink pattern (relative gain as a function of angle from boresight). .. 8Fig. 3-4. HGA downlink pattern (relative gain as a function of angle from boresight). .. 9Fig. 3-5. KHA pattern (relative gain as a function of angle from boresight). .................. 9Fig. 4-1. The Small Deep-Space Transponder (SDST). ................................................. 11Fig. 4-2. Ka-band power amplifier (KaPA). ................................................................... 12Fig. 4-3. Beacon monitoring system elements building on DS1 BMOX
demonstration concepts. ....................................................................................14Fig. 5-1. DSS-25 functional diagram (X-band uplink/downlink,
Ka-band downlink). ......................................................................................... 19Fig. 5-2. DSS-14 and DSS-43 functional-block diagram
(X-band uplink and downlink). ........................................................................ 20Fig. 5-3. DSN ranging system (from [13], 810-5, Rev. D, module TRK-30). ............... 21Fig. 5-4. DSN Doppler system (from [13], 810-5, Rev. D, module TRK-20). ...............22Fig. 5-5. DSN end-to-end radiometric data-flow diagram (from 871-010-030). ........... 22Fig. 5-6. DSN end-to-end command data-flow diagram (from 871-010-030). .............. 24Fig. 5-7. DSN demodulation and production of telemetry data (from 871-010-030). ... 26Fig. 5-8. DSN end-to-end telemetry-data-flow diagram (from 871-010-030). .............. 27Fig. 6-1. Downlink Pr/No and uplink Eb/No. ................................................................ 40Fig. 6-2. Station elevation angle and downlink telemetry symbol SNR. ....................... 41Fig. 7-1. Replica of “HGA Activity Planning Spreadsheet” for
May 26, 2000 activity. ..................................................................................... 47
List of Tables
Table 4-1. DS1 telecom system mass and power summary. ............................................. 16Table 6-1. DS1 uplink (command and ranging) DCT. ...................................................... 30Table 6-2. DS1 downlink (telemetry and ranging) DCT. .................................................. 33Table 6-3. DS1 ranging performance (uplink and downlink) DCT. ................................. 37


ix
Foreword
This Design and Performance Summary Series, issued by the Deep Space Communica-tions and Navigation Systems Center of Excellence (DESCANSO), is a companion series to theDESCANSO Monograph Series. Authored by experienced scientists and engineers who partic-ipated in and contributed to deep-space missions, each article in this series summarizes thedesign and performance for major systems such as communications and navigation, for eachmission. In addition, the series illustrates the progression of system design from mission to mis-sion. Lastly, it collectively provides readers with a broad overview of the mission systemsdescribed.
Joseph H. YuenDESCANSO Leader

x
Preface
This article describes how the Deep Space 1 (DS1) spacecraft and the Deep Space Net-work (DSN) ground systems receive and transmit data. The description is at a functional level,intended to illuminate the unique DS1 mission requirements and constraints that led to the com-munications-system design, and how the spacecraft has been operated in flight.
The primary purpose of this article is to provide a reasonably complete single source fromwhich to look up specifics of DS1-radio communications. The References and AdditionalResources sections include external as well as internal Jet Propulsion Laboratory (JPL) articlesand web sites. The article is a record of the DS1-mission telecommunications (telecom) throughAugust 2001, and was written and reviewed by JPL telecom people involved with DS1 designand flight, and JPL’s New Millennium program office.
Much of the telecom-design information in this article comes from the DS1 Telecom Oper-ations Reference Handbook, written by Chien-Chung Chen [1]. The telecom-technologydescription originated from a February 2000 DS1 technology-validation symposium at JPL andthe Master of Space Studies theses submitted to the International Space University by two of theauthors [2], who interned at JPL in 2000 and 2001 as part of 12-week NASA/JPL/ISU-spon-sored programs.
Acknowledgments
The authors would like to express their appreciation to Gael Squibb in the InterPlanetaryNetwork and Information Systems Directorate (IPN-ISD) for his encouragement and supportduring the preparation of this article.
The authors are especially grateful to Marc Rayman, Todd Bayer, Kathy Moyd, DaveMorabito, Andre Makovsky, Rich Benson, and other current and former DS1 team members fortheir advice, suggestions, and helpful information for this article.

1
*Look up this and other abbreviations and acronyms in the list that begins on page 60.
Section 1
Mission and Spacecraft Description
1.1 Technology Validation
DS1* is the first of the New Millennium Program (NMP) deep-space technology-valida-tion missions. The development of DS1 was led by JPL, with Spectrum Astro, Inc. as the indus-try partner for spacecraft development.
DS1’s payload consists of 12 advanced technologies for deep space that flew for the firsttime. With the three involving telecom listed first, the DS1 technologies are:
• Small Deep Space Transponder (SDST) for X-band uplink and X- and Ka-band down-link
• Ka-band solid-state Power Amplifier (KaPA) and associated experiments in Ka-band carrier tracking, telemetry demodulation, and turnaround ranging
• Beacon Monitor Operations Experiment (BMOX) for autonomous onboard health and status summarization and request for ground assistance
• Miniature Integrated CAmera Spectrometer (MICAS), a panchromatic visible imager and infrared and ultraviolet imaging spectrometers
• Solar-electric propulsion (SEP) technology, implemented as the Ion-Propulsion System (IPS)
• Autonomous onboard navigation (AutoNav)
• Solar-Concentrator Arrays, using Refractive Linear Element-Technology (SCARLET)
• Integrated ion-and-electron spectrometer, known as the Plasma Experiment for Plane-tary Exploration (PEPE)
• Remote Agent eXperiment (RAX) architecture for autonomous-onboard planning and execution

Mission and Spacecraft Description 2
• Set of Low-Power Electronics (LPE)
• High-packaging-density smart power switch, known as a Power-Actuation and Switch-ing Module (PASM)
• Multi-Functional Structure (MFS) experiment combining electronics and thermal con-trol in a structural element.
Although there are 12 advanced technologies on DS1, the rest of the spacecraft payload iscomposed of current, low-cost components that have been tried and tested on other missions.For example, the high-gain antenna (HGA) is a flight spare from the Mars Pathfinder program,and the flight computer is based on that used by Mars Pathfinder [3].
This approach—combining new technologies with tried-and-true components—is beingused because the New Millennium Program focus has been to prove that certain advanced tech-nologies work in space, not to build a spacecraft out of advanced but unproven components.
1.1.1 Mission Overview
DS1 was launched October 24, 1998 [4] and is in its extended mission [5]. The DS1 pri-mary-mission design and execution focused exclusively on the validation of the 12 new tech-nologies [6]. Technology testing was completed two weeks before the encounter with Asteroid9969 1992KD (renamed Braille shortly before the encounter) on July 29, 1999 [5]. As a bonusto its technology-validation mission, DS1 collected a wealth of science data. The MICASinstrument recorded pictures and spectra of Mars, Jupiter, and selected stars. PEPE recordedextensive solar-wind data, some in collaboration with the Cassini spacecraft.
The primary mission concluded, having met or exceeded all of the mission success criteria,on September 18, 1999.
The extended mission’s goal, in contrast to technology validation, was to return sciencedata from the encounter with comet Borrelly on September 22, 2001.1 The primary challenge inthe extended mission was working around the failure in November 1999 of the star tracker, orstellar-reference unit (SRU). By June 2000, the flight team had devised a major revision of theflight software to use the science camera (MICAS) as a substitute for feeding star data to theattitude-control system. After that, project-mission planning had also accommodated a solarconjunction (spacecraft on the opposite side of the Sun from Earth) in November 2000, andanother flight-software update in March 2001 to improve the probability of acquiring remote-sensing data during the Borrelly encounter.
For telecom operations, the DS1 flight team initially responded to the onboard SRU failureby substituting from the ground in near-real time, downlink carrier-signal observation, telecomanalysis, and uplink control. The replaced functionality achieves pointing the body-mountedHGA to within an acceptable angle of Earth. The “HGA activity” [7], described more fullylater, is labor-intensive and exacting in timing requirements. The RTLT (round-trip light time)delay in the HGA activity’s downlink signal monitor and corrective-command transmission
1 The original plan for the extended mission was for a flyby of the comet Borrelly [5]. During technology valida-tion, as we learned how and how well the spacecraft worked, we added a flyby of comet Wilson-Harrington for early 2001. The SRU failure and the recovery from that resulted in an extended period without IPS thrusting and a consequent replanning of the mission for a Borrelly flyby only.

Mission and Spacecraft Description 3
process is manageable. The RTLT was about 30 min. in early 2000, 40 min. at solar conjunc-tion, 34 min. during the March 2001 software update, and was about 25 min. during the Borrellyencounter.
Following the successful flyby of the comet Borrelly, DS1 began what has been named thehyperextended mission. This final mission phase, which includes some additional technologyvalidation of the IPS and the KaPA, will end with the spacecraft’s downlink being shut off inDecember 2001.
1.1.2 Telecom System Overview
By project policy, and like other parts of the spacecraft, the DS1 telecom system is “singlestring” (without block redundancy). The system elements include a transponder (receiver-trans-mitter in which the downlink can be phase-coherent with the uplink), power amplifiers for X-and Ka-band, and selectable directive and wide-beamwidth antennas. See Figs. 3-1 and 3-2 inSection 3.
The primary communication link is on Channel 19 at X-band (7.168-GHz uplink and8.422-GHz downlink). The SDST includes the X-band receiver, command-detection and telem-etry-modulation functions, and X- and Ka-band exciters.2 The X- and Ka-band solid-statepower amplifiers (XPA and KaPA) provide 12 W of RF power at X-band, and 2.2 W at Ka-band.
The Ka-band downlink carrier, phase coherent with the X-band downlink carrier, is also onChannel 19 (32.156 GHz). The Ka-band carrier can be unmodulated, or modulated with telem-etry or ranging data like the X-band carrier.
DS1 has four X-band antennas. The high-gain antenna has a half-power beamwidth3 ofabout ±4.0 deg, and ±4.5 deg on the downlink and uplink, respectively. The three low-gainantennas are pointed along different spacecraft axes and have beamwidths of about ±35 deg forboth downlink and uplink. As controlled through waveguide-transfer switches, the X-banduplink and downlink are always on the same antenna.
The Ka-band downlink is transmitted from the KHA (Ka-band horn antenna), which has ahalf-power beamwidth of about ±3.5 deg.
2 “Exciter” is a generic term for the portion of a radio transmitter that produces the carrier frequency. The SDST has two exciter functions, one for X-band and the other for Ka-band. Besides generating the output carrier fre-quency, each exciter also has a phase modulator and the modulation index control for each kind of downlink modulation.
3 The direction of maximum gain of an antenna is called the boresight. The half-power beamwidth is defined in terms of the angle from boresight at which the antenna would have the capability to transmit (or receive) half as much power as at the boresight. In this article, to avoid ambiguity, the half-power beamwidth is expressed in terms of ± deg from boresight. A half-power beamwidth of ±4 deg would be a total beamwidth of 8 deg.

4
*Look up this and other abbreviations and acronyms in the list that begins on page 60.
Section 2
Telecom System Requirements
The DS1* development-phase project policies and top-level requirements led to a numberof high-level directives regarding system implementation. DS1 was intended as a capability-driven—as opposed to science-driven—mission.1
Spacecraft- and ground-system designs were driven strongly by existing hardware, soft-ware, and system capabilities in order to meet cost, schedule, and risk constraints:
• Capability-Driven Design: High-level requirements could be renegotiated (require-ments reduced) if they conflicted with understood capabilities of existing hardware
• Single-String Implementation: The project policy identified that a single-string design was to be employed unless an existing design already incorporated redundancy.
For telecom, these constraints resulted in flying a single unit of each of two advanced tech-nology subsystems: the SDST and the KaPA. The SDST is a flight-engineering model (FEM),as project development and test schedules precluded a full flight model.
Except where functional redundancies already existed (for example, telemetry available oneither X- or Ka-band downlink, and X-band downlink available via either high- or low-gainantenna), project policy precluded “conventional” backups for these functions. Furthermore, itwas project policy to employ single-string design, and avoid cross-strapped redundancy unlessexisting designs (off-the-shelf or advanced technologies) already had it, and it was cost-effec-tive to retain it.
Unlike a traditional science-driven mission, DS1 imposed fewer absolute link-perfor-mance requirements (such as minimum downlink rate vs. time) that the telecom system had tomeet. Nevertheless, a number of issues imposed requirements on the telecom system.
1 “Science-driven” means the requirements that define a scientific mission govern the design of the spacecraft, its mission design, and its ground system. Capability-driven means that the requirements placed on the spacecraft, etc., follow from (rather than determine) the definition of hardware and software systems that are available.

Telecom System Requirements 5
Sources of these system requirements were:
• Project policies
• Mission-coverage needs
• Technology-validation goals
• End-to-end information-flow considerations
• Interoperability with the DSN
• Spacecraft-architecture constraints
• Radiometric-tracking accuracy.
The above considerations led to the definition of the flight-system (spacecraft) telecomrequirements. Top-level telecom-system capabilities and link design to meet the requirementsare defined in the DS1 Project Requirements/TMOD Support Agreement (PR/TSA) [8]. SDSTparameter values measured during prelaunch testing are in the “Telecommunication FEMSDST/DSN compatibility and performance Motorola test report”[9].

6
*Look up this and other abbreviations and acronyms in the list that begins on page 60.
Section 3
Telecom System Description
The DS1* telecom system provides X-band uplink and X/Ka-band downlink capabilitiesto handle all RF communications between the DS1 spacecraft and the DS1 mission operationsteam via the DSN. The telecom system receives and demodulates uplink commands, transmitsscience- and engineering-telemetry data on either an X-band or a Ka-band downlink or both,and provides coherent two-way Doppler and range-measurement capabilities using the X-banduplink, and the X- or Ka-band downlink. Figure 3-1 is a block diagram of the telecom-systemfunctional elements.
DS1 has four antennas that operate at X-band (one HGA and three LGAs) and one Ka-band antenna (the KHA). Figure 3-2 shows the antenna locations on the spacecraft. Eachantenna has a direction of maximum gain, often called the boresight. The boresights of theHGA, LGAX, and KHA are parallel to the +x-axis. The boresights of LGAZ+ and LGAZ– areparallel to the +z-axis and the –z-axis, respectively. Orienting the DS1 spacecraft so that the +x-axis points at Earth maximizes the performance of links using the HGA, LGAX, or KHA. Allantennas are right-circularly polarized (RCP) except LGAZ–, which is left-circularly polarized(LCP).1
Figure 3-3 shows the downlink pattern of each LGA; Fig. 3-4 shows the X-band downlinkpattern of the HGA. The X-band uplink patterns are similar, but slightly broader because of thelower-uplink frequency. Figure 3-5 shows the KHA pattern.
1 The LGAZ– antenna element is a duplicate of LGAZ+, mounted midway out on the service boom, with its bore-sight oriented along the –z-axis. LGAZ– was added to the spacecraft late in the development phase, less than one year before the planned launch date. The need for the antenna was in the first weeks after launch, when the range was small (strong signals) but Earth-spacecraft geometry would result in blockage of signal paths to LGAX or LGAZ+. Antenna-system design needed to preserve the capability of LGAZ+ as much as possible, and at the same time disturb the existing configuration and spacecraft system interfaces as little as possible. These needs led to the choice of a passive vs. an active-coupling system, and to a 25 percent/75 percent power split between the LGAZs.

Telecom System Description 7
The SDST provides the detected-command bits for decoding and an in-lock/out-of-lockindicator to the Integrated Electronics Module (IEM) of the avionics system. The IEM can senda power-on-reset (POR) signal to the SDST to activate a relay to remove spacecraft power fromthe SDST for 3 s, and then restore power. The SDST receives a serial stream of telemetry-databits and a clock signal from the IEM.
The amount of RF power that is input to the XPA from the SDST X-band exciter is estab-lished by a “select in test” (SIT) attenuator. Similarly, a SIT attenuator establishes the KaPA’sinput RF-power level. A 6-dB passive coupler connects the two z-axis LGAs, making bothLGAZ+ and LGAZ– active when “the LGAZs” are selected for X-band. This means that (on thedownlink) RF energy radiates out of both antennas when the LGAZs are selected, with the 6-dBcoupler sending 25 percent of the energy to LGAZ–.
The HGA has a larger on-boresight gain than any LGA, but also a narrower pattern. Whenthe spacecraft x-axis can be kept within 6 deg of Earthline, the HGA is selected (it has 15 dBmore gain than the XLGA). Otherwise, the spacecraft is commanded or sequenced to operate oneither LGAX (aligned with the +x-axis) or on the system of LGAZ+ and LGAZ– (aligned withthe +z- and –z-axis, respectively).
The three LGAs all have the same patterns of gain as a function of angle from boresight.Because of different circuit losses between the SDST and each antenna, LGAZ+ has an effec-tive gain about 1.5 dB lower than LGAX, and LGAZ– about 7 dB lower than LGAX. Much ofthe in-flight telecom analysis involves what uplink- or downlink-data rates are available for dif-ferent conditions of spacecraft pointing and antenna selection.
Fig. 3-1. DS1 spacecraft telecom system functional block diagram.

Telecom System Description 8
Fig. 3-2. Launch mode configuration, with telecom system components.
-20
-18
-16
-14
-12
-10
-8
-6
-4
-2
0
0 10 20 30 40 50 60 70 80 90
Angle from LGA boresight, degrees
Rel
ativ
e g
ain
, dB
Min Pattern
Fig. 3-3. LGA downlink pattern (relative gain as a function of angle from boresight).

Telecom System Description 9
Fig. 3-4. HGA downlink pattern (relative gain as a function of angle from boresight).
-24
-20
-16
-12
-8
-4
0
4
-12 -10 -8 -6 -4 -2 0 2 4 6 8 10 12
Angle from KHA boresight, degrees
Rel
ativ
e g
ain
, dB
Average Min Gain Max Gain
Fig. 3-5. KHA pattern (relative gain as a function of angle from boresight).

10
*Look up this and other abbreviations and acronyms in the list that begins on page 60.
Section 4
DS1 Telecom Technology
The three telecom-related technologies [6] demonstrated during the DS1* prime missionare:
• Small Deep-Space Transponder
• Ka-Band Power Amplifier
• Beacon Monitor Operations Experiment.
4.1 Small Deep-Space Transponder
The Small Deep-Space Transponder (SDST) (Fig. 4-1) is designed to facilitate command,telemetry, and radiometric communication between mission control and the spacecraft. TheSDST combines the spacecraft receiver, command detector, telemetry modulator, turnaround-ranging channels, exciters, and control functions into one 3-kg package. Developed by Motor-ola, Inc., Scottsdale, Arizona, under funding from NASA’s Jet Propulsion Laboratory, SDSTprovides a spacecraft terminal for X- and Ka-band signals with the NASA DSN, allowing X-band uplink, and X- and Ka-band downlink. It also provides coherent and noncoherent opera-tion for radionavigation purposes. This compact, low-mass transponder is enabled by the use ofadvanced GaAs (gallium arsenide) monolithic microwave-integrated circuits.
As the heart of the telecom system, SDST performs the following key functions.
4.1.1 Uplink-Receiving Functions
• Receive and demodulate the X-band-uplink carrier
• Provide an uplink AGC (automatic gain control) function for receive-power control and measurement
• Receive and demodulate the command subcarrier and data stream.

DS1 Telecom Technology 11
4.1.2 Downlink-Transmitting Functions1
• Generate a noncoherent downlink with auxiliary oscillator or ultrastable oscillator (USO)
• Perform convolutional encoding2 and subcarrier modulation of the downlink telemetry
• Modulate X- and Ka-band carriers with telemetry subcarriers or directly3
• Provide independent control of X- and Ka-band modulation-index values.
4.1.3 Radio Metrics
• Generate two-way coherent downlink carriers by phase locking with uplink signal4
• Demodulate uplink-ranging signal and remodulate signal on the downlink
• Provide differential one-way ranging (DOR) tones for downlink.
4.1.4 SDST Performance Monitoring and Spacecraft Data Interfaces
• Receives commands from the Integrated Electronics Module (IEM)
• Collects analog-engineering status within the system
• Provides status and performance parameters to the IEM.
1 Three of the SDST capabilities in these lists were not planned for operational use by DS1. DS1 does not have a USO and, therefore, the SDST auxiliary oscillator always provides the one-way-downlink carrier. Telemetry modulation is in the subcarrier mode only. DOR (differential one-way ranging) tones were checked out but not used for navigation during the prime mission technical validation. Late in the extended mission, the project scheduled and made use of DSN operational delta-DOR navigation data twice in the week prior to the September 22, 2001 Borrelly encounter.
2 See Section 6 for a description of the telemetry-transfer frame, which is convolutionally encoded by the SDST.3 See note 1 above.4 DS1 operates on DSN channel 19, with frequencies as defined in the PR/TSA (Project Requirements/TMOD
Support Agreement) [8] and in JPL document 810-005 [12]. The defined X-band-downlink frequency (8.422 GHz) is 880/729 times the defined X-band-uplink frequency (7.168 GHz). The defined Ka-band-downlink fre-quency (32.156 GHz) is 3360/749 times the X-band-uplink frequency.
Fig. 4-1. The Small Deep-Space Transponder (SDST).

DS1 Telecom Technology 12
• SDST design accommodates interfaces with spacecraft avionics via either a MIL-STD-1553, MIL-STD-1773, or RS422 serial bus, using the 1553 protocol. This design allows future SDST users the maximum flexibility of selecting the system architecture. The DS1 SDST Command and Data Handling (C&DH) communication is via the 1553, and the data interface uses the RS422 [6].
Technology-validation, link-performance tests for SDST (and the KaPA, below) includedtransmitting each of the 19 DS1 telemetry rates simultaneously over X- and Ka-band to verifythat the station could lock up to and decode data at each rate. The ranging channel was operatedat low- and high-modulation index values, and the received-range delay compared between thetwo bands. Frequency-stability and carrier-noise levels (both affecting Doppler data quality)were compared between the bands. The SDST DOR modulation was turned on briefly to verifyits operability.
As a result of DS1’s success in proving the SDST design in flight, the recently launchedMars’01 Odyssey, the in-development Mars’03 Exploration Rover (MER), and Deep Impact(DI) missions are using the SDST. There is a group-buy where several JPL missions (MER, DI,ST3) are pooling their resources to buy SDSTs.
4.2 Ka-Band Solid-State Power Amplifier (KaPA)
4.2.1 KaPA and Ka-Band Overview
At DS1 launch, the KaPA (Fig. 4-2) was the highest-power deep-space solid-state Ka-bandamplifier yet flown. The KaPA developed by Lockheed Martin Communication and PowerCenter, operates at 32 GHz and weighs 0.7 kg. As established during in-flight-technology vali-dation, the KaPA amplifies the RF output from the SDST Ka-band exciter to 2.2 W with anoverall efficiency of 13 percent [6].
The group-buy mentioned with regard to the SDST includes Ka-band for some of the mis-sions.
Ka-band offers a potential link-performance advantage for deep-space communications.With future improvement of ground facilities and spacecraft hardware, assuming similar power
Fig. 4-2. Ka-band power amplifier (KaPA).

DS1 Telecom Technology 13
efficiencies and spacecraft antenna sizes, Ka-band holds a potential four-fold increase in datarate compared to X-band. This fact alone is obviously important as at the end it means reducedproject cost. Ka-band offers greater available bandwidth as NASA and other agencies moveaway from lower frequencies shared with personal communications systems and other emerg-ing information-technology ventures.
On the debit side, the need for a KaPA/Ka-band technology demonstration on DS1 speaksto the relative maturity of flight systems at this frequency, in contrast to X-band. Ka-band linkperformance is also more sensitive than X-band to clouds and rain, which is a challenge todesigning reliable deep-space Ka-band links. Arrays that take into consideration different sea-sonal weather patterns at each DSN longitude (e.g., California and Arizona) can increase linkreliability. Once necessary Ka-band ground systems are in place, a higher-data rate requiresfewer ground resources and less mission-operation support per spacecraft-operation week.
4.2.2 KaPA and Ka-Band In-Flight Technology Validation
As part of the technology validation, DS1 first successfully demonstrated the KaPA inflight less than two months after launch and has operated it to benefit ground-systems develop-ment as recently as March 2001. On December 9 and 10, 1998, the SDST Ka-band exciter andthe KaPA were first powered on in flight. During two passes, the Ka-band link functions weremethodically verified. These functions (also tested with the X-band downlink) included coher-ent and noncoherent downlink carrier tracking, turnaround ranging, and telemetry decoding atall DS1 downlink rates.
KaPA engineering-telemetry measurements were confirmed as nominal during these tests.Internal to the KaPA are temperature sensor, gate current and gate-voltage telemetry measure-ments. External to the KaPA are other temperature sensors, as well as RF power detectors mon-itoring both input and output RF power. From these, RF gain can be deduced. At the same time,the SDST collects internal and external diagnostic-telemetry signals, which can isolate (to theSDST RF output, the intervening telecom-system components, or the KaPA) the location of anypotential degradation of performance. This ability to isolate problems was part of the DS1 tech-nology-validation plan, as SDST and KaPA came from different industrial partners.
Besides characterizing the KaPA operation and link during the primary mission, DS1 hassubsequently provided Ka-band modulated and unmodulated signals for DSN performance-ver-ification, improved ground-system design and network-component upgrades to operational useof Ka-band. In the 3 years since launch, the lifetime of the KaPA has been proven through hun-dreds of hours of operation.
4.3 Beacon Monitor Operations Experiment
4.3.1 Beacon System Concept Description
Beacon-monitor technology allows a spacecraft to report its status without transmittingtelemetry on the downlink. The status provides information the ground system requires to inter-vene by scheduling a telemetry-downlink or command-uplink session.

DS1 Telecom Technology 14
The main appeal of a beacon system is that, when DSN resources are scarce and spread outamong many missions, it’s cheaper to build and deploy small stations at different locations withtone-detection capability only. Noncoherent tone doesn’t require phase-locked receivers, anddetection is possible at a lower total-received power than for telemetry at even low-bit rates.Figure 4-3 shows future beacon monitoring-system elements.
The onboard monitoring system for a typical, future beacon-equipped spacecraft wouldconsist of flight software and part of the telecom system [2], and be responsible for:
• Analyzing the engineering data to determine spacecraft health
• Reducing health status to one of a few (perhaps the four implemented in DS1) monitor-ing states, also known as beacon states or tone states
• Mapping the current monitoring state into an appropriate monitoring signal
• Transmitting the monitoring signal to the ground.
Future system-ground components would include a new set of monitor stations and a coor-dination computer. One proposed beacon system has an 8-m antenna at each DSN site. Themonitoring system also includes support by project-operations teams and DSN-station schedul-ing, prediction, and operation systems.
Fig. 4-3. Beacon monitoring system elements building on DS1 Beacon Monitor Operations Experiment demonstration concepts.

DS1 Telecom Technology 15
A beacon-monitoring station detects the monitoring signal,5 using the schedule and predic-tions from the coordination computer, and then sends the result back to the computer. The com-puter interprets the beacon message based on rules established by the project. It maintains amonitoring schedule for all spacecraft, and it makes pass requests for a 34-m or 70-m antennaand notifies the project when needed. It also initiates urgent responses when triggered by anurgent message. The DSN prediction systems will provide carrier-frequency and antenna-point-ing predictions to the computer, which sends these to the monitor station. The DSN is responsi-ble for scheduling 34-m or 70-m antenna passes in response to the computer requests, astriggered by the detected messages. The future beacon-monitoring system is complementedwith the DSN’s larger antennas to track spacecraft and send telemetry data to the projects inaccordance with the DSN schedule.
When operating in monitoring mode, each spacecraft will maintain a continuous ability toreceive commands from the ground. It will transmit its monitoring signal continuously or on ascheduled basis if constrained by spacecraft power or other factors. In the scheduled case, a pre-agreed communication window can be established for monitoring purposes.
During a spacecraft emergency, the DSN will work directly with the project-operationsteams as usual, bypassing the coordination computer. When intensive interaction is neededbetween the spacecraft and the ground, the monitoring mode can be terminated by a groundcommand, or by the onboard computer. If onboard fault-protection software detects a conditionrequiring rapid ground intervention, the spacecraft will revert to safe mode and transmit low-rate telemetry to the ground.
4.3.2 The DS1 Beacon Monitor Operations Experiment
The DS1 Beacon Monitor Operations Experiment (BMOX) new technology consists offlight software that controls existing SDST subcarrier-frequency modes and includes two func-tions:
• Problem- or condition-detection and tone transmission—instead of routinely sending spacecraft-health data, the spacecraft evaluates its own state and transmits one of four beacon tones that reveal how urgent it is to send high-rate health data
• Data summarization—when telemetry tracking is required, it creates and transmits “intelligent” summaries of onboard conditions to the ground instead of bulk-telemetry data.
The tone-generation function was validated first. Stored-command sequences controlledthe SDST directly, producing over a period of several hours, an unmodulated carrier, and a sup-pressed carrier that was successively modulated by subcarrier frequencies of 20, 25, 30, and 35kHz. The subcarrier frequencies served as the tones. In a fully functional beacon system, theparticular tone would indicate a “nominal,” “interesting,” “important,” or “urgent” condition.
5 The beacon mode in the future system could use M-ary FSK (phase-shift keying in which the modulated carrier can assume any of ‘m’ values, thus providing 2m unique messages) with noncoherent detection, in contrast to phase modulation using coherent receivers for deep-space telemetry.

DS1 Telecom Technology 16
The spacecraft-technology validation’s tone-transmission also checked the station-predictfunction, the BMOX station-control software, and the station’s ability to detect weak X- andKa-band tone-modulated carriers. Subsequently, the BMOX flight software, not just a storedsequence, controlled which SDST subcarrier would be produced. In early 2000, weekly tone-transmission tests were sequenced to complete the station BMOX-operations automation.
The data-summarization function matured later in both the prime and the extended mis-sion. Tone-transmission capability was first used operationally in mid-2000 as part of the over-all spacecraft-pointing algorithm6 and IPS-thrusting operation. Transmission of tones in thisphase is not controlled by the BMOX software but by another part of the flight software. Thetones’ purpose at this time is to convey only one piece of information: the pointing algorithm’sstar-lock history.
4.4 Telecom System Mass and Input Power
For comparison with similar functions in other spacecraft, Table 4-1 shows values of massand spacecraft power for major elements of the DS1 telecom hardware discussed in Sections 3and 4. The mass values and some power values come from the technology validation reports [6]and pre-launch project reports (JPL internal documents). Where available, the power values aretaken from in-flight engineering telemetry. The telemetry confirms there has been negligibledrift in power usage by the receiver, exciters, or power amplifiers from 1998 to 2001.
6 The ACS pointing algorithm developed after the SRU failure depends on the software maintaining lock to a ref-erence star. A “tone detection” sequence that is activated during selected tracking passes will cause a 35-kHz fre-quency to modulate the downlink carrier if star-lock status has remained normal. It will modulate the downlink with a 20-kHz frequency if star-lock has been lost for more than a preset time—currently 1.5 hours.
Table 4-1. DS1 telecom system mass and power summary.
System UnitInput Power
(Wa)Mass(kg)
Dimensions(cm)
Receiver 11.8X-band exciter, 2-way 1.8X-band exciter, 1-way 2.3Ka-band exciter 3.9SDST 3.1XPA 52.5 1.6KAPA 16.9 0.7 14.2 × 15.2HGA 1.2KHA 0.8LGAX 0.4LGAZ+ 0.4LGAZ– 0.4
aBased on in-flight telemetry data

17
*Look up this and other abbreviations and acronyms in the list that begins on page 60.
Section 5
Telecom Ground System Description
The DSN* [10] is the ground system that transmits to and receives data from the DS1spacecraft and many other deep-space missions. The DSN is an international network of groundstations (antennas, transmitters, receivers, and associated systems) that operates intensively atS- and X-band, and with Ka-band being developed. The DSN supports interplanetary-space-craft missions and radio- and radar-astronomy observations for the exploration of the solar sys-tem and beyond. The DSN consists of three deep-space communications facilities placedapproximately 120 deg apart around the world: at Goldstone, in California’s Mojave Desert;near Madrid, Spain; and near Canberra, Australia.
This section includes brief descriptions and functional block diagrams of DSN systemsthat provide carrier tracking, radiometric data (Doppler and ranging) collection, commanduplinking, and telemetry reception and decoding for DS1.
Specific DSN numerical parameters for DS1 are defined in the PR/TSA [8] and the Net-work Operations Plan [11].
5.1 Uplink and Downlink Carrier Operation
DSN stations are grouped by antenna size (26 m, 34 m, and 70 m), and for the 34-mantennas by type—BWG (beam-waveguide) or HEF (high-efficiency). DS1 has been trackedby 70-m, 34-m HEF, and 34-m-BWG stations. The DSMS Telecommunications Link DesignHandbook [12] includes functional capability descriptions of each antenna size and type, for thepurpose of modeling link capability between a spacecraft and that station type. These 70- and34-m stations all receive X-band downlinks. The 34-m stations have had X-band uplink capa-bility through the DS1 mission. The 70-m stations were X-band downlink only at DS1 launch;by November 2001, all three will have X-band uplink capability also.

Telecom Ground System Description 18
5.1.1 The 34-Meter Station (DSS-25)
This section describes the system functions at Deep Space Station 25 (DSS-25), the34-m-BWG station at Goldstone. This operational station supports the DS1 X-band uplinkand downlink, as well as Ka-band downlink.1
Figure 5-1 is the DSS-25 antenna and microwave section functional diagram.Although these elements are representative, [12] provides specific figures for each type ofstation and indicates the sometimes significant differences among stations of a particulartype.
The RF output from the 4-kW X-band transmitter goes through the X-band diplexer,then through an orthomode junction and polarizer to the X-band feed. For DS1, the trans-mitter is set to RCP except when the spacecraft LGAZ– is scheduled to be in view ofEarth. The X-band uplink continues to the subreflector via an X-band/Ka-band dichroicplate, if simultaneous Ka-band is required. From the subreflector, the X-band uplink isfocused to the 34-m main reflector, which is oriented in the direction of the spacecraft dur-ing the active track.
The X-band downlink signal from the spacecraft is collected by the 34-m main reflec-tor, then is focused by the subreflector to the X-band feed (again via the X-band/Ka-banddichroic when there is also a Ka-band downlink from the spacecraft). The polarizer is setfor RCP reception for DS1 except when LGAZ– is scheduled. The orthomode junction isthe part of the antenna feed that combines or separates LCP and RCP signals. From thefeed the X-band RF signal goes to the X-band maser preamplifier. After low-noise ampli-fication, the downlink is frequency down-converted to a 300-MHz intermediate frequency(IF) for input to the Block V Receiver (BVR).
The Ka-band downlink also is collected by the 34-m main reflector and focused bythe subreflector. It passes through the dichroic plate to separate it from the X-band down-link signal path, on its way to the Ka-band feed. DSS-25 is equipped only for RCP at Ka-band (and the DS1 KHA is RCP). The Ka-band preamplifier is a high-electron-mobilitytransistor (HEMT). Like the X-band downlink, after low-noise pre-amplification, Ka-banddownlink is frequency down-converted for input to the BVR.
5.1.2 The 70-Meter Stations (DSS-14 and DSS-43)
The 70-m stations provide S-band uplink and downlink for those missions thatrequire those frequencies. For DS1, the stations’ X-band uplink and downlink are used.Figure 5-2 (from [12], module 101) shows the antenna and microwave sections of DSS-14and DSS-43 as they have existed since the installation of the X-band uplink in 2000.2
The 20-kW X-band transmitter output goes through a polarizer and a diplexing junc-tion to the X-band feed. From there, it passes through an S-band/X-band dichroic reflectoron its way to the subreflector and the main 70-m reflector that sends the uplink on its wayto the spacecraft.
1 Of the operational 70-m and 34-m-BWG stations, only DSS-25 has had Ka-band-downlink capability throughout the DS1 mission.
2 The third 70-m station, DSS-63 at Madrid, will have X-band uplink installed by November 2001. DSS-63 has also supported DS1, but with a concurrently-scheduled 34-m station when an uplink was required.

Telecom Ground System Description 19
Fig
. 5-1
. D
SS
-25
fun
ctio
nal
dia
gra
m (
X-b
and
up
link/
do
wn
link,
Ka-
ban
d d
ow
nlin
k).

Telecom Ground System Description 20
Fig
. 5-2
. D
SS
-14
and
DS
S-4
3 fu
nct
ion
al-b
lock
dia
gra
m (
X-b
and
up
link
and
do
wn
link)
.

Telecom Ground System Description 21
The X-band downlink from the main reflector is focused by the subreflector and passesthrough the dichroic reflector to separate it from the S-band signal path. From the diplexingjunction, the X-band downlink goes to a polarizer that selects the RCP output for all DS1antenna except LGAZ–. The X-band downlink from the X-band HEMT preamplifier is fre-quency-down-converted for input to the BVR.
5.2 Radiometric Data (Doppler and Ranging)
The DS1 uplink-and-downlink carriers provide a means of measuring the station-to-space-craft velocity as a Doppler shift. In addition, ranging modulation applied to the uplink is turnedaround by the SDST to modulate the downlink to provide a means of measuring the station-to-spacecraft distance. Together, Doppler-and-ranging data provide radio navigation inputs to theproject. Radio navigation and optical navigation have both been mainstays for DS1 orbit deter-mination. Radio navigation also played a part in the technology validation of “auto-nav.”
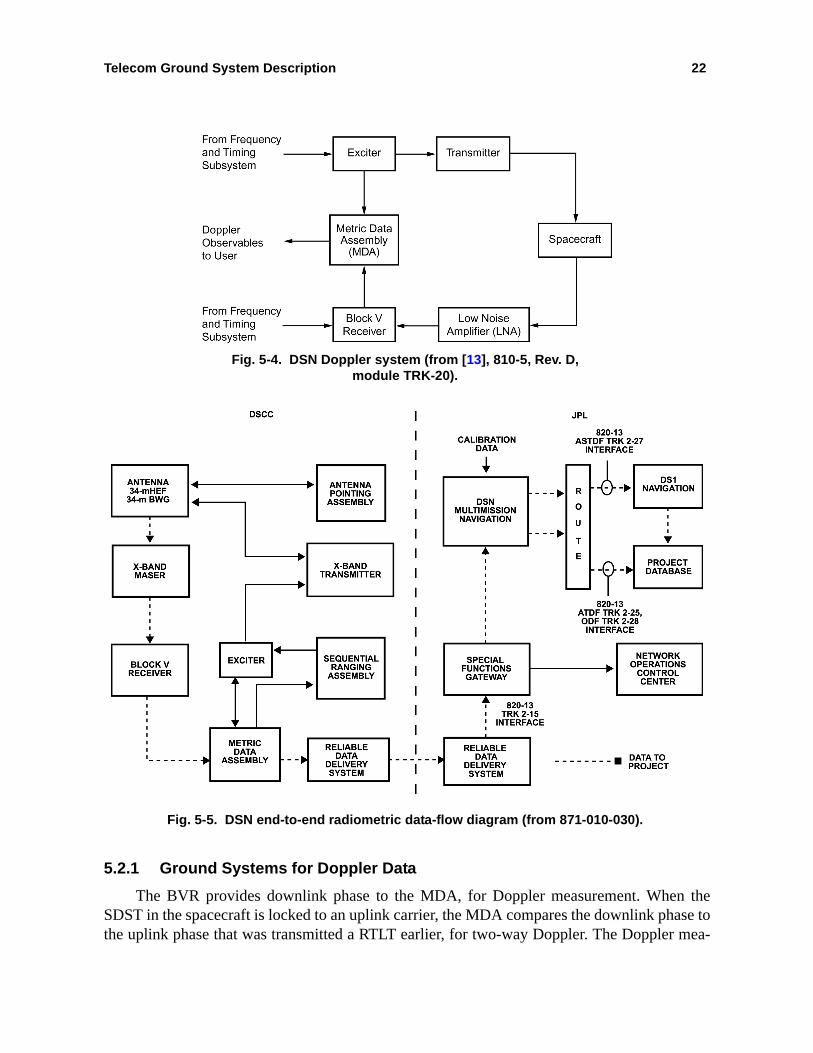
Figure 5-3 and 5-4 (from [13], document 810-5, Rev. D) show the metric-data assembly(MDA) and the sequential-ranging assembly (SRA).3
Figure 5-5 (from [11], the Network Operations Plan [NOP] for DS1) shows the groundsystems involved in Doppler and ranging-data processing for DS1.
In addition to the antenna, BVR, and transmitter already discussed, the equipment at theGoldstone, Madrid, or Canberra Deep Space Communications Complex (DSCC) includes theMDA and SRA.
3 DSN/Project-interface specifications are now defined in document 810-005 (Rev. E) [12]. However, in some cases, the older diagrams in document 810-5 (Rev. D) [13] better represent the DSN systems as they were config-ured for DS1. This article distinguishes between the newer and older sources of station information.
Fig. 5-3. DSN ranging system (from [13], 810-5, Rev. D, module TRK-30).
Telecom Ground System Description 22
5.2.1 Ground Systems for Doppler Data
The BVR provides downlink phase to the MDA, for Doppler measurement. When theSDST in the spacecraft is locked to an uplink carrier, the MDA compares the downlink phase tothe uplink phase that was transmitted a RTLT earlier, for two-way Doppler. The Doppler mea-
Fig. 5-4. DSN Doppler system (from [13], 810-5, Rev. D, module TRK-20).
Fig. 5-5. DSN end-to-end radiometric data-flow diagram (from 871-010-030).

Telecom Ground System Description 23
surements establish the spacecraft-station velocity as a function of time and can be comparedwith the expected or modeled velocity. The Doppler-sample rate for DS1 is normally 10 sam-ples/s. Doppler-integration times have sometimes been made longer to counter weak downlinklevels.
5.2.2 Ground Systems for Ranging Data
For the DS1 mission, the uplink-ranging data sent to the spacecraft and the ranging datademodulated from the downlink carrier are both processed in the SRA. The name refers to thesequence of square-wave frequencies sent to the spacecraft, with the highest frequency(“clock”) providing fine resolution in range. Square-wave frequencies at successive submulti-ples of the clock-resolve ambiguity.4 As defined in the NOP, to accommodate the lower-linkmargins in the extended mission, DS1 uses a 300-s integration time for the clock componentand 20-s integration time for the lower-frequency components. Standard DS1 ranging usescomponents 4 through 20 [11] for ambiguity resolution.
5.2.3 Ground Processing of Navigation Data
At JPL, the Radiometric Data Conditioning Group, part of the Multimission Navigationfunction, processes and delivers the Doppler and ranging data to DS1 project navigation. DS1navigation may do further processing of the delivered Doppler and ranging files in the trajec-tory-determination process, for example, weighting5 the values of data from specific passes rel-ative to other passes). In addition to providing information to the project to conduct the mission,the radio-navigation data are used to generate P-files for delivery back to the DSN, for use increating the frequency and pointing predicts for subsequent tracking passes. Frequency predictsare input to the BVR to assist in locking the receiver to expected periods of one-way, two-way,or three-way data. Pointing predicts are used to drive the station antenna in elevation and azi-muth angle during the pass. Pointing predicts are supplemented by several tables that are spe-cific to the station type, location, and the general declination of the spacecraft. Thesesupplementary tables include corrections for atmospheric refraction as a function of elevationangle and azimuth as well as for deformation of the antenna structures (and thus, changes in thebeam direction) as a function of elevation angle.
4 The process of ranging involves correlation between the transmitted and received waveforms. The correlation results in an infinity of solutions, separated one wavelength apart, creating the ambiguity. The ranging system resolves (eliminates) the ambiguity by successively correlating a series of waveforms, each one having a wave-length twice as long as the previous, until the spacecraft’s location is unambigous as determined by means other than the current range measurement.
5 Weighting is an art in navigation-orbit determination, in which the available datasets (or even individual-ranging points) are assigned relative value (importance) relative to other datasets. Weighting may involve such factors as the amount of scatter between successive points, the agreement between the range and Doppler points within a pass, and how well the points from one pass “fit” into the solution model, as determined from previous passes. Orbit determination for DS1 has been a challenging process because of the extensive periods of low-level thrust-ing. The effects of thrusting have to be separated from other small forces, such as solar pressure.

Telecom Ground System Description 24
5.3 Command Processing and Radiation
Figure 5-6 (from the NOP, [11]) shows the systems at JPL and the station involved in thecommanding process for DS1.
DS1 command files are moved to the station (“staged”) in advance of need in a store-and-forward system. The following description is of the systems [13] used during the DS1 mission.At the station, the command-processor assembly (CPA) and the command-modulator assembly(CMA) clock out the command bit stream, modulate the command subcarrier, and provide thesubcarrier to the exciter for RF-uplink carrier modulation. Bit rates, the command subcarrierfrequency, and the command-modulation index (suppression of the uplink carrier) are con-trolled through standards and limits (S&L) tables.
At JPL, the DS1 ACE (call sign for project real-time mission controller) operates the mul-timission command system from a workstation in the DS1 mission-support area (MSA). Tobegin or end a command session, the ACE requests the station to turn the command modulationon or off, respectively. The ACE selects a command rate, for example 125 bps. The selected rateis associated with one of four values of uplink-carrier suppression by command modulation (ormodulation index). The carrier suppression is established by use of one of four calibrated “buff-ers” in the station’s CMA. The CMA produces the command subcarrier, which has a nominalfrequency of 16000.2 Hz to match the subcarrier tracking loop best-lock frequency in the DS1SDST. The CMA also modulates the command-bit waveform onto the subcarrier.
Fig. 5-6. DSN end-to-end command data-flow diagram (from 871-010-030).

Telecom Ground System Description 25
The Reliable Data Delivery System (now called the Reliable Network System or RNS)transfers the command files to the station in the staging process, as well as the ACE directivesfor radiation of the staged commands. At the station, the Command Processor Assembly per-forms the digital processing to create the command-bit stream from the command files and theactivation signal. Experience with critical-command timing, as in the “HGA Activities”described in Section 7, shows that an ACE is able to activate command transmission within 2 sof the nominal time.
5.4 Telemetry Demodulation, Decoding, Synchronization, and Display
The Telemetry System performs three main functions: data acquisition, data conditioningand transmission to projects, and telemetry-system validation.
Figure 5-7 shows the station equipment involved in DS1 telemetry-demodulation anddecoding.
Each of the two redundant BVRs has phase-locked loops for receiving (locking to) the car-rier, the telemetry subcarrier, and the telemetry-symbol stream. DS1 generates a 375-kHz sub-carrier for telemetry bit rates of 2100 bps or greater, and a 25-kHz subcarrier for bit rates lowerthan 2100 bps. DS1 X-band carrier-modulation index values range from 40 deg for the lowestdata rate (10 bps) to 72 deg for the highest (19,908 bps).
The BVR delivers telemetry symbols to the maximum-likelihood convolutional decoder(MCD). For spacecraft with (7,1/2) coding, either MCD2 or MCD3 may be used. The (15,1/6)convolutional code normally used by DS1 requires the use of the MCD3. An MCD/FSS (FrameSynchronizer System) pair make up a telemetry-channel assembly (TCA). The telemetry-groupcontroller (TGC) controls the operation of TCA1 (containing the MCD3) and TCA2 (contain-ing an MCD2).
The MCD outputs decoded telemetry bits to the frame-synchronizer (FS) subsystem. Afterthe MCD declares lock, the FSS requires recognition of a minimum of two successive frame-sync words to output (“flow”) telemetry to the project. Validation requires recognition of a thirdsync word. The number of sync-word-allowable bit miscompares for recognition and validationcan be set in the software.
Figure 5-8 (from the NOP, [11]) shows the end-to-end telemetry data flow from the stationto the project analysts in the MSA. The Advanced Multimission Operations System (AMMOS)processes telemetry in both near-real time (delays up to one minute) and in nonreal time (pro-ducing data records that are as complete as possible, but with a delivery time guaranteed within2 hours of the end of track). The nonreal-time version includes retransmission of data lostbetween the station and JPL and replays from the central data recorder (CDR) as necessary.
AMMOS telemetry processing at JPL includes “channelizing” the data from the packetsreceived, ordering the telemetry data that may have been transmitted in real time or from space-craft storage, and time-tagging the data either by Earth-received time (ERT) or spacecraft-eventtime (SCET).
Station configuration and performance (“monitor”) data are output by the Link Monitorand Control (LMC), or the newer Network Monitor and Control (NMC) at the station. Monitor

Telecom Ground System Description 26
Fig
. 5-7
. D
SN
dem
od
ula
tio
n a
nd
pro
du
ctio
n o
f te
lem
etry
dat
a (f
rom
871
-010
-030
).

Telecom Ground System Description 27
data are channelized similarly to telemetry data and can be displayed or queried for telecomanalysis. Monitor data are available only in monitor-sample time (MST), which is analogous toERT for telemetry.
In the MSA, the near-real-time data are “broadcast” to workstations, which can displaythem in the form of DMD (Data Monitor and Display) pages. Pages may be in list form, plots,or specially formatted “fixed” pages. Also, at their workstations, the DS1 analysts can queryeither the near-real-time or the nonreal-time data. The query output can be displayed as tabula-tions or plots on the screen, routed to a printer, or saved as a file for further processing.
Fig. 5-8. DSN end-to-end telemetry-data-flow diagram (from 871-010-030).

28
*Look up this and other abbreviations and acronyms in the list that begins on page 60.
Section 6
Telecom Link Performance
The DS1* communication-link margins are calculated using statistical techniques to estab-lish expected values from the mean and variance, and a further indication of variability from thetolerances and shape (uniform, Gaussian, etc.) [14]. In many cases, link models (such as theLGAX antenna pattern, and the interaction of telemetry-and-ranging modulation in the SDSTdownlink) were modified from theory or early measurements by additional or iterative analysisof prelaunch measurements.
The three DS1 link functions are command, telemetry, and ranging. Each has a minimumsignal-to-noise ratio (called the threshold) at which the quality of the link meets a project-defined criterion.
Link performance is book-kept using a design-control table. In-flight DS1 operations arebased on a criterion of positive-link margin under the following conditions: (a) command: meanminus three standard deviations (3σ), (b) telemetry: mean minus 2σ, and (c) ranging: meanminus 2σ. The command link does not have error-correcting coding, so data-stream bits are thesame as channel symbols. The telemetry link has concatenated Reed-Solomon and convolu-tional coding.1 The parameter σ (spelled out as sigma) in the DCT refers to the standard devia-tion of the command Eb/No (bit energy to noise-spectral-density ratio), the telemetry Es/No
1 The DS1 telemetry-transfer frame is a fixed-length data-transfer structure. Details come from the DS1 PR/TSA [8] and Telemetry Dictionary [16]. The telemetry frame is created and Reed-Solomon (RS) encoded in-flight software using a conventional Berlekamp code with an interleave depth of 5. The code is shortened from the standard RS (255,223) code to an RS (252,220) code using 120 bits of virtual-zero fill (not transmitted from the spacecraft) that is used by the decode process to fill out the code block to the standard. This results in an RS code block (transmitted frame) with a total length of 10080 bits: 8800 bits of data and 1280 bits of RS check symbols. Each code block is preceded with a 32-bit synchronization marker, to aid the station in finding the frame bound-aries, making up a total 10112-bit structure commonly called the “transfer frame.” The sync marker is not included in the RS encoding or decoding processes. For DS1, the SDST encodes the data-stream of 10112-bit frames using either of two selectable-coding formats: K=15, Rate 1/6 or K=7, Rate 1/2.

Telecom Link Performance 29
(symbol energy to noise-spectral-density ratio), or the downlink ranging Pr/No (ranging powerto noise-spectral-density ratio)2. The quantity No is the noise-spectral density; Eb is the energyper bit, Es is the energy per symbol, and Pr is the ranging power.
Tables 6-1, 6-2, and 6-3 design-control tables (DCT) contain predictions of DS1 telecomperformance, generated by a software tool, the Telecom Forecaster Predictor (TFP). TFP is amultimission tool for link-performance prediction built upon Matlab [15]. DS1 TFP uses stan-dard models for station parameters (the same for each project’s TFP) adapted to include DS1spacecraft models.
The three DCTs are all for a specific arbitrary instant in time, 2000-173/16:00 UTC (9 a.m.Pacific daylight time, June 21, 2000). The DS1 spacecraft operates with the 70-m DSS-14antenna at Goldstone. The spacecraft is configured for X-band uplink and downlink on theHGA. The command rate is 2000 bps, at an uplink-modulation index of 1.2 rad. The rangingmodulation also suppresses the uplink, at a value of 3 dB. The downlink rate is 3150 bps, at amodulation index of 65.8 deg. The ranging also phase-modulates the downlink, at an index of0.3 rad. The HGA is presumed to have its boresight misaligned from Earth by 2.5 deg.
TFP shows the time variation of link performance either as tabulations (columns of num-bers to be read into a spreadsheet for formatting and printing) or as plot images for viewing orprinting.
Performance of command and telemetry during the entire DSS-14 pass on June 21, 2000 issummarized in the two pairs of plots that follow the three DCTs. The plots were created fromthe same run that produced the three DCTs. All plots contain values predicted once every 20min., starting at the DCT time of 16:00 UTC and continuing to 04:00 UTC the next day. Quan-tities plotted for illustration are the mean values of the parameters.
The first plot-pair shows the downlink-ranging mean Pr/No and its threshold of –10 dB atthe top and the uplink command mean Eb/No and its threshold of +9.6 dB at the bottom. Thesecond plot-pair shows the station-elevation angle at the top and the downlink-telemetry meanEs/No with its threshold of –7.5 dB at the bottom.3 Figure 6-1 and 6-2 display, respectively, thedownlink Pr/No and uplink Eb/No; and station-elevation angle, and downlink-telemetry symbolSNR.
2 The ranging DCT defines mean and variance for Pr/No, as a bottom-line telecom-analysis quantity that can be compared against a like-named channel in the station-monitor data. Beyond this, navigation also defines a rang-ing “sigma” (computed as a function of Pr/No, but which is not included in DS1 DCTs) that is a prediction of the ranging-measurement scatter.
3 DS1 flight-team link analysis does not receive monitor data from the station indicating the Reed-Solomon decod-ing performance or the frame-synchronization performance. The Block 5 receiver (BVR) outputs a measure of Es/No, and the maximum-likelihood convolutional decoder (MCD) outputs a measure of Eb/No. The DCTs in this section, accordingly, express predicted-performance relative to thresholds that are in terms of Es/No or Eb/No.

Telecom Link Performance 30
Table 6-1. DS1 uplink (command and ranging) DCT.
Produced by DS1 V5.1 12/16/1999
Predict 2000-173T16:00:00 UTCUp- /downlink Two-wayRF band X:XTelecom link DSS-14-HighGain. ConfigA-DSS-14
COMMAND UPLINK PARAMETER INPUTSCmd data rate 2000.0000 bpsCmd mod index 1.20 radCmd rngmod index 44.9 deg
Operations mode NominalMission phase Launch phaseDSN site Gold-GoldDSN elevation In viewWeather/CD 25Attitude pointing EarthPointed
EXTERNAL DATARange (km) 3.0816e+08Range (AU) 2.0599e+00One-way light time (OWLT) (hh:mm:ss) 00:17:07Station elevation(s) (deg) [14.41]DOFF: HGA, KHA (deg) 2.50 2.50DOFF: LGA1, LGA2, LGA3 (deg) 2.50 92.50 87.50Clk: HGA, KHA (deg) 159.49 0.00Clk: LGA1, LGA2, LGA3 (deg) 159.49 0.00 0.00Added s/c ant pnt offset (deg) 2.5
DSN site considered: DSS-14/DSS-14
At time: 0.00 hours after the start time
(Continued on next page)

Telecom Link Performance 31
Table 6-1. DS1 uplink (command and ranging) DCT (cont’d).
Link Parameter Unit Design Value
FavTol
AdvTol
MeanValue Var
TRANSMITTER PARAMETERS1. Total transmitter power dBm 73.01 0.00 –1.00 72.68 0.05562. Xmitter waveguide loss dB –0.41 0.05 –0.05 –0.41 0.00043. DSN antenna gain dBi 72.45 0.20 –0.20 72.45 0.01334. Antenna pointing loss dB –0.10 0.10 –0.10 –0.10 0.00175. EIRP (1 + 2 + 3 + 4) dBm 144.62 0.80 –0.80 144.62 0.0710
PATH PARAMETERS6. Space loss dB –279.33 0.00 0.00 –279.33 0.00007. Atmospheric attenuation dB –0.14 0.00 0.00 –0.14 0.0000
RECEIVER PARAMETERS8. Polarization loss dB –0.03 0.10 –0.10 –0.03 0.00339. S/C ant pointing control loss dB –0.30 0.20 –0.20 –0.30 0.0133
10. Deg-off-boresight (DOFF) loss dB –0.44 0.43 –0.48 –0.47 0.069111. S/C antenna gain (at boresight) dBi 20.10 0.50 –0.50 20.10 0.041712. Lumped circuit loss dB –1.79 0.30 –0.30 –1.79 0.0300
TOTAL POWER SUMMARY13. Tot rcvd pwr (5 + 6 + 7 + 8 + 9
+ 10 + 11 +12)dBm –117.34 –1.43 1.43 –117.34 0.2284
14. Noise spectral density dBm/Hz –172.22 –0.70 0.66 –172.23 0.077915. System noise temperature K 434.75 –65.08 71.69 436.95 779.942716. Received Pt/No (13–14) dB-Hz 54.89 1.66 –1.66 54.89 0.306317. Required Pt/No dB-Hz 50.60 0.00 0.00 50.60 0.000018. Pt/No margin (16–17) dB 4.29 1.66 –1.66 4.29 0.306319. Pt/No margin sigma dB 0.00 0.00 0.00 0.55 0.000020. Pt/No margin-3 sigma
(18–3*19)dB 0.00 0.00 0.00 2.63 0.0000
(Continued on next page)

Telecom Link Performance 32
CARRIER PERFORMANCE21. Recovered Pt/No (16 +
[AGC+BPF]) dB-Hz 54.89 1.66 –1.66 54.89 0.3063
22. Command carrier suppression dB –3.46 0.20 –0.20 –3.46 0.006723. Ranging carrier suppression dB –3.00 0.10 –0.10 –3.00 0.001724. Carrier power (AGC) dBm –123.80 –1.46 1.46 –123.80 0.236725. Received Pc/No (21 + 22 + 23) dB-Hz 48.43 1.68 –1.68 48.43 0.314626. Carrier loop noise BW dB-Hz 20.16 –0.20 0.15 20.13 0.010227. Carrier loop SNR (CNR)
(25–26)dB 28.30 1.71 –1.71 28.30 0.3248
28. Recommended CNR dB 12.00 0.00 0.00 12.00 0.000029. Carrier loop SNR margin
(27–28)dB 16.30 1.71 –1.71 16.30 0.3248
CHANNEL PERFORMANCE30. Command data suppression dB –3.04 0.17 –0.18 –3.04 0.005131. Ranging data suppression dB –3.00 0.10 –0.10 –3.00 0.001732. Received Pd/No (21 + 30 + 31) dB-Hz 48.85 1.68 –1.68 48.85 0.313033. 3-sigma Pd/No (32–3*sqrt
[32var]) dB-Hz 47.17 0.00 0.00 47.17 0.0000
34. Data rate (dB-Hz) dB-Hz 33.01 0.00 0.00 33.01 0.000035. Available Eb/No (32–34) dB 15.84 1.68 –1.68 15.84 0.313036. Implementation loss dB 1.50 –0.50 0.50 1.50 0.083337. Radio loss dB 0.00 –0.30 0.30 0.00 0.030038. Output Eb/No (35–36–37) dB 14.34 1.96 –1.96 14.34 0.426439. Required Eb/No dB 9.60 0.00 0.00 9.60 0.000040. Eb/No margin (38–39) dB 4.74 1.96 –1.96 4.74 0.426441. Eb/No margin sigma dB 0.00 0.00 0.00 0.65 0.000042. Eb/No margin–3sigma
(40–3*41)dB 0.00 0.00 0.00 2.78 0.0000
43. BER (from 38) none 8.5494e–14
Table 6-1. DS1 uplink (command and ranging) DCT (cont’d).
Link Parameter Unit Design Value
FavTol
AdvTol
MeanValue Var

Telecom Link Performance 33
Table 6-2. DS1 downlink (telemetry and ranging) DCT.
Produced by DS1 V5.1 12/16/1999
Predict 2000-173T16:00:00 UTCUp- /downlink Two-wayRF band X:XDiplex mode N/ALNA selection LNA-1Telecom link DSS-14-HighGain. ConfigA-DSS-14
TELEMETRY DOWNLINK PARAMETER INPUTSEncoding Reed-Solomon (255,223) concatenated with C.E. (15,1/6) Carrier tracking ResidualOscillator VCOSubcarrier mode SquarewavePLL bandwidth 1.00 HzTelemetry usage Engineering (ENG)—real timeTelemetry data rate/mod index 3150 bps/ 65.80 deg (38 DN)Telemetry rng/DOR mod index 0.30 rads/ off rad
Operations mode NominalMission phase Launch phaseDSN site Gold-GoldDSN elevation In viewWeather/CD 25Attitude pointing EarthPointed
EXTERNAL DATARange (km) 3.0816e+08Range (AU) 2.0599e+00One-way light time (OWLT) (hh:mm:ss) 00:17:07Station elevation(s) (deg) [14.41]DOFF: HGA, KHA (deg) 2.50 2.50DOFF: LGA1, LGA2, LGA3 (deg) 2.50 92.50 87.50Clk: HGA, KHA (deg) 159.49 0.00Clk: LGA1, LGA2, LGA3 (deg) 159.49 0.00 0.00Added s/c Ant pnt offset (deg) 2.5
DSN site considered: DSS-14/DSS-14
At time: 0.00 hours after the start time
(Continued on next page)

Telecom Link Performance 34
Table 6-2. DS1 downlink (telemetry and ranging) DCT (cont’d).
Link Parameter Unit Design Value
FavTol
AdvTol
MeanValue Var
TRANSMITTER PARAMETERS1. S/C transmitter power dBm 40.97 0.50 –0.50 40.97 0.04172. S/C xmit circuit loss dB –1.91 0.30 –0.30 –1.91 0.03003. S/C antenna gain dBi 24.60 0.60 –0.60 24.60 0.06004. Deg-off-boresight (DOFF) loss dB –0.98 0.21 –0.19 –0.97 0.01345. S/C pointing control loss dB –0.30 0.20 –0.20 –0.30 0.01336. EIRP (1 + 2 + 3 + 4 + 5) dBm 62.39 1.19 –1.19 62.39 0.1584
PATH PARAMETERS7. Space loss dB –280.73 0.00 0.00 –280.73 0.00008. Atmospheric attenuation dB –0.14 0.00 0.00 –0.14 0.0000
RECEIVER PARAMETERS9. DSN antenna gain dBi 74.00 0.20 –0.20 74.00 0.0133
10. DSN antenna pnt loss dB –0.10 0.10 –0.10 –0.10 0.003311. Polarization loss dB –0.02 0.10 –0.10 –0.02 0.0033
TOTAL POWER SUMMARY12. Tot rcvd pwr (6 + 7 + 8 + 9 +
10 + 11)dBm –144.61 –1.27 1.27 –144.61 0.1784
13. SNT (system-noise temperature) at zenith
K 18.39 –2.00 2.00 18.39 0.6667
14. SNT due to elevation K 5.02 0.00 0.00 5.02 0.000015. SNT due to atmosphere K 8.60 0.00 0.00 8.60 0.000016. SNT due to the Sun K 0.00 0.00 0.00 0.00 0.000017. SNT due to other hot bodies K 0.00 0.00 0.00 0.00 0.000018. System noise temperature
(13 + 14 + 15 + 16 + 17)K 32.01 –2.00 2.00 32.01 0.4444
19. Noise spectral density dBm/Hz –183.55 –0.28 0.26 –183.56 0.008220. Received Pt/No (12–19) dB-Hz 38.95 1.30 –1.30 38.95 0.186621. Required Pt/No dB-Hz 38.30 0.00 0.00 38.30 0.000022. Pt/No margin (20–21) dB 0.65 1.30 –1.30 0.65 0.186623. Pt/No margin sigma dB 0.00 0.00 0.00 0.43 0.000024. Pt/No margin-2sigma
(22–2*23)dB 0.00 0.00 0.00 –0.22 0.0000
(Continued on next page)

Telecom Link Performance 35
CARRIER PERFORMANCE25. Recovered Pt/No (20 +
[AGC + BPF])dB-Hz 38.95 1.30 –1.30 38.95 0.1866
26. Theoretical tlm carrier sup dB –7.75 0.56 –0.61 –7.76 0.057027. Non-lin SDST tlm carr sup dB 0.20 0.20 –0.20 0.20 0.006728. Total tlm carr sup (26 + 27) dB –7.56 –0.76 0.76 –7.56 0.063729. Theoretical rng carrier sup dB –0.26 0.04 –0.05 –0.26 0.000330. Non-lin SDST rng carr sup dB –0.54 0.20 –0.20 –0.54 0.006731. Total rng carr sup (29 + 30) dB-Hz –0.80 –0.25 0.25 –0.80 0.007032. DOR carrier suppression dB 0.00 0.00 0.00 0.00 0.000033. Carrier power (AGC)
(12 + 28 + 31 + 32)dBm –152.97 –1.50 1.50 –152.97 0.2491
34. Received Pc/No (25 + 28 + 31 + 32)
dB-Hz 30.58 1.52 –1.52 30.58 0.2573
35. Carrier loop noise BW dB-Hz 0.00 0.00 0.00 0.00 0.000036. Carrier loop SNR (CNR)
(34–35)dB 30.58 1.52 –1.52 30.58 0.2573
37. Recommended CNR dB 10.00 0.00 0.00 10.00 0.000038. Carrier loop SNR margin
(36–37)dB 20.58 1.52 –1.52 20.58 0.2573
TELEMETRY PERFORMANCE39. Theoretical tlm data sup dB –0.80 0.11 –0.12 –0.80 0.002340. Non-lin SDST tlm data sup dB 0.00 0.20 –0.20 0.00 0.006741. Total tlm data sup (39 + 40) dB –0.80 –0.28 0.28 –0.80 0.009042. Theoretical rng data sup dB –0.26 0.04 –0.05 –0.26 0.000343. Non-lin SDST rng data sup dB –1.10 0.20 –0.20 –1.10 0.006744. Total rng data sup (42 + 43) dB-Hz –1.36 –0.25 0.25 –1.36 0.007045. DOR data suppression dB 0.00 0.00 0.00 0.00 0.000046. Received Pd/No (25 + 41 +
44 + 45)dB-Hz 36.79 1.35 –1.35 36.79 0.2025
47. Two sigma Pd/No (46–2*sqrt(46var))
dB-Hz 35.89 0.00 0.00 35.89 0.0000
48. Data rate dB-Hz 34.98 0.00 0.00 34.98 0.000049. Available Eb/No (46–48) dB 1.80 1.35 –1.35 1.80 0.202550. Subcarrier demod loss dB 0.01 0.00 0.00 0.01 0.000051. Symbol sync loss dB 0.01 0.00 0.00 0.01 0.0000
(Continued on next page)
Table 6-2. DS1 downlink (telemetry and ranging) DCT (cont’d).
Link Parameter Unit Design Value
FavTol
AdvTol
MeanValue Var

Telecom Link Performance 36
52. Radio lossdB 0.01 –0.00 0.00 0.01 0.0000
53. Output Eb/No (49–50–51–52) dB 1.78 1.35 –1.35 1.78 0.202554. Output SSNR (Es/No) dB –6.00 –1.35 1.35 –6.00 0.202555. Required Eb/No dB 0.30 0.00 0.00 0.30 0.000056. Eb/No margin (53–55) dB 1.48 1.35 –1.35 1.48 0.202557. Eb/No margin sigma dB 0.00 0.00 0.00 0.45 0.000058. Eb/No margin–2sigma
(56–2*57)dB 0.00 0.00 0.00 0.58 0.0000
59. BER of conv decoder (from 53) none 1.1063e-05
Table 6-2. DS1 downlink (telemetry and ranging) DCT (cont’d).
Link Parameter Unit Design Value
FavTol
AdvTol
MeanValue Var

Telecom Link Performance 37
Table 6-3. DS1 ranging performance (uplink and downlink) DCT.
Produced by DS1 V5.1 12/16/1999
Predict 2000-173T16:00:00 UTCUp- /downlink Two-wayRF band X:XDiplex mode N/ALNA selection LNA-1Telecom link DSS-14-HighGain. ConfigA-DSS-14
COMMAND UPLINK PARAMETER INPUTSCmd data rate 2000.0 bpsCmd mod index 1.20 radCmd rngmod index 44.9 deg
TELEMETRY DOWNLINK PARAMETER INPUTSEncoding Reed-Solomon (255,223) concatenated with C.E. (15,1/6) Carrier tracking ResidualOscillator VCOSubcarrier mode SquarewavePLL bandwidth 1.00 HzTelemetry usage Engineering (ENG)—real timeTelemetry data rate/mod index 3150 bps/ 65.80 deg (38 DN)Telemetry rng/DOR mod index 0.30 rads/ off rad
Operations mode NominalMission phase Launch phaseDSN site Gold-GoldDSN elevation In viewWeather/CD 25Attitude pointing EarthPointed
(Continued on next page)

Telecom Link Performance 38
EXTERNAL DATARange (km) 3.0816e+08Range (AU) 2.0599e+00One-way light time (OWLT) (hh:mm:ss) 00:17:07Station elevation(s) (deg) [14.41]DOFF: HGA, KHA (deg) 2.50 2.50DOFF: LGA1, LGA2, LGA3 (deg) 2.50 92.50 87.50Clk: HGA, KHA (deg) 159.49 0.00Clk: LGA1, LGA2, LGA3 (deg) 159.49 0.00 0.00Added s/c ant pnt offset (deg) 2.5
DSN site considered: DSS-14/DSS-14
At time: 0.00 hours after the start time
(Continued on next page)
Table 6-3. DS1 ranging performance (uplink and downlink) DCT (cont’d).
Produced by DS1 V5.1 12/16/1999

Telecom Link Performance 39
Table 6-3. DS1 ranging performance (uplink and downlink) DCT (cont’d).
Link Parameter UnitDesignValue
FavTol
AdvTol
Mean Value Var
UPLINK TURNAROUND RANGING CHANNEL1. UL recovered Pt/No dB-Hz 54.89 1.66 –1.66 54.89 0.30632. UL cmd ranging suppression dB –3.46 0.20 –0.20 –3.46 0.00673. UL ranging suppression dB –3.03 0.10 –0.10 –3.03 0.00334. UL Pr/Pt (2 + 3) dB –6.49 –0.30 0.30 –6.49 0.01005. UL filtering loss dB –0.91 0.20 –0.20 –0.91 0.00676. UL output Pr/No (1 + 4 + 5) dB-Hz 47.49 1.70 –1.70 47.49 0.32297. Ranging channel noise BW dB-Hz 63.22 –0.43 0.20 63.14 0.01768. UL ranging SNR (6–7) dB –15.65 –1.75 1.75 –15.65 0.3406
DOWNLINK RANGING CHANNEL9. DL recovered Pt/No dB-Hz 38.95 1.30 –1.30 38.95 0.1866
10. Theoretical telemetry suppression
dB –7.75 0.56 –0.61 –7.76 0.0570
11. Non-linear SDST tlm suppression
dB –0.57 0.20 –0.20 –0.57 0.0067
12. DL total tlm suppression dB –8.34 –0.76 0.76 –8.34 0.063713. Theoretical rng modulation loss dB –28.30 2.38 –2.46 –28.33 0.975614. Non-linear SDST rng mod loss dB 0.00 0.20 –0.20 0.00 0.006715. DL total rng mod loss dB –28.33 –2.97 2.97 –28.33 0.982316. DL Pr/Pt (12 + 15) dB –36.66 –3.07 3.07 –36.66 1.046017. DL received Pr/No (9 + 16) dB-Hz 2.28 3.33 –3.33 2.28 1.232618. DL noisy ref loss dB 0.00 0.00 0.00 0.00 0.000019. DL output Pr/No (17 + 18) dB-Hz 2.28 3.33 –3.33 2.28 1.232620. DL out Pr/No sigma dB-Hz 0.00 0.00 0.00 1.11 0.000021. DL out Pr/No mean-2 sigma dB-Hz 0.06 0.00 0.00 0.06 0.000022. DL required Pr/No dB-Hz –10.00 0.00 0.00 –10.00 0.000023. Ranging margin, mean (19–22) dB-Hz 12.28 3.33 –3.33 12.28 1.232624. Ranging margin, mean-2 sigma
(21–22)dB-Hz 10.06 0.00 –0.00 10.06 0.0000

Telecom Link Performance 40
The top plot indicates how the ranging performance (predicted as downlink-ranging powerto noise-spectral-density ratio) varies during a DSS-14 pass on June 21, 2000. Below a thresh-old of –10 dB, ranging quality is unacceptable for navigation; below –5 dB, the quality ismarginal.
The bottom plot shows the 2000-bps command performance (predicted as uplink-com-mand bit energy to noise-spectral-density ratio) for the same pass. Threshold is +9.6 dB for abit-error rate of 10–5.
The uplink-ranging carrier suppression is 3 dB, and the command-carrier suppression is–3.5 dB, both standard DS1 values in mid-2000 for 70-m station operation with the spacecraftHGA. The downlink ranging-modulation index is 17.5 deg (low), and the telemetry-modula-tion index is 65.8 deg. These are also standard DS1 values.
The top plot shows the variation of the DSS-14 elevation angle during the pass on June 21,2000. Because the signal passes through more of Earth’s atmosphere at lower elevation angles,
Fig. 6-1. Downlink Pr/No and uplink Eb/No.

Telecom Link Performance 41
the attenuation is larger and the system-noise temperature (SNT) is higher. Attenuation affectsboth uplink and downlink, while SNT affects downlink.
The bottom plot shows the predicted symbol signal-to-noise ratio (SSNR) of the 3150-bpstelemetry. The downlink carrier also has ranging modulation at the “low” index. The telemetry-decoding threshold for the (15,1/6) concatenated code is –7.5 dB SSNR. DS1 experience showsthat successful decoding by the MCD3 is improbable when the BVR produces an SSNR lowerthan –7.5 dB.
Fig. 6-2. Station elevation angle and downlink telemetry symbol SNR.

42
*Look up this and other abbreviations and acronyms in the list that begins on page 60.
Section 7
Operational Scenarios
The following scenarios describe the major telecom-system operating modes in the contextof supporting specific phases of the mission or major mission activities and modes.
7.1 Launch
The major prelaunch DS1* telecom operational question was whether to launch withSDST in the coherent or the noncoherent mode. Noncoherent mode (coherency disabled) waschosen. The most important consideration leading to this choice was that noncoherent modeprovides an unambiguous downlink frequency for BVR acquisition regardless of whether anuplink is in lock. On the other hand, coherent mode with uplink in lock would have providedimmediate two-way Doppler data to determine any corrections from errors in the launch trajec-tory.
The spacecraft launched with the LGAZ antennas selected, with LGAZ– at the smallerangle to Earth. One day after launch, LGAZ– was to be pointed within about 20 deg of Earthline. The uplink and downlink rates were to provide commandability and telemetry data via theselected LGA over a wide range of pointing errors. At launch, the command rate was 125 bpsuncoded. The downlink rate was 2100 bps on a 25-kHz subcarrier, a 40-deg modulation indexand (7,1/2) convolutional coding. During the initial acquisition pass, the SDST was commandedto go to the coherent mode (“TWNC [two-way non coherent] off” for the old timers), and toturn the X-band ranging channel on. Approximately one day after launch, the uplink rate wascommanded to be 2000 bps, and a small sequence stored onboard before launch was activatedto change the downlink rate to 19908 bps, the telemetry subcarrier frequency to 375 kHz, andthe telemetry-modulation index to 65.8 deg. That configuration stayed the same for the first twoweeks of the mission.

Operational Scenarios 43
7.2 Safing
Safe mode normally occurs when the onboard fault-protection software detects a problemthat requires unplanned ground intervention. (A safe-mode configuration can also be com-manded intentionally, such as when the flight software is “rebooted” after any softwareupdate.)
The original implementation of safe mode for DS1, depending on what fault occurs, wouldpoint the +x-axis either at the Sun or at Earth. Since the late-1999 SRU failure, safe mode hasalways pointed the +x-axis at the Sun and rotated the spacecraft about that axis at a rate of onerevolution per hour. The system fault-protection software runs a “telecom script” (an unchang-ing series of commands, with defined intervals of time between the commands) to configure theSDST, XPA, and the antenna to provide the maximum degree of commandability and chance ofa station receiving above-threshold telemetry. Until March 2001, much of the safe-mode tele-com configuration (noncoherent mode, 7.8125-bps command rate, 40-bps telemetry rate, 25-kHz telemetry subcarrier frequency, (7,1/2) convolutional coding, ranging off, Ka-band down-link off) was similar to that of the launch mode.
Throughout the mission, the telecom script has been updated as to which antenna it selectsand what downlink-telemetry rate it controls. These updates match downlink-performancechanges caused by the changing Earth-DS1 distance and Sun-spacecraft-Earth angle. Telecom-script updates are through command-file uploads from the ground. As of March 2001, the scriptselects LGAX, a telemetry rate of 79 bps, and the (15,1/6) coding. Further changes are notexpected through end of mission.
7.3 Anchor Pass (at HGA Earth Point, High Rate)
The term “anchor” refers to the spacecraft stopping its mission activities to point the HGAat Earth and communicate. Anchor passes are scheduled approximately weekly to downloadtelemetry data accumulated since the last anchor pass, to upload new command sequences, andto provide ranging and Doppler data. Prior to the start of the pass, the spacecraft may havebeen oriented toward a “thrust star” with the IPS thrusting. Since the +x-axis would be off-Earth, minimal communication is possible. The process of pointing to Earth for an anchor passis based on the use of an onboard algorithm to control the spacecraft-pointing attitude withoutusing the failed SRU. Before start of track, the spacecraft sequence stops the thrusting, turns toan “Earth star” reference so the +x-axis is near Earth, selects the HGA, restarts the IPS thrust,1
and the X-band downlink (by turning the X-band exciter on). Depending on the amount oftelemetry data to be downlinked, the ranging channel may be sequenced on for the entire pass(for less telemetry data), or part of the pass (for more data). One or two hours before the endof an anchor pass, these processes would be reversed: the spacecraft returns to thrust attitude,the IPS is restarted, and (just before the scheduled end of track) the downlink is turned off.2
1 Thrusting on Earth-point is not usually beneficial to the trajectory but conserves the very limited attitude-control propellant, hydrazine. The IPS is gimbaled in two axes so it can perform attitude control in the x- and y-axes. Thus, while Earth-point thrusting, at a lower level, hydrazine is only expended for attitude control about the third axis (z).

Operational Scenarios 44
The flight team has developed several variations for starting an anchor pass, based on thedegree of pointing certainty at the start of the pass. One variant occurs when the initial Earth-reference star may be more than 5 deg from Earth, or there may be a question about beinglocked to a star at all. If so, the flight team may elect to start the pass at a low telemetry rate (79or 600 bps, depending on the uncertainty), with HGA selected but with a “lifeboat” sequence toreselect LGAX after three hours. The telecom analyst would compare telemetry Es/No with thevalue predicted for the expected off-Earth angle, then recommend a higher telemetry rate to becommanded in real time. If signal level is adequate, the flight team sends a command to “can-cel” (deactivate) the lifeboat, and so remain on the HGA.
During sequence planning, the telecom analyst defines for each anchor pass the uplink anddownlink rates, together with associated modulation-index values and subcarrier frequencies,and ranging-channel use. The analyst determines the supportable rates, using TFP. During theprimary mission, these predicts were in a “data-rate capability file” intended to interfacedirectly with sequencing software. Because confident long-range planning is less feasible whensuccessively chosen Earth-stars are involved, the telecom analyst makes predictions for eachpass with the off-point angle input directly. In either case, data rates for each allocated 34- or70-m pass enter the sequencing process via “service-package files.”
7.4 Midweek Pass (at Thrust Attitude for IPS Operation)
Midweek passes alternate with anchor passes, which are usually scheduled for early in theweek. During a midweek pass, the spacecraft is three-axis oriented for IPS thrusting throughuse of the Sun sensor, gyros, and science-camera data (assuming current operations without thefailed SRU). During the prime mission, the LGAX or one of the LGAZ antennas dictatedrequired-pointing direction, depending upon which antenna best supported communications ona particular day. For most of the extended and hyperextended missions, LGAX is best becausethrust attitudes result in the +x-axis being 0 to 50 deg from Earth. If the angle is less than 7.5deg, the HGA provides better performance than LGAX. In this case, no turn to an Earth-star isnecessary, and HGA communications are possible for midweek as well as anchor passes. Forlarger angles, midweek passes via LGAX provide at least for the subcarrier tone detection modeto indicate stability of pointing algorithm star-lock and two-way Doppler data to determine ifthrusting is still continuing as planned.
As for anchor passes, the telecom analyst predicts midweek pass uplink and downlink per-formance as a function of time, and 34-m BWG, 34-m HEF, or 70-m station allocation. The top-level spacecraft sequence (the “backbone”) for each successive 2- to 3-week period controls theuplink rate and downlink rate to supportable values. The lowest command rate (7.8125 bps) is
2 Until April 2001, IPS operation was nearly continuous and at a high-thrust level to reach Borrelly. This thrusting is called “deterministic,” with the thrust level determined by the available spacecraft power and thrust direction as a function of time determined by reaching Borrelly at the planned time and miss distance. Subsequently, the mission moved into a period of lower-level “impulse thrusting” for continued hydrazine conservation, using suc-cessive orientations at intervals of one or two weeks toward a “north” and a “south” thrust-star, each near an ecliptic pole. Over a period of time, the impulses cancel one another out. Like Earth-point thrusting, impulse thrusting is not at maximum thrust level and so allows the X-band downlink to remain on between passes.

Operational Scenarios 45
sequenced for 34-m BWG stations with their 4-kW, X-band transmitters. A rate of 125 bps issequenced for either 34-m HEF stations or 70-m stations, both with 20-kW transmitters. Formaximum IPS thrust capability, the X-band downlink is turned on shortly before the scheduledstart of track and turned off a few minutes before the end of track. Observing the turnoff vali-dates that the sequence is operating. During midweek passes, the spacecraft is in the coherentmode, to provide two-way Doppler regarding the thrust.
Between tracks, the spacecraft is generally also left in a “distant-pass” configuration sothat if an unscheduled pass should become necessary, DS1 is commandable. The distant-passconfiguration in late 2001 was LGAX, 7.8125-bps command rate, and 79-bps telemetry rate.
7.5 High-Gain-Antenna Activity (January–June 2000, March 2001)
DS1 spacecraft was launched with a Sun-sensor assembly (SSA), inertial measurementunits (IMUs), and the previously mentioned SRU; together they provided three-axis control ofspacecraft pointing.3 During the prime mission and until November 11, 1999, when the HGAwas selected for planned operations, it was pointed at Earth within a normal dead-band toler-ance of 1 deg.4 That day, downlink performance was not consistent with the HGA and theEarth-point planned for that pass. The spacecraft was found to be in safe mode (LGAX selectedand x-axis pointed to the Sun) after a tracking station could not acquire the expected downlink.Subsequent telemetry analysis showed the SRU was inoperative. Afterwards, the spacecraftremained in safe mode for some months, and low-rate uplink and downlink communicationswere done via LGAX.
To return valuable science data already stored onboard at the time of the failure, as well asmoderately-voluminous engineering data concerning the failure itself, the project flight teaminvented a ground-in-the-loop method to point the spacecraft close enough to Earth to use theHGA. The name refers to the operation of feedback-control loops with delay. Here human ana-lysts analyze spacecraft and station data in real time, then send corrective commands immedi-ately in real time, all the while constrained by the tens of minutes of delay inherent in the light-time between Earth and the spacecraft. Fundamental to ground-in-the-loop control is the idea ofmoving the spacecraft from its +x-axis to the Sun attitude to +x-axis near Earth. This wasaccomplished with a combination of inertial-control and attitude-control system inputs from thegyros and the SSA only. The first part of the process is determining the position (stop theantenna); the second part is maintaining the position (keep the antenna pointed).
This special mode is described in some detail because it involves considerable use of thetelecom-analyst’s skills in monitoring and assessing the significance of variations in downlink-signal levels. The most basic measurement is of carrier performance as represented by the Pc/No (carrier power-to-noise spectral-density ratio). The analyst assesses in real time what com-
3 The SSA was not used for three-axis control or knowledge in normal operation. Only the SRU and IMUs were used in normal operation.
4 The term “dead band” comes from feedback-control theory. It refers here to an angle (1 deg) relative to the devi-ation of the actual pointing relative to each desired axis (x, y, z). When the difference between actual and planned pointing about an axis reaches the dead-band limit (say +1 deg), the control system fires a thruster in the negative direction. No corrective action occurs so long as the pointing error remains within the dead band.

Operational Scenarios 46
mands to send and when to send them. The commands are used to change basic spacecraftmotion and pointing. The initial motion is called “coning,” which is rotating the spacecraftaround the line joining the Sun to the spacecraft, with the +x-axis at a fixed-offset angle fromthe Sun (equal to the Sun-spacecraft-Earth angle). The rotation (coning) rate is once per 45min.5 When coning is stopped, the final motion is with the +x-axis pointed “near” Earth, underinertial control. Pointing control commands index the +x-axis by a selected number of degrees(from 2 to 8), to compensate for gyro drift during the hours of the pass.
7.5.1 Stopping the Antenna Near Earth by Using the Planning Worksheet
Use of an Excel-planning spreadsheet requiring only simple and rapidly made inputs andproviding simple and unambiguous-to-use outputs is essential to achieve the initial HGA point-ing, starting from the +x-axis to the Sun condition. See Fig. 7-1.
Before the pass begins, the telecom analyst customizes the spreadsheet with the allocatedstart-and end-track times, the “start coning” and “final conditions” sequence start times, and theone-way light time. Figure 6-1 shows one-of-three parts of the worksheet, with the times in thetwo “action” cells updating as soon as the analyst has filled in the “observe” time. The twoactions are (a) the time the station will turn on its transmitter and begin an uplink-acquisitionsweep, and (b) the time the DS1 controller (ACE) will radiate the “stop-coning” activatecommand.
The onboard “start-coning” sequence puts the spacecraft into an attitude-control systemmode that ensures the HGA will sweep its boresight past Earth periodically. The telecom sys-tem is switched from LGAX to HGA, telemetry modulation is removed from the downlink car-rier, and the command rate is set to 31.25 bps. The +x-axis moves from the Sun, a distance equalto the Sun-spacecraft-Earth angle, and the spacecraft is sequenced to begin rotating about theSun-spacecraft line at one rotation per 45 min. Using the spreadsheet to determine the actualrotation rate, the telecom analyst observes and times the occurrence of two sweeps of the HGAboresight past Earth, and then gives the ACE the “action” times. These determine when theuplink and the command must be sent to reach the spacecraft, as the HGA is pointed near Earththe third time. Excluding station problems, 95 percent of the time this process stopped theantenna near Earth on the first attempt.
The March 2001 HGA activity was planned to stop the antenna, based on the analyst’s see-ing only one peak, on the assumption that the rotation was always close to once per 45 min. This“single-peak” activity, which was checked against the similar one in June 2000, was successful.
7.5.2 Keeping the Antenna Pointed Near Earth by Monitoring Signal Levels
The quantities monitored during this phase include the downlink Pc/No, telemetry Es/No(symbol energy to noise-spectral-density ratio), or uplink Pc (carrier power).
5 The coning rate is one rotation per 45 min. in contrast to the safe-mode rotation rate of one revolution per 60 min. As part of the SRU recovery flight-operations redesign, the coning rate was made as rapid as possible while still providing sufficient time to get a “stop-coning” command to the spacecraft. The safe-mode rate was established before launch, and there has been no reason to change it.

Operational Scenarios 47
After the ACE has radiated the “stop-coning” command, the telecom analyst records thePc/No observed for each of the first two peaks from each of the two receivers. This singlecommand activates a small stored sequence of commands that stops the coning rotation, pro-duces a turn-back in the opposite direction to return the HGA to near-perfect Earth-point, andresets the command and telemetry rates for further activity. The analyst compares the Pc/Novalue against the mean value predicted by TFP that assumes the HGA boresight is Earth-pointed with all telecom-link components operating at their expected values. The purpose ofthis assessment is to estimate the maximum downlink rate the link can support, taking into
Fig. 7-1. Replica of “HGA Activity Planning Spreadsheet” for May 26, 2000 activity.
Action Plan (based on seeing first 2 peaks)
act_date 05/26/00
owlt_sec 981owlt= 0:16:21rtlt= 0:32:42time/rev= 0:44:39 (from 1st to 2nd observed peak) NO coherency?typeover seeded items Do NOT enable uplink station Conscan NO ka-band dl?type in observations planned times/intervals NO fsr recording?
station NOCC QUERY NO ul conscan?
transmit SCET receive receive what dB or time value
12:23:41 12:23:41 observation: 1st HGA peak used in stopping HGA12:23:26 observation with delay removed13:08:41 2nd HGA peak was expected nominal = 00:45:00
observe--> 13:08:20 13:08:28 observation: 2nd HGA peak used in stopping HGA interval= 0:44:39 (2nd - 1st peak)
13:52:59 13:53:07 3rd HGA peak expected13:20:05 13:52:47 13:52:55 expected 3rd peak with delay removed
13:11:20 Start Excel sheet update (2nd peak seen plus 1 min) worktime= 0:06:0013:13:20 <--alert Give ACE station drive_on time13:13:20 ACE verifies CMD buffer selected for 31.25 bps nominal = 00:11:1913:18:20 <--action! 13:18:28 34m station’s transmitter drive ON interval= 0:10:00 (DrvOn - peak)
start sweep (3 segments +/-10 kHz, 300 Hz/sec = 00:01:40 for sweep) 13:20:00 Expected end of sweep (based on ACQ and nominal ETX30XCN duration of 00:01:40)13:20:05 Station turns command modulation ON at end of sweep13:20:12 ACE verifies command modulation ON nominal = 00:13:2413:20:25 <--action! 13:20:33 "Stop coning" activate cmd bit1 (drive ON + 00:02:05) interval= 0:12:05 (Bit1 - peak)13:20:28 Actual radiation begin, including command system latency13:20:52 13:37:13 End radiation of activate command (for 31.25 bps only, excluding vc5 tail sequence)13:20:53 13:37:14 Sequence execution begins13:20:53 13:37:14 Sequence execution completes
13:21:45 13:38:06 13:54:27 WAG: HGA stops. 0:01:40 after real 3rd peak
13:55:09 13:55:17 Stopped HGA expected 00:02:10 nominal 0:00:42 (stop - peak)14:00:29 14:00:37 HGA turn back expected 00:05:20 nominal 0:05:20 (back - stop)
Change log1/18/00 See "1stPeak_plan_times" for general updates
4/26/00 No Conscan on uplink station
5/5/00 Added planning intervals for "stop coning"
5/12/00 Corrected erroneous definition of ow lt in 2ndPeak sheet
5/12/00 Defined drive_on warning = 5 minutes (was 2 minutes)
5/12/00 Define start_excel time = 2ndPeak obs + 1 min, based on NOCC RT (w as 3 min)
5/15/00 Change "give ACE…" cell A23 to "alert" and color yellow
5/15/00 Add row s 37-38 for expected HGA stop and HGA back to earth

Operational Scenarios 48
account link performance as well as the HGA-pointing control demonstrated during previousHGA activities.
Next, the station Pc/No data show the third peak, the subsequent halt in antenna motion,and the turn back to Earth. The telecom analyst directs the ACE to command the activation of astored “telemetry-rate” sequence to establish the supportable rate, with its subcarrier frequencyand modulation index. Thereafter, through the remaining hours of the pass, the analyst contin-ues to monitor downlink Pc/No, Es/No, and uplink Pc to determine if the antenna drifted too farfrom Earth to support the rate. If so, the analyst directs that a “corrective-turn” activate com-mand be transmitted. The criterion for activating a “corrective-turn” sequence is if the Es/Nofirst falls to –6 dB (with the threshold being –7.5 dB) fairly rapidly or sinks to –6 dB twice butless rapidly.
The March 2001 HGA activity, using the new flight software, progressed similarly tomany HGA activities in 2000. For the first few hours after Earth-point was achieved, the HGAremained near Earth. Gradually, pointing became worse, and ordinary-corrective turns were noteffective. Seeing this, the DS1 attitude control analyst developed a new-turn sequence thatmimics a fraction of a turn of the original-coning rotation. This sequence restored HGA point-ing, and has been made standard for HGA activities required after future safe-mode events, orflight-software updates.
7.6 Solar Conjunction
Solar conjunction occurs when the spacecraft and the Sun are in the same angular regionas viewed from the deep-space station [17]. The angular separation is the Sun-Earth-probe(SEP) angle. Effects on deep-space communications become more severe as the SEP anglebecomes smaller.6 For DS1, X-band up- and downlink, we considered an angle of 5 deg as theminimum at which to expect no degradation, and 3 deg as the minimum at which reliable com-munications could be planned. From October 20 to December 3, 2000, the angle was less than5 deg, and from October 29 to November 25 it was less than 3 deg. The minimum angle wasless than 0.5 deg during a scheduled pass on November 14, 2000. The 11-year solar cycle wasnear its maximum.
Both to minimize configuration changes, and to use the HGA as much as possible, projectnavigation found a single-reference star with small x-axis-to-Earth angle throughout the con-junction period.7 The HGA off-point from Earth varied from about 2.5 deg at period start to aminimum of 0.3 deg November 13, to about 2.8 deg at period end. The first scheduled postcon-
6 A superior solar conjunction (like DS1’s) occurs when the Sun is between the spacecraft and the Earth. Planning for superior conjunction effects on deep-space links at JPL currently takes into account only the carrier-fre-quency band and the Sun-Earth-spacecraft angle. Solar activity varies in cycles, with the 11-year solar cycle near a maximum in 2000–2001. The effects on a link, caused by charged particles from the Sun producing amplitude and phase scintillation, may also be highly variable over periods of a few minutes to a few hours. Coronal-mass ejections (CME) of charged particles that cross the ray path between Earth and the spacecraft have degraded Galileo low-margin S-band links even when the SEP angle is large (> 90 deg). Apparent solar effects affected DS1 X-band up- and downlink signals during a pass on April 3, 2001 (at SEP ~31 deg), less than one day after a very large (class X20) solar flare occurred.

Operational Scenarios 49
junction pass that the project was able to receive telemetry was on November 20, with the Sun-Earth-spacecraft angle at 1.1 deg.
The DS1 project planned the solar conjunction as a single sequence with minimal configu-ration changes, to be loaded onboard for execution for the entire duration. The up- and down-link data rates were conservative, and the command-loss expiration was pushed to beyond thetime the angle would again be greater than 3 deg. The command rate was made 7.8125 bpsthrough the conjunction period.
Downlink strategy, as a function of Sun-Earth-spacecraft angle, was to:
• Sequence a downlink rate that was reduced by one or two data rates from normal between an angle of 3 and 5 deg. For example, instead of 4424 bps, sequence 3150 bps or 2100 bps. Instead of 790 bps sequence 600 bps or 420 bps. This increased the margin by about 1.2 to 3.1 dB
• Sequence 40 bps for passes with an angle less than 3 deg
• Modulate downlink carrier with only a subcarrier tone for passes with an angle less than 1 deg.
Link configurations were based on experience from recent solar conjunctions of Mars Glo-bal Surveyor and Cassini, as well as on the recommendations of David Morabito, of the JPLTelecommunications Systems and Research Section. The sequence included operating both theX- and Ka-band downlinks. It also included periods with the downlink in the two-way coherentmode (SDST-coherency enabled and uplink in lock) and other periods with no planned uplink.The objective was to maximize the probability that at least one frequency band would be receiv-able during the scheduled weekly tracking passes. The strategy was successful both in monitor-ing spacecraft health and providing open- and closed-loop data for telecom analysis, andplanning other project conjunctions [17].
7.7 Ka-Band Downlink
Using the Ka-band downlink during the first months after launch was for technologyvalidation of the KaPA. Ka-band was also used operationally during portions of the solar con-junction in November 2000. The Ka-band downlink is receivable via the KHA only when the+x-axis points at Earth and a station with Ka-band capability has been allocated. Sequencing ofthe Ka-band exciter of the SDST and the KaPA is through previously stored commands.
During the 1998–99 technology validation period, the Ka-band downlink carried telemetryand ranging data. Ranging channel on/off and modulation index (low/high) are individuallycontrollable for X- and Ka-band, as is the telemetry subcarrier frequency and modulation index.However, only a single downlink rate is available at a time for use on both bands. Because theKHA and HGA gains are similar, but the KaPA has one-fifth of XPA’s RF output, the Ka-band
7 Part of the rationale in selecting the reference star used during conjunction was to yield good pointing relative to Earth for the November 20 pass. The star was also suitable for IPS thrusting which continued throughout con-junction. The 0.3 deg minimum Sun-Earth-spacecraft angle that occurred on November 13 compares with a solar radius of about 0.25 deg and meant the signal path from spacecraft to Earth was very nearly blocked by the Sun.

Operational Scenarios 50
supportable telemetry rate is similarly reduced relative to X-band. Because DS1 is downlink-rate limited, the project generally chooses the higher rate supportable on X-band. Subsequently,except for special tests, the Ka-band downlink has been unmodulated.

51
*Look up this and other abbreviations and acronyms in the list that begins on page 60.
Section 8
Lessons Learned
8.1 Telecom-Related Lessons Learned
In December 1999, Telecom presented lessons learned to DS1*. This section is an updateof that material, covering the development and testing of the SDST and KaPA, as well as theflight operations. The section begins with some things we did mostly right and ends with otherthings that caused us difficulty.
8.1.1 Telecom Pre-Launch Testing
Telecom hardware testing by the manufacturer, the JPL Telecom-Development Lab (TDL)system testing, DSN-compatibility testing, and spacecraft-level prelaunch system testing wasthorough enough on DS1 that the flight team has yet to find an untested SDST characteristicthat is needed for in-flight planning or analysis. The DS1 telecom test plan should be used as amodel for our in-development projects. Future test plans don’t need to include repeats of devel-opment tests already done for unchanged components; however, the planning needs to beequally thorough in considering the telecom functions (command, telemetry, carrier tracking,including the presence of Doppler shifts, ranging) and mission plans.
8.1.2 Development-to-Operations “Handover”
This was properly scheduled and well executed. The flight-team telecom analyst cameonboard a year before the planned launch, and the development telecom-system peopleremained to lend a hand through the planned “40-day” technology-validation period that lastedsix months. The intense period of telecom in-flight characterization (planning and execution)probably lasted half that long, with the formal SDST, KaPA, and BMOX technology-validationactivities on the spacecraft occupying all or portions of about 15 passes. The telecom analystwas well seasoned by launch, including a sufficient familiarity with the DS1 spacecraft and spe-cifically its telecom system characteristics. Even so, the telecom-development engineers played

Lessons Learned 52
important roles in the formal-technology validation. Plans for our in-development projects needto include a development-to-operations handover of at least one year.
8.1.3 Flight Team Telecom-Support Level
The flight-team plan for telecom staffing was 1.0 full-time equivalent (FTE) in the primemission, reducing to 0.5 during the extended mission. The reality was the need for 1.5 to 2.0FTEs; through in-flight characterization, remaining at 1.0 through the SRU-anomaly resolution,and 0.75 by May 2001. Some causes: our software tools were not mature; there is more thanexpected hands-on flying of this dynamic spacecraft; and there is a continuing need to producetwo forms of telecom-configuration definitions (a DSN keywords file and service packages).The DS1 experience taught us that we need a full-time, seasoned telecom analyst for eachspacecraft, with moderately active telecom planning and execution, with tracking a half or moreof the total time. This level can begin to be cut back once several projects have a common set ofautomation tools for telecom planning and analysis.
8.1.4 Effective Staffing Mix
On DS1, the senior-lead telecom analyst trained and mentored two junior analysts succes-sively through the prime mission. We verified that routine or repetitive tasks such as perfor-mance-comparison runs do not require a senior analyst. A second, on-call senior analyst canstep in for vacations, illness, etc. DS1 hoped to do the link-analysis task using a pool of quali-fied engineers. However, this “plug and play” approach did not work for DS1 because therewere never enough members in the pool, and there were not enough projects subscribing to theconcept. The implication here is that these problems have to be overcome to make a pure “ser-vice” approach work, and—even then—a senior analyst with continuity on each project is vitalto mission success for a telecom-active mission. In the future, availability of more effective orintegrated telecom software would allow for automation of the routine tasks, requiring only areview of the results by a less senior analyst.
8.1.5 Flight Team Co-Location, Near the MSA
Operating from a separate building by telephone and e-mail would not have worked. Co-location reduces sequence-integration/review turnaround-time during iterations. The data areaccessible only behind the firewall in the MSA. Interruptions are a resultant co-location cost inindividual-analyst efficiency. These results underscore the lesson that the planning portions ofthe link-analysis task are project-dedicated flight-team functions, not a generic task.
8.1.6 Effective, Easy-to-Use Data Displays
DS1 made a formal agreement with the DSN to provide access in the MSA to operate (viagraphical user interface) the workstations of the DSN’s Network operations control-center real-time (NOCC RT) system. This allows a telecom analyst or the ACE to resolve configurationand bandwidth problems. Because of the demonstrated need for it on DS1, the AMMOS systemhas developed some NOCC RT functions, including plot rescaling without data loss, in theDMD.

Lessons Learned 53
8.1.7 Querying Data
The AMMOS query system has limitations, particularly for even a few telemetry channelsover long durations. Consequently, to complete the technology validation required 2-1/2 weeksof senior-analyst time for queries of KaPA performance and configuration back to the time ofthe in-flight characterization (December 1998). The set of tools, DMD/EZquery/Oplot is capa-ble, but it works easily only for fairly recent data (of a few weeks’ duration).
8.1.8 Telecom-Sequencing Standardization
Inconsistency in telecom configuration guidelines led to the need to redeliver service pack-ages (SPs) and to re-review sequence products. On the other side, there was a real growth overtime in sequence modularization and standardization through use of activity types such as theTBOT and TEOT (telecom at beginning and end of tracks), downlink-rate control (includingranging-channel use, modulation index, and subcarrier frequency), and the DSN keyword files(DKFs). Dual lessons here are to (a) publish sequence-generation guidelines early and stick tothem, and (b) modularize for reuse the sequence elements at several levels higher than individ-ual commands.
8.1.9 Need for an As-Flown Sequence
A project needs a good one-page-per-day SFOS (spaceflight operations schedule) for plan-ning and a good as-flown SOE (sequence of events) for analysis. An as-flown set of sequencedand real-time telecom commands could replace data queries to establish configuration for tech-nology validation or problem analysis.
8.1.10 Simultaneous Update
Selection of TFP (over Excel) was the correct choice for the solid tool needed for the oper-ational environment, but it was new software. In the several months before and after launch,there were several deliveries of TFP as well as the need for individual “add path” telecom mod-els.1 Up to several hours of analyst time are needed to verify the correctness of each add-pathupdate and several days to verify a formal TFP delivery before use in project-mission planning.The nonlinearity in the flight-engineering model SDST X-band modulator [18] required 1-1/2months for users to determine how to model and implement in TFP. Most of these TFP-devel-opment “growing pains” should be less severe for in-development projects that adapt the sametool. The DS1 lesson is that the project-development plan needs to provide for a sufficient adap-tation, debug, and shakedown effort for a new link-analysis tool ensemble.
1 See [15] for a description of TFP, including “add path.” The name refers to maintaining the officially-delivered TFP spacecraft and station models in specific computer directories, then establishing updated models, as needed, in separate directories. TFP allows the user to specify that a TFP run use the updated model by adding its direc-tory path to the run instructions. For example, when many station performance parameters and models changed as the interface document 810-5 was updated from [13] (Rev. D) to [12] (Rev. E), the DS1 telecom analyst has used add paths for the more significant differences such as 70-m station system-noise temperatures.

Lessons Learned 54
8.1.11 Service Packages and DSN Keyword Files
As part of a ground-system “new technology,” DS1 worked with the DSN to define the SPfor both the telecom-configuration input to project-sequence planning and the project input tothe new Network Planning and Preparation (NPP) system. The NPP, intended as an automatedmeans for station-configuration management, never became operational. As DS1 launchneared, significant concern about the NPP development resulted in a TMOD/project agreementfor the project to use the older DKF station-configuration-management input. The project usedSPs for telecom input to the sequencing process, as planned. Telecom time was lost beforelaunch to develop and test the SP as an NPP input. With hindsight, a telecom interface forproject sequence input only, could have been less complex than the SP. The late changeover tothe DKF interface resulted in the need for several updates to the DKF-generation softwarethrough flight, and still a need for some hand-editing and a review of DKF outputs. The DS1-SPexperience will be applied to our in-development projects to make their data-rate-capabilitygeneration, configuration trade-off, and telecom-planning input processes and tools simple touse and easy to modify. At the other end of the sequence-generation process, the DKF-interfaceto DSN configuration needs to be made both significantly more flexible (allowing for severaldata rates per pass) and more automated than it became on DS1.
8.2 Project-Level Lessons Learned
In December 2000, the former and current DS1 project managers and the spacecraft-devel-opment system manager presented the “lessons learned” to JPL [19]. The presentation includeda mission summary, a discussion of the mission-success criteria, and the spacecraft-system-development schedule to place things into context.
Following one page titled, “Why did DS1 accomplish so much?,” and another two titled,“What worked well?,” there are 12 pages headed, “What didn’t work well and why?”
Here, from that presentation, is a summary of the DS1 project-level lessons learned. With-out the inclusion of the events that motivated each lesson, these should be taken more as achecklist for deep-space project operations in the future.
8.2.1 Project Management
• A project needs at least a year for Phase A/B, culminating in a review to ensure the mis-sion concept is sound, the requirements are agreed to, and there are sufficient resources to do the job.
• During the early project phases, define phasing of funding, need dates for the launch vehicle, requirements and success criteria, etc., and do not proceed with further com-mitments until the entire project is better understood and agreement is in place with NASA Headquarters.
8.2.2 Organization-and-Team Dynamics
• The team is the most important factor in mission success.

Lessons Learned 55
• An unambiguous organization, adequate resources and the right environment are essen-tial to allow the team to succeed. It is critical to have adequate resources to allow the team to do their job in a humane way.
8.2.3 Reviews
• Peer Reviews add the most value.
• Set up a peer-review plan early and get line-management support. Make sure the indus-try partner buys into the peer-review process.
8.2.4 Advanced Technologies
• Develop a technology plan during formulation that addresses risk-mitigation and tech-nology readiness. Include meaningful technology-readiness gates to assess development progress, include clear-action plans if the gates are not met.
• Be cautious about having one technology rely on another for testing.
• If technologies are coupled, treat the independent technology as critical.
8.2.5 Communications and Data Transfer
• Require data transfer to occur at the technical level, without intermediaries.
8.2.6 Assembly, Test, and Launch Operations
• Include adequate margin in development schedules, particularly for technology devel-opment. Develop an Assembly, Test and Launch Operations plan that is resilient to late deliveries.
8.2.7 Operations
• Resources (personnel and schedule) need to be made available in order to allow space-craft-and payload-team participation early in operations planning.
• Allocate time to allow development personnel to complete integration and test activities and to prepare for mission operations.
8.2.8 Contingency Procedures
• Develop contingency procedures and update them during development and operations as new information makes them obsolete.
8.2.9 Operations-Testbed Environment
• If an activity is important and uncertain enough to test in a test bed, then require all sub-systems with major involvement in it to review the test results.
• The test-bed configuration should be as flight-like as possible, and differences must be completely understood by the operations team.

Lessons Learned 56
8.2.10 Single-String Teams
• Build in human redundancy.
• Allocate funds for training and mentoring. Identify this as a major risk if the budget will not allow additional staffing.
8.2.11 External Communications
• Define and maintain clear lines of communication to management and to the news media. Communicate the probable outcome of critical events and their impact clearly to JPL, Headquarters, and the media.
8.2.12 Science in a Technology-Validation Mission
• Speak clearly as a project, with one voice, to ensure that external expectations match priorities. Project, JPL and Headquarters must be in agreement on mission-success criteria.

57
References
[1] C.-C. Chen, Deep Space 1 Telecom Operations Reference Handbook (JPL internal web site), http://eis.jpl.nasa.gov/ds1/telecom/ Accessed July 2001.
[2a] M. Muñoz Fernández, Deep Space 1 Mission Support, Master of Space Studies thesis, International Space University, Strasbourg, France, May 2000.
[2b] A. I. Bolea Alamanac, Deep Space 1 Operations: Lessons Learned, Master of Space Studies thesis, International Space University, Strasbourg, France, May 2001.
[3] The DS1 project web site, http://nmp.jpl.nasa.gov/ds1/
• M. D. Rayman, “Mission Log,” http://nmp.jpl.nasa.gov/ds1/mrlog.html Accessed August 2001.
• Launch press kit, http://www.jpl.nasa.gov/news/press_kits/ds1launch.pdf Accessed August 2001.
• Spacecraft description, http://nmp.jpl.nasa.gov/ds1/tech/spacecraft.html Accessed August 2001.
[4] M. D. Rayman, P. Varghese, D. H. Lehman, and L. L. Livesay, “Results from the Deep Space 1 Technology Validation Mission,” IAA-99-IAA.11.2.01, 50th International Astro-nautical Congress, Amsterdam, The Netherlands, October 4–8, 1999, http://nmp.jpl.nasa.gov/ds1/DS1_Primary_Mission.pdf Accessed October 2001.
[5] M. D. Rayman and P. Varghese, “The Deep Space 1 Extended Mission,” IAF-00-Q.5.01, 51st International Astronautical Congress, Rio de Janeiro, Brazil, October 2–6, 2000, http://nmp.jpl.nasa.gov/ds1/DS1_Extended_Mission.pdf Accessed October 2001.
[6] New Millennium Program Technology Validation Reports, http://nmp-techval-reports.jpl.nasa.gov/ (with individual reports on each DS1 technology, including SDST, KaPA, and BMOX). Accessed August 2001.
[7] J. Taylor and P. Ko, “Achieving and Maintaining Deep Space 1 Spacecraft High-Gain Antenna Pointing Control by Data Monitoring and Immediate Corrective Commanding,” The Telecommunications and Mission Operations Progress Report 42–144, http://tmo.jpl.nasa.gov/tmo/progress_report/42-144/title.htm Accessed August 2001.
[8] DS1 Project Requirements/TMOD Support Agreement (PR/TSA), DS1 Service Require-ments/TMOD Commitments (JPL internal web site), http://eis.jpl.nasa.gov/ds1/pr_tsa/svcsfram.htm Accessed August 2001.
[9] Telecommunication FEM SDST/DSN Performance and Compatibility Motorola Test Report (JPL internal web site), http://eis-lib.jpl.nasa.gov/eis-lib/dscgi/ds.py/Get/File-5438/motorola_tst_rpt.doc Accessed August 2001.

58
[10] The Deep Space Network, http://deepspace.jpl.nasa.gov/dsn/ Accessed August 2001.
[11] Deep Space 1 (DS1) Project Network Operations Plan, JPL D-14824, DSN 871-010-030 (internal document), January 23, 2001.
[12] DSMS Telecommunications Link Design Handbook, 810-005, Rev. E, http://eis/deep-space/dsndocs/810-005/ Accessed July 2001.
[13] R. Sniffin,1 Deep Space Network/Flight Project Interface Design Handbook, Volume I: Existing DSN Capabilities, JPL 810-5, Rev. D, Jet Propulsion Laboratory, Pasadena, California, September 15, 1991, also available at JPL internal web site http://block.jpl.nasa.gov/810-5/810-5.html Accessed October 2001.
[14] K.-M. Cheung, A. Makovsky, and J. Taylor, “Telecommunications Analysis for ‘Faster, Better, Cheaper’ Deep Space Flight Planning and Operations: The DS1 Experience,” http://tmo.jpl.nasa.gov/tmo/progress_report/42-140/title.htm Accessed August 2001.
[15] K. K. Tong and R. H. Tung, A Multimission Deep-Space Telecommunications Analysis Tool: The Telecom Forecaster Predictor, http://tmo.jpl.nasa.gov/tmo/progress_report/42-140/title.htm Accessed August 2001.
[16] R. Gounley, DS1 Project Telemetry Dictionary (version M3T8A), JPL D-14678 (internal document), September 19, 1998, also available at JPL internal web site http://eis-lib.jpl.nasa.gov/eis-lib/dscgi/ds.py/View/Collection-955 Accessed August 2001.
[17] D. Morabito, S. Shambayati, S. Finley, D. Fort, J. Taylor, and K. Moyd, “Ka-band and X-band Observations of the Solar Corona Acquired During Superior Conjunctions Using Interplanetary Spacecraft," paper presented at the Seventh Ka-band Utilization Confer-ence, Genoa, Italy, September 26–28, 2001.
[18] A. Makovsky, “New Telecom Loss Models for DS1,” JPL interoffice memorandum 3310-98-09 (internal document), June 18, 1998 [available in [1], Section 5].
[19] D. H. Lehman, L. Livesay, M. Rayman, and P. Varghese, DS1 Lessons Learned (JPL internal document), presentation at JPL, December 1, 2000.
1 There are two versions of the tracking-station-interface document, with Rev. D [13] applicable through most of the DS1 mission. Rev. D of 810-5 is dated February 15, 1975 (with later individual release dates of many individ-ual modules). The document was superseded and renamed 810-005 (Rev. E) [12], January 15, 2001.

59
Additional Resources
[1] M. I. Herman, S. Valas, W. Hatch, C.-C. Chen, S. H. Zingales, R. P. Scaramastra, L. R. Amaro, M. D. Rayman, DS1 Telecommunication Development, SSC98-IV, Utah Small Satellite Conference, September 1, 1998, http://www.sdl.usu.edu/conferences/smallsat/proceedings/12/ssc98/4/ssciv1.pdf Accessed August 2001.
[2] Basics of Space Flight, JPL. This is a training module designed primarily to help JPL operations staff identify the range of concepts associated with deep-space missions and grasp the relationships these concepts exhibit for space flight. It also enjoys growing pop-ularity among high school and college students, as well as faculty and those everywhere who are interested in interplanetary space flight. Its major sections are Environment, Flight Projects, and Operations: http://www.jpl.nasa.gov/basics/toc.html Accessed August 2001.
[3] Solar activity and space weather information:
• http://www.spaceweather.com/ Accessed August 2001.
• http://lasco-www.nrl.navy.mil/ Accessed August 2001.
• http://www.sec.noaa.gov/SWN/ Accessed August 2001.

60
Abbreviations and Acronyms
ACE call sign for project real-time mission controllerAGC automatic gain control (received carrier power)AMMOS Advanced Multimission Operations SystemATLO Assembly, Test and Launch OperationsBBPP base-band patch panelBER bit-error rateBMOX Beacon-Monitor Operations Experimentbps bits per secondBVR Block V ReceiverBW bandwidthBWG beam waveguideCAS Cassini ProjectCD cumulative distributionCDR Central Data RecorderC&DH command and data handlingClk clockCMA command modulator assemblyCmd commandCMD command systemCME coronal-mass ejectionCNR carrier-to-noise ratioCPA command processor assemblydB decibelDCT design control tableDKF DSN keyword fileDL downlinkDM data moverDMC DSCC meteorological computer DMD data monitor and displayDOFF degrees off (boresight)DOR differential one-way rangingDrv drive

61
DS1 Deep Space 1DSCC Deep Space Communications ComplexDSMS Deep Space Mission SystemsDSN Deep Space NetworkEb/No bit-energy-to-noise spectral-density ratioEIRP effective isotropic radiated powerERT Earth received timeEs/No symbol energy-to-noise spectral-density ratioETX exciter transmitterFEM flight-engineering modelFSR Full-Spectrum RecorderFSS Frame Synchronizer SystemFTS frequency and timing systemGaAs gallium arsenideGUI graphical user interfaceHEF high efficiencyHEMT high electron mobility transistorHGA high-gain antennaHLAN high-speed LANICA IF channel assemblyIDS IPS diagnostic sensorsIEM integrated-electronics moduleIF intermediate frequencyIMU inertial-measurement unitIPN-ISD InterPlanetary Network and Information Systems Directorate (formerly TMOD)IPS ion-propulsion systemISU International Space UniversityJPL Jet Propulsion LaboratoryLAN local-area networkLCCD level clock conversion distribution (interface)LCP left-circular polarizationKaPA Ka-band power amplifierKHA Ka-band horn antennaLGA low-gain antennaLGAX LGA directed along the +x-axisLGAZ LGA directed along the +z-axisLGAZ– GA directed along the –z-axisLMC link monitor and control

62
LNA low-noise amplifierLPE low-power electronicsMCD maximum-likelihood convolutional decoderMDA metric data assemblyMICAS miniature integrated-camera spectrometerMON monitor systemMST monitor sample timeNAV navigationNMC Network Monitor and ControlNMP New Millennium ProgramNOCC RT Network Operations Control Center real timeNOP network operations planNPP Network Planning and Preparation systemOWLT one-way light timePASM power actuation and switching modulePc/No carrier power to noise-spectral-density ratioPd/No Data power-to-noise spectral-density ratioPEPE Plasma Experiment for Planetary ExplorationPLL Phase-lock loopPr/No ranging power-to-noise spectral-density ratioPt/No total power-to-noise spectral-density ratioPR/TSA project requirements/TMOD support agreementRAX Remote-Agent ExperimentRCC receiver control computerRCP receiver channel processorRCP right-circular polarizationRF radio frequencyRLAN receiver LANRNS reliable network serviceRS Reed-SolomonRTLT round-trip light timeS&L standards and limitsS/C spacecraftSCARLET Solar Concentrator Array Using Refractive Linear Element TechnologySCET spacecraft event timeSDST Small Deep-Space TransponderSEP solar-electric propulsion (technology)SEP Sun-Earth-probe (angle)

63
SFOS spaceflight operations schedulesigma spelled out form of Greek character, σ (for 1 standard deviation)SIT select in testSNT system-noise temperatureSOE sequence of eventsSP service packageSPC signal processing centerSRA sequential ranging assemblySRU stellar-reference unitSSA Sun-sensor assemblySSD symbol stream distributionSSK soft symbol controllerTBOT telecom at beginning of tracksTEOT telecom at end of tracksTCA telemetry channel assemblyTFP telecom forecaster predictorTlm telemetryTLM telemetry systemTMOD Telecommunications and Mission Operations Directorate (now called IPN-ISD)TRK tracking systemTWNC two-way noncoherentUL uplinkUSO ultrastable oscillatorUTC universal time coordinatedVC virtual commandVCO voltage-controlled oscillatorVME Versamodule EurocardWAG rough engineering estimateXe xenonXPA X-band power amplifier