desert tortoise recovery plan assessment · 1.2 desert tortoise recovery plan assessment committee...
TRANSCRIPT

DTRPAC Report page i
Desert Tortoise Recovery Plan Assessment
Tracy, C.R., R. Averill-Murray, W. I. Boarman, D. Delehanty, J. Heaton, E. McCoy, D. Morafka, K. Nussear, B. Hagerty, P. Medica

DTRPAC Report page ii
Dedication
This report is dedicated to our colleague and friend David Morafka.

DTRPAC Report page iii
Assessment Committee
C. Richard Tracy (Chair) Professor of Biology University of Nevada, Reno Reno, Nevada
Roy Averill-Murray William I. Boarman Biologist Biologist Arizona Game and Fish Department U.S. Geological Survey/ BRD Phoenix, Arizona San Diego, California
Dave Delehanty Jill Heaton Assistant Professor of Biology Assistant Professor of Geography Idaho State University University of Nevada, Reno Pocatello, Idaho Reno, Nevada
Jeff Lovich Earl McCoy Biologist Professor of Biology U.S. Geological Survey University of South Florida Flagstaff, Arizona Tampa, Florida
Phil Medica Dave Morafka Biologist Research Associate U.S. Geological Survey California Academy of Sciences Las Vegas, Nevada San Francisco, California
Ken Nussear Bridgette Hagerty Research Ecologist Ph.D. Student U.S. Geological Survey University of Nevada, Reno Las Vegas, Nevada Reno, Nevada

DTRPAC Report page iv
Table of Contents
DESERT TORTOISE RECOVERY PLAN ASSESSMENT ................................................................... I
DEDICATION ......................................................................................................................................II
ASSESSMENT COMMITTEE.......................................................................................................... III
TABLE OF CONTENTS ................................................................................................................... IV
TABLE OF TABLES ........................................................................................................................XII
TABLE OF RECOMMENDATIONS............................................................................................ XIII
ACKNOWLEDGEMENTS ............................................................................................................ XIV
BULLETED ABSTRACT OF FINDINGS AND RECOMMENDATIONS .............................. XVI
EXECUTIVE SUMMARY ............................................................................................................XVII
1. INTRODUCTION ............................................................................................................................ 1
1.1 Charge of the Desert Tortoise Recovery Plan Assessment Committee .................................................1
1.2 Desert Tortoise Recovery Plan Assessment Committee Members ........................................................2
1.3 Scientific Evaluation of the Recovery Plan ................................................................................................7 1.3.1 Recovery Prescriptions from the Recovery Plan ...................................................................................7 1.3.2 Topics Addressed in the Scientific Evaluation ......................................................................................9 1.3.3 Overview of Observations from the Assessment.................................................................................11
2. QUANTITATIVE LITERATURE REVIEW: THE STATE OF KNOWLEDGE..................... 16
2.1 Translocation ................................................................................................................................................19 Translocation Recommendations ....................................................................................................22
3. DISTINCT POPULATION SEGMENTS..................................................................................... 27
3.1 Definition and intentions of Distinct Population Segments...................................................................27 3.1.1 Background ............................................................................................................................................27 3.1.2 Discreteness............................................................................................................................................28 3.1.3 Significance............................................................................................................................................30
Direct Life-History Measures:...................................................................................................................32

DTRPAC Report page v
Ecological/Demographic Indicators:.........................................................................................................32 Possible Environmental Correlates: ..........................................................................................................32
3.1.4 Conservation Status ...............................................................................................................................32
3.2 DPSs of the Desert Tortoise........................................................................................................................33 3.2.1 Reappraisal of 1994 Recovery Units ....................................................................................................33 3.2.2 Provisional Revised List of DPSs.........................................................................................................36
DPS Recommendations ...................................................................................................................38
4. STATUS AND TRENDS............................................................................................................... 40
4.1 Recovery Plan Implementation .................................................................................................................40 Recovery Action Review and Implementation Recommendations: .............................................44
4.2 Trend Analyses of Populations ..................................................................................................................46 4.2.1 History of Long-Term Study Plots .......................................................................................................46 4.2.2 Trends Range-wide (East and West) ....................................................................................................51 4.2.3 Trend Analyses by Recovery Unit........................................................................................................52
Upper Virgin River Recovery Unit (and DPS) ........................................................................................54 Northeastern Mojave Recovery Unit ........................................................................................................55 Eastern Mojave Recovery Unit .................................................................................................................56 Northern Colorado Recovery Unit ............................................................................................................56 Eastern Colorado Recovery Unit...............................................................................................................57 Western Mojave Recovery Unit (and DPS) .............................................................................................58
4.2.4 Trend Analyses by Distinct Population Segment ................................................................................59 Lower Virgin River DPS ...........................................................................................................................59 Eastern Mojave and Colorado DPS...........................................................................................................60 Northeastern Mojave DPS .........................................................................................................................61
4.2.5 Summary of Trend Analyses.................................................................................................................61
4.3 Spatial Analyses............................................................................................................................................62 4.3.1 History of Desert Tortoise Transects ....................................................................................................63
Total Corrected Sign Transects .................................................................................................................63 Distance Sampling Transects ....................................................................................................................64
4.3.2 Observation Rates ..................................................................................................................................66 4.3.3 Presence/Failure to Detect.....................................................................................................................68 4.3.4 Conditional Probability of Live Encounter ..........................................................................................70
Resampling .................................................................................................................................................70 Logistic Regression ....................................................................................................................................71
4.3.5 Kernel Analyses .....................................................................................................................................73 4.3.6 Nearest Neighbor Clustering.................................................................................................................84
4.4 Implications of Population and Spatial Analyses....................................................................................86 Plot and Spatial Analysis Recommendations .................................................................................88
4.5 Status and Trends of Habitat and Environmental Setting for Tortoise Populations .......................89 4.5.1 Road Case Study ....................................................................................................................................89
Road Case-Study Recommendations ..............................................................................................91 4.5.2 Patterns of Precipitation Case Study................................................................................................97
Patterns of Precipitation Case Study Recommendations ...............................................................99 4.5.3 Disease Case Study...........................................................................................................................99
What is known and what is not known? ............................................................................................100 Risk from disease threats ....................................................................................................................103

DTRPAC Report page vi
Disease Case-Study Recommendations........................................................................................105
5. LINKING IMPACTS, HABITAT, AND DEMOGRAPHY TO RECOVERY ....................... 108
5.1 Cumulative, Interactive, and Synergistic Impacts of Multiple Threats ............................................109 5.1.1 Threats Network...................................................................................................................................112
Threats Recommendations.............................................................................................................119
6. MONITORING, EVALUATING, AND DELISTING.............................................................. 122
6.1 Strategies of Desert Tortoise Monitoring ...............................................................................................123 6.1.1 Historical Background for Desert Tortoise Monitoring ....................................................................123 6.1.2 Scope and Purpose of Modern Monitoring ........................................................................................124 6.1.2 Categories of Monitoring ....................................................................................................................126
6.2 Monitoring Desert Tortoises ....................................................................................................................128 6.2.1 Monitoring Desert Tortoise Populations ............................................................................................128
Long-Term Study Plots............................................................................................................................129 Distance Transect Sampling ....................................................................................................................130
6.2.2 Monitoring Individual Desert Tortoises .............................................................................................134 Condition indices......................................................................................................................................134 Behavior....................................................................................................................................................134
Behavior of Embryos and Neonates...................................................................................................136 Behavior of Juveniles..........................................................................................................................136 Behavior of Adults ..............................................................................................................................137
6.3 Habitat monitoring ....................................................................................................................................138 Monitoring Recommendations ......................................................................................................138
6.4 Delisting Criteria........................................................................................................................................142 Criterion 1 .................................................................................................................................................142 Criterion 2 .................................................................................................................................................142 Criterion 3 .................................................................................................................................................142 Criterion 4 .................................................................................................................................................142 Criterion 5 .................................................................................................................................................142
7. INTEGRATING RESEARCH AND MANAGEMENT............................................................ 146
7.1 Synopsis of Recommendations.................................................................................................................146 7.1.1 Research and Monitoring ....................................................................................................................146
• Re-evaluating the status of DPSs and the positioning of DWMAs....................................................146 • Improve population sampling methods ................................................................................................146 • Develop tools .........................................................................................................................................147 • Improve the focus on the recovery goal ...............................................................................................147 • Improve information gathering .............................................................................................................148 • Improving information dissemination ..................................................................................................148 • Improve the utility of monitoring efforts .............................................................................................149 • Improve the focus on recovery goals....................................................................................................149 • Develop research agendas .....................................................................................................................149 • Employing “outside” expertise .............................................................................................................150 • Improve information dissemination/access..........................................................................................150
7.1.3 Data Management ................................................................................................................................150

DTRPAC Report page vii
• Improve information dissemination/access..........................................................................................150 • Re-evaluate the status of DPSs and the positioning of DWMAs .......................................................150 • Improve the focus on the recovery goal ...............................................................................................150
7.2 Adaptive Management ..............................................................................................................................151 7.2.1 Ingredients of Inventory, Monitoring, and Research.........................................................................151 7.2.2 Relationships among Inventory, Monitoring, Research, and Adaptive Management.....................153 7.2.3 Definitions ............................................................................................................................................153 7.2.4 Inventory ..............................................................................................................................................154 7.2.5 Monitoring............................................................................................................................................154 7.2.6 Research ...............................................................................................................................................156 7.2.7 Adaptive Management Decision Making...........................................................................................156 7.2.8 The Circle of Status and Trends and of Monitoring ..........................................................................157
7.3 Cooperation and Coordination ................................................................................................................157 7.3.1 Desert Tortoise Recovery Office ........................................................................................................160 7.3.2 Science Advisory Committee..............................................................................................................160
7.4 Data Management ......................................................................................................................................163 7.4.1 Distribution of Monitoring Resources ................................................................................................163 7.4.2 Data Management Plan........................................................................................................................164 7.4.3 Types and Sources of Errors ...............................................................................................................164 7.4.4 Errors Detection and Correction .........................................................................................................166
APPENDIX A. DTRPAC RESPONSES TO COMMENTS ......................................................... 168
APPENDIX B. DTRPAC MEETING MINUTES.......................................................................... 177
LITERATURE CITED ..................................................................................................................... 237

DTRPAC Report page viii
Table of Figures
Fig. 2.1 Distribution of all literature types before and after the publication of the Recovery Plan. .............17
Fig. 2.2 Distribution of literature among the major research categories........................................................17
Fig. 2.3 Distribution of professional journal literature in the research categories before and after the publication of the Recovery Plan. The proportion of Recovery Plan prescriptions associated with each major research topic are included for comparison with the distribution of professional journal literature.18
Fig. 2.4. Percent of early life stage documents in professional journals that focused on ecology and autecology.............................................................................................................................................................19
Fig. 3.1. Depiction of recovery units proposed in the 1994 Recovery Plan. Green outlines within the recovery units are proposed DWMAs. ................................................................................................................34
Fig. 3.2. Ratio of rainfall in winter compared to summer in the Mojave Desert. Weather stations, and the longitudes for those stations, are given in the table. .........................................................................................35
Fig. 3.3 Map of the proposed distinct population segments for desert tortoise. .............................................37
Fig. 4.1 Relative number of threats to desert tortoises in each critical habitat unit (i.e., DWMA), as identified by the Recovery Plan in 1994. ............................................................................................................40
Fig. 4.2 Relative number of threats to desert tortoises in each critical habitat unit (i.e., DWMA), as identified by the Desert Tortoise Management Oversight Group in 2003. ......................................................41
Fig. 4.3 Relative numbers of management actions recommended for each DWMA in the 1994 Recovery Plan. ......................................................................................................................................................................42
Fig. 4.4 Relative numbers of management actions by DWMA reported to the USFWS that have been at least partially implemented by 2002. ..................................................................................................................43
Fig. 4.5 Locations of desert tortoise permanent study plots within the federally listed range of desert tortoises in the southwestern United States. .......................................................................................................47
Fig. 4.6 Trends in relative population densities for desert tortoises in the eastern and western permanent study plot sites. .....................................................................................................................................................52
Fig. 4.7 Active (green tortoise symbols) and discontinued (orange triangles) permanent study plots grouped within the 1994 Recovery Units............................................................................................................54
Fig. 4.8 Plot of adult densities over time for the City Creek permanent study plot located within the Upper Virgin River Recovery Unit. Error bars are 95% confidence intervals for the density estimate. ..................55
Fig. 4.9 Plot of adult densities over time for the study plots located within the Northeastern Mojave Recovery Unit. Error bars are 95% confidence intervals for the density estimate. ........................................55

DTRPAC Report page ix
Fig. 4.10 Plot of adult densities over time for the study plots located within the Eastern Mojave Recovery Unit. Error bars are 95% confidence intervals for the density estimate..........................................................56
Fig 4.11 Plot of adult densities over time for the PSPs located within the Northern Colorado Recovery Unit. Error bars are 95% confidence intervals for the density estimate..........................................................57
Fig. 4.12 Plot of adult densities over time for the PSPs located within the Eastern Colorado Recovery Unit. Error bars are 95% confidence intervals for the density estimate. ..................................................................57
Fig. 4.13 Plot of adult densities over time for the permanent study plots located within the Western Mojave Recovery Unit. Error bars are 95% confidence intervals for the density estimate. ........................................58
Fig. 4.14 Active (green tortoise symbols) and discontinued (orange triangles) study plots grouped by Distinct Population Segment. ..............................................................................................................................59
Fig. 4.15 Plot of adult densities over time for the Lower Virgin River Distinct Population Segment. Error bars are 95% confidence intervals for the density estimate. .............................................................................60
Fig. 4.16 Plot of adult densities over time for the Eastern Mojave and Colorado Distinct Population Segment. Error bars are 95% confidence intervals for the density estimate. ..................................................60
Fig. 4.17 Plot of adult densities over time for the Northeastern Mojave Distinct Population Segment. Error bars are 95% confidence intervals for the density estimate. .............................................................................61
Fig. 4.18 The ratio of carcasses to live tortoises for DWMAs..........................................................................67
Fig. 4.19 Presence/”Failure to Detect” tortoises and carcasses for combined distance sampling (2001-2003) and total corrected sign (1998, 1999, and 2001) transects. Dark green areas are those in which a tortoise and/or scat were present. Light green areas are those in which a tortoise and/or scat and carcasses were present. Red areas indicate only carcasses were present. White areas indicate no tortoises, scat, or carcasses were found. Light tan areas indicate no distance sampling or total corrected sign transects were conducted. .............................................................................................................................................................69
Fig. 4.20 Results from the resampling analysis - Areas depicted in red are points in bins 6 and 12, which had lower than average probabilities of live encounters; green points are bins 7 and 16, which had higher proportions of live animals. Points in all other bins are blue in color.............................................................71
Fig. 4.21 Results from the logistic regression analysis. Cooler colors indicate higher probabilities of encountering a live tortoise, and warmer colors indicate a lower probability................................................73
Fig. 4.22 Kernel analysis for the Upper Virgin River DWMA. The 95% kernel for live animals is indicated by the green polygon; the 95% kernel for carcasses is indicated by the red outlined polygon. Transects that were sampled for which no tortoises (live or dead) were found are indicated by the letter X on the map. ...75
Fig. 4.23 Kernel analysis for the Beaver Dam Slope / Mormon Mesa / Gold Butte-Pakoon DWMAs. The 95% kernel for live animals is indicated by the green polygon; the 95% kernel for carcasses is indicated by the red outlined polygon. Transects that were sampled for which no tortoises (live or dead) were found are indicated by the letter X on the map. ..................................................................................................................76
Fig. 4.24 Kernel analysis for the Coyote Springs Valley DWMA. The 95% kernel for live animals is indicated by the green polygon; the 95% kernel for carcasses is indicated by the red outlined polygon.

DTRPAC Report page x
Transects that were sampled for which no tortoises (live or dead) were found are indicated by the letter X on the map. ...........................................................................................................................................................77
Fig. 4.25 Kernel analysis for the Piute-Eldorado Valley DWMA. The 95% kernel for live animals is indicated by the green polygon; the 95% kernel for carcasses is indicated by the red outlined polygon. Transects that were sampled for which no tortoises (live or dead) were found are indicated by the letter X on the map. ...........................................................................................................................................................78
Fig. 4.26 Kernel analysis for the Chuckwalla DWMA. The 95% kernel for live animals is indicated by the green polygon; the 95% kernel for carcasses is indicated by the red outlined polygon. Transects that were sampled for which no tortoises (live or dead) were found are indicated by the letter X on the map. ............79
Fig. 4.27 Kernel analysis for the Pinto Mountain and Joshua Tree DWMAs. The 95% kernel for live animals is indicated by the green polygon; the 95% kernel for carcasses is indicated by the red outlined polygon. Transects that were sampled for which no tortoises (live or dead) were found are indicated by the letter X on the map. ..............................................................................................................................................80
Fig. 4.28 Kernel analysis for the Chemehuevi DWMA The 95% kernel for live animals is indicated by the green polygon; the 95% kernel for carcasses is indicated by the red outlined polygon. Transects that were sampled for which no tortoises (live or dead) were found are indicated by the letter X on the map. ............81
Fig. 4.29 Kernel analysis for the Ivanpah DWMA. The 95% kernel for live animals is indicated by the green polygon; the 95% kernel for carcasses is indicated by the red outlined polygon. Transects that were sampled for which no tortoises (live or dead) were found are indicated by the letter X on the map. ............82
Fig. 4.30 Kernel analyses for Fremont-Kramer / Superior-Cronese, and Ord-Rodman DWMAs. The 95% kernel for live animals is indicated by the green polygon; the 95% kernel for carcasses is indicated by the red outlined polygon. Transects that were sampled for which no tortoises (live or dead) were found are indicated by the letter X on the map. ..................................................................................................................83
Fig. 4.31 Nearest Neighbour Hierarchical Cluster analysis for the Western Mojave. Green areas are clusters of living tortoises; red outlines are clusters of carcasses. ..................................................................85
Fig. 4.32 Routes in the Western Mojave DWMAs in 1985-87. Blue routes were designated as open, brown as either closed, limited, undetermined, or non-route. Large roadless areas such as southwest Ord-Rodman, and the most southwestern portion of Fremont-Kramer were not without roads in 1985-87, but were instead not inventoried. On the other hand, the DTNA was designated by the BLM as an Area of Critical Environmental Concern and fenced in the late 1970’s, thus creating a roadless area.....................92
Fig. 4.33 Routes in the Western Mojave DWMAs in 2001. Orange routes were designated as open, brown as either closed, limited, or non-BLM owned routes. The most southwestern portion of Fremont-Kramer remains un-inventoried as does portions of northern Fremont-Kramer, excluding the DTNA. .....................93
Fig. 4.35 Comparison of 1985-87 and 2001 designated open BLM routes. The red routes represent 2001 routes not formally designated as open in 1985-87. The lack of designation as open in 1985-87 could be a result of the fact that the route was inventoried in 1985-87 but not designated as open, not inventoried in 1985-87 but existing, or not existing in 1985-87. ..............................................................................................95
Fig. 4.36 Comparison of 2001 and 1985-87 designated open BLM routes. The blue routes represent 1985-87 routes not formally designated as open in 2001. The lack of designation as open in 2001 could be the result of the fact that the route was inventoried in 2001 but not designated as open, not inventoried in 2001 but existing, or not existing in 2001. ...................................................................................................................96

DTRPAC Report page xi
Fig. 4.37 Seasonal rainfall in the Mojave Desert, 1930-2000..........................................................................98
Fig. 5.1 Network of threats demonstrating the interconnectedness between multiple human activities that interact to prevent recovery of tortoise populations. Tier 1 includes the major land use patterns that facilitate various activities (Tier 2) that impact tortoise populations through a suite of mortality factors (Tier 3). ...............................................................................................................................................................113
Fig. 5.2 A section from the Threats Network from Fig. 5.1 that shows how multiple land uses and human activities provide food subsidies to predators on tortoises, thereby increasing mortality. ...........................115
Fig. 5.3 A section from the threats network from Fig. 5.1 showing just the primary activities associated with utility corridors. The causes of tortoise mortality associated with physical structures are also shown. .............................................................................................................................................................................117
Fig. 5.4 A subsection of the Threats Network shown in Fig. 5.1 that illustrates the mortality factors directly associated with unpaved roads used for maintenance of utilities...................................................................118
Fig. 5.5 A much more complex web showing the interconnectedness among many activities associated with utilities and their impacts on tortoise populations...........................................................................................119
Fig. 6.1 Idealized population trends before recovery planning implemented, as a result of implementing recovery planning, and after delisting. .............................................................................................................123
Fig. 6.2 Dimensions of elements important to recovery, and therefore, needing monitoring. .....................125
Fig. 6.3 Kernel analysis of presence data for living desert tortoises (green polygons) and carcasses (red outlines. ...............................................................................................................................................................128
Fig.6.4 Simulated population growth at a 2% growth rate with (a) a 10% coefficient of variation around the trend and (b) a 40% coefficient of variation around the same trend. ......................................................129
Fig. 6.5 Tortoise activity measured over a three year period at Bird Spring Valley, NV. Tortoise activity is expressed as the proportion of animals active for each hour during each week of the year and ranges from 0 to 1. The gray areas represent times for which tortoise activity was not sampled. Warmer colors indicate high proportions of animals active, and cooler colors indicate fewer animals active. .................................132
Fig. 7.1 Relationships among the desired objectives of a recovery program, a conceptual model of the functional relationships among species, and monitoring activities in the adaptive management................155
Fig. 7.2 Relationships among factors contributing to disease important to demography of the desert tortoise. ...............................................................................................................................................................159
Fig. 7.3 Relationships among offices, teams, committees, etc. functioning to produce strategies for recovery and implementation of the listed species. .........................................................................................................162
Fig. 7.4 Kinds of activities associated with monitoring. .................................................................................163
DTRPAC Report page xii
Table of Tables
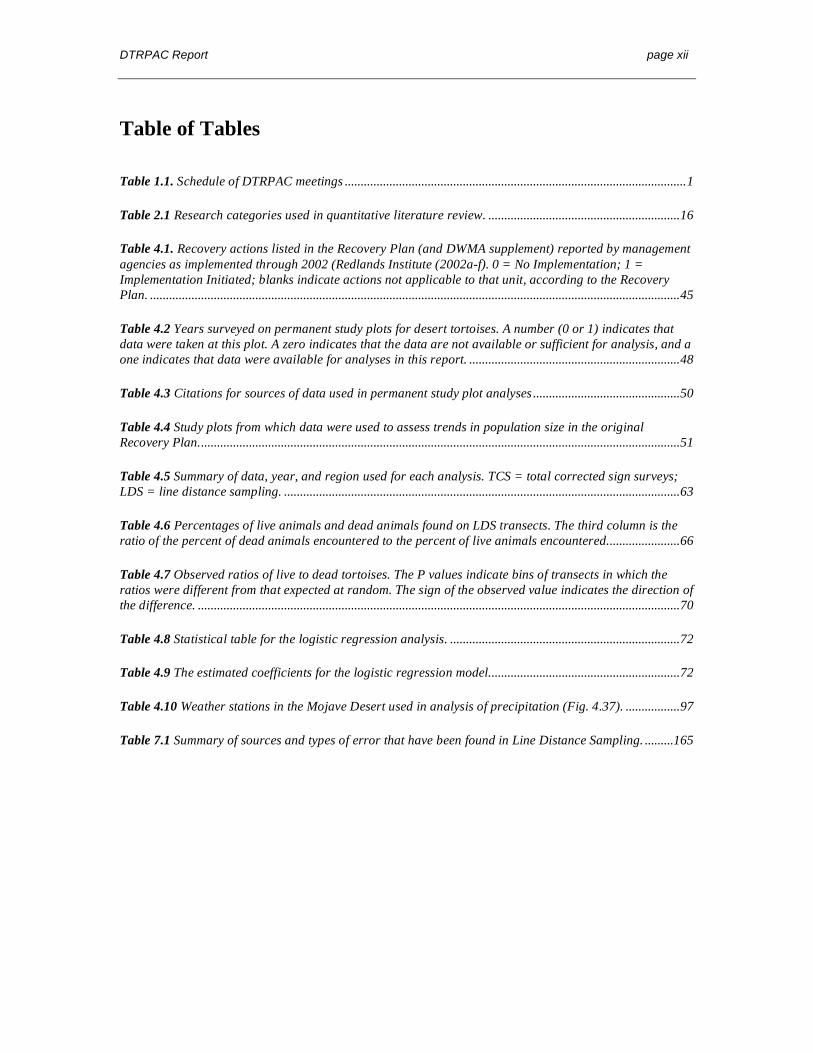
Table 1.1. Schedule of DTRPAC meetings ...........................................................................................................1
Table 2.1 Research categories used in quantitative literature review. ............................................................16
Table 4.1. Recovery actions listed in the Recovery Plan (and DWMA supplement) reported by management agencies as implemented through 2002 (Redlands Institute (2002a-f). 0 = No Implementation; 1 = Implementation Initiated; blanks indicate actions not applicable to that unit, according to the Recovery Plan. ......................................................................................................................................................................45
Table 4.2 Years surveyed on permanent study plots for desert tortoises. A number (0 or 1) indicates that data were taken at this plot. A zero indicates that the data are not available or sufficient for analysis, and a one indicates that data were available for analyses in this report. ..................................................................48
Table 4.3 Citations for sources of data used in permanent study plot analyses ..............................................50
Table 4.4 Study plots from which data were used to assess trends in population size in the original Recovery Plan.......................................................................................................................................................51
Table 4.5 Summary of data, year, and region used for each analysis. TCS = total corrected sign surveys; LDS = line distance sampling. ............................................................................................................................63
Table 4.6 Percentages of live animals and dead animals found on LDS transects. The third column is the ratio of the percent of dead animals encountered to the percent of live animals encountered.......................66
Table 4.7 Observed ratios of live to dead tortoises. The P values indicate bins of transects in which the ratios were different from that expected at random. The sign of the observed value indicates the direction of the difference. .......................................................................................................................................................70
Table 4.8 Statistical table for the logistic regression analysis. ........................................................................72
Table 4.9 The estimated coefficients for the logistic regression model............................................................72
Table 4.10 Weather stations in the Mojave Desert used in analysis of precipitation (Fig. 4.37). .................97
Table 7.1 Summary of sources and types of error that have been found in Line Distance Sampling. .........165

DTRPAC Report page xiii
Table of Recommendations
Bulleted Abstract of Findings and Recommendations xv
Recommendations on Translocations 23
Recommendations on Distinct Population Segments 38
Recommendations for Recovery Action Review and Implementation 44
Recommendations on Study Plot and Spatial Analyses Techniques 88
Recommendations from Road Case Study 91
Recommendations from Precipitation Case Study 99
Recommendations from Disease Case Study 105
Recommendations for Dealing with Threats 119
Recommendations on Monitoring 138
Considerations for Delisting Criteria 143
Synopsis of Overall Recommendations 146

DTRPAC Report page xiv
Acknowledgements
We would like to thank U.S. Fish and Wildlife Service staff, which assertively provided an interface between the DTRPAC and the public during the process leading to this report. The Biological Resources Research Center at the University of Nevada, Reno provided most of the logistic support for the process of creating this report. The University of Redlands, the Redlands Institute, and Lisa Benvenuti helped in producing maps. The Western Ecological Research Center of The U.S. Geological Service provided some financial and staff support. The Arizona Heritage Fund and a State Wildlife Grant (USFWS) supported Roy Averill-Murray as a member of DTRPAC. U.S. Fish and Wildlife Service provided funds for this project.

DTRPAC Report page xv
Preface
This report of the assessment of the Desert Tortoise Recovery Plan of 1994 is the result of more than a year of work by a committee who spent many hours conducting analyses and writing the report. A thorough understanding of the assessment process and products requires reading the entire report. Appendix B contains the minutes of all working meetings of the committee. This appendix allows a general tracking of the discussions and the process by which the report was assembled. For those who wish only to read the recommendations resulting from the report, there are three sources of recommendations. There is a one-page bulleted list of the general recommendations on page xv. The Executive Summary on page xvi presents an abstract of the report. All recommendations associated with each chapter of the report can be located by using the Table of Recommendations on page xii.

DTRPAC Report page xvi
Bulleted Abstract of Findings and Recommendations
• The Recovery Plan of 1994 was fundamentally sound, but some modifications for contemporary management will likely make recovery more successful.
• Complex meta analyses of tortoise distributions and abundances indicate trends leading away from recovery goals in some parts of the species range. These results indicate a need for more aggressive initiatives to facilitate recovery.
• A USFWS Desert Tortoise Recovery Office (DTRO) should be established to facilitate and coordinate recovery efforts based upon an adaptive-management approach with advice from a Science Advisory Committee (SAC).
• Many of the original prescriptions of the Recovery Plan were never implemented. These prescriptions continue to be appropriate and they should be implemented. However, synergistic, interacting, and cumulative threats, not appreciated by the original Recovery Team, also must be addressed and new prescriptions should be prioritized from analyses of analyses of “threats network topologies” assembled by the DTRPAC to assess redundancies and synergies within individual threats.
• Recovery planning should reflect distinctness of population segments within the species range. The genetic distinctness of tortoise populations and of their pathogens must be assessed to guide all manipulative management (e.g., head starting, translocation, habitat restoration, corridor management, etc.). A newly proposed (by the DTRPAC) delineation of DPSs should be revised with new scientific information.
• Status and trends of populations/metapopulations within DPSs are potentially impossible based only upon assessment of tortoise density because assessing density of populations for rare and cryptic species is exceedingly difficult (and potentially impossible). Thus, monitoring the efficacy of management actions should be based upon a comprehensive assessment of the status and trends of threats and habitats as well as population numbers.
• A new definition of recovery is needed as assessing recovery defined in terms of a population that is demonstrably increasing or remaining stable may not be possible. The new definition should be based upon achievable assessment of progress toward recovery as assessed in the status and trends of threats, habitats, and population distribution and abundance.
• The original paradigm of desert tortoises being recovered in large populations relieved of intense threats may be flawed as tortoises may have evolved to depend upon metapopulation dynamics. Assessing the appropriateness of the metapopulation paradigm is very important as management under this paradigm could require more intense actions (including head starting, genetics management, habitat management and facilitated dispersal, herd immunization, and other artificially facilitated ecosystem processes).

DTRPAC Report page xvii
EXECUTIVE SUMMARY
The Desert Tortoise Recovery Plan Assessment Committee (DTRPAC) was appointed by the U.S. Fish and Wildlife Service (USFWS) in 2003 and charged with carrying out a scientific assessment of the Desert Tortoise Recovery Plan published in 1994. The assessment committee consisted of credentialed academic and agency scientists with expertise in ecology, tortoise biology, conservation biology, geography and GIS technologies, scientific ethics and philosophy of science, the Endangered Species Act of 1973 as amended and the implementation of that law, and desert natural history. Additionally, the assessment committee solicited input from nationally recognized scientists to provide expert advice and opinion in highly technical areas central to tortoise recovery including tortoise epidemiology, remote sensing, and multi-scale population monitoring.
The resultant assessment reviews the Recovery Plan in the context of scientific and analytical advances made since the Recovery Plan was published in 1994. The primary goal of this assessment is to provide a critical scientific evaluation of the Recovery Plan prior to any renewal or revision of the plan. The assessment produced by DTRPAC is not a Recovery Plan, and it does not seek to make social, legal, or political decisions on desert tortoise recovery. Rather, the assessment is a scientific evaluation of the current state of scientific knowledge regarding tortoise recovery, and the assessment reveals directions, via analytical examples, towards the scientific knowledge necessary to achieve desert tortoise recovery. The committee explicitly demonstrates how recent analytical advances can be applied to desert tortoise recovery by carrying out original and rigorous analyses of existing data. Not only are these analyses meant to provide a detailed scientific perspective for a possible future recovery plan panel to consider, the examples also demonstrate the power of analyses now available for tortoise recovery when appropriate data exist and the true loss in potential information incurred when tortoise data acquisition is poorly planned or only intermittently carried out.
The DTRPAC found that original Recovery Plan was fundamentally strong but could benefit substantially from modification. Modifications center on the following areas: (1) recognition of new patterns of diversity within the Mojave desert tortoise population, (2) explicit implementation of original Recovery Plan prescriptions, (3) greater appreciation of the implications of multiple, simultaneous threats facing tortoise populations, and (4) applying recent advances in analytical techniques to desert tortoise recovery.
Much of the inability to implement the original Recovery Plan owes to the lack of coordinated, range-wide tracking and reporting of management implementation. The DTRPAC recommends that a much more aggressive coordination and facilitation effort should become the responsibility of the USFWS. A Desert Tortoise Recovery Office (DTRO) should be established in the USFWS to implement the needed oversight, tracking, and reporting of new information about the efficacy of management actions and the methods by which that efficacy is assessed. This office should empanel a Science

DTRPAC Report page xviii
Advisory Committee (SAC - including members from academia and USGS) to serve in an advisory role to the DTRO.
Research and management efforts can and should be integrated to increase the likelihood of tortoise recovery. It appears that many opportunities to accumulate scientifically rigorous data to examine tortoise and habitat trends, as well as to explore mechanisms underlying tortoise population dynamics, have been missed. Recovery depends upon a substantially greater understanding of tortoise behavior, genetics, disease transmission, and demography, and the DTRO should facilitate increased scientific understanding in these areas by increasing research activity outlined in the original Recovery Plan and here, and working to improve cooperation between managers and research scientists. Scientists need to emphasize research that will address urgent management needs and their efforts will benefit from consulting with managers on their “on-the-ground knowledge” of tortoise populations. Managers can contribute to recovery by collaborating and consulting with researchers on data acquisition, storage, and access. Additionally, sophisticated data oversight and management as well as independent expertise in data acquisition design and statistical analysis are essential to the process leading to desert tortoise recovery.
The recovery prescriptions of the original Recovery Plan were only partially implemented and, as implemented, the Recovery Plan neither appears to be leading to desert tortoise recovery, nor is it likely to do so. In particular, explicit recommendations for research designed to provide rigorous data essential to understanding desert tortoise demography and population dynamics were not carried out. The failure to implement research recommendations means that the understanding of desert tortoise demography and population dynamics has advanced very little. The call for rigorous data was an essential part of the adaptive management approach at the core of the original Recovery Plan. In adaptive management, management actions are modified based upon incoming data that assesses whether or not current management actions are working. Establishing an aggressive DTRO will help us avoid missing more opportunities to facilitate recovery.
Desert tortoises face an array of threats, which act simultaneously and synergistically. The far-reaching implications of this concept were not fully appreciated in the original Recovery Plan. Multiple, simultaneous threats are particularly insidious to formulating recovery actions because it is possible that potential gains made in tortoise numbers through one action can be lost when potentially “saved” tortoises perish or fail to reproduce due to a different threat not alleviated by the management action. The synergism of multiple threats refers to the biological fact that effects from one threat can be magnified when the threat co-occurs with another threat. The original Recovery Plan does not fully appreciate that threats to tortoises can act in this non-additive way.
Due to the natural progression of science, the original Recovery Plan does not incorporate technological and analytical techniques now available. The DTRPAC reviewed the scientific literature, sought to acquire recent data in the “gray” literature (agency reports, etc.), and applied a suite of analytical techniques to existing desert tortoise data. These

DTRPAC Report page xix
analyses were meant to yield new insights into desert tortoise biology and recovery, to provide examples of approaches that a new recovery plan could employ, and also to underscore the true need for, and benefit of, rigorous and scientific data that directly address issues underlying desert tortoise recovery.
The assessment presents a modified set of desert tortoise Distinct Population Segments (DPS) relative to the original Recovery Plan. The new DPS delineations reflect the committee’s review and interpretation of recent desert tortoise and conservation biology literature. The DTRPAC delineations reflect the prevailing concepts of subpopulation “discreteness, “ and “significance,” and incorporate morphological, behavioral, genetic, and environmental information. The DTRPAC suggestion reduces the number DPSs from six to five by leaving the original Upper Virgin River and Western Mojave units intact and recombining the four central units into three reconfigured units.
The assessment provides a highly detailed meta-analysis of desert tortoise population status and trends. The DTRPAC found the data on status and population trends often to be statistically unwieldy due to inconsistencies in data collection, suboptimal data collection design, and the truly daunting task of measuring animals that are difficult to detect and that occupy a harsh environment. Because much of the data currently available to address tortoise recovery was originally collected for purposes other than tortoise recovery, the DTRPAC analyses are meta-analyses using data of mixed quality. To adjust for very low statistical power in current data sets, DTRPAC used transect sampling carried out by various agencies and managers to derive tortoise occurrence data, then used spatial analysis of tortoise occurrence to map tortoise status and possible trends. Results are complex, but resulting maps suggest that in many areas tortoise populations appear be facing continued difficulty. Spatial analyses did not indicate zones of recovery. Kernel analyses of transect data – limited to only one year due to lack of additional sufficient data – identified several regions that may have experienced significant local die-offs. Statisticians consulting with DTRPAC derived an original analysis called “Conditional Probability of Being Alive” that spatially illustrated regions of low, intermediate, and high probability of encountering live tortoises during surveys. These analyses identified large regions within historic desert tortoise habitat as being associated with having a low probability of detecting live tortoises during surveys. In other words, probably few tortoises occur in these areas currently. The West Mojave recovery unit stood out within overall tortoise range as unambiguously experiencing continued population decline.
The DTRPAC also performed spatial analyses of habitat and other geographic trends with special emphasis on potential impacts of roads and disease: two issues of historic importance in desert tortoise recovery. GPS technology and renewed survey effort indicate that more roads currently are documented in the western Mojave zone of tortoise decline than were documented in 1987. Some portion of the increase in roads probably represents legal or illegal road creation from 1987-2001. Some portion probably represents new documentation of previously existing roads. The relationship between road type and road density to tortoise decline needs to be clarified. Expert consultation

DTRPAC Report page xx
with wildlife disease epidemiologists and emerging evidence from tortoise studies indicate that the relationship between ELISA-positive assays of live tortoises, Mycoplasma infection, and tortoise decline is not a simple and easily predicted relationship. Disease experts sought out by the DTRPAC described a growing awareness that the probability of infection leading to death in tortoises may be a function of chronic stress (e.g., malnutrition) and the strain of infectious agent. This means that the presence of disease alone is not sufficient to explain tortoise die-offs. For example, it is possible that habitat degradation results in physiologically stressed tortoises that then succumb to disease agents that are normal at background levels in healthy populations. The relationships between disease, physiological status, and tortoise death are scientifically tractable, but they have not been rigorously addressed.
The assessment presents a threats network topology. This network illustrates the profoundly daunting array of threats facing the desert tortoise and should discourage a future recovery team, if it is necessary to form one, from viewing threats in overly simplistic way. A substantial body of evidence indicates that tortoises face a complex suite of threats. It is naïve to propose a recovery action that addresses a single threat and then anticipates straightforward additive increases in tortoises as a response to the management action.
It is also clear that effective desert tortoise monitoring and the creation of an effective restoration strategy will entail a new and greater level of cooperation and coordination among managers and scientists. Currently, no group is charged with managing scientific data on the desert tortoise, and data often are collected and reported in ways that make them difficult to use in conjunction with other data. Currently, important desert tortoise data are widely scattered among state and federal agencies and the scientific community. Data have been gathered, “organized”, and stored in a multitude of ways. Some data have been organized and other still exists in raw, unanalyzed states. Accessibility of data for managers, scientists, and the public is highly variable. In short, a great deal of important long-term data cannot be used readily. Organizing and “mining” currently existing desert tortoise data could be highly productive and helpful. Establishing a DTRO would help focus attention towards learning from existing data and promoting new scientific initiatives.
The current definition of desert tortoise recovery requires populations within recovery units to be stable or increasing for at least 25 years (one tortoise generation). To demonstrate recovery based on population stability, scientists must be able to distinguish among populations that are truly stable as opposed to populations that superficially appear to be stable because monitoring data are not sufficiently rigorous to detect declines when in fact declines are occurring. A new multi-dimensional monitoring strategy may be the most effective approach for redefining and verifying recovery. The monitoring approach presented in the assessment refers to three tiers of monitoring. Tiers 1 and 2 perform status and trend monitoring by using repeated measures taken over time (tier 1) and inferential statistics applied across broad geographical areas (tier 2). These are designed to meet current management objectives and also to monitor changes over

DTRPAC Report page xxi
long time periods. Tier 3 is research monitoring designed to detect or to verify mechanistic links between actions and tortoise responses. Both population and habitat monitoring will require multi-scale approaches to achieve information needed for adaptive management and assessment of recovery.
It is no longer clear that the original population paradigm upon which definitions of recovery were based is correct. Existing data do not exclude the possibility that tortoise populations evolved to be distributed in metapopulations instead of single, large populations. The dynamics of metapopulations, and the conservation prescriptions for metapopulations are entirely different from single, large populations. Thus, the original Recovery Plan prescribed establishing large wildlife management areas and reducing threats within those areas. For metapopulations, it may be additionally necessary to protect corridors among habitat patches, and to recognize that natural metapopulation dynamics require areas suitable for desert tortoises, but periodically vacant of tortoises. Thus, new data and analyses are needed immediately to determine the biological basis for defining recovery in light of the possibility that unforeseen ecosystem processes need to be protected as part of recovery.

DTRPAC Report page xxii
“Science can only state what is, not what should be.”
Albert Einstein, Out of My Later Years. (1950)

DTRPAC Report page 1
1. Introduction
The original Desert Tortoise Recovery Team recognized the importance of including new data and analyses for recovery efforts as they become available. Indeed, the Recovery Team called for the Recovery Plan to be reassessed every three to five years to ensure that recommendations to management were made with the best available scientific information (USFWS 1994, p. 37). Since the Recovery Plan's publication in 1994, there have been no overt efforts to revise the Recovery Plan in light of new information pertinent to desert tortoise recovery, despite the fact that there has been new research on many aspects of desert tortoise ecology, threats, conservation biology, and monitoring, as well as public challenges to the validity of the Plan.
1.1 Charge of the Desert Tortoise Recovery Plan Assessment Committee
The U.S. Fish and Wildlife Service (USFWS) initiated a two-step process to revise the 1994 Desert Tortoise Recovery Plan. Step 1 is a review and assessment of new research and information gathered on many aspects of desert tortoise ecology, threats, conservation biology, monitoring, and recovery actions. Step 2 will be the revision of the Recovery Plan by a newly established recovery team of scientists, agency resource specialists, and stakeholders, if a future recovery team is necessary.
Following is a description of Step 1 of the process that has been initiated by the Desert Tortoise Recovery Plan Assessment Committee (DTRPAC). The charge of the DTRPAC is to review the entire Recovery Plan in relation to contemporary knowledge and, based on that review, prepare recommendations about which parts of the Recovery Plan need updating. Under this charge, the DTRPAC was to assemble and review all new literature pertinent to the Recovery Plan, to hold meetings to conduct an in-depth review of selected topics (disease, monitoring, etc.), and submit a final report to the USFWS. A schedule of DTRPAC meetings, including focal topics for each meeting is shown in Table 1.1. The minutes from each meeting are contained in Appendix B.
TABLE 1.1. Schedule of DTRPAC meetings
Topic Dates Location Orientation and Agenda 11 April 2003 San Francisco, CA Distinct Population Segments and Threats
15-16 May 2003 Palm Springs, CA
Disease Workshop Debrief, Disease, Status of Threats
9-10 June 2003 San Francisco, CA
Status of Populations, Demography, Finalize Threats
31 July – 1 August 2003 Truckee, CA
Monitoring and Delisting Criteria
4-5 September 2003 Monterey, CA

DTRPAC Report page 2
Habitat Conservation Planning, Research
2-3 October 2003 Tucson, AZ
Review and Report Preparation
6-7 November 2003 Las Vegas, NV
Report Preparation 26-27 February 2004 Reno, NV Report Preparation 22-23 April 2004 Carlsbad, CA Address Public Comments 26-27 May 2004 Reno, NV Finalize Report 14-15 June 2004 Reno, NV
1.2 Desert Tortoise Recovery Plan Assessment Committee Members
The DTRPAC was purposely assembled with scientists and experts diverse in terms of State representation, institutions of employment, gender, and scientific expertise. Some members were chosen who are not doing research on the desert tortoise. The committee was assembled with representatives with the following characteristics:
1. expertise and experience with the desert tortoise and/or ecosystems containing desert tortoises,
2. expertise and experience in conservation biology and other areas important to the DTRP evaluation process,
3. ability to serve as “internal peer-reviewers” (i.e., scientists serving as general science analysts whose job it will be to keep tortoise scientists from becoming myopic while focusing on new data, analyses, and opinions for the desert tortoise),
4. academic and agency scientists, 5. representation of the original Recovery Team, 6. broad representation from the geographic range of the listed species.
The committee included the following members:
C. Richard Tracy (Ph.D.), [Chair of the Committee] Professor of Biology and Director of the Biological Resources Research Center, University of Nevada, Reno, NV Dr. Tracy is the former Director of the Ecology, Evolution, and Conservation Biology Graduate Program at the University of Nevada, Reno. He currently serves as the science advisor for the Clark County Desert Conservation Program in Nevada. He earned his B.A. and M.S. from California State University, Northridge and his Ph.D. from the University of Wisconsin. He has served on faculties at Colorado State University, the University of Wisconsin, the University of Washington, the University of Puerto Rico, Pepperdine University, the University of Nebraska, and the University of Michigan. He has been honored as a Guggenheim Fellow, as a Distinguished Scholar at Pepperdine University, and as a Fellow of the Association of Western Universities. He also has received an American Society of Zoologists Service Award, a Desert Tortoise Council Conservation Award, a Service Award from the U.S. Fish and Wildlife Service, and he has served in leadership roles in the Ecological Society of America and the American Society of Zoologists. Dr. Tracy is

DTRPAC Report page 3
an ecologist who has published more than 140 articles and book chapters on a wide range of topics in ecology, population biology, physiology, biophysics, and natural history of animals (mostly amphibians and reptiles), and whose studies have included research on herbivorous reptiles since 1977, and on desert tortoises since 1988. He was a member of the original Desert Tortoise Recovery Team, and he is a member of the Houston Toad Recovery Team. He has served as major professor for 37 masters and Ph.D. students, and he has directed theses, dissertations, and postdoctoral research of several graduate students and postdoctoral scholars who have studied the desert tortoise.
Roy C. Averill-Murray (M.S.), Amphibians and Reptiles Program Manager, Arizona Game and Fish Department, Phoenix, AZ
Mr. Averill-Murray earned his B.S. in Wildlife and Fisheries Sciences (cum laude) from Texas A&M University in 1990. In 1993 he earned his M.S. in Wildlife and Fisheries Science from the University of Arizona, where he completed his thesis on estimating density and abundance of desert tortoises in the Sonoran Desert. He began working for the Arizona Game and Fish Department in 1995 as the Nongame Branch's Desert Tortoise Coordinator. As Desert Tortoise Coordinator, he directed the state's population monitoring program; conducted research on desert tortoise ecology, especially reproduction; and co-chaired the Arizona Interagency Desert Tortoise Team. He has published 8 peer-reviewed scientific papers on desert tortoises, including 3 chapters in the new book The Sonoran Desert Tortoise: Natural History, Biology, and Conservation. He assumed the duties of Amphibians and Reptiles Program Manager in 2002, and he is responsible for the management of all amphibians and reptiles in Arizona. He is also co-chair of Partners in Amphibian and Reptile Conservation's Southwest Regional Working Group.
William I. Boarman (Ph.D.), Research Wildlife Biologist, U.S. Geological Survey, Western Ecological Research Center, San Diego, CA
Dr. Boarman received his Ph.D. in ecology from Rutgers University. He has worked for the Department of Interior for 13 years studying the ecology, behavior, and management of the desert tortoise and common raven. His desert tortoise research focuses on the impacts of roads on desert tortoise populations and the effectiveness of barrier fences and culverts at recovering desert tortoise populations. The association between raven ecology and anthropogenic resources to develop means to reduce raven predation on juvenile tortoises is the aim of his work with ravens. He has written a comprehensive evaluation of the state-of-the-art of our knowledge of threats to desert tortoise populations. He is also involved in research on the Salton Sea ecosystem, prairie falcon ecology, and marbled murrelet conservation. He has published 25 papers in peer-reviewed scientific journals.
Dave J. Delehanty (Ph.D.), Assistant Professor of Biology, Idaho State University, Pocatello, ID Dr. Delehanty received his Ph.D. from the Ecology, Evolution, and Conservation Biology Program at the University of Nevada, Reno in 1997. He has taught

DTRPAC Report page 4
Conservation Biology at UNR and ISU, and he is well known for his innovative approach to this important subject. He has studied mechanisms underlying behavior and the physiological importance of dietary carotenoid pigments on steroid-mediated physiological events involved with sexual maturation, sexual behavior, and reproductive performance in vertebrates. Importantly, he seeks to develop an improved understanding of animal behaviors integral to the success of conservation actions. He is implementing Nevada restoration programs for mountain quail and Columbian sharp-tailed grouse, two native species extirpated from all or part of their historic ranges. This includes developing new restoration techniques that account for behavioral and life history constraints. He is a critical thinker whose prowess in ecology, conservation biology, genetics, statistical analyses, research design, as well as species repatriation makes him an excellent member for the DTRPAC.
Jill S. Heaton (Ph.D.), Assistant Professor of Geography, University of Nevada, Reno, NV
Dr. Heaton was previously an assistant professor in Environmental Studies at the University of Redlands. She was Principal Investigator for the Redlands Institute (RI) Desert Tortoise Project (DTP). The RI and DTP are comprised of numerous research analysts, ecologists, GIS analysts, programmers, and systems analysts, among other positions. She and her DTP research team are building a desert tortoise decision support system. This system uses a scientific knowledge base linked to geospatial data within an application framework allowing users to evaluate decision and management options as well as identify knowledge and data gaps, thus clarifying research priorities. She is an arid lands ecologist, with degrees in biology and geography. She earned her B.S. and M.S. in Biology from the University of North Texas, in 1993 and 1996, respectively. Dr. Heaton earned her Ph.D. in Physical Geography from Oregon State University in 2001. Her research career has been spent in the arid southwest working with mammals in the Chihuahuan Desert and reptiles in the Mojave. She is experienced in applying quantitative and statistical techniques to ecological problems, and integrating ecological theory and principles with the spatial and temporal complexity of the natural environment. She has experience and expertise in habitat modeling, statistical modeling, environmental issues on military installations, urban and development biodiversity boundary interactions, and issues relating to land use and conservation. She is trained in GIS applications, primarily the suite of ESRI GIS products, remote sensing and image analysis, and traditional statistical and geo-statistical analyses. She has extensive fieldwork experience and strives to spend a quarter of her time in the field conducting research.
Jeffrey E. Lovich (Ph.D.), Chief, Grand Canyon Monitoring and Research Center, U.S. Geological Survey, Flagstaff, AZ Dr. Lovich is the former Director of the U.S. Geological Survey, Western Ecological Research Center. Headquartered in Sacramento, California, the Center employs a staff of over 100 employees, located at 14 duty stations in California and Nevada. He started his federal career in 1979 at the National Museum of Natural History/Smithsonian Institution in the Division of Amphibians and Reptiles while still

DTRPAC Report page 5
an undergraduate student at George Mason University. After finishing his B.S. in Biology, he stayed on at George Mason, earning an M.S. in Biology. From there, he went to the University of Georgia, obtaining a Ph.D. in Ecology in 1990. Most of his tenure at the University of Georgia was spent at the Savannah River Ecology Laboratory, a research facility of the University of Georgia in South Carolina. After a brief Post Doctoral fellowship at the Savannah River Ecology Laboratory, he went to work for the Bureau of Land Management, first as a staff biologist at the California Desert District Office in Riverside, then as the Lead Wildlife Biologist in Palm Springs. As a charter member of the National Biological Survey (now Biological Resources Division of USGS), he conducted research on desert tortoises and desert ecology in southern California. His research on turtles and tortoises spans almost 25 years. During that time he published over 60 scientific papers, most on the ecology and evolution of North American and Asian freshwater turtles. He discovered and formally described three of the world's 280 or so turtle species, including two in the United States and one in Japan. In addition he published two books. He is co-author of the book "Turtles of the United States and Canada" published by the Smithsonian Institution Press in 1994, and co-editor of, and contributor to, the book "Biological Diversity: Problems and Challenges" published by the Pennsylvania Academy of Science the same year.
Earl D. McCoy (Ph.D.), Professor of Biology, University of South Florida, Tampa, FL Dr. McCoy earned a B.S. in Biology at Florida State University in 1970, a M.S. in Biology at the University of Miami in 1973, and a Ph. D. in Biology at Florida State University in 1977. He has published over 100 peer-reviewed publications, many of which focus on the ecology and conservation biology of gopher tortoises. He has also published extensively on the philosophy of science and the basis of experimental design in ecology, including the book Method in Ecology: Strategies for Conservation Problems. He is currently on the editorial board for three journals, including Ecology and Ecological Monographs. He has been at the University of South Florida since 1977. He has been the associate Chairman for the Department of Biology since 1992. He has also been a Visiting Assistant Professor at the University of Virginia on several occasions. He has mentored three postdoctoral students, 10 Ph.D. students, and 27 masters students. He is currently the primary investigator or a collaborator on several research projects, including a large multi-disciplinary project examining the field epidemiology of the Upper Respiratory Tract Disease in the gopher tortoise.
David J. Morafka (Ph.D.), [deceased] Research Associate, Department of Herpetology, California Academy of Sciences, San Francisco, CA
Dr. Morafka was the Lyle E. Gibson Emeritus Professor of Biology, CSU, Dominguez Hills. He earned his B.S. in Biology (with honors) at the University of California at Berkeley in 1967, and a Ph. D. at the University of Southern California in 1974. He was a member of the original Desert Tortoise Recovery Team and a member of the IUCN Freshwater Turtle and Tortoise Conservation Group. He had more than 50 publications and one book on North American desert reptiles and their conservation. He was the principal investigator on neonatology and hatchery nursery

DTRPAC Report page 6
studies of the desert tortoise at Ft. Irwin and Edwards Air Force Base, and of the endangered Bolson tortoise in Mexico.
Ken E. Nussear (Ph.D.), Research Ecologist, U.S. Geological Survey, Western Ecological Research Center, Las Vegas Field Station, Las Vegas, NV Dr. Nussear is a recent graduate from the Ecology, Evolution, and Conservation Biology Program at the University of Nevada, Reno. He received his B.S. in Zoology (summa cum laude) from Colorado State University. He has published several peer-reviewed publications on the physiology of desert reptiles. He has worked on many research projects involving desert tortoises since 1995. His research has focused on conservation biology, nutritional ecology, and physiological ecology of desert tortoises. These research projects included a multi-site, multi-state translocation project designed to examine the efficacy of translocation as a conservation tool for desert tortoises. The study looked within and beyond the geographic range of desert tortoises and gives insights into the habitat requirements of this species. His work is being used to develop management strategies for desert tortoises in the face of the fastest growing human populations in the country. He had a pre-doctoral fellowship from the University of Redlands to continue his research. This research involves applied biophysical-ecology studies of tortoises to enhance our understanding of tortoise activity and how this impacts monitoring efforts. This work will help to refine desert tortoise monitoring efforts throughout the range of the listed population.
Bridgette E. Hagerty, Ph.D. Student, University of Nevada, Reno (DTRPAC manager) Ms. Hagerty is a current doctoral student in the Ecology, Evolution, and Conservation Biology Program at the University of Nevada, Reno. She earned her B.A. in Biology (magna cum laude) from St. Mary’s College of Maryland in 2000. Prior to beginning her graduate studies, she was an Environmental Management Fellow with the Chesapeake Research Consortium and staffed committees at the EPA Chesapeake Bay Program. Her research focuses on the use of indirect methods to quantify movement among desert tortoise populations in the Mojave Desert. The results of her genetics research will be used to help make decisions concerning distinct populations segments of the desert tortoise.
Phil A. Medica (M.S.), Biologist, U.S. Geological Survey, Western Regional Research Center, Las Vegas Field Station, (USFWS liaison representative)
Mr. Medica is a Wildlife Biologist with the U.S. Geological Survey, Western Ecological Research Center, at the Las Vegas Integrated Science Office. He received his B.S. in Wildlife Management (Game Management) and his M.S. in Biology (Herpetology) from New Mexico State University in 1964 and 1966, respectively. He has worked on reptiles and small mammals throughout the southwestern U.S. for the past 40 years. He began his career working at the Nevada Test Site (NTS) in 1966 as a field technician for Brigham Young University, Department of Zoology, and was subsequently employed as a Staff Research Associate by UCLA, Laboratory of Nuclear Medicine and Radiation Biology from 1967-1981. While with UCLA at

DTRPAC Report page 7
NTS, he studied the effects of gamma irradiation upon natural populations of animals and plants at the Rock Valley facility, documented sterility among the lizard inhabitants, and conducted lizard demographic and reproductive studies. He developed and implemented environmental research studies on natural populations of lizards and small mammals in conjunction with drought upon the ecosystem as well as disturbances, i.e., roads, fire, grading, cratering, and irradiation. From 1992-1993, he served as an Ecologist with the Bureau of Land Management, Las Vegas District Office, and was transferred to the National Biological Survey in 1993. As a Research Wildlife Biologist with the National Biological Survey, subsequently USGS/Biological Resources Division (1993-2000), he conducted extensive field studies pertaining to desert tortoise translocation, reproduction, and survivorship. Most recently, he served as the Mojave Desert Tortoise Coordinator for the U.S. Fish and Wildlife Service (2000-2004), initiating rangewide population monitoring using the Line Distance Sampling technique. He has authored or co-authored 70 reports, scientific papers, and peer reviewed journal articles pertaining to the ecology of desert reptiles and small mammals of the southwestern United States.
1.3 Scientific Evaluation of the Recovery Plan
1.3.1 Recovery Prescriptions from the Recovery Plan
The passage in the following text box is taken directly from the Recovery Plan of 1994. This passage expresses the core of what needs to be compared with current management and knowledge. The comparison we present in this document is meant to be a scientific evaluation of the Recovery Plan in relation to contemporary knowledge of (a) the biology of the desert tortoise and (b) the extent to which the Recovery Plan was implemented.

i. Develop monitoring planii. Implement monitoring plan
DTRPAC Report page 8
“The desert tortoise was listed as threatened primarily because of a variety of human impacts that cumulatively have resulted in widespread and severe desert tortoise population decline and habitat loss. The destruction, degradation, and fragmentation of desert tortoise habitat and loss of individual desert tortoises from human contact, predation, and disease are all important factors in the decline of the Mojave population. If the desert tortoise is to be recovered within its native range, the causes of the decline must stop, at least within the DWMAs. Some factors are likely more important than others; for instance, urbanization has probably caused more habitat loss than light cattle grazing. However, eliminating all factors that are deleterious to desert tortoise populations will certainly result in faster recovery than will selective elimination of a few.
Accomplishing the prescribed recovery actions is needed to reduce or eliminate human-caused impacts in the recovery units and to implement the recovery strategy described in the Recovery Plan.
1. Establish DWMAs and implement management plans for each of the six recovery units
a. Select DWMAs
b. Delineate DWMA boundaries i. Reserves that are well-distributed across a species' native range will be more
successful in preventing extinction than reserves confined to small portions of a species' range.
ii. Large blocks of habitat, containing large populations of the target species, are superior to small blocks of habitat containing small populations.
iii. Blocks of habitat that are close together are better than blocks far apart. iv. Habitat that occurs in less fragmented, contiguous blocks is preferable to
habitat that is fragmented. v. Habitat patches that minimize edge to area ratios are superior to those that
do not. vi. Interconnected blocks of habitat are better than isolated blocks, and
linkages function better when the habitat within them is represented by protected, preferred habitat for the target species.
vii. Blocks of habitat that are roadless or otherwise inaccessible to humans are better than blocks containing roads and habitat blocks easily accessible to humans.
c. Secure habitat within DWMAs.
d. Develop reserve-level management within DWMAs. e. Implement reserve-level management within DWMAs. f. Monitor desert tortoise populations within recovery units.

DTRPAC Report page 9
2. Establish environmental education programs. a. Develop environmental education programs. b. Implement environmental education programs.
3. Initiate research necessary to monitor and guide recovery efforts. a. Obtain baseline data on desert tortoise densities both inside and outside of
DWMAs.
b. Develop a comprehensive model of desert tortoise demography throughout the Mojave region and within each DWMA. i. Initiate epidemiological studies of URTD and other diseases. ii. Research sources of mortality, and their representation of the total
mortality, including human, natural predation, diminishment of required resources, etc.
iii. Research recruitment and survivorship of younger age classes. vi. Research population structure, including the spatial scale of both genetic
and demographic processes and the extent to which DWMAs and recovery units conform to natural population subdivisions.
c. Conduct appropriately designed, long-term research on the impacts of grazing, road density, barriers, human-use levels, restoration, augmentation, and translocation on desert tortoise population dynamics.
d. Assess the effectiveness of protective measures (e.g., DWMAs) in reducing anthropogenic causes of adult desert tortoise mortality and increasing recruitment.
e. Collect data on spatial variability of climate and productivity of vegetation throughout the Mojave region and correlate this information with population parameters (e.g., maximum sustainable population size, see Appendix G).
f. Conduct long-term research on the nutritional and physiological ecology of various age-size classes of desert tortoises throughout the Mojave region.
g. Conduct research on reproductive behavior and physiology, focusing on requisites for successful reproduction.”
1.3.2 Topics Addressed in the Scientific Evaluation
The DTRPAC reviewed the Recovery Plan to determine which parts required modification based on new knowledge. As a result of this review, the topics listed in Table 1.1 were addressed. To conduct the topic reviews most efficaciously, the committee invited outside experts to help conduct the reviews. This effectively expanded the panel of experts to very large numbers and provided the expertise needed to conduct

DTRPAC Report page 10
an extremely thorough review of the Recovery Plan. The expertise brought to bear on the topics represented the highest level of scientific expertise available. The panel included:
• Elliott Jacobson, DVM, Tortoise disease • Mary Brown, Ph.D., Mycoplasma • David Rostal, Ph.D., Tortoise reproduction • David Thawley, Ph.D., Veterinary epidemiology • Kristin Berry, Ph.D., Desert tortoise biology • Barry Noon, Ph.D., Conservation biology of endangered species • Michael Reed, Ph.D., Conservation biology, population modeling • Jim Sedinger, Ph.D., Population biology • Chuck Peterson, Ph.D., Herpetology, reptile ecology • Mary Cablk, Ph.D., Remote sensing • Ron Marlow, Ph.D., Conservation planning • Ann McLuckie, M.S., Conservation planning • Ray Bransfield, M.S., Conservation planning • Bryan Manly, Ph.D., Statistics (consultant for user groups) • Lyman MacDonald, Ph.D., Statistics (consultant for user groups)
USFWS also invited diverse stakeholders to send representatives as observers to the DTRPAC meetings. Some of those representatives contributed substantively to discussions or report preparation and review. Representatives and observers included:
• Clarence Everly, Consultant for the Department of Defense • John Hamill, Department of Interior and Desert Managers Group • Rebecca Jones, California Department of Fish and Game • Ron Marlow, Ph.D., Clark County Habitat Conservation Plan • Ann McLuckie, Utah Division of Wildlife Resources • Karen Phillips, U.S. Geological Survey • Lewis Wallenmeyer, Clark County Habitat Conservation Plan • John Willoughby, Bureau of Land Management
After completion of the scientific evaluation, the DTRPAC focused on the following major topics for the report.
1. Distinct Population Segments (DPS) in relation to the Recovery Units designated by the original Recovery Team. Recovering the Mojave population of desert tortoise in all its diversity (genetic, ecological, behavioral) in relation to conservation challenges is basic to a recovery plan. The concept of distinct population segments was mentioned in the original Recovery Plan, but the distinct population segments were referred to as recovery units. The original Recovery Plan suggested that genetic resolution of those recovery units was necessary. Research has been conducted since the original Recovery Plan, so this area certainly needs revisiting by the DTRPAC.
2. Knowledge advances since the listing of the desert tortoise occurred in the following areas: (a) populations and demography, (b) impacts to habitats, (c)

DTRPAC Report page 11
literature, and (d) recovery plan implementation. Ten years have passed since the original Recovery Plan, so new research and conservation planning needed to be reviewed to assess whether new knowledge naturally leads to old conservation prescriptions or whether new knowledge requires new directions in conservation and management prescriptions.
3. Linking impacts, habitat, and demography to recovery (Specific threats and their mitigations with special attention to impacts resulting from interactions among individual threats; the relationships among threats and the importance of disease) The original Recovery Plan attempted to list specific threats and link those threats to specific places. For 10 years, the identified threats have been the subject of much debate and planning. Insofar as some evidence has been that some populations are still declining, it was clear that threats needed reevaluation.
4. Monitoring, evaluating, and delisting. Monitoring provides the information necessary to adapt management. Nevertheless, monitoring has been elusive and contentious. The ability to monitor rare and cryptic species has always been difficult, and new approaches to monitoring have been suggested since the original Recovery Plan.
5. Integrating research needs and management. Numerous research needs were published in the original Recovery Plan. Some of those needs have been pursued vigorously and others neglected. This area needed updating and evaluation in light of years of experience.
It is important to note that this summary is intended to serve as a “strategic” review of the current Plan. Although, we have conducted several new analyses of existing data to understand current status better or to illustrate various points, this report primarily provides recommendations for consideration in revising and more effectively implementing the Plan.
1.3.3 Overview of Observations from the Assessment
What follows in this report are evaluations of the original Recovery Plan in light of contemporary knowledge. Immediately below, we make eight general observations that bear on difficulties of implementing the original Recovery Plan or of lack of attempt to implement the original Recovery Plan. The remainder of the report is a more detailed summary of conclusions from this committee.
The desert tortoise invokes three fundamental challenges in understanding its biology and managing its recovery: time scale, detectability, and metapopulation structure.
Time Scale – Desert tortoise recovery is fundamentally a demographic problem. Diminished populations require some period of population growth (average lambda > 1.0) to recover. Populations that are stable and secure may fluctuate in size in response to local, prevailing conditions, meaning that population growth rate (lambda) will vary around an overall stable mean (lambda = 1.0). However, desert

DTRPAC Report page 12
tortoise natural history is not well suited to demographic analysis using short-term study. Individual tortoises grow slowly, take many years to reach sexual maturity, and have low reproductive rates during a long period of reproductive potential. This means that studies of 1-10 years, or even longer, do not necessarily yield data of sufficient statistical power to reveal population trends.
Detectability – Desert tortoise behavior and morphology make them very difficult to detect and observe. Other than in the Upper Virgin River Recovery Unit, where tortoise population densities have been high, the personnel and resources necessary to overcome the problem of low detectability have not been appropriate to allow precise estimates of population size of desert tortoise within the Mojave Desert. If desert tortoise density declines in the Upper Virgin River, even this recovery unit may ultimately suffer from problems of low detectability.
Population paradigm – The original paradigm about how tortoise populations are organized, and the prescriptions made within that paradigm might be wrong and dangerously misleading. Existing data are consistent with the possibility that tortoises have evolved to exist in metapopulations. The original Recovery Plan and the original paradigm conceived desert tortoises to be distributed in large populations that required large areas and large densities to recover. Metapopulation theory, on the other hand, conceives that tortoises are distributed in metapopulation patches connected with corridors that allow inefficient and asynchronous movements of individuals among the patches. This paradigm conceives that some habitat patches within tortoise range will have low population numbers or no tortoises at all, and others will have higher population numbers. Movement among the patches is necessary for persistence of the “system.” If desert tortoises evolved to exist in metapopulations, then long-term persistence requires addressing habitat fragmentation caused by highways and satellite urbanization. Indeed, mitigating abrogations of natural corridors among habitat patches might require active management of tortoise densities in habitat patches.
Desert tortoises face simultaneous, multiple threats. Tortoises face an array of threats and these threats act simultaneously. This concept is central to recovery, because it portends profound difficulties in formulating effective recovery actions. In particular, a management action that alleviates one threat may not yield meaningful recovery, because the deleterious effects of another threat operating simultaneously suppress the gains sought by the original management action. In other words, one threat can negatively compensate for another threat when threats are simultaneous.
Threats to desert tortoises are interactive and synergistic. The magnitude of the deleterious effects of one threat can be a function of another threat. For example, if increased mortality reduces the lifetime fecundity of a female tortoise by removing that female from the population before she reaches her period of maximum annual fecundity, then deleterious factors to other life stages (e.g., raven predation on neonatal tortoises) may have a greater effect on tortoise demography. Why? The negative effect on neonates by raven predation, for example, now affects a larger proportion of neonates in the population, because new neonates are not produced when adults are killed. Also, disease

DTRPAC Report page 13
may only be an important contributor to population declines during years of drought or to populations stressed by invasion of exotic plants or by off-road vehicles or any number of other stresses. In other words, threats to tortoise populations are complex, because the threats interact to cause impacts rather than creating impacts just directly.
Recommendations made in the original Recovery Plan for carefully controlled experiments to generate data and analyses important to monitoring and recovery have not been implemented. The original Recovery Plan recommended a suite of experimental approaches which, if carried out, could have provided key data and analyses needed for understanding tortoise population dynamics, especially relevant to management effectiveness, important in guiding current recovery. Many of these recommendations appear to have been largely ignored. Unfortunately, ten years of opportunity to collect critical data and perform critical analyses have been diminished or lost for a variety of reasons.
Much of the data currently available to address tortoise recovery was originally collected for purposes other than tortoise recovery (hence we are doing meta-analyses using data of mixed quality to perform analyses that would be more efficacious using data from well designed studies). Perhaps for historical reasons, certain tortoise studies have been carried out more-or-less continuously. For example, permanent study plots have been used to study demography and biology of tortoises in non-random sites. Various forms of distance sampling have been carried out at mixed levels of magnitude and intensity. A more efficient approach for the future might be to design studies using statistical and scientific expertise expressly to obtain key data to address central problems.
Mapping of even poorly collected data reveals very important apparent patterns. Technological advances since the first Recovery Plan have resulted in powerful analytical tools that bear directly on analyzing and monitoring desert tortoise populations. In particular, GIS analyses of data diligently derived from large, disparate data sets that were collected by various agencies are yielding intriguing patterns. “Mining” historical data and applying powerful new analyses or applying older analyses in new ways will be helpful in prescribing recovery actions. As demonstration of the substantial value of this approach, we present several new analyses from existing data. These include (i) a kernel analysis of spatial distribution of live and dead tortoises, (ii) a cluster analysis of spatial distribution of live and dead tortoises, (iii) a spatial analysis of the probability of finding live versus dead tortoises, (iv) a multi-dimensional, multi-scale approach to monitoring, (v) a threats network topology, (vi) a quantitative literature review of all available tortoise literature, (vii) a weighted analysis of variance (ANOVA) of tortoise density from permanent study plots across 24 years, and (ix) a spatial analysis of the implementation of recovery actions from the first Recovery Plan.
No group is charged with managing scientific data on the desert tortoise. Currently, important desert tortoise data are widely scattered among state and federal agencies and the scientific community. Data have been gathered, organized, and stored in a multitude of ways. Some data have been reviewed, collated, or otherwise organized. Other data

DTRPAC Report page 14
have not. Accessibility of tortoise data to managers, scientists, and the public is highly variable. In short, a great deal of important long-term data cannot be readily used. This is an ineffective data management strategy for species recovery. A new infrastructure for ensuring quality, accessibility, and analyses of data is desperately needed. These observations apply equally well to information on and status of recovery action implementation.
Scientific information important for recovery is entirely ad hoc. In general, new knowledge acquisition seems frequently to be directed at land-management agency mandates vis-à-vis management decisions. Thus, the limited supply of tortoise biologists is frequently absorbed into contracts for local issues (e.g., DOD needs for data to comply with NEPA). However, there is a real need to pursue the research agenda outlined in the Recovery Plan of 1994. Some HCPs have scientific oversight and direction, but there is essentially no coordination of the scientific enterprise conducted in different management units in a way to get more than accidental accumulation of necessary knowledge important for recovery of the desert tortoise and its ecosystems.

DTRPAC Report page 15
“Scientif ic principles and laws do not l ie on the surface of nature. They are hidden, and must be wrested from nature by an active and elaborate technique of inquiry.”
John Dewey, Reconstruction in Philosophy. (1920)

DTRPAC Report page 16
2. Quantitative Literature Review: the state of knowledge
The most recent annotated bibliography (Grover and DeFalco 1995) published on desert tortoises (Gopherus agassizii) identified trends in research prior to 1991 and mentioned gaps in knowledge that influenced research prescriptions in the Desert Tortoise Recovery Plan (1994). The original Recovery Team made several recommendations for research necessary to fill information gaps important to the recovery of desert tortoise populations. These items included:
• long-term demography (particularly recruitment and survivorship of younger age classes, sources of mortality, and epidemiology),
• population structure (spatial scale of genetics and demography), • long-term analysis of impacts, • effectiveness of protective measures, • spatial variation in climate and vegetation, • nutritional and physiological ecology, • reproductive behavior and physiology, and • restoration, augmentation, and translocation.
The Recovery Plan highlighted the need for long-term studies, which are necessary to capture temporal variation and ecologically relevant trends. In addition, the Recovery Plan prescribed research on non-reproductive age classes. Few studies have been conducted on survivorship or recruitment rates in young Gopherus tortoises due to their cryptic morphology and behavior.
A recent literature review employed a quantitative approach to 1) compare the foci of research before and after the publication of the Recovery Plan, and 2) identify present gaps in desert tortoise knowledge (Hagerty, Sandmeier, and Tracy in prep.). Available desert tortoise literature, obtained by the Clark County Multi-Species Habitat Conservation Plan database (1378 total papers), was classified by age class, literature type, and one or more research categories (Table 2.1). Contingency table analyses were performed to determine differences among the types of research before and after the Recovery Plan was published.
TABLE 2.1 Research categories used in quantitative literature review.
Research Category Relevant topics included in each category Ecology life history characteristics, demography, ecology Autecology physiology, behavior, morphology Conservation threats, management, effectiveness of conservation efforts Systematics molecular and morphological systematics Disease pathology, veterinary procedures, pharmacology History natural history, evolution, fossil record, paleoecology Bibliographies literature reviews and annotated bibliographies

,------------------------1
~........
.....
::J
0
r---
(/)
Cf--- r---
::J()
~
0r-
~I- f-
d11rlll~%<A
e,1lI ~ve, ~o'" ~oo;. ~oo;.Ill'?>Q....<? t:? r.:"-'?> «"vo vo
",Ill e,1lI 1-,.1lIc;~e, CP'" "?'v
DTRPAC Report page 17
Academic researchers and agency biologists studying desert tortoises communicate their results in professional journals, government documents, Desert Tortoise Council (DTC) symposia, and other professional society meetings. Overall, 22% of catalogued desert tortoise literature was published in professional journals. After the Recovery Plan, the percentage of literature published in professional journals increased, while the percentage of gray literature decreased (Fig. 2.1). The latter result may be an artifact of the availability of government reports, however there was an increased trend for researchers to publish their results in professional journals.
• DTC symposia60 . Gray
52.3 D Professional Journal 50
Fig. 2.1 Distribution of all literature types
0 40before and after the
Vl 31.9publication of the 31.0 cRecovery Plan. (]) 30 E U 0 19.0
16 .7
10
0 Pre Recovery Plan Post Recovery Plan
Further, professional journal documents were dominated by autecological research, while other documents contained mainly conservation and ecological studies (χ2 = 154.115, df = 6, p<0.0001) (Fig. 2.2). This result may suggest a dichotomy of research being done within agencies and academia, respectively. Tortoise conservation studies consisted mainly of descriptions of threats to tortoises and how these threats are being managed. Population density and habitat studies, which are typically performed by government agencies, are also included in the gray 50 literature category. • Other
40 D Professional journals -
Ql
E 30
0
20Fig. 2.2 Distribution of literature among the major research 10
categories. I I II0

.....
:J
III
l...:J
.....,
DTRPAC Report page 18
The Recovery Plan prescriptions for future research did appear to have a limited impact on desert tortoise research. After the Recovery Plan was published, more documents in professional journals focused on ecology and implementation of conservation, with a continued emphasis on autecology (χ2 = 25.88, df = 5, p<0.0001) (Fig. 2.3). A change in the distribution of gray literature corresponding to the publication of the Recovery Plan was marginally significant (χ2 = 13.49, df = 7, p<0.06).
60 • Pre recovery plan
50 • Recovery plan prescriptions
• Post recovery plan Ul 40 C (])
E 30 U o o
20 C
o 10
o
Fig. 2.3 Distribution of professional journal literature in the research categories before and after the publication of the Recovery Plan. The proportion of Recovery Plan prescriptions associated with each major research topic are included for comparison with the distribution of professional journal literature.
Since the Recovery Plan was published, there has been considerable research on some aspects of tortoise biology, in particular nutritional ecology, reproductive physiology, and the effects of several specific impacts on tortoise populations. However, very little research has been published on other recommended topics, such as long-term demography, the effectiveness of recovery actions, translocation (but see below), and climatic and vegetative variability. Virtually no research has been conducted or published on other important topics, such as epidemiology and many long-term impacts on tortoise populations. Some additional areas that have been the topic of active research yet were not identified in the Recovery Plan prescriptions, include disease and health status, habitat conditions, and fire ecology. In the case of disease, recent studies have focused on pathology instead of the focus on epidemiology that was prescribed by the Recovery Plan. These new areas of research are important and may need to be continued at some level, however not in place of the recovery plan recommendations.

DTRPAC Report page 19
Research prescriptions in the Recovery Plan also emphasized the need for research on immature age classes within the categories of ecology and autecology. In particular, the Recovery Plan recommended research on recruitment and survival rates of non-reproductive age classes and their nutritional and physiological ecology. After the Recovery Plan, an increase in the percentage of studies on immature age classes corresponded to general prescriptions in these areas, suggesting that the Recovery Plan prescriptions were followed (Fig. 2.4). However, no studies included in the analyses were conducted that focus specifically on recruitment and survival of young age classes. A quantifiable deficiency in knowledge of the ecology of non-reproductive tortoises remains a missing link to understanding desert tortoise population structure and dynamics. Literature on early life stages is under represented in all age-relevant categories, with only 5% of documents focusing exclusively on immature life stages.
Fig. 2.4. Percent of early life stage documents in professional journals that focused on ecology and autecology.
0
5
10
15
20
Ecology Autecology
Ear
ly li
fe s
tage
jour
nal d
ocum
ents
(%) Pre recovery plan
Post recovery plan
Implementation of effective management strategies to recover the Mojave population of the desert tortoise requires an accurate characterization of population structure, threats to population persistence, and the effectiveness of protective measures. Determining life history characteristics, such as age-specific survivorship, is critical and requires large sample sizes and long study periods. In addition, hypothesis-based experiments on the long-term effects of recovery actions are also necessary. These gaps in knowledge were identified in the Recovery Plan, have not been addressed, and remain important prescriptions for research.
2.1 Translocation
There were many topics for research recommended by the Recovery Plan that have been the subject of active research and publication over the last decade. Translocation of desert tortoises has recently come to the forefront because of the impending expansion of Ft. Irwin in the West Mojave and the continued urbanization of the Las Vegas Valley.

DTRPAC Report page 20
Because no peer reviewed papers on recent research on translocation of desert tortoises have been published yet on this topic, and at the request from several reviewers of the draft DTRPAC report, we include a brief synopsis of recent translocation studies here. Translocation was regarded by the Recovery Team as both a threat and as a potential conservation measure to mitigate take of tortoises, to augment depleted populations, and re-colonize extirpated populations (USFWS 1994).
Prior to the publication of the Recovery Plan, few studies of the effects of translocation on desert tortoises had been conducted, and no study was extensive enough to evaluate translocation as a conservation tool for this species. The results of previous efforts are generally reported in government documents (Berry 1974, Berry 1975, Berry 1976), as anecdotes (e.g., see Cook et al. 1978), or unpublished accounts (Crooker 1971, Bryan and West 1972, McCawley and Sheridan 1972, Cook et al. 1978, Corn 1991, SAIC 1993). Because of the dearth of literature on translocation of desert tortoise, the potential for success of translocation in this species had not previously been thoroughly examined, and as a result translocation as a tool for conservation has remained controversial (Berry 1986, Dodd and Seigel 1991, USFWS 1994). Nevertheless, the Recovery Plan recognized the potential of the technique for augmenting populations with tortoises taken outside of DWMAs, and the plan recommended that more thorough research on translocation be conducted.
The definition of success of translocating a species is typically taken to be the ability of the translocated or augmented population to become self-sustaining in the long-term (Griffith et al. 1989, Dodd and Seigel 1991, Fisher and Lindenmayer 2000). Success, however, may be measured at several temporal scales, which may be important precursors to judging the long-term success of a translocation program (Tasse 1989, Dickinson and Fa 2000, Fisher and Lindenmayer 2000). For example, there may be some level of initial mortality above which a translocation study is judged to be unsuccessful (Platenberg and Griffiths 1999). In addition, other goals may be used to judge success in the short-term, such as the colonization of a particular site (Lohoefener and Lohmeier 1986), the social integration of translocated animals into the existing population (Berry 1986, Reinert 1991), and the ability of the animals to find mates and reproduce (Berry 1986, Pedrono and Sarovy 2000).
Extensive translocation studies have been conducted in Nevada and Utah that quantified survivorship, growth, pre-release conditions, reproduction, microhabitat use, and movements (one index of behavior, which can be especially important to land-management decisions) of translocated and resident animals in six locations spanning elevations from 500 to 1500 meters (Field 1999, Field et al. 2003, Nussear 2004, Nussear et al. in prep.). These projects included tracking more than 300 tortoises (resident and translocated) for several years. Some tortoises were translocated to habitats with vegetation not normally associated with desert tortoise populations (in order to assess the mechanistic determinants of geographic range in tortoises). Some tortoises were translocated into areas cleared of any resident tortoises and some into areas containing populations with resident tortoises (to assess the effect of translocation both on the animals translocated and on the tortoises already present in the habitat). Some translocated tortoises were formerly pet tortoises

DTRPAC Report page 21
moved from urban settings to wild locations, and some tortoises were wild tortoises translocated from one wild location to another (to assess the potential to repatriate tortoises that had been removed from the wild for long periods prior to their release into the wild). Tortoises were translocated into the wild in three seasons of the year (in order to assess the extent to which season predicts success in translocation) (Field et al. 2003). Only tortoises certified as not having an immune response to Mycoplasma agassizii were translocated, and all areas studied had populations with resident tortoises having immune responses to Mycoplasma agassizii.
In general, translocated tortoises had the same survivorship and reproductive success as resident animals. This result was the same in drought years and in El Niño years. Tortoises moved to atypical habitat generally moved until they reached habitat more commonly associated with desert tortoise presence. Even when desert tortoises were translocated into typical tortoise habitat, they tended to move greater distances in the first year after translocation, but their movements in the second year were indistinguishable from resident tortoises. Knowing how translocated tortoises displace after translocation is necessary in order to plan for any needed fencing of managed areas, or to determine the size of translocation release areas. Important in any of these measures of success are comparisons between translocated and resident animals in the area. This allows the effect of translocation to be statistically separated from factors normally expected in resident populations in particular areas.
The results of these translocation studies indicate a very optimistic potential for success in translocating individual tortoises in a wide variety of circumstances. The mortality documented in previous translocation experiments on desert tortoises was largely because animals were translocated during the most stressful thermal environments of the year (e.g., when the weather is stressfully hot). The results of these recent studies suggest that both wild and pet tortoises can thrive and reproduce after translocation. These results also suggest that it is necessary to plan for translocated tortoises to move great distances in the first year after translocation. It is especially important to recognize that tortoises cannot be moved to unnatural habitats and expected that the tortoises will remain in those habitats (unless confined by fencing). Indeed, the fact that tortoises do not accept being translocated to atypical habitats suggests that some needs for the tortoises are only met in more typical habitat.
Knowing that it is possible to translocate tortoises successfully is important in conservation planning. Translocation should not be substituted for habitat protection as a conservation measure, but translocation can be important as a means to supplement existing populations that may have declined abnormally (e.g., in regions formerly heavily used by recreationists or by construction projects such as gas pipelines, etc.). Translocation can be used to create new populations in areas where populations are known to have existed in the historic past, however, creating new populations always should be regarded as experiments until the reasons why historic populations are absent are known and logic and science suggests that a new population can thrive in the area. Future translocations could be used as an experimental tool to assess the effects of certain

DTRPAC Report page 22
management prescriptions (e.g., fencing, ablation of cattle grazing, reducing the density of unpaved roads, etc.).
The remaining cautions, vis-à-vis translocation, are that the process of translocation may disrupt community interactions and that the impacts of those alterations might be difficult to predict. In other words, we know that individual and population responses to translocation are generally benign and suggest that translocation can be an effective tool in the conservation arsenal for a land manager, but we do not yet know all that is needed about community interactions potentially modified by translocation. Thus, translocating tortoises into an area containing, for example, a strain of pathogen that is foreign to the translocated tortoises may alter the balance between host-pathogen relationships in ways that might not be easily predictable and potentially dangerous. Thus, additional research is needed to increase our understanding of host-pathogen relationships and other community-level interactions (e.g., competition, predator-prey, pathogen, etc.) to support carefully considered translocation programs.
Translocation Recommendations
• Translocation should not be substituted for habitat protection as a conservation measure but rather as a last resort to mitigate the take of displaced animals.
• Translocation can be used to supplement or augment depleted populations, but all translocations should be conducted as an experiment with research to ensure that the threats originally causing the depletion have been removed.
• Translocation can be used as an experimental tool to assess the effects of certain management prescriptions, or to assess the presence of threats that affect the population.
• Translocated animals are likely to have large movements in the first two years. If tortoises are translocated near roads with high traffic volume, these roads should be fenced. In addition, if the goals of the translocation project are to retain animals in a relatively small area, then experimental fencing should be used for a few years as given in the translocation guidelines (Recovery Plan Appendix B).
There are seven guidelines for translocation given in the Recovery Plan (see appendix B). These guidelines, while well intentioned have little chance of all being applied simultaneously. The use of these guidelines requires the knowledge of measures that are currently unavailable, or have poor precision for desert tortoises such as historic densities and carrying capacity. We recommend that these guidelines be revisited in light of recent information on translocation in desert tortoises, and in light of the consideration of realistic management constraints and conditions where translocations are likely to occur.

DTRPAC Report page 23
A summary of each guideline with commentary on its applicability is given below.
Guideline 1 “Experimental translocations should be done outside experimental management zones. No desert tortoises should be introduced into DWMAs—at least until relocation is much better understood.”
• Unless experimental management zones, or other areas within DWMAs can be used for translocation, translocated tortoises cannot be assured protection into the future. This is particularly important when long-term conservation of translocated populations comes into conflict with changes to the environment by humans such as urbanization or flood control projects.
Guideline 2 “All translocations should occur in good habitat where the desert tortoise population is known to be substantially depleted from its former level of abundance. Translocation of reproductively competent adults into depopulated areas can have beneficial effects on population growth. Before population growth can occur, however, individuals must establish home ranges and enter into any existing social structure. Desert tortoises should be periodically evaluated against a defined health profile (proportional weight/size, fecal scans, and blood panels).”
• These criteria have two possible limitations. First it tacitly assumes an explicit knowledge of the former abundance of animals (this is usually unavailable for most of the listed range of the tortoise). Second, if this guideline is strictly followed, then tortoises displaced from an area could be translocated to areas where tortoises could have different population composition.
Guideline 3 “Areas into which desert tortoises are to be relocated should be surrounded by a desert tortoise-proof fence or similar barrier. The fence will contain the desert tortoises while they are establishing home ranges and a social structure. If the area is not fenced, past experience suggests that most animals will simply wander away from the introduction site and eventually die. (Fencing is not cheap; estimates range from $2.50 to $5.00 per linear foot). Once animals are established some or all of the fencing can be removed and probably reused.”
• The final sentence of this guideline has not been scientifically evaluated. The goals of each proposed translocation should be considered individually. If one of the goals of a translocation program is to populate a specific area, then fencing the area may be desirable (but should be tested scientifically). If however the goal is to move tortoises to a non-specific area, such as a large valley, then fencing may be impractical, and un-necessary.
Guideline 4 “The best translocations into empty habitat involve desert tortoises in all age classes, in the proportions in which they occur in a stable population. Such translocations may not always be possible, since young desert tortoises are chronically underrepresented in samples, often due to observer sampling error, and may now actually be underrepresented in most populations due to poor recruitment and juvenile survivorship

DTRPAC Report page 24
during the last several years. Desert tortoises smaller than the 7-year age-size class are particularly vulnerable to predation and may be a poor investment for translocation, unless predator exclusion (fencing, for example) is incorporated into such endeavors. Mature females would probably be the best sex/age class to introduce into below carrying capacity extant populations because of their high reproductive value (low potential mortality, high potential fecundity for many years).”
• This guideline seems to provide different recommendations. First it recommends that the best case would be to translocate all size classes, but it also suggests that juveniles may be a poor investment. Fencing of translocated tortoises is recommended as a protection from predation but this has not been confirmed. It is unlikely that most predators would be excluded using fencing, and juveniles have been reported to suffer from avian predation from ravens and other large birds. The concept of carrying capacity may not be appropriate for desert tortoise, and it would be extremely difficult to measure. It is difficult to reconcile the reportedly high tortoise densities prior to the 1980s with the concept of carrying capacity.
Guideline 5 “The number of desert tortoises introduced should not exceed the pre-decline density (if known). If the pre-decline density is not known, introductions should not exceed 100 adults or 200 animals of all age classes per square mile in category 1 habitat (Bureau of Land Management designation for management of desert tortoise habitat) unless there is good reason to believe that the habitat is capable of supporting higher densities. Post-introduction mortalities might be compensated by subsequent introductions if ecological circumstances warrant this action.”
• Caution should be used if persistent post-introduction mortality continues over long periods of time. This may signal that threats originally causing are still present. If threats persist, the situation should be considered an opportunity to more about the importance of threats.
Guideline 6 “All potential translocatees should be medically evaluated in terms of general health and indications of disease, using the latest available technology, before they are moved. All translocatees should be genotyped unless the desert tortoises are to be moved only very short distances or between populations that are clearly “genetically” homogeneous. All translocated animals should be permanently marked, and most should be fitted with radio transmitters so that their subsequent movements can be closely tracked.”
• The application of radio transmitters should depend on the experimental design of the translocation project, and the questions that are to be asked of the translocated animals. If, for example, the study is to be used for the sole purpose of measuring long-term population genetics, then the costs and the intensive labor required to monitor all of the translocated animals monthly are probably not warranted.

DTRPAC Report page 25
• All translocations should be guided by a genetic management plan. Such a plan will help to ensure that translocated individuals are moved conservatively among populations that are genetically similar.
Guideline 7 “If desert tortoises are to be moved into an area that already supports a population—even one that is well below carrying capacity—the recipient population should be monitored for at least 2 years prior to the introduction. Necessary data include the density and age structure of the recipient population, home ranges of resident desert tortoises, and general ecological conditions of the habitat.
Areas along paved highways can serve as good translocation sites, if properly fenced. Many such areas support good habitats, but vehicle-caused mortalities and/or collecting have substantially reduced or totally extirpated adjacent desert tortoise populations. Any translocation sites should be isolated by a desert tortoise barrier fence or similar barrier next to the highway or road. The purpose of fencing the highway is obvious—to keep translocated animals from being crushed by vehicles on the road. However, fencing the other sides of the translocation area is critical for establishment. If a fenced area or strip of habitat approximately 0.125 to 0.25 mile wide is established along highways, some translocatees should establish home ranges and a social structure within this strip. When the inside fence is removed, the translocated desert tortoises and those from the extant population farther away from the road will eventually expand their home ranges into the remaining low-density areas. A second reason for inside fencing is to prevent any diseased, but asymptomatic, desert tortoises from infecting nearby, healthy populations. In the event that disease is an issue and a resident population is present nearby, double inside fencing should be considered."
• Guideline 7 appears to address two topics. The first topic (monitoring residents) should be the focus of an experiment and not a criterion for all. As with guideline 6, the conditions of this monitoring should be guided by the experimental design for each specific translocation project.
The second part of this guideline seems overly specific and speculative. While it is true that habitat reclaimed by fencing of major highways could provide receptive habitat, it is unknown if the threats associated with traffic are alleviated by fencing. For example, are tortoises affected by air pollution from traffic, or are raven populations artificially elevated near highways due to the presence of trash, and other animals killed on the road? Until these and other questions are answered the conditions of this guideline may constitute a sound research suggestion not a routine guideline.

DTRPAC Report page 26
“If Einstein had to go through all that is necessary to do science today, who knows what ‘e’ would equal.”
President Josiah Bartlett, West Wing. (2003)

DTRPAC Report page 27
3. Distinct Population Segments
3.1 Definition and intentions of Distinct Population Segments
Given the Endangered Species Act’s definition of “species” to include “any distinct population segment of any species of vertebrate fish or wildlife which interbreeds when mature,” the 1994 Recovery Plan identified six recovery units of the Mojave population of the desert tortoise. These recovery units were identified under the concept of evolutionary significant units (ESU), as described by Waples (1991) and Ryder (1986), but a specific policy on how distinct population segments (DPS) would be defined and applied would only be formally proposed six months after the publication of the Plan (USFWS and National Oceanic and Atmospheric Administration 1994). A final policy was published in 1996 (USFWS and National Marine Fisheries Service [NFMS] 1996).
Two issues arise from the identification of recovery units as DPSs or ESUs prior to a final DPS policy. First, the current policy identifies specific criteria that must be met in defining a DPS. The current recovery units need to be evaluated in light of these criteria. Second, the Recovery Plan stated that each recovery unit, considered to be separate DPSs, may be individually delisted upon meeting the recovery criteria listed in the Plan. However, DPSs must be designated through a formal listing (or delisting) process. Because the tortoise was listed as a single population throughout the Mojave Desert (USFWS 1990), recovery units may not now be individually delisted without formal DPS designation. This chapter addresses these two issues.
3.1.1 Background
USFWS and NFMS (1996) defined DPSs based upon three elements for recognizing individual sub-populations of a single species for differential protection under the Endangered Species Act (ESA):
(1) discreteness of the population segment in relation to the remainder of the species to which it belongs,
(2) significance of the DPS relative to the species to which it belongs, and
(3) conservation status of the population in relation to the ESA standard for listing.
The criterion of discreteness must be satisfied as prerequisite to recognizing both the physical existence (= geographical reality) and the biological/conservation significance (criteria #2 and 3) of a proposed DPS. The Congressional intent of the DPS provision of the ESA was that “the interests of conserving genetic diversity would not be well served by efforts directed at either well-defined but insignificant units or entities believed to be significant but around which boundaries cannot be recognized” (U.S. Court of Appeals, Ninth Circuit 2003).
DPSs and ESUs were until 1994 largely equated with one another and are still treated as synonyms by NMFS. Since 1994, ESU has become much more narrowly defined in the

DTRPAC Report page 28
discipline of comparative biology, where it is most often used. Typically, ESU refers to conspecific populations that are distinguishable by substantial and mutually monophyletic differences in their mitochondrial or nuclear DNA sequences (Moritz 1994, 2002; see also its use by Avise 2000), differences sufficient to reflect past geographical isolation by “vicariance events” (Berry et al. 2002). Currently only NMFS still utilizes a narrow, genetic definition to designate DPS status, most prominently for salmonid fish (Pennock and Dimmick 1997) and fresh water mussels (Nammack 1998). For most taxa, both Services apply the much broader definition of DPS, provided above, for reasons reviewed by Pennock and Dimmick (1997). In terms of legal policy, agency and court precedence, and practicality, it is the broader definition of DPS that is particularly appropriate for defining subdivisions of the desert tortoise (Berry et al. 2002). Regardless of the historical divergence of ESU from the broader DPS, these concepts share a common objective of conserving genetic diversity and divergent evolutionary trajectories, whether these trajectories are demonstrated specifically through DNA (ESU sensu stricto) or inferred through both direct and indirect evidence (DPS sensu lato). In some sense, these units replace the poorly defined and highly subjective anachronism of subspecies (Frost and Hillis 1990, Frost et al. 1992). Influenced in part by the traditional use of morphology, and more recently genetics, in defining subspecies, USFWS and NMFS cite the use of these lines of evidence as appropriate parameters by which to define DPSs. However, these criteria were not to exclude other important information.
The expressed Congressional intent was that differential protection of DPSs be applied “sparingly” to avoid important losses of genetic diversity. While genetics is generally recognized as the primary determinant of distinction, the definition and precedent use of DPSs for the ESA allows genetic, and by extension, evolutionary significance, to be inferred from other parameters. Even compelling differences in conservation status among subdivisions of a species may be invoked both to define and justify a DPS (e.g., differential conservation across international boundaries).
Difficulties in the application of the term DPS largely hinge on the following questions.
(1) What degree of genetic/evolutionary distinctness, either demonstrated or inferred, justifies DPS designation for a specific spatial entity as “discrete”?
(2) What degree of ecological or behavioral differentiation, conservation status, and/or internal homogeneity would make a DPS significant?
(3) To what extent do our existing databases for the desert tortoise subpopulations north and west of the Colorado River make it possible to discern distinctness and document both ecological significance and conservation status?
3.1.2 Discreteness
Resolution of the issue of discreteness is the first requirement in the justification of a DPS. A population may be considered discrete if 1) it is markedly separated from other populations of the same taxon as a consequence of physical, physiological, ecological, or behavioral factors, which may be evidenced by genetics or morphology, or 2) it is delimited by international boundaries within which significant differences in control of

DTRPAC Report page 29
exploitation, management of habitat, conservation status, or regulatory mechanisms exist (USFWS and NFMS 1996). Determining discreteness is intrinsically challenging, because it involves diverse criteria, subjective judgments about degrees of distinctness, and a perspective from comparative biology that places discreteness in context of its particular taxonomic unit. The difficulty of determining distinctness has been exacerbated by the historical commingling of terms like DPS, ESU, and Recovery Unit as in the 1994 Recovery Plan (Pennock and Dimmick 1997, Berry et al. 2002). Furthermore only core areas of most DPSs are resolved by current databases; discrete borders of DPSs are less easily delineated (see McLuckie et al. (1999) for illustration of the complexity of even using the Colorado River as boundary).
Discreteness traditionally has referred to reproductive isolation from other conspecific population units (Nammack 1998). Yet, by definition, DPS units are recognized as conspecific, so reproductive isolation may be less than complete reproductive incompatibility. Reproductive isolation may be based on geographical, ecological, physiological, or behavioral difference(s), and quantitative genetics or morphology may be used as evidence of such difference(s). Although quantitative genetics is an arbiter to assist determination of discreteness (e.g., Spidle et al. 2003), other evidence of reproductive isolation may be considered (e.g., Haig et al. 2002), especially in the context of current policy definition of DPS. In the case of the desert tortoise, quantitative biochemical/genetic information is available (Rainboth et al. 1989, Britten et al. 1997, Lamb and Lydehard 1994, and McLuckie et al. 1999), and it should be used as the primary database.
A second obvious source of comparative data is morphology. Morphological/meristic differences are traditional tools of taxonomists. Indeed, virtually all chelonian species and subspecies have been defined almost exclusively in terms of morphology. Such evidence may be misleading, especially at the subspecies level, particularly given the susceptibility of tortoise shell ontogeny to environmental factors (e.g., diet, seasonality, temperature regimes, etc., see Berry et al. 2002 and Jackson et al. 1976) that are not heritable. If, however, reproductive isolation is not detected because of incompleteness of genetic or morphological sampling, recentness of the isolating mechanism, anthropogenic translocations of individuals, or other reasons, then a case may be made for (1) additional quantitative genetic sampling in specific locations and/or (2) recognition of a DPS based on other criteria. However, such designations would be difficult justify, because they would require extensive knowledge of organism-environment interactions (actually it might well require more knowledge than we are able to obtain within the foreseeable future).
The more generous definition in current use by USFWS (Pennock and Dimmick 1997) conveys “discreteness” to DPS units using criteria that would not justify discreteness in a literal evolutionary sense, but which are very relevant both to the conservation of species like the desert tortoise, in particular. Examples include recognizing populations fragmented or isolated by international boundaries and those demonstrating marked physical, physiological, ecological, or behavioral differences. Behavioral and ecological differences among populations may be used both to infer genetic/reproductive isolation

DTRPAC Report page 30
and to establish the ecological significance of a proposed DPS, but the two concepts are so intertwined that they will be discussed together in the following section.
In most cases, only DPS core areas may be defined but their boundaries are rarely discerned. Both spatially inadequate and genetically incomplete sampling precludes the resolution of such boundaries. This task needs to be addressed for many reasons, but especially when new DPS units are being subdivided from old, or when a pre-existing unit is subsumed into another.
3.1.3 Significance
Ecological and behavioral criteria need to be considered under the current definition of DPS. Genetic evidence generally comes from small samples of the genome of the species, and phenotypic differences in ecology and behavior also can provide evidence of genetic distinctness. Ecological differences help establish the “significance” of differences among populations. Thus, if a sub-population already has been demonstrated to be genetically “distinct,” when should it be considered ecologically “significant”? The USFWS and NFMS (1996) determine the significance of a discrete population by considering the following non-exclusive factors.
(a) Persistence of the discrete population segment in an ecological setting unique or unusual for the taxon.
(b) Evidence that loss of the discrete population segment would result in a gap in the range of a taxon.
(c) Evidence that the discrete population segment represents the only surviving natural occurrence of a taxon that may be more abundant elsewhere as an introduced population outside its historic range.
(d) Evidence that the discrete population segment differs markedly from other populations of the species in its genetic characteristics.
A “significant” subdivision refers to evolutionary legacy. Thus, a DPS should either represent an independent component in the evolution of the species (Nammack 1998) or an irreplaceable component in the conservation of the species in its full diversity (Pennock and Dimmick 1997).
What would be convincing ecological evidence that a DPS represents an independent evolutionary component or irreplaceable component in the conservation of a species? We propose that an important piece of evidence would be a difference in life history trait(s) such that individuals in the putative DPS may be affected differently from individuals elsewhere when faced with the same threat(s) to population persistence. Unfortunately, this criterion is not independent of existing threat(s) because data prior to the existence of threats are lacking. Thus, a more tractable criterion might be difference(s) in life history trait(s) such that individuals in the putative DPS may be affected differently from individuals elsewhere when faced with new threat(s).

DTRPAC Report page 31
Life history traits are adaptations influencing survivorship and reproduction. These adaptations include age and size at reproductive maturity, length of reproductive life, clutch size and size of hatchlings, number of clutches per year, sex ratios, mating systems and sperm storage, etc. Differences in these traits are the result of selection in different environments. Thus, life-history theory predicts that when stochastic selective pressures differentially select against young tortoises, then there should be life-history adaptations to increase the length of reproductive life of adults. Alternatively, when stochastic selective pressures differentially select against adult tortoises, then there should life-history adaptations to produce larger clutches of eggs. When there are differences in life histories among populations, and when there are threats to a sensitive species, then the adaptations to environments can be inadequately matched to environments. Thus, the life-history traits most likely to contribute to the evolutionary independence of a sub-population are those that reflect the adaptation to place and contribute to ecological success.
Sometimes an understanding of these important life-history traits can be captured with a small number of population-level attributes. For example, age-specific mortality rates, clutch size and number of clutches each year, bodily growth rate, body size at reproductive maturity, and primary and secondary sex ratios (e.g., Tanner 1978). More recently, ecologists have been able to infer much of importance in ecological attributes contributing to the evolutionary independence of a sub-population from genetics, dispersion and dispersal, and size and arrangement of habitat patches (see Krebs 1994 and Ricklefs and Miller 1999). A fundamental list of population-level attributes for monitoring species recovery would be very similar and include population size, demographic rates, mode of reproduction, and age at sexual maturity (e.g., Hoekstra et al. 2002).
Even though the information needed to understand the basic ecology of a species is reasonably clear, lack of knowledge about the basic biology of rare species often plagues recovery plans (Tear et al. 1993, Schemske et al. 1994, Crouse et al. 2002). While such information is largely lacking or inadequate to characterize existing DPS units within the threatened Mojave tortoise population, a robust set of life-history characteristics, both stable and pronounced in their differences, distinguish the Mojave desert tortoise from its counterpart in the Sonoran desert. The degree of isolation between populations east and west of the Colorado River correlates well with parallel genetic data used to separate the two currently conspecific groups of populations (Lamb and McLuckie 2002). For this reason, we do not entirely discount the eventual discovery of similar, if less pronounced, life history differences within Mojave tortoise populations.
With the list of important population-level attributes in hand, we are in a position to develop a hierarchy of ecological evidence that can be used to determine if a putative DPS actually represents an independent evolutionary component. A suggested list follows, arranged from the most- to the least-convincing evidence.

DTRPAC Report page 32
Direct Life-History Measures:
(a) survivorship (b) fecundity (clutch size and frequency) (c) dispersion rates (d) seasonality of mating and hormonal cycles (e) size at reproductive maturity (f) bodily growth rate and sex ratio
Ecological/Demographic Indicators:
(a) age distribution/size distribution (b) population growth rate (c) sex ratio/mating system (d) age at sexual maturity/generation time (e) reproductive value (per age class) (d) body size/number of clutches/timing of reproduction (e) population density
Possible Environmental Correlates:
(a) vegetation – both for diet/shelter (b) rainfall (c) soils (d) burrow size, shape, and orientation; hibernacula (e) other habitat variables (slope, proximity to ephemeral water channels, etc.)
At least three caveats accompany this list. (1) Short- and long-term variability in any of these measures, indicators, or correlates could be important in concert with each other or independently. (2) It is not likely that direct demographic measures will be available from throughout a putative DPS, so establishing boundaries may require use of indicators and correlates, once their relationships to direct demographic measures have been established. Likewise, the establishment of long-term (10-20 year) study sites could verify correlates (they could even serve to ”ground truth” remote sensing inferences). (3) Standard statistical techniques can be used to establish significant differences in any of these measures, indicators, or correlates between locations.
3.1.4 Conservation Status
The conservation status of the species, as measured by the five listing factors identified in Section 4 of the ESA, provides final justification for its legal protection as a discrete and significant entity (i.e., DPS). Particularly germane to desert tortoise populations, so many of which are differentially affected by upper respiratory tract disease and other health threats, is the fact that health status should be used to recognize an individual population as discrete and significant (Pennock and Dimmick 1997).

DTRPAC Report page 33
The emphasis on threat(s) is further re-enforced by recent evaluations of recovery plans. These evaluations have led to several recommendations for improving the use of science in recovery plans (Clark et al. 2002). These recommendations include: (1) make threats a primary focus, (2) specify monitoring tasks for species status and recovery tasks, (3) ensure that species status-trend data are current, quantitative, and documented.
3.2 DPSs of the Desert Tortoise
3.2.1 Reappraisal of 1994 Recovery Units
The 1994 Recovery Plan identified six Recovery Units (Fig. 3.1): Northern Colorado, Eastern Colorado, Upper Virgin River, Eastern Mojave, Northeastern Mojave, and Western Mojave. The current Recovery Units represent appropriate hypotheses of discreteness. Certainly all of the Desert Wildlife Management Areas (DWMAs) within these recovery units are valuable to the conservation of the desert tortoise. However, each of the Recovery Units must be reviewed under the more current and elaborate definition of DPS provided above.
How well justified are these recovery units in terms of modern application of DPSs: should some be split, merged, or eliminated? At the species-wide scale, major differences in genetics, morphology, ecology, and behavior separate Mojave, Sonoran, and Sinaloan assemblages of the tortoise (Woodbury and Hardy 1948, Burge 1977, Jennings 1985, Turner et al. 1986, Weinstein and Berry 1987, Lamb et al. 1989, Glenn et al. 1990, Germano 1993, Lamb and Lydehard 1994, Wallis et al. 1999, Averill-Murray et al. 2002a, Averill-Murray et al. 2002b, Averill-Murray 2002a,). These major genetic assemblages were resolved with a parsimony approach, using relative mitochondrial DNA differences exhibited by the other North American tortoise species (Lamb et al. 1989). Recognizably different shell morphology between populations east and west of the Colorado River corresponds to the two described assemblages north of Mexico (Weinstein and Berry 1987). Each assemblage occupies a unique ecological setting (Berry et al. 2002). There is overwhelming support from several facets of science, which point to a clear separation between the Mojave and Sonoran assemblages of the desert tortoise. Within the Mojave assemblage, finer-scale genetic, morphological, ecological, and behavioral differentiation has been acknowledged in the Desert Tortoise Recovery Plan (USFWS 1994).
The Western Mojave, Eastern Colorado, Northern Colorado, and the eastern end of the Eastern Mojave recovery units have poor justification as separate DPSs from each other, despite the geographical importance of their DWMAs, based on current genetic data (Lamb et al. 1989). Currently, the Eastern Mojave Unit combines distinctive California and Nevada haplotypes. We expect the Western Mojave Recovery Unit to be genetically discrete from other units, but additional research needs to be conducted to confirm genetic differences. Tortoises in the western Mojave Desert produce relatively larger eggs, produce fewer eggs overall, and lay their second clutches later than tortoises in the adjacent eastern Mojave Desert (Wallis et al. 1999). Behaviorally, western Mojave

! • no! used .""Iy...~ "
used ;, 3""1y$;'
~ Recovery Un~s
""" V...,., R.....
N""".uomMo!.....E ...,,,,opv.
"'"""" ..."...N«""" C_.do
(...""'c_0 -
0' , • _Jt)'In I~
D v-n",·..- ".
DTRPAC Report page 34
tortoises are much less active during summer than in other recovery units. Extremely winter-dominant rainfall and resultant effects on the vegetation community, as well as its position on the western end of the distribution, contribute to the significance of this recovery unit (USFWS 1994). Furthermore, range reduction already observed at the western edge of the species’ distribution (Bureau of Land Management et al. 2003, Map 3-10) contributes to the significance of this putative DPS on the basis of the gap in the range that would be created by the loss of the DPS if not recovered.
PSP In
* psp
Current
..
_ ...
_ -
0
...
•• . Fig. 3.1. Depiction of recovery units proposed in the 1994 Recovery Plan. Green outlines within the recovery units are proposed DWMAs.

'0m- "''l..o.Sm
'" , 0~., , , ,~ ,en ,~
"~
~'b.,~
3: ()OO- ' 0
'"."m'"
0
c
-
E E
0 0
DTRPAC Report page 35
The entire complex east of the Baker Sink needs more data and analyses, as well as comprehensive reevaluation in terms of genetic diversity and ecological geographic boundaries. An attractive division line for the Western Mojave Recovery Unit runs along a line from Saline Valley in California in the north, then south through Death Valley, Silurian Valley, Baker Sink, and Cadiz Valley. It is particularly attractive because the lower elevations and extremely hot climates along this line divides the ecological western Mojave Desert with its quite variable winter-spring precipitation regime, lower elevations, and Mojave River hydrology, from the more eastern Mojave Desert, subject to more predictable winter and summer monsoon precipitation, more variable elevations, and closed basin and Colorado River hydrology. Rainfall pattern differences (Fig. 3.2) induce profound vegetation differences, forage, and possibly reproductive differences (seasonality of mating, egg clutch size, frequency, and timing). Furthermore, rainfall differences create the potential for different interactions among threats (Section 5).
Station Latitude Adelanto 117.4167 Apple Valley 117.2167
0.8 0 Barstow 117.0333 Cantil 117.9667
0 China Lake 117.6833 0.6
El Mirage 117.6333 0
Hesperia 117.3000 0 Inyokern 117.8167 00.' 0 0 Lucerne Valley 116.9500 0
Mojave 118.1667 Randsburg 117.6500 00.2 Trona 117.3833 Victorville 117.3000 Boulder City 114.8500 0.0 DNWLR 115.3667 · 119 ·118 -117 -116 -115 -114 Dunn Siding 116.4333
Longitude Kyle Canyon 115.6000 Las Vegas 115.1500 Little Red Rock 115.4167 Fig. 3.2. Ratio of rainfall in winter compared to Mitchell Caverns 115.5500 summer in the Mojave Desert. Mountain Pass 115.5500 Weather stations, and the longitudes
for those stations, are given in the North Las Vegas 115.1167
table. Red Rock Canyon 115.4667 Searchlight 114.9167 Sunrise Manor LV 115.0833

DTRPAC Report page 36
While life history patterns and strategies should be expected to differ in tortoise populations east and west of the Baker sink, they have not yet been demonstrated other than for aspects of reproductive ecology noted above between sites in the Western and Eastern Mojave Desert Recovery Units. Tortoises are rare in the lowlands comprising this division, yet they are not entirely absent. Furthermore, neither allozyme nor mitochondrial comparisons yet support differentiation across this axis of potential separation (Rainboth et al. 1989, Lamb and Lydehard 1994).
The western ends of each of the Northeastern Mojave and Eastern Mojave recovery units are indistinguishable genetically (Lamb et al. 1989, Britten et al. 1997). On the other hand, the eastern end of the Northeastern Mojave Recovery Unit falls out genetically distinct from the western end of this unit (Britten et al. 1997). A distinct shell phenotype occurs in the Beaver Dam Slope region of this unit (USFWS 1994).
While we expect that significant differences in genetics and morphology exist, additional study is needed to quantify differences between the Upper Virgin River Recovery Unit and the Northeastern Mojave Recovery Unit (Berry et al. 2002). The Upper Virgin River Recovery Unit is discrete on the basis of behavioral/ecological factors (USFWS 1994) and also has a unique and unusual vegetation community, topography, and soil type (USFWS 1994). Loss of this unit would result in a gap at the northeastern extent of the species’ distribution.
3.2.2 Provisional Revised List of DPSs
We offer here a provisional recognition of a new set of DPS units (Fig. 3.3): Upper Virgin River Desert, Lower Virgin River Desert, Northeastern Mojave Desert (including Amargosa Valley, Ivanpah Valley, and Shadow Valley), East Mojave and Colorado Desert, and Western Mojave Desert. These include two of the original units (Upper Virgin River and Western Mojave) and add or revise four other units, based largely on the best resolving biochemical/genetic data of Rainboth et al. (1989), Lamb et al. (1989), Lamb and Lydehard (1994), and Britten et al. (1997). We do not consider these divisions definitive. These suggested revisions will require more data and analyses, as well as evaluation and expansion of the analyses of Britten et al. (1997), and may result in additional modification. Prior genetic studies pertinent to the foregoing case and others are largely piecemeal, confined to mtDNA, or limited to allozyme or morphological data. They provide us with little insight with regards to gene flow or discrete boundaries. Depending on the outcome of future studies, various DWMAs could be reassigned to different DPSs than currently proposed. In addition, we note that our provisional recommendations leave a single DWMA within the revised Northeastern Mojave Desert DPS, without specific habitat protection throughout the northern half of this segment. All of the DWMAs/critical habitat units remain well justified to sustain survival of G. agassizii: it is only their assignment to particular DPSs that concerns us.
Although we recommend that additional data be collected to refine or revise these proposed DPSs, the evidence for particular DPS designation does not need to be absolute and incontrovertible. Note that an agency must have discretion to rely on the reasonable

MMoryln >Ii<In
D uro"" ....•
<I. not YSed ana!:lsi$
PSPuMd ...nal:ioiS
" '" ,"'''-/'Upper
L.cwe r Rrve,Northeast Mojave
\llle$te,n MClave
East M<Jjave & CoIo<adQ D&$art
D -'-Wfr--,.,
DTRPAC Report page 37
opinions of its own qualified experts even if a court might find contrary views more persuasive. Courts, however, must set aside agency actions that are arbitrary, capricious, an abuse of discretion, or otherwise not in accordance with law. The standard for reversal of an agency action is if the agency has “relied on factors which Congress has not intended it to consider, entirely failed to consider an important aspect of the problem, offered an explanation for its decision that runs counter to the evidence before the agency, or is so implausible that it could not be ascribed to difference in view or the product of agency expertise” (U.S. Court of Appeals, Ninth Circuit 2003). Note also “the fact that the evidence is weak, and thus not dispositive, does not render the agency’s determination arbitrary and capricious” (U.S. Court of Appeals, Ninth Circuit 2003).
....
,..
psp In* ,Revised DPS Units
Vrgn RIVer
Virgin
•.
,.
•
Fig. 3.3 Map of the proposed distinct population segments for desert tortoise.

DTRPAC Report page 38
DPS Recommendations
We recognize that DPSs may not officially be designated in a recovery plan, but revision of the 1994 Plan should lay sufficient groundwork so that DPSs may be formally proposed in future delisting proposals as delisting criteria are met for each DPS (e.g., USFWS 2003). Future revisions will need to respond to the three criteria by which modern DPS units are defined: discreteness, significance, and conservation status. The mechanisms are as follows:
• Genetic core units need to be assessed using both nuclear and mitochondrial genes (Berry et al. 2002).
• The genetic boundaries and gene flow among units need to be critically examined.
• Once these data are available, ecological, morphological, and behavioral attributes should be assigned to each of these genetic units. Correlations should be evaluated among established genetic units and carefully quantified and standardized ecological affinities, health status, life history patterns, and stereotypic behaviors.
• The natural history of host-parasite associations for the major disease relationships for desert tortoise should be more deeply elucidated, including the genetics of hosts and strains of pathogens.
• At least three disparate, long-term study sites should be established within each proposed DPS to verify the reality, consistency, homogeneity, and variability of these defining traits.
• DWMAs within each DPS should be geographically revised to maximize their conservation potential in consultation with ecologists and local resource administrators including the USFWS for coordinating recovery efforts range wide.

DTRPAC Report page 39
“An experiment is a question which science poses to Nature, and a measurement is the recording of Nature’s answer.”
Max Planck, Scientific Autobiography and Other Papers. (1949)

D Urban Ar",asr
Degree
D 'LCW0 '
_~~:v"-t-- ID '.5H'Il~
Reoovery Un~
Mil~a'Y IlIslaUation
DTRPAC Report page 40
4. Status and Trends
4.1 Recovery Plan Implementation
The Recovery Plan identified specific management actions for each DWMA to address perceived threats identified during the listing of and recovery planning for the desert tortoise. If sheer numbers of threats are used as an indication of threatened status, all but the Chuckwalla DWMA have seen increased numbers in the intervening years between 1994 and 2003 (Fig. 4.1 and 4.2).
of Threat 1994
.' - -
..••
Fig. 4.1 Relative number of threats to desert tortoises in each critical habitat unit (i.e., DWMA), as identified by the Recovery Plan in 1994.

InSlallalion
o Areas
0 2Lew
''''''~'''''-' 0 'HIQIl
- - Recovery Un'/:
DTRPAC Report page 41
• •_5 Degree of Threat 2003
j Milrtary• Urban
Fig. 4.2 Relative number of threats to desert tortoises in each critical habitat unit (i.e., DWMA), as identified by the Desert Tortoise Management Oversight Group in 2003.
In answer to these threats the Recovery Plan recommended a number of management actions per DWMA. The relative numbers of recommended management actions are illustrated in Fig. 4.3. In 2002 land and wildlife management agencies responded to a questionnaire from the USFWS to document implementation of the Plan (Redlands Institute 2002a- 2002f). Survey responses were not specific enough to quantify the level of implementation for specific actions. Therefore, we did not attempt to interpret the degree to which agencies actually implemented each action, only whether some action had been taken. We intend this brief analysis to simply represent a “first-cut” review of the general status of recovery plan implementation without delving into a comprehensive analysis of each recommendation in the Plan.

o ~
,
=':"li/,-nD ~
DTRPAC Report page 42
• ,.-
Recovery Actions
Number Recommended
27 28 0 29-30
_ 31 -32
Fig. 4.3 Relative numbers of management actions recommended for each DWMA in the 1994 Recovery Plan.
Based on survey responses in 2002, it appears that implementation has been uneven relative to recommended management (Fig. 4.4, Table 4.1). Many reviewers of the prior draft of this report made it clear that they disagreed with the representation of Recovery Plan implementation in Fig. 4.4 and Table 4.1, both by not crediting implementation where it had occurred and by giving credit for implementation where it may have been negligible. Our main conclusion from this survey is not the specific degree to which the Recovery Plan has been implemented in any given area. Rather, it is clear that the USFWS and other management agencies need to better document and quantify recovery efforts recommended in the Recovery Plan or its revision (Section 4.5.1) provides a
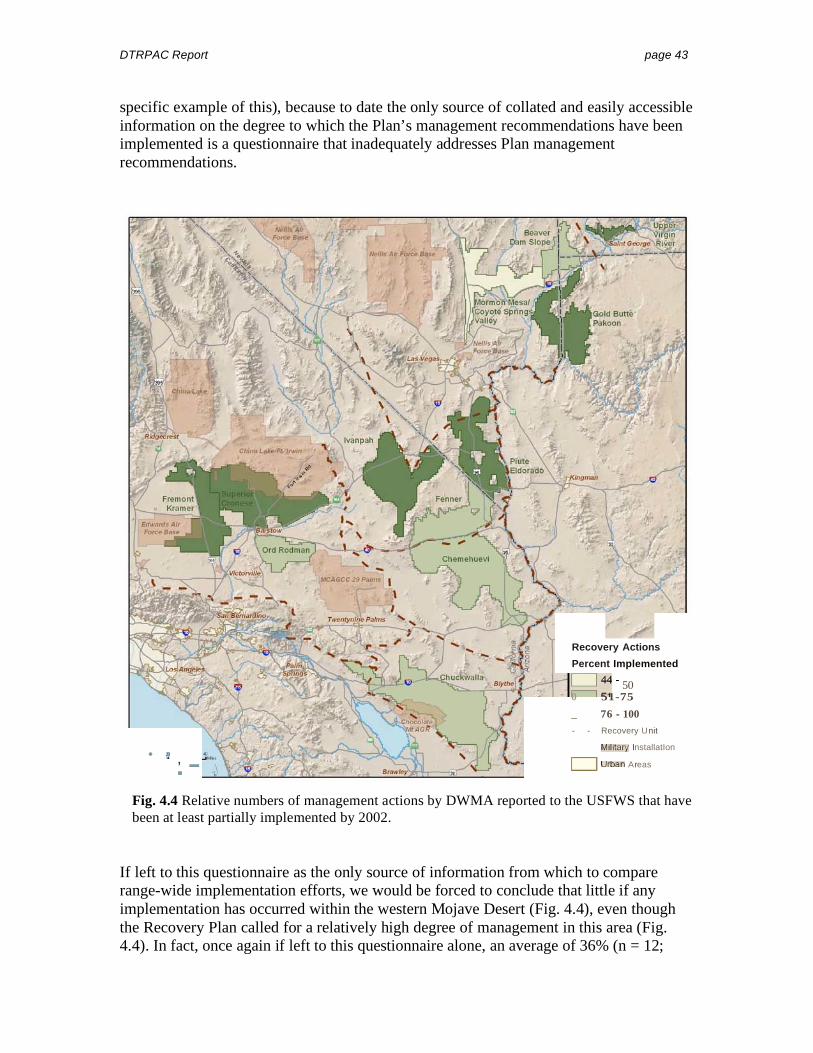
,
_--f~~~MD44 ~
MII ~ary
o Urban
DTRPAC Report page 43
specific example of this), because to date the only source of collated and easily accessible information on the degree to which the Plan’s management recommendations have been implemented is a questionnaire that inadequately addresses Plan management recommendations.
• ,.-
Recovery Actions
Percent Implemented
50 0 51-75
_ 76 - 100
- - Recovery Unit
InstallatIon
Areas
Fig. 4.4 Relative numbers of management actions by DWMA reported to the USFWS that have been at least partially implemented by 2002.
If left to this questionnaire as the only source of information from which to compare range-wide implementation efforts, we would be forced to conclude that little if any implementation has occurred within the western Mojave Desert (Fig. 4.4), even though the Recovery Plan called for a relatively high degree of management in this area (Fig. 4.4). In fact, once again if left to this questionnaire alone, an average of 36% (n = 12;

DTRPAC Report page 44
Coyote Springs Valley is combined with Mormon Mesa and Joshua Tree not included) of the management recommendations per DWMA were not reported as having been implemented as of 2002, ranging from 100% (at least partial) implementation at Upper Virgin River to only 32% implementation at Ord-Rodman (Table 4.1). Only 38% of recommended management actions were reported to be implemented overall in the Western Mojave Recovery Unit, and tortoise populations in this region have shown the most dramatic declines (Section 4.2 or Fig. 4.13).
Recovery Action Review and Implementation Recommendations:
With better planning and implementation of a new questionnaire that specifically addresses Recovery Plan implementation, we will be better able to assess the level of implementation of management recommendations. We offer the following specific recommendations regarding recovery action review and implementation:
• Land managers and policy makers should undertake a coordinated, range-wide effort today, not waiting for the possible formation of a future recovery team, to assess the level to which Plan recommendations have been implemented within each DWMA. This effort should be directly correlated to Recovery Plan management recommendations. Without this effort, it will be impossible to assess the level of Plan implementation and thus objectively assess the reasons why the desert tortoise continues to appear to be declining throughout much of its range.
• At the same time, if a future recovery team is formed, it will be essential that the team review and revise recovery recommendations for each DWMA and/or provisional DPS to ensure that recommended recovery actions address relevant site-specific impacts or threats.
• Most recovery actions should be implemented in an experimental framework (in at least some areas) to determine the effectiveness of those actions. Appropriate response variables (e.g., tortoise numbers or density, reproductive output, nutrition, juvenile survival, etc.) may vary depending on the action. Likewise, the necessary study duration may vary depending on the action and response variable; long-term studies should be expected, given the life history of the tortoise.
• The USFWS and other management agencies should develop a forward-looking, quantitative recovery actions database. Database development should begin during the Recovery Plan revision process with site-specific baseline measures (e.g., miles of authorized/unauthorized roads and trails, number of landfills in a particular DWMA) for each recovery action. Subsequently, agencies should document in the database specific levels of recovery action implementation (e.g., miles of roads closed, number of landfills closed or managed appropriately in a particular DWMA). Lundquist et al. (2002) and Hatch et al. (2002) found that recovery tasks and monitoring were significantly more likely to be implemented for plans with a recovery coordinator or committee and a centralized recovery database.

DTRPAC Report page 45
Table 4.1. Recovery actions listed in the Recovery Plan (and DWMA supplement) reported by management agencies as implemented through 2002 (Redlands Institute (2002a-f). 0 = No Implementation; 1 = Implementation Initiated; blanks indicate actions not applicable to that unit, according to the Recovery Plan.
Recovery Action 1 Prohibit Vehicles off Roads 2 Prohibit Competitive/Organized
Events 3 Prohibit Surface Disturbance 4 Prohibit Grazing 5 Prohibit Burros/Horses 6 Prohibit Vegetation Harvest 7 Prohibit Collection 8 Prohibit Dumping/Littering (+
cleanup) 9 Prohibit Releases 10 Prohibit Uncontrolled Dogs 11 Prohibit Discharge of Firearms 12 Restrict New Roads 13 Close Roads 14 Designate Roads 15 Fence Roads/Install Culverts 16 Law Enforcement 17 Restore Habitat 18 Sign/Fence Boundaries 19 Landfill Management 20 Environmental Education 21 Withdraw Mining 22 DWMA Mgt. Plan 23 Secure Non-federal
Lands/Habitat 24 Halt Unauthorized ORV Use 25 Halt Vandalism of Tortoises 26 Install Railroad Barriers/Culverts 27 Install Aqueduct Barrier 28 Monitor Health of Population 29 Evaluate Raven Use 30 Install Urban/Other Barriers 31 Raven Control 32 Distribution/Density Surveys
Chemehuevi 1 1
1 1 1 1 1 1
1 0 0 0 1 1 0 1 0 0 1 1 0 1 1
0 0 1
1
Chuckwalla 1 1
1 1 1 1 1 1
1 0 0 0 1 1 0 1 0 0 1 1 0 1 1
0 0
1 0
1
Upper Virgin River
1 1
1 1 1 1 1 1
1 1 1 1 1 1 1 1 1 1 1 1 1 1 1
1 1 1
Fenner 1 1
1 1 1 1 1 1
1 0 0 0 1 1 0 1 0 0 1 1 0 1 1
0 0
1
0 1
Ivanpah 1 1
1 1 1 1 1 1
1 1 0 1 1 1 0 1 1 0 1 1 0 1 1
0 0
1
1
Piute-Eldorado
1 1
1 1 1 1 1 1
1 1 0 1 1 1 0 1 1 1 1 1 0 1 1
0
1 1
Beaver Dam
Slope 1 1
1 1 0 1 1 1
1 0 0 1 1 1 1 1 0 1 0 1 0 1 0
0
1
0
1
Gold Butte-
Pakoon 1 1
1 1 1 1 1 1
1 0 0 1 1 1 0 1 1 1 1 1 0 1 0
1
1
Mormon Mesa
1 1
1 0 0 1 1 0
0 0 0 1 0 1 0 1 0 0 1 1 0 1 0
0 0
Fremont-Kramer
0 0
0 0 0 0 1 1
1 1 1 0 0 0 1 1 0 0 1 1 0 0 1
0 0 0
1
1 1 1
Ord-Rodman
0 0
0 0 0 0 1 1
1 0 0 0 0 0 0 1 0 0 1 1 0 0 1
0
1
0 0 1
Superior-Cronese
0 0
0 0 0 0 1 1
1 0 1 0 0 0 1 1 0 0 1 1 0 0 1
0
0
% Partially Implemented 67% 64% 100% 64% 78% 85% 67% 80% 44% 47% 32% 36%

DTRPAC Report page 46
4.2 Trend Analyses of Populations
No existing data or analyses are adequate to estimate long term status or trends in (a) desert tortoise populations, (b) habitat for desert tortoises in any recovery unit, and/or (c) threats to tortoise populations regionally. However, we assembled as much data as was possible, within the time constraints for preparing the DTRPAC report, to perform the equivalent of meta-analyses on existing information (Hunter et al. 1982). Our analyses consist of two general approaches: 1) evaluation of long-term trends in the densities of desert tortoises within Recovery Units and within the Distinct Population Segments that are proposed by the DTRPAC, and 2) evaluation of qualitative and quantitative spatial analyses of the presence of live and dead tortoises on transects for (a) “total corrected sign” and (b) distance sampling. These analyses provide insight as to where, within larger management units, tortoises may be doing better or worse than in other areas. The successes of these analyses portend efficacious approaches for exploring data in new and innovative ways that can be terrifically important to the future successes of monitoring programs.
4.2.1 History of Long-Term Study Plots
Long-term permanent study plots were established in California in the early 1970’s as part of an inventory of Bureau of Land Management (BLM) resources (Berry 1984). Permanent study plots were also established in Arizona, Nevada, and Utah (Fig. 4.5). These plots originally were established to generate data on demography and population trends as well as ecological relationships with abiotic and biotic factors (Berry 1984). Various methods were used to assess population size in the initial surveys on those plots (e.g., 30-day spring surveys, 20-day fall surveys, and winter den surveys), but eventually a standard method became a 60-day spring survey of a one square mile plot. In this protocol, survey effort was divided into two periods of roughly equal times (capture and recapture periods). Tortoise density has been estimated using the Lincoln-Peterson calculation (Turner and Berry 1984); analyses for most plots limit abundance estimation to tortoises >180 mm MCL, due to reduced capture probabilities for smaller tortoises, but abundance of tortoises of all sizes on California plots is often estimated with a stratified Lincoln Index (Overton 1971). Additional data collected on study plots include health profiles, burrow or cover characteristics, tortoise size, information on carcasses, and vegetation on the plots. Few of these latter data have been analyzed beyond descriptive summaries.
Plots typically were located on public lands and in areas containing “adequate tortoise densities for sampling,” sometimes explicitly where many tortoises had been reported; however, some plots were originally located in areas where strip-transect surveys had previously documented little or no tortoise sign (Berry 1984). Plots were located in areas generally considered to have been the least disturbed “representative habitats” within the desert ecosystems (e.g., Mojave Desert, Colorado Desert, etc.). Several plots on which few tortoises were found have been discontinued (K.H. Berry, pers. comm. 2003). Sixty-day plot surveys began in California in the early 1970’s, in Nevada and Utah in 1981, and in Arizona in 1987. Only a small subset of the plots has been surveyed in any one year, and fixed survey intervals have not been maintained (Table 4.2).

'I....~-
•
,
~ not used ,., onolysls* used In an!'Jiy<is
CJ~M
DTRPAC Report page 47
Fig. 4.5 Locations of desert tortoise permanent study plots within the federally listed range of
PSP
PSP
desert tortoises in the southwestern United States.
Permanent study plot data were used to give the committee some insight into the range-wide status of tortoises over the most recent two decades. Density estimates and confidence limits for those estimates were collected from published literature, reports, and from personal communications with researchers who supervised surveys of the permanent study plots within the listed range of the desert tortoise from 1979 to 2002 (Table 4.2). Not all plots were sampled in all years, and not all data were calculated or obtainable for plots that were sampled in some years (Table 4.2).

DTRPAC Report page 48
Table 4.2 Years surveyed on permanent study plots for desert tortoises. A number (0 or 1) indicates that data were taken at this plot. A zero indicates that the data are not available or sufficient for analysis, and a one indicates that data were available for analyses in this report.
Study Site State 71/72 76/77 78 79 80 81 82 83 84 85 86 87 88 89 90 91 92 93 94 95 96 97 98 99 00 01 02 03 Southern Argus CA 0 Fremont Valley CA 0 0 1 1 1 1 DTNA (interior) CA 1 1 1 1 1 1 DTNA (inter. Center) CA 1 1 1 1 0 0 Fremont Peak CA 1 1 1 1 1 Kramer Hills CA 1 1 1 1 1 Stoddard Valley CA 1 1 1 Lucerne Valley CA 1 1 1 1 Johnson Valley CA 1 1 1 1 Shadow Valley CA 0 1 1 1 Ivanpah Valley CA 1 1 1 1 1 Fenner Valley (Goffs) CA 0 1 0 0 0 0 1 1 1 Ward Valley CA 1 1 1 1 1 Chemehuevi CA 0 0 1 1 1 1 0 Chuckwalla Valley CA 1 1 1 Chuckwalla Bench CA 0 0 1 1 1 1 1 0 1 Last Chance NV 0 Sheep Mountain NV 1 1 1 1 Piute Valley NV 0 0 1 1 1 Christmas Tree NV 1 1 1 Coyote Spring NV 1 1 1 Gold Butte NV 1 1 1 Sand Hollow NV 1 1 Mormon Mesa NV 1 1 Trout Canyon NV 1 1 Eldorado Valley NV 1 LMNRA Tassi NV 0 Road 152 NV 0 0 Road 149 NV 0 Road 60 NV 0 0 Road 58 NV 0 0 0 Road 42 NV 0 0 River Mountains NV 1 0 1 1 Pinto Valley NV 0 Overton NV 1 1 Lake Las Vegas NV 0 Grapevine NV 1 1 1 0 0 0 0 0 Government Wash NV 0 Dupont Mine NV 0 Cottonwood NV 1 1 1 0 0 0 0 0 0 Cat Claw NV 0 Bitter Springs NV 0 0 0 Pakoon Basin AZ 0 Virgin Slope AZ 1 1 0 BDS Exclosure AZ 0 1 0 Littlefield AZ 0 0 1 1 City Creek UT 1 1 Woodbury-Hardy UT 0 1 1 1 Beaver Dam Slope UT 1

DTRPAC Report page 49
Data on population densities on permanent study plots were assembled from numerous sources (Table 4.3). Data from these plots have limits to their value for scientific assessment of status and trends for several reasons. For example, the plots are not random samples of desert tortoise habitat, so extrapolations from them cannot be made. The plots were not sited to address specific hypotheses about management actions so it is not clear to what the contained tortoises are responding. The plots were not censused in the same years, and the timing of measuring the plots makes comparisons among plots of limited value. Detectability of tortoises was never measured which further limits temporal comparisons of status and trends. In spite of the inadequacies of these data, and with some caveats, they can be used to estimate the status and trends of desert tortoise populations with appropriate caution. When the Recovery Plan was assembled, information regarding the status of desert tortoise populations largely depended upon analyses of tortoise densities from permanent study plots. While these data showed that populations experienced significant declines in the western extent of the listed range (i.e., California, see USFWS 1994, Page 4, Fig. 1), no trend in adult densities for the eastern portion was discernable at that time (see USFWS 1994, Appendix C, Page C9, Fig. C4). Interpretations of analyses of data from permanent study plots have been controversial (Corn 1994, Bury and Corn 1995), and new sampling methods were advocated. Permanent study plots continued to be sampled in the years following the publication of the Recovery Plan, and many continue to be sampled. However, many of the study plots in Nevada, and Utah were not sampled beyond ~ 1996, as new methods of density estimation were implemented. Thus, the status of tortoise populations in California, as measured by data taken from study plots, is more current than that from Nevada or Utah. Nevertheless, data beyond those relied upon by the Recovery Team in 1994 are available and are analyzed herein, and those analyses show similar patterns in trends of desert tortoise densities to those published in the 1994 Plan.

DTRPAC Report page 50
Table 4.3 Citations for sources of data used in permanent study plot analyses
Advantage Environmental Consulting. undated (1992) Bashor, A.N. undated (1991) Berry, K.H. 1989
Berry, K.H., T. Shields, and C. Knowles. In prep. Duck, T.A., and E. Schipper. undated (1989) Duck, T.A., and J.R. Snider. undated (1988)
Foreman, L. (pers. comm.)
Fridell, R.A., and M.P. Coffeen. undated (1993)
Haley, R., and M. Boyles (pers. comm.)
Berry, K.H. 1990 K.H. 1992 Berry. K.H. 1995 Berry.
Berry, K.H. 1996 Berry, K.H. 1999 Berry, K.H., L.L. Nicholson, S. Juarez, and A.P. Woodman. 1986
EnviroPlus Consulting. 1995 EnviroPlus Consulting. 1994
Fridell, R.A. 1995 Fridell, R.A., and J.A. Shelby. 1996
Fridell, R.A., J.R. Snider, K.M. Comella, and L.D. Lentsch. 1995 Fridell, R.A., M.P. Coffeen, and R. Radant. 1995 Goodlett, G., and P. Woodman 2003 Goodlett, G., M. Walker, and P. Woodman. 1997 Goodlett, G., P. Woodman, M. Walker, and S. Hart. 1996
K. Berry (pers. comm.) K. Phillips (pers. comm.) Longshore, K.M. 2003 Medica, P.A. 1992 Minden, R.L., and S.M. Keller. 1981 Nickolai, J.L., and R.A. Fridell. 1998 P. Medica (pers. comm.) Rourke, J.W., C. Hillier, J. Merriam, and T.A. Duck. undated (1993) Turner, F.B., and K.H. Berry. 1985 USFWS, Ventura Office Annual Permit Reports Woodman, P. 1997

DTRPAC Report page 51
4.2.2 Trends Range-wide (East and West)
Permanent study plots that have been sampled for an extended period, from which data were used in the original Recovery Plan, and can be divided into those in the eastern and western part of the desert tortoise range (Table 4.4), as was done in the original Recovery Plan. When the 1994 Recovery Plan was written, there were documented population declines in the Western Mojave and this downward trend appears unabated (Fig. 4.6). In addition, there is now a guarded concern for populations in the East Mojave (in California), particularly due to a single recent data point at the Goffs site (Fig. 4.6). This concern has highlighted the need for more data to assess the importance of data points that could either be outliers or could be indicators of new trends. In these areas, desert tortoises appear to be affected by various combinations of threats or the cumulative effects of many threats.
Table 4.4 Study plots from which data were used to assess trends in population size in the original Recovery Plan.
Eastern Western Chemehuevi Valley Desert Tortoise Natural Area (Interior) Chuckwalla Bench Desert Tortoise Natural Area (Visitors Center) Chuckwalla Valley Fremont Valley Ivanpah Valley Fremont Peak Upper Ward Valley Johnson Valley Christmas Tree Kramer Mountains Coyote Springs Lucerne Valley Gold Butte Stoddard Valley Piute Valley Sheep Mountain Trout Mountain

6 a Wcst Mojaw Sitcs~
~ . OTHAif
Oi • OTNAC • .. FtemOf7f PIc~ A F~tVMec C V.,
KntmfN
'" L~V.I
!!! StoddiIrrJ VII'~ 0c. a
60. • • ~
'" 6~
a; • • • a:
Qs e . _1°
a [ l lsl ern~
~ . e~~uevf
';; 6 Chud",,,lIe V.,D Coyo.. Springc
~ .-e GDkIButreC ........'" b. IIfNmOt1 Iftu~ o-ron.,
PiIlt. VMC. a 0
ShMkJ. y.,0. SJ-.pMtn~ W.wd V.,
.~ I; Chrl,lnU$ r,..1i .. Chuc*wlIl~a;a:
DTRPAC Report page 52
• • 01.00
• • 3 0.80
Johnson. a0 a HI.0 0.60 • •0
o• 0.40 •0
> • 0.20
0.00 1980 1985 1990 1995 2000
Year
• • • Sites1.00 • • 0
0.80 • •• ••
•• • •
C
00 0.60 • 0. a .
o o
0.400 •
o •
0.20 Beh
0
0.00 1980 1985 1990 1995 2000
Year
Fig. 4.6 Trends in relative population densities for desert tortoises in the eastern and western permanent study plot sites.
4.2.3 Trend Analyses by Recovery Unit
The DTRPAC analyzed for trends in tortoise population densities at a finer spatial scale than just the eastern and western portions of the listed range (as was done in the Recovery Plan). It is important to recognize that analyzing permanent study plots individually is largely meaningless except to learn about processes only on the plot (generally not valuable for conservation planning). Thus, analyzing permanent study plots cannot give insight into population trends occurring within larger management areas (Manly 1992, MacDonald and Erickson 1994, Underwood 1997) unless the plots are randomly placed within the area for which generalization is needed. Nevertheless, for our analyses, study plots were treated as though they were random samples of regions. Because the permanent study plots actually were not randomly placed (Berry 1984), this somewhat limits the extent to which it is

DTRPAC Report page 53
possible to generalize from analyses (Manly 1992). Regardless of the limitations to analyses from these plots (the only data available), the data from the plots were analyzed in a way that reduced bias as much as possible. The geographic areas that we examined included the Recovery Units specified in the original Recovery Plan (Fig. 4.7), and the Distinct Population Segments (Fig. 4.14) suggested by the DTRPAC (see Section 3). For each Recovery Unit and DPS, we constructed a weighted general linear model with one continuous and one categorical variable (results below). Estimates of the population densities of adult tortoises (carapace lengths > 208 mm) were the response variable, and time (years) and the study plot were predictor variables. The model was weighted by the inverse of the half-width of the upper confidence limit relative to the magnitude of the density estimate. This weighting caused more precise density estimates to have greater influence on the model than those with poor precision. Repeated measures analysis of variance was also considered for these analyses, however the data from study plots were collected in different years and for differing numbers of years, which made this type of analysis untenable. The graphs of adult tortoise density for each Recovery Unit and Distinct Population Segment given below are bivariate plots of the raw density estimates and their confidence limits and not the results of analyses on the data.
Some of the Recovery Units, or proposed Distinct Population Segments, did not have sufficient study plots within them to permit analysis, or had too few study plots to provide enough power to produce conclusive analyses. For example, the Upper Virgin River recovery unit and proposed DPS contained only one plot (City Creek), for which we had density estimates for only 1988 and 1994. Thus, no analyses were conducted for this Recovery Unit/DPS. In addition, the Eastern Colorado Recovery Unit and the Northern Colorado Recovery Unit each contained only two plots, and results for analyses from this small sample lack power and ability to generalize. The Western Mojave Recovery Unit contained the same set of permanent study plots as the proposed Western Mojave Distinct Population Segment, and therefore new analyses were not necessary for the DPS.

.,.,_ P.....
! • not used ",.,.lys
~ "used In analy$io
~ Recovery Un~s
u"" v...,., R".N""".uomMo!.....
_ E"'om~
w..t"" ..." ...N«"om C_.do
( ""'c_D~M. • • _or:t ln aIico1
• D v-n"'....- ".
DTRPAC Report page 54
PSP In ..
* psp
Current
..
_
- ... • , ....
• . Fig. 4.7 Active (green tortoise symbols) and discontinued (orange triangles) permanent study plots grouped within the 1994 Recovery Units.
Upper Virgin River Recovery Unit (and DPS)
There was only one PSP represented in the Upper Virgin River recovery unit (City Creek; Fig. 4.7), and therefore no analysis was generated for this recovery unit. The density estimates for this site are given in Fig. 4.8.
The Upper Virgin River DPS contains the same permanent study plot (City Creek) as the recovery unit (Fig. 4.7). No analysis was conducted for this DPS and Recovery Unit.
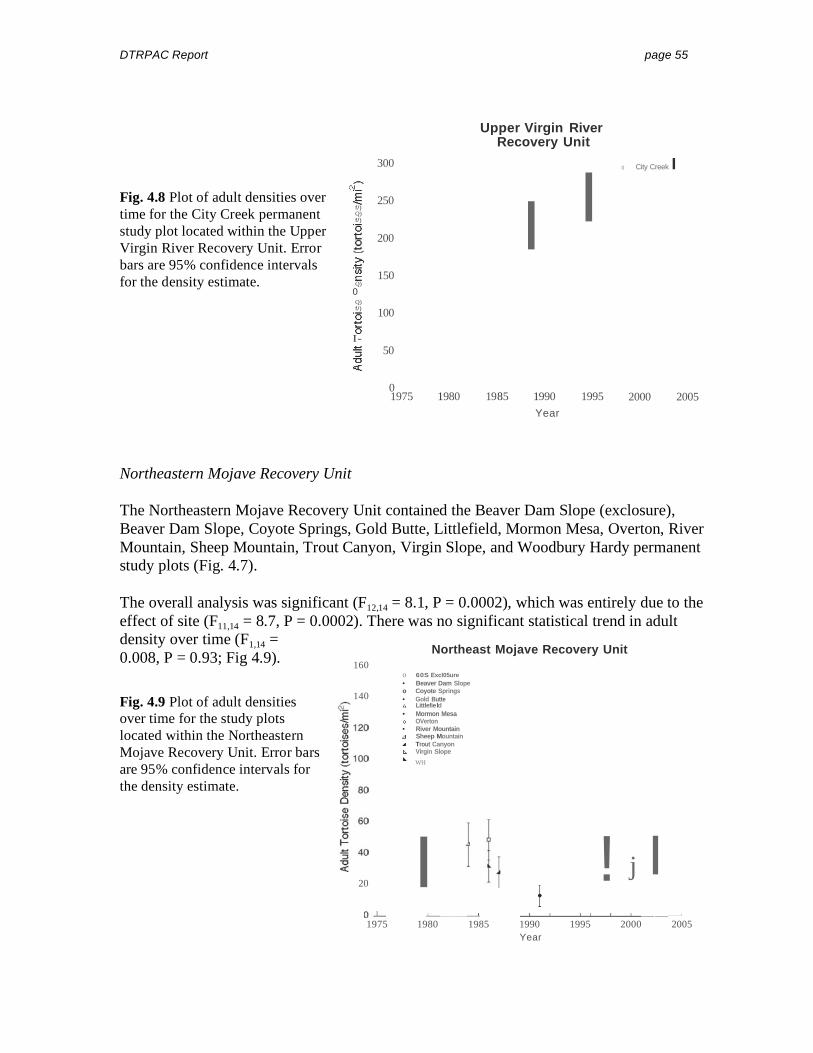
---01_
.E
'Eg~"Ujc
'2a-"'5"0<:(
f
l:!.
<>
.:f
...r::..
•
O -'- .L- ----.J. --'-_-'--_---L--'---'-_-'-__ -----.J
DTRPAC Report page 55
Upper Virgin River Recovery Unit
Fig. 4.8 Plot of adult densities over time for the City Creek permanent study plot located within the Upper Virgin River Recovery Unit. Error bars are 95% confidence intervals for the density estimate.
Northeastern Mojave Recovery Unit
300 0 City Creek I
250
If/) Q) If/)
200
150 Q)
0 Q) f/) 100
I50
0 1975 1980 1985 1990 1995 2000 2005
Year
The Northeastern Mojave Recovery Unit contained the Beaver Dam Slope (exclosure), Beaver Dam Slope, Coyote Springs, Gold Butte, Littlefield, Mormon Mesa, Overton, River Mountain, Sheep Mountain, Trout Canyon, Virgin Slope, and Woodbury Hardy permanent study plots (Fig. 4.7).
The overall analysis was significant (F12,14 = 8.1, P = 0.0002), which was entirely due to the effect of site (F11,14 = 8.7, P = 0.0002). There was no significant statistical trend in adult density over time (F1,14 = 0.008, P = 0.93; Fig 4.9).
Fig. 4.9 Plot of adult densities over time for the study plots located within the Northeastern Mojave Recovery Unit. Error bars are 95% confidence intervals for the density estimate.
Northeast Mojave Recovery Unit 160
o 60S Excl05ure • Beaver Dam Slope o Coyote Springs
140 • Gold Butte Littlefield
• Mormon Mesa OVerton
• River Mountain Sheep Mountain Trout Canyon Virgin Slope
WH
! j I 20 I
__
1975 1980 1985 1990 1995 2000 2005 Year

0L.E Goff,(/)
(/)
'"'B0~
»'[5c0
1
(/)
"B0~
"3 nu~
•
DTRPAC Report page 56
Eastern Mojave Recovery Unit
The Eastern Mojave Recovery Unit contains the Christmas Tree, Goffs, Ivanpah, Shadow Valley, and Piute Valley permanent study plots (Fig. 4.7).
The overall analysis for the Eastern Mojave Recovery Unit was significant (F5,11 = 10.3, P = 0.0007). This result was entirely due to the significance of the site effect (F4,11 = 11.7, P = 0.0006). There was no significant effect of year in the model, indicating that there was no trend in adult density estimates over time (F1,11 = 0.2, P = 0.65; Fig. 4.10).
East Mojave Recovery Unit 300
250 0 Christmas Tree
• 0 IvanpahFig. 4.10 Plot of adult densities Q) Shadow Valley• Plute Valleyover time for the study plots 200 jlocated within the Eastern Mojave
Recovery Unit. Error bars are 95% 150confidence intervals for the density Q)
estimate. Q)
100
IIIII
50
I0 1975 1980 1985 1990 1995 2000 2005
Year
Northern Colorado Recovery Unit
The Northern Colorado Recovery Unit contained two permanent study plots, Chemehuevi and Ward Valley (Fig. 4.7). This limits how generalizable the results from this analysis can be and again highlights one of the weaknesses of using data from permanent study plots to discern long-term trends for management areas.
The overall model for the Northern Colorado Recovery Unit was significant (F2,7 = 23.29, P = 0.0008), and the effect of site was significant (F1,7 = 39.6, P = 0.0004). There was no significant effect of year, indicating no statistical trend of adult tortoise density over time (F1,7 = 1.3, P = 0.3; Fig. 4.11).

'""''"~If)Q)If)
'2g>.oijjcQ)
Q)If)
'£0
"3'0« II t
'""'01_
.EIf)Q)If)
°2g>.
.~cQ)
Q)If)
jI~0..."3'0«
DTRPAC Report page 57
Northern Colorado Recovery Unit 300
250
200
Fig 4.11 Plot of adult densities 150over time for the PSPs located
0within the Northern Colorado Recovery Unit. Error bars are 95% 100 confidence intervals for the l
density estimate. I50 I0 1975 1980 1985 1990 1995 2000 2005
Year
Eastern Colorado Recovery Unit
The Eastern Colorado Recovery Unit contained two permanent study plots, Chuckwalla Bench and Chuckwalla Valley (Fig. 4.7). As in the Northern Colorado Recovery Unit analysis, this limits how generalizable the results from this analysis can be and highlights one of the weaknesses of using data from permanent study plots to discern long-term trends for management areas, whether they are Recovery Units or Distinct Population Segments.
The overall model for the Eastern Colorado Recovery Unit was significant (F2,6 = 21.0, P = 0.002), with significant effects Eastern Colorado Recovery Unit of both site (F1,6 = 19.18, P = 250
0.005) and year (F1,6 = 20.24, P 0 Chuckwal la Bench= 0.004; Fig. 4.12). This Chuckwalla Valley•200indicated that there was a
statistical decline in adult densities over time, which 150
appears to be due to the effect of Chuckwalla Bench. 0
100
Fig. 4.12 Plot of adult densities I- Ij Ij50over time for the PSPs located Iwithin the Eastern Colorado Recovery Unit. Error bars are 95% 0 confidence intervals for the density 1975 1980 1985 1990 1995 2000 2005
estimate. Year

........"i_
.E(J)Q)(J)
'0....
........»'00CQ)
Q)(J)
'0....
/;..(>
DTRPAC Report page 58
Western Mojave Recovery Unit (and DPS)
The Western Mojave Recovery Unit included the DTNA Interior, DTNA Interpretive Center, Fremont Peak, Fremont Valley, Johnson Valley, Kramer Hills, Lucerne Valley, and Stoddard Valley Permanent Study Plots (Fig. 4.7).
The overall analysis was significant (F8,25 = 7.2, P < 0.0001), and the year effect yielded a significantly negative trend in adult density estimates over time (F1,25 = 20.52, P = 0.0001 (Fig. 4.13). There was also a significant contribution of site to the model (F7,25 = 4.46, P = 0.003). This analysis indicates that, taken together, tortoise densities on the permanent study plots located within the Western Mojave Recovery Unit are declining, as was suggested in the Recovery Plan (Recovery Plan, Appendix C, page C10, Figure C5). This pattern suggests that recovery actions implemented since the Plan have not resulted in the reversal of this declining trend.
The study plots included in the proposed Western Mojave Distinct Population Segment (Fig. 4.14) are the same as those in the Western Mojave Recovery Unit (Fig. 4.7).
West Mojave Recovery Unit
250
Fig. 4.13 Plot of adult 200 0 DTNAf3lDTNA 4•
I 0 Fremont Peak
Fremont Valley densities over time for the
•permanent study plots Johnson ValleyKramer Hills
located within the Western o Lucerne Valley - 150 • Stoddard Valley
Mojave Recovery Unit. Error bars are 95% confidence intervals for o the density estimate.
o I-
Year

•., ,- ",
'-'M'fr-
<I. not YSed anal:isis
uMd Il ana!:l'"
"''''L-~1
Up.per RIVer
L.cwer Rrver
No<thea$t Mojave
V\le$te,n MClave
East M<Jj;;ove CokKadQ ~rt
D -
DTRPAC Report page 59
4.2.4 Trend Analyses by Distinct Population Segment
psp In
• psp
Revised DPS Units Vi gn
Virg in
&
•• . Fig. 4.14 Active (green tortoise symbols) and discontinued (orange triangles) study plots grouped by Distinct Population Segment.
Lower Virgin River DPS
The Lower Virgin River Distinct Population Segment contains the Beaver Dam Slope (Exclosure), Beaver Dam Slope, Coyote Springs, Gold Butte, Littlefield, Mormon Mesa, Overton, River Mountain, Virgin Slope, and Woodbury Hardy permanent study plots (Fig. 4.14).
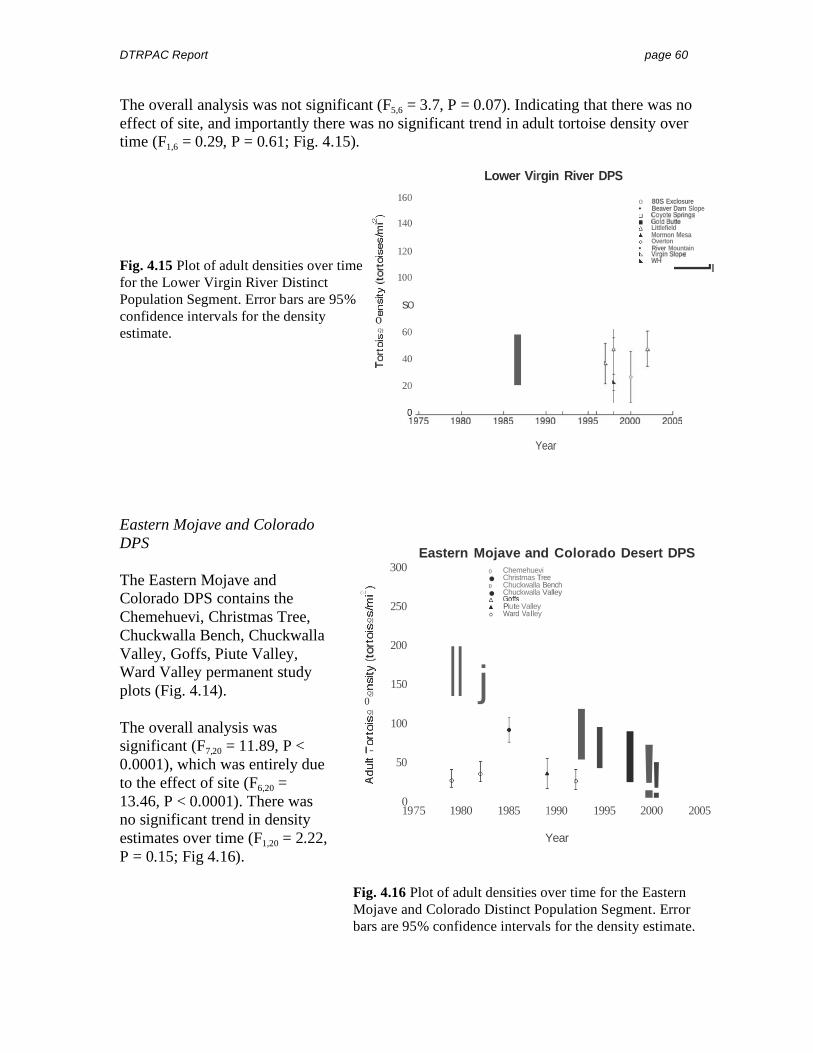
~ ~rgWu~~rlngsQ
•<>
~ ~inSlope
--.II
'""'"!-
~III"0
g>.-usiii
III"0
~
~ 9c"-7--,-S--19,-LS--,-0--19,-LS-,S------,--19,-L9--,-0---'----19,-L9-"S--'----,--20,-L0-,0---,-,J200S
.......
] IJ. Goffs&
(/) ¢
(/)
"2g?:'"iiic
(/)
f'E0...
f"5 t1J t f«
DTRPAC Report page 60
The overall analysis was not significant (F5,6 = 3.7, P = 0.07). Indicating that there was no effect of site, and importantly there was no significant trend in adult tortoise density over time (F1,6 = 0.29, P = 0.61; Fig. 4.15).
Lower Virgin River DPS
160
140
120
Fig. 4.15 Plot of adult densities over time 100for the Lower Virgin River Distinct
Population Segment. Error bars are 95% so confidence intervals for the density estimate.
Eastern Mojave and Colorado DPS
The Eastern Mojave and Colorado DPS contains the Chemehuevi, Christmas Tree, Chuckwalla Bench, Chuckwalla Valley, Goffs, Piute Valley, Ward Valley permanent study plots (Fig. 4.14).
The overall analysis was significant (F7,20 = 11.89, P < 0.0001), which was entirely due to the effect of site (F6,20 = 13.46, P < 0.0001). There was no significant trend in density estimates over time (F1,20 = 2.22, P = 0.15; Fig 4.16).
o Q) 60
I40
20
o 80S Exclosure • Beaver Dam Slope
Littlefield Mormon Mesa Overton
• River Mountain
Year
Eastern Mojave and Colorado Desert DPS 300 0 Chemehuevi
Christmas Tree•0 Chuckwalla Bench
(\J Chuckwalla Valley• Piute Valley Ward Valley
250 Q)
200
II j150 Q)
0 Q)
100
I I!! I- I50
0 1975 1980 1985 1990 1995 2000 2005
Year
Fig. 4.16 Plot of adult densities over time for the Eastern Mojave and Colorado Distinct Population Segment. Error bars are 95% confidence intervals for the density estimate.

~::
.E(J)
(J)
'.80~
.c'iiic
(J)
'20f-
-S"'C«
I
•0 Sheep Mountain
140 • Trout Canyon
Q) 120
100
80 Q)
0 Q) 60
!1 Ij I40
20
0
DTRPAC Report page 61
Northeastern Mojave DPS
The Northeastern Mojave Distinct Population Segment contains the Ivanpah, Shadow Valley, Sheep Mountain, and Trout Canyon permanent study plots (Fig. 4.14).
The overall analysis was significant (F4,9 = 26.52, P < 0.0001), which was entirely due to the effect of site (F3,9 = 35.35, P < 0.0001). There was no trend in adult densities as a function of time (F1,9 = 0.06, P = 0.82; Fig. 4.17).
Northeast Mojave DPS 160 0 tvanpah
Shadow Valley
Fig. 4.17 Plot of adult densities over time for the Northeastern Mojave Distinct Population Segment. Error bars are 95% confidence intervals for the density estimate.
1975 1980 1985 1990 1995 2000 2005
Year
4.2.5 Summary of Trend Analyses
From the trend analyses a few key conclusions can be drawn. First, the downward trend in adult tortoise densities in the Western Mojave clearly dominates the analyses, whether considered by dividing the listed range into eastern and western sections (Fig 4.6), or analyzed at the level of the Recovery Unit/DPS (Fig 4.14). There were several Recovery Units that contained too few permanent study plots to allow meaningful analyses and some that could not be analyzed. This speaks to the inadequacy of the historical placement of the permanent study plots in light of the current needs of range-wide monitoring. One caveat to the weighting procedure should be pointed out, however. Low point estimates with high variance are often obtained when few animals are captured or recaptured, so real tortoise declines may have had little effect on some models. For example, in the Northeastern Mojave Recovery Unit (or Lower Virgin River DPS) plot surveys on the Beaver Dam Slope Exclosure in 2000 and the Virgin Slope in 2003 produced too few live tortoises to even produce a population estimate that could be included in the analyses presented here.

DTRPAC Report page 62
This, combined with the fact that many more carcasses were found than in prior surveys, suggests that recent declines have occurred on those plots. Second, the variation in density estimates using study plots does not appear to be less than the variation from line distance sampling. Thus, it is unlikely that plot analyses would have sufficient power to detect the subtle trends that are assumed to be associated with recovery of desert tortoise populations (see Monitoring section).
Finally, the resolution of the analyses that can be conducted with data from permanent study plots is currently limited due to the relatively few plots established, the lack of random placement of existing plots, and the fact that plots were not established to test hypotheses concerning recovery. Newer research and monitoring using spatial analyses requires the more extensive transect sampling promoted by USFWS since 2001. However, a robust monitoring program requires exploring novel analyses, particularly those that can be conducted with existing data (or with little modification of current monitoring methods). New methods could become increasingly important as new hypotheses-driven research and monitoring is required for recovery.
4.3 Spatial Analyses
We conducted several GIS and spatial analyses to explore spatial variation within tortoise populations at different scales on the landscape and in different management units. Spatial analyses were based upon transect data generated for distance sampling and for surveys for total corrected sign (TCS), (see tortoise transect history below). The analyses that we conducted provide both qualitative and quantitative conclusions about the spatial nature of tortoises relative to carcasses, and of the relative presence and absence (viz., failure to detect) of tortoises in DWMAs.
Specific analyses included:
1) An Observation Rates analysis, which compared distance sampling transects in which live tortoises were observed relative to the number of transects in which only carcasses were observed.
2) A Presence/Failure to detect analysis to examine the recent spatial distribution of the presence of live tortoises and carcasses using transect data from surveys of total corrected sign (TCS).
3) Two Conditional Probability of Live Encounter analyses consisting of two approaches with the same goal. These analyses were used to estimate the probability that an observation was a living tortoise as a function of location within the Western Mojave DPS using Line Distance Sampling (LDS) data from 2001.
4) Kernel analyses, which are quantitative analyses in which the distributions of live tortoises and carcasses were smoothed to qualitatively search for areas where distributions of live tortoises and carcasses do not overlap. These non-overlapping areas may indicate areas that have experienced recent die offs or expansions of populations.

DTRPAC Report page 63
5) Nearest Neighbor Clustering, which is a quantitative search for statistical clusters of live animals and carcasses. Analyses included searching the degree of overlap (or separation) of these clusters.
Each of these analyses carries unique limitations concerning the extent to which transect data can be used. For example, Nearest Neighbor Hierarchical Clustering requires that the data be spatially random or regularly distributed. Thus, cluster analysis was restricted to using only LDS data from 2001. Table 4.5 lists data used in our spatial analyses.
These analyses are neither intended to be an exhaustive exploration of all spatial analysis techniques suitable for TCS and LDS data, nor are they an exhaustive attempt to analyze all possible data and/or regions. Instead, our objective is to investigate alternative, and primarily novel, spatial analysis techniques that should be explored further by the subsequent recovery team. There are very likely more types of spatial analyses that could be explored and perhaps better spatial analyses that are more appropriate given the different sources of data that we had available. If a future recovery team is formed, we recommend that all of the data available to them, and future monitoring efforts be explored to the fullest extent possible, as the detection of trends alone (given current sampling precision, see Section 6) seems at this time untenable.
Table 4.5 Summary of data, year, and region used for each analysis. TCS = total corrected sign surveys; LDS = line distance sampling.
Analysis Transect Data Years Region Presence/Failure to Detect TCS, LDS All years West Mojave Observation Rates LDS 2001-2003 Range-wide (excluding Upper
Virgin River) Kernel LDS 2001 Range-wide Cluster LDS 2001 West Mojave Conditional Probability of Being Alive: Re-sampling
LDS 2001 West Mojave
Conditional Probability of Being Alive: Logistics Regression
LDS 2001 West Mojave
4.3.1 History of Desert Tortoise Transects
Total Corrected Sign Transects
There have been several transect methods used to estimate the relative presence of tortoises, especially in the Western Mojave. Prior to, and later in support of, the draft West Mojave Plan (BLM et al. 2003), many transects were surveyed with the goal of measuring tortoise sign. These data typically are referred to as total corrected sign (TCS). Historically, estimates of relative tortoise density have been estimated from the “corrected” sign of tortoises. This correction was based upon comparison of sign counts from areas of unknown density and areas with both sign counts and estimated density.

DTRPAC Report page 64
Transect surveys for TCS transects were conducted in 1998, 1999, and 2001 by the Bureau of Land Management West Mojave Planning team in support of development of the draft West Mojave Plan (WMP) habitat conservation plan and the California Desert Conservation Area Plan amendment (BLM et al.2003). The transect method was developed by Berry and Nicholson (1984) to determine relative tortoise densities. However, the West Mojave Plan planning team restricted the use of the data for various reasons to depict relative “patterns of occurrence” for tortoises (BLM et al. 2003). The transects are typically walked in the Autumn, to allow for greater amounts of tortoise sign (i.e., scat and burrows) to accumulate during the activity season. In addition to observations of scat and burrows, observations of live tortoises and carcasses were also recorded.
For the purposes of analyses conducted herein only the raw sign data were used. In other words, data were not “corrected”, and no density estimates were derived from the data.
Distance Sampling Transects
In February 1995 during a workshop on tortoise monitoring in Reno, Nevada (sponsored by the Biological Resources Research Center at the University of Nevada, Reno), tortoise biologists, statisticians, and monitoring experts reviewed previous methods used to monitor tortoise populations and possible methods to use in the future. At this workshop, the method of “Distance Sampling” (Buckland et al. 1993) was introduced as a way to mitigate the problems of the permanent study plots. At a second meeting in Laughlin, Nevada, in October 1998, the Management Oversight Group (MOG) proclaimed Distance Sampling to be the method that would be used on public lands for estimating density of desert tortoise populations. In June 1999, the MOG endorsed the use of Distance Sampling using program “Distance” as the method to be employed in range-wide sampling of desert tortoise populations. However, the appropriateness of the technique for sampling desert tortoises (especially in areas with low population densities) was, and remains, contentious (see Section 6).
In January 2001 a monitoring workshop was held in Las Vegas, Nevada, to explain the sampling techniques that would be used in 2001 to conduct the first years effort of Line Distance Sampling range wide. This meeting was attended both by agency and contractor personnel. A handbook was prepared by the Desert Tortoise Coordinator and provided in March 2001 to serve as the manual for conducting the distance sampling in 2001. In March of 2001, two training workshops were conducted. Approximately 40 people attended each of the two four-day workshops. These training workshops provided practice for conducting the Distance Sampling technique by using styrofoam tortoise models (styrotorts) placed in natural habitats near Jean, Nevada. This technique had been used as part of an earlier demonstration workshop conducted in October 1998 (Anderson et. al. 2001). Finally, the tortoise transects were sampled range-wide beginning in 2001 by Chambers Group; Kiva Biological Consultants; the Mojave National Preserve; the University of Nevada, Reno; and the Utah Division of Wildlife Resources.

DTRPAC Report page 65
The Utah Department of Wildlife Resources instituted a monitoring program similar to that of the rest of the listed range of tortoises (using transects to monitor tortoises and the distance technique to estimate densities of tortoise populations) at the Red Cliffs Desert Reserve within the Upper Virgin River Recovery Unit (McLuckie et al. 2002). A pilot study was initiated in 1997, and reserve-wide monitoring was initiated in 1998.
For most of the listed range (excluding the Upper Virgin River Recovery Unit) LDS transects (Buckland et al. 2001) were conducted for the years 2001-2003 by the USFWS in support of the range-wide sampling of tortoises within DWMAs. Transects were conducted in the spring, corresponding to periods of high tortoise activity. Data from these transects can be used to calculate density estimates at several scales (e.g., for each DWMA or Recovery Unit; Anderson et al. 2001). Transects for 2001 were randomly selected from a 400m grid within each DWMA with the following exclusions: areas greater than 4,200 ft in elevation, slopes ≥30%, permanent water bodies, playas, major roads, private land, and restricted areas within military reservations.
Density estimates for the 2001 distance sampling for the West Mojave indicate approximate densities of 7.3 tortoises/km2 (95% CI = 5 – 10) for the Fremont-Kramer DWMA and 9.6 tortoises/km2 (95% CI = 7 – 13) for the Ord-Rodman DWMA (Medica pers. comm.). These numbers are relatively comparable to those given for permanent study plots near the same two DWMAs (DTNA Interior for 2002 = 2 tortoises/km2 (95% CI = 1-4), Fremont Valley for 2001 = 5 tortoises/km2 (95% CI = 2-9) (Berry pers. comm.). However, the sampling design for monitoring for most of the range (excluding the Upper Virgin River Recovery Unit) using transects was flawed in such a way that samples from subsequent years (2002 and 2003) cannot be considered representative of the DWMAs as a whole. Therefore, density estimates for 2002 and 2003 were not part of our analyses. The “flaws” in data collected in 2002 and 2003 reflect weaknesses in the system of constructively adapting monitoring each year to increase efficacy. In particular, several processes contributed to problems in 2002 and 2003. The lack of certainty in year-to-year funding of range wide monitoring contributed to an atmosphere of last-minute adjustments to monitoring methods. Adjustments to field techniques often emphasized logistics instead of needs for solid scientific design and statistical validity. Only as part of the DTRPAC process did we learn that adjustments in monitoring methods to improve logistics actually nullify the statistical validity of spatial analyses from those data. This experience reveals the pressing need for a consistent, high-level, scientific advisory capability as part of range wide monitoring overseen by USFWS.
The data provided by distance sampling transects sampled in 2001 and the TCS transects from other years provide a capacious source of information for spatial analyses. For example, we found that the spatial data from both the relative sign and distance sampling transects could be used to understand better the information regarding the declining density estimates of tortoises as provided by the permanent study plots, especially in the West Mojave.

DTRPAC Report page 66
4.3.2 Observation Rates (distance sampling transects; range-wide, excluding Upper Virgin River; 2001-2003).
The objective of this analysis was to ascertain the percentage of transects in which live tortoises were observed in comparison to the number of transects on which only carcasses were observed. Spatial randomness was not required for this analysis, so the data from distance sampling transects for 2001 through 2003 were used (Table 4.6). Although data from corrected sign transects also contain observations of live and dead tortoises, the difference in sampling period relative to distance sampling transects (Autumn for sign transects and spring for distance sampling transects) disproportionately biases against live observations compared to those observed on the distance sampling transects, which could skew the live/carcass ratios. For this reason we limited our analysis to LDS data only.
The percentage of transects with observations of live tortoises and those with observations of carcasses are presented in Table 4.6. Note that high/low percentages should not be confused with high/low numbers of live tortoises or carcasses. For example, 29% of the transects in Fremont-Kramer in 2001-2003 had live tortoises and 67% of transects had carcasses (Table 4.6).
We also calculated the ratio of carcasses to live tortoises for the same areas (Table 4.6, Fig. 4.18). A low ratio (i.e. close to 1) does not mean that there are a low number of carcasses; it instead means that there were approximately equal numbers of carcasses and live tortoises. There was a continuum of ratios ranging from 1.08 for the Pinto to 3.67 for Fenner (Table 4.6).
Table 4.6 Percentages of live animals and dead animals found on LDS transects. The third column is the ratio of the percent of dead animals encountered to the percent of live animals encountered.
DWMA % Live %Dead Ratio Dead/Live Beaver Dam Slope 5 6 1.25 Chemehuevi 41 70 1.71 Chuckwalla 24 46 1.94 Chocolate Mountains 45 68 1.51 DTNA 41 59 1.51 Fenner 20 74 3.67 Gold Butte 8 15 1.88 Fremont-Kramer 29 67 2.29 Ivanpah 16 46 2.87 Joshua Tree 23 33 1.40 Mormon Mesa 21 34 1.58 Ord-Rodman 46 56 1.22 Pinto Mountains 32 34 1.08 Piute-Eldorado 15 48 3.23 Superior-Cronese 29 46 1.60
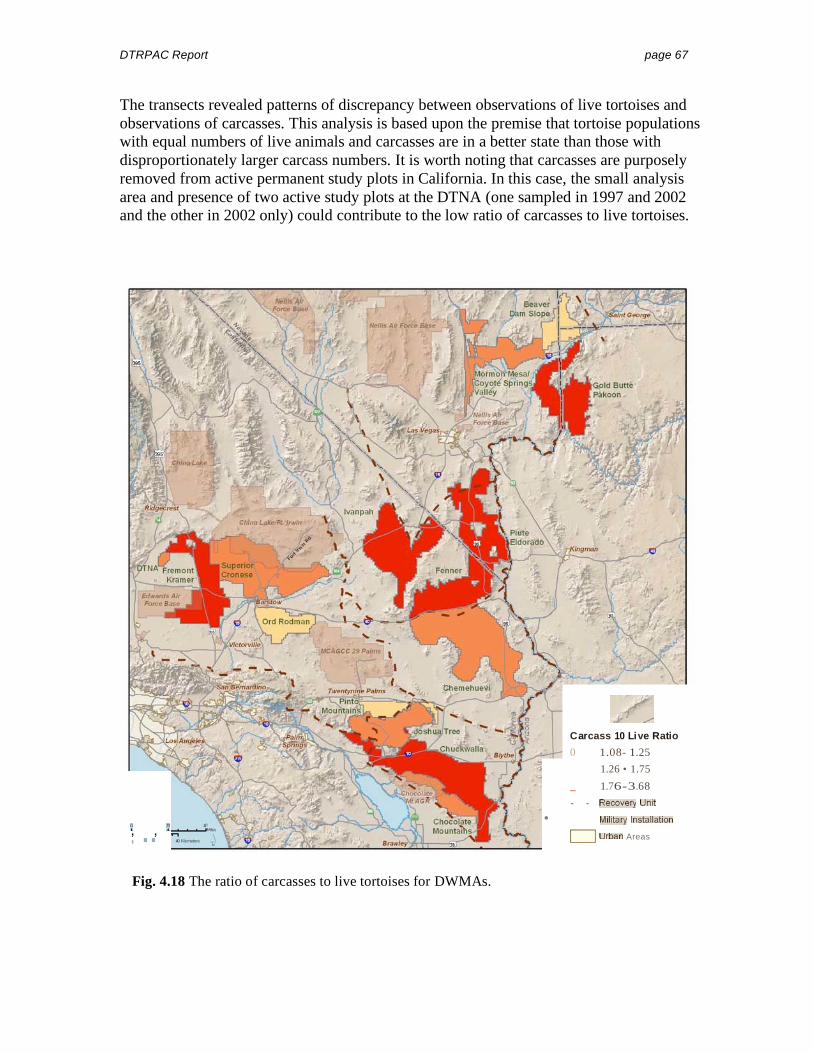
, ,- - Recovery Unrt
MilRary Insta ll at ioo
o Urban
DTRPAC Report page 67
The transects revealed patterns of discrepancy between observations of live tortoises and observations of carcasses. This analysis is based upon the premise that tortoise populations with equal numbers of live animals and carcasses are in a better state than those with disproportionately larger carcass numbers. It is worth noting that carcasses are purposely removed from active permanent study plots in California. In this case, the small analysis area and presence of two active study plots at the DTNA (one sampled in 1997 and 2002 and the other in 2002 only) could contribute to the low ratio of carcasses to live tortoises.
Carcass 10 Li ve Ratio
0 1.08- 1.25
1.26 • 1.75
_ 1.76-3.68
• , , Areas, .. Fig. 4.18 The ratio of carcasses to live tortoises for DWMAs.

DTRPAC Report page 68
4.3.3 Presence/Failure to Detect (total corrected sign and distance sampling transects, Western Mojave, all years).
This analysis graphically assesses the recent spatial distribution of live tortoises and carcasses, but is not a statistical analysis of this distribution. Although burrows have been shown to be significantly correlated with live tortoises (BLM et al. 2003), we restricted our analysis of presence or “failure to detect” tortoises on transects with observations of live tortoises or scat. We used the presence of scat as an indication of live tortoises in a given area when live tortoises were not actually observed. This method assumes that where there is scat, there must have been a tortoise (recognizing that scat can be moved by wind, water, or other animals) within a relatively short time frame (assuming scat degradation rates of 1-2 yrs).
This analysis was restricted to the Western Mojave for two reasons. First, the DTRPAC had access to spatially referenced distance sampling data for the West Mojave, but not for other areas. Second, though the DTRPAC had access to distance sampling data throughout the entire listed range of the desert tortoise, an analysis of distance transects alone would not have been comparable to the combined transect data for the West Mojave due to the disparity in their sampling periods.
All transects were assigned to one square mile analysis grids. Each grid cell was assigned a different color based on the composition of the observations of tortoises, scat, and carcasses found within the grids (Fig. 4.19).
The presence/”failure to detect" analysis illustrates patterns of 1) tortoise or scat presence, 2) tortoise or scat and carcass presence, 3) carcasses only, and 4) failure to detect either tortoises or scat or carcasses. Areas containing tortoises included the DTNA, the southern portions of Fremont-Kramer, south and east Superior-Cronese, and most areas of Ord-Rodman (Fig. 4.19). Large sections of Superior-Cronese have not been recently sampled (as near as we can determine). It is likely that many of these areas have been sampled by other research and/or compliance projects, however data from these areas were not available for analysis by the committee. Maintenance of a master desert tortoise location database would enhance the ability to track areas of tortoise and carcass occurrence.

Edwards AirFo",,,Sas,,
MCAGCC29j>aI",s
DTRPAC Report page 69
Fig. 4.19 Presence/”Failure to Detect” tortoises and carcasses for combined distance sampling (2001-2003) and total corrected sign (1998, 1999, and 2001) transects. Dark green areas are those in which a tortoise and/or scat were present. Light green areas are those in which a tortoise and/or scat and carcasses were present. Red areas indicate only carcasses were present. White areas indicate no tortoises, scat, or carcasses were found. Light tan areas indicate no distance sampling or total corrected sign transects were conducted.

DTRPAC Report page 70
4.3.4 Conditional Probability of Live Encounter (distance sampling transects, Western Mojave, 2001).
Resampling
For this analysis the Western Mojave was divided into a grid consisting of 18 cells. Using the 2001 LDS data, the proportion of tortoises that were alive (i.e., live tortoises/[live + dead tortoises]) was then calculated for each cell. A test statistic was then derived for each cell, which consisted of the observed proportion of tortoises that were alive in each cell minus the proportion calculated from all cells combined (0.284).
The test statistics for each of the 18 cells (Table 4.7) were tested for significance using a randomization method. To produce a randomized set of data the 609 transects were randomly reallocated to the 18 cells. This was done 10,000 times. The p-value for the statistic from the ith cell was then the proportion of times that the randomized sets of data gave a value as far or further from zero than the observed test statistic. In addition, a 19th statistic was calculated, which consisted of the maximum of the absolute values of the statistics for the individual cells. This was then used to calculate an overall test of differences between the cells and for all of the data.
As shown in Table 4.7, there are significant results for cells 6, 7, 12, and 16, and for the maximum statistic. There is also a nearly significant result for cell 15. It is more compelling to view the data graphically. Distinct areas, as defined by groupings of points with the same color with lower (red) or higher probabilities (green) of live encounters are clearly identifiable in Fig. 4.20.
Table 4.7 Observed ratios of live to dead tortoises. The P values indicate bins of transects in which the ratios were different from that expected at random. The sign of the observed value indicates the direction of the difference.
Bin Observed Value P-value Bin Observed Value P-value 1 0.08 0.45 10 0.09 0.09 2 -0.13 0.24 11 0.01 0.85 3 0.10 0.47 12 -0.14 0.04 4 0.06 0.30 13 -0.06 0.56 5 0.10 0.47 14 0.05 0.43 6 -0.28 0.002 15 -0.21 0.07 7 0.29 0.008 16 0.52 0.001 8 0.03 0.75 17 0.05 0.54 9 0.05 0.54 18 0.22 0.09
Max 0.52 0.004

Ed",~m, Ai, Fo
wI
"p;-,;.;-
~
P.'",~
• E ,oo<llle, ..Ave"' lIe Probability U.....
"'''''rage
L""""" """,rageHigher Ill"" __age
D~D Urban AreBs
Mil~ary Ins\allalloo
DTRPAC Report page 71
• B
(
C ...
•• •• •••
AGCC
.01 ,
•
• than •
_
Fig. 4.20 Results from the resampling analysis - Areas depicted in red are points in bins 6 and 12, which had lower than average probabilities of live encounters; green points are bins 7 and 16, which had higher proportions of live animals. Points in all other bins are blue in color.
Logistic Regression
Another analysis was possible based upon logistic regression. The regression calculates the probability of a tortoise being live at a distance E km east and N km north from easting 414493 and northing 3825771 and is given by
P(E,N) =exp(ß0 + ß 1E + ß 2N + ß 3E.N + ß 4E2 + ß 5N2)/{1 + exp(ß 0 + ß 1E + ß 2N + ß 3E.N + ß 4E2 + ß 5N2)}.
Data for this analysis were restricted to transects on which both live and/or dead tortoises were observed. Each of these transects then provided one observation on the number of

DTRPAC Report page 72
tortoises that were live in a sample of n tortoises. It is possible that higher order polynomial terms are needed in the equation to describe better the spatial changes in the probability of a tortoise being live. This was not investigated.
The following analysis of deviance shows that the model accounts for a significant amount of the variation in the data (Tables 4.8 and 4.9). The mean deviance is much larger than one, indicating that part of the variation in the data is not properly accounted for. This confirms that it would be worth investigating adding higher order polynomial terms into the equation. A kriging surface mapping the conditional probability of being alive in 2001 are presented in Fig. 4.21.
This analysis asks the question, if a tortoise is found on a transect, what is the probability that it is a live tortoise? The region in the northern portion of the Fremont-Kramer DWMA and the northwestern portion of the Superior-Cronese DWMA had noticeably lower probabilities of encountering a live tortoise relative to other portions of the DWMAs.
Table 4.8 Statistical table for the logistic regression analysis.
df Mean deviance
Deviance Deviance ratio
Approx chi pr.
Regression 5 47.8 9.56 9.56 <.001 Residual 300 820.5 2.74
Total 305 868.3 2.85
Table 4.9 The estimated coefficients for the logistic regression model.
Estimate s.e. t(*) t pr. Constant 1.966 0.63300 3.11 0.002 E -0.02214 0.00506 -4.37 <.001 N -0.02654 0.00979 -2.71 0.007 EN 0.0000791 0.0000251 3.15 0.002 E2 0.0000480 0.0000133 3.61 <.001 N2 0.0000348 0.0000427 0.82 0.414

•
ErJ ...~trl< Air FM"
Ch/mt "'-H Fl ...
•
'",",
DTRPAC Report page 73
• B.
• AGee
!I In
Fig. 4.21 Results from the logistic regression analysis. Cooler colors indicate higher probabilities of encountering a live tortoise, and warmer colors indicate a lower probability.
4.3.5 Kernel Analyses (distance sampling transects, range-wide, 2001).
The analyses presented above are useful for comparisons among DWMAs, but do not indicate where within an individual DWMA one would be more likely to find live tortoises. The kernel, cluster, and conditional probability of being-alive analyses presented below however, do indicate where within a DWMA one would expect to find live tortoises. This type of within-DWMA spatial analysis requires that the sample transects be significantly spatially random or regularly distributed. As such (for reasons given above), only the 2001 LDS data were used.

DTRPAC Report page 74
This analysis used adaptive kernels (frequently used for home range analyses) to smooth the distributions of the observations of live tortoises and carcasses on the distance sampling transects to look for lack of overlap in regions of these two smoothed distributions. Data were separated into groups of adjacent DWMAs that had similar numbers of transects per area. Observations from these groups were separated into two datasets, one for live observations and one for carcass observations. Kernel analyses were conducted for both the live tortoises and carcasses for each of the groupings. The kernels were created using the Animal Movement Extension (v 2.04b, Hooge and Eichenlaub 2001) for ArcView 3.2 (ESRI, Redlands, CA). The smoothing factor (H) was reduced to a value below that of the default to constrain the kernels to areas that were close to the boundaries of the sampled areas. These smoothing factors were taken to be the same for the carcass and live kernels for each area. Separate kernel analyses were conducted for the following areas which are generally denoted by the DWMAs included therein: 1) Upper Virgin River (Fig. 4.22); 2) Beaver Dam Slope/Mormon Mesa/Gold Butte-Pakoon (Fig. 4.23); 3) Coyote Springs (Fig. 4.24); 4) Piute-Eldorado Valley (Fig. 4.25); 5) Chuckwalla (Fig. 4.26); 6) Joshua Tree/Pinto Mountain (Fig. 4.27); 7) Chemehuevi (Fig. 4.28); 8) Ivanpah (Fig 4.29); and Fremont-Kramer/Superior-Cronese, and Ord-Rodman (Fig. 4.30).
The kernel analyses revealed several areas in which the kernel estimations for live tortoises and carcasses did not overlap. The pattern of non-overlapping kernels that is of greatest concern are those in which there were large areas where the kernels encompassed carcasses but not live animals. These regions represent areas within DWMAs where there were likely recent die-offs or declines in tortoise populations. This pattern occurred in half of the areas for which kernel analyses were conducted (Figures 4.24, 4.25, 4.29, 4.30). It should be noted that a few of these areas had relatively few transects (Fig. 4.25, 4.29), and that the data underlying all of these results come from only one year of sampling (2001).
Kernel analyses for the Upper Virgin River (Fig. 4.22), Chemehuevi (Fig. 4.28), Joshua Tree/Pinto Mountain (Fig. 4.27), and Chuckwalla (Fig. 4.26) DWMAs had distributions of live and dead animals that were more like what we expect to occur in “normal” tortoise populations, in that carcasses occurred in the same areas as live animals and not in extensive areas absent of live animals.

lOS
vlive OilsefvaHon
Observahon
)( 2001
0 95%
Live
o 2001 Sludy Bound"';..
Militury 1""'. 11 .1;00
o Areas
DTRPAC Report page 75
• 2001
• 2001 Ca rcass
No Observation
2001 Carcass Probability
2001 Probability _ 95%
lDS
i. Urb."
Fig. 4.22 Kernel analysis for the Upper Virgin River DWMA. The 95% kernel for live animals is indicated by the green polygon; the 95% kernel for carcasses is indicated by the red outlined polygon. Transects that were sampled for which no tortoises (live or dead) were found are indicated by the letter X on the map.
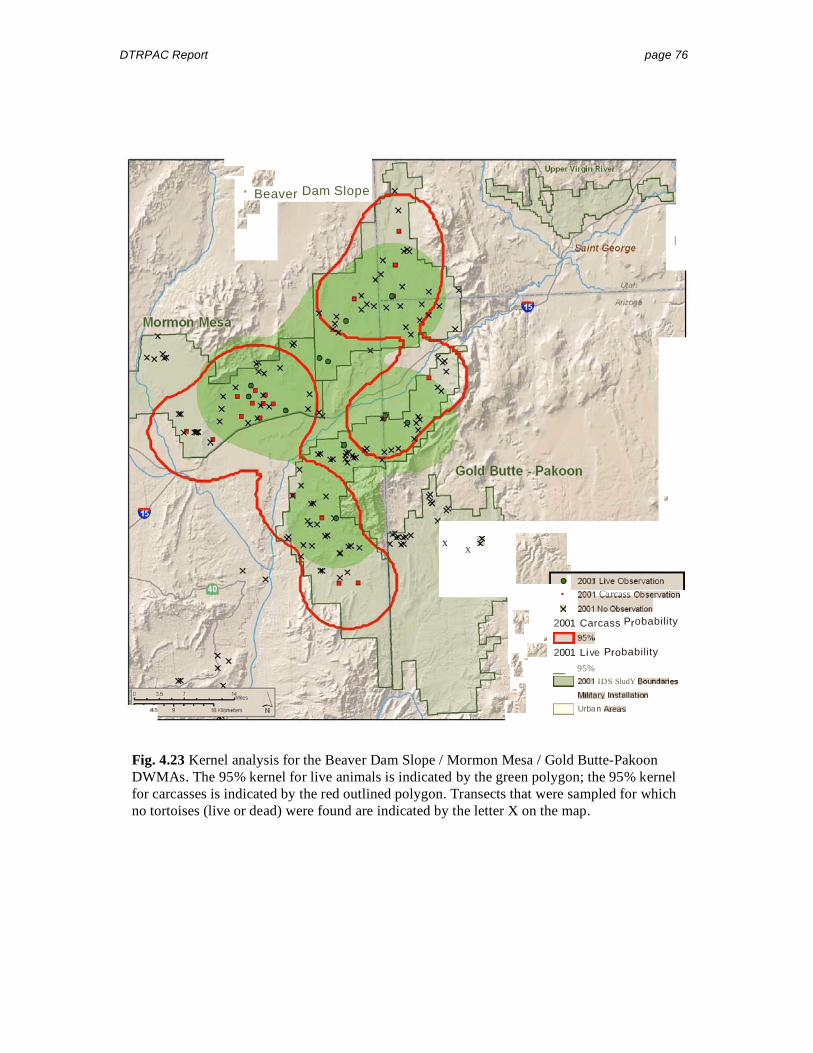
.,
-~ "I
I" '")'11
'fI'
*
,
~'~~';/">. ~;;;;;;;;;;;:j..,~ O!l$efV~hooLive
Observshon~OOl
~l NOOb_ioo)(l/
~. 0 '""):J!;J
t. . Bound"';..
~ 0 2001
_'1 Military Insto ll el,,,.,
if' 0 Areas
DTRPAC Report page 76
• Dam SlopeBeaver
x x
I
2001
• Ca rcass
P obability2001 Carcass r
P bability2001 Live ro
_ 95% lDS SludY _
Urban
Fig. 4.23 Kernel analysis for the Beaver Dam Slope / Mormon Mesa / Gold Butte-Pakoon DWMAs. The 95% kernel for live animals is indicated by the green polygon; the 95% kernel for carcasses is indicated by the red outlined polygon. Transects that were sampled for which no tortoises (live or dead) were found are indicated by the letter X on the map.

fiMf/sA,rForu8ase
"" .:._-
"/
M ormonMe.a
rLive Obse<Vah""
Clrc... Ob.e<vation
2001 Qb..,rnr""
Carcass
C] 95%
o 2001 Bound"';..
Military 1,,"'" 11 81;00
o Areas
DTRPAC Report page 77
2001 L.ive Probability
_ 95% lDS Sludy
. , Urban
• 2001
2001
X No
2001 Probability
Fig. 4.24 Kernel analysis for the Coyote Springs Valley DWMA. The 95% kernel for live animals is indicated by the green polygon; the 95% kernel for carcasses is indicated by the red outlined polygon. Transects that were sampled for which no tortoises (live or dead) were found are indicated by the letter X on the map.
J I

-,•
LIVe Observauon
1001 Carcass ObseNalion
x No 0!>w<v3~
~
D '"
. ",':rr,' 0 2001 Bounda ri...'. Bull~h" c,·,."~I Military
o Urban
DTRPAC Report page 78
Piute - Eldorado
\
• 2001
•
2001
2001 Carcass Probability
•
( •
2001 Live Probability
LOS Study
Installatlon" Areas"
Fig. 4.25 Kernel analysis for the Piute-Eldorado Valley DWMA. The 95% kernel for live animals is indicated by the green polygon; the 95% kernel for carcasses is indicated by the red outlined polygon. Transects that were sampled for which no tortoises (live or dead) were found are indicated by the letter X on the map.

Live ObSefVlltion
2001 Carcass Observation
~lNo~~
02001 Study Ba.lndari es
Inslal laHon
Chaco/MeMI.
Cenrro
Si Se
o Areas
DTRPAC Report page 79
AGR
\ Ion
• 200 1
7B •
X
2001 Carcass Probability
0 95% 2001 Live Probability
_ 95% E/
LOS
Military
Urban
Fig. 4.26 Kernel analysis for the Chuckwalla DWMA. The 95% kernel for live animals is indicated by the green polygon; the 95% kernel for carcasses is indicated by the red outlined polygon. Transects that were sampled for which no tortoises (live or dead) were found are indicated by the letter X on the map.

2001 LIIre Observation
2001 Observation
2001 No Ol>~rvalion
CJ 95%
......._--1_95%
02001 Study Ba.lndaries
Inslallalion
o Areas
ITwenlynlne
•
"Pi rft~Mounta'lns
~ J.--"
DTRPAC Report page 80
, Palms
, .
XX
X X .
X XX XX
X
X X
•
• Carcass
x
2001 Carcass Probabili ty
2001 L. ive Probabi l ity
LOS
Military
Urban
Fig. 4.27 Kernel analysis for the Pinto Mountain and Joshua Tree DWMAs. The 95% kernel for live animals is indicated by the green polygon; the 95% kernel for carcasses is indicated by the red outlined polygon. Transects that were sampled for which no tortoises (live or dead) were found are indicated by the letter X on the map.

!
Live Observation1001 ObseNalion
x No~a~
0 95%
_ 95%0 2001 Bounda ri...
Mil itary
o Urban
8ul/Mad
". '1<•
~
~"x~
#
,
~~!4~.t
DTRPAC Report page 81
I
• 2001 • Carcass
2001
2001 Carcass Probability
2001 live Probability
LOS Study
Installatlon
;
Areas
x
elll'
o
• 0 •• 0 • 0
0 ••0 0• 0
• 0 0 '
0 0 0 0
0 0 .. 0 • 0
0 • 0 -..•0 0 •• •
I° 0 •0
0 0
..
Pinto-Mo untaIns
Fig. 4.28 Kernel analysis for the Chemehuevi DWMA The 95% kernel for live animals is indicated by the green polygon; the 95% kernel for carcasses is indicated by the red outlined polygon. Transects that were sampled for which no tortoises (live or dead) were found are indicated by the letter X on the map.

Piut~ Eldorado
o Urban
Live Observation1001 ObseNalion
x No~a~
0 95%
_ 95%
~-------lD 2001 Bounda ri...
Mil itary
•
Ivanpat,l...",
•, •• ,
~.,
>- Fe ",,~r
.~
, Ch"mehu~vi
'" "
i
DTRPAC Report page 82
Sea hi hr
I
• 2001 • Carcass
2001
2001 Carcass Probability
'.
• ,
•
_
2001 Live Probability
LOS Study
Installatlon
Areas
Fig. 4.29 Kernel analysis for the Ivanpah DWMA. The 95% kernel for live animals is indicated by the green polygon; the 95% kernel for carcasses is indicated by the red outlined polygon. Transects that were sampled for which no tortoises (live or dead) were found are indicated by the letter X on the map.

'" ~
UVf!' Observll tionCllrclIss
Observ<ltlonsx~ '/~(11 CJ 95~
~j~r:~:(J J i j :-., ;et'~. :JG!C" ,,%
~'W;, 'ilv '" ;:'" 0;00""""'".-'''"''~~ Miftal)' InstalinUal
o Areas,._-"
EcJwanisForr:tB.1s...
~---~-~'L' . '"
DTRPAC Report page 83
o
0o e
Observation • 2001• 2001 _
2001 No P bability2001 Carcass ro
. .
/' 2001 Liv l! Pro ba bil ity _
Urban
(
DTNA
•
AI'
o· . eO
Fig. 4.30 Kernel analyses for Fremont-Kramer / Superior-Cronese, and Ord-Rodman DWMAs. The 95% kernel for live animals is indicated by the green polygon; the 95% kernel for carcasses is indicated by the red outlined polygon. Transects that were sampled for which no tortoises (live or dead) were found are indicated by the letter X on the map.

DTRPAC Report page 84
4.3.6 Nearest Neighbor Clustering (distance sampling transects, Western Mojave, 2001).
Nearest Neighbor Hierarchical Clustering analysis was used to identify clusters of live tortoises and carcasses within the Western Mojave. These analyses were performed using CrimeStat II (Levine 2002). Spatial randomness of distance sampling data (2001-2003) and total corrected sign data (1998, 1999, and 2001) was tested. The tests included analysis of each year, all years, and both. All analyses were using the ArcView extension Animal Movement (Hooge and Eichenlaub 2001). The results of these tests confirmed that distance sampling transects in 2001 were randomly distributed. However, all other years and all combinations of years and methods were statistically spatially clustered. Thus, only data from 2001 were analyzed. As with the kernel analyses, where one finds live animals one would expect to find carcasses at some level, although the draft West Mojave Plan (BLM et al. 2003, Appendix L) reported that carcass counts were not correlated with transect live tortoises counts. However, our analyses were conducted for presence and absence and not for densities. Where one finds carcasses and no live animals there is cause for concern, suggesting recent die-offs in these areas.
The Nearest Neighbor Hierarchical Spatial Clustering routine used by CrimeStat is a constant-distance clustering routine that groups points together on the basis of spatial proximity (Levine 2002). The threshold distance (i.e., the confidence interval around a random expected distance of a pair of points) was set to 0.95 (i.e., fewer then 95% of the pairs could be expected to be as close or closer by chance). Only pairs of points that are closer together than this threshold distance are grouped together as clusters. The minimum number of points required to create a cluster was set to 5. The size of the ellipse around the cluster was set to one standard deviation, which would cover about 65% of the points.
The Cluster analysis revealed numerous patterns of statistically significant live and carcass clusters, and these clusters did not overlap in several areas. These include; central Fremont-Kramer, western Superior-Cronese, and numerous areas within the Western Mojave (Fig. 4.31).

,QO •,.
""",,0••~.
<tt:/P '
DTRPAC Report page 85
• • 0
• I
.
•• •• •
•
0
•• ••
0
•
,.'. •
0DTNA 0
•• • 0 0
0
Fig. 4.31 Nearest Neighbour Hierarchical Cluster analysis for the Western Mojave. Green areas are clusters of living tortoises; red outlines are clusters of carcasses.

DTRPAC Report page 86
4.4 Implications of Population and Spatial Analyses
The spatial analyses provided in this report are examples of the kinds of analyses that should be considered by a possible future recovery team and by the science advisors to the USFWS. We recommend that similar analyses be conducted for the rest of the listed range. We also recommend analyses with additional years of data when suitable data become available. Time and data limitations have prevented the DTRPAC from completing all possible analyses for this report.
The Western Mojave (Recovery Unit/DPS) has experienced marked population declines over time (Fig 4.6). This was indicated in the original Recovery Plan and continues today. Spatial analyses of the West Mojave show areas with increased probabilities of encountering dead rather than live animals (Fig. 4.18, 4.19, 4.20, and 4.21), areas where kernel estimates for carcasses exist in the absence of live animals (Fig. 4.31), and extensive regions where there are clusters of carcasses where there are no clusters of live animals (Fig. 4.31). Collectively, these analyses point generally toward the same areas within the West Mojave, namely the northern portion of the Fremont-Kramer DWMA and the northwestern part of the Superior–Cronese DWMA. Together, these independent analyses, based on different combinations of data, all suggest the same conclusion. The management strategy and implementation of recommended management actions over the last decade in West Mojave Recovery Unit have not slowed the decline of tortoise populations, and tortoise numbers are plummeting. Indeed the Draft West Mojave Plan (WMP) points out problems within the same areas highlighted in our analysis. For example, despite historically high densities of tortoises (BLM et al. 2003, map 3-7) within some portions of the West Mojave Recovery Unit, analyses in the West Mojave Plan indicate recent die offs (BLM et al. 2003, map 3-12) and higher-than-average sign counts (BLM 2003, map 3-8) in the same regions as presented by our independent analyses of the data.
Data are not currently available (i.e., they either do not exist or are not easily accessible) with the same detail for most of the range of desert tortoises. Nevertheless, it is possible to compile and digitally catalog corrected sign data for other recovery units within the listed range, but not without considerable time and money. We had additional historical data for permanent study plots and recent data from distance sampling surveys for these regions, and they were similarly analyzed but not reported. Kernel analyses of DWMAs within other Recovery Units and Distinct Population Segments also show areas of non-overlapping carcass and live animal distributions (e.g., Fig. 4.24, 4.25, 4.29 and 4.30) and this signals reason for concern for these areas. Ivanpah (Fig. 4.29) and Piute–Eldorado Valley (Fig. 4.25) contained study plots that were analyzed in the East Mojave Recovery Unit analysis (Fig. 4.6). While there was no overall statistical trend in adult density over time, the 2000 survey at Goffs and the 2002 survey at Shadow Valley indicate low densities of adult tortoises relative to earlier years. Unfortunately there are no data in the latter years for all five study plots within this recovery unit, and therefore, while there is no statistical trend in adult densities, we cannot conclude that tortoises have not experienced recent declines in this area. The probability of finding a carcass on a distance sampling transect was considerably higher for Ivanpah, Chemehuevi, Fenner, and Piute-Eldorado

DTRPAC Report page 87
which make up the Eastern Mojave Recovery Unit and portions of the Northeastern Mojave and Eastern Mojave/Colorado Desert DPSs (Table 4.6).
The kernel analysis for the Piute-Eldorado Valley (Fig 4.25) indicated large areas where there were carcasses, but no live animals were found. For this entire area in 2001, there were 166 km of transects walked, and a total of six live and 15 dead tortoises were found, resulting in a live encounter rate of 0.04 tortoises per km for this area. This encounter rate was among the lowest for that year for any of the areas sampled in the listed range. Analyses of the study plots for the Eastern Mojave Recovery Unit (Fig. 4.6) and the East Mojave and Colorado DPS (Fig. 4.16) do not indicate significantly declining densities of adult tortoises prior to 1997. The kernel analysis for the Ivanpah DWMA also indicates large areas where only carcasses were found and smaller areas where live animals occurred (Fig. 4.29). Analyses of the study plots for the Lower Virgin River DPS (Fig. 4.19) and the Eastern Mojave Recovery Unit (Fig. 4.6) do not indicate significant declines in adult density over time (although note the apparent declines on the Beaver Dam Slope Exclosure and Virgin Slope plots noted in Section 4.2.5).
The Coyote Springs Valley DWMA is included in the Lower Virgin River DPS plot analysis. While the kernel analysis for this region showed areas where the distributions of carcasses and living tortoises do not overlap (Fig. 4.24), densities of adult tortoises for the region do not show a statistical trend over time (Fig. 4.6). Thus, while there may be a local die-off occurring in the northern portion of this DWMA, this does not appear to influence the overall trend in the region as interpreted by study plot data. However, as stated above, the data for permanent study plots for this region were discontinued after 1996. Thus, if there have been recent declines in numbers, they are not reflected in our analyses of study plots. Nevertheless, we did not see large regions of non-overlapping carcass and live tortoise kernels in the regions adjacent to the Coyote Springs Valley DWMA (Fig. 4.24). The probability of finding either a live tortoise or a carcass was relatively very low for Beaver Dam Slope and Gold-Butte Pakoon and moderately low for Mormon Mesa/Coyote Springs Valley (Table 4.6) all within the Lower Virgin River DPS.
The Eastern Colorado Recovery Unit contained only two study plots, and analyses of adult densities over time indicate that there may be declines in this area (Fig. 4.12). From inspection of the density data, it appears that this is likely due to declines in adult density for the Chuckwalla Bench plot, but not the other plot (Fig. 4.12). The kernel analysis of this area shows that the distributions of the living tortoises and carcasses overlap for most of the region sampled by LDS (Fig. 4.26). The Chuckwalla Bench study plot is outside of the distance sampling study area, and this creates a problem in evaluating what may be occurring in that area of the DWMA. However, the few transects walked in that portion of the DWMA yielded no observations of live or dead tortoises. This illustrates our concern for drawing conclusions from areas represented by too few study plots and leaves us with guarded concern for this region. The percentage of transects with live animals was relatively high for most DWMAs within the Eastern Colorado Recovery Unit (Table 4.6). In addition, the ratio of carcasses to live animals was low within this recovery unit relative to others (Fig 4.18).
DTRPAC Report page 88
Desert tortoise populations defy definition in terms of population dynamics even after 30 years of data from a wide variety of studies. In particular, the existing paradigm and the original Recovery Plan treated desert tortoise population dynamics and planned for recovery as individual populations. However, the temporal dynamics revealed in existing data and theory, and the clear indication that populations of tortoises respond remarkably slowly, suggest that this original paradigm needs re-evaluation. Specifically, it is not known if desert tortoises have evolved to exist in single large populations or in metapopulations. The prescriptions for recovery in the Plan were for individual populations and assumed that preserving large blocks of habitat and managing threats in that habitat would be principally all that would be necessary to recover the species. However, that original paradigm, and the prescriptions made within that paradigm, may be wrong and dangerously misleading and ineffective. Consider, for example, that existing data have revealed population crashes occurring asynchronously across the range. There are reports that some populations, which have crashed previously, have subsequently increased in population density. Additionally, everywhere where populations have been dense, those populations have crashed. This suggests that density-dependent mortality occurs in desert tortoise populations, and that population dynamics may be asynchronous.
These characteristics indicate that tortoises may exist in a classic metapopulation (Hanski, 1999, Levins and Culver 1971, Levins et al. 1984), and this should portend profoundly different prescriptions for recovery. In particular, if desert tortoises have historically existed in metapopulations, then connections among habitat patches are a necessary part of conservation prescriptions. Additionally, habitat suitable for tortoises, but without tortoises, should be regarded as equally necessary for recovery. Assessing the state of a metapopulation (including the long-term persistence of the species) will be entirely different and needs to be the subject of future research and consultation. Long-term persistence cannot be determined from tortoise density or tortoise numbers alone, but assessment must include the complexities of metapopulation dynamics and the habitat characteristics that promote metapopulation dynamics (habitat connectivity through inefficient corridors (i.e., partial connectivity), asynchrony of subpopulation dynamics, several separate habitat patches, and others). Some of the characteristics of proper metapopulation function may already have been obviated by proliferation of highways, and habitat fragmentation due to satellite urbanization. Thus, management may require artificially facilitating metapopulation processes such as movement among patches. Insofar as having the correct paradigm is central to recovery success, this is a critical area requiring attention by science consultants to the USFWS.
Plot and Spatial Analysis Recommendations
1. There were several recovery units and proposed DPSs that contained too few permanent study plots to be analyzed either with any power, or at all. If study plot sampling is to continue, it would be better if there were enough study plots to represent the different scales of management areas. As a study plot is in itself only a sample, and not representative of an entire area, it would be beneficial to have several plots within each area upon which future analyses are to be conducted, for example a DPS, or even for DWMAs within DPSs.

DTRPAC Report page 89
2. If permanent study plots are to be continued (see, for example, recommendations in Section 3), then there should be some agreement among the surveying agencies to share the data for the greater good of the tortoise species. Permanent study plots played a key role in this committee's interpretation of the current status of tortoise populations, but it is possible that some of the conclusions reached as a result of our analyses could be different had additional years of data been available. However, the trend from the Western Mojave is a solid conclusion that cannot be disputed.
3. We found the exploration of new analyses, especially those that can be conducted with existing data or with little modification of current monitoring methods, to be extremely valuable toward understanding the status of tortoise populations and the inadequacies of current monitoring. These types of analyses should be part of any future reporting on status and trends of desert tortoise to the MOG, DMG, and/or Congress. These kinds of analyses should be prepared by a body like the recommended Desert Tortoise Recovery Office discussed in Section 7.3 of this report, so that regular advice can provide a means towards improved monitoring.
4. The paradigms of population/metapopulation dynamics need to be re-evaluated. This may require explicit experimental research to dissect the driving ecosystem processes important to long-term persistence of desert tortoise populations or metapopulations.
4.5 Status and Trends of Habitat and Environmental Setting for Tortoise Populations
An efficacious monitoring program should be multidimensional, including monitoring of populations, monitoring the extent and condition of habitat, and monitoring threats to tortoises. Monitoring habitats and threats has not previously been part of the protocols for monitoring the desert tortoise, so analyses of past efforts is not possible. However, it is possible retrospectively to provide examples of how such analyses can be conducted. We present the examples below as “case studies.”
4.5.1 Road Case Study
Habitat monitoring considers variables related to the physical environment of the desert tortoise. These variables can include natural processes, such as climate and weather, and anthropogenic threats, such as presence of roads, livestock grazing, urbanization, etc. In this case study, we explore the temporal distribution of routes (i.e., roads) inventoried between the mid 1980s and 2001 and the co-occurrence of above average vehicle impact areas with higher density TCS and die-off regions as presented by the West Mojave Plan (BLM et al. 2003).

DTRPAC Report page 90
Roads are conduits by which humans come into contact with tortoises. Hence, understanding the relationship between the presence of roads and tortoise population dynamics may be important to formulating desert tortoise recovery strategies. The original Recovery Plan recommended: 1) prohibiting vehicles from driving off roads; 2) restricting proliferation of new roads; 3) closing vehicle access to all but designated routes; and 4) implementing emergency closures of unpaved roads and routes as needed to reduce human access and disturbances in areas where human-caused mortality may have caused negative population trends. The plan also specifically highlighted the need to halt unauthorized ORV use in the Fremont-Kramer DWMA (USFWS 1994, Table 4.3).
The comparisons made in this case study use the best data available to the DTRPAC. However, we are aware that both road and tortoise data are imperfect, thus we identify possible scenarios resulting from these imperfections and geographic regions within the Western Mojave that yield contradictory relationships between the presence of roads and tortoise sign.
The following data were used in this case study: 1985-87 (Fig. 4.32) and 2001 routes (Fig. 4.33) provided by the BLM. Above average vehicle impact areas, areas identified as higher then average sign counts, and areas with recent die-offs (Fig 4.34) were taken from the West Mojave Plan. In the following section, inventory and any of its variants, is used to represent routes (i.e., roads) without dealing with official designation (i.e., open, closed, undetermined, etc.). Different methods were used by the BLM to inventory routes between 1985-87 and 2001. In particular, Global Positioning System (GPS) and Geographic Information Systems (GIS) were used for locating and mapping roads in 2001 but not in 1985-87. Thus, the 2001 inventory is likely to be more detailed and more accurate than the initial 1985-87 inventory. Despite this discrepancy, the data used for this case study represent the best available data, data for which management and policy decisions have been made, and data for which management and policy decisions are being made currently (e.g., WMP and West Mojave Route Designation).
The 2001 inventory of roads (Fig. 4.33) indicates that a higher density of roads currently exists within DWMAs in the West Mojave than was documented in 1985-87 and also that more roads are currently documented than were documented in 1985-87 (Fig. 4.34). One explanation for the increase in road density in the Western Mojave is that the number of roads increased during this period. Based on the increased human population in the western Mojave during this time, an actual increase in roads is a plausible and likely explanation for the increase in inventoried roads. This is especially likely considering the popularity of vehicle-based recreation in the desert leading to the legal and illegal creation of single and two-track routes. However, an important alternative explanation exists. It is plausible and likely that at least some of the recently mapped roads are historic rather than newly created, especially considering the effectiveness of GPS-based mapping and increased survey effort in recent years. This alternative hypothesis is important because arithmetically it is possible that the rate of discovery of established roads (better technology and greater effort) exceeded the rate of road closures (management action) and resulted in more apparent roads. It is possible that the question of recent road creation could be resolved by analyzing consistently collected data such as satellite and aerial surveys that documented the presence

DTRPAC Report page 91
or absence of roads in the Western Mojave from 1987-2001.The DTRPAC encourages management agencies to consider performing this analysis.
The tortoise population dynamics information for the western Mojave also has caveats. In particular, the “higher density TCS areas” may have used burrow counts as well as sightings of live tortoises and tortoise scats. Hence, it is possible that higher than average TCS may be inflated relative to other surveys techniques. This is an example of the difficulties that arise when data are inconsistently collected, named, and reported.
The number of inventoried routes increased significantly between 1985-87 and 2001 (Fig. 4.32 and 4.33). The spatial location of open routes between 1985-87 and 2001 has changed significantly (Fig 4.35 and 4.36). The red lines in Fig. 4.35 represent 2001 officially designated open routes that were not similarly designated as such in 1985-87. In some cases these routes may have existed in 1985-87 but failed to be inventoried, or if inventoried they were not designated as open. The blue lines in Fig. 4.36 represent 1985-87 officially designated open routes that were not officially designated as open in 2001. In some cases these routes may no longer exist, they exist but were not inventoried in 2001, or they may still exist but were not officially designated as open in 2001.
We identified 6 regions within the western Mojave roads case study that each indicate a different potential relationship between roads, higher then average TCS densities, and tortoise die-off regions (Fig. 4.34). We identify tortoise die-off regions within and outside vehicle use areas (Fig. 4.34, regions A and B, respectively); higher then average TCS densities within and outside of vehicular areas (Fig 4.34, regions C and D, respectively); areas simultaneously with high die-off, high TCS, and vehicle use (Fig. 4.34, region E); and areas with simultaneous high die-off, high TCS, and no vehicle use (Fig. 4.34, region F). A superficial explanation for these results is that vehicle use is unrelated to higher than average density TCS and/or die-off regions. This interpretation is incongruous with other indications that tortoise mortality is linked to human encounters via roads and would require a reinterpretation of other studies. Alternatively, there are many kinds of vehicle use and some uses are relatively innocuous to tortoises whereas other uses are deleterious. It is also possible that the data in this comparison lack sufficient resolution to detect the real and complex relationships between TCS, carcasses, roads, and vehicle use.
Road Case-Study Recommendations
1. Management agencies should compare historic satellite and aerial surveys to better document changes in road density.
2. Despite ambiguities in the current case study, a similar approach could be employed using rigorously collected data to reveal real and important relationships between tortoise population dynamics and presence of roads or other aspects of, or impacts to, desert tortoise habitat.

Chln3 L3k~'FL
____-K-~-a-m__ ~~~~~~~~~~~ ~~:r-=Edw3fdsAirForr:e83Se
M6Accc
Routes Open
Lim~ed.
Military Installa ti on
DTRPAC Report page 92
Irwm
Fremont
er
29Pllims
• -- BLM 1985-87
-- BLM Roules 1985-87 - Closed, Undetermined, Non-R oule
D DVVMA
_
Urban Areas
Fig. 4.32 Routes in the Western Mojave DWMAs in 1985-87. Blue routes were designated as open, brown as either closed, limited, undetermined, or non-route. Large roadless areas such as southwest Ord-Rodman, and the most southwestern portion of Fremont-Kramer were not without roads in 1985-87, but were instead not inventoried. On the other hand, the DTNA was designated by the BLM as an Area of Critical Environmental Concern and fenced in the late 1970’s, thus creating a roadless area.
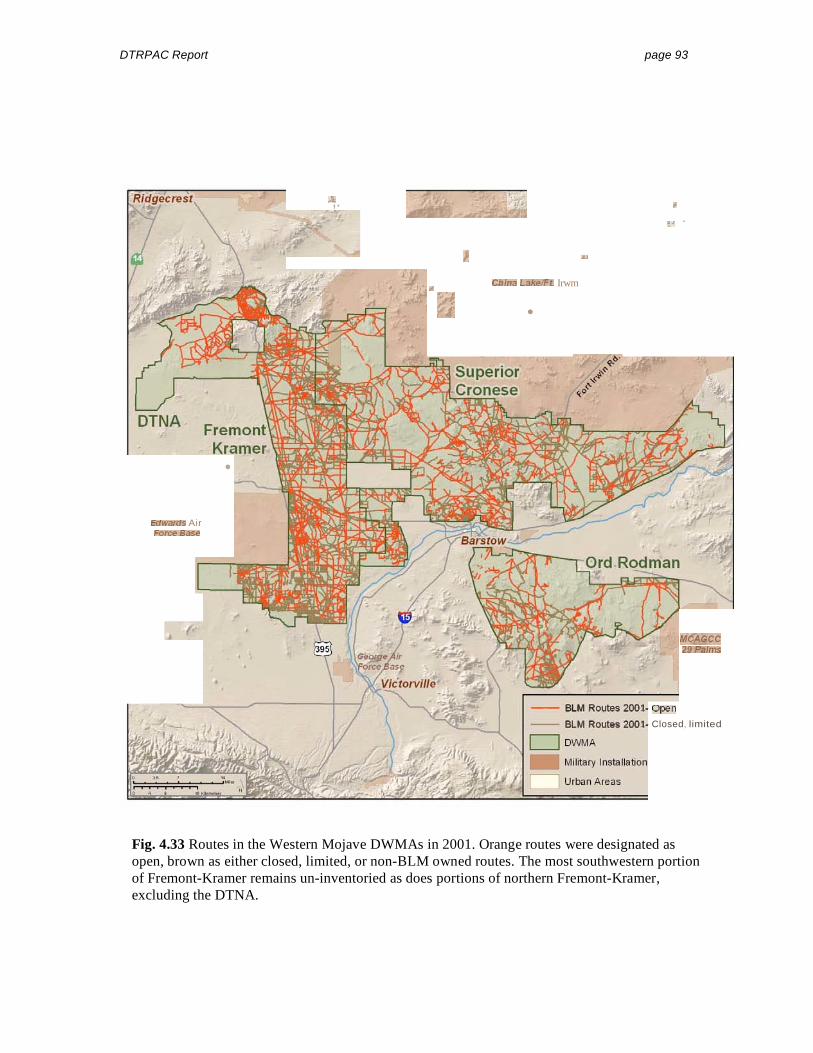
Edw.lfdsForr:eBase
~
,
-1
J
,F
.,
China L3k~'FL
M6(J.CCC29Pllims
Open
DTRPAC Report page 93
Air
•
,. "
Irwm
•
-- BLM Routes 2001
-- BLM Routes 2001- Closed, limited
Fig. 4.33 Routes in the Western Mojave DWMAs in 2001. Orange routes were designated as open, brown as either closed, limited, or non-BLM owned routes. The most southwestern portion of Fremont-Kramer remains un-inventoried as does portions of northern Fremont-Kramer, excluding the DTNA.

Chin:! .....
~~j.,j c:::::J Boundaries
\.~ [nstlllliltion
~ [.=:J Urban Areas
11D WMP
c::J Open Area Boundaries
l!i ~ Arells
I ~ Ole Regions
L,--'--'----1c::::::::J Residentilll Impact
o Open ImpactUse Areas
Twenlyrii""
DTRPAC Report page 94
Fig. 4.34 Distribution of above average vehicle based impacts areas, higher then average TCS and recent die-off regions as reported by the West Mojave Plan (BLM et al 2003). Letters are explained in the text.
A)
B)
D) F)
C)
E)
L
--HighwllYs
DWMA _ Mll it llry
Boundllry
f BLM
Higher Density res
Off
Abovc-Avcragc Vchiclc Impact Arcas Vehicle Arcils
Area Areas China Lake/Ff. Irwin _ High OHV
Palm

M6Accc
-Open
Milrtary Insl.<ll lation
Uroon Areas
China Lak~'FL
Edw.lfdsForr:e8ase
DTRPAC Report page 95
J
Irwm
•
DTNA
Air
29Pllims
. -- BlM Routes 1985-87
- BLM Routes 2001- 0pe ll
DDWMA
_
Fig. 4.35 Comparison of 1985-87 and 2001 designated open BLM routes. The red routes represent 2001 routes not formally designated as open in 1985-87. The lack of designation as open in 1985-87 could be a result of the fact that the route was inventoried in 1985-87 but not designated as open, not inventoried in 1985-87 but existing, or not existing in 1985-87.

,
....'il
~r
M6Accc
,
•
China L3k~'FL
J
Edw.lfdsForr:eBase
DTRPAC Report page 96
"
29Pllims
• -- BlM Routes 2001- Open
-- BlM Routes 1985-87 - Open
Irwm
Fremont Kramer
Air
DTNA
Fig. 4.36 Comparison of 2001 and 1985-87 designated open BLM routes. The blue routes represent 1985-87 routes not formally designated as open in 2001. The lack of designation as open in 2001 could be the result of the fact that the route was inventoried in 2001 but not designated as open, not inventoried in 2001 but existing, or not existing in 2001.

DTRPAC Report page 97
4.5.2 Patterns of Precipitation Case Study
It is important to assess the natural variation in the physical environment as well as the anthropogenically-altered environments. Drought has been hypothesized potentially to cause population declines in desert tortoise populations. To assess the extent to which there have been trends in precipitation, we obtained data on precipitation from all known weather stations in the Mojave. These data were parsed into cumulative rain that would affect production of spring annual plants (precipitation within November to April) and rain resulting from summer monsoonal thundershowers (precipitation within May to October). These data were assembled for three locations in the Mojave (Table 4.10) and averages for each region and for each season were plotted in Fig. 4.37. Clearly, the regions have different patterns of rainfall, as the West Mojave has almost all of its rainfall in the winter season. Also, clearly, there is no long-term trend in rainfall amounts or in patterns of drought duration. The variability of precipitation from year-to-year is very large, and the only apparent conclusion one can draw from the data is that the amount of precipitation and the occurrence of drought are not especially predictable measures for any place in the Mojave. Thus, the absence of a clear pattern suggests that precipitation alone (i.e., not in concert with other stressors) cannot account for downward trends in population sizes in the Mojave.
Table 4.10 Weather stations in the Mojave Desert used in analysis of precipitation (Fig. 4.37).
Northeast-Sonoran East Group West Group BEAVER DAM BOULDER CITY ADELANTO BULLHEAD CITY DESERT NATL WL RANGE APPLE VALLEY BUNKERVILLE DUNN SIDING BARSTOW CALLVILLE BAY KYLE CANYON RANGER STN CANTIL DAVIS DAM LAS VEGAS MCCARRAN INTL AP CHINA LAKE NAF ECHO BAY MITCHELL CAVERNS EL MIRAGE KINGMAN MOUNTAIN PASS HESPERIA LAKE HAVASU NORTH LAS VEGAS INYOKERN LAUGHLIN RED ROCK CANYON ST PK LUCERNE VALLEY 1 WSW LITTLEFIELD 1 NE SEARCHLIGHT MOJAVE LOGANDALE SUNRISE MANOR LAS VEGAS RANDSBURG LYTLE RANCH SHOSHONE TRONA MESQUITE VICTORVILLE PUMP PLANT NEEDLES OVERTON PARKER RESERVOIR PIERCE FERRY 17 SSW ST GEORGE TEMPLE BAR TRUXTON CANYON VALLEY OF FIRE ST PK WIKIEUP WILLOW BEACH YUCCA 1 NNE

o
-
i
DTRPAC Report page 98
1250 A. West Mojave November to April
• May to October1000
B. East Moj ave
1000
E • •E •750 •·••• ".
500
1250
C. Northeast Mojave 1000
• 750 • •
1980 1990 2000
Fig. 4.37 Seasonal rainfall in the Mojave Desert, 1930-2000.

DTRPAC Report page 99
Patterns of Precipitation Case Study Recommendations
This type of analysis should be conducted for other specific threats to desert tortoise populations, as well as ecological variables that may also influence tortoise population status (e.g., rainfall, Fig. 4.37). Such analyses will provide managers and scientists with a comprehensive database of the current environmental setting under which tortoise recovery is taking place and will provide the basis for future hypothesis-based monitoring of tortoise populations relative to threat mitigation and environmental change.
4.5.3 Disease Case Study
Because disease has been such a prevalent issue throughout the range of the desert tortoise, it seems appropriate to consider it in some depth here, as an aspect of the status of the species’ environmental setting. The Recovery Plan mentions two diseases specifically, shell dyskeratosis (section I.B.3) and upper respiratory tract disease (sections I.B.3 and II.D.3.b.1, appendix D.IV.C). Other potentially important diseases not mentioned specifically include herpesvirus (THV) (Pettan-Brewer et al. 1996), iridovirus (Westhouse et al. 1996), and fungus (Homer et al. 1998, Rose et al. 2001) infections. Diseases in general are mentioned or implied for topics such as sources of mortality (USFWS 1994, Section II.D.b.2) and translocation (USFWS 1994, Appendix B.6).
Shell dyskeratosis is not uncommon in both the desert tortoise and the gopher tortoise. The disease may be related to nutrient deficiency or to toxins (Jacobson et al. 1994, Homer et al. 1998, Christopher et al. 2003; E.R. Jacobson, pers. comm.). A direct connection between shell dyskeratosis and population decline in tortoises has not been established. A correlation between the presence of shell dyskeratosis and a die-off of individuals has been reported for a site in California (Berry 1997), yet numerous other threats (Boarmann 2002) are also present at that site. In addition, no correlation exists between frequency of shell dyskeratosis and population declines in the Sonoran Desert (Arizona Game and Fish Department, unpublished data).
Little was known about the relationship of Mycoplasma to tortoise disease when the Recovery Plan was developed. Likewise, the potential relevance to the desert tortoise of studies of Mycoplasma in the gopher tortoise was little appreciated when the Recovery Plan was developed. Upper respiratory tract disease (URTD) now is confirmed to be the result of infection by Mycoplasma agassizii in both the desert tortoise and gopher tortoise (Brown et al. 1994, 1996). Furthermore, another, closely related, species of Mycoplasma, M. cheloniae, has been isolated from tortoises, and two more species of mycoplasma are known from tortoises, but not as yet isolated (Brown et al. 2002; M.B. Brown, pers. comm.). Important studies of respiratory mycoplasmal infection in tortoises published since 1994 include Jacobson et al. (1995), Berry (1997), Epperson (1997), Lederle et al. (1997), McLaughlin (1997), Schumacher et al. (1997, 1999), Smith et al. (1998), Brown et al. (1999), and Diemer-Berish et al. (2000). A direct cause/effect relationship between respiratory mycoplasmal infection and population decline in tortoises has not been established, although a provocative correlation between the presence of URTD and die-offs

DTRPAC Report page 100
of individuals of both the desert tortoise and the gopher tortoise has been documented at some locations (Jacobson et al. 1995, Berry 1997, Rabatsky and Blihovde 2002, Seigel et al. 2003; K.H. Berry, pers. comm.; J.E. Diemer-Berish, pers. comm.).
Mycoplasma agassizii is easily transmitted horizontally by direct contact between host individuals (McLaughlin 1997, Brown et al. 2002). Although other Mycoplasma are known to be transmitted vertically from host mother to offspring and via fomite, such modes of transmission have not been demonstrated for M. agassizii (Brown et al. 2002). Because M. agassizii is so easily transmitted horizontally, isolating infected individuals is an appropriate means to control spread. Isolation of infected individuals is only a part of the general strategy for control of an infectious disease, which should include diagnosis, quarantine, culling or segregation, physical separation, sentinels, and long-term monitoring (M.B. Brown, pers. comm.). How much time, effort, and funds are put into implementing this strategy for a particular disease depends, in large part, on the perceived risk to the host: the greater the perceived risk, the larger the commitment. For example, although the viruses that can cause another upper respiratory tract infection, the “common cold” in humans, are extremely contagious, virtually no control strategy for the pathogens has been implemented, because the perceived risk is low, despite the fact that individuals sometimes develop secondary infections and occasionally succumb to the – largely indirect – effects of the viruses. Assessing risk is particularly difficult in situations, such as those surrounding both the desert tortoise and the gopher tortoise, in which many of the relevant facts that bear on the assessment simply are uncertain or unknown. We return to assessing risk later.
What is known and what is not known?
A great deal has been learned about the relationship of Mycoplasma to tortoise disease, mostly since the Recovery Plan was developed. It is certain (Brown et al. 2002) that:
• Mycoplasma agassizii (strains PS6 and 723) is a cause of URTD • The pathology of mycoplasmosis involves hyperplastic and dysplastic lesions of the
upper respiratory tract
• Clinical signs of URTD vary in onset, duration, and severity • Mycoplasmosis has a chronic phase and may be clinically silent (subclinical) in
adult tortoises • Infection with M. agassizii elicits specific antibody responses that can be detected
by ELISA
• The current ELISA may not be able to detect exposure of all tortoises to mycoplasmas other than M. agassizii, although some cross-reactions do occur
• The antibody responses to M. agassizii are detectable by ELISA beginning eight weeks after experimental infection
• Under experimental conditions, gopher tortoises become ill quicker after repeated exposure to M. agassizii

DTRPAC Report page 101
• Colonization of the upper respiratory tract with M. agassizii may be detected by culture and PCR, but assay sensitivity is not as high as the ELISA
• Mycoplasmosis is a horizontally transmissible disease
Note, first, that the important information that we know with certainty relates entirely to individual tortoises and not to populations. We return to current understanding at the level of the population later. Secondly, important uncertainties and unknowns remain even at the level of individual tortoises. For example, it is probable, but not clearly established (Brown et al. 2002) that:
• Pathogenic and nonpathogenic tortoise mycoplasmas exist • There is variation among strains of Mycoplasma agassizii in their ability to cause
URTD
• Other species of Mycoplasma (such as M. cheloniae) also can cause URTD • Specific antibodies against M. agassizii may not confer protective immunity
• Mycoplasma may be transmitted by some forms of indirect contact
• Mycoplasma may not persist in burrows of infected tortoises
Many of the uncertainties and unknowns at the level of individual tortoises warrant increased attention (Brown et al. 2002; M.B. Brown, pers. comm.; E.R. Jacobsen, pers. comm.). In particular, more information is needed about: vertical transmission of tortoise pathogens (on-going studies are examining vertical transmission of both M. agassizii and THV), tortoise immunobiology (need information on reagents and functional assays, normal versus abnormal values, and the cellular immune system), tortoise pathophysiology and hemosiderosis, modes of transmission of tortoise pathogens other than M. agassizii, and relative importance of tortoise pathogens (need information on the virulence of species and strains).
Although accruing information about the effects of URTD and other diseases on individuals is an important undertaking, sound management decisions about species recovery require accruing information about the effects of diseases on populations. Unfortunately, virtually nothing still is known about the demographic consequences, either direct or indirect, of URTD. It is suspected that respiratory mycoplasmal infection can affect desert tortoise and gopher tortoise life history traits (survival, fecundity, migration) directly and, therefore, affect population dynamics directly (Brown et al. 2002; M.B. Brown, pers. comm.), but establishing such a connection, if it indeed does exist, requires a more concerted effort than has been made to date. This cause-and-effect relationship has two linkages: Disease Individual Population. A suitable research plan, therefore, would need to be designed first to establish that disease affects the life history traits of individuals, and second, to establish that the changes in life history traits of individuals cumulatively affect population dynamics. Although some tortoises with respiratory mycoplasmal infection clearly have died with what appear to be abnormal deaths (Jacobson et al. 1995, Berry 1997, Rabatsky and Blihovde 2002, Seigel et al. 2003; K.H. Berry, pers.

DTRPAC Report page 102
comm.; J.E. Diemer-Berish, pers. comm.), other tortoises with the infection have lived what appear to be normal lives for extended periods (e.g., at sites at which seropositive individuals occur, yet at which no substantial declines in population size can be documented; McCoy et al. in review). Unfortunately, the nature of the research to date has been such that cases of the absence of population decline, in the face of respiratory mycoplasmal infection or of subsequent recovery from URTD, have not been well reported. Neither have the fates of random samples of ill – defined broadly – and healthy individuals from the same populations been mapped, as far as we can tell. The connection between the disease and survival of individuals, therefore, remains inferential, and whether or not disease is an important source of mortality (section II.D.3.b.2) remains largely unknown. Declines in the fecundity of tortoises with acute respiratory mycoplasmal infection have occurred, but the best available evidence indicates that they eventually recover (Schumacher et al. 1999; D.C. Rostal, pers. comm.). The connection between the disease and fecundity of individuals, therefore, remains problematic. No studies to date have explored the potential connection between disease and migration of individuals. Tortoises with respiratory mycoplasmal infection may display abnormal physiological responses, such as increased water loss, or behavioral responses, such as reduction in appetite, reluctance to leave burrows, and irregular basking and burrowing, however, which could influence movement patterns (Brown et al. 2002; M.B. Brown, pers. comm.; E.R. Jacobson, pers. comm.).
It seems clear that the dearth of information on the linkage between disease and life history traits of individuals would reduce the linkage between changes in life history traits of individuals brought about by disease and resulting population dynamics largely to speculation. The best-published attempt to relate tortoise demography to disease was by Berry (1997). She presented convincing evidence that desert tortoise population densities had declined substantially at two sites (but see the discussion of permanent study plots and measurement of population densities presented elsewhere). Some individuals at one of the sites were seropositive and/or clinically ill with URTD, and some individuals at the other site exhibited varying degrees of shell dyskeratosis. She concluded (p. 94) that “between 1988 and 1992 the declines of adults [at the site with seropositive and/or clinically ill individuals] are clearly attributable to URTD caused by M. agassizii.” She is more reserved in her conclusion about the second case (p. 95): “the population decline appears to be linked to the appearance of shell lesions on the tortoises.” The evidence that she presents for the cause-and-effect relationship between tortoise population decline and disease in the first case is: (1) prior to 1988, before the appearance of acute URTD, few individuals ever were observed with overt signs of illness or in a dying state; (2) individuals displaying clinical signs of URTD were distributed throughout the site and in adjacent areas; and (3) of 27 individuals in a health profile research program, fitted with radio transmitters, 6 died and 11 disappeared between 1989 and 1992. We suggest that this evidence supports a more conservative conclusion, one that is nearer the conclusion that Berry (1997) reached for the other site: the population decline appears to be linked to the appearance of URTD in the tortoises. Note that this conclusion still is immensely important and demonstrates that, at present, disease threats deserve consideration on par with other threats.

DTRPAC Report page 103
Risk from disease threats
It appears that URTD is a complex, multi-factorial disease, interacting in some circumstances with other stressors to affect tortoises (Brown et al. 2002; M.B. Brown, pers. comm.). Hypothesized factors contributing to mycoplasmal transmission and URTD disease severity include different critical thresholds of exposure among tortoise populations; difference in virulence among microbial species and strains; prior exposure, which probably limits the ability to control disease severity; variable clinical expression, both temporally and spatially; differences in sex ratios, age structures, and behaviors among tortoise populations; exacerbating factors, such as drought; and tortoise nutritional status (M.B. Brown, pers. comm.).
At present, the accumulating evidence about URTD is a mass of seeming contradictions. No data indicate that URTD is moving through Mojave Desert tortoise populations in a wavelike pattern typical of mycoplasmal spread (E.R. Jacobson, pers. comm.); yet, failure to identify the pattern may have resulted from inadequate serological sample sizes, inadequate spread of sampling effort throughout the range of the desert tortoise, or other, similar, problems (E.R. Jacobson, pers. comm.; see Diemer-Berish et al. 2000, McCoy and Mushinsky in review). Tortoises in the genus Gopherus may have maintained a long-term coexistence with the pathogens causing URTD (E.R. Jacobsen, pers. comm.; McCoy and Mushinsky in review); yet, in some places, such as Ft. Irwin, tortoises seem to have been isolated from at least Mycoplasma agassizii (E.R. Jacobson pers. comm.; see McCoy and Mushinsky in review), and, in many ways, respiratory mycoplasmal infection in tortoises resembles a new interaction between host and pathogen (D. Thawley, pers. comm.). In general, respiratory mycoplasmal infections have high morbidity but low mortality (Brown et al. 2002); yet, in some places, severe population declines have been hypothesized to be linked to URTD caused by M. agassizii (e.g., Berry 1997).
These seeming contradictions reinforce the emerging picture of URTD as a complex, multi-factorial disease. First, as we have seen, demonstrating the two important cause-and-effect relationships Disease Individual Population is not easy, and the difficulty is compounded by inadequate sample sizes and inadequate experimental design. Second, the potential effects of URTD, either for individuals or for populations, are inextricably intertwined with potential effects by numerous other threats, and teasing out individual effects, when several factors co-vary, is a difficult analytic problem. Third, changing ecological conditions, whether connected with human activities (e.g., habitat degeneration, McCoy et al. in review) or not (e.g., malnutrition, Jacobson 1994, Oftedahl et al. 2002); drought, Berry et al. 2002), may stress individuals and result in more severe clinical expression of URTD (Brown et al. 2002). Fourth, mycoplasmal infections often are density dependent (e.g., Hochachka and Dhont 2000), and URTD is seen mostly in relatively dense populations (M.B. Brown, pers. comm.), suggesting that some threshold density of tortoises may need to be reached before the infection becomes severe. Fifth, even if the mycoplasmal species responsible for URTD have maintained a long-term relationship with tortoises in the genus Gopherus, the pathogens appear to evolve rapidly into novel strains (Brown et al. 2002), suggesting that demographically important pathogenic relationship may occur at the sub-specific level.

DTRPAC Report page 104
The complexity of the disease threat facing the desert tortoise, coupled with the uncertainty surrounding many of the key issues, and the fact that the tortoise is faced with many other threats, suggests that a conservative approach toward disease as a threat be adopted at this time. Although the evidence suggests that disease, especially URTD, could be an important force shaping the demography of desert tortoise populations, the evidence neither demonstrates that disease is a potent force, nor that it is the most important force, nor that it acts independently of others forces. A more balanced, adaptive, and focused approach to dealing with URTD is appropriate at this time, perhaps one modeled on the recommendations of McCoy and Mushinsky (in review) for dealing with the disease in the gopher tortoise. Such a balanced approach would take into account the risks, and associated costs, involved not only of transmitting Mycoplasma agassizii among tortoise populations, but also of transmitting it within populations or to other species. It would deal with the management practice of translocation and of dooming demographically valuable individuals to euthanasia simply because they are suspected of harboring the pathogen. It would deal with underestimating the importance of other pathogens (such as herpesvirus, THV) and of diverting attention and resources away from managing, acquiring, and restoring habitat. For example, if Mycoplasma agassizii has a long-term relationship with its tortoise host, then addressing the risks involving habitat loss, fragmentation, and degeneration is crucial for permitting recovery from URTD. Die-offs are likely to have occurred historically, and populations have obviously recovered. Under current conditions, large populations in good habitat likely could recover again, but small populations or populations in poorly managed habitat may be in serious danger of extinction. A more adaptive approach would take into account the evolution of knowledge about M. agassizii and URTD. Advances in knowledge may necessitate reevaluation of the risks facing the tortoise. For example, if strains of M. agassizii are variable in virulence, as evidence now suggests (Brown et al. 2002), then careful isolation of high-virulence strains on the one hand, and relaxation of the moratorium on translocation of the low-virulence strains on the other hand, may be warranted and wise. A more focused approach would take into account the ultimate goals of any actions taken against URTD. Different goals may dictate different weightings of the risks facing the gopher tortoise. For example, if the ultimate goal is for populations to be self-sustaining in the face of environmental pressures, including disease, then actions requiring persistent veterinary intervention may counter indicated and dangerous.
The complexity of the disease threat facing the desert tortoise, coupled with the uncertainty surrounding many of the key issues and the fact that the tortoise is faced with many other threats, suggests that the disease threat will not be understood without bringing to bear all of the tools of modern epidemiology, particularly ecological epidemiology. Classical epidemiology primarily is concerned with the statistical relationship between disease agents, both infectious and non-infectious, while ecological epidemiology is concerned with the ecological interactions between populations of hosts and parasites (Swinton 1999). Epidemiologists are aware of the importance of the sociodemographic (classical epidemiology) or the ecological (ecological epidemiology) setting influencing the course that a disease takes in a population, and they are equipped with the statistical tools

DTRPAC Report page 105
necessary to deal with diseases resulting from a variety of confounded and interdependent factors and to establish causal chains.
Disease Case-Study Recommendations
An immediate need exists to develop scientifically-based recommendations for management of healthy and ill -- defined broadly – wild tortoises so as to minimize the risk to both individuals and populations of uninfected tortoises (Brown et al. 2002), and by extension, risks both to individuals and populations of infected tortoises. The focus here is on the two recovery actions recommended in the Recovery Plan most relevant to disease threats in light of this need (see below). These two recommendations still are sound, but suffer from almost complete lack of implementation in the past decade. Here we also list additional recovery actions, which should be seen as simple extensions of the original actions based on new knowledge available today.
a. Initiate epidemiological studies of URTD and other diseases (section II.D.3.b.1)
• Refocus the general approach to research on disease, treating it as part of a network of threats to tortoise populations, which, because of negative and positive feedback loops to other threats, cannot be addressed effectively without reference to the threats network (see section 5.1.1).
• Develop multi-disciplinary, long-term research agendas to understand the network of threats (a possible model, developed for studying URTD in the gopher tortoise, is in Section 7.3).
• Develop tools to study disease which are not so expensive that they preclude needed resources to research the interactive effects of disease with other threats.
• Develop more knowledge about the ecogeography of genetics of disease and hosts as a way to develop recommendations for translocation programs cognizant of the potential harm that can come from lack of information about mismatches between virulence of genetic strains of pathogens with different strains of host.
• Include epidemiologists and population biologists in developing the research agendas.
b. Research sources of mortality, and their representation of the total mortality, including human, natural predation, diminishment of required resources, etc. (section II.D.3.b.2)
• Add health assessments to the information gathered in ecological studies and monitoring, perhaps using an existing protocol (Berry and Christopher 2001).
• Develop clear standards for determining whether individuals in a population are healthy or not and whether they have been stressed or not.
• Continue current serological surveys for M. agassizii, adding screening for THV. Develop surveys for other Mycoplasma species as assays become available.

DTRPAC Report page 106
• Continue necropsies (the sample currently includes 74 individuals according to E.R. Jacobson). Develop a rationale for these necropsies in relation to the potential for information from them to affect new knowledge and management.
• Continue developing, improving, and extending diagnostic tests. This includes developing less expensive and more field-portable testing.
• Continue developing stress tests that are applicable to wild tortoises (e.g., adrenocorticotropin hormone (ACTH), phytohemagglutinen (PHA), and sheep red blood cell (SRBC) challenge experiments, to examine adrenal gland response, T-cell response, and B-cell response, respectively; P. Kahn, pers. comm.).
• Inform researchers about both the qualities and the shortcomings of diagnostic tests (see Brown et al. 2002); for example, clinical signs of URTD may be non-specific or specific host responses to agents other than mycoplasmas; seropositive (ELISA) individuals may display no overt clinical signs of URTD; and that ELISA alone often is not sufficient, largely because they indicate only past exposure and not necessarily current infection.
• Inform researchers about the value of different diagnostic tests in addressing different goals (see Brown et al. 2002); for example, different tests are appropriate for health assessment of an individual tortoise, for a population survey, for long term population monitoring, and for investigation of a mortality event.
• Ensure that all important information is made accessible to researchers.
• Ensure that the expedient course of killing seropositive, but otherwise healthy, individuals is kept to a minimum.
A caveat to these recommendations is in order. Many modern epidemiologists do not think that epidemiology itself should be concerned with the delivery of services or with implementation of policy (e.g., Savitz et al. 1999). Regardless of whether or not one agrees with this viewpoint – which reflects a similar viewpoint common in conservation biology – it points to a separation between the scientifically-based accumulation of knowledge and the ultimate use of knowledge. The recommendations made here are for improving the science surrounding disease as a threat for the desert tortoise and may not necessarily provide an easy transition to management strategies. Designing management strategies for a complex disease threat, particularly one in which the factors contributing to the complexity may themselves be threats – which is an unusual situation – is a daunting task; however, the response to this daunting task must not be to ignore the complexity in the name of expediency.

DTRPAC Report page 107
“Science is a way of thinking much more than a body of knowledge. Its goal is to find out how the world works...”
Carl Sagan, Broca’s Brain: Reflections on the Romance of Science. (1979)

DTRPAC Report page 108
5. Linking Impacts, Habitat, and Demography to Recovery
The committee found that desert tortoises face a vast array of threats and that these threats interact with one another in highly complex ways that vary from place to place within the historic range of the desert tortoise. In fact, examples of species facing a single major threat are unusual among listed species. The complex nature of many threats is likely to make them difficult to both document and address in recovery plans. In addition to understanding complex ecological systems, mitigating threats often requires understanding and addressing interrelated social and economic factors, thus creating additional challenges in assigning tasks for species’ recovery (Lawler et al. 2002). The DTRPAC does not identify any simple and universal prescription for restoring and protecting desert tortoises across their range. Rather, the committee presents a threats matrix – a topology of the complexity of threats facing desert tortoises currently. The committee recognizes the importance of the on-the-ground knowledge that land managers will bring to developing management responses to threats. The committee urges management actions that recognize and account for the knowledge that land managers will bring to the table and that also account for the true complexity of formulating management actions for populations that face multiple, simultaneous, interacting threats.
Desert tortoise recovery is fundamentally a demographic process. That is to say that recovery activities center on tortoise populations, particularly population size and whether or not they are increasing, decreasing, or stable. The fundamental recovery goal is for tortoise populations to have sufficient size and stability to ensure their continued existence. Tortoise populations increase, decrease, or remain stable largely because of the net effects of several important demographic factors: birth rate (natality), survivorship (recruitment into the breeding population), fecundity, and death rate (mortality). A population growth index called “lambda” summarizes the cumulative effects of these demographic factors.
Lambda describes if and how quickly populations are changing. A population that is increasing has a lambda greater than 1. For example, a lambda of 2 would indicate that the population is doubling in size each generation (32 years for desert tortoises; Turner et al. 1987). A population that is declining has a lambda that is less than 1. For example, a lambda of 0.5 means that the population is diminishing by half each generation. A stable population has a lambda of 1, i.e., the population is replenishing itself each generation.
Most recovery actions for threatened and endangered species are designed to stabilize population size (lambda at 1.0 based on dynamics across several generations) where population size is sufficient to safeguard against extinction. If population size is small enough to threaten extinction, the recovery goal is to increase population size (lamba > 1.0) until the population is sufficiently large to ensure persistence. Then the population can be managed for a long-term lambda of 1. Population increase can be achieved through actions that increase natality, increase recruitment, increase fecundity, decrease mortality, or some combination of these. Because the management actions taken depend in part upon the factors responsible for population declines, it is important to know what forces are causing population declines or are preventing small populations from rebounding to stable population sizes. Forces influencing population dynamics were addressed in Appendix D of

DTRPAC Report page 109
The Recovery Plan (USFWS 1994), by listing each identifiable force and presenting evidence that it is indeed a threat to population well being.
5.1 Cumulative, Interactive, and Synergistic Impacts of Multiple Threats
One of the most insidious problems preventing desert tortoise recovery is that tortoise populations face multiple threats. To grasp the complexity of threats facing desert tortoises, it is helpful to consider two important ways that these threats act:
Individual populations face a suite of threats simultaneously. This means that ameliorating a prominent threat does not mean that the population has become secure. Another threat may replace, or “compensate” for, the threat that has been removed. Adding further complexity, each population may face its own suite of threats.
Threats can interact with one another. The action of one threat can influence the degree to which another threat is expressed. Because threats are simultaneous, the degree to which a particular threat is expressed is partly a function of other active threats. The interaction of threats need not be simply additive. They can be synergistic. In other words, the combined application of two or more threats may cause an overall effect that is greater than the sum of each threat individually.
Our task was to determine if new information would change the original Recovery Team’s (USFWS 1994) evaluation of threats to desert tortoise populations. For this analysis, we made use of a recent objective analysis of evidence pertaining to threats to desert tortoise populations (Boarman 2002) plus testimony of expert witnesses and knowledge of committee members. The Recovery Plan identified a large number of important threats to tortoise populations. Although some new information has been generated since then, we see little need to change the Recovery Team’s treatment of most individual threats. However, the original Plan did not fully appreciate the complexity of interactions of individual threats with each other and the insidious nature of the synergism that can occur among threats. In particular, the original Recovery Plan did not emphasize the degree to which one mortality factor can deleteriously compensate for another mortality factor when the first one has been mitigated through management actions. For example, the original Plan did not illustrate clearly that adult tortoises may die from an alternative mortality factor, such as vandalism, after being protected from another important mortality factor, such as being crushed by cars, in an environment of multiple anthropogenic threats.
Some new information exists on the extent of threat posed by some specific activities. For example, feral and unleashed domestic dogs are now thought by many to pose an important threat to tortoises in some parts of the Mojave (Bjurlin and Bissonette 2001), but this issue was barely recognized in1994. Recent studies have shown that native vegetation biomass and other elements of the Mojave Desert ecosystem were higher in areas protected from grazing and OHV activities, while non-native grass biomass was greater outside the protected area (Brooks 1995, 1999). Another study found greater plant cover and desert tortoise abundance in an unused plot compared to an OHV-used plot (Bury and

DTRPAC Report page 110
Luckenbach 2002). Lovich and Bainbridge (1999) reviewed effects of OHVs on desert ecosystems, as well as other anthropogenic effects. Translocation was portrayed as a likely threat to populations in 1994, but recent research has shown how it may be an important element in recovery programs (Field 1999, Nussear et al. 2000, Nussear 2004). More details are now available on disease (see Section 4.5.2 and many studies listed in Boarman 2002), raven predation (Boarman 2003), fires (e.g., Brooks and Esque 2002), invasive weeds (e.g., D’Antonio and Vitousek. 1992, Brooks 2000, Brooks and Esque 2002), military activities (e.g., Krzysik 1998, Berry et al. 2000), and livestock grazing (e.g., Avery 1997, 1998). A little more has been learned since 1994 about a number of other threats to tortoise populations including illegal collecting (Berry et al. 1996), kit fox predation (Bjurlin and Bissonette 2001), handling (Averill-Murray 2002b), release of captives (Field et al. 2000, Johnson et al. 2002), roads (Fig. 4.32, von Seckendorff Hoff and Marlow 2002), and noise (Bowles et al. 1999). Most importantly, however, virtually nothing is known about the demographic impacts of any of the threats on tortoise populations or the relative contributions each threat makes to tortoise mortality. This dearth of knowledge is not surprising given the difficulty of estimating desert tortoise population sizes (see Chapter 4). We caution that the individual threat approach taken by the Recovery Plan (USFWS 1994) may have resulted in managers placing too much emphasis on political and practical trade offs involved in controlling individual threats; we believe tortoise recovery depends on emphasis being placed on managing multiple threats because of the interactive, synergistic, and cumulative effects of multiple threats.
We recommend a significant modification to the Recovery Plan’s perspective on threats by strongly emphasizing the importance of cumulative, interactive, and synergistic threats to desert tortoise populations throughout the Mojave. We emphasize that multiple threats appear to act simultaneously to suppress tortoise populations at any given place in the desert. Simultaneous multiple threats represent an insidious threat to desert tortoise populations by diminishing the benefits of carrying out important management actions designed to relieve stress on tortoise populations. For example, overgrazing may suppress tortoise populations by reducing the availability of important forage plants (Avery and Neibergs 1997). However, tortoises that are “saved” by grazing reductions may be lost anyway due to shooting by public land users or crushing by vehicles driven on desert roads. Hence, even though grazing reduction was appropriate and necessary, it was not sufficient because saved tortoises were now available to be lost through the compensatory threat (called “compensatory mortality”).
Multiple threats can also act synergistically. By synergism we mean that the deleterious effects of a given threat are substantially magnified when another threat is simultaneously acting. In other words, the cumulative threat effect is greater than the sum of the individual threats. One example of synergy between threats is raven predation and road mortality. While some tortoises are killed by ravens and others are crushed by vehicles on roads, the presence of tortoise (and other) carcasses on roads enhances the survival and reproduction of ravens which are then available to prey upon tortoises (Boarman 2003). Another possible important synergism is the suspected link between disease and nutrition or disease and drought (Brown et al 2002, M. B. Brown pers. comm., Duda et al. 1999). In this scenario, well-nourished tortoises may not necessarily die from URTD, but succumb when under nutritional stress. Nutritional stress, in turn, may occur in areas such as OHV open

DTRPAC Report page 111
areas where forage availability has been significantly reduced. Multiple threats and their synergistic interactions may make it extremely difficult to identify and implement management actions that will most efficiently lead to recovery.
Whereas the most obvious threats directly result in tortoise mortality (e.g., road mortality and poaching), the cumulative, interactive, and synergistic impacts of multiple threats is often manifested through indirect impacts that reduce survivorship and fecundity. Habitat degradation and the resulting reduced nutrition are two of those indirect impacts. Habitat degradation takes many forms, and often the occurrence of one form of degradation is correlated with the occurrence of other forms. Three kinds of habitat degradation are centrally important to tortoise conservation and tortoise population decline: habitat fragmentation, habitat loss, and habitat degeneration. Fragmentation refers to the parsing of habitat into separate segments. This is a spatial phenomenon, but does not refer to habitat loss per se. For example, a fence or road that forms a barrier to tortoise movement divides a tortoise population into two units without significant habitat loss. Habitat fragmentation is an issue of scale and has been shown to cause population declines in other reptiles (Fisher et al. 2002).
Habitat loss refers to the destruction or conversion of previously suitable habitat into a form that is no longer suitable to tortoises. For example, urbanization leads to habitat loss for desert tortoises. Animals with large home ranges, such as the desert tortoise, typically are sensitive to habitat fragmentation and habitat loss. Both lead to population decline. Among the deleterious effects of habitat fragmentation are reduced movement and gene flow among breeding populations. Fragmenting a population increases the likelihood of local population extinction from a range of demographic and catastrophic events (Opdam 1988, Hanski and Gilpin 1991). Habitat loss does not necessarily fragment a population, but habitat loss invariably leads to population decline due to net loss of space and resources available to tortoises.
Lastly, habitat can degenerate, meaning its value for desert tortoise survival and reproduction is reduced, even if the habitat is not fragmented or destroyed. Reduced habitat quality can be a particularly insidious problem for wildlife managers because it can be difficult to recognize that seemingly suitable habitat is actually deficient in some important way. Habitat fragmentation, loss, and degeneration are all occurring throughout the Mojave Desert, but particularly in the western Mojave. Unfortunately, habitat protection has not been effectively implemented in many areas within the tortoise’s historic range (e.g., see Section 4.1).
Nutrition is important to desert tortoise population biology because of the role it plays in growth, health, and fecundity. The availability of adequate nutrition to tortoises in the Mojave ecosystem is naturally variable in response to annual variation in precipitation, temperature, soil moisture, and plant community responses. Some years are forage rich and others forage poor, which in turn causes for annual differences in fecundity and survivorship. This is an example of a natural interaction between abiotic factors (weather) and biotic factors (native plant community) influencing tortoise populations through the indirect pathway of nutrition (see Fig. 5.1, Turner et al. 1984, Peterson 1994, Peterson 1996a, Peterson 1996b). However, anthropogenic factors introduce a suite of factors that

DTRPAC Report page 112
ultimately bear on tortoise nutrition through more complex synergistic effects. For example, the replacement of native forbs and grasses by introduced weeds may change the plant community response to precipitation and the nutritional value of the forage produced. Additionally, exotic plants change fire cycles, fugitive dust, the biological availability of water, and perhaps, tortoise movement. The demographic consequences of tortoise nutritional ecology may prove to be difficult to monitor directly, however the threats network described below may suggest proxy factors that can reasonably be monitored and managed.
Focusing on individual threats has resulted in little positive change for desert tortoise populations. The individual threats approach has not contributed to a general recovery of the desert tortoise for several reasons. For example, the individual threats approach generally does not account for compensatory mortality in which one mortality factor takes tortoises that were “saved” from another mortality factor. A particularly troublesome consequence of using the individual threats approach is a problem we term “elevating the expedient to the important.” A simple listing of individual threats may prompt managers to attend first to those threats they view as most tractable, in light of available resources and political exigencies, but managing those threats may not necessarily produce the best results. For example, raven depredation of tortoises appears to be an important problem and raven control is a straightforward management action that can be quickly and easily implemented. However, raven control may not be the highest priority management action for every tortoise population. Finally, focusing on individual threats suffers from Leibig’s Law of the Minimum (Berryman 1993). By focusing on and removing only the one or two threats considered the most important, no response may be realized because the next most important threat becomes the limiting factor for population recovery (Leibig’s Law). Thus, we believe the most effective management will be based on recognizing the importance of addressing the multiplicity of threats impacting specific populations.
5.1.1 Threats Network
We illustrate the truly complex relationships among the array of threats to tortoise populations with a three-tiered conceptual model (Fig. 5.1). The model characterizes biotic, abiotic, and anthropogenic factors in a network of threats to tortoise populations. Overall, the network illustrates the interaction of biotic, abiotic, and human land-use factors in causing tortoise population decline. Major land-use categories appear in the top tier of the network. The second tier represents activities or threats that are indirectly linked to tortoise mortality and fecundity. The third tier represents mortality factors that lead directly to tortoise population decline. The model focuses on anthropogenic features that lead to tortoise population decline because these factors are central to developing effective recovery strategies. We do not illustrate tortoise population increases in the network, but we recognize that ameliorating the deleterious effects represented in the model may open the way for desert tortoise population increases through increased longevity and fecundity. It is important to note that this network model represents a hypothesis that needs regular reevaluation and modification.

I!Iili..1
III<lU
MO.,ed<llOl'S
bumlll9 bu,lal
POl"ULATIOtl DECLINES
rei_ofCd 11v",
diSH'" laliing
Mortality Mechanisms
DTRPAC Report page 113
Biotic Anthropogenic AblaUc
Land Use
TIER 2 Actlvlty/ Threat
I I
Fig. 5.1 Network of threats demonstrating the interconnectedness between multiple human activities that interact to prevent recovery of tortoise populations. Tier 1 includes the major land use patterns that facilitate various activities (Tier 2) that impact tortoise populations through a suite of mortality factors (Tier 3).
The threats network demonstrates that many human activities can have negative effects on tortoise populations through many pathways. Taking management actions that break one pathway, even though the pathway is real, may not be adequate to prevent the mortality factor from continuing to diminish a tortoise population. This is because alternative pathways exist to “compensate” by removing animals that were otherwise “saved” by a management action as with “compensatory mortality,” discussed above. Compensatory mortality is not the only way that multiple pathways make developing recovery actions

DTRPAC Report page 114
difficult. Tortoise populations can also experience “indispensable mortality,” resulting from tortoise life history traits that are not under human control. In tortoises, reducing the influence of a mortality factor on younger age classes, for example, may not result in a commensurate increase in overall population size because high mortality among older, highly fecund individuals is the true constraint on the population. For example, “headstarting” of hatchling sea turtles is not particularly effective in reducing population decline, relative to protection of reproductive females (Frazer 1993), because of the very high mortality rates of intermediate-age individuals. Indispensable mortality accounts for why reducing raven predation alone likely will not result in significant increases in tortoise population size.
Anthropogenic food provides a good example of how network analysis gives insight into the importance of recognizing alternative pathways before planning recovery actions. Figure 5.2 is a portion of the complete network (Fig. 5.1) and shows direct and indirect ways that human activities generate anthropogenic foods for predators that eat desert tortoises. Ranching, agriculture, and urbanization are probably the biggest direct land uses that provide food to ravens, coyotes, and feral dogs. Other land uses generate foods less directly through associated activities illustrated in Tier 2 of the network. Activities that generate food subsidies to tortoise predators include motorized and non-motorized recreational activities, railroads, and landfills. Taking a single threat approach, eliminating railroads as a source of food, may indeed reduce the amount of food available to ravens, but there are still many other compensatory sources of food the ravens could switch to: and no measurable reduction in juvenile mortality may be realized. As a further illustration, the presence of people facilitates raven presence and their likely predation on tortoises in other ways, such as water, nesting structures, roosting sites, and nesting materials. So, even if all anthropogenic sources of food were eliminated, human activities may still facilitate predation on tortoises by ravens. A multiple threats approach to tortoise recovery would evaluate the relative contributions each source makes to the availability of food. With the assistance of statistical analyses such as Path Analysis (Petraitis et al. 1996, Smith et al. 1997, Wootton 1994) or Structural Equation Modeling (Maruyama 1997), sources can then be prioritized and the most important ones eliminated to maximize the positive benefit to tortoise populations.

DTRPAC Report page 115
ranching agriculture urbanization
landfills
non-motorized recreation
construction
Ravens
Fig. 5.2 A section from the Threats Network from Fig. 5.1 that shows how multiple land uses and human activities provide food subsidies to predators on tortoises, thereby increasing mortality.
The network also illustrates a vortex of feedback loops in which mortality mechanisms from both natural and human impacts can reinforce one another. In particular, some factors affect age distribution through increased mortality of older individuals, which in turn affects population recruitment through the reduced fecundity of young individuals, which then makes the population more susceptible to threats that affect younger, smaller individuals. In other words, not only do impacts from threats cause a population decline, but a population may also lose much of its ability to rebound from the population decline. Lastly, an inability to rebound can be exacerbated when impacts differentially affect breeding female or juvenile segments of a population. Several demographic models

DTRPAC Report page 116
indicate that tortoises require very high juvenile survivorship and recruitment into the breeding population to recover diminished tortoise populations (Congdon et al. 1993, Doak et al. 1994, USFWS 1994). The vortex of deleterious feedbacks among multiple threats represents a grave threat to tortoise recovery.
There are several important caveats relative to using the threats network to formulate recovery strategies. First, the effects of some of the threats may have time lags that make the effects hard to discern early. Second, tortoise populations and habitats may respond to threats emanating from areas outside of DWMAs or other areas designated for management action. Third, cumulative or indirect effects caused by modification of ecosystems, may occur. Fourth, threats may have different effects in different areas. Fifth, the magnitude of various threats may depend upon the initial condition of the landscape and its changes through time. Sixth, the degree of threat by any one factor almost certainly changes in different combinations of interacting threats. Finally, the value of a management strategy depends on the particular problem being addressed. In other words, the threats matrix provides a general topology of the complex issue of threats. However, management actions to recover or protect individual tortoise populations likely will have to be custom designed for those populations and be based on the suite of threats and their interactive effects facing that population. We do not identify any simple and universal prescription for restoring and protecting desert tortoises across their range.
To illustrate how the threats network can be interpreted, we provide three simplified examples. First, following a relatively simple thread, we see that four major elements are associated with utility corridors (Fig. 5.3): construction, physical structures (e.g., power towers, pump houses, etc.), people (e.g., involved in maintenance operations), and unpaved roads. Each one of those elements affects tortoises through various mechanisms. For example, physical structures cause loss of habitat and facilitate mortality from predation by providing nesting habitat for ravens (Boarman and Heinrich 1999). This example shows a relatively straightforward connection between utility corridors and tortoise population declines.

DTRPAC Report page 117
( (onstructlon )
Fig. 5.3 A section from the threats network from Fig. 5.1 showing just the primary activities associated with utility corridors. The causes of tortoise mortality associated with physical structures are also shown.
Unpaved roads represent another contributor to threats associated with utility corridors further illustrating a much more complex web of connections. On the face of it unpaved roads have relatively few direct impacts on tortoise population. The crushing of tortoises, habitat loss, and air pollution (not illustrated) associated with unpaved roads do not appear to be the major causes of tortoise decline (Fig. 5.4). However, there are a host of important indirect impacts of unpaved roads that may be very important factors in tortoise decline, some of which are illustrated in Fig. 5.5). For example, unpaved roads, specifically the vehicles and the people they transport, cause fires (USFWS 1994, Brooks pers. comm.), which in turn kill tortoises and alter native and non-native vegetation (Brooks and Esque 2002). Roads facilitate the spread of non-native plants (Brooks and Esque 2002, Gelbard and Belnap 2003), which may in turn suppress growth of some native species (Brooks 2000). Unpaved roads also generate fugitive dust (Gillette and Adams 1983), which reduces productivity of plants (Sharifi et al. 1997) and may release contaminants (Forman et al. 2003). Roads facilitate non-motorized and motorized (OHV/ORVs) recreation, which can directly, and indirectly, impact tortoise demography (not illustrated in Fig. 5.5) (Boarman 2002). Finally, unpaved roads provide access to people, which can facilitate a

/'
DTRPAC Report page 118
large number of activities that may harm tortoises (e.g., vandalism, removals, release of diseased captives, habitat destruction, dumping of garbage and toxic chemicals, crushing burrows and animals, release of pet dogs that may become feral, etc.) (Boarman 2002). Hence, when viewed within the threats matrix, unpaved roads within desert tortoise habitat may be a key factor associated with tortoise decline.
Fig. 5.4 A subsection of the Threats Network shown in Fig. 5.1 that illustrates the mortality factors directly associated with unpaved roads used for maintenance of utilities.

dec::rease native
anthropogenic::
fugitive
rec::reallon
DTRPAC Report page 119
lants OHV/OIIVs
non-motoMzed food
dust
Fig. 5.5 A much more complex web showing the interconnectedness among many activities associated with utilities and their impacts on tortoise populations.
Threats Recommendations
The threats network represents a working hypothesis of how various factors impact tortoise populations, singly or interactively (as cumulative, synergistic, or interactive effects), whether biotic, abiotic, or anthropogenic. We encourage managers to think about management in terms of suites of threats. Our model first posits that many threats affecting desert tortoises include multiple factors or various aspects of individual factors. For example, “livestock grazing” includes both horses and burros. Second, not all possible impacts, or mechanisms of mortality, are depicted in the model (e.g., minor sources of

DTRPAC Report page 120
mortality such as ant predation of eggs are not included). Third, all possible linkages important to describing interacting threats may not be included in this model. The connections we chose to include are only those with a more apparent probability of occurring (i.e., with strong empirical or theoretical support) and that likely do not occur only rarely (e.g., meteor falling on a burrow or a tortoise finding, swallowing, and being injured by a balloon). Finally, each linkage is illustrated as equi-probable and equally important; focused research and modeling should reveal relative strengths of the various linkages.
An appropriate application for the model is to identify nodes that have many linkages (incoming and outgoing). Factors represented by these nodes may be key factors that merit focused and priority management action. The next step is to take an hypothesis-driven approach to determine what management actions will have the greatest effects on tortoise populations. If a future recovery team is formed, we see them using this model to make initial recommendations about priorities for management action.
We offer the following recommendations for changes to the Recovery Plan:
• Place a greater emphasis on the interactive, synergistic, and cumulative effects of the multiple threats that occur at any given space and time.
• Research and management should, through a hypothesis-based approach, focus first on those sets of actions and threats that contribute to a greater number of mortality mechanisms (i.e., involve more linkages in Fig. 5.1) or that affect size structure or fecundity.
• The relative strengths of hypothesized connections between threats and mortality should also be assessed (some individual linkages may be more important than multiple linkages from other individual threats). This assessment should be based on data from research designed specifically to elucidate relationships between threats and mortality.
• Data from the previous two recommendations should be combined into a classification system that characterizes threat by spatial extent, frequency, predictability, and intensity.
• Develop and use innovative methods, including GIS and other types of visualization technologies, to visualize and display the temporal and spatial complexities of individual and interactive threats.
DTRPAC Report page 121
“The aims of scientif ic thought are to see the general in the particular and the eternal in the transitory.”
Alfred North Whitehead, in A Dictionary of Scientific Quotations by Alan L. Mackay . (1991)

DTRPAC Report page 122
6. Monitoring, Evaluating, and Delisting
The 1994 Recovery Plan (p. 3) identified the most serious problem facing the remaining desert tortoise populations in the Mojave region as
the cumulative load of human and disease-related mortality accompanied by habitat destruction, degradation, and fragmentation.
As a result, the Recovery Plan recommends a list of recovery actions for each DWMA, and many individual actions have been implemented (GAO 2002; but see Section 4.1). Many of these actions appear to have been selected due largely to their ease of implementation, rather than their effectiveness in improving tortoise status. Furthermore, an uncoordinated approach with a suite of management treatments and hit-or-miss assessment of effectiveness is rarely effective for species recovery. Specific diagnosis is needed to reveal the magnitude of how different factors (or combinations of factors) are affecting a species’ decline, and that diagnosis should guide priorities for the treatments (Caughley and Gunn 1996).
Recovery of threatened and endangered species must often be initiated with incomplete biological knowledge and in the face of multifaceted and intractable ecological, political, economic, and social challenges. Thus, it is difficult to predict with confidence the outcome of proposed management actions. Monitoring the subsequent response of the species to management is therefore essential (Campbell et al. 2002). The Recovery Plan specifically recommended the establishment of “experimental management zones” within DWMAs, in which certain otherwise prohibited activities would be allowed to occur in an experimental context. These zones would allow scientists and managers to determine the effectiveness of different management actions. Unfortunately, experimental management zones have not been created, and a primary criticism of desert tortoise recovery efforts to date has been the lack of necessary analyses assessing the effectiveness of specific recovery actions (GAO 2002).
The importance of data-based decision making is already recognized by the USFWS (Crouse et al. 2002). For example, the USFWS and NMFS habitat conservation planning (HCP) handbook identifies the need for syntheses of relevant biological data and specific methods for determining anticipated levels of incidental take when describing the impacts of the project covered by a given HCP (USFWS and NMFS 1996). Additionally, USFWS specifically recommends adaptive management (see Section 7.2) to adjust to uncertainty due to gaps in scientific information regarding the biological requirements of the species. It is important to allow for changes in mitigation strategies (or other recovery actions) that may be necessary to reach the long-term goals or biological objectives of conservation or other land management plans. Monitoring is essential in an adaptive management program, and it should be designed to ensure proper data collection and scientific analyses. The results of scientific monitoring analyses represent the basis for adjusting management strategies and can lead to more efficient recovery of a species, both in terms of time and money, because recovery actions that are closely monitored can be modified to ensure the

>>-
"'o
o>0<~
=>
o
DTRPAC Report page 123
desired results (Campbell et al. 2002). The need for hypothesis-driven experiments to assess the efficacy of management actions should not be under-emphasized in a revised recovery plan. Other than by coincidence, the effectiveness of recovery efforts depends on the accuracy with which the reasons for decline have been determined (see Section 5), and furthermore, we cannot know for sure without an experimental design that an action and any success were causally related (Caughley and Gunn 1996).
6.1 Strategies of Desert Tortoise Monitoring
6.1.1 Historical Background for Desert Tortoise Monitoring
The keystone-delisting criterion in the Recovery Plan for Mojave Desert tortoises is: “As determined by a scientifically credible monitoring plan, the population within a recovery unit must exhibit a statistically significant upward trend or remain stationary for at least 25 years (one desert tortoise generation)” (Fig. 6.1). This criterion was promoted by the original Desert Tortoise Recovery Team instead of a more common criterion specifying a target population size required for delisting (at the time when the desert tortoise was listed by USFWS, there was a downward trend in population size). The other four delisting criteria for desert tortoise relate to conservation actions required after an upward trend has been achieved.
z us
Fig. 6.1 Idealized population ztrends before recovery planning implemented, as a result of implementing recovery planning, and after delisting.
0.
0.
Historically, monitoring has centered on the tortoises themselves and not on monitoring their environments or threats. For example, the Desert Tortoise Recovery Plan, Appendix A, (USFWS 1994) outlined the need to determine regional densities of desert tortoises to determine if population sizes remain stable, increasing, or declining. Originally, desert tortoise populations were monitored using strip transects (Berry 1979) or plots (Berry 1984). Both of these approaches have provided data on local desert tortoise densities with varying degrees of accuracy and precision, yet neither of these approaches were designed to provide regional density estimates.
Modern monitoring requires going beyond simple tracking of population densities and expanding to document changes in three elements of importance to recovery:
TIME

DTRPAC Report page 124
1. size of populations a. population size includes measures of population density b. aerial extent of population
2. habitat of the species 3. threats to populations
6.1.2 Scope and Purpose of Modern Monitoring
The purposes for monitoring are manifold. For example, monitoring is necessary to assess the efficacy of management actions and can alert managers to catastrophic changes in population size, habitat loss, proliferation of threats, etc. Success must be assessed by comparing it to goals set in advance. Goals and management actions may evolve with additional knowledge, thus effective monitoring is carried out within an “adaptive management” framework (see Section 7.2).
All monitoring should be hypothesis driven or designed to meet management objectives. There should be clearly defined questions and purposes, such as detection of trend or changes in abundance of desert tortoise over time. Note that monitoring for population trend detection should be based on the hypothesis that the population is changing at some rate, whether that is specified as 0% change (i.e., stable population) or some positive or negative rate, and therefore estimation methods must be sensitive enough to detect the desired trend with reasonable probability (power). Monitoring should never be conducted “to do monitoring” just for the sake of monitoring.
Monitoring data and analyses will be the basis for delisting. Although population persistence is the ultimate goal of recovery, the current monitoring program is one dimensional, in that monitoring is only done for densities of tortoises and thus will never inform management to its full potential. We recommend that monitoring should be a multidimensional program, including monitoring of tortoises, but also monitoring the extent and condition of habitat and monitoring impacts to tortoises, as well. Each of these dimensions, in turn, involves multiple scales: individual, population, and species for the tortoise dimension; micro-scale, macro-scale, and landscape scale for the habitat dimension; low, moderate, and high for the impact dimension (Fig. 6.2). The goals of an effective desert tortoise monitoring program minimally should include:
1. Monitoring to assess recovery status of the desert tortoise 2. Monitoring in an adaptive management framework 3. Monitoring that is multi-dimensional 4. Monitoring that is multi-scaled.

M g:~
DTRPAC Report page 125
I M
'
PACT
Fig. 6.2 Dimensions of elements important to recovery, and therefore, needing monitoring.
The types of questions that could be asked of a multi-dimensional, multi-scaled, recovery-focused, and adaptive management-integrated monitoring program include, for example:
1. Are there enough tortoises in the DPS for the population to be self-sustaining?
2. Is the criterion of a 50% probability of persistence for 500 years the best criterion to define recovery?
3. Is the condition of the habitat within a recovery unit improving or getting worse?
4. Is the effective area of tortoise habitat contained within the DPS region being reduced?
5. Are threats to tortoises increasing or decreasing in the DPS region?
The ability to successfully manage tortoises, habitat, or impacts, and the importance of managing tortoises within an adaptive framework, increases as one moves across each axis
DTRPAC Report page 126
of Fig. 6.2. As one moves from the light to dark shades, it becomes increasingly more difficult to manage along particular dimensions, and it becomes more important to manage within an adaptive framework. Monitoring should be targeted more towards the darker areas of the graph, as that information tends to be the most important for assessing recovery status. On the other hand, research should not neglect other areas of the box. Wherever possible, research should focus on topics that inform management needs or directly support monitoring to assess the recovery status of the desert tortoise.
6.1.2 Categories of Monitoring
Four categories of monitoring have been recognized in study of relationships of wildlife populations, habitat, and threats (e.g., Independent Scientific Advisory Board 2003, NMFS 2002).
Implementation Monitoring is monitoring of task completion in a specific project (e.g., miles of habitat fenced, miles of roads decommissioned, completion of reports, etc.). Implementation monitoring results must be presented for projects and need to be clearly documented and synthesized (see Section 4.1). However, sound science requires that project results also be measured in terms of benefits to desert tortoises and habitat.
Tier 1 status and trend monitoring obtains repeated measurements on indicator variables over a period of time, with a view to quantifying trends or abrupt changes over time. For example, availability of water in a habitat improvement project might be measured in August every third year for a 21-year period. This can be a low level of monitoring on individual project sites or on a large area. For example, aerial photography or data layers in a GIS could be used for long-term trend monitoring of riparian or other terrestrial habitat over time. In general, Tier 1 monitoring does not establish cause and effect relationships (i.e., is not a “true” research experiment) and does not provide statistical inductive inferences to larger areas or time periods. It is not necessarily expensive or time consuming. However, Tier 1 mapping or trend monitoring on similar projects replicated over time and space can provide compelling evidence for general conclusions. Also, aerial photography or data layers in a GIS yield a census of the study area, thus eliminating the need for spatial sampling and classical statistical analysis at the scale studied.
Tier 2 statistical monitoring provides statistical inferences to parameters in the study area as measured by certain data collection protocols (e.g., distance sampling for density of desert tortoises). These inferences apply to areas larger than the sampled sites and to time periods not studied. The inferences require both probabilistic selection of study sites and repeated visits over time. Individual proposals can support larger Tier 2 statistical monitoring projects by using the same field methods and methods to select study sites that contribute information to Tier 2 statistical monitoring. Tier 2 statistical monitoring will be required for estimation of parameters such as number of desert tortoises of reproductive age in an area, juvenile production, acres of noxious weed present, etc.
Tier 3 research (effectiveness) monitoring is for those projects or groups of projects whose objectives include establishment of mechanistic links between management actions

DTRPAC Report page 127
and population responses of the desert tortoise or its habitat condition. Tier 3 research monitoring requires the use of experimental designs incorporating “treatments” and “controls” randomly assigned to study sites. Generally, the results of Tier 3 research monitoring qualify for publication in the refereed scientific literature. Examples of Tier 3 monitoring would include: 1) projects to evaluate the effects of different levels of predator control on survival of juvenile desert tortoises, with study areas selected randomly for reference and treatment; 2) projects to evaluate the survival rates of adult desert tortoises in areas treated by different management actions; and 3) projects to evaluate the effectiveness of various land restoration or management techniques.
Tier 3 research and monitoring is that tier most necessary to be hypothesis-based. For example, hypothesis-based monitoring could be used to determine the effects of management actions such as highway fencing or removing grazing. Presence/absence data can be used to identify areas that could be targeted for repatriation or other research projects needed for assessing the efficacy of management (e.g., MacKenzie et al. 2002). For example, data on presence and absence of tortoises collected as part of a project to estimate population density of desert tortoises were used in a kernel analysis of distribution of the desert tortoise in the Western Mojave (Section 4.3). This analysis revealed areas in which tortoises were found formerly and now are largely absent. A similar kernel analysis of carcasses showed that the same geographic area had a wider distribution of carcasses than live animals. Thus, kernel analyses of presence and absence of live desert tortoises and carcasses show an example of where the distribution of desert tortoises was not maintained in parts of designated DWMAs and USFWS critical habitat. Specifically, in an area that was formerly in the range of desert tortoises, there appears to be no remaining population (Fig. 6.3). A GIS analysis of this extirpation illustrates that the consequence of this loss is greater than just the loss of the individual tortoises. For example, the Desert Tortoise Natural Area (DTNA) has become a fragment of habitat separated from the rest of the DWMA to which it belongs. The same damaging results have occurred in Eldorado Valley, Nevada. Time required for Tier 3 research monitoring may be relatively short (e.g., predator abundance following different control procedures) or long term depending on the response time (e.g., response of vegetation to burning treatments).

UVf!' Observ<'ltion
200 1 Ci!lrclIss
Observ<ltions
EcJwalTisForr;tB3s~
• • ~
'"
2:gPa!ms
DTRPAC Report page 128
AI'
MCAGCC
• 2001
• Observll tion
x 2001 No
x x • x
Fig. 6.3 Kernel analysis of presence data for living desert tortoises (green polygons) and carcasses (red outlines.
6.2 Monitoring Desert Tortoises
6.2.1 Monitoring Desert Tortoise Populations
Tier 1 and 2 status and trend monitoring must have clear objectives for current management agencies, but should also provide information on status, trend, and change over relatively large regions and long periods of time. Ideally, the methods will remain useful for a minimum of 25-50 years. For example, the 2001 distance sampling for desert tortoise abundance provides Tier 2 monitoring allowing statistical inferences to be made to large areas of habitat of the desert tortoise. Assessing trends in population numbers is necessary to assess the efficacy of management actions or to determine when delisting is warranted. Additionally, trends must be discernable regardless of variation in periodic estimates of population size (whether that variation is caused by actual variation in population numbers or errors in estimates of population size). With little variation in data, statistically determining a population trend is a simple task (Fig. 6.4). However, large

'002% Annual growth".
'00••• ". - eJ".
'" •• -_...... ~~.-! '00," '".!
'00t ''''.t" '00•~
'''' • •• • • • •• '00 • • • • • '"
" "Yeo.rs
DTRPAC Report page 129
variance in population density estimates for desert tortoises can make determining a trend very difficult. The life history characters of desert tortoises make discerning population trends difficult over a short time (e.g., 25 years; see Fig. 6.4). This type of problem stems from a particular life history typical of desert tortoise (Kareiva and Klepetka1994) and has been previously demonstrated for bald eagle populations (Hatfield et al. 1996).
a. -• SO ( 10% 010)
• .• •
• Fig.6.4 Simulated population growth at a 2% growth rate with (a) a 10% coefficient of •tvariation around the trend and (b) a 40% b. • SD(40% ofD) I •coefficient of variation around the same trend.
• •
,, , 1O " Originally, desert tortoise populations were monitored using total corrected sign transects (Berry 1979) or plots (Berry 1984). Both of these approaches have provided data on local desert tortoise densities with varying degrees of accuracy and precision, yet neither of these approaches were designed to provide regional density estimates. As a result, range-wide distance sampling has recently been implemented to provide regional density estimates. However, modern population monitoring also requires going beyond simple tracking of population densities and should also include documenting changes in the aerial extent of populations.
Long-Term Study Plots
Permanent study plots (see Section 4), and the data gleaned from them, were extremely valuable in identifying the original problems with tortoise populations declining. Similarly, they remain important because of their historic data. However, there are also many problems with using permanent plots to determine population trends:

DTRPAC Report page 130
Plots cover a small percentage (0.2%) of tortoise critical habitat, though plots are separated far enough that tortoises from one plot cannot move to another.
Plots are neither randomly placed in critical habitat, nor are they placed to address hypotheses concerning threats or management actions (e.g., highway fencing, removing grazing, allowing fragmentation due to urbanization, etc.).
Replication of plots within years is inadequate for comparison. Sample sizes of survey years are largely inadequate to yield enough statistical
power to perform a regression of trends in any particular plot. High variability in point estimates within years contributes to the problem of detecting subtle upward or downward trends.
Several plots were abandoned early in the process because they had low tortoise counts. This creates a bias for analysis of trends.
Data from plots violate assumptions in mark-recapture techniques when applied to all size classes, and detectability of tortoises was not evaluated as part of the analyses.
The spacing of plots is different in different places, and the spacing may not produce needed sensitivity to detect changes at different landscape scales.
Continued monitoring of permanent study plots may still be of value for other reasons, however. Consideration may need to be given to abandon sampling plots that do not address specific research or management issues other than “just because a particular plot has been surveyed for a long time.”
o Long-term capture/recapture data from plots has tremendous potential for looking at mechanisms of trends and asking size-class survivorship questions.
o In management or threat-related, hypothesis-based surveys, if data were parsed out from individual grids within plots, more power would exist to determine which threats or management activities are most important.
Distance Transect Sampling
Distance Sampling is a method of enumerating population density from data collected along transects. The method requires that measuring the perpendicular distance from the transect line to all tortoises sited (Anderson and Burnham 1996). Calculating animal density by distance sampling requires mathematical adjustments to account for the extent to which a population can be sampled. For example, one has to know the probability that tortoises on the transect line are available to be detected (active or visible in burrows) and the actual detection rate (termed g0 and often assumed to be 100% in distance sampling). Additionally, one has to measure detectability of tortoises which are some distance away from the immediate transect line, (termed Pa in distance sampling) which is the probability that animals can be seen by the person walking a transect (Anderson et al. 2001).
The further a tortoise is located from the transect line, the more difficult it is to see. In distance sampling, the perpendicular distance from the transect to the animals can be used to estimate Pa by assessing proportion of tortoises seen as a function of distance from the transect. The proportion of observed tortoises is then adjusted assuming the proportion of

DTRPAC Report page 131
tortoises on the transect line is 100%. The statistical approach to calculating Pa requires a sample size of about 60 – 80 observations to obtain a well-formed frequency distribution of observations in relation to distance from the transect line (Buckland et al. 2001). This is the recommended standard, but, in fact, as few as 15 observations have been used in analyses by the USFWS. In good years, a person must walk more than 400 km to see 60 tortoises in most of the listed range, and in some years, it is necessary to walk more than 1000 km to find 60 tortoises (Medica, pers. comm.). The relatively high densities found in the Upper Virgin River Recovery Unit result in much higher encounter rates for that region, and thus the density estimates from that area have greater precision.
Mathematical and statistical research on properties of distance sampling has shown the pooling of data from multiple teams is robust to different abilities of teams to detect desert tortoises, so long as all teams have 100% probability of detection of available animals on the transect line. If desired, allowing for team differences with distance sampling is straightforward, although not with current versions of the program Distance. For example, double sampling with independent observers and logistic regression can be used to adjust for different abilities of teams and other characteristics of desert tortoises such as: tortoises found walking in the open and tortoises found in burrows (e.g., see Manly et al. 1996 for the use of this method in surveys of polar bear). This method can potentially be used to adjust for sources of error including the tacit assumption that tortoises in burrows have the same availability and detectability as tortoises found walking in the open.
Some adjustment factors are also difficult to estimate. For example, the availability of tortoises on the transect line changes among sites, at different times of the day, at different seasons, and among years (Fig. 6.5). The probability of detection of available tortoises on the line may vary from one team to another. However, data from across the entire California and Nevada portion of the range are currently lumped to calculate correction factors for density estimates of tortoises for the entire Mojave range, exclusive of the Upper Virgin River (the Utah Division of Wildlife Resources has been estimating tortoise density independently of other recovery units since 1997). Tortoise activity is calculated using a small number of focal tortoises, which are monitored to find the proportion of animals that are active.

>-aQ....IIIE~
~
DTRPAC Report page 132
0 0 .2 0 .4 0.6 0.8 1.0 20
1997
15 Fig. 6.5 Tortoise activity measured over a three year period at Bird Spring Valley, 10
NV. Tortoise activity is expressed as the proportion of animals active for each 5 hour during each week of 20
the year and ranges from 0 to 1. The gray areas
15represent times for which tortoise activity was not 0 sampled. Warmer colors
10indicate high proportions of animals active, and cooler colors indicate fewer
5animals active. 20
15
10
•5
Mar. May Aug. Oct. Dec.
Month of the Year
Although tortoise densities should be easy to calculate using distance sampling (because tortoises are diurnal, tortoises are found in open habitat, and their activity is linked to drought severity index), it is not always the case that tortoises are easy to enumerate. Tortoise positions that are cited while sampling include burrow (visible), deep (not visible), open, under vegetation, hidden, tortoise in the open but near burrow. For each recovery unit the percent activity of focal animals (n = 5-18) is measured. The mean of observations during when transects are surveyed is calculated. Unfortunately, the software used to calculate tortoise densities (Program Distance) currently allows the use of only one value of g0, and this is a serious limitation to the analyses. New software or data collection methods (e.g., double sampling with independent observers) need to be developed allowing those working with desert tortoises to account for all the variables affecting tortoise activity and detectability.

DTRPAC Report page 133
Power Analysis - A power analysis was performed to estimate the ability to detect trends in population size (Link and Hatfield 1990, Hatfield et al. 1996) in relation to different reasonable annual percent population growth rates (e.g., those given in the Recovery Plan, and in Doak et al. 1994), with ranges in error generally encompassing those currently encountered using distance sampling in the Mojave Desert (Nussear 2004). For an entirely reasonable gentle growth rate (1%), the coefficient of variation would have to be much lower (i.e., 12 %) than current technologies are producing (9.5 to 56.2%, average = 20%) in order to detect a trend statistically, based on current population sizes. Currently, those working on distance sampling are trying to reduce variance in estimates of Pa and g0, but it may be impossible to reduce variance enough to be able to detect subtle trends typical of the natural growth rates of tortoise populations. Therefore, transect methods minimally require modifications to increase the precision of population estimates to the point where they may be useful for analyses needed for delisting. The detection of steeper trends, such as those of tortoise populations in the West Mojave, is currently possible with the level of variation achieved using distance sampling.
Various scientists are working on modifications to the way data are collected and exploring and evaluating new approaches to analyzing data. These modifications include the length and shape of the transects, the number of technicians working on the transects, the manner in which the data are collected, the configuration of random start locations for the transects, the areas included/excluded for sampling, etc. Each of these approaches needs to be evaluated in terms of the potential to discern subtle changes in population size. Modifications have been suggested based on the tradeoffs between the precision of data points and the number of data points.
There is some doubt that precision of estimates from distance sampling is being evaluated correctly. The sampling unit is the transect, and the “sample size” is the number of transects in a particular study area, not the number of desert tortoises observed. Program distance should be used to obtain Pa. Then, given g0 and an independent estimate of the proportion of individuals missed on the transect lines, call this proportion Pt, the abundance on a given transect is ni/(Pa*g0*Pt*Area Searched), where ni is the number of desert tortoises seen on “the transect” and Area Searched in the denominator is adjusted for length and width of transect. Data might be pooled to estimate the factors: (Pa*g0*Pt), but the variance of the survey should be computed based on the values of ni/(Pa*g0*Pt) from each transect. Finally, this process should be bootstrapped to bring in the variation due to estimation of the components of (Pa*g0*Pt). Pooling the data and running it through program distance one time will give a model-based estimate of variance that does not reflect variation from transect to transect. Clearly, population enumeration via distance sampling needs refinement and evaluation, including evaluating the efficacy of the approach all together. This refinement can best be accomplished by establishing a science-savvy monitoring committee who can evaluate and direct change in approaches to monitoring methods and approaches.
DTRPAC Report page 134
6.2.2 Monitoring Individual Desert Tortoises
Comprehensive monitoring programs allow biologists and managers to understand the dynamics of a species fully. If applied toward desert tortoises, this type of program would include asking different questions on many different scales, ranging from the level of the population to the individual level. This section discusses aspects of individual desert tortoise monitoring.
Condition indices
Examining changes and variation in the body condition of individuals may also provide another method for modeling and mapping habitat condition. It could be useful to develop a body condition index for individual desert tortoises that included more information about the health of the individual than do current indices. A condition index might lead biologists to mechanisms contributing to population dynamics. For example, snakes show strong correlations between body condition and reproductive fitness (C. Peterson, pers. comm.; but see Wallis et al. (1999) for contrasting results with regard to desert tortoise reproductive output).
Measuring the condition of individuals need not be separate from monitoring population size. A condition index may provide evidence for mechanisms behind changes in population size. For example, a measure of condition could potentially link the risk of mortality to individual covariates. That risk could help contrast between a stable and declining population. Using a more formalized monitoring structure allows some pressure to be taken off of requiring high precision of density monitoring (i.e., density measurements are not relied upon to answer all questions about a population). Each scale that is monitored should have different objectives and a coordinated effort for addressing each objective. For example, following individuals (“sentinels”) could be used to determine extent of certain threats, but not to answer exhaustive questions.
Behavior
We also explored information about population viability contained in the behavior of individuals. Understanding desert tortoise behavior can be very important to developing means to achieve recovery. The actions of living tortoises within their habitats contribute to survival, growth, reproduction, and ultimately to population persistence.
Tortoise behavior, as it relates to recovery, consists of the cumulative actions carried out by individual desert tortoises. The goal is to recognize critical and generalizable behavioral patterns among desert tortoises. This comes from the study of individual animals under natural and experimental conditions.
The behavior of individual desert tortoises is the result of complex interactions among six factors. Behavior should be analyzed in the context of the interplay of these six effects.

DTRPAC Report page 135
1. Genetic Make-up - Individuals are endowed with a unique genotype that will result in future individualized responses. More importantly, natural selection and drift can result in genetically-derived behavioral differences among populations (e.g., burrowing in soil versus using caves in rocks).
2. Developmental Conditions - Developmental conditions can strongly influence genetic expression and subsequent behavior. For example, maternally-derived nutrients and hormones, as well as environmental contaminants within the egg, influence neonate performance.
3. Physiological Traits - The ability and manner by which a tortoise responds to environmental conditions, and exposure to disease, is a function of its physiological capabilities. Because physiological limits and capabilities themselves are determined by genes, development, age, sex, and past physiological events, behavioral responses of tortoises to prevailing conditions may not be predictable without detailed investigation (Zimmerman et al. 1994). Furthermore, as the demography of the population shifts or as the habitat is transformed, mean physiological responses across a population may shift.
4. Morphological Traits - Genetic make-up, development, and past physiological events determine morphological characteristics. Morphology and behavior are deeply intertwined. Morphology biomechanically limits what behaviors can be performed (e.g., foraging performance, vagility, crossing barriers, etc.).
5. Environmental Conditions - Generally, an animal will exhibit only a subset of its total behavioral repertoire. Behaviors often are cued by prevailing environmental conditions. Humans are introducing inordinate new cues into the Mojave ecosystem (e.g., intentionally placed barrier fences along highways and changes of vegetation due to invasions of exotic weed species).
6. Cumulative Individual Experiences - With time, an animal accumulates a set of individual experiences that can strongly influence its behavioral response to a stimulus. For these kinds of flexible behavioral responses, older individuals will tend to express successful behavioral responses (natural selection). Although counter-intuitive, net behavioral responses within a population can be a function of demography even after controlling for differences in 1-5. If tortoise lifespan has been shortened due to human-caused mortality, tortoises that once contributed most to reproduction (mature and experienced individuals) may now be lost on a regular basis.
Most behaviors of primary conservation and recovery importance are poorly understood or unknown at this time. Because the recovery of the desert tortoise is intrinsically a demographic problem, it is valuable to take a demographic approach to tortoise behavior. Doing so illustrates the central role of behavior in the recovery of the desert tortoise and identifies significant gaps in knowledge of important tortoise behavior.

DTRPAC Report page 136
Behavior of Embryos and Neonates
Post-hatch performance of young birds and turtles is linked to egg quality, which in turn is linked to adult female physiology and the time of egg formation. Egg size (Roosenburg and Kelley 1996), nutrient endowment to the yolk, and the endowment of maternally derived steroids (Pilz et al. 2003, Sockman and Schwabl 2000) affect the behavior and performance of neonates following hatch. Variation in neonate tortoise performance and its relationship to maternal quality are unknown.
This seemingly obscure issue is linked to tortoise conservation and recovery in two important ways. Adult females that face poor quality foraging habitat likely will produce fewer or lower quality eggs. Secondly, if prevailing mortality patterns act to remove mature and experienced (i.e., high quality) females, egg quality and quantity likely will decline.
Post-hatch movement and habitat selection of neonate tortoises appears to be largely unknown but likely is very critical to population dynamics. The Mojave environment is heterogeneous. It is plausible that only a small subset of the general environment is adequate for the survival and growth of neonate tortoises, so these special habitats become extremely important to conservation and recovery even though they may represent a small percentage of available habitat. Do neonate tortoises go on a “random walk?” Are they following cues to important habitat? Are they moving independently of one another?
A corollary to this issue is nest-site selection by breeding females. Adaptively, one might predict that females will select nest sites close to suitable neonate habitat if such habitat is available and females have knowledge of it. Are females limited in nest-site selection? Possible limits might be: inexperience (older may do better), territoriality, loss of quality nest sites, barriers to movement to preferred sites.
Behavior of Juveniles
Desert tortoises have a long juvenile period. Prolonged juvenile periods in birds and mammals frequently are attributed to the need for learning as well as for time needed to grow to breeding size. Desert tortoises grow and reach sexual maturity faster when fed high-nutrition diets (Christopher et al. 1998), and gopher tortoises do the same in high-nutrition habitats (Mushinsky et al. 1994). Apparently, little thought has been given to the possibility that the juvenile period in tortoises has important functions other than a prolonged effort to acquire the nutrients to grow to some predetermined breeding size (Wilson et al. 1999).
Certainly, juvenile tortoises engage in a suite of behaviors central to future population dynamics. Most importantly:
Movement - The degree to which juvenile tortoises move through their environment is critically important because of its link to three crucial phenomena.
A) Juvenile dispersal - Dispersal determines gene-flow, the “connectedness” of populations, and the genetic signal which we attempt to decipher in evaluating

DTRPAC Report page 137
populations. Without significantly better understanding of juvenile dispersal, informed recovery planning will be severely hampered.
B) Disease transmission - It is likely that juveniles move more than adults in the process of finding a place to settle. It also is likely that juveniles encounter more tortoises in this process than do settled adults. Hence, juveniles moving through the environment and interacting (agonistically?) with other tortoises could be a central mechanism for disease transmission. We cannot verify or discount this plausible scenario without measuring juvenile movement.
C) Information gathering - The juvenile period can be an important period of information gathering. Presumably, juveniles learn locations of food, water, shelter, potential mates, and other critical information during the juvenile period. If juveniles necessarily wander during this period of their lives, then their vulnerability due to wandering may remain high regardless of apparent environmental conditions.
Foraging and seeking shelter to promote growth - Nutrition, water, and thermal needs differ for juveniles relative to adults. Do juveniles have special habitat needs related to this growth phase of their life? Are these habitat needs being met?
Gender differences in juvenile behavior - Little to nothing is known here.
Behavior of Adults
Considerably more is known about adult behavior, although it remains insufficient for well-informed conservation planning. Key issues are:
Disease by behavior interplay - Disease regularly causes behavioral changes in animals (listlessness and other forms of morbidity, etc.). If disease changes behavior and detection during surveys, then surveys may fail to provide accurate information.
Mating system - Effective population size and genetic signatures can be influenced by mating system. Mating systems can create differential vulnerability of the sexes during movements. Encounters with vehicles, barriers, or humans might be influenced by mating systems. Disease transmission might be affected by searching for mates and courtship.
Sperm storage – With sperm storage, following insemination adult females become temporarily independent of males for reproduction. This independence lasts for the duration of effective storage. Furthermore, if males are polygynous, then adult male survival becomes relatively less important than female survival.
Breeding dispersal – Especially, do females return to nest areas? Are some females “sinks” by returning to traditional sites that actually fail?
Circannual rhythm – Circannual rhythm can affect detectability, interacting with good food years.

DTRPAC Report page 138
6.3 Habitat monitoring
When threats to habitat exist, it may be as important to monitor habitat as it is to monitor the focal species. In this context, a bias toward monitoring of focal species is particularly undesirable, because problems with habitat loss that have immediate consequences are deprived of attention and resources (Campbell et al. 2002).
Remote Sensing for Tier 1 monitoring of status and trends - Aerial photography, digital airborne data, and satellite data are all possible remote sensing technologies that could be used to monitor habitat (M. Cablk, pers. comm. 2003). Remote sensing will not work well unless habitat monitoring experts work within the decision-making process. Types of habitat features that could be measured using remote sensing include vegetation association, slope, elevation, micro-conditions, elevation limits, geomorphology, and urban/agricultural land, etc. Once tortoise experts have determined which features are important to measure, the spatial, spectral, and temporal resolution of those features must be determined. This approach makes it more likely to capture the essence of habitat and how best to measure it. Change detection analysis would be used to determine seasonal or annual differences.
Habitat Modeling - New techniques have also been developed in environmental and habitat mapping/modeling (C. Peterson, pers. comm. 2003). These approaches determine key features and assess those features along an environmental gradient. This has been done well for some species using simple habitat variables like temperature and moisture. Analysis tools include estimation of probability of occurrence or abundance of desert tortoises by multiple regression on habitat variables. In addition, resource selection functions for habitat use can be estimated by contrasting GIS or “on the ground” data between transects with and without detection of desert tortoises (Manly et al. 2002).
Monitoring Recommendations
• A coordinated, integrated, collaborative, range-wide monitoring program is needed. This program must be comprehensive and multi-scaled in its approach. The elements of the program should include the aerial extent of population, density of populations within aerial extent, qualitative and quantitative gain/loss of habitat, quantitative trends for threats, and possibly a condition index of individuals as an indicator of the population status.
• There should be a science team formed to advise USFWS and land managers on how to make, and keep, the monitoring efforts scientifically credible and to help adaptively manage monitoring efforts to be as efficacious as possible. This team should also help in the prioritization of monitoring efforts. To be most useful, study design and data collection protocols for Tier 1 and 2 monitoring should be standardized.
• The monitoring program should include an outside panel of experts to evaluate and recommend how data should be collected and analyzed. The DTRPAC and outside

DTRPAC Report page 139
experts agreed that a monitoring program is not useful unless it has a centralized organization, which can provide USFWS with information needed to make informed decisions.
• A centralized monitoring program should be rigorous and formal wherein agencies, counties, and municipalities contribute to a centralized fund from which integrated monitoring projects can be funded which adhere to consensuses on monitoring priorities, approaches, data standards, etc. It is imperative that sufficient funding is secured to implement a scientifically rigorous monitoring program, including not only field collection of data, but also quality control measures and data management.
• There should be a top-down organization of personnel to conduct monitoring in such a way that a formalized process is followed for data collection, quality control, and data archival. Standardized data collection and data sharing will allow collaboration so that meta-analyses and analyses beyond the calculations of tortoise densities can be done. All parties who collect monitoring data should have an agreement for data sharing/pooling and documentation of metadata, as well as agreements on publication of the data/analyses.
• All Tier 1 and 2 monitoring should be designed to meet current management objectives but should be general enough to monitor trend and changes over a relatively long time period, say 50 years. All Tier 3 monitoring should be hypothesis driven. In other words, Tier 3 research should be experiments to test pre- and post-management actions over relatively short time periods.
• Protocols for Tier 3 research monitoring should include identification of specific statistical and modeling procedures for analysis of data collected. There should be anticipated analysis methods for Tier 1 and 2 status and trend monitoring, but these analysis methods are less critical than for Tier 3 research because Tier 1 and 2 monitoring data should have utility over a relatively long time period. In fact, analysis methods for Tier 1 and 2 monitoring data that will be used in, say 2025, have probably not yet been envisioned.
• Monitoring should be promoted to detect change at different scales or levels of integration (Allen and Hoekstra 1992).
• Data on habitat and threats should be collected as part of tortoise density monitoring to extend the scope of density analyses and enhance the ability to develop correlation-regression models between abundance of desert tortoise, habitat, and threats. This would include association of habitat and threat indicator variables (e.g., length of roads per unit area in buffers surrounding transects) with individual transects used in distance sampling.
• There should be a workshop to bring experts on various kinds of monitoring together to map a plan for developing monitoring of habitat and threats. Additionally, there should be a summit on statistical approaches to density monitoring. This summit

DTRPAC Report page 140
should bring together statisticians and tortoise biologists to map out a plan for improving density monitoring.
• There is value in permanent study plots only if the data are used more fully. The use of permanent study plots should be evaluated relative to their utility in answering specific research or management questions. Some established plots may have outlasted their scientific usefulness, while others may need to be established to answer new questions (e.g., relative to threats and recovery action effectiveness or DPS differentiation).
• The value of permanent study plots is also based on the availability of raw plot data. Without the ability to pool data from all areas and projects, plot data do not justify their expense. It is difficult to justify the amount of money spent on data collection from plots without having open access to the full data set. Inter-agency coordination should be imposed to acquire all necessary data for analyses.
• Continue to use transect sampling, as these data are extremely valuable. Develop custom computer software to incorporate unique needs for tortoises (including modeling go and Pa). Currently, it is not possible to modify the computer software program DISTANCE. Do research to find ways to reduce variance in estimates of availability and detectability, including variance created due to the clumped distribution of tortoises in the landscape. Investigate the use of bootstrapping of individual transect lines to evaluate a design based estimate of variance of density and abundance of desert tortoises.
• There should be continued work to modify distance sampling to get the most precise estimates possible. This includes, for example, improving detection rates and adding environmental covariates in models of population density.
• There should be an attempt to determine the minimum rate of growth or decline detectable by the most optimistic methods. This would produce an answer to the question, “in the best of all worlds, is there power to detect a certain level of decline or increase?”
• Distance sampling as implemented in 2001 combined with habitat and threats variables measured at the same sites continues to hold great promise for long-term status and trend monitoring. If distance sampling is shown not to have enough power to track population trends, then it may be necessary to redirect effort towards detecting trends in other objects or processes, such as changes in carcass density or tracking die-offs, etc. The downside to this suggestion is that some objects or processes may have a time lag that would preclude seeing a decline in adequate time to respond with a change in management.
• Transect sampling associated with distance sampling for abundance as implemented in 2001 should be refined to collect considerably more data. Additional data could include habitat measures such as rainfall, vegetation, etc. as well as measures on individual tortoises such as blood samples for assessing stress, health, genetic
DTRPAC Report page 141
distinctness, etc., and the ability to determine remotely sensed/GIS data such as linear density of roads in buffers surrounding transects.
• Density monitoring needs to be recognized to have several components: training field crews, field collection of data using standardized data collection protocols, data quality assessment and quality control, data archival, metadata (methods) archival, and data analysis and reporting. Too frequently in the past, monitoring has expended virtually all funds on field collection of data, and the other components that should be included in a comprehensive monitoring program have been neglected.
• If estimates of tortoise density are determined to be too variable to be useful in assessing effectiveness of management actions, then perhaps density estimates should be treated as “density indicators.” This approach should be used only after it has been determined that assessing density cannot be accomplished to obtain useful, precise, and accurate estimates.
• There should be an attempt to assess the extent to which data on presence and absence of tortoises could be useful to the goals for monitoring. The method of MacKenzie et al. (2002, 2003) should be explored as a means to enhance monitoring. The methods of Manly et al. (2002) for estimation of resource selection functions should be considered as a means of relating habitat use to measured indicators of habitat quality/quantity or threats.
• A health, or physiological status, index needs to be developed from body condition measurements of individual tortoises. The condition index of Nagy et al. (2002) may not be sufficient by itself, because it gives no information on levels of stress, immune system function, etc., and little information on changes in body mass not attributable to water gain/loss (see also Hayes and Shonkweiler 2001).
• Initiate a rapid response program to investigate morbidity and mortality events, using existing programs (e.g., Biodefense, Foodnet) as models (i.e., develop standard operating protocols so that when a die-off event occurs, response actions happen quickly). Develop standard diagnostic and evaluation protocols to determine the nature and severity of a disease threat. Develop appropriate management strategies for containing or removing a disease threat, if necessary. Develop appropriate ways of evaluating the success of management strategies.
• Habitat and threats monitoring by remote sensing should be researched.

DTRPAC Report page 142
6.4 Delisting Criteria
As given in the Desert Tortoise Recovery Plan, five criteria must be met for delisting of the desert tortoise (USFWS 1994).
Criterion 1
“As determined by a scientifically credible monitoring plan, the population within a recovery unit must exhibit a statistically significant upward trend or remain stationary for at least 25 years (one desert tortoise generation).”
Criterion 2
“Enough habitat must be protected within a recovery unit, or the habitat and the desert tortoise populations must be managed intensively enough, to ensure long-term population viability.”
Criterion 3
“Provisions must be made for population management in each DWMA so thatpopulation lambdas are maintained at or above 1.0 into the future.”
Criterion 4
“Regulatory mechanisms or land management commitments have been implemented thatprovide for adequate long-term protection of desert tortoises and their habitat.”
Criterion 5
“The population in the recovery unit is unlikely to need protection under the Endangered Species Act in the foreseeable future. Detailed analyses of the likelihood that a population will remain stable or increase must be carried out before determining whether it isrecovered. (a) Fluctuations in abundance, fecundity, and survivorship; (b) movements ofdesert tortoises within the area and to or from surrounding areas; (c) changes inhabitat, including catastrophic events; (d) loss of genetic diversity; and (e) any otherthreats to the population all might be significant and should be important elements thatshould be considered in such an analysis.”
All but the first criterion deal with securing habitat into “the foreseeable future” for the recovered populations and remain mostly relevant, except for changes in wording needed to accommodate a new first criterion. The first criterion may require replacement or modification. The Recovery Plan called for creation of areas for intensive management of tortoise populations that were large enough (at least 1000 square miles) to permit recovery of the populations within them after the populations had declined to minimum permissible population sizes, as determined by population viability analyses. Although this prescription followed logically from a heuristic model of what was known about population dynamics in the desert tortoise, statistical methods now available suggest that it may be impossible to monitor populations precisely enough to determine if the prescription was effective. Power

DTRPAC Report page 143
analysis of current monitoring approaches to estimate tortoise population densities shows that it will be nearly impossible statistically to discern an upward or stable population trend, even over a 25-year time span, which is a requirement of the current criterion. On this basis, the first criterion needs to be modified, and the revised criterion should incorporate the following considerations.
• The criterion of a population remaining at least “stationary” does not work well, insofar as high variance in population estimates often makes a population’s trending upward or downward statistically indistinguishable from its remaining “stationary.”
• The criterion of a population remaining at least stationary draws attention exclusively to population size and excludes concern for changes in habitat and threats, which are significant components of a well-conceived recovery and monitoring program.
• The criterion of a population remaining at least stationary ignores multiple scales of measurement, disregarding important information on population well being available at the levels of the individual (e.g., physiology and behavior of individuals) or landscape (e.g., ecosystem processes, such as habitat fragmentation and/or degeneration), and failing to define relationships among the components of a well conceived recovery and monitoring program.
• The criterion of a population remaining at least stationary suffers statistically from lack of power and high levels of risk from both Type I and Type II statistical errors.
• The definition of a “population” excludes the possibility of tortoise populations acting as metapopulations.
These considerations highlight the fact that that the heuristic model of desert tortoise population dynamics used by the Recovery Team essentially is obsolete. In particular, the Recovery Plan may have (a) overestimated the importance of local population dynamics, (b) underestimated the importance of metapopulation processes (a concept in its infancy in 1994), and (c) greatly underestimated the time required to observe evidence of recovery. Population die-offs appear to occur commonly, and local populations seem to recover from those die-offs at different rates. Some local populations appear historically to have achieved high densities and subsequently all to have suffered die-offs (this pattern has been seen especially in the Western Mojave and in Southwestern Utah, but it also may have been present in other places, such as Piute Valley, Ivanpah, Chuckwalla Valley, and Fenner Valley). These slowly accumulating facts suggest that the desert tortoise exists in an ecological system in which metapopulation dynamics may have been historically important to the long-term persistence. It may be the case that, for the desert tortoise, nobody has yet seen a single cycle of local population extirpation and re-colonization that may occur naturally as a part of metapopulation dynamics. Habitat fragmentation by satellite urbanization and high-density highways currently may be preventing natural metapopulation processes and, ultimately, species recovery.

DTRPAC Report page 144
The metapopulation model of recovery contrasts deeply with the heuristic model used by the Recovery Team. If the metapopulation model accurately describes the ecology of the desert tortoise, then it will be necessary to understand the dynamics of recovery for both local populations and for entire metapopulations, within an ecosystem that is permanently disrupted by habitat loss, fragmentation, and degradation. In this disrupted state, metapopulations are not likely to recover without artificial enhancement of metapopulation processes. For example, if fragmentation ablates normal processes of recolonization of local populations after die-offs, then it may be necessary to “head start” recolonization of local populations from hatchery stocks. This, and similar, management actions were not considered in the original Recovery Plan. Employing the metapopulation model will require considerable ecological wisdom, and we recommend that the new science advisory committee for the USFWS assemble appropriate expertise, perhaps in a workshop, to develop new prescriptions for management that will lead to delisting. It will be necessary for such a group to develop new criteria for assessing recovery of a metapopulation. In particular, it will be necessary to develop (1) indices of poor metapopulation function that do not suffer from the kinds of statistical and other inadequacies described above (perhaps indices that focus on extreme, i.e. minimum, values rather than on central tendencies); (2) monitoring schemes that are sensitive enough to reveal relatively subtle changes in demography, habitat, and threats (perhaps schemes that focus on presence/absence of critical size classes in a large number of small, widely spread quadrats rather than on quantitative assessment of population size in a small number of locations); and (3) management plans that compensate for ecosystem dysfunction (perhaps plans that, of necessity, incorporate currently controversial techniques such as head starting, translocation, and maintenance of so-called "assurance colonies").

DTRPAC Report page 145
“True science teaches, above all, to doubt and be ignorant.”
Miguel de Unamuno, The Tragic Sense of Life. (1913)

DTRPAC Report page 146
7. Integrating Research and Management
The mission of the DTRPAC was to analyze the current state of research on the desert tortoise, to identify important gaps in our knowledge about the desert tortoise, and to suggest ways in which those gaps could be filled. The results of the efforts of the DTRPAC to accomplish this mission are displayed in previous chapters. Although its mission did not include recommendations about management directly, the DTRPAC concluded that research and management are so closely intertwined that it would be remiss in not addressing relevant management issues. Furthermore, the DTRPAC strongly suggests that no matter how good and complete the research effort may become, it will be for naught if it does not become part of a well-conceived management plan. We begin by reviewing the research needs.
7.1 Synopsis of Recommendations
We collected the various recommendations in previous chapters, paraphrased them for clarity, and organized them topically, by Research and Monitoring, Cooperation and Coordination, Data Management, and Other Management Recommendations. The list of these recommendations follows (the chapter from which each need was extracted is included, in parentheses).
7.1.1 Research and Monitoring
• Improve understanding of genetics and the relationships between genetics and other attributes
Genetic core units, boundaries, and gene flow need to be examined. (3)
Patterns of differences in ecological. morphological, behavioral, demographic, and health status of each unit needs to be determined. (3).
More about the ecogeography of genetics of pathogens and hosts must be learned (4).
• Re-evaluating the status of DPSs and the positioning of DWMAs
DWMAs within each DPS should be geographically revised to maximize their conservation potential (3).
• Improve population sampling methods
There should be enough study plots to represent the different scales of management areas (4). Alternatively, using 5-10 key permanent study plots as indices of change, while abandoning sampling of other plots, should be considered (6).

DTRPAC Report page 147
The data should be used more fully, and the raw plot data pooled from all areas and projects (6).
Modify distance sampling analyses to get the most precise estimates possible, including modeling G0 and Pa (6).
If distance sampling is shown not to have enough power to track population trends, then redirection of effort towards detecting trends in other objects, processes, or indices, such as changes in carcass density or tracking die-offs, should be considered (6).
Determine the maximum rate of growth or decline detectable by the most optimistic methods (6).
The method of MacKenzie et al. (2002), looking at presence/absence, should be explored as a means to enhance monitoring (6).
Statistical tests need to include measures of power and deal with both Type I and Type II statistical errors (6).
If densities are determined to be too variable to be useful in assessing effectiveness of management actions, then density estimates should be treated only as “density indicators.” (6).
• Develop tools
Innovative methods for the visualization and display of individual and interactive spatial and temporal threats, including GIS and other types of visualization technologies, should be developed and evaluated (5).
Inexpensive and more field-portable tools and diagnostic tests to study disease should be developed (4).
Stress tests that are applicable to wild tortoises (e.g., adrenocorticotropin hormone (ACTH), phytohemagglutinen (PHA), and sheep red blood cell (SRBC) challenge experiments, to examine adrenal gland response, T-cell response, and B-cell response, respectively), should continue to be developed (4).
Habitat monitoring by remote sensing should be developed (6).
• Improve the focus on the recovery goal
In the threats network, the relative importance or hypothesized nature of each linkage between impacts and mortality sources should be weighted. Research and management should, through a hypothesis-based approach, focus on those actions/threats that are more heavily weighted (5).
Refocus the general approach to research on disease, treating it as part of a network of threats (5).
DTRPAC Report page 148
Develop clear standards for determining whether individuals in a population are healthy or not and whether they have been stressed or not (4).
A study of the epidemiology of URTD is badly needed. (2)
Sources of mortality, particularly their importance relative to each other, needs to be better explored as age-specific survivorship. (2)
The impact many threats have on tortoise populations is poorly known and in need of investigation to evaluate their relative importance and develop effective mitigations to reduce their impacts. (2)
Alternative protective measures need to be compared experimentally to help ensure that useful methods are used. (2)
Long-term studies, that include standard life-history traits, are needed on tortoise demography. (2)
The natural history of host-parasite associations for the major disease relationships should be more deeply elucidated (3).
All monitoring should be hypothesis driven (6).
Recognize density monitoring as having several components: training field crews, field collection of data, data quality assessment and quality control, data archival, and data analysis and reporting (6).
• Improve information gathering
Health assessments should be added to the information gathered in ecological studies and monitoring. A health, or physiological status, index needs to be developed from bodily condition measurements of individual tortoises (6).
Current serological surveys for M. agassizzi should be continued, adding screening for THV and other Mycoplasma species, as assays become available (4).
Continue necropsies, if a rationale for these necropsies can be developed in relation to the potential for information from them to affect new knowledge and management (4).
Data on habitat and threats should be collected as part of tortoise density monitoring, to extend the scope of monitoring (6).
Monitoring should be pitched to detect change at different scales or levels of integration (6).
• Improving information dissemination
Inform researchers about both the qualities and the shortcomings of diagnostic tests for Mycoplasma species and URTD (4).

DTRPAC Report page 149
Inform researchers about the value of different diagnostic tests in addressing different goals (4).
Explicit acknowledgment describing what data are not available should be made, to allow a more accurate assessment of uncertainty and risk in the planning process (6).
7.1.2 Coordination and Cooperation
• Improve the utility of monitoring efforts
Coordination of effort on monitoring can be improved if USFWS would ensure that all monitoring data are reported annually as part of the federal permitting process. Then the USFWS could facilitate sharing data among researchers as part of the USFWS responsibility to obtain, analyze, and distribute reports on monitoring data (4).
• Improve the focus on recovery goals
Research and management should, through a hypothesis-based approach, focus on those actions/threats that are more heavily weighted (5).
Provide quantitative biological goals for the conservation/management plan or recovery action (6).
• Develop research agendas
Develop multi-disciplinary, long-term research agendas to understand the network of threats. Include epidemiologists and population biologists in developing the research agendas (4).
There should be a workshop to bring experts on various kinds of monitoring and statisticians together to map a plan for developing monitoring of habitat and threats (6).
Initiate a rapid response program to investigate morbidity and mortality events (4).
Ensure that killing seropositive, but otherwise healthy individuals, is limited (4).
There should be coordinated effort to conduct monitoring, including having a formalized process for data collection, quality control, and data archival (6).
A centralized, integrated, collaborative, range-wide monitoring program should be initiated (6).
Recognize density monitoring as having several components: training field crews, field collection of data, data quality assessment and quality control, data archival, and data analysis and reporting (6).

DTRPAC Report page 150
• Employing “outside” expertise
Include epidemiologists and population biologists in developing the research agendas (4).
There should be a science team to advise the USFWS on how to make and keep the monitoring efforts scientifically credible; to help adaptively manage monitoring efforts to be most efficacious; and help in prioritization of monitoring efforts (6).
There should be external peer review by an independent panel of experts that would periodically review the monitoring program and the science advice given (6).
The monitoring program should include an outside panel of expert analysts to evaluate and recommend how data should be collected and used (6).
There should be a workshop to bring experts on various kinds of monitoring and statisticians together to map a plan for developing monitoring of habitat and threats (6).
• Improve information dissemination/access
There should be imposed inter-agency coordination to acquire all necessary data for analyses (6).
7.1.3 Data Management
• Improve information dissemination/access
Ensure that all important data exist, are accessible to researchers, and are explicitly summarized (4).
Explicit acknowledgment describing what data are not available should be made, to allow a more accurate assessment of uncertainty and risk in the planning process (6).
Information/data should be maintained in an accessible, centralized location (6).
7.1.4 Other Management Recommendations
• Re-evaluate the status of DPSs and the positioning of DWMAs
DWMAs within each DPS should be geographically revised to maximize their conservation potential (3).
• Improve the focus on the recovery goal
Research and management should, through a hypothesis-based approach, focus on those actions/threats that are more heavily weighted (5).

DTRPAC Report page 151
The list of research needs suggests attention be directed to at least three management areas: adaptive management, cooperation and coordination, and data management. We discuss each of these areas successively.
7.2 Adaptive Management
Adaptive management can be defined as a flexible, iterative approach to long-term management of biological resources that is directed over time by the results of ongoing monitoring activities and other information. This means that biological management techniques and specific objectives are regularly evaluated in light of monitoring results and new information on species needs, land use, and a variety of other factors. These periodic evaluations are used over time to adapt both management objectives and techniques to better achieve overall management goals as defined by measurable biological objectives.
Adaptive management of recovery efforts for the desert tortoise must be designed to provide an objective, quantitative evaluation of the effectiveness of management actions in attaining program goals (Kareiva et al. 1999). It should provide a scientifically sound approach to provide resource managers with objective scientific data and analysis upon which to base management decisions as well as scientifically valid evaluation of management actions.
A critical element of any adaptive management program is the database upon which management decisions can be made. Such a database can provide a basis for evaluating species, habitat, and/or threats status and trends, and it can be used to evaluate management actions directed at recovery. Adaptive management requires an objective and scientifically-valid program for collecting data coupled with supervision of an accessible database by a competent scientific authority.
A Desert Tortoise Recovery Office (DTRO) should be established in the USFWS to oversee collection, quality control, and archival of scientific data as well as analysis of data and generalization of results from data. This office should be advised by a Science Advisory Committee (SAC; see Section 7.3.2) composed of credentialed scientists who have expertise in conservation biology, statistics/experimental design, and herpetology. The DTRO would facilitate both collection and distribution of data from and to scientists, managers, and stakeholders. Additionally, this office should be in charge of data security. This office should appoint a database manager (potentially as a contract) that will be in charge of long-term maintenance of the database
7.2.1 Ingredients of Inventory, Monitoring, and Research
Inventory, monitoring, and research include six key steps, which when appropriately linked to decision making, will maximize the collection and integration of objective, reliable data into the decision-making process and is intended to minimize inappropriate

DTRPAC Report page 152
or unnecessary management actions.
• Identifying Explicit (Quantifiable) Scientific Goals and Objectives The goals of recovery programs include targets of study at a wide variety of spatial scales and levels of ecological complexity. For example, targets of study will range from highly restricted spatial scales for individual tortoises to broad spatial scales to include multiple DPSs (see section 3.0).
• Identifying Likely Threats or Combinations of Threats The SAC should guide efforts to identify likely threats, or threat combinations (see Section
5), for recovery. Threats, and threat combinations, will include both natural and anthropogenic phenomena including change in drought frequency, fire, toxic pollutants, flood, invasions of exotic species, poaching, disease, and so on. Identification and verification of threats, and threat combinations, will be the product of research to establish mechanistic links between environmental phenomena and threats to populations and ecosystems.
• Constructing Conceptual Models Describing Crucial Ecological Interactions The models are important in developing an understanding of the key processes and properties of the ecological interactions between individuals, and/or populations, and their environments, and in developing understanding of how threats affect processes like extinction. The models will be important in delimiting the boundaries of what constitutes natural variation in population processes and the role of humans in stressing populations. Models should incorporate the latest scientific concepts and paradigms, which can keep costs low and scientific understanding high.
• Identifying Indicators or Indices Indicators are surrogates of population responses to threats (Simberloff 1998). Indicators can be demographic properties or characteristics that are easy to measure and exhibit dynamics and responses that parallel those of more difficult to measure population properties or processes. Indicators must be selected because they demonstrate low natural variability, but they respond measurably to environmental change at reasonable cost. Indicators might include population sizes and distributions, and physical and biotic variables. Establishing indicators will require research into the correlation among population dynamics and ecosystem properties and processes.
• Developing Sampling Design to Estimate Status and Trends of Populations, Habitats, Threats, and/or Indicators Hypothesis testing, trend analyses, model development, and statistical inference must come from rigorously scientific programs that should be subjected to independent scientific review. Monitoring exercises must be statistically rigorous so that the program will have the highest probability to detect ecologically important trends convincingly. Sampling design, hypothesis testing, and trend analyses are all scientific procedures that continually become better as general scientific knowledge increases. Thus, rigor in this area will require continuous reevaluation.

DTRPAC Report page 153
• Determining Threshold Values That Will Trigger Management Changes Quantitative levels of status and trends should be used to trigger adjustments land management and policy. This is the basis for adaptive management, and it provides recommendations for the appropriate bodies to establish dynamic policies and management aimed at producing the desired ecological condition and the conditions required by the USFWS.
Appropriately integrated, this systematic program can use direct measurements and surrogate variables (indirect measures of the status of recovery) to determine the status and trends of the focal species. The resulting data and analyses should provide insight and lead to recommendations for adaptive management. It is critical to this process and to the assurances made to the USFWS that the long-term scientific integrity of inventory, monitoring, and research be assured because of the highest standards of scientific accountability and peer review.
Inventory, research, and monitoring are necessary and important activities for recovery programs. Nevertheless, the lines defining the differences and similarities between monitoring and research are not sharp. Indeed, appropriate monitoring requires research methods to provide more than anecdotal information, and anecdotal information will be inadequate for both economy-seeking permit holders and for regulatory agencies. Additionally, where monitoring methods do not yet exist, research must be conducted to develop efficacious means to assess the effectiveness of the recovery efforts.
7.2.2 Relationships among Inventory, Monitoring, Research, and Adaptive Management
Inventory, research, and monitoring (IRM) are necessary and important activities for complex, long-term, recovery efforts. The lines defining the differences and similarities between monitoring and research are not sharp. Indeed, apposite monitoring requires research methods to provide anything more than anecdotal information, and anecdotal information will be inadequate for both economy-seeking permit holders and for regulatory agencies. Additionally, where monitoring methods do not yet exist, research must be conducted to develop efficacious means to assess the effectiveness of the recovery plan. Thus, this section will elaborate on the definitions, roles, and importance of IRM activities in conservation planning.
7.2.3 Definitions
• Inventory, a to Webster’s New International Dictionary (Merriam-Webster 1986), is an itemized list of current assets; as a survey of natural resources such as a survey of wildlife of a region.
• Monitoring, a to Webster’s New International Dictionary (Merriam-Webster 1986), is to watch, observe, or check especially for a purpose.
• Research, a to Webster’s New International Dictionary (Merriam-Webster 1986), is to search or to investigate exhaustively.

DTRPAC Report page 154
7.2.4 Inventory
A recovery program designed to protect sensitive populations must be based upon knowledge of the status of populations. The size and spatial distributions of populations are critically important pieces of information upon which management prescriptions can be made. If the status of any population is not known, then aspects of that status can be assessed through an inventory of presence and absence, that inventory should be conducted at the earliest possible time in the planning process, and periodic inventories may need to be conducted to assess the distribution of presence.
7.2.5 Monitoring
Monitoring without a goal can result in misdirected management more than can result from no monitoring at all. Monitoring without goals can consume valuable resources that can be used constructively in other conservation actions (such as buying more habitat), and incorrect information from improper monitoring can mislead and direct dangerous management decisions. Additionally, monitoring must be conducted with adequate sampling and scientifically defensible sampling protocols so that any new data are sufficiently replicable that they can lead to conclusions with a determinable probability of being correct.
There are numerous relevant goals of monitoring, and different kinds of monitoring are necessary and important to a successful recovery plan. Nevertheless, monitoring is important to validate management actions, to provide better data for adaptive management, and to get advanced knowledge of unforeseen circumstances that arise in the recovery plan. Monitoring can be categorized as implementation monitoring, effectiveness monitoring, and validation monitoring (NMFS 2002). The first two of these forms of monitoring meet the definition of monitoring, but the validation monitoring is actually a form of research (see below, Fig. 7.1).
• Implementation Monitoring Implementation monitoring provides a permanent record of what mitigation and management is applied as part of the recovery plan. Implementation monitoring should occur continually and it should include details about the implementation actions undertaken in mitigation of take or as management for recovery. Implementation monitoring should assess actions such as fencing along roads, recreation restrictions within reserves, range improvements, pollution regulation, vegetation restoration, grazing management, etc. Implementation monitoring also should include “natural implementations” such as occurrences of drought, natural fires, and invasion of exotic species.

DTRPAC Report page 155
Actual Statusand Trends
Research
ValidationMonitoring/Research
Results ofmanagement actions
AdaptiveManagement
ActionsEffectivenessMonitoring
Desired Statusand Trendsfrom Manage-ment Actions
Conceptual Model
ImplementationMonitoring
Fig. 7.1 Relationships among the desired objectives of a recovery program, a conceptual model of the functional relationships among species, and monitoring activities in the adaptive management.
• Effectiveness Monitoring Effectiveness monitoring is used to record change in recovery status caused by management actions and other important natural and anthropogenic events as well as random, year-to-year change. With sufficient data from different monitoring sites and from a series of years, analyses should be able to separate out the non-random change from a background of random change. For example, analyses of data from effectiveness monitoring could assess the efficacy of grazing restrictions on vegetation. They could estimate the impacts of natural and anthropogenic fires. They may assess the growth in animal populations freed from mortality caused by vehicles on roads passing through semi-natural areas. Importantly, analyses from effectiveness monitoring also should assess the loss of biological resources due to aggressive competition, predation, or parasitism by exotic species.
Even if all populations being recovered were monitored to assess non-random change, that would not be enough as a test of the efficacy of recovery actions. Other populations or processes within the planning area could threaten the efficacy of a recovery program even before non-random change occurs in the populations. If habitats are invaded by a destructive exotic species, or a destructive change in pollution levels, or a destructive

DTRPAC Report page 156
change in climate, then the existing management activities might not be adequate and might have to be changed as part of adaptive management.
• Validation Monitoring Validation monitoring (NMFS 2002) is actually research. Its purpose is to determine if the “conceptual model” of the ecological systems of the recovery program is valid. The concept of validation is that, if the conceptual model is correct, then correct prescriptions for adaptive management can be made. Validation monitoring/research determines the extent to which predictions and assumptions of adaptive management are appropriate to attain the desired objectives. Validation monitoring/research generally requires experimentation and long-term monitoring to create a database essential to validate results from the effectiveness monitoring. Validation can be made regardless of whether or not the conservation objectives are met. For example, if a particular standing crop of non-woody vegetation is deemed (by the conceptual model) to be essential to provide shade for tortoises, and if this standing crop is not achieved even after a reduction in cattle grazing, then validation monitoring/research could be used to determine needs for additional changes in grazing. That is, validation monitoring/research is used to assure that benefits of management actions are not wrongly attributed to a given action or mechanism.
Adaptive management of recovery efforts requires constant assessment of the effectiveness of management actions. That assessment occurs through monitoring, and some monitoring cannot occur without research. An effective monitoring program must have all three types of monitoring and research or else it is not possible to interpret data from the component parts of monitoring. Specifically, the efficacy of the recovery effort requires evaluation of the effects of management in light of hypothesized responses to that management and to the actual management actions. All of the different kinds of monitoring are required to make a decision to alter current management practices to reach the desired objectives of recovery.
7.2.6 Research
Research is necessary for the development, and continual correction, of the conceptual model of the recovery program. An incorrect conceptual model of recovery can lead to dangerously inappropriate adaptive management. Assumptions of which management actions will lead to the desired objectives of the recovery program need to be tested. For example, suppose that we hypothesized a conceptual model that posits that unpaved roads result in greater mortality of reproductive female tortoises. This hypothesis requires testing. The test would not simply assess the number of tortoises lost due to facilitated poaching or direct mortality from vehicles, etc. It would, additionally, assess threats to the persistence of desert tortoise populations given that some individual tortoises will die due to roads.
7.2.7 Adaptive Management Decision Making
Importantly, adaptive management must facilitate information transfer to decision makers and land and resource planners. The process involves five steps:

DTRPAC Report page 157
• Provide a range of possible management responses.
• Determine the potential alternative ecological outcomes associated with specific phenomena being monitored.
• Assess the probabilities associated with each possible interpretation of monitoring data.
• Identify the management decision that maximizes the overall “utility” of each decision and outcome (involving considerations of the costs of misinterpretations of monitoring data and costs of wrong decisions).
• Propose research endeavors that are likely to result in identification of management actions which will allow species to be moved from evaluation to covered status.
7.2.8 The Circle of Status and Trends and of Monitoring
The circle of elements marked with blue arrows in Fig. 7.1 includes the major elements of adaptive management. Generally, it is necessary to develop goals for recovery, which generally will be the status and trends needed for delisting. Our understanding of the ecological interactions between the species and its environment represents our “model” of system. The model, then, represents what we know about the role of food resources, disease, predators, roads, etc. for population dynamics of desert tortoise. That model, and the goals for recovery, represent the ingredients needed to prescribe management actions to achieve those goals. Management actions might include fencing roads, managing access by off-road vehicles, habitat restoration of abandoned roads or mines, reducing the anthropogenic subsidies to ravens (e.g., garbage dumps, power lines), etc. The efficacy of these management actions needs to be monitored by effectiveness monitoring. Effectiveness monitoring does not assess the management actions per se, but assess the outcomes relative to the desired status and trends. Thus, the circle in Fig. 7.1 depicts the relationship between status and trends and monitoring as discussed in the next chapters.
7.3 Cooperation and Coordination
The interaction between environmental scientists and environmental managers often has been contentious, even though the ultimate goal of both groups is environmental protection (Cullen 1990; Dewberry and Pringle 1994; Shrader-Frechette and McCoy 1994a, b). Many factors, such as under-use of the reductionist approach by managers (Romesburg 1991), over-use of the reductionist approach by scientists (Miller 1993), perceived irrelevance of science to the environmental problem-solving process (Johannes 1998), and lack of consistency among scientists (Kaiser 2000b), may have contributed to this contentiousness. Despite the barriers between scientists and managers, which still are not easily overcome (Kaiser 2000a), cooperation between the two groups can return important dividends in dealing with species recovery (Ecological Society of America 1995, Hyman and Wernstedt 1995, Kleiman and Mallinson 1998, Badalamenti et al. 2000).

DTRPAC Report page 158
Cooperation among scientists in different disciplines, like cooperation between scientists and managers, is likely to return important dividends in dealing with species recovery, yet such cooperation also is not easily fostered (Metzger and Zare 1999). Dealing with disease threats is an aspect of species recovery for which cooperative research would seem, potentially, to be particularly productive (Nicastri et al. 2001, Wallace 2001). Conservation efforts often could be improved markedly by involving wildlife health professionals (Kock 1996, Deem et al. 2001), and disease control efforts often could be improved markedly by involving ecologists (Hoffman 2002, Wasserburg et al. 2002, Kazura and Bockarie 2003). The potential role for ecologists in dealing with disease threats is critical as we increasingly come to appreciate the ways in which local (e.g., Ross 2002) and global (e.g., Chan et al. 1999) environments influence disease transmission and prevalence, and, in turn, we come to appreciate the role of environmental improvement in mitigating the consequences of disease (e.g., Woodroffe 1999).
As an example of the potential value of cooperation and coordination, consider research on URTD. Researchers consisting of experts on mycoplasmas (Mary Brown, PhD, University of Florida (UF); Paul Klein, PhD, UF; Lori Wendland, DVM, UF; Dan Brown, PhD, UF), gopher tortoise ecology (Earl D. McCoy, PhD, University of South Florida (USF); Henry R. Mushinsky, PhD, USF; Joan Berish, MS, Florida Fish and Wildlife Conservation Commission (FFWCC)) and population modeling (Madan Oli, PhD, UF) are working cooperatively to fill in important gaps in our knowledge about the effects of respiratory mycoplasmal infection and URTD on the gopher tortoise. The cooperative research is funded by the joint NIH/NSF Ecology of Infectious Diseases Program for five years. The premise underlying the research is that URTD is a complex, multi-factorial disease, interacting in some circumstances with other stressors to affect tortoises (Fig. 7.2). Questions that the research is addressing include: do natural and anthropogenically-induced population characteristics influence disease transmission and prevalence; does habitat quality influence disease transmission and prevalence; does the disease negatively influence population demographics; and do mycoplasmas vary in virulence, and, if so, does the strain present influence disease transmission and prevalence?

Anthropogenic
DDisease M
\r,/ ,-_D'_"""_"_'_'''....,..
D/
//
//
//
//
//
/
Microbial Factors
DTRPAC Report page 159
Factors
Transmission Population
Host Factors Habitat Factors
Fig. 7.2 Relationships among factors contributing to disease important to demography of the desert tortoise.
Anthropogenic, habitat, host, and microbial factors all potentially affect the interaction between URTD and tortoise populations (Fig. 7.2). Anthropogenic factors include translocation of tortoises, surrounding urban development, fire suppression, and human predation. Means of studying anthropogenic factors include field surveys, fire history data, FFWCC translocation records, and current and historic aerial photographs. Habitat factors include size, fragmentation, management, and rainfall. Means of studying habitat factors are much the same as for anthropogenic factors. Host factors include size class, sex, health status, and serological status. Means of studying host factors include tortoise surveys, ELISA, CBC, chemistry panels, and physical examinations. Microbial factors include virulence, species, and strain. Means of studying microbial factors include culturing, PCR, molecular epidemiology, and infection studies.
The data derived from the studies listed above will be used to develop causal and predictive models of the interaction between URTD and tortoise populations. The models elucidate the effects of URTD on population demographics (survival, reproduction, migration) and on population growth. The models also will evaluate the role of the major factors listed above in influencing URTD transmission and prevalence.

DTRPAC Report page 160
7.3.1 Desert Tortoise Recovery Office
The DTRPAC review leads strongly to the opinion that USFWS needs to implement a Desert Tortoise Recovery Office (DTRO) made up of scientists, a recovery coordinator, GIS specialist, database specialist, and support staff (Fig. 7.3). Some part of that staff can be outsourced to contractors, and that may be desirable. However, the USFWS has had a history of failure on implementing recovery, because the effort is not commensurate with the magnitude of the task. The desert tortoise is more complex in terms of needs for recovery than any of the widest-ranging listed species in the US, such as northern spotted owl, red-cockaded woodpecker, or grizzly bear. Thus, unless extinction is an acceptable option, USFWS must devote more resources to recovery efforts.
The DTRO should be directly responsible for concerted range-wide recovery efforts for desert tortoises. It would provide a focus to cause management of desert tortoises to be more efficient and effective. The proposed DTRO would provide a centralized point of contact, through which research, data compilation, and monitoring activities are coordinated, so as to maintain the highest level of knowledge about progress toward recovery of the desert tortoise. In addition, the DTRO would focus on identifying where new research and management should be focused to facilitate range-wide recovery of this species. The DTRO would consist of a Recovery Team leader, and a staff of specialized personnel charged with coordinating monitoring, research, Section 7 consultation, and HCP issues. The DTRO would also have the capability of GIS analysis of data, and data storage, compilation and synthesis, as well as public relations and staff support. As a core set of responsibilities, the DTRO would:
• Advise, conduct, direct, and prioritize research where appropriate
• Develop new techniques for monitoring desert tortoises, their habitat, and threats
• Recommend management actions based upon the best available science • Standardize methods for data collection
• Develop a centralized desert tortoise data repository and management system
• Inform policy through recovery recommendations and plan reviews as directed • Address needs of agencies, local governments, MOG, MOG/TAC, DMG and other appropriate management organization
• Create a point of contact for stakeholders groups, agencies, NGO's, Congress, GAO, etc. to address policy information needs
7.3.2 Science Advisory Committee
The DTRO would draw upon the expertise of a Science Advisory Committee (SAC) in order to benefit from the most current knowledge and information available. The SAC would be composed of appointed members from the USFWS, USGS-BRD, and academia, and the Desert Tortoise Coordinator (Fig. 7.3). The SAC would meet periodically to provide

DTRPAC Report page 161
scientific expertise and recommendations to the DTRO. As a core set of responsibilities, the SAC would:
• Rank importance of threats and networks of threats
• Assess the efficacy of monitoring
• Prescribe needed research
• Prioritize research-based recovery actions
• Synthesize data
• Assess progress of recovery
• Consult outside scientific experts as necessary
The SAC could be extremely valuable in addressing some of the critical research questions still remaining concerning the desert tortoise, particularly in the areas of spotting trends; identifying gaps in data; and understanding tortoise biology, environment, and threats.

SAC Tum Member
"'- ..,.,....·USGSBflO_• usFwS S<>onool·0Nr _ S<>onool
6~
Stak~
Re...",chMonitoring
ISpeC"' . NlbitatMId threat'l
DTRPAC Report page 162
FWS
•
.
I
Fig. 7.3 Relationships among offices, teams, committees, etc. functioning to produce strategies for recovery and implementation of the listed species.

DTRPAC Report page 163
7.4 Data Management
Data management is crucial to producing meaningful and useful data to support desert tortoise recovery. Currently, important data from monitoring tortoise densities are widely scattered among state and federal agencies and the scientific community. Data have been gathered, organized, and stored in a variety of ways with no common approach. Metadata may or may not be available. Some data have been reviewed, collated, or otherwise organized. Other data have not. Accessibility of tortoise data to managers, scientists, and the public is highly variable. In short, a great deal of important data (both historical and recent data) cannot be readily used and may be at risk to being lost permanently unless the data are compiled, organized, quality assurance/ quality control documented, stored, and made easily accessible to authorized individuals.
7.4.1 Distribution of Monitoring Resources
Data management is centrally important to data oversight, but it must be done in the context of a coordinated monitoring and research program that systematically seeks to identify needs, generate hypotheses, design studies, collect data, conduct analyses, and report findings (i.e., scientific method). Translating the scientific method into on-the-ground monitoring and research activities requires funding to support the following activities: planning, training, data collection, data management, and analysis and reporting (Fig. 7.4). Size of the pie slices is not intended to represent amount of funding needed, but to represent that each slice is as equally important as any other slice.
Fig. 7.4 Kinds of activities associated with monitoring.
Planning
Training
Data Collection
Data Management
Analysis and Reporting
There is a natural tendency to think that data collection is the main activity in monitoring, but monitoring data do not reach their potential without all aspects of the monitoring process (Fig. 7.4).

DTRPAC Report page 164
7.4.2 Data Management Plan
It is important to identify issues and potential solutions for improving the management of data collected for programs that monitor desert tortoise populations, threats, and habitat. At a minimum, creation of data management plan would generally include:
Guidelines to standardize data collection models and data management based upon scientific data collection needs
Guidelines to standardize and manage field data collection operations and methods. The implementation of these guidelines will insure that at a minimum the data will be evaluated for its completeness, correctness, and conformance/compliance against the method, procedures, and contractual requirements.
A Data Quality Assurance/Quality Control Plan (that specifies required management activities, procedures and identifies appropriate manual and automated methodologies for post-processing and database finalization)
A Data Administration Plan (that identifies how data should be consolidated and managed in a central data repository and the identification of responsible parties)
7.4.3 Types and Sources of Errors
Data are prone to errors. All data collection operations for desert tortoise monitoring can, nevertheless, be designed and conducted to prevent data entry errors and to automate the detection and correction of errors during processing. Data may exhibit numerous types of error that may be broadly classified into the following three categories:
• Blunders –Mistakes in instrument reading, data entry, erroneous computation, careless observation and recording
• Systematic Errors –A regular error introduced by instruments, measurement conditions, or data processing techniques
• Random Errors –Resulting from accidental or unknown combinations of cause. Random errors are the most difficult to detect and correct.
By process of example from 2001-2003 LDS data, Table 7.1 outlines the types of errors that need to be managed in any monitoring or research data collection effort. The development of the data management plan should include procedures of preventing, minimizing, and correcting each of these data error types.

DTRPAC Report page 165
Table 7.1 Summary of sources and types of error that have been found in Line Distance Sampling.
Error Type Error Data Tables (ATTRIBUTES) Potential Source Positional Accuracy
Illogical spatial locations Example: Transect locations in the Pacific Ocean
Corner Coordinate, Observation field crew data entry GPS Data Error (bad
coordinate values, etc.)
Spatial Different projections, datums, and (EASTING, NORTHING, GPS Setup (Incorrect Reference correction factors by area, by year, by
contractor Example: A portion of the locations within the database are systematically shifted by 100m meters in the northing and 200m in the easting
LATITUDE, LONGITUDE) Datum, Incorrect Projection)
Coordinate conversion (error in transforming raw field data during processing to unify into a common database)
Attribute Accuracy
Incorrect data values Example: Incorrect time of observation
All tables and fields PenDragon scripts field crew data entry incorrect PDA Time
Completeness Missing data values Example: No distance from the line recorded
All tables and fields All attributes without automated validation
Data not validated during data entry
Consistency Non-standard values Example: Live and Carcass each have three different spellings in the database. Technically ‘LIVE’, ‘live’, and ‘Live’ all mean "live tortoises" Attributes are not within tolerances (acceptable parameters) Example: an MCL value of 10,000mm
All tables and fields Data entry Data collection methods,
contractors, and database schema changed each year
Contractors/data collectors interpret record and process data differently
Relational Integrity (error in key relationship among records across tables)
Missing or incorrect relationship key Example: Transect records do not have all related (corresponding) corner coordinate records, corner coordinate record does not have corresponding transect record, or relationship key is incorrect
Transect and Corner Coordinate Field crew does not create all corner coordinate records
Incorrect relationship key was entered
Missing or incorrect relationship key Example: Observation record does not have corresponding transect record, or observation has incorrect transect relationship key
Transect and Observation Field crew does not create observation
Incorrect relationship key was entered
Data Type and Invalid data type Observation Database design is Precision Example: decimal numerical value
stored as an integer incorrect
Data processing did not preserve data types (e.g., import or conversion resulted in rounded values)
Lineage and No documentation Study-level tracking Lack of convention Metadata Example: Inaccurate or missing field
logs, table names, interim processing file names, GIS meta-data
Lost or missing logs Failure to create
documentation

DTRPAC Report page 166
7.4.4 Errors Detection and Correction
The most effective means to achieve a quality database is to prevent errors from occurring in the first place at each level of the workflow process. Prevention will require a combination of initiatives at each stage of data management to standardize data capture methods, to standardize the data storage model, and to standardize and automate data processing and storage. The principal steps in the data processing workflow are:
• Data model and database design
• Field data collection • QA/QC post-processing
• Compile data into a common, finalized database
References
Principles of Error Theory and Cartographic Applications; reprinted June, 1968; United States Air Force, Aeronautical Chart and Information Center.
Guidance on Environmental Data Verification and Data Validation (EPA QA/G-8); November 2002; United States Environmental Protection Agency, Office of Environmental Information.
Guidance for Data Quality Assessment: Practical Methods for Data Analysis (EPA QA/G-9; QA00 UPDATE; EPA/600/R-96/084); July 2000; United States Environmental Protection Agency, Office of Environmental Information.
DTRPAC Report page 167
“Science is the great antidote to the poison of enthusiasm and superstition.”
Adam Smith, The Wealth of Nations. (1776)
DTRPAC Report page 168
Appendix A. DTRPAC Responses to Comments
We received one comment form and three letters in response to the DTRPAC presentation at the September 24, 2003, Desert Tortoise Management Oversight Group meeting in Las Vegas. We received 12 letters with comments on the working draft of the report. This appendix summarizes and addresses these comments.
Many reviewers made editorial comments regarding typographical errors, clarifications, and omissions, including an Executive Summary, information on translocation and HCPs, and a more thorough discussion of delisting criteria.
We revised the report where appropriate.
Several reviewers requested that the DTRPAC’s goals and objectives be clarified in the report.
We revised the report accordingly.
Many reviewers commented that the U.S Fish and Wildlife Service’s policy on DPSs should be better incorporated into the DPS chapter and that the provisional revision of DPSs needed better justification.
We revised the chapter to more explicitly reference and describe the USFWS’s DPS policy. The final report more clearly justifies the provisional DPSs according to the policy and identifies areas needing additional data or research to solidify or modify potential future DPS designation. If and when recovery units or DPSs are revised, existing DWMAs should be reevaluated relative to new recovery unit/DPS boundaries.
A reviewer commented that, in the DPS chapter, discussion about life-history adaptations, which evolve over many generations, does not fit well within the context of recovery plans.
Consideration of life-history traits in evaluating potential DPSs does not imply that DPS designation should anticipate evolution of new traits. Rather, differing life-history traits between potential DPSs indicate a level of adaptation that has already occurred and which contributes to the “significance” criterion of DPS designation. Therefore, this discussion is appropriate to the chapter.
Some reviewers commented that the literature-review chapter added little to the assessment and should be moved to an appendix and that the topic of translocation should be included in the discussion.
We were charged to review scientific information since the 1994 Recovery Plan was published. This chapter provides an overview of areas of research that have been conducted, as well as gaps relative to the 1994 Recovery Plan’s recommendations. As such, we have retained the chapter in the report and have added specific information on translocation.
Many reviewers commented that the analysis and discussion of desert tortoise status and trends was not clear or was flawed in statistical methodology, included omissions in

DTRPAC Report page 169
figures and specific analyses, and should include discussion on how to improve data collection and analysis methods.
This section of the report has been greatly revised to address issues raised by the reviewers. Statistical methods in both the draft and final reports were reviewed by two outside statisticians.
Some reviewers questioned whether a recommendation that the Western Mojave Recovery Unit of the tortoise should be uplisted to endangered status was within the scope of the DTRPAC’s charge.
We agree that such a recommendation was not within the committee’s charge and have revised the report to simply emphasize that the current data indicate that desert tortoises in the Western Mojave Desert are continuing to decline. It is the USFWS’s responsibility to determine whether these data are sufficient to change the listing status of the species within this recovery unit/DPS.
Some reviewers questioned whether all available data were used or pointed out several times where the DTRPAC failed to incorporate available data such as that in the West Mojave Plan, numerous Biological Opinions, and other formal or informal documents.
We assessed important information that could be addressed given time constraints placed on the committee and invited groups to provide specific studies or data that bear on the assessment. If other specific reports were overlooked in this assessment, we ask that they be provided to USFWS so that a possible future recovery team can incorporate that information into the actual revision of the Recovery Plan. We regret the omission of West Mojave Plan data in the draft report. Where appropriate, much of these data and analyses have been included in the final report.
Many reviewers questioned the accuracy of or methods behind the figures and tables summarizing desert tortoise threats and Recovery Plan implementation. Some reviewers commented that particular recovery actions were not reflected in the implementation table (Table 4.3 in the working draft) as having been implemented. Others questioned whether some actions recorded in the table as having been at least partially implemented have actually been implemented in a meaningful way. Most were unsatisfied with the simplified representation of actions having “no implementation” or “at least partial implementation.”
We summarized Recovery Plan implementation as of 2002 based on information provided by the relevant management agencies. It was impossible to quantify the degree of implementation, given the nature of the information provided. We revised this section to clarify the sources of information used, but more importantly we emphasize recommendations to better document and quantify implementation of recovery actions in the future, rather than drawing final conclusions about specific levels of implementation based on incomplete and inadequate data.
Many reviewers commented that the road case study was a flawed comparison between early route designations and more recent route inventories.

DTRPAC Report page 170
The road case study was revised to address concerns over comparisons across years. A more detailed explanation was provided on methods used to collect the data and a full exploration of the consequences of the differences was discussed. Additional information provided by the West Mojave was included in the analysis.
A reviewer requested that historic (pre-1970s) land management information be compared to tortoise population data and subsequently commented that the report did not address, or otherwise determine, the efficacy of recovery actions implemented to date. Another comment noted that tortoise populations have continued to decline after grazing had been eliminated on most of the Mojave National Preserve and that no scientific basis has been given for vegetation thresholds for removing cattle.
We are unaware of any pre-1970 data on tortoise population trends, though we are aware of some of the threats that were on the landscape at that time. Both the working draft and the final report repeatedly state that research needed to determine the effectiveness of recovery actions has not been conducted to date. The report specifically recommends that research and monitoring on threats and management effectiveness be implemented in the future. However, threat effects may not always be connected in space and time, and a fundamental challenge in evaluating responses to management is overcoming the extended time scales required for tortoise demographic processes to result in measurable population changes.
We received comments indicating that significant data on URTD since 1994 must be reviewed and incorporated into the revised recovery plan and should guide management/recovery actions set forth in the plan, including the simple steps of halting the spread, determining the cause of, and developing a cure for the disease.
We reviewed all desert tortoise disease studies, discussed the topic in detail, and provided specific recommendations to the USFWS and a possible subsequent Recovery Team in the report. It is important to note that even though URTD has been associated with tortoise population declines, the precise relationship between the disease and demographic effects is poorly known; tortoises have likely maintained a long-term coexistence with mycoplasmas; mycoplasmal infections are not typically associated with high mortality in other species (in fact, low-virulence strains may actually be beneficial to tortoise populations); and a cure or treatment for URTD in the wild is impossible at the population level. Management actions for desert tortoise populations in the face of disease must not be conducted outside the context of other threats. In this way, the condition of tortoise populations can be improved so that they can endure disease outbreaks.
A reviewer commented that the DTRPAC should acknowledge the lack of a disease strategy and recommend that the formal recovery team consider all strategies for dealing with disease.
The report covers a variety of strategies and makes some much more specific recommendations than were previously available.
A reviewer commented that disease case study de-emphasizes disease relative to other threats, including OHVs, toward which the draft report reflects a strong bias, and that the

DTRPAC Report page 171
draft report ignores correlations between disease incidence and tortoise population die-offs, leading to a misguided recovery effort.
The report clearly states that disease deserves attention on par with other important threats, especially given the observed correlations. We believe the report shows no bias against disease or any other threat. Nonetheless, there is overwhelming evidence that OHV activities of the nature that occurs within open areas causes great damage to tortoise habitat. There is considerably less showing what level of damage is caused by lighter activities that are mostly constrained to designated routes. This information is included in Boarman (2002), which is cited by the report, and its conclusions are not dependent on an assumption of a strong impact of grazing or OHV activities.
A reviewer commented that the draft report suggests that epidemiology is an academic exercise only and that it has no place in directing wildlife management policy. The reviewer further commented that a statement in the draft report (that improvements in the science surrounding disease as a threat to desert tortoises may not necessarily provide an easy transition to management strategies) implies that more funding should be spent on research but not on on-the-ground management.
The reviewer misinterprets the report on this subject. The report simply states that many epidemiologists and conservation biologists believe that their role as scientists is to maintain objectivity in providing scientific information by distancing themselves from the application of that information in policy decisions. The report goes on to say that designing effective management strategies will be a daunting task that should consider all the complexities of the disease threat, not a task that should be ignored in favor of additional research for research’s sake.
Several reviewers commented that the draft report’s discussion of cumulative and synergistic threats to desert tortoises, and the associated threats network figure, has not been proven, is a “copout,” misdirects attention from disease, is otherwise too theoretical, or should have been replaced by a prioritized list of mortality factors and recovery measures.
The rationale for “synergistic causes of desert tortoise declines” is described in detail in the report and should not be interpreted as misdirecting attention from disease or any other specific threat. We agree that a multiple threats, “death of a thousand cuts,” perspective is unsatisfying and difficult to accept. Unfortunately, we firmly believe that this is the situation we are forced to deal with. There are many things affecting tortoise populations, their relative impacts are extremely hard to assess, and the populations are not at all likely to respond significantly if only one threat is dealt with. We agree with commentors that little data currently exist to document specific interactions between threat factors, including relative magnitudes of effects, and we include important recommendations to correct this deficiency. With regard to a specific comment on potential interactions between tortoise nutrition and disease, we note that nutrition has well documented effects on growth, health, and fecundity of wildlife, including desert tortoises. We agree that data do not currently exist to document population-level effects of nutrition on disease and population declines, and recommend that such studies be conducted.

DTRPAC Report page 172
A reviewer commented that there has not been an attempt to correlate air pollution from the Los Angeles Basin and the southern San Joaquin Valley, and potential associated heavy metal toxicants, with desert tortoise declines.
The links between air pollution and disease or tortoise health have been largely unexplored. It is unknown if the levels of heavy metals found in tortoise tissues represent toxic levels, nor if the spatial patterns are consistent with air pollution being the source. Furthermore, there is essentially nothing that desert managers can do about air pollution, which mostly derives from the Los Angeles Basin.
A reviewer commented that “new information” with respect to feral dogs applies only to Twentynine Palms Marine Corps Base.
The only published data we know of is from Twentynine Palms, at the interface between urban/rural and wild areas. There are observations by several biologists of dogs causing mortality in other areas, in both the Mojave and Sonoran deserts, including areas with a low density of human residences. These observations have not been quantified. We feel the evidence is sufficient to justify a need to implement actions to reduce dog predation in urban/rural – wildland interfaces like the area around the southern edge of Twentynine Palms. More work is required to further understand the threat.
We received a comment disputing the role of habitat fragmentation in tortoise declines or as a threat to tortoise populations.
Habitat fragmentation is an issue of scale and has been shown to cause population declines in other reptiles (Fisher et al. 2002). Animals with large home ranges, such as the desert tortoise, appear to be affected seriously by habitat fragmentation/loss, and habitat protection has not been effectively implemented in many areas within the tortoise’s range. Fragmentation can cause reduced movement and gene flow among breeding populations. It does not directly cause mortality, however there are documented indirect effects, such as introduced exotic plants and increased mortality on roads. von Seckendorff Hoff and Marlow (2002) demonstrated a reduction in tortoise sign with proximity to roads and a relationship between this reduction and the traffic level. Roads create linear “sinks” fragmenting tortoise populations. While it is intuitive that restricted genetic interchange caused by this fragmentation may have long-term population consequences, we agree that studies have not yet been conducted to determine the nature of those consequences. Section 5 describes the need for studies evaluating the relative importance and interactions of these effects.
Some reviewers noted geographic differences in particular threats or recommended that a regional assessment of threats be conducted, especially relative to the evolutionary history of the tortoise and populations at the margins of the current range. Another reviewer noted that available GIS data layers were not used in the analysis, other than in the road case study.
The report explicitly discusses threats in a general, non spatially-explicit context. We recognize the importance of the spatial differences in threats for the desert

DTRPAC Report page 173
tortoise and include this issue as a caveat to the threats network. However, we defer to the Recovery Team to more specifically address regional threats and mitigation under the guidance of recommendations provided in the report. The evolutionary history of the desert tortoise and the geologic history of the Mojave Desert have little bearing on the relevance of managing the tortoise under the current ESA. Desert tortoise adaptations (or exaptations sensu Morafka and Berry (2002)) ) do make them suitable for desert living, even at the margins of their current range. Populations at the edge of the species’ range can be different and important in many ways. We underscore our recommendation that the spatial component of threats and threat mitigation be taken into account and that management actions be monitored in a hypothesis-based approach to determine the effectiveness of the action.
The GIS data of which we are aware and had readily available are primarily from the West Mojave plan, and other sources will be invaluable in identifying specific areas where certain threats are likely to exist. Even though a comprehensive analysis of region-by-region threats was beyond the scope of our task, we recommend that, if a future recovery team is formed, they undertake such an exercise within the context of multiple threats in a network for each region.
A reviewer commented that more necropsies need to be performed on dead tortoises each year to better determine the cause of tortoise mortality.
We agree more work on causes of death (including, but not limited to necropsies) are critically needed to test and refine the hypothesis of multiple interacting threats. This recommendation is made in the report.
A reviewer commented that the draft report lacks an analysis of predation and predator control.
The report and Boarman (2003) include discussions of what is known about predation. We agree that additional research is needed on predation and predator control (and its effectiveness in tortoise recovery). This recommendation is made in the report.
A reviewer commented that the current difficulty in detecting trends in tortoise populations suggests that the original decision to list the desert tortoise as Threatened under the ESA had inadequate scientific support.
Subtle population trends are difficult to detect for most desert tortoise populations with current methods. However, as the report states, dramatic population declines such as those observed before and since the listing of the tortoise are easy to detect. The GAO’s independent review of the listing decision found that the decision was appropriate.
Several reviewers responded to a statement in the draft report that “all monitoring should be hypothesis driven” by suggesting that this excluded basic monitoring to detect population trends in the absence of an experimental study.
We continue to emphasize that monitoring needs to be conducted in an experimental framework to determine the effectiveness of recovery actions,

DTRPAC Report page 174
however we have clarified the report to indicate that population trend-detection monitoring is still appropriate as long as estimation methodologies are sensitive enough to detect the desired trend (e.g., reject a null hypothesis that the population is decreasing at a particular rate).
Several reviewers commented on the difficulty of distance sampling to detect trends in tortoise populations and that the method is a waste of time and should be abandoned or that the report should better identify ways to improve the method.
The report documents several supplemental analyses that make the distance-sampling effort valuable, besides estimating tortoise density. We have revised the report to provide a more complete review of the method as it has been implemented for desert tortoises to date. The report also includes several recommendations for future research in improving the method for estimating density, as well as additional information that could be gained from the effort.
Some reviewers questioned statements in the report that suggested that some permanent study plots should be abandoned.
We recognize, and the report documents, value in permanent study plot data. However, given limited resources and a list of documented problems associated with the permanent study plots, the report recommends that plots that do not serve to answer specific research or management questions be discontinued.
A reviewer commented that an observation in the draft report (that the current monitoring program has expended virtually all funds on field collection of data and little on quality control or data management) ignores the reality that funding is limited and that in reality the choice comes down to collecting as much data as possible or collecting insufficient data and managing them expensively.
We recognize the need to obtain sufficient funding and emphasize efforts to do so in the report. However, the utility of data collected under any funding level is severely compromised if sufficient effort is not also directed to quality control and data management. Collecting “sufficient” data and managing them poorly is just as much a waste of money as collecting insufficient data and managing them expensively, because resources are not available to determine whether the data collected really are “sufficient.”
One comment suggested that revision of the Recovery Plan carefully consider and analyze the importance of soils and ecological site descriptions to delineate desert tortoise habitat.
We agree that a scientifically sound analysis should be conducted to determine which factors negatively impact populations of the desert tortoise. The report provides recommendations to accomplish this task, including recommendations for habitat monitoring at different scales. A possible future recovery team should consider soils and other ecological aspects of tortoise habitat in this monitoring effort.

DTRPAC Report page 175
We received a comment suggesting that data on tortoise reproduction and disease be used to reevaluate the 1.0 lambda originally calculated in the 1994 Recovery Plan to determine a more accurate recovery goal.
As noted in the report, most recovery actions for threatened and endangered species are designed to stabilize population size (lambda at 1.0 across generations) where population size is sufficient to safeguard against extinction and to increase population size (lamba > 1.0) where population size is small enough to threaten extinction. By definition, lambas < 1.0 result in continued population decline. While we make no specific recommendations regarding modifying recovery criteria to reflect increased population lambas, we defer to a possible future Recovery Team to make a final determination. Nevertheless, we agree that disease and other relevant factors must be evaluated relative to population growth rates.
Many reviewers commented on the lack of discussion on headstarting and translocation as potential recovery tools for the tortoise.
The final report now includes a section on this topic.
Several reviewers provided comments pertaining to topics such as public outreach, the need for an implementation schedule and costs of implementation, the need to review existing DWMAs, and prioritization of research.
These comments are outside the scope of the DTRPAC’s charge and have been referred to the USFWS to be addressed by a subsequent Recovery Team, if one is necessary.

DTRPAC Report page 176
“Let science neither be a crown to put proudly on your head nor an axe to chop wood.”
Talmud

DTRPAC Report page 177
Appendix B. DTRPAC Meeting minutes
Desert Tortoise Recovery Plan Assessment Committee MeetingFriday, April 11, 2003 9:30am – 5:00pm California Academy of Sciences, Goethe Room
Greeting and charge to the committee
Bob Williams, Field Supervisor of the Nevada Field Station of the Fish and Wildlife Service (USFWS), presented the Desert Tortoise Recovery Plan Assessment Committee (DTRPAC) with a charge to use the best available scientific information to review the 1994 Recovery Plan.
After this review, the team will provide a report with recommendations as to where the 1994 plan should be revised (if necessary) and provide any new relevant data useful to prepare the revision. These recommendations will be reviewed by Management Oversight Group (MOG), the Clark County MSHCP, the Washington County MSHCP, and the Desert Management Group (DMG). After the DTRPAC has submitted their report, USFWS will form a recovery team to draft a new recovery plan. Therefore, this assessment is a first and important step to determine revisions and future direction of desert tortoise recovery.
USFWS will act as an interface between the team and the public. The need for stakeholder involvement in this process was highlighted. DMG representatives attended the DTRPAC meeting largely to reflect the interests of stakeholder groups in the process. They may attend future meetings to represent stakeholders participation and to facilitate an environment of openness and objectivity.
It was noted that this assessment committee is not a recovery team. This assessment is only the first part of two-step process. The team will be working as peer reviewers of the 1994 Recovery Plan in light of contemporary knowledge. The second step in the recovery plan revision process will be to assemble a recovery team consisting of scientists, managers, and stakeholders who will complete a revision of the plan.
A two-page summary of the current process will be provided on the on DMG website which will include the DTRPAC mission, scheduling of future meetings, briefings, and biographies of committee members.
Process of evaluation
A suggestion was made that there should be at the minimum, four or five more DTRPAC two-day meetings before a draft report deadline in November. The next deadline will be for a completed report to be delivered to the MOG by January for review. This committee does not include all the expertise that will be needed to complete this assessment. Therefore, ad hoc experts will be asked to brief the committee on topics where additional scientific expertise would be valuable.
Open meetings
All future DTRPAC meetings should be open to representatives of interested stakeholders who would like to observe. It was stated that by inviting representative stakeholders (one or two individuals) to observe and comment in their allotted time, they would then be able to convey DTRPAC proceedings to constituents. USFWS will invite stakeholders to future meetings, and

DTRPAC Report page 178
provide minutes from each meeting through the DMG website. Meeting agendas, including invited speakers for each meeting will be announced in advance.
One opportunity for public involvement will be an open call for requests for additional topics to be covered at DTRPAC meetings. A preliminary list of what the team plans to include in the assessment will be provided. If there is a good scientific basis, these additional topics will be included at the appropriate time during discussions.
Invitations to stakeholder scientists
If a stakeholder feels as though the team has missed information, they are invited to provide a scientist to present their issue as a briefing to the team. DTRPAC meetings will be topic oriented, so the scientist will be speaking about the specified topic of the meeting, and (s)he must bring references to publications that can be distributed to the team members prior to the meeting.
Periodic briefings to DMG and MOG
Briefings of the DTRPAC progress to the MOG, Clark County, Washington County, and the DMG will be completely open to the public.
Location of meetings
To provide convenience for local team participants, meetings will be sited in different locations. Possible locations include Las Vegas, Palm Springs, Reno, and San Francisco again. Depending on the discussion topics, field trips may be required.
Advanced materials for each topic
Materials for each meeting will be available via email, on a website, and in print for meeting participants. Materials for each meeting will be determined at the previous meeting.
Writing assignments
At the end of each topic discussion, different sections of the report will have to be written. Team members will alternate between writing and reviewing sections.
Discussion of proposed six segments of assessment (tentative list)
Following a discussion on the process of future DTRPAC meetings, the team began discussing and prioritizing, the tentative list of six proposed segments of the recovery plan assessment. This preliminary list, which will be subject to change following public comment and further team discussion, is attached at the end of the minutes.
1. Delisting criteria Delisting criteria are found on the first page of recovery plan, and are goals that are critical to the recovery of the desert tortoise. A discussion of these criteria has three parts:
a) Are the current Recovery Units biologically correct? b) Is the relationship between Recovery Units and delisting criteria appropriate? c) Are delisting criteria able to be implemented and sufficient?

DTRPAC Report page 179
It was suggested that the Recovery Units of the 1994 plan should be revisited and modernized in light of the current USFWS definition of a distinct population segments (DPS). Currently, the recovery plan acknowledges six recovery units based upon genetic, morphological, behavioral, ecological, and geographic differences. Using the USFWS DPS definition, boundaries should be revisited, along with the number of DPSs, which may change with new data and DPS definition criteria.
The clarification was provided that the Mojave desert tortoise was listed range wide, before the USFWS definition of DPS was established. Therefore, the USFWS currently can only delist the entire Mojave population. Legally, it is not possible to delist recovery units. DPSs are usually defined in the listing action, which would allow delisting by DPS. If the team finds, in accordance with contemporary USFWS policy, that distinct population segments need to be individually listed and there is adequate evidence that this is warranted, then the DTRPAC should attempt to provide information on redefining segment boundaries, characterize what data are missing for DPS designation, and how many specific DPSs are justified. If the species warrants DPS listings, the team should provide as much information as possible to the future Recovery Team as they make changes to the Recovery Plan.
Meeting participants concurred that the team should review current literature and current recovery units and give basis for change in boundary and number of units. If the team comes to consensus that the tortoise populations should be distinguished as DPSs, then there should be a recommendation on how many units should be designated. There was also a suggestion that the team should operate under the (potentially “null”) hypothesis that there is only one large population. The preponderance of evidence will have to prove that the populations have fundamental differences in life history strategies with conservation consequences, if they are considered the same. It was noted that the assessment committee also must consider the consequences of not breaking down tortoise populations into DPSs, if it will be a downfall, and why.
Different threats, niches, habitat, behavior, morphology, genetics, and ecology are possible characteristics defining DPSs. As a result, different management strategies may be necessary for each DPS. The USFWS policy lists the following as DPS criteria: discreteness, significance, and conservation relevant to listing factors. The committee must evaluate all these criteria.
What information is needed for this topic?
Genetics and morphology data
ACTION: Dr. Morafka will take the lead on this issue and compile and distribute relevant literature on DPSs. The DTRPAC will discuss differences in definitions between the Recovery Plan and current definitions in the literature, and look at extent of where DPS boundaries need to be reconsidered.
Demographic status – Committee members should identify information gaps. The committee would like any data that suggests why populations are declining in certain areas, and results from any new demographic studies that occurred after the 1994 Recovery Plan.
o Types of data needed (mean as well as within and between site variances): size distribution plot densities sex ratios health status fecundity data/reproduction

DTRPAC Report page 180
o How much? All the data from as many populations as possible is needed, so that team can
evaluate data, and recommendations can be based on best data available. The DTRPAC is also interested in evidence of decline and from study plots,
including information on placement of plots, number of visits, drought conditions during each year of study, and evidence of mortality including shells.
o End product: The team would like a map of total tortoise distribution with indicators of
population status (arrows up/down/stable), and the evidence that led to each judgment.
ACTION: Mr. Medica will be the lead on determining what status information is available, and compiling permit reports from USFWS offices. Mr. Murray will provide study plot information from Arizona, which will be scanned in electronically by Dr. Heaton.
NOTE: All electronic information should be sent to Ken Nussear (UNR). Dr. Heaton will aid in the collection of electronic data and scanning.
ACTION: Dr. Heaton will gather total live/carcass data, burrow data, lumped sign data, line distances sampling data, and encounter rates, and will incorporate them into a map; This type of map may be helpful with area occupied by tortoises (presence/absence) and threats.
Briefings: The DTRPAC will require a briefing on all topics related to DPS units. Dr. Morafka will collaborate with others to provide a briefing on distinctness. Other possible invited speakers would be Taylor Edwards, Dr. Kristin Berry, and Dr. Dave Germano.
The briefing on demographic status should include status across the Mojave population’s range. Dr. Berry will be asked by Dr. Lovich and USFWS to provide a complete review of California study plots, particularly those that have had long-term monitoring, and any new studies. Mr. Medica will provide equivalent information for Nevada. Mr. Murray will report on Arizona and Utah.
ACTION: Dr. Tracy will draft guidelines for what is needed by those giving briefs. He will then email the draft to entire team for comments.
The following items need to be discussed and integrated before the DTRPAC can make any recommendations regarding distinct population segments.
Genetic, morphological, and biological differences among populations Range wide demographic status of tortoise populations and threats Determine the extent to which the results from the assessment differ from 1994 recovery
plan
As a result of the extensive amount of information needed to discuss DPSs, and the amount of time to prepare data, these topics will be broken up over several meetings.
2. Threats The topic of threats to tortoise populations includes three components: definition of threats, status, and monitoring. Mojave populations of the desert tortoise population appear to be in a delicate balance. This may cause difficulty in ranking threats, especially when any number of combinations of threats may be the culprit of population declines. The following are viewed as threats to the

DTRPAC Report page 181
desert tortoise: ravens, vehicle access, feral dogs, and grazing. The DTRPAC will discuss these threats separately, the interrelation of threats and groups of cumulative threats, as well as any new threats. Currently, there is a controversy over whether disease should be considered a threat or is manifested as an “exacerbating condition”, not a cause – or precipitant - of population declines. As a result, disease will be considered separately from threats.
Disease updateThe DTRPAC would like an update on ELISA testing and would like to discuss the following questions.
Is disease natural or an invasive? If natural and largely existing in a chronic state, what exacerbates it into an acute state? If an animal is tested, where is it located? (wild vs. pet populations)
Regional Status on a by-threat basis Dr. Bill Boarman and Dr. Heaton will be asked to provide a brief on missing information in the most current threats document and where are threats located.
West Nile Virus question and impact Dr. Delehanty will assemble a short report on changes in the West Nile Virus and the possible threats to ravens in the Mojave Desert.
3. Monitoring: USFWS has identified (a) species populations, (b) habitat changes, and (c) threats as monitoring priorities. Monitoring issues will be covered during appropriate topic discussions.
Habitat New information on habitat has become available since the 1994 recovery plan. The DTRPAC would like a clear picture of how tortoise habitat has changed. This would include information on the impacts of fire on tortoise habitat with the disappearance of shrubs. Estimations of habitat loss would also be helpful. Utah State University and the Desert Research Institute collaborated on a data set that provided estimations of development from 1980, 1990, and future projections. This data set may provide good regional indications by providing population information layered on top of urbanization.
4. Remaining items to be covered Habitat Conservation Plans (HCPs) – The team should be assigned to review that section of
recovery plan and determine if it is on target. Members would like an update section on which HCPs are on the ground and the status of tortoise management.
Research needs and priorities/delisting criteria
Scheduling of future meetings:
(15% of each meeting will be devoted to planning the next meeting.)
Meeting 1: May 15-16, Palm Springs, CA Day 1:
o First session on distinct population segment issues: biology, genetics, and morphology
o No invited speakers for day 1

DTRPAC Report page 182
Day 2: o Disease and associated topics (euthanasia, ELISA testing, and other management
issues) o Due to a conflict with a major microbiology conference, it is not possible to be
briefed on disease at the next meeting. Thus, Dr. Boarman will brief us on threats. o Prepare for monitoring of threats portion of Meeting 3
Meeting 2: June 9-10, San Francisco, CA
Both days will be spent on the regional status and monitoring of threats. THE DTPRAC will ask the question, “Does the original recovery plan adequately cover these issues and is there new information that would change views?” Due to the microbiology conference conflict, we will invite M. Brown, D. Brown, D. Rostal, and J. Heaton to present a briefing at this meeting instead of the Palm Springs meeting.
Meeting 3: July 31-Aug 1, Tucson, AZ
This meeting will focus on the demographic status of tortoise populations and habitat. Dr. Kristin Berry, Phil Medica, and Roy Murray will be asked to present demography data for CA, NV, AZ, and NM. A discussion of monitoring will begin at this meeting.
Meeting participants at April Meeting
Roy Averill-Murray, Arizona Game and Fish Dave Delehanty, Idaho State University Jill Heaton, University of Redlands Jeff Lovich, USGS/BRD Earl McCoy, University of South Florida Phil Medica, USFWS Dave Morafka, California Academy of Sciences Ken Nussear, University of Nevada, Reno Dick Tracy, University of Nevada, Reno Bob Williams, USFWS John Hamill, DMG Bridgette Hagerty, UNR Clarence Everly, DMG
For Reference:
Possible areas of discussion 1. Delisting criteria (do we need changes from those prescribed in the DTRP?)/ need to list by
“Distinct Population Segment” (DPS)?/ different criteria for different DPSs? This topic is listed first because, even though the 1994 recovery plan suggested treating each recovery unit separately, the USFWS has not pursued legally treating each recovery unit separately. Insofar as differences among recovery units have become greater with time (some populations having declined to disastrous levels while others could be stable), and insofar as this is a topic that might require USFWS action before the recovery plan is revised, we need to discuss this topic.
2. Habitat conservation planning including critical habitat designation, threats, and delisting criteria. This allows us to address the different needs in different recovery units.

DTRPAC Report page 183
3. Updates on regional status of (a) population threats, (b) threats, (c) habitats. This forms the basis for most other topics.
4. Monitoring of (a) tortoises, (b) threats to tortoise populations, and (c) changes in status of habitats. The prescriptions for monitoring in the 1994 recovery plan were sometimes naïve in light of today’s knowledge. This is a terrifically important, and sometimes controversial, topic.
5. Details of specific threats and their mitigations with special attention to interactions among individual threats. This deals with the very controversial topics of the basis for listing and recovery.
6. Research needs and priorities in the next decade. Assessment of research proposed in 1994 DTRP and what is needed next. Most of what was recommended in 1994 has not been implemented. We need to reassess old and new prescriptions for science and research.

DTRPAC Report page 184
Desert Tortoise Recovery Plan Assessment Committee MeetingFriday, May 15-16, 2003 Wyndham Hotel, Palm Springs, CA
Announcements and Introductions
Bob Williams (USFWS) spoke about changes made in stakeholder involvement after the April 11th
meeting. In order to implement the recovery plan consistent with the GAO report, the U.S. Fish and Wildlife Service (FWS) is working on a Memorandum of Understanding (MOU) among Department of Interior agencies and the states. A memo to the Management Oversight Group (MOG) and Desert Management Group (DMG) outlined a two-layer structure for stakeholder involvement in this process. The first layer consists of state and federal agencies, which would nominate representatives to observe the scientific expert panel. The second layer consists of representative stakeholders. This structure will be used to develop an open process for those collecting information and will aid in data gathering. The membership of the Desert Tortoise Recovery Plan Assessment Committee (DTRPAC) will not change.
Presentation on distinct population segments issues (biology, genetics, morphology), led by Dr. David Morafka
A synopsis was given of how distinct population segments (DPSs) are incorporated into the 1994 recovery plan, as well as the language of the 1996 USFWS DPS policy. The terms DPS and ESU (evolutionary significant unit) were synonymous at the time the 1994 recovery plan was written. These were equated as a recovery unit in the 1994 plan, and all terms were used interchangeably. The USFWS has developed a legal definition for the DPS. The DPS designation is based on three criteria, and the term is to be used “sparingly” and only when warranted. The three criteria are: 1) discreteness, 2) significance (if criteria 1 is met, and 3) conservation status in relation to the Act’s standards for listing.
The term “sparingly” is only discussed in terms of listing, not delisting. Therefore, if the DTRAPC recommends that the species warrants DPS designations, then implementation of delisting each segment may be possible. The other alternative would require relisting the desert tortoise, making redefining using DPS units more difficult. By writing delisting criteria in the recovery plan using USFWS DPS criteria, the DTRPAC could accomplish the same goals and with less difficulty. There are many examples where this is already occurring, such with the gray wolf. The USFWS recommendation to the DTRPAC is to make recommendations based on science. The USFWS will use those recommendations for appropriate actions.
The DTRPAC has three tasks in relation to identifying DPSs: 1) make the best recommendation with current available information for the number of DPS units (if any) and the boundaries of those units, 2) determine gaps in information, and 3) produce a new protocol for how future recovery teams and assessment committees should handle DPS designations. In all discussions, the DTRPAC should be trying to reject the null hypothesis that there is no difference among units and should the term DPS “sparingly”.
A summary was provided of current information on the status of ESU/DPS (see Pennock and Dimmick 1997). Previous genetic work on the desert tortoise has used mitochondrial DNA and allozyme markers. Currently, there is no uniform command for geneticists to perform tortoise studies using equivalent sample sizes, genetic markers, or study areas. As a result, uniform

DTRPAC Report page 185
sampling has not occurred range-wide for the Mojave population. Data are incomplete and have inherent biases resulting from low scientific rigor.
To designate a DPS, all three elements must be considered and satisfied in some way, but not necessarily equally.
1) Discreteness: Genetics is a conservative place to start to look for evidence of population differences. Morphology may be different across the Mojave population, but can be subject to dietary and other environmental influences, as well as genetics. Behavioral differences are similar to morphological differences in that it may not be solely a function of genetics.
2) Significance: The term significance can be taken very broadly, and unusual circumstances and ecological niches may be critical to DPS designations. Peripheral populations may warrant protection because of its distinct ecosystem; however, one must also take into account the probability of persistence.
Discussion on distinct population segments (DPS)
Currently the recovery plan designates six recovery units: Upper Virgin River, Northeastern Mojave, Eastern Mojave, Northern Colorado, Eastern Colorado, and Western Mojave.
There was discussion concerning the table below and how the terms in the table relate back to DPS criteria. The table was constructed using published and available evidence.
Table summarizing the criteria used to define Distinctive Population Segments. The criteria are ranked as poor or negative evidence (—), absent or ambiguous evidence (0), positive evidence (+), or highest priority. The data are taken from The Desert Tortoise (Mojave Population) Recovery Plan (Plan) (1994) and Britten et al. (1997). Possible changes to the table are highlighted in red. Initially the Conservation Need/Status columns were represented by one column, which notes that there is positive evidence for greatest need for conservation relative to the status of the unit.
DPS Discreteness (I)
Ecological Significance (II) (be more specific)
Geographical Significance (II)
Genetic Significance (II)
Conservation Need (III)
Conservation Status/existing regulatory mechanisms (III) (threats, etc)
Northern Colorado — 0 + ? 0 Eastern Colorado — + + — ++ Upper Virgin River + + + + ++ Eastern Mojave 0 0 0 — + Northeastern Mojave
0 — + 0/+1 +
Western Mojave 0 + + — ++ 1 Significant genetic units are embedded within the DPS.
There was a discussion about additions to the table, including discreteness being separated into its component parts (behavior, morphology, ecology) and using the new DPS hypotheses based on genetics by adding a North Las Vegas unit. The conservation status column should include consideration of threats, which are important for determining the status (threatened/endangered) of each DPS.

DTRPAC Report page 186
The USFWS DPS Policy determines the order of discussion for designating DPSs. First the unit must be discrete. Once discreteness is determined, than significance must be, followed by conservation status. The DTRPAC came to consensus to use genetics used as first cut for determining DPS units, followed by the incorporation of other factors including morphology, ecology, and behavior.
Maps showing the current situation and proposed changes were used to aid in the discussion. A suggestion for the DTRPAC to provide more detailed recommendations for the boundaries for DPS units, etc. was given because of the ability to use current GIS technology.
The DTRPAC must resolve 1) if there is a legitimate basis for DPSs in the Mojave population, 2) if four conservative units are well-justified, 3) what data, in addition to genetics, are needed to make DPS designations, and 4) how can interested scientists improve on status quo.
The DTRPAC suggested that the Upper Virgin River unit is well justified because it has discreteness in genetics, behavior, morphology, and habitat. In addition, the Western Mojave/Eastern Colorado units are distinct from the other units. The Northeastern Mojave unit requires resolution and revision. Finally, the Northern Colorado unit has poor justification to be designated different from the Western Mojave.
In Southern Nevada, there is a wealth of local amphibian populations due to historical water complexity that has only recently been simplified. This suggests that it is a good place to look for desert tortoise distinctness. Britten et al. (1997) highlights complexity in S. Nevada, but not in a uniform way. Since the recovery plan there have been studies that present information on the division of recovery units in the Mojave population. Britten et al. (1997) use shell morphology, allozyme data, mtDNA data at a fine resolution and designate Amargosa, Piute, North Las Vegas, and South Las Vegas as separate areas. Lamb (1994) suggests that there are genetically distinct populations in NV (North Las Vegas/South Las Vegas), and in the northern part of the tortoise range.
A suggestion was made to designate Coyote Springs/Mormon Mesa/ Gold Butte (North Las Vegas) as one DPS. Further genetics are needed to define the Gold Butte area. There would be another unit, South Las Vegas, and perhaps more than one (Piute Valley, Ivanpah, Amargosa). Historic land data vaguely supports this idea, but it is not an overarching cause. These DPS designations would be a working hypothesis. In order to provide more support for this hypothesis, it will be necessary to expand on Britten et al. (1997) and incorporate land formation data.
Allozyme and mtDNA data suggest that most of California is strikingly homogeneous for many warm desert species. This may suggest that there was an over subdivision of recovery units in CA. The Colorado Desert has quite different vegetation from Western Mojave (Vasak 1984); however, there is little genetic difference. The differences could be local environmental adaptations to different environments, such as differences in rainfall.
Some members of the committee continue to stress that threats are paramount to recovery. Although the DTRPAC has no problem with determining distinctness among the population, some members caution against excessively fine scale phylogenies.
The DTRPAC came to an initial consensus on DPS designations, based on genetics using the current available data. These DPS hypotheses are subject to revision with new genetic, ecological, behavioral data. The genetic discreteness hypothesis is that there are four DPS units: Upper Virgin

DTRPAC Report page 187
River, North Las Vegas, Western Mojave/Colorado Desert/Piute Valley (subject to revision), and Amargosa/Eastern Mojave (Ivanpah).
Limitations and Deficits in DPS designations: 1) Program of uniform sampling (20-25 samples per local populations using all genetic markers, including microsatellite information range wide) 2) Behavioral: a) burrow/microhabitat selection b) hibernacula 3) Ontogentic series characterizing morphological differences 4) Standardized morphological analysis 5) Behavioral differences among populations that affect gene flow 6) Geographically describe problematic areas (Southern Nevada, Colorado divisions)
Position paper recommendations: 1.Add a geneticist to the full Recovery Team to revise the 1994 plan. 2. Genetic core units need to be assessed using both nuclear and mitochondrial genes (Berry et al., 2002). 3. The genetic boundaries and gene flow between units needs to be critically examined. 4. Once these data are available, ecological, morphological and behavioral attributes can be assigned to each of these genetic units. 5. Finally, CHUs within each DPS should be geographically revised delineated to maximize their conservation potential in consultation with local resource administrators.
The initial DPS hypotheses do not include ecological differences and boundaries. A suggestion was made to study behavior that is essential to gene flow, thus connecting genetics and behavior. Information would include fecundity, clutch frequency and size, mating system, sperm storage, connectivity, barrier crossing, and dispersal patterns for juveniles and adults. Another suggestion was that the DTRPAC should specify the need for or give specific objective ways to determine if a behavior or morphology is different among DPS units. This would requite targeted research.
ACTION: Dr. Morafka will revise the position paper in light of today’s discussion, as well as add recommendations for future groups revising DPS units. Dr. McCoy will write an addition to the paper discussing problems with objectivity and the research necessary to overcome these difficulties. Dr. Delehanty will write an addition discussing the conservation biology point of view.
Briefing on threats to Mojave desert tortoise population, Dr. Bill Boarman
The DTRPAC will examine if there are significant changes that need to be made in a subsequent recovery plan in relation to threats. This possibly includes justification for the list of threats in the 1994 recovery plan, and suggesting data collection that would allow for the prioritization of threats. The 1994 recovery plan does not show the complexity of threats or potential interactions among threats.
Dr. Boarman was charged to evaluate all current knowledge on threats to desert tortoises for the West Mojave Planning Team. His 2002 report includes a literature search, an evaluation of sources, and a discussion on threats to desert tortoises. Ranking of threats and spatial/temporal information is not included in the report. Some sources used to support threats were weak (based on lack of data). Since 1994, more data have become available, which should be identified in the DTRPAC report.

DTRPAC Report page 188
Discussion of threats:
DTRPAC’s report should recommend that the recovery team use Dr. Boarman’s 2002 literature review and Dr. Heaton’s work to update the recovery plan. For example, appendix D could be revised using Dr. Boarman’s literature review.
Dr. Boarman highlighted new or increasing threats. The 1994 Recovery Plan may have underestimated the threat of feral dogs to desert tortoises. As a result of less space between desert fragments, there are regional changes in canids as a threat. Anecdotal information suggests an increase in feral dog populations, corresponding with an increase in human disturbance. Fire is also an increasing threat. The spatial and temporal distribution of fire should be examined, as roads may be causing the increase.
In addition, Dr. Boarman noted threats that have diminished since the 1994 Recovery Plan. Direct impacts of livestock grazing have been eliminated due to action, except in certain areas in the West Mojave. Collecting by humans may no longer be a widespread population threat. Law enforcement data would be helpful to determine if collection is a localized problem. There is a need to compile poaching information to refine extent of the threat.
The major inadequacy of the original plan was lack of discussion on synergies and interactions among threats. Instead a list of threats was provided. One of the substantial overall threats is the human access or road access to the desert. This threat incorporates components of the exotics, fire, poaching, and ORV threats. The reduction of cumulative effects as supposed to individual threats would be more effective. Cumulative threats were not emphasized in the 1994 recovery plan. Quantifying threat interactions experimentally will be the most difficult, expensive, and valuable. Designating research areas for science (experiments) to occur and recommending experimentation that has management payoff should be a priority.
A suggestion was made to use modeling of threats and their effects on tortoise population. A current update of the model could be made using current available data (i.e. new raven predation data). The model could be used to evaluate relative effects of threats compared to each other (i.e. sensitivity analysis) in certain areas of the Mojave. Probability maps, predicting threats in certain areas of the desert in conjunction with modeling effects on tortoise populations would help assess potential for problems. In addition, an updated graph of roads vs. tortoise deaths showing an analysis on a spatial and temporal scale (roads, fires, exotics) to compare to other non-human caused threats. In order to rank threats, some form of commonality is needed. The DTRPAC should highlight overarching problems and what needs to be done on a more localized basis.
ACTION: Dr. Tracy and Dr. McCoy will work on a modeling effort to assess the effects of ravens on tortoise populations.
ACTION: NDEP historical data has not been available on line. Clarence Everly has been tasked with providing DTRPAC with data that has been previously unavailable (aerial photos).
ACTION: The desert is a place of life that has vital components (desert blooms, seasonality) easily damaged by human contact. Desertification of the desert can wipe out species that are typically described as “desert species.” Dr. Morafka will write a paragraph explaining desert complexity.

DTRPAC Report page 189
Preparation for future DTRPAC meetings
June 9-10 Meeting in San Francisco, CA: June 9 – Disease
Invited guests: Dr. Mary Brown, Dr. Dave Rostal, Dr. Elliot Jacobson June 10 – Wrap up threats; Presentation on threats by Dr. Heaton
Dr. Elliot Jacobson will be invited to speak about interaction between URTD and herpes virus. The workbook from the Disease workshop should be available for distribution at this meeting. The disease discussion could be one day, and the team should have focused questions that deal with the recovery plan. The DTRPAC should focus on issues not discussed in the 1994 recovery plan such as new diseases (e.g. herpes), alternative hypotheses of sources, synergisms, and types of stresses. In order to write a report about the 1994 recovery plan with respect to new information on disease, the DTRPAC will ask penetrating questions to the invited speakers.
ACTION: Dr. Morafka will contact Dr. Jacobson about attending the June meeting.
A suggestion was made to invite an outside epidemiologist to interact with Mycoplasm experts in the tortoise field. DTRPAC would like to determine data are necessary to make further progress in the tortoise disease. The epidemiologist will hopefully be able to determine if the current pattern of outbreak and latency been documented elsewhere. In addition, the epidemiologist will be asked to objectively evaluate current Mycoplasm hypotheses, which would launch into later discussion.
ACTION: Dr. Tracy will find an outside epidemiologist to attend the disease portion of the meeting. Dr. McCoy will send Dr. Tracy a list of references for epidemiologists.
There was concern raised about ability to cover all threats, including a comparative analysis and potential other threats. However, identified threats are already included in the 1994 Plan. Cumulative effects and interactions among threats are lacking. A suggestion was made to identify threats and how they affect life history strategies. A Threats table should include basic information, management, monitoring, and mitigation, in order to provide as much information as possible for the next recovery team.
ACTION: Dr. Heaton will put together a first draft of a threats matrix that will accompany the DPS table with respect to former recovery units (and/or new DPS). Dr. Heaton is also working on a spatial population status map.
July 31-Aug 1 Meeting: This meeting has been moved to Truckee, CA. July 31 – Demography/Population status Aug 1 – Threats wrap up
ACTION: Dr. Tracy will invite Dr. Dan Brown to give briefing on disease phylogeny in the afternoon July 31 or morning Aug 1.
There should be a gap analysis of demography data, as well as a discussion of ties between tortoise declines and threats status
ACTION: Roy Murray has all materials for UT and AZ. Data in spreadsheet format will be given to Ken Nussear and Dr. Heaton by May 23.

DTRPAC Report page 190
September 4-5 Meeting in Monterey, CA: Topics to be discussed:
Monitoring / Begin delisting criteria
ACTION: Dr. Morafka will call Asilomar about accommodations. The Double Tree or Casa Munras Inn are other choices for accommodations. The Monterey Aquarium is another choice for a meeting place.
October 2-3 in Tuscon, AZ:
Topics to be discussed: Finish delisting criteria Research Needs Conservation Planning
Invite: Mary Cablk (DRI)
ACTION: Dr. Heaton will invite Mary Cablk. The Desert Research Institute has range-wide change detection analysis data. Mary will give a presentation on hyperspectral data.
The issue of tortoise habitat will be covered during the conservation planning discussion. A suggestion was made to review critical habitat designations and determine if they are properly designated. This could be determined by performing a comparative analysis of demographic data in critical habitat vs. outside critical habitat. Reserve design could also be revisited in a similar manner. Management actions of other species that would affect tortoises will also be covered in conservation planning.
ACTION: Roy Murray will call about meeting accommodations at Tumamac Hill or the USGS room at the University of AZ. Bridgette will call the Inn Suites.
November 6-7 in Las Vegas, NV: Grand Wrap Up and final DPS designation discussion
Revisit discussion of DPS and desert tortoise threats
By changing the number of DPS units, the number of needed management reserves may change. It is important to ensure that there is continuity in protection throughout the listed range, despite where boundaries are changed.
An argument was made for breaking up Western Mojave based on other factors besides genetic factors. There is a special conglomeration of threats in the West Mojave, as well as ecological differences in the Colorado Desert (i.e. major climatic difference, 116 degrees longitude is a segregation point based on meteorological data in the Mojave). There is also corresponding data on desert flora and rainfall from Mojave botanists. A good reference for this is the June Lathrup (ed.) book on California Deserts.
ACTION: Dr. Heaton will put together maps for each situation to show further delineation of DPS units after genetics using ecological (climate) and behavioral factors. Tortoise habitat will EXCLUDE everything above a certain elevation (5, 000 ft) to better show the available habitat, dry lakebeds, urban areas, and highways.

DTRPAC Report page 191
Determination of writing assignments:
The DTRPAC began to assign sections of the final report by identifying products that would result for DTRPAC meetings. A rough draft of a Table of Contents is attached at the end of this document. There was a discussion on what topics should be included in the report and in what order. Additionally, products were discussed from the past meeting and this meeting. The section on research needs should be a portion of each of the writing assignments for each section, not one section at the end of the report. An introduction to the report will include a scientific overview of what is known about the desert tortoise comparing prior to the 1994 Plan to present, showing significant advances in the state of general knowledge. DTRPAC products will include an updated GIS range map for Desert Tortoise and a comprehensive bibliographic reference for all desert tortoise literature, including references published since the 1994 Plan.
ACTION: Dr. Lovich will produce a rough draft of an introduction and distribute to the DTRPAC for review.
Meeting participants: Roy Averill-Murray, Arizona Game and Fish Dave Delehanty, Idaho State University Jill Heaton, University of Redlands Jeff Lovich, USGS/BRD Earl McCoy, University of South Florida Dave Morafka, California Academy of Sciences Ken Nussear, University of Nevada, Reno Dick Tracy, University of Nevada, Reno Bob Williams, USFWS Bridgette Hagerty, University of Nevada, Reno Becky Jones, CA Dept of Fish and Game Clarence Everly, DMG

DTRPAC Report page 192
Desert Tortoise Recovery Plan Assessment Committee Meeting June 9-10, 2003 Redwood Room, California Academy of Sciences, San Francisco, CA
Discussion on tortoise disease with panel of guest speakers, Dr. Mary Brown, Dr. Elliott Jacobson, Dr. David Rostal, and Dr. David Thawley
The following questions were asked of guest speakers prior to the meeting: 1) What is the existing research and what future research is needed bearing on the alternative
hypotheses concerning URTD? The alternative hypotheses are 1) Mycoplasmosis is a novel disease to natural populations of desert tortoise, or 2) Mycoplasma has persisted in wild populations of desert tortoise for a long time, occasionally breaking to acute status with some mortality.
2) What existing research/future research bears on whether populations of desert tortoise (not individuals) are negatively affected by URTD?
3) What research has been done and needs to be done to understand what stressors will cause chronically affected populations to become acute?
4) What existing research/future research bears on the effects of different strains of Mycoplasma on clinical outbreaks v. environmental stressors?
5) What management actions do the literature and your scientific opinion recommend to control the spread of URTD, and to recover affected populations?
Dr. Elliot Jacobson gave a presentation on disease studies in the desert tortoise. At the time of the original recovery plan, very little was known about Mycoplasma in relation to tortoise disease. Two sections of the 1994 recovery plan apply to disease: 3.b.1 Initiate epidemiologic studies and 3.b.2 Research sources of mortality. Little attention has been paid to epidemiologic studies since the recovery plan was written.
There is no data to support the idea that Upper Respiratory Tract Disease (URTD) is moving through the populations of the Mojave desert tortoise. From the information available, it would seem that Mycoplasma has been in coexistence with the desert tortoise for extended periods of time; however, there may have been subsequent changes in the strains infecting tortoises. Evolutionarily, Mycoplasma can coevolve with their hosts. Current data only point to an association between death of tortoises and URTD.
Mycoplasma agassizii is isolated in the upper respiratory track, which is unusual with Mycoplasma infections. Dr. Jacobson is interested in looking at the energetics of disease in the desert tortoise. Studies of water balance in sick tortoises appear to be critical to understanding the relationship between disease and environmental stress.
Shell dyskeratosis is the only other disorder mentioned in the recovery plan. This disorder, which may be related to toxins, causes lesions that affect the formation of keratin.
The following are on going projects related to desert tortoise disease: 1) necropsies of ill and dying tortoises (recommended in original Recovery Plan), 2) serologic survey of desert tortoises for exposure to Mycoplasma and Herpesvirus (THV) (prevalence of disease in captive tortoises), and 3) transmission of Herpesvirus and Mycoplasma through the egg of desert tortoises.

DTRPAC Report page 193
Dr. Jacobson gave some examples of tortoise disease, including hepatic and renal disease, and Herpesvirus. Herpesvirus may be a significant problem; however, there is no data on how Herpesvirus is affecting wild populations.
Future studies on tortoise disease will include: 1) transmission of THV, 2) developing immunologic markers for heath assessment, 3) examination of tissues by PCR for retroviruses and other pathogens, and 4) understanding the pathophysiology of hemosiderosis.
The need for epidemiologic studies was highlighted, however, to perform the appropriate studies, appropriate questions are needed. For example, is disease spreading across the Mojave? Although ELISA positive animals did increase across the Mojave desert, this may be an artifact of sampling. URTD is seen mostly in dense populations and may be drought associated. Another question would be is URTD an ultimate cause of tortoise mortality.
There was a question of how information on tortoise disease will relate into management actions, considering this is a sparsely distributed wild population. It was noted that human intervention might only be a short-term fix. Over the long-term, human actions may not necessarily help the species. The difference between protecting populations and protecting individuals was noted. The response was that there is conservation value in containing the disease in particular areas which are protected. By setting up ways to limit disease transmission, this will aid in translocation studies by limiting exposure. Interim actions are necessary to create artificial source and sink populations cannot sustain themselves alone due to habitat fragmentation and other threats. Source and sink populations could be related to elevation, and subsequently to rainfall.
There is a population of tortoises in Ft. Irwin which does not show antibodies for the disease. This suggests that it could be possible that Mycoplasma may be novel for the desert tortoise or that the population has cleared the disease. An alternative explanation is that the sample sizes could be too small or the test could not be detecting the strain that may exist in that population. There was a suggestion that URTD has all the characteristics of agents entering a population that have never come across a particular organism (non-resistant population). This may be a case of a very significant genetic change in the Mycoplasma in recent times.
Dr. Mary Brown presented the need for a global perspective on tortoise disease. There are multifactor causes of morbidity and mortality events and disease is only one factor that contributes to mortality. Understanding how disease interacts with stress, drought, and nutrition is critical. There is a need for a rapid response program to investigate morbidity and mortality events. There are other response programs (Biodefense and Foodnet) which we can use as models.
Components of rapid response could include:
1) Standard operating protocols in place (permits, etc.) so that when an event happens, the response actions occur immediately.
2) Diagnostic and evaluation protocols designed to determine the nature of the threat 3) Appropriate management strategies for containment or removal of threat 4) Plans for monitoring the success of the action
This potential management action was not specified in the original recovery plan. If there is a disease outbreak in a protected area, this is a possible way to introduce controls to prevent spreading to conspecifics. Examples of possible actions are setting up a quarantine zone or removing actively shedding animals. These animals could be held for observation and possibly

DTRPAC Report page 194
reintroduced in the long term. Using modeling as a tool also may be helpful for studying different outbreak scenarios. There is a need for interdisciplinary solutions to disease. In the future, models could be applied to use and test validity of predictive models, provide framework for management decisions, and use real outbreaks to provide a benchmark for efficacy of containment models.
Strategies for the control of infection diseases include:
Diagnosis Quarantine Culling or segregation Physical separation/barrier Use of sentinel animals Investigate the periphery of outbreak Long-term monitoring – choose populations that will provide the most information, not
solely disease monitoring (habitat, etc)
Hypothesized factors contributing to URTD disease transmission and severity:
Critical threshold of exposure (differs among populations) Microbial virulence Microbial infections dose and lesion dose (wide variety of virulence) Prior exposure (limited ability to control disease severity) Clinical expression of disease Gender, age, and behavior (individual behavior may affect) Exacerbating factors – nutrition, drought, etc. Nutritional status
Although there is no definitive proof, the following are the potential population effects of URTD (long-term monitoring is needed):
Multifactorial disease Directly Affects demographics and viability May impact Survival and reproduction May affect Physiology/behavior
There are two Mycoplasma that have been isolated from wild tortoises: Mycoplasma agassizii – confirmed etiologic role in URTD Mycoplasma cheloniae – isolated; some strains may be pathogenic Two additional Mycoplasma not yet isolated
A cluster of closely related species may cause URTD, which is consistent with respiratory disease in poultry and small ruminants. This causes a diagnostic dilemma because the ELISA test may not cross react with all strains; clusters may vary regionally, and may vary in virulence. To understand differences in virulence among strains, new work is being done with virulence infection studies.
1) Identification of virulence genes and development of virulence profiles 2) Critical prognostic information and management decisions – identify gene products and
develop prognosis checks, which may be an early detector for populations in trouble
It is important to understand specific virulence factors so that scientists can:

DTRPAC Report page 195
Predict disease severity and at risk populations Determine specific antigens occurring when “bad” Mycoplasma are present Monitor changes over time
o Mutations o Changes in microbe present due to new introductions
Currently there are major gaps in knowledge including:
Tortoise immunobiology – reagents and functional assays, normal vs. abnormal values, cellular immune system
Infectious agents – different strains/species Diagnostics testing Long term effects in wild populations
These gaps lead to directions for future research:
Development of genetic profile for virulence Interactions with other agents Rapid response
Dr. David Rostal gave a presentation on URTD and reproduction in the desert tortoise. Reproduction studies occurred in 1991-1993 with a follow up in 2000-2001. Dramatic declines in reproduction were seen in acute animals; however, reproduction recovered in animals showing clinical signs of URTD over time. Animals showing acute symptoms were more likely to show symptoms in the follow up. These animals were not nesting, and therefore, were not functioning as a reproductive part of the population. In the follow up, a majority of sick individuals began to reproduce in a manner like ELISA negative animals. There was no difference in clutch size and no difference in hatchling size between formerly sick and always well animals. The ability to reproduce seems to recover in infected tortoises.
Some observations from gopher tortoises at Ft. Stewart may provide insight for the desert tortoise. Reproduction, clutch size, and hatchling success were not affected by a five-year drought; however, multiple droughts can have a cumulative effect. Habitat is the most important component to tortoise health. There is a low probability that Mycoplasma can be vertically transmitted; however the antibody is passed from mother to offspring. Preliminary studies support this, but more data are needed. Moreover, outbreaks followed the introduction of animals into research groups, but individuals not introduced into groups did not show signs, suggesting that social stress can cause clinical signs.
Stress, density, and nutrition affect wild populations with varying levels of ELISA positive (possibly different strains with different virulence). This may lead to an outbreak or not, with clinical (no reproduction) and subclincal (reproduction recovers) phases. It is important to determine the causes of outbreaks and to look further at the interaction between drought and disease.
The discussion on disease pointed towards not ranking threats, but focusing on cumulative and interactive effects. Perhaps disease has always existed, however, it may be important to show that, possibly as a result of other threats, disease has become a problem. Long-term monitoring is necessary to answer some specific questions, determine specific management actions, and monitor their effectiveness.

DTRPAC Report page 196
A veterinary epidemiologist gave perspectives on tortoise disease from the epidemiologist’s point of view:
Determine the relevance of the questions concerning disease to the survival of the desert tortoise over the long term.
Place equivalent effort into answering what are the factors contributing to the decline in tortoise numbers.
There are challenges due to the nature of the host and the pathogen in this case o Widely spread host, which makes it difficult to get epidemiological data o Ranking causes of death
Ask how will the disease affect low density, long-lived species? Determine how Mycoplasma behaves in a population of desert tortoise Be wary of modeling too quickly with too little information, and be sure to use post hoc
evaluation of models; possibly use modeling to assess knowledge base. Pick representatives sites as examples, and design studies that collaborates between those
studying individuals and epidemiology
The following are possible changes in prescriptions for research that were not made in the original recovery plan:
The USFWS should be proactive in providing leadership using multi-disciplinary/multi-year efforts. Long-term research agendas and improve implementation are needed.
Use the study of healthy tortoises as a control to determine what is abnormal may have value, but killing healthy animals should be kept at a minimum.
The following are possible changes in prescriptions for management actions that were not made in the original recovery plan:
There should be a slight rearrangement in organization of the approach towards disease, and threats in general. No longer a list of threats but an integrated approach (totality).
There are currently no standards for determining if a population is healthy or not and whether individuals were stressed or not. Is it possible to develop them?
o Rapid response protocols o Integrating management and research; use a global perspective o Monitor health of populations in all DWMAs
Briefing on the Disease Workshop
Highlights were given from November 2002 workshop on desert tortoise health and disease. The disease workshop report will include lists of what we know, what we don’t know, and what we suspect for topics including, health, nutrition, general, URTD, and herpes. The report also includes research priorities and management actions. The document still needs several iterations, including addition of citations under the “what we know” section.
Determination of writing assignments
A discussion of DPS units continued from previous discussions in the prior meeting. A map showing four genetic units was discussed. Further ecological evidence is needed for dividing West Mojave from Colorado.

DTRPAC Report page 197
Presentation on desert tortoise threats, Dr. Jill Heaton
The following five steps could be used begin to address threats and to set the stage for the complexity of threat interactions:
1. Identify a list threats (* already complete) 2. Visualize complexity of threats (GIS, etc) (**critical) 3. Develop ways to describe and characterize threats and threat interactions (possible
research priorities for long-term monitoring) 4. Methods for prediction of threat spatial interactions 5. Application of methods for description and prediction of past present future threats
The potential starting point to handle the issue of description and characterization of threats (monitoring, mitigating) could be the questionnaire used to evaluate recovery plans (Ecological Applications on Recovery plans). The questionnaire would need to modify not to single out individual threats. There are serious difficulties with this approach due to questionnaire design. In addition, it will be difficult to obtain quantitative data from the questionnaire. This questionnaire is already approved from USFWS and can be used as a framework to characterize threats and differences in threats based on ages, but we are cautious about this approach.
Dr. Heaton developed GIS maps for threats and recovery actions recommended for each DWMA in the 1994 Recovery Plan. The maps show where recovery actions are being implemented, were partially implemented or have not been implemented. The data sources were the “Summary of Desert Tortoise Recovery Actions” for each recovery unit. The documents describe agency management actions occurring since the 1994 Recovery Plan recommendations. These documents were a good starting point; however, there are many more management actions, which were not discussed. The maps, which highlight DWMA and recovery units, could be sent to agencies to address inconsistencies between implementation and recommendations.
Within California unit there are different management units (planning areas), which implement actions in different ways and each unit has different strengths and weaknesses. Future maps could separate out management units. There was a discussion of grazing allotments and the difficult political climate in CA. There is only one grazing allotment (Gene Dry Lake) in NV which is not in a DWMA. The discussion pointed out inconsistencies between map data and actual management practices. There are similar problems with feral equids data. There was a recommendation made develop a different questionnaire and to break up maps by planning area, agency, and geographic locations.
There appears to be discrepancies between the Recovery Plan and the DWMA documents. The monitoring health of populations may have only been suggested for Fenner Valley. There will be a check to determine if this was recommended or if there are discrepancies.
Maps showing tortoise habitat voids (>5,000 ft elevation and dry lake beds) and road density in critical habitat were presented to the group. A suggestion was made to weigh by road usage. An adjacent map showing road density in areas surrounding critical habitat will be helpful.
A data sources inventory (determine data sources) and assessment (geographic area and specifics) will be necessary to visualize the complexity of threats, particularly in the Western Mojave. Data sources are listed below.

DTRPAC Report page 198
Air quality - types of available data from AQ monitoring stations (arsenic, barium, copper, lead, SO2, CO2 counts for 2000)
Mining – all mines, not just those currently in use. Further assessment needed (potential sources of toxicants and dust)
Urban areas Toxic release sites Roads Railroads OHV/DOD areas Landfills and disposal sites USGS dust traps CA cattle grazing
It is possible to layer threats and determine the number of threats (perturbations) per pixel. This has been done previously for sage grouse. In addition, layers showing tortoise distribution and density estimates would be useful. This would lead to the possibility of making flow charts, showing changes over time.
ACTION: Dr. Delehanty will try and track down the literature related to layering threats for the sage grouse.
It was noted that there might be a danger in illustrating the high number of threats to tortoises. When large sacrifices produce little noticeable improvements, its leads to feelings that eliminating one threat can’t make any difference. Some threats are more easily eliminated than others, despite the smaller benefit to tortoises. Threats are not just scientific but also political and social. By targeting particular demographic groups with working towards elimination of particular threats (i.e. dogs in urban areas, target folks in urban areas), tackling threats may be more manageable. Presenting information on threats (flow charts) in a visual way will be very helpful. The group came to consensus that excluding use of habitat will make the most difference for tortoise populations and that the elimination of many threats as best possible is more important than eliminating one threat completely.
In addition to a source of threats data inventory, specific data are needed for modeling efforts.
Weather stations Dry lake beds Elevation Wind patterns Other important items: geomorphology, vegetation, etc.
Future work and data acquisition: Work is currently being done on developing fragmentation indices. Data are needed for grazing allotments and planning areas from NV.
ACTION: Dr. Heaton will work with Lewis Wallenmeyer (Clark County) to acquire necessary data from Nevada.
Dr. Heaton also gave a presentation on a decision support system for desert tortoise knowledge being developed at the University of Redlands. The goals of the project are to create system to track tortoise knowledge and a forum for scientific consensus building. This will be done using an integrated modeling tool known as an Ecosystem Management Decision Support (EMDS). This tool provides the ability to evaluate missing data, rank confidence in data sources, and bridge gaps in knowledge. Dr. Heaton explained how the knowledge base is constructed without using what

DTRPAC Report page 199
data is available. Data will then be linked to the different components. It is possible to have a map for each node in the knowledge base, which would show, for example, suitable vs. non-suitable habitat. The system can combines habitat and threats models. The stacking of threats interactively could be a way to visualize threat complexity.
The system allows evaluation based on criteria such as conservation priority, feasibility, habitat suitability, and management area condition. Users can perform sensitivity analyses and trade-off analyses, as well as, weight the importance of certain criteria. Development of this system will be an iterative process and must be adaptive. There was a suggestion that both population-based and individual-based models would be useful for different analyses. There was also a suggestion to make the process self-correcting, based on data already in the model. This would involve neural networking.
Responses to draft text and maps: Dr. Heaton would like reaction and direction on the threats section text. In addition, she would like to know if there are there other data sources to fill in the gaps to the data inventory. Dr. Heaton would like thoughts on threat prioritization (five-ten core threats, spatially associated with points on the ground) to perform overlay analysis. There was a suggestion to focus on threats that seem independent (i.e. fire, roads, water, human population density, exotics), but may be influencing each other and the final result.
Suggestions for the Threats Section included:
Provide a map showing a buffer around urban areas that shows less associated threats as you move farther from the center.
Give examples in report of the types of threats analysis and highlight what is missing to analyze fully the interaction/complexity of threats.
Give an example using a smaller geographic area, and provide a visual analysis of all threats.
Provide as much scientific analysis as possible. Hypothesize on the characterization of individual threats and the interactions among threats.
This will be the set up for future experimentation and monitoring to test hypotheses. Highlight issues of spatial and temporal importance
Determine writing assignments and an update
Information is accumulating concerning recommendations that the team will make for a revised recovery plan. There was a suggestion to arrange a framework for the end product and begin sending around iterations via email. The Distinct Population Segments (DPS) section is coming together well; however, the components that extend beyond genetics still needs to be fleshed out. A suggestion was made to propose a hypothesis for further dividing certain suggested DPS units based on ecological components, such as rainfall. By providing an hypothesis and listing pros and cons, this may prevent vital gaps from being lost in the future. Some ecological/behavioral differences may lead to divergence on different evolutionary tracts over time.
ACTION ITEMS:
1) UNR will make three separate databases containing the recovery actions in the DWMA document, Appendix F of the recovery plan, and pgs 45-60 of the recovery plan. Then make comparisons to determine if there are inconsistencies.

DTRPAC Report page 200
2) Roy Averill-Murray will review Dr. Heaton’s translation of the recovery action documents for each recovery unit into maps. (Using these categories: no implementation, partial implementation, ongoing implementation, no data)
3) For 20 recommended actions not answered in the “Summary of Recovery Actions” documents (listed below), Roy Averill-Murray and Phil Medica will determine if there is data concerning implementation and put together a database.
Distribution and density surveys Eliminate unauthorized bombings Health of populations - Law Enforcement Landfill Management Install RR culverts
Stop mining Evaluate Raven use Install Road Culverts Restore habitat Install Urban Barriers Monitor health of populations
Remove surface chemicals Establish visitor center Establish research natural area Install RR tortoise fencing
DWMA management area Administration Establish breeding programs Install aquaduct barrier
4) Dr. Heaton will continue writing the Threats section text and working on GIS maps. 5) Dr. Lovich will review Dr. Heaton’s Threats section. [Tracy will assume this responsibility] 6) Bridgette Hagerty and Ken Nussear will continue to work on population data and will send the
final products to Dr. Heaton. 7) Dr. Tracy will compose the first iteration of a framework for a final product and send this
around via email.
Preparation for July DTRPAC meeting
Summary size/age class and density data are accumulated for NV, AZ, UT, and CA pre-1991. There was discussion on collapsing from 7 size classes to 4 size classes. This will be done to allow comparison of all data; however, all uncollapsed data will also be archived. The question was raised, “Is there a null hypothesis for what a size/age class distribution should look like?” There is a size class distribution hypothesis in the 1994 recovery plan.
There are three levels of data to review for the July meetings: Capture/recapture data Density estimates (>180 and all) Size class distribution – tortoises observed (presented in histograms)
Meeting participants: C. Richard Tracy, UNR Ken Nussear, UNR Jill Heaton, U. Redlands Earl McCoy, USF David Morafka, Cal. Academy of Sciences David Delehanty, ISU Phil Medica, USFWS
Roy Averill-Murray, AFG Mary Brown, UF Elliott Jacobson, UF David Thawley, UNR David Rostal, GSU Lewis Wallenmeyer, Clark County, NV Bridgette Hagerty, UNR
DTRPAC Report page 201
Desert Tortoise Recovery Plan Assessment Committee MeetingJuly 31 – August 1, 2003 North Tahoe Conference Center Kings Beach, CA
Announcements: The West Mojave Plan is currently out for review. Comments are welcome and are due by September 18th. There is also a contract out for a pathologist, as an outcome of the disease workshop.
Presentations on tortoise population status in CA, NV, UT, and AZ
Arizona and Utah data – Roy Averill-Murray, AFGD Ann McLuckie presented size class data from Arizona and Utah plots. Lincoln Peterson
density estimates were presented, where available. All plots are 1 sq.mile in area and are surveyed for an effort of 60 person days, in two successive 30-day sweeps. During the first 30-day sweep, tortoises are marked, and tortoises are recaptured during the second. In some cases, more than one person worked a particular plot, thus lowering the amount of days necessary to complete 60 person days worth of effort. Consistently, there were 45 days where one person work alone surveying a plot. There may have been a 15-day period where a second person is working. The 60-person day effort was held constant.
The graphs provided showed the number of live animals captured on each plot per year. Where data on sex were not given or if tortoises were not sexed due to lack of reliability, tortoise numbers were split in half for this exercise. Murray also provided data on the percent dead at each plot. Percent dead was number of carcasses removed from the plot divided by the number of live tortoises found plus the number dead. Tortoise carcasses are being removed during every survey year. In AZ, all plots will show survey technique improvements in mid-90s, thus improving the number of tortoises found.
Notes associated with general plot data: There is an assumption that the number of tortoises entering the plot is equal to the number
leaving the plot. In addition, there is a higher likelihood that tortoises around the periphery will move off the plot than those in the center. Tortoises appear to have anchored home ranges, so large moves seem unlikely.
Juveniles and subadults in the West Mojave show great deal of movement prior to reproduction (Boarman and Morafka, pers. comm.).
If there have been changes in impacts (management, recreation, etc.) over time, they are important to note for all plots.
Occasionally desert tortoises have been known to die in burrows. There was a suggestion to provide a rangewide estimate of growth rate, which would then
be broken down by areas of the Mojave. The dead counts and the size class of dead tortoises may vary in reliability depending on
the experience of the crew. Preservation of the carcass, shell, scutes, etc. depends heavily on how the tortoise died and where the carcass is left (in moist vegetation or not). (Berry, pers comm.).
It is important to remember that some plots may be sinks while others are sources. Thus, one cannot assume every plot should expect good numbers of tortoises.
In the future, it would be helpful to include plot workers in data spreadsheets.

DTRPAC Report page 202
Beaver Dam Slope (BDS) Exclosure (AZ): The BDS Exclosure plot is less than 1 sq. mile, closer to 500 acres, and is located on the AZ/UT border. Caliche caves are found throughout this plot, which may reduce the ability to detect tortoises. This site was surveyed in 1989, 1996, and 2001. This site is scheduled to be surveyed in 2005, however, the survey could be done in spring 2004, funding permitting.
Littlefield (AZ): This plot was surveyed in 1987, 1993, 1998, and 2002.
Pakoon Basin (AZ): This plot is located south of the Virgin Mountains, and was only surveyed in 1991.
Virgin Slope (AZ): This plot was surveyed in 1992, 1997, and 2003.
Summary of Arizona data: Plot data from Arizona suggests that there is enough evidence to be concerned about tortoise populations, however, there is no conclusive evidence of decline. More data are necessary.
Beaver Dam Slope (UT). The BDS site was surveyed once in 1991.
City Creek (UT): This plot was surveyed in 1988 and 1994. Line distance sampling has been the method used more recently in this area, and has shown constant density estimates.
Woodbury – Hardy (UT): This plot was surveyed in 1981, 1986, 1992, and 1998. This plot is located in the northern edge of the tortoises range. A male biased sex ratio may be the result of pre-breeding dispersal movement in males.
Nevada data – Phil Medica, USFWS
Phil Medica presented size class data from Nevada plots. Lincoln Peterson density estimates were presented, where available. Data for dead tortoise counts were not included in the presentation. All plots were surveyed with 60-day person effort. Most of the surveys were done with two people for a 15-day capture period and a 15-day recapture period. All surveys occurred between early April and May. Where appropriate, tortoise density estimates were provided. After 1995, there were no plots sampled in Nevada, except at Lake Mead.
Christmas Tree Pass (NV): This plot was surveyed in 1985, 1991, and 1994. The plot is located between a highway and a power line with a moderate level of disturbance. Population estimates at this plot are fairly stable for the years surveyed.
Piute Valley (NV): This plot was surveyed in 1979, 1983, 1989, and 1994. In 1987 there were problems with the survey. The entire plot was not worked, the time of year was incorrect, and there were problems with data collection. For these reasons the 1987 data set was not used. Confidence limits for population estimates for years surveyed overlap, suggesting that the population has not decreased significantly.
Coyote Springs (NV): This plot approaches the northern edge of the desert tortoises range, located in Lincoln County. The plot was surveyed in 1986, 1992, and 1995.

DTRPAC Report page 203
Sand Hollow (NV): This plot is the most northern plot in the NV tortoise’s range, located in Lincoln county. The plot does not contain good tortoise habitat for burrow construction. The site is east of highway 93 and west of I-15. No density estimates were provided due to low tortoise counts.
Mormon Mesa (NV): This plot contains a caliche underpan and is located 4 miles west of I-15. The plot was surveyed in 1989 and 1994, and data show no significant differences in density estimates.
Gold Butte (NV): This plot is located in a remote area, southeast of Mesquite near the Lake Mead National Recreation Area. This plot was surveyed in 1986, 1990, and 1994. Density estimates for this plot were stable.
Trout Canyon (NV): This plot is located west of Las Vegas and is three miles north of a new highway. The plot was surveyed in 1987 and 1992.
Sheep Mountain (NV): This plot is located south of Las Vegas and east of I-15. The plot was surveyed in 1979, 1984, 1992, and 1995.
Last Chance (NV): This plot was surveyed once in 1980.
Lake Mead National Recreation Area (NRA): Two plots (Grapevine and Cottonwood) were surveyed extensively in this area. Several plots were sampled sparsely since 1995.
Grapevine Canyon (NV): This plot was surveyed for population estimate data from 1992-1995. These data are useful for making year-to-year comparisons. After these surveys were done, animals were fitted with transmitters and followed to determine survivorship. The plots were not systematically sampled. The data from this study were published in the June or July issue of the Journal of Herpetology. This plot is located northwest of Laughlin, Nevada and is not comparable to other plots.
Cottonwood (NV): This plot was sampled similarly to Grapevine from 1992 to 1994 for population estimates.
River Mountain (NV): This plot was sampled from 1995 – 2002.
Summary of Nevada data: Until 1994 there was no statistical variation from survey year to survey year, although mortality was observed. Populations in Nevada plots appear to be stable. Although there is not enough data to warrant concern, follow up data for plots in recent years would be valuable.
California data – Dr. Kristin Berry, USGS
Dr. Berry initially presented preliminary results from a tortoise color study that may affect DTRPAC’s discussion of distinct population segments. Since 1992, color data for shells and limbs were taken, using the Munsell soil color chart. Initial results show statistically significant differences among all age classes and among larger tortoises from different regions. Juveniles also show statistical differences between West and East Mojave. Regional color differences seem to reflect original recovery units. In addition, soil color is always lighter than tortoises, and juveniles appear to have more variety than adults. There is a possibility that color differences have a genetic component if the influence of diet, etc. is eliminated.

DTRPAC Report page 204
Status and trends in CA
Dr. Berry provided some history on the choice of long-term permanent plots. In the early 1970s, plots with tortoise counts that too low to perform demography/trends studies were eliminated. Study sites were chosen after mountainous areas, pinyon/juniper areas, and other poor desert habitat were eliminated. Sites were chosen in all valleys in California that contained tortoise habitat. The plots were located in critical habitat and represent five of the six recovery units. These plots were not only used for demography data collection, but also for tortoise health profiles. All data shown were from 60-day effort surveys per 1 sq. mile during which time population data was collected. All shell and skeletal remains were collected for analysis including time since death, size, sex, relative age, and cause of death. In addition, scat from predators was analyzed. Changes in disturbance, such as increases in use, in plots were also assessed. In addition to demography surveys and health profiles, necropsies of ill, dying, recently dead tortoises were conducted and NOAA precipitation data were analyzed to determine if there is a relationship between drought conditions and die offs.
West Mojave
Fremont Valley (CA): This plot was surveyed in 1981, 1987, 1991 and 2001. Major threats near this plot include domestic dogs, recreational vehicles, a major road, ravens, and invasive species.
Desert Tortoise Natural Area (DTNA) Interior (CA): This plot was sampled in 1979, 1982, 1988, 1992, 1996, and 2002. The plot has an increase in shrub cover and less evidence of invasive species; however, outside degradation has increased.
DTNA Interpretive Center (CA): This site was surveyed in 1979, 1985, 1989, 1993, 1997, and 2002. This site has shown an increase in development that is evident throughout California. Tortoises at this plot have elevated levels of mercury in their livers (Jacobson et al 1991).
Kramer Hills (CA): This plot was surveyed in 1980, 1982, 1987, 1991, and 1995.
Summary of West Mojave region: With the exception of Kramer Hills, all plots in the West Mojave show a terrific downward trend.
Southern Mojave
Stoddard Valley (CA): This plot was sampled in 1981, 1987, and 1991; however, there was doubt raised that the data is reliable.
Lucern Valley (CA): This plot was surveyed in 1980, 1986, 1990, and 1994.
Johnson Valley (CA): This plot was surveyed in 1980, 1986, 1990, and 1994.
Northeast and East Mojave region
Shadow Valley (CA): This is a remotely located plot that is cattle grazing intensive. This plot was surveyed in 1978, 1988, 1992, and 2002.
Ivanpah Valley (CA): This plot is located in the Mojave National Preserve. This plot was surveyed in 1979, 1986, 1990, 1994, and 2002.

DTRPAC Report page 205
Goffs (CA): This plot is located in the Mojave National Preserve; however, there is still evidence of cattle grazing. The plot was surveyed in 1980, 1983, 1984, 1985, 1986, 1990, 1994, and 2000. Data from the 2000 survey are located in a published report. Management issues at Goffs include, road kills, the addition of more railroad tracks, disease, and invasive plant species such as the Moroccan Mustard.
Summary of the Northeast and East Mojave region: All plots in this region show a recent downward trajectory.
North Colorado
Ward Valley (CA): This plot is long and narrow and located along an elevation gradient. It was surveyed in 1980, 1987, 1991, 1995, and 2002.
Chemehuevi Valley (CA): This is a 1.8 sq. mile plot that was surveyed in 1979, 1982, 1988, 1992, and 1999. Crude assignments of causes of death were given to shell and skeletal remains. Causes were mammalian predation (high number of coyotes), combination vehicle/mammalian predation, vehicles, avian predation, disease, and unknown. A high number of deaths were associated with roads. An estimation of Brassica tournefortii density suggests that higher densities are located near edge of road, but the species had penetrated to at least 1 mile into the plot.
Eastern Colorado Desert
Chuckwalla Bench (CA): This plot was surveyed in 1979, 1982, 1988, 1990, 1992, and 1996. Initially, this plot had the largest reported density of tortoises (225 torts/km) of all CA plots surveyed. Density estimates were published in the New York Turtle and Tortoise Society Proceedings.
Summary on the North and East Colorado Desert: These plots generally showed downward trends.
Summary on CA threats: Direct sources of tortoise mortality are raven predation, vandalism, poaching, road deaths, and canine predation. Examples of these sources of mortality occur at Lucerne Valley, DTNA, Fremont Valley, and Goffs. Indirect sources of tortoise mortality include habitat fragmentation, unauthorized ORV use, increased human access, and invasive plants. Most importantly, current inability to measure cumulative impacts to desert habitat is a serious threat.
Comments on CA presentation: A discussion about the differences and similarities between Piute Valley (NV) and Chemehuevi (CA) followed the presentation on California data. Difference in nutrition available at sites, as well as, between year variations may cause differences in rebounding from a large die off. A question was raised that if there is a healthy source population, can a tortoise population that experiences at die off, rebound more quickly?
Currently, there is a working hypothesis that ground disturbance (e.g. road construction) is causing free-floating toxicants to be blown onto plants, etc. This is one mechanism for finding high concentrations of toxicants in tortoises.

DTRPAC Report page 206
The DTRPAC will recognize that CA post-1996 data exists, and will continue with work with sources on how to characterize this information. New data can be handled by using dialogue and annotation so that the team can provide recommendations.
Friday, August 1
A comment was made that although plot information is critical to analysis, it is difficult to use a single plot to make inferences about an entire DPS unit. Scrutiny of individual plot information is important to determine how useful it will be to make inferences. The following question was posed, “How should plot information be combined to do statistical analysis of trends in each DPS?” A suggestion was made to use regression analysis to look at all plots in a particular area over time and in order to make an inference about each DPS unit.
There was further discussion on how to use information on possible declines in the Eastern Mojave in order to make recommendations in the report. A suggestion was made to use Goffs (CA) and Piute (NV) as an example to describe the volatility of the data and explain reservations on what plot data suggest.
Reservations were expressed about reporting numeric declines in any area using only density estimates from all size classes combined. Discussion of what is occurring in each large scale DPA area is critically important to make recommendations. A suggestion was made to use the following verbage: with available data there is no downward trend, however, a scientist gave the opinion that there are samples showing lower numbers in certain plots which raises concern.
In order to clearly determine trends, there needs to be a change in infrastructure. Data collection should be programmatic. There is current difficulty with the disjointed nature of scientific data collection under USFWS permitting.
Several suggestions were made on how to discuss the topic status in the final DTRPAC report, and in what units should be used. Suggestions are listed below:
Use original recovery units. Use preliminary DPS designations. Use data with all possible hypotheses for different DPS units Revisit concepts of DPS units in light of status data presented earlier.
Update on previous writing assignments
Dr. Morafka gave an update on the Distinct Population Segments (DPS) section. To designate a DPS, evidence must be given to show distinctness, ecological and behavioral significance, and conservation status. Evidence for distinctness should be recognized as the prerequisite. In addition, these designations will be used sparingly, as stated by Congress. The USFWS definition is less strict than those in current schools of scientific thought. Genetic evidence should be used as an eyewitness. However, if genetic evidence is not clear, morphology can be used as a possible clue that genetic differences may be present. Health status (disease) may also be used as a lower tier criterion to make a population distinct. Therefore, threats can be used to designate management areas, and may result in better management recommendations, and thus recovery of the species.
The second criterion is significance, both ecological and behavioral, which also has two tiers. First, different life history strategies may suggest that two populations may be on two different

DTRPAC Report page 207
evolutionary trajectories. Demographics beyond life history strategies, such as responses to disease, weather, and environmental factors that over time may affect life histories, can be used.
The third criterion is conservation status. This should be used a justification in addition to significance. A population may be considered significant to the conservation of a species if an international boundary is crossed, if there is threat of disease, or if a population sustains gene flow by serving as a bridge between other DPS units.
Britten et al. (1997) does not provide definitive evidence to designate DPS units, however, their data is the best available and therefore, can be used as a justification for a recommendation for DPS units. Using Britten et al. data, Nevada would be divided into two units (North of Las Vegas and South of Las Vegas). Therefore, 4 DPS units are designated as a genetic starting point (Upper Virgin, North Las Vegas, South Las Vegas, and Western Mojave).
A suggestion was made to make further divisions using hierarchical justifications. For example, differences in pre-adult predation or differences in summer flora (Western Mojave) may qualify as justification. In addition, different management needs in the far West Mojave, if they can be related to tortoise biology, could also be used as justification.
Although there is no genetic evidence to separate the far West Mojave from the Colorado and Eastern Mojave, shape coupled with a progenetic or habitat component, or reproductive differences may send a population off on another evolutionary trajectory.
The following status models were suggested to perform statistical analysis on plot data: Original recovery units Genetic DPS Third alternative that takes into account all possibilities, resulting in five units: East Las
Vegas, West Las Vegas, Upper Virgin, East Mojave - Colorado, West Mojave
Description of statistical analysis: Used normalized data using highest value recorded and strike plot variable. Run scale to see blanks (gaps in data)
How can line distance sampling data be used to determine status? Presence/absence Show the drawbacks of plots to pinpoint trends Support or not for trends in plots
o If plots do not show full range of variability, then line distance can point out if plots are in poor tortoise populations to use as representative areas.
Density dependent effects o Grid analysis (1 sq. mi for example) o First tally each grid unit; then randomly grab units.
Compare plots that were dropped in the early 70s using current LDS data. To determine if LDS data provide further information on status, a regression analysis will
be performed on LDS density estimates after G0 data is added to 2003.
Summary of Line Distance Sampling Phil Medica presented a summary on line distance sampling (LDS) for 2001 – 2003. Transects were 400 m on a side and in the shape of a bow tie or figure 8. Random point criteria were used once the following criteria were used. Transects included critical habitat, < 1250 m elevation, < 30% slope, and excluded private land and non-habitat areas (e.g. playas). Density estimates using LSD appear

DTRPAC Report page 208
to underestimate tortoise density compared to plot density estimates. A suggestion was made to attempt to increase the area that could be sampled by increasing slope. Poor resolution of data available may give an inaccurate slope calculation. Possible area able to be sampled decreased mainly by changing to bowtie shape transects that could not overlap.
Total corrected sign (TSC) data: Further discussion of TCS data will occur at the DTRPAC meeting that covers monitoring.
Threats in relation to population status
There was a discussion concerning the relation of threats in relation to downward trends. Is the occurrence of threats and population declines synchronous? Or are differences in management also responsible? Many threats have a temporal component that must be included in the analysis. In the West Mojave, where there have been precipitous declines, there are no unique threats, except perhaps poaching for food. However, there are increased threats of raven predation, human predation, habitat fragmentation, canine predation, releasing of sick pets, air pollution, and ground disturbing activities (roads, tanks, more legal and illegal OHV, open areas). Dr. Heaton brought forth data sets that may show some of these threats numerically. A suggestion was made to compare threats in areas where populations that are stable to those in declining areas. There are available data that would be useful for region wide comparisons.
Determine writing assignments and action items
ACTION: Dr. Boarman will provide a set of demography data for a highway 158 plot in the West Mojave to Dr. Heaton and Ken Nussear. ACTION: Ken Nussear will run statistical analysis of plot data using different DPS models. ACTION: Dave Delehanty will perform a regression analysis on LDS density estimates after G0
data is added to 2003 data. ACTION: Rich Inman will deliver G0 data for 2003. ACTION: Dr. Boarman will send around draft writing on total corrected sign data for review. ACTION: Dr. Heaton will produce a map with long-term plots and then with random plots to determine if long-term plots are representative of a region. ACTION: Dr. Heaton and Dr. Boarman will produce a threats index ACTION: Dr. Heaton and Phil Medica will provide references that give history of tortoise sampling methods.
Writing Assignments: Current draft of DPS section – Dr. Tracy will review the draft by Dr. Morafka and Dr.
McCoy Appreciation of Desert – Dr. Morafka is working on a draft of this section Introduction to the report: Dr. Tracy and Dr. Morafka will write a draft of this section Population Status Section: Dr. Tracy will write a draft of this section.
Preparation for September 4-5 DTRPAC meeting (MONITORING in the broad sense and Delisting Criteria)
Meeting schedule: o Delisting criteria will be introduced on the morning of Sept. 4 o Monitoring of threats and habitat will be discussed in the afternoon of Sept. 4
(Guests: Mary Cable, landscape level theoretician, Dr. White)

DTRPAC Report page 209
o Monitoring tortoise populations will be discussed in the morning of Sept. 5. (Speakers: Stephen Corn, Dr. Tracy, Dr. Boarman)
o Return to delisting criteria in the afternoon of Sept. 5 o The DPS discussion will be revisited to incorporate new analyses.
To be discussed at the September meeting: o Efficacy of current methods for monitoring tortoises o Are plots valuable indicators? o How to evaluate trends in reference to the animals (relative vs. absolute)
Focused list of questions to pose to guests (not in any particular order) o Preamble: To instill a complete monitoring scheme, there are several components: 1)
monitoring for focal animal, either true density estimate or indicators of trends, 2) monitoring of habitat, and 3) monitoring of threats (improving or worsening).
o How is it possible to know if we are satisfying the given delisting criteria? o What other delisting criteria could work instead of 25-year upward or stable trend? o What are cost effective mechanisms that people are using to monitor vast expanses of
habitat? o What are the different types of approaches to monitor habitat? Please provide a cost-
benefit analysis as well as the need for technical know-how? Are experts required for particular approaches?
o What features of the environment should be monitored? (i.e What variables can feasibly be looked at over time?)
o If you were hired as an outside consultant, and you were asked to design a scheme to determine if habitat has changed over time, what would you do?
o How can statistical power issues be dealt with? How can habitat be measured with enough power to perform an analysis?
o If a certain amount of habitat is being converted for use, how can that be measured? Remaining habitat may or may not be good tortoise habitat. How can you distinguish between the two?
o What needs to be known about tortoise biology to design habitat monitoring? (i.e. movement, life history strategies etc.)
o Is it feasible to track individual threats as well as measure cumulative threats? How can you recognize a threat?
Invitations for speakers (two days): o Steve Corn: Line distance sampling o Mary Cable: change detection from remote sensing o Outside evaluation (non-tortoise) – possibly Gary White or Jim Sedinger o Protocols for threats and habitat monitoring (in a general sense - theoretical) - Chuck
Peterson (Idaho State) o Threats monitoring - Fran James or Michael Reed
Meeting participants:
C. Richard Tracy, UNR Bridgette Hagerty, UNR Earl McCoy, USF David Morafka, Cal Academy Phil Medica, USFWS Roy Averill-Murray, AFG Bob Williams, USFWS Kristin Berry, USGS Becky Jones, CFG
Karen Phillips, USGS John Hamill, DOI Clarence Everly, DOD Bill Boarman, USGS Dave Delehanty, UI Ken Nussear, UNR Jill Heaton, U. Redlands Rich Inman, Redlands Lewis Wallenmeyer, Clark County

DTRPAC Report page 210
Desert Tortoise Recovery Plan Assessment Committee MeetingSeptember 4 - 5, 2003 Casa Munras Garden Hotel Monterey, CA
Announcements: The Management Oversight Group is having a meeting on Wednesday, September 24 (10am – 3pm) at the Sun Coast in Las Vegas, NV to receive an update on DTRPAC progress.
Presentation on Multi-dimensional monitoring of desert tortoise: what are the goals and problems associated with monitoring?
Dr. Tracy presented information on the current status of multi-dimensional monitoring for the desert tortoise. The keystone delisting criterion is to demonstrate a statistically significant upward trend in the size of desert tortoise Mojave population over a period of 25 years. This criterion was used instead of a more common criterion specifying a target population size for delisting (At the time when the desert tortoise was listed by USFWS, there was a downward trend in population size). The other four delisting criteria for desert tortoise relate to conservation initiatives after an upward trend has been demonstrated.
Modern monitoring requires documenting changes in three elements: 1) size of populations (including density and aerial extent of population), 2) habitat of the species, and 3) threats to the population. In addition, some monitoring should be hypothesis-based. For example, hypothesis-based monitoring could be used to determine the effects of management actions such as highway fencing or removing grazing. Using presence/absence data, we could identify areas which could be targeted for repatriation experiments or other research needed for assessing the efficacy of management.
Using the data from transects conducted for distance sampling, a Kernel analysis was performed to predict the presence and absence of live animals and carcasses within DWMAs and recovery units. In some areas that were formerly in the range of desert tortoise, there appears to be no discernable populations. For example, the Desert Tortoise Natural Area (DTNA) has become a fragment of habitat that no longer appears to represent adequate tortoise habitat. The same result obtains in Eldorado Valley of Nevada.
Monitoring trends
With little variation in data, statistically determining population growth is a simple task. However, variance in population density estimates for desert tortoise makes determining a trend very difficult (or impossible). Life history characters make seeing trends difficult over a short time. This type of problem has been previously demonstrated for bald eagle populations.
Sites for permanent monitoring plots were initiated to study the biology of individual tortoises including population ecology questions. When the 1994 recovery plan was written, there were population declines in the Western Mojave. This downward trend still continues. There is now a new concern for populations in the East Mojave, particularly due to a single data point at the Goffs site. This concern has highlighted the need for more data. In these areas, tortoises appear to be affected by various combinations of cumulative threats, not one particular threat.

DTRPAC Report page 211
There are many problems with using permanent plots to determine population trends: Plots cover a small percentage of tortoise habitat, though plots are separated far enough that
tortoises from one plot cannot move to another. Plots are not randomly placed in critical habitat. Replication of plots within years in inadequate for comparison. Sample sizes of census years are largely inadequate to yield enough statistical power to
perform a regression of trends in any particular plot. Several plots were abandoned early in the process because they had low tortoise counts. Data from plots violate assumptions in mark-recapture techniques and detectability of
tortoises was not evaluated as part of the analyses.
Transect Methods for Density Estimates
During a 1995 workshop on tortoise monitoring in Reno, tortoise biologists, statisticians, and monitoring experts reviewed previous methods used to monitor tortoise populations and possible methods to use in the future. From this workshop, a decision was made to use distance sampling techniques to monitor tortoise populations, although the efficacy of the technique for the species was debated. Distance sampling requires measuring the distance perpendicular to a transect to each tortoise in order to calculate the detectability of animals.
Typical density calculations are multiplied by two factors, Pa and G0. Pa is the probability that tortoises can be seen by the person walking a transect (detectability). G0 is the probability that tortoises are active and able to be sampled (either on the ground surface or visible in a burrow). Tortoises that are located farther from the transect line are more difficult to see. All data are normalized under the assumption that all tortoises on the transect line are seen. The rule of thumb used is that a sample size of 60 tortoises is large enough to estimate detectability. In better years, a person must walk more than 400 km to see 60 tortoises. More than 1 field crew contributes to the transect data from each site, as a result of the long distances necessary to find 60 tortoises. In some circumstances (temporally or spatially), distances exceeding 1000 km are necessary to find 60 tortoises.
More recently, measurements of each team’s ability to detect tortoises have allowed us to enumerate the role of the team for Pa. Two sizes of styrofoam tortoises used to train crews. Each tortoise is numbered and the distance to each tortoise found is measured. Currently, only one density of tortoises (410 tortoises per 1 km2) is used. These tests have shown that distance sampling is inaccurate because crews appear unable to see tortoises on the line. This violates a critical assumption of distance sampling as a method. Furthermore, data from different crews are fused together to produce transects producing 60 tortoises. The detectability estimate resulting from those data are irretrievably incorrect as they bias Pa to the better crews in ways that cannot be corrected.
G0 changes among sites, during the day, throughout the season, and among years. However, data from the entire range are currently lumped to calculate a single G0 to estimate densities of tortoises for the entire range. G0 is calculated using a number of focal tortoises that are monitored to find the amount of time they are active. Another possible source of error is that tortoises that can be seen in their burrow are counted the same as tortoises found walking in the open to make one G0 estimate.
Power analysis of distance sampling
A power analysis was performed to detect trends in population size as a function of annual percent population growth rate. For a gentle growth rate, the coefficient of variation would have to be much

DTRPAC Report page 212
lower to detect a trend statistically. A reasonable optimistic population growth rate for tortoises would be 3/10 % growth per year. Currently, those working on distance sampling are trying to reduce variance in Pa and G0, but it may be impossible to reduce variance enough to be able to detect an upward trend. It was noted that no time lag due to age structure was included in the analysis, which may make detection even more difficult. Therefore, transect methods require modifications to increase precision of population estimates to the point where they can be useful for analyses needed for delisting.
With knowledge of what is being done to monitor tortoise populations, there was a suggestion for multi-dimensional monitoring program. This would include monitoring the efficacy of our management actions, changes in habitat, and changes in threats with time, in addition to estimating tortoise density adequately.
Further discussion of distance sampling
Steve Corn (USGS) presented additional information on the distance sampling (DS) method currently being used to estimate tortoise densities. Methods for distance sampling are as follows: A pair of field workers (leader and follower) make three passes over 100m segments. The first observer makes a first pass holding a measuring tape. Then, a second observer follows behind along the centerline. A third pass involves the observers moving in a zigzag pattern.
In 2003, the goal for DS was to walk 4 km per day along transects that bent back upon themselves in a bow tie configuration, and do this in 3-5 hrs. Using the composite detection function from Program Distance produced comparable results among years. Transect criteria changed between 2001 and 2002. The buffers used were different and the bow-tie configuration vs. straight line transects restricted number of areas available to be used as random samples. As a result, there was a lack of re-randomization among years because the probability of reselecting areas among years was much higher. The restrictions on randomly choosing a transect included: sites had to be below 4200 ft elevation, less than 30 % (2001) and 30 degree slope (2002), not on playas, not on private land, not on any roads in the GIS data set (buffered 25 m on either side), and in 2002 a 25 m buffer was placed on all criteria for exclusion. For 2004, no buffers will be used, dirt roads will not be excluded, and slope exclusions will be much steeper.
There was a suggestion that re-randomization is not always useful in reducing variation. One suggestion was to select random sites for sampling initially, and then continue to use the same sites annually. Another suggestion was to use a mixture of re-randomizing and revisiting sites to look at temporal differences. There was a discussion on the number of data points vs. the precision of data points and the resulting power to determine trends. A suggestion was made that there is the possibility of finding the optimal pooling. This would be a balance between the number of points to use, power of analysis, and variation in data. However, Nussear and Tracy reported that pooling invariably reduced power as the balance of reducing variance was offset by a reduction in degrees of freedom.
Although tortoise densities should be easy to calculate using DS methods because of the properties of tortoises (i.e., tortoises are diurnal, they are found in open habitat, and their activity is linked to drought severity index) it is not always the case that tortoises are easy to enumerate. Tortoise positions that are cited while sampling are burrow (visible), deep (not visible), open, under vegetation, hidden, tortoise in the open but near burrow. For each recovery unit focal animals (5-18) are repeatedly measured. The mean of observations during when observations are being taken is calculated.

DTRPAC Report page 213
Unfortunately, Program Distance currently only takes one G0 measurement, and this is a serious limitation. If a satisfactory model for G0 were developed, this would eliminate the need for focal animals and it would require different software. A suggestion was made to use a weighted or harmonic average if G0 estimates are lumped. Currently there is a developing effort to model G0 (by BRRC and U. of Redlands) and this may be more accurate than measuring focal animals.
A serious bias of inability to detect tortoises on the transect line does exist, but this failure can be estimated in relation to effort. One way would be to use the removal factor from the second observer as a correction factor. A suggestion was made to change the DS technique and remove the third pass from the methods. There would be one pass with a leader and a follower would provide data for a correction factor. By not doing the zigzag pass, burrow detection may be lost.
Someone suggested creating a combined estimator of G0. For example use burrow density, probability of burrow occupation, and tortoise sightings to model the probability of activity.
A suggestion was made that human behavior affects the detection rate of Styrofoam tortoises. Detection of styrotorts may be different from live tortoises because they are sedentary and may be camouflaged by differences in habitat.
A proposal was made that transects should be run a different way. In particular, a team would walk until a tortoise was found, and then a density estimate could be made for each transect using Pa from the training classes. Currently transects are a fixed length (whether tortoises found or not) and many transects produce no tortoises. Each transect would be done the same way so that variance would still exist, but not be ignored as is currently. This would be a logistical problem because sometimes great distances are required to find one tortoise.
A rebuttal to this proposal was that the focus was on bias, and to detect trend bias is not crucial. The suggestion was to use training as a covariate in analysis. Fuse data within teams and then adjust for team variation with each team Pa. If only 1 pass were done per transect, more transects could be done per team.
Long-term Study Plots
Argument for stopping the use permanent plots for population estimation: o Choice of plots was not hypothesis driven and not random. o There is a mixed bag for temporal spacing of plot sampling, and possibly not enough
sensitivity to detect changes
Argument to retain permanent plots to use for population estimation: o Long- term capture/recapture data from plots has the tremendous potential for looking
mechanisms of trends and asking size-class survivorship questions. o A suggestion was made for gridding plots and parsing out data from individual grids for
analysis. There would be more power to determine which threats are causing. The raw data would be necessary for this type of analysis
A time-trend analysis of plot data was done by Nussear to determine if plots show trends over time. Different DPS scenarios that have been discussed were used. After controlling for site and looking for a year affect, trends were only noticeable in the West Mojave using the current recovery unit scenario, the genetic hypothesis scenario, and the genetic and ecological scenarios.
Status of current monitoring for desert tortoises

DTRPAC Report page 214
Experiments to test pre and post management actions have not been done. There was an eight-year study on the effect of road management, which found that fencing did decrease the occurrence of tortoise road kill along highways. However, there are many actions, both active and non-intervention, that need to be assessed.
Some habitat and threats data are available to extend the scope of current analysis. Although temporal differences in vegetation data may cause trouble, those data are collected in the same year of tortoise data.
Advice and observations about population monitoring (density) from invited experts
• There is value in a top-down organization to monitoring to have a formalized process for data collection. Standardized data collection and data sharing allows collaboration so that meta-analyses can be done. All parties involved should have an agreement for data sharing/pooling. There should be external peer review by an independent panel of experts that is hired to analyze and error check data. This type of process is being used with the CA spotted owl.
• There is value in permanent study plots if you can use the data more fully. However this value is based on the availability of raw plot data.
• Without the ability to pool data from all areas, plot data are not useful. It is difficult to justify amount of money spent on data collection from plots without having open access to the full data set.
• There was a suggestion to force inter-agency coordination to acquire all necessary data for analyses.
• Work on modifications to DS to get most precise estimates possible. This includes using different detection rates and different groups of covariates in models of population density.
• Determine the maximum growth or decline potential for which there is enough power to detect the trend. Given the best of all worlds, is there power to detect a certain level of decline?
• Perhaps try the % area occupied method discussed in MacKenzie et al. 2002.
• Use a suite of methods to detect change at different scales.
• One possibility is to choose five or so key permanent plots to sample annually and abandon the sampling of all other plots.
• Assuming DS cannot be done well enough (lack of power) to track an increase, put effort into detecting decrease by tracking carcass and track die-offs for management purposes. The downside to this suggestion is that by the time a decline may be noticed, it may be too late.
Points on which there was consensus for population monitoring
o Continue to model and analyze what the maximum likely growth rate of the population is and that given the variance in data; there is enough power to detect it. The same applies to a downward trend. All possibilities have not been exhausted. There is need to determine how subtle of a decline can be distinguished past zero. In essence, what is the minimum target

DTRPAC Report page 215
resolution we think is important to aim for to achieve power? Based on natural variation, when should there be an alarm?
o If density cannot be measured, determine what methods can be used to detect an alternative measure, such as population contractions, food availability, or increasing or decreasing threats.
o Need a central repository for data and a formalized process for collaboration of data collection. This includes sharing costs among agencies, having a means to certify the efficacy of data, providing a means by which all can access data, and that there be a means by which USFWS can depend upon multiple approaches to data analysis so that they are always aware of the status and trends of tortoise populations.
Habitat monitoring
Remote sensing and the Desert Tortoise
Mary Cablk (DRI) presented information on using remote sensing to monitor changes in habitat and threats. Aerial photography, digital airborne data, and satellite data are all possible technologies to fill the remote sensing components of monitoring habitat. Mary described the data requirements necessary for remote sensing, as well as the necessary components for each type of technology. Mary emphasized the need for habitat monitoring experts to be working in the decision making process. The types of habitat features that could be measured using remote sensing include vegetation association, slope, elevation, micro-conditions, elevation limits, geomorphology, and urban/agricultural land. Once tortoise experts have determined the features that are important to measure, the features must be linked to data and the spatial, spectral, and temporal resolution should be determined. Using these steps, it would be more likely to capture what habitat really is and how to best measure it. Change detection and analysis would be used to determine seasonal or annual differences. Once habitat monitoring is established, links can be made between habitat and tortoise biology.
Habitat monitoring for Snake River Plain reptiles and Yellowstone Amphibians
Dr. Chuck Peterson presented new techniques in environmental mapping/modeling and habitat modeling/ mapping. If key features can be identified, there is a possibility to model habitat. To look at an environmental gradient, students in Dr. Peterson’s lab used important environmental characteristics (e.g. temperature and moisture) to examine an environmental gradient using probability monitoring logistic regression, or a combination of both.
Another possible method for modeling and mapping habitat is to examine changes and variation in the body condition of individuals. This could be a possible strategy for desert tortoise monitoring. Additionally, one can study the changes in occurrence, as well as temporal changes in spatial distribution.
A comprehensive monitoring program allows biologists and managers to understand the dynamics of a species fully. This type of program would include asking different questions on many different scales, including the level of individual using an index of condition and the populations level. Measuring the condition of individuals is not separate from monitoring population size. A condition index may provide evidence for mechanisms behind changes in population size. For example, a measure of condition could potentially link the risk of mortality to individual covariates. That risk
DTRPAC Report page 216
could help contrast between a stable and declining population. Using a more formalized monitoring structures allows some pressure to be taken off density monitoring (i.e. density measurements are not relied upon to answer all questions about a population). Each scale would have different objectives and a coordinated effort for addressing each. For example, following individuals (“sentinels”) could be used to determine extent of certain threats, but not to answer exhaustive questions.
Friday, September 5
Continued discussion on population status from the August DTRPAC meeting
Ken Nussear presented an analysis on population density using data from permanent study plots within habitat and in protected areas. There is a noticeable loss of tortoises within West Mojave. The aerial extent of habitat is changing as a result of a range wide loss of habitat. The DTRPAC is aiming towards a statement of concern over entire range, but heightened concern in West Mojave. This may lead to a change in listing from threatened to endangered in some areas due to dramatic density declines and loss of habitat. The recommendations still require additional steps, such as continued discussion of DPS designations.
Summary of monitoring discussion
With respect to density, there needs to be a more assertive attempt to develop a centralized program, which would include using an outside panel of analysts with expertise to determine how data should be collected and used. There was an explicit agreement that a density assessment is not useful if it is not a centralized program that provides USFWS with all the information needed to make informed decision. The program should be rigorous and formal, possibly having agencies contribute to one sum of money that would be distributed after there is consensus on monitoring, data standards, etc. Lack of coordination is currently a limiting factor; however, it will be difficult to have everyone agree if DPS designations are agreed upon. There was a suggestion to have communal funding be designated by DPS, but data collection be standardized.
ACTION ITEM: Ask Barry Noon for documentation on the structure of the California spotted owl data collection program and other collaborative efforts. This information will help the DTRPAC to make a recommendation based on the documented successes of another program. List successes of this type of collaborative program and how the success translated into the recovery of the species. Provide examples of benefits of the collaborative effort for the agencies, scientists, and species.
There has been a lack of implementation of the 1994 Recovery Plan and a collaborative program may remedy that problem. There was a suggestion that the DTRPAC’s goal should be an outline for an integrative, collaborative, rangewide program (i.e. comprehensive multi-scale approach to a monitoring program, including the aerial extent of population, density of populations within aerial extent, qualitative and quantitative gain/loss habitat, quantitative direction of threats, and a condition index of individuals as an indicator of the population).
Dr. Sedinger advised the team to refine distance sampling and continue collecting data using the same technique (e.g., other potentially important information could be taken as part of the protocols by technicians conducting distance sampling transects). Currently, observers are not monitoring rainfall, vegetation, etc. Habitat monitoring was not described in the 1994 Recovery Plan.

DTRPAC Report page 217
There was a suggestion for DTRPAC to assess current monitoring techniques, and make recommendations on how to improve current monitoring, including the use of new techniques and approaches as well as monitoring more different things.
A suggestion was made to regard density estimates as a “density indicator” instead of working to improve distance sampling to improve the accuracy density estimates which may have limitations. By calibrating technicians using styrotorts to calculate detectability, Pa could be modeled, and the focus could focus on improvements in monitoring.
There was a discussion on the potential goals of the multi-scale monitoring program. The following was a possible list of goals: o Monitor to accumulate indicators of ability to delist o Monitor to inform adaptive management (failure/success) o Monitor the success of management actions (i.e. hypothesis-based monitoring)
Approach monitoring in a hierarchical fashion
There was a question about the usefulness of developing a bodily condition index for individual desert tortoises. A condition index might help biologists to mechanism contributing to population dynamics. In snakes, there is a correlation for body condition and reproductive fitness.
ACTION ITEM: Bridgette Hagerty will work with Dr. Peterson to provide references on examples of measuring body condition.
What are the possible goals for monitoring?
6. To have viable wild populations distributed in each DPS (protect natural processes) and to preserve the diversity (genetic, ecological, behavioral, morphological) of the Mojave population
a. Are there enough tortoises necessary to be self-sustaining currently? b. Is 50% for 500 years the best way to reach this goal? Do we use the existing PVA or
make a more definitive statement? c. Increase tortoise populations in each DPS to reasonable levels to avoid an Allee effect.
Tortoise was listed because of downward trends due to threats, not as a result of low population numbers.
7. Determine why tortoise populations are threatened. a. Loss of quality and or quantity of habitat b. Direct threats creating mortality
8. Measure the success or failure of management actions
There was a discussion on no-net-loss or fragmentation of habitat. If you increase new breeding populations that are isolated, that is technically increasing fragmentation, though it can be perceived as a good thing. Would no net loss of individuals or habitat be enough in each DPS? Currently, this would not be considered enough to delist a DPS.
Is it necessary to generate a new hypothesis because the old delisting criteria are unable to be measured? The original prescription was to have a 1,000 square mile reserve protected and have at least 10 tortoises per square mile within that reserve. If populations dropped below these numbers, there was a dangerous probability of an Allee effect and a resulting extinction vortex.

DTRPAC Report page 218
Discussion of the original delisting criteria
The recovery objective is the recovery and delisting of Mojave population of desert tortoise. To consider the population recovered, all criteria must be met.
Criterion 1. As determined by a scientifically credible monitoring plan, the population within a recovery unit must exhibit a statistically significant upward trend or remain stationary for atleast 25 years (one desert tortoise generation).
Possible changes to this criterion
o The terminology remain stationary does not work well for most of the DPS. o The criterion needs refinement because wording only refers to population size and not to
habitat and threats. o Include (a) monitoring of habitat, (b) threats, (c) aerial extent
o Revise Appendix A o Consider multiple scales (population, landscape, individual content)
o Provide examples. These are the types of things to consider (e.g. body condition index)
o Presence/absence of individuals in critical habitat (ability to determine suitability of habitat; spatial framework)
o Define relationships between components o Include power and statistical analysis (evaluate the probability of both type 1 and
type 2 errors) o Include language such as a “High powered test that fails to detect decline, or a statistical
test that detects an increase.” In those areas having lower densities, it will be easier to see an increase statistically. Areas with very low densities will require intense management to increase population size and should produce a noticeable increase.
o Use experimental management to test management actions.
Criterion 2. Enough habitat must be protected within a recovery unit, or the habitat and the desert tortoise populations must be managed intensively enough, to ensure long-term population viability.
o Perhaps there are more ways to use available data.
Criterion 3. Provisions must be made for population management at each DWMA so thatpopulation lambdas are maintained at or above 1.0 into the future.
o Long-term population management is needed
Criterion 4. Regulatory mechanisms or land management commitments have been implemented that provide for adequate long-term protection of desert tortoises and their habitat
Criterion 5. The population in the recovery unit is unlikely to need protection under theEndangered Species Act in the foreseeable future. Detailed analyses of the likelihood that apopulation will remain stable or increase must be carried out before determining whether it isrecovered. (a) fluctuations in abundance, fecundity, and survivorship; (b) movements of deserttortoises within the area and to or from surrounding areas; (c) changes in habitat, includingcatastrophic events; (d) loss of genetic diversity; and (e) any other threats to the populationwhich might be significant.
o Wording in this criterion needs to be revised.

DTRPAC Report page 219
Possible changes to Delisting criteria:
o Make recommendations to have specific criteria for each DPS o Have headings for criteria (i.e. MANAGEMENT) o Perhaps use a different criterion for density (e.g., not trends in population size)
Recommendations for monitoring
o Change DISTANCE software to incorporate differences in G0 – this might require writing our own software
o Continue to use transects sampling as these data are extremely valuable o Data collection for habitat monitoring should occur simultaneously with population
monitoring or in parallel. o Condition measurements of individual tortoises need to be developed. The condition index
of Nagy is not considered to be reliable insofar as that index can be biased by amount of water in the bladder which can amount to nearly 50% of body mass.
o Assess the extent to which presence/absence data could be useful to the goals for monitoring.
o Perform research to reduce variation in different types of population estimates from transect data (may or may not be distance sampling).
o Have tortoise trackers perform ground truthing of habitat variables, if remote sensing is used in monitoring.
o Habitat monitoring should measure rainfall, vegetation, etc. o Assemble a workshop to discuss habitat monitoring (experts on tortoise habitat, image
analysts, GIS analysts, ground truthing) o Threat monitoring needs to be hypothesis driven to measure success of management
actions.
Comments from stakeholder visitors
There was a comment concerning future scenarios of cultural changes that will be occurring in tortoise habitat over the next 25 years. This should be considered when designing reserves and managing DWMAs. Changes include increase in the human population and climate change.
There was a concern expressed that using buffers around features in the environment as criteria for selecting points for distance sampling transects reduces the amount of information that could be collected (e.g. effects of roads).
Preparation for the October 2-3 meeting in Tucson, AZ
October 2
DPS designation wrap up, (morning session) There will be a discussion to finalize recommendations for DPS designations.
ACTION ITEM: Dr. McCoy, Dr. Morafka, Dr. Delehanty, and Dr. Tracy will provide appropriate references for discussion prior to the meeting.

DTRPAC Report page 220
Research needs, (afternoon session) This has been discussed at previous meetings. The team will revisit areas of lack of knowledge and make a new list of research for the next five years.
ACTION ITEM: Each team member should come with suggestions for new research needs or emphasis on old research needs that have not been done (i.e. gaps in knowledge).
ACTION ITEM: Dr. Boarman will do an analysis of what kinds of research have been done since the recovery plan using desert tortoise council symposia and publications.
October 3
Conservation planning, (morning session) Representatives who are familiar different conservation plans (Larry Foreman, Lewis Wallenmeyer, Ray Bransfield, Ann McLuckie, Becky Jones) will be invited to discuss the status of implementation of the recovery plan (pg 55). They will be asked to report on the number of management issues that have been addressed in each conservation plan. Dr. Heaton will present what management actions have been done so far for each management unit, using the spreadsheet put together by Roy Averill-Murray. Inconsistencies in the wording of the recovery plan for management actions will be addressed. Revisit to make recommendations on how to deal with this problem of diverting attention to one threat.
Managers will have time to react to what the team has discovered thus far.
John Hamill will make a presentation on the DMG recovery proposal.
ACTION ITEM: DTRPAC should read the conservation-planning section of the recovery plan and be prepared to make recommendations for plan (adaptive management).
Preparation for DTRPAC presentation to the MOG on September 24th
A task described for the DTRPAC was to update the Desert Management Group and the Management Oversight Group on the process and progress of the committee. There will be a meeting of the MOG for this specific purpose on Wednesday, September 24 from 10am to 3pm in the Sun Coast Casino in Las Vegas, NV. In addition, there will be a presentation on the Disease workshop. There will be a presentation on how members of the DTRPAC were chosen and how is the team approaching the assessment. All stakeholders are invited and will be asked to bring information and will be permitted to ask questions. There was also a suggestion to have presentations from stakeholders that have been regular observers of the meetings to provide a different perspective to the group.
The script:
Dr.Tracy: Introduction, Overview, and Summary of DPS discussion
Dr. Heaton: Importance of spatially explicit modeling in the process up to this point. How GIS has been used in committee processes and how it can be used in future recovery efforts (e.g. looking at threats in a quantitative way)
Dr. Boarman: Threats overview

DTRPAC Report page 221
Averill-Murray: Involvement by a state agency (UT/AZ involvement) and the importance of process to states represented, importance of data sharing and standardized data collection
Tracy, Medica, and Nussear – Data collection, historical data, and analyses being done to use historical data (plots, distance sampling, total corrected sign), Improvements in distance sampling
Meeting participants
C. Richard Tracy, UNR Earl McCoy, USF Phil Medica, USFWS Roy Averill-Murray, AFG Bob Williams, USFWS Ken Nussear, UNR Bill Boarman, USGS Dave Delehanty, UI Jill Heaton, U. Redlands Bridgette Hagerty, UNR Rich Inman, U. Redlands John Hamill, DOI Clarence Everly, DOD
Jim Sedinger, UNR Steve Corn, USGS Barry Noon, CSU Chuck Peterson, ISU J. Michael Reed, Tufts U. Mary Cablk, DRI Lewis Wallenmeyer, Clark County John Willoughby, BLM Ron Marlow, UNR Ann McLuckie, Utah DOW Becky Jones, CFG Bryan Manley, representing Quad State Coalition Ray Bransfield, USFWS

DTRPAC Report page 222
Desert Tortoise Recovery Plan Assessment Committee MeetingOctober 2-3, 2003 Inn Suites Hotel Tucson, AZ
Thursday, October 2
Briefly discuss outcome of September 24th MOG meeting
Bob Williams (USFWS) provided some feedback on the DTRPAC presentation at the Management Oversight Committee on Wednesday, September 24th. The following were presentations given by DTRPAC members:
Dr. Tracy introduced the DTRPAC process, including team members, expert guests, and meeting topics.
Roy Averill-Murray discussed the importance to state agencies in the process and the importance of data sharing.
Dr. Boarman explained the DTRPAC approach to threats and emphasized interactive threats.
Dr. Heaton highlighted the use of new technologies and its importance to the DTRPAC process.
Phil Medica presented distance sampling data and methods. Ken Nussear provided some preliminary results, including downward trends in the Western
Mojave, using new analyses. Ken highlighted the team’s effort to use all available data including plot data and distance sampling data in new ways to make recommendations.
After the presentations, the DTRPAC members present formed a panel to answer any questions. Stakeholders and agency representatives offered both compliments and constructive criticism to the DTPRAC process and preliminary results. A summary of the presentations given at the MOG meeting will be made available on line.
Dr. Heaton gave an overview of the analyses that were presented at the MOG meeting. A kernel analysis was rerun using a combination of total corrected sign (TCS) and distance sampling (DS) data (1998-2003) to better represent areas where it is known that there are live animals. With both data sets, there is a suggestion that the DTNA is no longer attached to the remainder of the Fremont-Kramer DWMA. This area is void of evidence of tortoises, but does contain carcasses. If this small area of DTNA has been fragmented, it poses conservation biology concerns. These results are dependent on the size of the areas used for the analysis. Using smaller sampling areas for the analysis makes the results more conservative. In addition, a cluster analysis was done using the same combined data sets. The results suggest that there is a problem where there only appears to be clusters of carcasses, but not live animal clusters.
A question was raised about how to include cumulative and synergistic effects in the writing of a recovery. There was a suggestion that there should be a focus on practical considerations. The DTRPAC should make recommendations that translate expertise and data into possible priorities for management actions. For example, although there are many connected threats, roads are a threat that is associated with many other threats. If the DTPRAC were to identify correlative effects, they could create groupings of effects that would work as a whole. A goal of the DTPRAC should be to identify isolated and correlated threats. One possible mechanism for doing this would be a risk

DTRPAC Report page 223
analysis using best available information. The result would be a correlation matrix or network. The correlation matrix could be used to support recommendations for management actions.
Unfortunately it is difficult to difficult to control one threat experimentally and come up with a data that tests multiple threats occurring simultaneously. However, it might be possible to introduce healthy headstarted animals in experiments in areas were there no longer appears to be tortoises.
If the DTRPAC can provide a framework for how threats are interrelated, including recovery unit specific arrays of most probable threats and most probable interaction arrays, the new recovery team can determine the most worthy hypotheses to test. Although there may not be homogeneity within DPS units, it may be possible to use experimental management units to test hypotheses. There was a note to reemphasize hypothesis testing in DTRPAC recommendations.
There was a discussion about what is meant by “control access.” Although it is outside the scope of the DTPAC to provide all the features of a definition for this term, there is a need to be precise so that the new recovery team will have enough information.
Revisit DPS designations
A draft manuscript describing the DTRPAC DPS recommendations (written by Morafka, Murphy, McCoy and Tracy) was distributed to the DTRPAC for review. The take home message of the document is that the most supportable way to delineate DPS unit is the use of genetic information. In order to make designations based on ecological differences, etc. more concrete information is required. In the case of the Mojave population of the desert tortoise, the genetic model alone suggests that the Upper Virgin River is justifiably different as a DPS. The West Mojave is genetically similar to the Eastern and Northern Colorado units. Using mtDNA, Britten et al (1997) suggests that the Northeastern Recovery unit should be split between North and South of Las Vegas. Nuclear DNA was not used in the analysis, so further resolution is necessary. However, there is enough information to recommend a first separation of the Recovery Unit. The genetic DPS hypothesis includes four units: Upper Virgin River, West Mojave, North Las Vegas, and South Las Vegas. Further delineation of the West Mojave DPS is warranted based on ecological information (e.g. differences in rainfall east and west of the Baker sink, and in threats). This information may be enough to justify the West Mojave to be separated from the Eastern and Northern Colorado unit. Currently, there is not enough information to distinguish between the Northern and Eastern Colorado Units.
Discussion to finalize recommendations for DPS designations
The possible environmental correlates to justify DPS designations have the least justification; therefore, more information from the literature is necessary. For example, direct life history characteristics and environmental correlates have been demonstrated for similar herbivorous desert species (chuckwalla). There is literature that suggests tortoises have differences in body growth east and west of the Baker sink. Differences in reproduction in east vs. west, which can be correlated to rainfall, have also been demonstrated, though this data has not been published and there may be a similar problem with acquiring access to the necessary data. Work by Turner and Henen suggest that clutch size declines in drought years. Therefore, there is a current working hypothesis to split the West Mojave from Eastern and Northern Colorado using geographical discreteness east and west of the Baker sink. Currently, there is not enough information or justification to separate the Eastern and Northern Colorado into two DPS units. The genetic similarity in the West Mojave, Northern Colorado and Eastern Colorado possibly suggests that these populations were a relatively recent extension of the desert tortoise range.

DTRPAC Report page 224
A question was raised regarding the affect of humans moving tortoises on genetic variation. This has occurred on a very short time scale and with a small number of individuals, so the effect is probably minimal.
Discuss listing status recommendations for DPSs
As a result of the data analyses that have been done during the DTRPAC process, the DTRPAC is considering elevating the West Mojave DPS to endangered status.
What is the difference between threatened and endangered status? Endangered status
Makes jeopardy decisions possible Changes public opinion No 4D rule, which concerns exemptions on take Takes 30 days longer to get a permit
The West Mojave desert tortoise DPS has all the elements of an endangered species (five criteria in section 4 of the ESA):
Loss of habitat Over utilization for commercial, recreational, scientific, or educational purposes Disease or predation The inadequacy of existing regulatory mechanisms Other natural or manmade factors
Bob Williams suggested using the example of the delisting of the Columbian white-tailed deer as a way to proceed with the desert tortoise.
Discuss required management actions and monitoring for each DPS
What are the management issues associated with individual DPS units? DPS units have cross-state boundaries. In the proposed South Las Vegas DPS, there would be only one DWMA in Ivanpah
Valley/Shadow Valley. This DWMA is approximately 1000 mi2. There would be no DWMA in Nevada.
What should be measured and what should the criteria be for each DPS?
The following were suggestions of what should be measured and what criteria should be used for each DPS:
Biologists must address population growth because ESA protection is ultimately a demographic issue. If researchers can monitor reproduction, mortality, age class structure in plots within each DPS, tentative answers for population growth can be realized in the long-term. If the desert tortoise is a cycling species, there may only be an average value for population growth over a long period of time.
Measure response to mitigation in threats and habitat Improve upon power in analyses

DTRPAC Report page 225
A discussion on original delisting criteria was revisited. In order to detect an upward or stationary trend, researchers will monitor changes in habitat and threats. Monitoring should also provide evidence of the efficacy of management actions in relation to threats and habitat. If individual condition cannot be linked to demographic population parameters, then the data do not provide evidence of recovery. Additionally, the population may still be declining, but condition may not be able to predict the downward trend. By sampling at multiple scales, it would be possible to see a series of indications of recovery after different amounts of time. The quantitative criterion for habitat protection is long-term population viability.
Repatriation may be a valid consideration in certain DPS units. Currently there is a proposal for repatriation as an experiment to determine mechanisms for population decline. The design uses adults and juveniles as a diagnostics for determining the effects of threats.
ACTION: Dr. Heaton will provide a copy of Dr. Morafka’s repatriation proposal to help in writing the report.
What differences should there be in monitoring for each DPS?
There was a suggestion to add plots to certain DPS units where there are not enough points. There should also be changes in the sampling rotation so that representative plots from each DPS are sampled annually. There were noted reservations about continuing to use permanent study plots for the same purpose as distance sampling, although plots provide other information in addition to density estimates. However, it was also noted that if each type of monitoring has a different flaw, then there is value in using both methods. It was suggested that the DTRPAC should provide recommendations for types of monitoring to use if there is unlimited funds, and if there are limited funds.
What are the required management actions for multiple, synergistic, and cumulative threats?
The DTRPAC should recommend that the next recovery team build a management prescription per DPS. The DTRPAC should plot the strategy, not provide individual recommendations.
Review of research prescribed in 1994 recovery plan and what has been published in the literature
Dr. Boarman provided a review of the research recommendations in the 1994 recovery plan as well as the type of research that has been presented at Desert Tortoise Council Symposia, International symposia, and in Chelonian Conservation and Biology.
The following were the general research recommendations in the recovery plan: Density – a recommendation to collect baseline data on density and distributions and to test
the replicability and accuracy of density estimate methods o Dr. Boarman noted a disproportionate number of baseline monitoring studies
Demography – a recommendation to produce a model for epidemiology and population structure (demographic and genetic).
o Dr. Boarman noted that there were more papers on population structure (genetic) or broad geographic patterns with morphology
o There were no papers comparing mortality and epidemiology.

DTRPAC Report page 226
Impacts – a recommendation to perform long term studies to determine demographic impacts of grazing, road density, barriers, human-use levels, restoration, augmentation, and translocation.
o Dr. Boarman noted that there were more papers on translocation and grazing. o Other papers focused on fire, roads, and OHV. Most papers only provided
inferential and correlational data. Protective measures – a recommendation to determine the effectiveness of DWMAs.
o Dr. Boarman cited the study comparing populations within and outside the DTNA. A study also determined the effectiveness of fencing.
Climate and Plants – a recommendation to study the spatial variability in climate and vegetation productivity, and how that affects demography.
o Typically these studies are not tortoise literature, so a fair assessment has not been made.
Nutritional ecology – a recommendation to study nutritional ecology and how it affects survivorship.
o Dr. Boarman noted that papers focused on tortoise diet and its effect on physiology. Reproductive physiology
o There have been studies on clutch size and temperature dependent sex determination.
The following were non-recovery plan topics that have been studied since 1994: Disease and health – mostly status, etiology and pathology, not affects on demography Habitat and fire – weeds and fire ecology Population and behavior – juvenile movements and home range Habitat characteristics – burrow characteristics, hibernation (mostly juvenile) Methodology – ELISA methods for disease, putting transmitters on tortoises
The following are successes in terms of what has been covered that was recommended in the recovery plan:
Physiology, nutrition, and reproduction – 24% Density and status – 13% Impacts - 10% Topics not listed in the plan (disease - 17%, and fire ecology – 8%)
The following are failures in terms of the recovery plan: Epidemiology Mortality (underestimated) and no relative proportions of causes of mortality Impacts including roads, barriers, human-use, restoration, augmentation
These downfalls can be explained by failures of management and lack of publishing.
The following are research needs to be addressed in the future: Demography – age-specific survivorship (juveniles) and age-specific fecundity Epidemiology Impacts – particularly road densities Effectiveness of actions - signal of failure of management agencies
NOTE: There was a suggestion to evaluate the effects of road density by looking at the clustering of live and dead animals and its correlation to road density. This analysis could be finished by the end of the year.

DTRPAC Report page 227
Discuss gaps in research (on a per DWMA basis)
The following is an evaluation of research in terms of answering questions important to the species:
3.a. Baseline data on tortoise density both inside and outside DWMAs – Comments: The term baseline was used because the intention was for comparisons to be
made inside and outside of DWMAs. The term baseline is no longer appropriate. In addition, the wording should be changed managed and non-managed areas. Differences between these areas should be assessed with hypothesis driven testing.
3.b. Develop a comprehensive model of desert tortoise demography in the Mojave region and within each DWMA Comments: This research need has not been fulfilled due to failures of technology and the lack
of necessary data. This model should be broken down into manageable component parts. For example, each component would be a different size/age class. This need should also include a spatial and temporal natural change component. This research need emphasizes the need for data sharing, appropriate statistical consultation, and accountability.
3.b.2. Research of sources of mortality and their representation of the total mortality, and including human natural predation, diminishment of required resources
3.b.2a.Initiate epidemiological studies of URTD and other studies
3.b.3 Research recruitment and survivorship of younger age classes Comments: Researchers should focus on understanding population structure, including the
spatial scale of both genetic and demographic processes. In addition, studies should be done to determine the extent to which DWMAs and recovery units to conform to natural population subdivisions.
Additional comments on the organization of 3.b.: Research sources of mortality (including disease), fecundity, survivorship, recruitment,
migration for a demographic model o Include Recruitment and mortality by stage o Include fecundity for whole system o Suggestions to use the Lefkowich model o Incorporate differences between age, stage, and size o Include possible differences between individual DPS units o Suggestion to include density in the model?
3.c Long term research on impacts of grazing, road density, barriers, human use levels, restoration, augmentation, and translocation. Comments: This particular research need should be separated into positive and negative
impacts (i.e. threats and effectiveness of protective measures). Therefore, restoration, augmentation, and translocation should be moved to 3.d. There was a suggestion to produce a new list of impacts to study based on the correlated clusters of threats. These research needs should also include a spatial and temporal component. Impacts should not be tested only comparatively (e.g. grazing/non-grazing). Research should also separate the effectiveness of a DWMA and the effectiveness of individual management actions. This is particularly important because management is not consistent within or across DWMAs.
3.d Assess the effectiveness of protective measures in reducing anthropogenic impacts

DTRPAC Report page 228
3.e Collect data on spatial variability of climate and productivity of vegetation Comments: The spatial component of this research need should spread to other
recommendations. There was a suggestion of include the impacts of global climate change in this recommendation. Another suggestion was to improve the wording of this section by including with and without threats. Modeling should be included in this section as well. This research need does not stand alone, and should be used for appropriate modeling and assessing threats in the appropriate contexts.
3.f Long-term research on the nutritional and physiological ecology of various age-size classes Comments: A good amount of research has been done in response to this research need.
However, there should be an attempt to link this research to threats.
3.g Conduct research on reproductive behavior and physiology, focusing on requisites for successful reproduction
Comments: This research need should also be discussed in the context of understanding threats.
ACTION – Dr. Tracy will develop a conceptual demographic model using ideas conveyed during this meeting.
What are the recommended additions to the research needs list?
1. Development of new technologies that will be important to studying tortoises in the future Repair of technology challenged areas and improve survey techniques
o Harmonic radar o Hyperspectral imaging o Remote sensing and GIS
2. Threats to habitat and tortoises (i.e. invasion of weeds, etc.): Include integration of impacts of the threat to habitat and to tortoises Separate for direct and indirect threats
3. Habitat monitoring: Habitat modeling technology (including needed data) is a possibility to support research in
habitat monitoring over the long term. Provide specific ways to understand the mechanisms behind why tortoises exhibit changes
in aerial extent. Provide a list of what is necessary to monitor habitat.
ACTION – Ken Nussear will draft the characteristics for habitat monitoring.
4. Target further delineation of DPS units Behavior Genetics (nuclear DNA)

DTRPAC Report page 229
Friday, October 3
Presentation on the beginning of a correlation threat matrix
The DTRPAC used a rough draft of a correlation threat matrix, which was presented by Dr. Boarman and Dr. Heaton, as an exercise to tally how often different threats occur. Without statistics, it is still possible to assign correlations between threats per DPS unit. The DTRPAC should be able to make recommendations on how to use this matrix per DPS. There was a suggestion to also include environmental stressors (uncontrollable environmental effects) to the matrix.
This matrix was presented in a flow chart format. The following is an example of how to follow the flow chart: Direct effects (crush, predation (ravens, coyotes, feral dogs), human removal, burning) anthropogenic effects that may cause these (construction, landfills, roads, non-motorized, grazing, mining). Note: These anthropogenic effects are in no particular order of importance.
The DTRPAC discussed the difference between direct and indirect effects. A suggestion was made to instead look at the factors and changes harms tortoises (mortality, malnutrition, lower reproductive fitness). There was a suggestion to collapse factors that have similar effects. Another suggestion was to give each effect an individual box (e.g. landfill). By counting the number of arrows coming from each box, and the thickness or length of arrows (to emphasize magnitude of the effect), the strength and magnitude of correlation could be graphically represented. Other suggestions included proposing a hypothesized mechanism to better support arguments, to show correlations in terms of the harm effect and spatial differences (geographically specific), and to include a hierarchical component that would show the outcomes for the population at the bottom of the diagram.
Time constraints may hinder the ability of the team to produce an entire matrix, however, the team should be able to put together a protocol on how to do this process for each DPS. This matrix should focus on population, rather than individual effects. There was a suggestion to use broken arrows when effects of a possible threat are unknown and where hypothesis driven experiments need to be done at the population level. One member noted the importance of recognizing that if direct effects are removed, indirect effects have not necessarily been removed in space and time.
This type of diagram will emphasize the concept of addressing multiple threats simultaneously. These network diagrams will help tease out synergistic, cumulative effects of threats. In addition the network should address within habitat effects (mortality and fecundity) and the effects of losing habitat (absolute aerial extent). Providing a combination of this network and a list of threats for each DPS to accompany the rhetoric of the report will fortify the DTRPAC’s argument for the “death of several cuts.”
ACTION – Dr. Boarman, Dr. Heaton, and Dr. Delehanty will continue to work on this network to include as a recommendation in the final report.
Research needs that resulted from this exercise: All threats need to be addressed at the population level. All explanations for this should include a common sense scenario. For example, the Texas tortoise lives in a higher productivity area and reaches age of reproduction earlier. Therefore, the number of individual deaths can be high, and the population will rebound more easily. However, the desert tortoise does not have these same life
DTRPAC Report page 230
history and habitat characteristics. As a result, the same amount of individual mortality may be having a much more noticeable effect.
Presentations on conservation planning in CA, NV, AZ, and UT
Clark County Multi-Species Habitat Conservation Plan (MSHCP):
Ron Marlow presented on the Clark County MSHCP. In general, habitat conservation plans (HCPs), authorized under Section 10 of the ESA, allow parties to avoid prohibitions on take under Section 9 of the ESA. For the most part, HCPs are carried out on a small scale, and are concerned with private parties. Clark County’s plan proposes to mitigate take on private land by managing public lands. The land was broken down into levels of management intensity. Intensively managed areas could be enhanced via payment to federal land managers to improve prospects of tortoise habitat. For example, one action taken by Clark County was to purchase grazing permits, resulting in the elimination of most grazing. In addition, certain highways that were identified as threats to tortoises were fenced as an MSHCP requirement.
In Clark County, take of desert tortoises occurs on private and public land. Funding for conservation is both federal and non-federal. The MSHCP has a broad base public support and requires science-based adaptive management. This HCP has been viewed as an experiment to determine if this type of process results in implementation of the recovery plan. In addition, the MSHCP is a test for land managers to determine if independent science and stakeholders can both be involved in the decision making process.
Requirements for Clark County in the HCP: Permit conservation actions – public information and education; tortoise pick up and
holding; rehabilitation and enhancement of habitat; construction tortoise barriers; translocation; science based adaptive management
Requirements for research (tortoise only) – translocation, survivorship, density, and stress.
Law enforcement - ACEC protection and management, predator control, conservation easement management, development of site conservation management plans
A question was posed as to whether the recovery plan should address efficacy of HCPs. A suggestion was made to document advantages and disadvantages of how HCPs are being implemented in terms of the recovery plan.
A DTRPAC member asked how adaptive management has been working for the Clark County MSHCP. The process of adaptive management has just barely begun. Management is occurring on an action-by-action basis, and there is reluctance and resistance for cooperation between federal mangers and Clark County.
Washington County HCP
Ann McLuckie presented on the Washington County HCP. The county obtained an incidental take permit in 1996 for over 1,000 animals and over 40,0000 known and potential tortoise habitat. The Red Cliff reserve (60,000 acres) includes 38,000 acres of tortoise habitat. The reserve is divided into 4 different zones, which several contain human use levels, and a translocation site. The reserve is close to urbanized areas and is divided by a highway.

DTRPAC Report page 231
Reserve management:
Within the Red Cliff reserve, the following management actions have been taken: Grazing permits have been retired Habitat acquisition Majority of areas have been fenced (tortoise fencing, people-proof/dog-proof, range fence
to prevent OHVs) Public use plan has been designed (trails, signs, human use monitoring program) Multi-agency law enforcement to eliminate illegal OHV use, reduce vandalism, and reduce
illegal collection. Education Translocation (Zone 4) - a short term study of the efficacy of translocation found it to be a
good management tool Population monitoring – density and long term trends using distance sampling transects, in
addition to population structure, sex ratios, and survivorship estimates
The Washington County HCP has an adequate funding mechanism, a broad base of players, and a reserve design based on biology. However, the reserve currently faces multiple threats including, drought, utility development and maintenance, habitat degradation and trail proliferation, and no forum for science-based adaptive management. As a result, concerns include, 1) the role of the technical committee is not well defined, 2) additional pressure/impacts created on the other species and habitat outside the reserve, and 3) general challenges of managing an urban reserve.
California Conservation Plans
Ray Bransfield presented on three large planning efforts led by the BLM: 1) North and East Mojave 2) North and East Colorado, and 3) West Mojave. The following chart summarizes the major information on each plan.
North and East Mojave North and East Colorado
West Mojave
Status Records of decision Record of Decision EIS Litigation Complaints filed Complaints filed ? DWMA Designated (BLM DWMAs
are not a 1000 mi^2) Designated Proposed
Vehicles Access Dual sport events are allowed in DWMAs – seasonal and only on roads No speed events in DWMAs Route designation is complete and proposed in the Western Mojave Travel will be open in certain washes In CA vehicles can travel 50 ft. from the center line to park, camp
Land Status Mostly federal Mostly federal 50% private (introduces level of complexity)
Land fills Not allowed in DWMAs Agriculture Not allowed in DWMAs Military No habitat destructive military activities Grazing Willing seller – willing buyer close allotment (no sheep grazing)

DTRPAC Report page 232
Burros Management goal is zero burros Guns Hunting per code and target shooting ok Ravens Target offending birds
Reduce and remove subsidies Environmental assessment in preparation Start next spring More aggressive program in the West Mojave
Fence roads Discussion about fencing roads before projects; current FG policy is causing a slight problem
The following is additional information on the West Mojave Plan: The proposed DWMAs include almost all critical habitat. The BLM is proposing that no ground disturbance will exceed 1% within DWMAs;
continual restoration of habitat will reduce the level of disturbance to 1%. General areas will also be protected for the Mojave ground squirrel, which will benefit
desert tortoises. Projects funds will be used to buy additional private land. Tortoises will not be collected prior to development; however, there will be a hot line to
collect tortoises during development actions. The West Mojave Plan is multi-species and will span several counties.
After the HCP presentations, the DTRPAC returned to the charge of the committee, which is to evaluate plan based on current knowledge of HCPs. There was a suggestion that HCPs should have an evaluative process by a science team. Additionally, hypothesis based research should be used to evaluate the successes and failures of HCP actions. The DTRPAC should highlight the need for constant science review and make a recommendation for independent (outside) science review. Science should inform the initial decision to take a management action and then also evaluate the effectiveness of the action. Moreover, for all large planning efforts, there should be a recommendation to build science review into the recovery plan for HCPs. In addition to science review, there should be coordination among HCPs because of the large scale of these plans. Although each plan may be acceptable individually (compromises made in each), a comprehensive review of all HCPs may reveal unsatisfactory levels of management.
Presentation on DMG recovery proposal
John Hamill presented on the Desert Management Group Proposed Recovery Action Program (RAP) and asked for a DTRPAC review of the proposal. There was concern that the implementation of RAP may be premature before the review of the recovery plan was complete. Additionally, the DMG does not want actions to be inconsistent with the new recovery plan. The focus of this review is to determine if the RAP is consistent with best available scientific information and to ask for DTRPAC recommendations to improve the RAP.
Within CA, desert tortoise recovery is addressed by 10 plans. The geographic scope of the RAP is the entire CA desert, and the program will be an integrated effort with the MOG.
The goal of the RAP is to reconcile compatible human uses and recovery of the desert tortoise. The RAP is based of the principles of sound science, adaptive management, and stakeholder involvement. The DMG, which includes all principle land and resources management agencies, and the Regional Executive Management Group will manage the program. These groups will sign an

DTRPAC Report page 233
MOU, work together on policy guidance, approve a work plan, and continue to engage in active coordination.
The desert tortoise management framework will include public and stakeholder involvement in the form of NEPA compliance. The program will be based on the following basic foundation elements: 1) annual work planning process to increase collaboration and be more cost effective, 2) science support to provide adaptive management standards and guidance, 3) data management, including central data repository with appropriate protocols that will be coordinated with other states in the range, 4) desert tortoise monitoring, including a commitment to improve and continue distance sampling and to integrate distance sampling and study plots, and 4) education and outreach to promote individual responsibility for desert tortoise protection.
The first recovery actions that will be addressed by the RAP will be those that require interagency coordination for effective implementation. These will include management of ravens, feral dogs, disease, head starting, and translocation. Each element will have identified areas of management.
The following were DTRPAC comments and clarifications on the CA RAP:
DTRPAC members emphasized the need for coordination both among government agencies and between states within the desert tortoise range.
Given the scope of the West Mojave plan, the RAP should work to provide coordination with range-wide plans. Additionally, USFWS should clarify how all plans should coordinate.
Collaboration will be necessary for head starting to avoid anecdotes dominating evaluation of successes or failures.
Coordination, data sharing, regular science oversight, and scientific assessment of effectiveness are all key components to the success of the RAP.
Focus on interagency coordination as the reason for the actions that were chosen
DTRPAC members also highlighted some possible changes for recovery actions. Specific techniques listed for monitoring should be able to be revised in the future. Disease should be studied in relation to how it will effect head starting and translocation Consultation with statisticians and expert in research design will be necessary to answer
questions for projects that have range-wide implications. Short-tem and long-term evaluation should be made explicit in all sections of the RAP.
ACTION: Dr. Heaton will present the outcome of the DTRPAC meeting at the DMG meeting on October 8th .
Outline of the DTRPAC report to the USFWS:
Introduction: Sections from the 1994 recovery plan that put forth a process for reviewing the plan every
3-5 years (Tracy) Sections from the DTRPAC proposal on the process of recovery plan review (Tracy) The importance of turtles to ecosystems and some natural history (Morafka) The DTRPAC’s opinion of the original recovery plan and a synopsis on data collected
since 1994 (types of data used, rate of change in publications, etc. (Boarman) Explanation of what the report is not
o Not a recovery plan, o Not a statement on political or social actions

DTRPAC Report page 234
o Not a generation of new data, o Not generated to perform new management actions)
Explanation of what the report is (a strategic overview, rather than a tactical overview) Acknowledgement of those who were invited speakers and experts (thank them as well)
and non-team members who consistently came to meetings (managers, etc.), and those who provided data
Distinct Population Segments (changes to listings) Deemphasize old categories and emphasize new categories Justifications for the West Mojave including data on annual differences east and west of the
Baker sink (rainfall and temperatures) (Tracy figure) Fortify West Mojave arguments with literature (Berry, Wallace, Germano, Weinstein) Maps for the old recovery units and the new recommended DPSs (Heaton) Revision of draft document by Morakfa, McCoy, and Tracy
Status and Trends (range wide assessment) Maps of all original plots, distance sampling transects, and TCS (Heaton) Analyses of plot data (Nussear) Kernel and cluster analyses – distance sampling and total corrected sign (refinement needed
for the West Mojave) (Nussear and Heaton) Table of Distance sampling estimates (Medica) Methods section about how data were acquired and cluster analyses (Heaton) Methods section on kernel and regression analyses (Nussear) History of distance sampling (Medica) History of permanent study plots (Murray) Spatial component of data Conventional status based on data and Organization of this section (Murray)
Threats and disease: Proper context of disease, modern thinking, cause and effect (McCoy) What is proper data collection on the population level for these issues? Capture differences
in effects on individuals and effects on populations (McCoy) Acknowledge tactical report that will be concurrent (Disease workshop) Multiple, interacting, and synergistic effects Network diagram of threats (Boarman, Heaton, Delehanty) Distill Boarman Threats report Lead - Boarman and McCoy
Monitoring: Lead - Delehanty and Tracy Multiscale monitoring approach (Peterson advice) Habitat, threats, and tortoise population monitoring
Planning and Coordination: Interface of Science and Management Elements that should be included in HCPs and other conservation plans (Murray)
o Science based adaptive management o Hypothesis-driven experiments to assess efficacy of management actions
Data sharing and outside scientific review (tie in information from other sections) (Delehanty)
Recapture recommendations from other programs (spotted owl program) (Delehanty)

DTRPAC Report page 235
Lead – Murray
Research: Introduction to this section will be a summary of past research in relation to the recovery
plan (Boarman) Significant recommendations in the original recovery plan that have not been heeded
(Boarman, Medica) Suggestion for a master plan of research – Florida example (McCoy and Morafka) Gaps in research from each section – each section writer will note research gaps for this
section Research needs from original recovery plan (DTRPAC checklist) Importance of interdisciplinary approaches and coordination (Morafka)
Summary of overarching recommendations: Recommendation for a new recovery team Changes in the recovery plan Change in listing of the West Mojave population (endangered status) and why Keep a list of recommendations from each section
ACTION: Ken Nussear and Dr. Heaton will make sure that all maps will be put on the website for the group to access while writing.
ACTION: As DTRPAC members make progress, they will email sections to all DTRPAC members.
Preparation for possible November DTRPAC meeting and remaining tasks November 6-7th in Las Vegas, NV (Bob Williams will make meeting preparations.)
o Final wrap up and reviewing all writing sections o If necessary, there will be a final DTRPAC meeting in San Francisco (Jan 12-13th).
Meeting participants:
C. Richard Tracy, UNR Bridgette Hagerty, UNR Ken Nussear, UNR David Delehanty, ISU Roy Averill-Murray, AFG Bill Boarman, USGS Phil Medica, USFWS Jill Heaton, U. Redlands Earl McCoy, USF Ann McLuckie, UFG Ray Bransfield, USFWS Dave Morafka, CA Academy of Sciences Brian Manly, representative for QUAD Clarence Everly, DOD Ron Marlow, UNR John Hamill, DOI

DTRPAC Report page 236
“It is the desire for explanations that is at once systematic and controllable by factual evidence that generates science; and it is the organization and classif ication of knowledge on thee basis of explanatory principles that is the distinctive goal of the sciences.”
Ernest Nagel, The Structure of Science. (1961)

DTRPAC Report page 237
Literature Cited Advantage Environmental Consulting. undated (1992). Desert tortoise monitoring study: Virgin Slope trend plot. Report to Bureau of Land Management, Arizona Strip District, St. George, Utah.
Anderson, D.R., and K.P. Burnham. 1996. A monitoring program for the desert tortoise Colorado Cooperative Fish and Wildlife Research unit, Colorado State University, Fort Collins, CO. 15pp.
Anderson, D.R., K.P. Burnham, B.C. Lubow, L. Thomas, P.S. Corn, P.A. Medica, and R.W. Marlow. 2001. Field trials of the line distance method applied to estimation of desert tortoise abundance. Journal of Wildlife Management 65: 583-597.
Allen, T.F.H. and T.W. Hoekstra. 1992. Toward a unified ecology. Columbia University Press, New York 384 pp.
Averill-Murray, R.C. 2002a. Reproduction of Gopherus agassizii in the Sonoran Desert, Arizona. Chelonian Conservation and Biology 4: 295-301.
Averill-Murray, R. C. 2002b. Effects on survival of desert tortoises (Gopherus agassizii) urinating during handling. Chelonian Conservation and Biology 4:430-435.
Averill-Murray, R.C., B.E. Martin, S.J. Bailey, and E.B. Wirt. 2002a. Activity and behavior of the Sonoran desert tortoise in Arizona. Pages 135-158 in T.R. Van Devender (ed.), The Sonoran Desert Tortoise: Natural History, Biology, and Conservation. Univ. Arizona, Tucson.
Averill-Murray, R.C., A.P. Woodman, and J.M. Howland. 2002b. Population ecology of the Sonoran desert tortoise in Arizona. Pages 109-134 in T.R. Van Devender (ed.), The Sonoran Desert Tortoise: Natural History, Biology, and Conservation. Univ. Arizona, Tucson.
Avery, H.W. 1997. Effects of cattle grazing on the desert tortoise, Gopherus agassizii: nutritional and behavioral interactions. Proceedings: Conservation, Restoration, and Management of Tortoises and Turtles - An International Conference, pp. 13-20.
Avery, H.W. 1998. Nutritional ecology of the desert tortoise (Gopherus agassizii) in relation to cattle grazing in the Mojave Desert. Ph.D. Dissertation, University of California, Los Angeles. 158 pp.
Avery, H. A., and Neibergs, A.G. 1997. Effects of cattle grazing on the desert tortoise. Gopherus agassizii: Nutritional and behavioral interactions. In Van Abbema, J. (Ed.). Proceedings: Conservation, Restoration, and Management of Tortoises and Turtles—an International Conference. July 1993. Purchase, New York: New York Turtle and Tortoise Society and the WCS Turtle Recovery Program, pp. 13-20.
Avise, J.C. 2000. Phylogeography: The history and formation of species. Harvard University Press, Cambridge, Mass.
Badalamenti, F., A. A. Ramos, E. Voultsiadou et al. 2000. Cultural and socio-economic impacts of Mediterranean marine protected areas. Environmental Conservation 27: 110-125.

DTRPAC Report page 238
Bashor, A.N. undated (1991). Desert tortoise population and habitat attributes on the Pakoon Basin trend plot, Mojave County, Arizona. Report to Bureau of Land Management, Arizona Strip District, St. George, Utah.
Berry, K.H., 1974. Desert tortoise relocation project: status report for 1972. California Department of Transportation: 104pgs.
Berry, K.H., 1975. Desert tortoise relocation project: status report for 1973. California Department of Transportation: 38pgs.
Berry, K.H. 1976. Desert tortoise relocation project: status report for 1974. Division of Highways, Contract F-9353, 1-26.
Berry, K.H. 1979. State report–California. Bureau of Land Management. In: St. Amant, E. (Ed.), Desert Tortoise Council Proceedings, 1979 Symposium, Tucson, AZ. pp 83-87.
Berry, K.H. 1984. A description and comparison of field methods used in studying and censussing desert tortoises. Appendix 2. pp 1-33. (In) K.H. Berry. (ed.) 1984. The status of the desert tortoise (Gopherus agassizii) in the United States. Report to the U.S. Fish and Wildlife Service from the Desert Tortoise Council. Order No. 11310-0083-81. March 1984.
Berry, K.H. 1986. Desert tortoise (Gopherus agassizii) relocation: implications of social behavior and movements. Herpetologica 42: 113-125.
Berry, K.H. 1989. Report from the Desert Tortoise Natural Area and Surrounding Areas
Berry, K.H. 1990. Status of the desert tortoise in 1989: incomplete draft report, with marginal annotations for tables with 1990-1991 data sets for live tortoises. Bureau of Land Management, Riverside, CA. pp. 15-80.
Berry. K.H. 1992. Report to USFWS for scientific research permit LOA-Berry on the desert tortoise (Gopherus agassizii). Bureau of Land Management, Riverside, CA. pp. 2-3 (tables 1 and 2)
Berry. K.H. 1995. Report to Mr. Ray Bransfield, U.S. Fish and Wildlife Service, July 11, 1995. US DOI National Biological Service, Riverside, CA. (size class)
Berry, K.H. 1996. A summary of the changes in density of desert tortoise populations at the permanent study plots in California, prepared for Ms. Molly Brady, Bureau of Land Management, October 1, 1996 (Revised). U.S. Geological Survey. Riverside, CA. pp 1-15.
Berry, K.H. 1997. Demographic consequences of disease in two desert tortoise populations in California, USA. In: Proceedings: Conservation and management of turtles and tortoises – an international conference, J. van Abbema (Ed.), New York Turtle and Tortoise Society, West Orange, NJ. pp. 91-97.
Berry, K.H. 1999. Preliminary report from the 1999 Spring Survey of the Desert tortoise Long Term Study plot in Chemehuevi Valley and Wash, CA. U.S. Geological Survey. Riverside, CA. September 30, 1999. (size class)
Berry, K.H., and M.M. Christopher. 2001. Guidelines for the field evaluation of desert tortoise health and disease. Journal of Wildlife Diseases 37: 427-450.

DTRPAC Report page 239
Berry, K.H., G. Goodlett, and T. Goodlett. 2000. Effects of geology and cover site choice on desert tortoise populations at the Tiefort mountains, California. The Proceedings of the Desert Tortoise Council 2000:5.
Berry, K.H., F.G. Hoover, and M. Walker. 1996. The effects of poaching desert tortoises in the western Mojave Desert: Evaluation of landscape and local impacts. The Proceedings of the Desert Tortoise. Council Symposium. 1996:45.
Berry, K.H., D.J. Morafka and R.W. Murphy. 2002. Defining the desert tortoise(s): our first priority for a coherent conservation strategy. Chelonian Conservation and Biology 4: 249-262.
Berry, K.H., L.L. Nicholson, S. Juarez, and A.P. Woodman. 1986. Changes in the desert tortoise populations at four study sites in California. First draft.
Berry, K.H., and L.L. Nicholson. 1984. The distribution and density of desert tortoise populations in California in the 1970's. Berry, K.H., The Status of the Desert Tortoise (Gopherus agassizii) in the United States, Long Beach, CA: The Proceedings of the Desert Tortoise Council Symposium: 26-60.
Berry, K.H., T. Shields, and C. Knowles. in prep. Changes in tortoise populations at the Desert Tortoise Natural Area, Interpretive Center, and Fremont Peak study plots between 1970's and 1989. Bureau of Land Management, Riverside, CA.
Berry, K.H., E.K. Spangenberg, B.L. Homer, and E.R. Jacobson. 2002. Deaths of desert tortoises following periods of drought and research manipulation. Chelonian Conservation and Biology 4: 436-448.
Berryman AA. 1993. Food web connectance and feedback dominance, or does everything really depend on everything else? Oikos 68: 183-185
Bjurlin, C.D. and J.A. Bissonette. 2001. The impact of predator communities on early life history stage survival of the desert tortoise at the Marine Corps Air Ground Combat Center, Twentynine Palms, California. U. S. Dept. of the Navy Contract N68711-97-LT-70023. UCFWRU Pub. # 00-4: 1-81.
Boarman, W.I. 2002. Threats to desert tortoise populations: a critical review of the literature. U.S. Geological Survey, Western Ecological Research Center, Sacramento, CA.
Boarman, W.I. 2003. Managing a subsidized predator population: reducing common raven predation on desert tortoises. Environmental Management. 32:205-217.
Boarman, W.I. and B. Heinrich. 1999. The Common Raven. In A. Poole and F. Gill (eds.), The Birds of North America, No. 476. The Birds of North America, Philadelphia, PA.
Bowles, A.E., S. Eckert, L. Starke, E. Berg, L. Wolski, and J. Matesic, Jr. 1999. Effects of flight noise from jet aircraft and sonic booms on hearing, behavior, heart rate, and oxygen consumption of desert tortoise (Gopherus agassizii). AFRL-HE-WP-TR-1999-0170. Sea World Research Institute, Hubbs Marine Research Center, San Diego, CA. 131 pages.

DTRPAC Report page 240
Britten, H.B., B.R. Riddle, P.F. Brussard, R.W. Marlow and T.E. Lee, Jr. 1997. Genetic delineation of management units for the desert tortoise, Gopherus agassizii, in northeastern Mojave Desert. Copeia 1997: 523-530.
Brooks, M.L. 1995. Benefits of protective fencing to plant and rodent communities of the western Mojave Desert, California. Environmental Management 19:65-74.
Brooks, M.L. 1999. Effects of protective fencing on birds, lizards, and black-tailed hares in the western Mojave Desert. Environmental Management 23:387-400.
Brooks, M.L. 2000. Competition between alien annual grasses and native annual plants in the Mojave Desert. American Midland Naturalist 144:92-108.
Brooks, M. L., and T.C. Esque. 2002. Alien plants and fire in desert tortoise (Gopherus agassizii) habitat of the Mojave and Colorado deserts. Chelonian Conservation and Biology 4:330-340.
Brown, D.R., I.M. Schumacher, G.S. McLaughlin, L.D. Wendland, M.B. Brown, P.A. Klein, and E.R. Jacobson. 2002. Application of diagnostic tests for mycoplasmal infections of the desert and gopher tortoises, with management recommendations. Chelonian Conservation and Biology 4: 497-507.
Brown, M.B., G.S. McLaughlin, P.A. Klein, B.C. Crenshaw, I.M. Schumacher, D.R. Brown, and E.R. Jacobson. 1996. Upper respiratory tract disease in the gopher tortoise is caused by Mycoplasma agassizii. Journal of Clinical Microbiology 37: 2262-2269.
Brown, M.B., I.M. Schumacher, P.A. Klein, K. Harris, T. Correll, and E.R. Jacobson. 1994. Mycoplasma agassizii causes upper respiratory tract disease in the desert tortoise. Infection and Immunity 62: 4580-4586.
Brown, M.B., K.H. Berry, I.M. Schumacher, K.A. Nagy, M.M. Christopher, and P.A. Klein. 1999. Seroepidemiology of the upper respiratory tract disease in the desert tortoise in the western Mojave Desert of California. Journal of Wildlife Diseases 35: 716-727.
Bryan, T.R., and M.T. West. 1972. Survival of captive desert tortoises (Gopherus agassizii) after release in the Mojave Desert. University of California Polytechnic, Pomona, California.
Buckland, S.T., D.R. Anderson, K.P. Burnham, and J.L. Laake. 1993. Distance Sampling: Estimating abundance of biological populations. Chapman and Hall. London. 446 pp.
Buckland, S.T., D. Anderson, K. Burnham, J.L. Laake, D.L. Borchers, and L. Thomas. 2001. Introduction to Distance Sampling: Estimating Abundance of Biological Populations. Oxford University Press, Oxford.
Bureau of Land Management, County of San Bernardino, and City of Barstow. 2003. Draft environmental impact report and statement for the West Mojave Plan; a habitat conservation plan and California Desert Conservation Area Plan amendment. Moreno Valley, San Bernardino, and Barstow, California.

DTRPAC Report page 241
Burge, B.L. 1977. Daily and seasonal behavior, and areas utilized by the desert tortoise, Gopherus agassizii, in southern Nevada. The Proceedings of the Desert Tortoise Council Symposium 1977: 59-94.
Bury, R.B., and P.S. Corn. 1995. Have desert tortoises undergone a long-term decline in abundance? Wildlife Society Bulletin 23: 41-47.
Bury, R.B., and R.A. Luckenbach. 2002. Comparison of desert tortoise (Gopherus agassizii) populations in an unused and off-road vehicle area in the Mojave Desert. Chelonian Conservation and Biology 4:457-463.
Campbell, S.P., J.A. Clark, L.H. Crampton, A.D. Guerry, L.T. Hatch, P.R. Hosseini, J.J. Lawler, and R.J. O’Connor. 2002. An assessment of monitoring efforts in endangered species recovery plans. Ecological Applications 12:674-681.
Caughley, G., and A. Gunn. 1996. Conservation Biology in Theory and Practice. Blackwell Science, Inc., Cambridge, MA. 459 pp.
Chan, N.Y., K.L. Ebi, F. Smith et al. 1999. An integrated assessment framework for climate change and infectious diseases. Environmental Health Perspectives 107: 329-337.
Christopher, M.M., K.H. Berry, B.T. Henen, and K.A. Nagy. 2003. Clinical disease and laboratory abnormalities in free-ranging desert tortoises in California (1990-1995). Journal of Wildlife Diseases 39: 35-56.
Christopher, T.E., B.T. Henen, E.M. Smith, M.E. Allen, F.H. Pough, and O.T. Oftedal. 1998. Reproductive output of large-for-age desert tortoises (Gopherus agassizii). The Proceedings of the Desert Tortoise Council Symposium. 104-105.
Clark, J.A., J.M. Hoekstra, P.D. Boersma, and P. Kareiva. 2002. Improving U.S. Endangered Species Act recovery plans: key findings and recommendations of the SCB Recovery Plan Project. Conservation Biology 16: 1510-1519.
Cook, J.C., A.E. Weber, and G.R. Stewart. 1978. Survival of captive tortoises released in California. The Proceedings of the Desert Tortoise Council Symposium: 130-134.
Congdon, J.D., A.E. Dunham, R.C. Van Loben Sels. 1993. Delayed sexual maturity and demographics of Blanding's turtles (Emydoidea blandingii): Implications for conservation and management of long-lived organisms. Conservation Biology 7: 826-833.
Corn, P.S. 1991. Displacement of desert tortoises: Overview of a study at the apex heavy industrial use zone, Clark County, Nevada. The Proceedings of the Desert Tortoise Council Symposium: 295-303.
Corn, P.S. 1994. Recent trends of desert tortoise populations in the Mojave Desert. U. S. Department of the Interior National Biological Survey, Washington, D. C. pp. 85-94.
Crooker, N.S. 1971. First report on the movements and survival of captive desert tortoises released in the Colorado Desert of California. University of California Polytechnic, Pomona, California.

DTRPAC Report page 242
Crouse, D.T., L.A. Mehrhoff, M.J. Parkin, D.R. Elam, and L.Y. Chen. 2002. Endangered species recovery and the SCB study: a U.S. Fish and Wildlife Service perspective. Ecological Applications 12:719-723.
Cullen, P. 1990. The turbulent boundary between water science and water management. Freshwater Biology 24: 201-209.
D’Antonio, C.M., and P.M. Vitousek. 1992. Biological invasions by exotic grasses, the grass/fire cycle, and global change. Ann. Rev. Ecol. Syst. 23: 63-87.
Deem, S.L., N.B. Karesh, and W. Weisman. 2001. Putting theory into practice: Wildlife health in conservation. Conservation Biology 15: 1224-1233.
Dewberry, T.C., and C.M. Pringle. 1994. Lotic science and conservation: Moving toward common ground. Journal of the North American Benthological Society 13: 399-404.
Dickinson, H.C., and J.E. Fa. 2000. Abundance, demographics and body condition of a translocated population of St Lucia whiptail lizards (Cnemidophorus vanzoi). Journal of Zoology 251: 187-197.
Diemer-Berish, J.E., L.D. Wendland, and C.A. Gates. 2000. Distribution and prevalence of upper respiratory tract disease in gopher tortoises in Florida. Journal of Herpetology 34: 5-12.
Doak, D., P. Kareiva, and B. Klepetka. 1994. Modeling population viability for the desert tortoise in the western Mojave Desert. Ecological Applications 4: 446-460.
Dodd, C.K., and R.A. Seigel. 1991. Relocation, repatriation, and translocation of amphibians and reptiles - are they conservation strategies that work. Herpetologica 47: 336-350.
Duck, T.A., and E. Schipper. undated (1989). Analysis of a desert tortoise population and habitat on the Beaver Dam Slope, Arizona. Part II. Site 45, Exclosure. Bureau of Land Management, Arizona Strip District, St. George, Utah.
Duck, T.A., and J.R. Snider. undated (1988). Analysis of a desert tortoise population and habitat on the Beaver Dam Slope, Arizona. Part I. Site 44, Littlefield. Bureau of Land Management, Arizona Strip District, St. George, Utah.
Duda, J. J., A.J. Krzysik, and J.E. Freilich. 1999. Effects of drought on desert tortoise movement and activity. Journal of Wildlife Management 63: 1181-1192.
Ecological Society of America (ESA). 1995. Strengthening the use of science in achieving the goals of the Endangered Species Act. ESA, Washington, DC.
EnviroPlus Consulting. 1994. Desert tortoise population studies at six plots in southern Nevada. Report to Nevada Division of Wildlife. Contract # 94-44. 85pp. plus appendices.
EnviroPlus Consulting. 1995. Desert tortoise population studies at plots in southern Nevada. Report to U.S. Department of Interior, National Biological Service. Contract # 14-48-0006-95-019. 53pp. plus appendices.

DTRPAC Report page 243
Epperson, D.M. 1997. Gopher tortoise (Gopherus polyphemus) populations: activity patterns, upper respiratory tract disease, and management on a military reservation in northeast Florida. Ph.D. Dissertation, University of Florida, Gainesville, FL.
Field, K.J. 1999. Translocation as a conservation tool applied to the desert tortoise: Effects of the pre-release availability of water. Masters of Science, University of Nevada, Reno: 61pgs.
Field, K., C.R. Tracy, P.A. Medica, R.M. Marlow, and P.S. Corn. 2000. Translocation as a tool for conservation of the desert tortoise: Can pet tortoises be repatriated? [abstract]. The Proceedings of the Desert Tortoise Council Symposium 2000:14.
Field, K.J., C.R. Tracy, P.A. Medica, R.W. Marlow, and P.S. Corn. 2003. Spring, fall, or winter? Success of desert tortoise translocation as affected by season of release. The Proceedings of the Desert Tortoise Council Symposium 2003.
Fisher, J., and D.B. Lindenmayer. 2000. An assessment of the published results of animal relocations. Biological Conservation 9: 1-11.
Fisher R.N., A.V. Suarez, and T.J. Case. 2002. Spatial patterns in the abundance of the coastal horned lizard. Conservation Biology 16: 205-215.
Forman, R.T.T., D. Sperling, J.A. Bissonette, A.P. Clevenger, C.D. Cutshall, V.H. Dale, L. Fahrig, R. France, C.R. Goldman, K. Heanua, J.A. Jones, F.J. Swanson, T. Turrentine, T.C. Winter. 2003. Road ecology: Science and solutions. Island Press: Washington, DC.
Frazer, N.B. 1993. Sea turtle conservation and halfway technology. Conservation Biology 6: 179-184.
Fridell, R.A., and J.A. Shelby. 1996. Status of the desert tortoise population on the Beaver Dam Slope monitoring plot, 1991. Utah Division of Wildlife Resources Publication Number 96-12, Salt Lake City, Utah.
Fridell, R.A., and M.P. Coffeen. undated (1993). Desert tortoise population on the Woodbury-Hardy monitoring plot, Beaver Dam Slope, 1986. Utah Division of Wildlife Resources Publication Number 93-6, Salt Lake City, Utah.
Fridell, R.A., J.R. Snider, K.M. Comella, and L.D. Lentsch. 1995. Status of the desert tortoise population on the City Creek monitoring plot, Upper Virgin River Valley, 1994. Utah Division of Wildlife Resources Publication Number 95-05, Salt Lake City, Utah.
Fridell, R.A., M.P. Coffeen, and R. Radant. 1995. Status of the desert tortoise population on the City Creek monitoring plot, Upper Virgin River Valley, 1988. Utah Division of Wildlife Resources Publication Number 95-04, Salt Lake City, Utah.
Fridell, R.A. 1995. Status of the desert tortoise population on the Woodbury-Hardy monitoring plot, Beaver Dam Slope, 1992. Utah Division of Wildlife Resources Publication Number 95-03, Salt Lake City, Utah.
Frost, D.R., and D.M. Hillis. 1990. Species in concept and practice: Herpetological applications. Herpetologica 46: 87-104

DTRPAC Report page 244
Frost, D.R., A.G. Kluge, and D.Z. Hillis. 1992. Species in contemporary herpetology: Comments on phylogenetic inference and taxonomy. Herpetological Review 23: 46-54.
Gelbard, J.L., and J. Belnap. 2003. Roads as conduits for exotic plant invasions in a semiarid landscape. Conservation Biology 17:420-432.
Germano, D.J. 1993. Shell morphology of North American tortoises. American Midland Naturalist 129: 319-335.
Gillette, D.A., and J. Adams. 1983. Accelerated wind erosion and prediction of rates. Pp. 97-109 in Webb, R.H., and H.G. Wilshire (eds.). Environmental effects of off-road vehicles: impacts and management in arid regions. Springer-Verlag, New York.
Glenn, J.L., R.C. Straight, and J.W. Sites, Jr. 1990. A plasma protein marker for population genetic studies of the desert tortoise (Xerobates agassizii). The Great Basin Naturalist 50: 1-8.
Goodlett, G., M. Walker, and P. Woodman. 1997. Desert tortoise population survey at Virgin Slope desert tortoise study plot, spring, 1997. Report to Arizona Game and Fish Department, Phoenix, AZ.
Goodlett, G., and P. Woodman. 2003. Desert tortoise population survey at Virgin Slope desert tortoise study plot and line distance transects on the Virgin and Beaver Dam slopes, spring, 2003. Report to Arizona Game and Fish Department, Phoenix, AZ.
Goodlett, G., P. Woodman, M. Walker, and S. Hart. 1996. Desert tortoise population survey at Beaver Dam Slope exclosure desert tortoise study plot; spring, 1996. Report to Arizona Game and Fish Department, Phoenix.
Gould, S. J., and. R.C. Lewontin. 1979. The spandrels of San Marcos and the Panglossian Paradigm; A critique of the adaptationist programme. Royal Society of London B 205: 581-598.
Gould, S. J., and. E.S. Vrba. 1982. Exaptation-a missing term in the science of form. Paleobiology 8: 4-15.
Griffith, B., J.M. Scott, J.W. Carpenter, and C. Reed. 1989. Translocation as a species conservation tool - status and strategy. Science 245: 477-480.
Grover, M.C., and L.A. DeFalco. 1995. Desert tortoise (Gopherus agassizii): status-of knowledge outline with references. Gen. Tech. Rep. INT-GTR-316. Ogden, UT: U.S. Department of Agriculture, Intermountain Research Station. 134p.
Haig, S.M., L.W. Oring, P.M. Sanzenbacher, and O.W. Taft. 2002. Space use, migratory connectivity, and population segregation among willets breeding in the western Great Basin. Condor 104: 620-630.
Hanski, I. 1999. Metapopulation Ecology. Oxford University Press. Oxford.
Hanski, I., and M.E. Gilpin. 1991. Metapopulation dynamics - brief-history and conceptual domain. Biological Journal of the Linnean Society 42: 3-16.

DTRPAC Report page 245
Hanski, I., and M.E. Gilpin (eds.). 1997. Metapopulation Biology: Ecology, Genetics and Evolution. Academic Press.
Hatch, L., M. Uriarte, D. fink, L. Aldrich-Wolfe, R.G. Allen, C. Webb, K. Zamudio, and A. Power. 2002. Jurisdiction over endangered species’ habitat: the impacts of people and property on recovery planning. Ecological Applications 12:690-700.
Hatfield, J.S., W.R. Gould, B.A. Hoover, M.R. Fuller, E.L. Lindquist. 1996. Detecting trends in raptor counts: Power and Type I error rates of various statistical tests. Wildlife Society Bulletin 24: 505-515.
Hayes, J.P., and J.S. Shonkweiler. 2001. Morphometric indicators of body condition: worthwhile or wishful thinking? Pgs. 8-38 in.J.R. Speakman (ed.). Of What Stuff Are Animals Made? Body Composition Analysis in Animals: A Handbook of Non-Destructive Methods. Cambridge University Press, Cambridge. 252p
Henen, B.T., C.D. Peterson, I.R. Wallis, K.H. Berry, and K.A. Nagy. 1998. Effects of climatic variation on field metabolism and water relations of desert tortoises. Oecologia 117: 365-373.
Hereford, R. 2000. Past and future climate variation in the Mojave Desert: Surface processes and land management issues. The Proceedings of the Desert Tortoise Council Symposium.
Hochachka, W.M., and A.A. Dhondt. 2000. Density-dependent decline of host abundance resulting from a new infectious disease. Proceedings of the National Academy of Sciences 97: 5303-5306.
Hoekstra, J.M., J.A. Clark, W.F. Fagan, and P.D. Boersma. 2002. A comprehensive review of Endangered Species Act recovery plans. Ecological Applications 12: 630-640.
Hoffman, T.C. 2002. The reimplementation of the Ra’ui: Coral reef management in Rarotonga, Cook Islands. Coastal Management 30: 401-418.
Homer, B.L., K.H. Berry, M.B. Brown, G. Ellis, and E.R. Jacobson. 1998. Pathology of diseases in desert tortoises from California. Journal of Wildlife Diseases 34: 508-523.
Hooge, P. N., and B. Eichenlaub. 2001. Animal movement extension to Arcview. ver 2.04b. Anchorage, AK: Alaska Science Center Biological Science Office, U.S. Geological Survey.
Hunter, J., F. Schmidt, F., and G. Jackson. 1982. Meta-Analysis: Cumulating research findings across studies. Sage, Beverly Hills, CA.
Hyman, J.B., and K. Wernstedt. 1995. A value-informed framework for interdisciplinary analysis: Application to recovery planning for Snake River salmon. Conservation Biology 9: 625-635.
Independent Scientific Advisory Board. 2003. A Review of Strategies for Recovering Tributary Habitat. Prepared for the Northwest Power Planning Council, the National Marine Fisheries Service, and the Columbia River Basin Indian Tribes, 851 SW 6th Avenue, Suite 1100, Portland, Oregon 97204.
Jackson, C.G., J.A. Trotter, T.H. Trotter, and M.W. Trotter. 1976. Accelerated growth and early maturation in Gopherus agassizii (Reptilia: Testudines). Herpetologica 32: 139-145.

DTRPAC Report page 246
Jacobson, E.R. 1994. Causes of mortality and disease in tortoises: a review. Journal of Zoo and Wildlife Medicine 25: 2-17.
Jacobson, E.R., M.B. Brown, I.M. Schumacher, B.R. Collins, R.K. Harris, and P.A. Klein. 1995. Mycoplasmosis and the desert tortoise (Gopherus agassizii) in Las Vegas Valley, Nevada. Chelonian Conservation and Biology 1: 279-284.
Jacobson, E.R., T.J. Wronski, I. Schumacher, C. Reggiardo, and K.H. Berry. 1994. Cutaneous dyskeratosis in free-ranging desert tortoises, Gopherus agassizii, in the Colorado Desert of southern California. Journal of Zoo and Wildlife Medicine 25: 68-81.
Jennings, R.D. 1985. Biochemical variation of the desert tortoise, Gopherus agassizii. M.S. Thesis, University of New Mexico, Albuquerque.
Johannes, R.E. 1998. The case for data-less marine resource management: Examples from tropical near-shore fisheries. Trends in Ecology and Evolution 13: 243-246.
Johnson, A., E. Jacobson, D. J. Morafka, F. Origgi, and L. Wendland. 2002. Prevalence of URTD in captive desert tortoises on and adjacent to Fort Irwin: potential impacts to wild populations. The Proceedings of the Desert Tortoise Council Symposium 2002.
Kaiser, J. 2000a. Bringing science to the national parks. Science 288: 34-37.
Kaiser, J. 2000b. Rift over biodiversity divides ecologists. Science 289: 1282-1283.
Kareiva, P.S., and B. Klepetka. 1994. Modeling population viability for the desert tortoise in the western Mojave Desert. Ecological Applications 4:446-460.
Kareiva, P.S., S. Andelman, D. Doak, B. Elderd, M. Groom, J. Hoekstra, L. Hood, F. James, J. Lamoreux, G. LeBuhn, C. McCulloch, J. Regetz, L. Savage, M. Ruckelshaus, D. Skelly, H. Wilbur, and K. Zamudio. 1999. Using science in Habitat Conservation Plans. National Center for Ecological Analysis and Synthesis, Santa Barbara, CA, and American Institute of Biological Sciences, Washington, DC. 97 pp.
Kazura, J.W., and M.J. Bockarie. 2003. Lymphatic filariasis in Papua New Guinea: Interdisciplinary research on a national health problem. Trends in Parasitology 19: 260-263.
Kleiman, D.G., and J.J.C. Mallinson. 1998. Recovery and management committees for lion tamarins: Partnerships in conservation planning and implementation. Conservation Biology 12: 27-38.
Kock, M.D. 1996. Wildlife, people and development: veterinary contributions to wildlife health and resource management in Africa. Tropical Animal Health and Production 28: 68-80.
Krebs, C.J. 1994. Ecology: The Experimental Analysis of Distribution and Abundance. HarperCollins, New York.
Krzysik, A.J. 1998. Desert tortoise populations in the Mojave Desert and a half-century of military training activities. Pp. 61-73 in J. Van Abbema (ed.) Proceedings: conservation, restoration, and management of tortoises and turtles-an international conference. New York Turtle and Tortoise Society, New York.

DTRPAC Report page 247
Lamb, T., J.C. Avise, J.W. Gibbons. 1989. Phylogeographic patterns in mitochondrial DNA of the desert tortoise (Xerobates agassizii), and evolutionary relationships among North American gopher tortoises. Evolution 43: 76-87.
Lamb, T., and C. Lydehard. 1994. A molecular phylogeny of the gopher tortoises, with comments on familiar relationships within the Testudinoidea. Molecular Phylogenetics and Evolution 3: 283-91.
Lamb, T., and A.M. McLuckie. 2002. Genetic differences among geographic races of the desert tortoise. Pages 67-85 in T.R. Van Devender (ed.), The Sonoran Desert Tortoise: Natural History, Biology, and Conservation. Univ. Arizona, Tucson.
Lawler, J.J., S.P. Campbell, A.D. Guerry, M.B. Kolozsvary, R.J. O’Connor, and L.C.N. Seward. 2002. The scope and treatment of threats in endangered species recovery plans. Ecological Applications 12:663-667.
Lederle, P.E., K.R. Rautenstrauch, D.L. Rakestraw, K.K. Zander, and J.L. Boone. 1997. Upper respiratory tract disease and mycoplasmosis in desert tortoises from Nevada. Journal of Wildlife Diseases 33:759-765.
Levine, N. 2002. CrimeStat: A Spatial Statistics Program for the Analysis of Crime Incident Locations (v 2.0). Ned Levine & Associates, Houston, TX, and the National Institute of Justice, Washington, DC.
Levins R.., and D. Culver. 1971. Regional coexistence of species and competition between rare species. Proceedings of the National Academy of Sciences 68:1246-1248.
Levin S.A., D. Cohen, A. Hastings. 1984. Dispersal strategies in patchy environments. Theoretical Population Biology 26:165-191.
Link, W.A., and J.S. Hatfield. 1990. Power calculations and model selection for trend analysis - a comment. Ecology 71: 1217-1220.
Lohoefener, R., and L. Lohoefener. 1986. Experiments with gopher tortoise (Gopherus polyphemus ) relocation in Southern Mississippi. Herpetological Review 17: 37-40.
Lovich, J.E., and D. Bainbridge. 1999. Anthropogenic degradation of the Southern California desert ecosystem and prospects for natural recovery and restoration. Environmental Management 24: 309-326.
Lundquist, C.J., J.M. Dieh, E. Harvey, and L.W. Botsford. 2002. Factors affecting implementation of recovery plans. Ecological Applications 12:713-718.
MacDonald, L.L., and W.P. Erickson. 1994. Testing for bioequivalence in field studies: Has a disturbed site been adequately reclaimed? Pp 183-197 In D.J. Fletcher and B.F.J. Manly (eds.) Statistics in Ecology and Environmental Monitoring, Otago Conference Series No. 2, University of Otago Press, Dunedin, New Zealand.

DTRPAC Report page 248
MacKenzie, D.I., J.D. Nichols, G.B. Lachman, S. Droege, J.A. Royle, and C.A. Langtimm. 2002. Estimating site occupancy rates when detection probabilities are less than one. Ecology 83: 2248-2255.
MacKenzie, D.I., J.D. Nichols, J.E. Hines, M.G. Knutson, and A.B. Franklin. 2003. Estimating site occupancy, colonization, and local extinction when a species is detected imperfectly. Ecology 84: 2200-2207.
Manly, B.J.F. 1992. The Design and Analysis of Research Studies. Cambridge University Press, Cambridge.
Manly, B.F.J., L.L. MacDonald, D.L. Thomas, T.L. McDonald, and W.P. Erickson. 2002. Resource Selection by Animals, 2nd edn. Kluwer Academic Publishers, Dordrecht, the Netherlands.
Manly, B.F.J., L.L. MacDonald, and G.W. Garner. 1996. Maximum likelihood estimation for the double-count method with independent observers. Journal of Agricultural, Biological, and Environmental Statistics 1:170-189.
Maruyama, G.M. 1997. Basics of structural equation modeling. Thousand Oaks, CA: Sage.
McCawley, J., and D. Sheridan. 1972. A second report on the survival and movements of the desert tortoises released in the Orocopia mountains of the Colorado desert. University of California Polytechnic, Pomona, California.
McLaughlin, G.S. 1997. Upper respiratory disease in gopher tortoises, Gopherus polyphemus: pathology, immune responses, transmission, and implications for conservation and management. Ph.D. Dissertation, University of Florida, Gainesville, FL.
McLuckie, A.M., T. Lamb, C.R. Schwalbe, and R.D. McCord. 1999. Genetic and morphometric assessment of an unusual tortoise (Gopherus agassizii) population in the Black Mountains of Arizona. Journal of Herpetology 33: 36-44.
McLuckie, A. M., D.L. Harstad, J.W. Marr, and R.A. Fridell. 2002. Regional desert tortoise monitoring in the Upper Virgin River Recovery Unit, Washington County, Utah. Chelonian Conservation and Biology 4: 380
Medica, P.A. 1992. Desert tortoise population trends in Nevada 1990-1992. Report to Bureau of Land Management. 10pp.
Merriam -Webster (eds.). 1983. Merriam-Webster's Collegiate Dictionary. Merriam-Webster, Inc.
Metzger, N., and R.N. Zare. 1999. Interdisciplinary research: From belief to reality. Science 283: 642-643.
Miller, A. 1993. The role of analytical science in natural resource decision-making. Environmental Management 17: 563-574.
Minden, R.L., and S.M. Keller. undated (1981). Population analysis of the desert tortoise (Gopherus agassizii) on the Beaver Dam Slope, Washington County, Utah. Utah Division of Wildlife Resources Publication Number 81-14, Salt Lake City, Utah.

DTRPAC Report page 249
Morafka, D.J., and K.H. Berry. 2002. Is Gopherus agassizii a desert-adapted tortoise, or an exaptive opportunist?: implications for tortoise conservation. Chelonian Conservation and Biology 4: 263-287.
Moritz, C. 1994. Applications of mitochondrial DNA analysis in conservation: A critical review. Molecular Ecology 3:401-11.
Moritz, C. 2002. Strategies to protect biological diversity and the evolutionary processes that sustain it. Systematic Biology 51: 238-254.
Mushinsky, H.R., D.S. Wilson, and E.D. McCoy. 1994. Growth and sexual dimorphism of Gopherus polyphemus in central Florida: Herpetologica. 50: 119–128.
Nagy, K.A., B.T. Henen, D.B. Vyas, and I.R. Wallis. 2002. A condition index for the desert tortoise (Gopherus agassizii). Chelonian Conservation and Biology 4:425-429.
Nammack, M. 1998. National Marine Fisheries Service and the evolutionary significant unit: Implications for management of freshwater mussels. Journal of Shellfish Research 17: 1415-1418.
National Marine Fisheries Service. 2000. Conservation of Columbia Basin fish: all-H paper. U.S. Department of Commerce, National Oceanic and Atmospheric Administration, National Marine Fisheries Service, in consultation with the Federal Caucus, Portland, Oregon. 3 vol.
Nicastri, E., E. Girardi, and G. Ippolito. 2001. Determinants of emerging and re-emerging infectious diseases. Journal of Biological Regulators and Homeostatic Agents 15: 212-217.
Nickolai, J.L., and R.A. Fridell. 1998. Status of the desert tortoise population on the Woodbury-Hardy monitoring plot, Beaver Dam Slope, 1998. Utah Division of Wildlife Resources Publication Number 98-24, Salt Lake City, Utah.
Nussear, K.E. 2004. Mechanistic investigation of the distributional limits of the desert tortoise, Gopherus agassizii. Dissertation. University of Nevada, Reno.
Nussear, K.E., C.R. Tracy, P.A. Medica, M.B. Saethre, R.W. Marlow, and P.S. Corn. 2000. Translocation as a tool for conservation of the desert tortoise: Nevada studies. The Proceedings of the Desert Tortoise Council Symposium 2000:26-30.
Oftedal, O. T., S. Hillard, and D.J. Morafka. 2002. Selective spring foraging by juvenile desert tortoises (Gopherus agassizii) in the Mojave Desert: Evidence of an adaptive nutritional strategy. Chelonian Conservation and Biology.4: 341-352.
Opdam, P. 1988. Populations in fragmented landscape. In K. F. Schreiber (ed.). Connectivity in Landscape Ecology. Proceedings of the 2nd International Seminar of the International Association for Landscape Ecology. Geografische Arbeiten 29: 75-77.
Overton, W.C. 1971. Estimating the numbers of animals in wildlife populations. in R.H. Giles (ed.), Wildlife Management Techniques. The Wildlife Society, Washington, D.C. pp. 403-456.
Pedrono, M., and A. Sarovy. 2000. Trial release of the world's rarest tortoise Geochelone yniphora in Madagascar. Biological Conservation 95: 333-342.

DTRPAC Report page 250
Pennock, D.S., and W.W. Dimmick. 1997. Critique of the evolutionary significant unit as a definition for “distinct population segments” under the U.S. Endangered Species Act. Conservation Biology 11: 911-619.
Peterson, C. C. 1994. Different rates and causes of high mortality in two populations of the threatened desert tortoise, Gopherus agassizii. Biological Conservation 70: 101-8.
Peterson, C.C. 1996a. Anhomeostasis: Seasonal water and solute relations in two populations of the desert tortoise (Gopherus agassizii) during chronic drought. Physiological Zoology 69: 1324-1358.
Peterson, C.C. 1996b. Ecological energetics of the desert tortoise (Gopherus agassizii): effects of rainfall and drought. Ecology 77: 1831-1844.
Petraitis P.S., A.E. Dunham, P.H. Niewiarowski. 1996. Inferring multiple causality: The limitations of path analysis. Functional Ecology 10: 421-431.
Pettan-Brewer, K.C.B., M.L. Drew, E. Ramsay, F.C. Mohr, and L.J. Lowenstine. 1996. Herpesvirus particles associated with oral and respiratory lesions in a California desert tortoise (Gopherus agassizii). Journal of Wildlife Diseases 32: 521-526.
Pilz, K.M., H.G. Smith, M.I. Sandell, and H. Schwabl. 2003. Interfemale variation in egg yolk androgen allocation in the European starling: do high-quality females invest more? Animal Behavior 65:841-850.
Platenberg, R. J., and R.A. Griffiths, R. A. 1999. Translocation of slow-worms (Anguis fragilis) as a mitigation strategy: a case study from south-east England. Biological Conservation 90: 125-32.
Rabatsky, A., and B. Blihovde. 2002. Gopher tortoise die-off at Rock Springs Run State Reserve, Lake County, Florida. Florida Scientist 65: 27.
Rainboth, W.J., D.G. Booth, and F.B. Turner. 1989. Allozyme variation in Mojave populations of the desert tortoise. Copeia 1989: 115-123.
Redlands Institute. 2002a. Summary of Desert Tortoise Recovery Actions: Eastern Colorado Recovery Unit. Unpublished report to Desert Managers Group, Barstow, CA. 28pp.
Redlands Institute. 2002b. Summary of Desert Tortoise Recovery Actions: Eastern Mojave Recovery Unit. Unpublished report to Desert Managers Group, Barstow, CA. 37pp.
Redlands Institute. 2002c. Summary of Desert Tortoise Recovery Actions: Northern Colorado Recovery Unit. Unpublished report to Desert Managers Group, Barstow, CA. 21pp.
Redlands Institute. 2002d. Summary of Desert Tortoise Recovery Actions: Northern Mojave Recovery Unit. Unpublished report to Desert Managers Group, Barstow, CA. 47pp.
Redlands Institute. 2002e. Summary of Desert Tortoise Recovery Actions: Upper Virgin River Recovery Unit. Unpublished report to Desert Managers Group, Barstow, CA. 22pp.
Redlands Institute. 2002f. Summary of Desert Tortoise Recovery Actions: Western Mojave Recovery Unit. Unpublished report to Desert Managers Group, Barstow, CA. 65pp.

DTRPAC Report page 251
Ricklefs, R.E., and G.L. Miller. 1999. Ecology. W.H. Freeman and Company, New York.
Reinert, H.K. 1991. Translocation as a conservation strategy for amphibians and reptiles: Some comments, concerns, and observations. Herpetologica 47: 357-363.
Romesburg, H.C. 1991. On improving the natural resources and environmental sciences. Journal of Wildlife Management 55: 744-756.
Roosenburg, W.M., and K.C. Kelley. 1996. The effect of egg size and incubation temperature on growth in the turtle, Malaclemys terrapin. Journal of Herpetology 30: 198-204.
Rose, F.L., J. Koke, R. Koehn, and D. Smith. 2001. Identification of the etiological agent for necrotizing scale disease in the Texas tortoise. Journal of Wildlife Diseases 37: 223-228.
Ross, P.S. 2002. The role of immunotoxic environmental contaminants in facilitating the emergence of infectious diseases in marine mammals. Human and Ecological Risk Assessment 8: 277-292.
Rourke, J.W., C. Hillier, J. Merriam, and T.A. Duck. undated (1993). Desert tortoise population on the Littlefield study plot, 1993. Bureau of Land Management, Arizona Strip District, St. George, Utah.
Ryder, O.A. 1986. Species conservation and systematics: the dilemma of subspecies. Trends in Ecology and Evolution 1: 9-10.
S.A.I.C. 1993. American Honda desert tortoise relocation project. Science Applications International Corporation, Santa Barbara, CA.
Sall, J. 1990. Leverage plots for General Linear Hypotheses. American Statistician. 44: 308-315.
Savitz, D.A., C. Poole, and W.C. Miller. 1999. Reassessing the role of epidemiology in public health. American Journal of Public Health 89: 1158-1161.
Schemske, D.W., B.C. Hubbard, M.H. Ruckelshaus, C. Goodwillie, I.M. Parker, and J.G. Bishop. 1994. Evaluating approaches to the conservation of rare and endangered plants. Ecology 75: 584-606.
Schumacher, I.M., D.B. Henderson, M.B. Brown, E.R. Jacobson, and P.A. Klein. 1997. Relationship between clinical signs of upper respiratory tract disease and antibodies to Mycoplasma agassizii in desert tortoises from Nevada. Journal of Wildlife Diseases 33: 261-266.
Schumacher, I.M., D.C. Rostal, R. Yates, D.R. Brown, E.R. Jacobson, and P.A. Klein. 1999. Transfer and persistence of maternal antibodies against Mycoplasma agassizii in desert tortoise (Gopherus agassizii) hatchlings. American Journal of Veterinary Research 60: 826-831.
Seigel, R.A., R.B. Smith, and N.A. Seigel. 2003. Swine flu or 1918 pandemic? Upper respiratory tract disease and sudden mortality of gopher tortoises (Gopherus polyphemus) on a protected habitat in Florida. Journal of Herpetology 37: 137-144.
Sharifi, M.R., A.C. Gibson, and P.W. Rundel. 1997. Surface dust impacts on gas exchange in Mojave Desert shrubs. Journal of Applied Ecology 34: 837-846.

DTRPAC Report page 252
Shrader-Frechette, K.S., and E.D. McCoy. 1994a. Ecology and environmental problem solving. Environmental Professional 16: 342-348.
Shrader-Frechette, K.S., and E.D. McCoy. 1994b. What ecology can do for environmental management. Journal of Environmental Management 41: 293-307.
Simberloff, D. 1998. Flagships, umbrellas, and keystones: is single-species management passé in the landscape era? Biological Conservation 83: 247-257.
Smith F.A., J.H. Brown, T.J. Valone. 1997. Path analysis: A critical evaluation using long-term experimental data. American Naturalist 149: 29-42.
Smith, R.B., R.A. Seigel, and K.R. Smith. 1998. Occurrence of upper respiratory tract disease in gopher tortoise populations in Florida and Mississippi. Journal of Herpetology 32: 426-430.
Sockman, K.W., and H. Schwabl. 2000. Yolk androgens reduce offspring survival. Proceedings of the Royal Society of Biological Sciences Series B 267:1451-1456.
Spidle, A.P., S.T. Kalinowski, B.A. Lubinski, D.L. Perkins, K.F. Beland, J.F. Kocik, and T.L. King. 2003. Population structure of Atlantic salmon in Maine with reference to populations from Atlantic Canada. Transactions of the American Fisheries Society 132: 196-209.
Swinton, J.A. 1999. Dictionary of Epidemiology. Welcome Centre for Epidemiology of Infectious Diseases. Cambridge University, Cambridge, UK.
Tanner, J.T. 1978. Guide to the Study of Animal Populations. University of Tennessee Press, Knoxville.
Tasse, J. 1989. Translocation as a strategy for preserving endangered species. Endangered species update 6: 6.
Tear, T.H., J.M. Scott, P.H. Hayward, and B. Griffith. 1993. Status and prospects for success of the Endangered Species Act: A look at recovery plans. Science 262: 976-977.
Turner, F.B., and K.H. Berry. 1984. Methods used in analyzing desert tortoise populations. Appendix 3 in K.H. Berry (ed.), The status of the desert tortoise (Gopherus agassizii) in the United States. Desert Tortoise Council, Long Beach, CA. Unpublished report to U.S. Fish and Wildlife Service on Order No. 11310-0083-81.
Turner, F.B., and K.H. Berry. 1985. Population ecology of the desert tortoise at Goffs, California, in 1984. Ann. Rept, to Southern California Edison Co., Res. and Dev. Series Rept. 85-RD-63. Rosemead, California.
Turner, F.B., K.H. Berry, D.C. Randall, and G.C. White. 1987. Population ecology of the desert tortoise at Goffs, California, in 1983-1986. Ann. Rept, to Southern California Edison Co., Res. and Dev. Series Rept. Rosemead, California. 101pp.
Turner, F.B., P. Hayden, B.L. Burge, and J.B. Robertson. 1986. Egg production by the desert tortoise (Gopherus agassizii) in California. Herpetologica 42: 93-104.

DTRPAC Report page 253
Turner, F.B., P.A. Medica, and C.L. Lyons. 1984. Reproduction and survival of the desert tortoise (Scaptochelys agassizii) in Ivanpah Valley, California. Copeia 4: 811-820.
Underwood, A.J. 1997. Experiments in Ecology. Their Logical Design and Interpretation Using Analysis of Variance. Cambridge University Press, Cambridge.
U.S. Court of Appeals, Ninth Circuit. 2003. National Association of Home Builders v. Norton. Opinion No. 02-15212 D.C. No. CV 00-0903 SRB.
U.S. Fish and Wildlife Service. 1990. Endangered and threatened wildlife and plants; determination of threatened status for the Mojave population of the desert tortoise. Federal Register 55:12178-12191.
U. S. Fish and Wildlife Service. 1994. Desert tortoise (Mojave population) Recovery Plan. U.S. Fish and Wildlife Service, Portland, OR. 74 pgs plus appendices.
U.S. Fish and Wildlife Service. 1996. Policy regarding the recognition of distinct vertebrate population segments under the Endangered Species Act. Federal Register 61:4722-4725.
U.S. Fish and Wildlife Service. 2003. Endangered and threatened wildlife and plants; final rule to remove the Douglas County Distinct Population Segment of Columbian white-tailed deer from the Federal list of endangered and threatened wildlife. Federal Register 68:43647-43659.
U.S. Fish and Wildlife Service and National Marine Fisheries Service. 1996. Policy regarding the recognition of distinct vertebrate population segments under the Endangered Species Act. Federal Register 61:4722-4725.
U.S. Fish and Wildlife Service and National Oceanic and Atmospheric Administration. 1994. Draft policy regarding the recognition of distinct vertebrate population segments under the Endangered Species Act. Federal Register 59:65885-65887.
U.S. General Accounting Office. 2002. Endangered species: research strategy and long-term monitoring needed for the Mojave desert tortoise recovery program. GAO-03-23. Washington, DC. 53 pp.
Van Devender, T.R. 2002a. Natural History of the Sonoran tortoise in Arizona: life in a rock pile. pp.3-28 In: Van Devender, T.R. (ed.). The Biology of the Sonoran Desert Tortoise: Natural History, Biology, and Conservation. The University of Arizona Press and the Arizona-Sonora Desert Museum, Tucson.
Van Devender, T. R. 2002b. Cenozoic environments and the evolution of the gopher tortoises (genus Gopherus). pp. 29-51 In Van Devender, T.R. (ed.). The Biology of the Sonoran Desert Tortoise: Natural History, Biology, and Conservation The University of Arizona Press and the Arizona-Sonora Desert Museum, Tucson, Arizona
Vasek, F.C. 1983. Plant succession in the Mojave Desert. Crossosoma 9: 1-23.
von Seckendorff Hoff, K., and R. W. Marlow. 2002. Impacts of vehicle road traffic on desert tortoise populations with consideration of conservation of tortoise habitat in southern Nevada. Chelonian Conservation and Biology 4: 449-456.

DTRPAC Report page 254
Walker, M., and P. Woodman. 2002. Desert tortoise population survey at Beaver Dam Slope exclosure desert tortoise study plot; spring, 2001. Report to Arizona Game and Fish Department, Phoenix, AZ.
Wallace, R.B. 2001. Bridging epidemiology and demography – theories and themes. Annals of the New York Academy of Sciences 954: 63-75.
Wallis, I.R., B.T. Henen, and K.A. Nagy. 1999. Egg size and annual egg production by female desert tortoises (Gopherus agassizii): the importance of food abundance, body size, and date of egg shelling. Journal of Herpetology 33: 394-408.
Waples, R.S. 1991. Pacific salmon, Oncorhynchus ssp., and the definition of “species” under the Endangered Species Act. Marine Fisheries Review 53: 11-22.
Wasserburg, G., Z. Abramsky, G. Anders et al. 2002. The ecology of cutaneous leishmaniasis in Nizzana, Israel: Infection patterns in the reservoir host, and epidemiological implications. International Journal for Parasitology 32: 133-149.
Weinstein, M. N., and K. H. Berry. 1987. Morphometric analysis of desert tortoise populations. Report CA950-CT7-003, Bureau of Land Management, 39 pp.
Westhouse, R.K., E.R. Jacobson, R.A. Harris, K.R. Winter, and B.L. Homer. 1996. Respiratory and pharyngo-esophageal iridovirus infection in a gopher tortoise (Gopherus polyphemus). Journal of Wildlife Diseases 32: 682-686.
Wilson, D.S., D.J. Morafka, C.R. Tracy, and K.A. Nagy. 1999. Winter activity of juvenile desert tortoises. Journal of Herpetology. 33: 496-50.
Woodbury, A.M., and R. Hardy. 1948. Studies of the desert tortoise, Gopherus agassizii. Ecological Monographs 18:146-200.
Woodman, P., P. Wood, and S. Topham. 1999. Desert tortoise population survey at Littlefield desert tortoise study plot, spring, 1998. Report to Arizona Game and Fish Department, Phoenix, AZ.
Woodroffe, R. 1999. Managing disease threats to wildlife. Animal Conservation 2: 185-193.
Wootton, J.T. 1994. Predicting direct and indirect effects - an integrated approach using experiments and path analysis. Ecology 75: 151-165.
Young, R., C. Halley, and P. Woodman. 2002. Desert tortoise population survey at Littlefield desert tortoise study plot, spring, 2002. Report to Arizona Game and Fish Department, Phoenix, AZ.
Zimmerman, L.C., M.P. O’Connor, S.J. Bulova, J.R. Spotila, S.J. Kemp, and C.J. Salice. 1994. Thermal ecology of desert tortoises in the eastern Mojave Desert: Seasonal patterns of operative and body temperatures, and microhabitat utilization. Herpetological Monographs 8: 45-59.