design and development of pulse jet minimum quantity
TRANSCRIPT

DESIGN AND DEVELOPMENT OF PULSE JET MINIMUM QUANTITY LUBRICANT (MQL)
APPLICATOR AND ITS EFFECT ON SURFACE MILLING OF HARDENED AISI 4140 STEEL
By
Mahmood Al Bashir
A Thesis Submitted to the
Department of Industrial & Production Engineering in Partial Fulfilment of the
Requirements for the Degree of
M.Sc. in Industrial and Production Engineering
DEPARTMENT OF INDUSTRIAL & PRODUCTION ENGINEERING BANGLADESH UNIVERSITY OF ENGINEERING & TECHNOLOGY
DHAKA, BANGLADESH
December 2014
ii
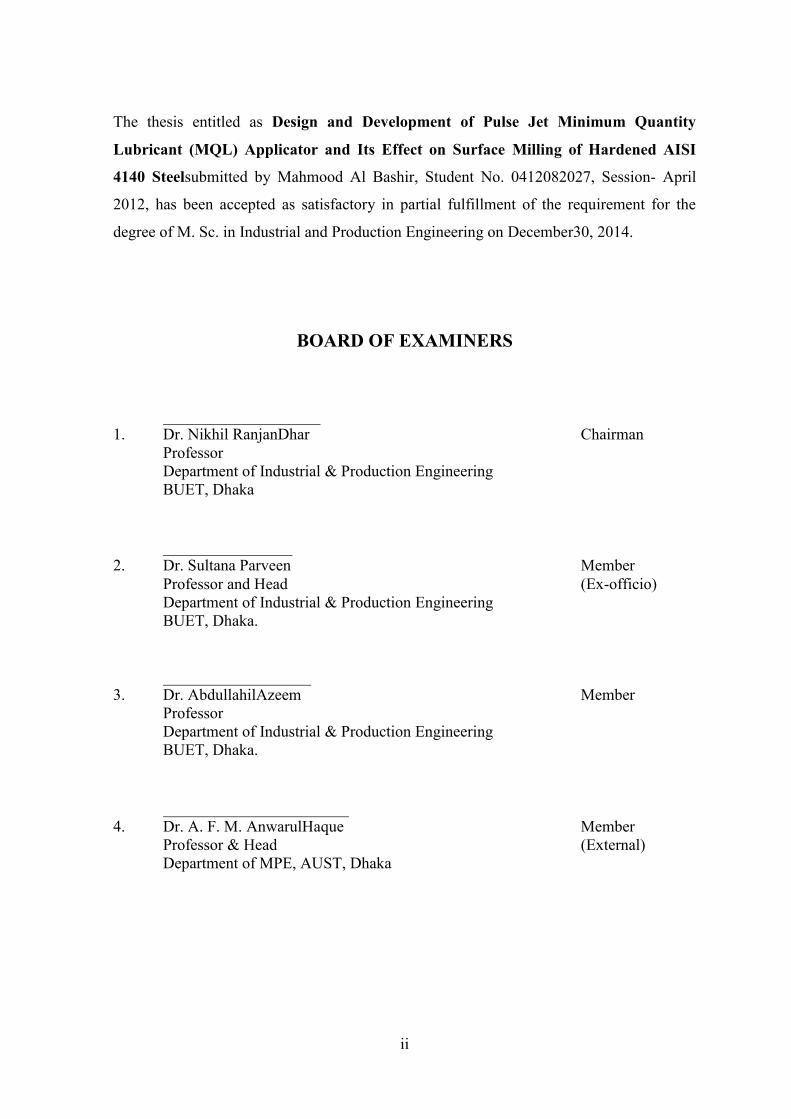
The thesis entitled as Design and Development of Pulse Jet Minimum Quantity
Lubricant (MQL) Applicator and Its Effect on Surface Milling of Hardened AISI
4140 Steelsubmitted by Mahmood Al Bashir, Student No. 0412082027, Session- April
2012, has been accepted as satisfactory in partial fulfillment of the requirement for the
degree of M. Sc. in Industrial and Production Engineering on December30, 2014.
BOARD OF EXAMINERS
1. Dr. Nikhil RanjanDhar Chairman Professor
Department of Industrial & Production Engineering BUET, Dhaka
2. Dr. Sultana Parveen Member Professor and Head
Department of Industrial & Production Engineering BUET, Dhaka.
(Ex-officio)
3. Dr. AbdullahilAzeem Member Professor
Department of Industrial & Production Engineering BUET, Dhaka.
4. Dr. A. F. M. AnwarulHaque Member Professor & Head
Department of MPE, AUST, Dhaka (External)

iii
Declaration
It is hereby declared that this thesis or any part of it has not been submitted elsewhere for
the award of any degree or diploma.
Mahmood Al Bashir

iv
This work is dedicated to my Loving Parents
Dr. Md. Bashir Uddin
and Mrs. MahbubaShirin

v
ACKNOWLEDGEMENT
I express my gratitude to my respected supervisor, Dr. Nikhil RanjanDhar,
Professor, Department of Industrial and Production Engineering, BUET for his profound
knowledge, timely advice, ceaseless support, thoughtful guidance, continuous inspiration,
motivation, encouragement and valuable suggestions to complete this work successfully.
I would like to express my gratitude and thanks to the board of examiners Dr.
Sultana Parveen, Professor, Department of Industrial & Production Engineering, BUET,
Dr. AbdullahilAzeem, Professor, Department of Industrial & Production Engineering,
BUET for their valuable suggestions and guidance.
I acknowledge the help rendered by the Director, DAERS, BUET who provided
machine shop facilities whenever required.
My special thanks and appreciation to all my colleagues of the Department of
Mechanical and Production Engineering,Ahsanullah University of Engineering and
Technology, for their help, encouragement and support at various occasions. A special
word of thanks are due to all the staff members of Central Machine Shop and Machine
Tools Lab who have helped a lot whenever required, especially Manik Chandra Roy, M.
A. Razzak, S. C. Das and T. G. Gomesfor their helps in conducting the experimental
work. I also like to thank Philip Halder of sheet metal lab for his support during the
development of the MQL system. I am especially thankful to M. A. Karim of Central
Machine Shop for his assistance throughout the experimentation.
My family has always been an important source of support. I devote my deepest
gratitude to my parents for their love and support throughout my life. Lastly, I offer my
thanks to all of those who supported me in any respect during the research work.

vi
ABSTRACT
Modern manufacturing industries are seeking different alternatives to attain the
need of higher machining speeds, lower wastage and a better product quality as well as
reducing the cost of the manufacturing process.An approach to this problem is considering
high speed machining but high speed machining at high speeds and feeds generates large
heat and high cutting temperature, which shortens the tool life and deteriorates the job
quality. To reduce this high temperature machining of hardened medium carbon steelneeds
large quantities of cutting fluid to be applied which not only incur expenses but also can
cause grave environmental and health hazards. Dry machining might be an alternative in
this context and is totally free from the problems associated with cutting fluid but is
difficult to implement on the existing shop floor as it needs ultra-hard cutting tools and
extremely rigid machine tools. The manufacturing industries hence are looking to mitigate
these problems by experimental investigations and by adoption of advanced techniques
such as cryogenic cooling, high-pressure coolant, and minimum quantity lubricant (MQL)
application. Among these, Minimal Quantity Lubrication machining is found to be quite
effective in improving tool life and surface finish.
In this research work surface milling of AISI 4140 steel (40 HRC)was
investigated with pulsed jet Minimum Quantity Lubricant (MQL) applicator using straight
oil as the cutting fluid. The investigation was carried upon comparing the performance of
MQL applicator on the basis of tool wear, cutting force, and surface finish. The effects of
different cutting parameters were compared at different combinations of feed, depth of cut
and cutting conditions. A pulsed jet MQL applicator was designed and developed with the
help of full factorial analysis (Design of Experiment) and it was ensured that the cutting
fluid can be applied in different timed pulses and quantities at critical zones during surface
milling.An investigative comparison with dry milling under same conditions has been
done to evaluate the relative performance of hard milling with MQL applicator. It was
observed that the MQL applicator system for surface milling on hardened steel can bring
forth better performance when compared to dry milling.

vii
LIST OF TABLES Table 2.1 : Most severe variables that effects performance of the MQL applicator 31 Table 2.2 : F-value and P-value of the parameters from ANOVA analysis 32 Table 2.3 : Selected parameters for final design of pulsed jet MQL applicator 33
Table 3.1 : Chemical composition of the work material 37
Table 3.2 : Experimental conditions 40
Table 4.1 : Reduction in surface roughness due to dry and MQL cooling in
milling AISI4140 hardened steel
61
Table 4.2 : Reduction in cutting force due to dry and MQL cooling in milling
AISI4140 hardened steel
63

viii
LIST OF FIGURES Fig. 2.1 : Commonly used DOE method 30 Fig. 2.2 : Interaction effects between A & D and A & C 32
Fig. 2.3 : Schematic view of Pulsed Jet MQL Applicator 34 Fig. 2.4 : Photographic view of the Pulsed Jet MQL Applicator 34
Fig. 2.5 : Repeatability check of the MQL applicator for different flow rates 35
Fig. 2.6 : Schematic view of spray pattern of the cutting fluid 36
Fig. 2.7 : Photographic view of spray pattern of the cutting fluid 36
Fig. 2.8 : CAD view of the nozzle injector 36
Fig. 2.9 : Sectional view of nozzle injector 36
Fig. 2.10 : Photographic view of nozzle injector during milling process 36
Fig. 3.1 : Photographic view of AISI4140 hardened steel 37
Fig. 3.2 : Schematic view of four flute end milling cutter 39
Fig. 3.3 : Photographic view of four flute end milling cutter 39
Fig. 3.4 : Variation of surface roughness with that of cutting velocity at 22
mm/min table feed under dry and MQL with different flowrates.
42
Fig. 3.5 : Variation of surface roughness with that of cutting velocity at 34
mm/min table feed under dry and MQL with different flowrates.
42
Fig. 3.6 : Variation of surface roughness with that of cutting velocity at 44
mm/min table feed under dry and MQL with different flowrates.
43
Fig. 3.7 : Variation of surface roughness with that of cutting velocity at 68
mm/min table feed under dry and MQL with different flowrates.
43
Fig. 3.8 : Variation of surface roughness with that of feed rate at 12 m/min
cutting velocity under dry and MQL with different flowrates.
44
Fig. 3.9 : Variation of surface roughness with that of feed rate at 16 m/min
cutting velocity under dry and MQL with different flowrates.
44
Fig. 3.10 : Variation of surface roughness with that of feed rate at 22 m/min
cutting velocity under dry and MQL with different flowrates.
45
Fig. 3.11 : Variation of surface roughness with that of feed rate at 27 m/min
cutting velocity under dry and MQL with different flowrates.
45
Fig. 3.12 : Variation of surface roughness with that of feed rate at 32 m/min
cutting velocity under dry and MQL with different flowrates.
46

ix
Fig. 3.13 : Variation of surface roughness with time at 32 m/min cutting velocity
and 68 mm/min table feed rate under dry and MQL.
46
Fig. 3.14 : Variation of cutting force with that of cutting velocity at 22mm/min
table feed rate under dry and MQL with different flowrates.
47
Fig. 3.15 : Variation of cutting force with that of cutting velocity at 34mm/min
table feed rate under dry and MQL with different flowrates.
48
Fig. 3.16 : Variation of cutting force with that of cutting velocity at 44mm/min
table feed rate under dry and MQL with different flowrates.
48
Fig. 3.17 : Variation of cutting force with that of cutting velocity at 68mm/min
table feed rate under dry and MQL with different flowrates.
49
Fig. 3.18 : Variation of cutting force with that of feed rate at 12m/min cutting
velocity under dry and MQL with different flowrates.
49
Fig. 3.19 : Variation of cutting force with that of feed rate at 16m/min cutting
velocity under dry and MQL with different flowrates.
50
Fig. 3.20 : Variation of cutting force with that of feed rate at 22m/min cutting
velocity under dry and MQL with different flowrates.
50
Fig. 3.21 : Variation of cutting force with that of feed rate at 27m/min cutting
velocity under dry and MQL with different flowrates.
51
Fig. 3.22 : Variation of cutting force with that of feed rate at 32m/min cutting
velocity under dry and MQL with different flowrates.
51
Fig. 3.23 : Variation of cutting force with time at 12m/min cutting velocity and
68 mm/min table feed rate under dry and MQL.
52
Fig.3.24 : Growth of tool wear with time at 32m/min cutting velocity and 68 mm/min table feed rate under dry and MQL with different flowrates.
53
Fig.3.25 : Variation of flank wear with that of cutting force at 32m/min cutting velocityand 68 mm/min table feed rate under dry and MQL with different flowrates.
53
Fig.3.26 : Variation of surface roughness with that of feed rate and cutting
velocityunder dry condition.
54
Fig.3.27 : Variation of surface roughness with that of feed rate and cutting
velocityunder 50 ml/hr MQLcondition.
54
Fig.3.28 : Variation of surface roughness with that of feed rate and cutting
velocityunder 75 ml/hr MQLcondition.
55

x
Fig.3.29 : Variation of surface roughness with that of feed rate and cutting
velocityunder 100 ml/hr MQLcondition.
55
Fig.3.30 : Variation of surface roughness with that of feed rate and cutting
velocityunder 150 ml/hr MQLcondition.
56
Fig.3.31 : Variation of surface roughness with that of feed rate and cutting
velocityunder 200 ml/hr MQLcondition.
56
Fig.3.32 : Variation of surface roughness with that of feed rate and cutting
velocityunder dry and MQL with different flowrates.
57

xi
CONTENTS
Acknowledgements............................................................................................. v
Abstract............................................................................................................... vi
List of Tables.......................................................................................................
vii
List of Figures..................................................................................................... x
Chapter 1 Introduction................................................................................. 1 1.1 Introduction……………………………………………………… 1
1.2 Literature Review……….……………………………………….. 3
1.2.1 Cutting Fluid Used in Machining Operation…….……...... 4
1.2.2 Hard Machining.…………………………………….……. 7
1.2.3 Application of MQL in Hard Machining………………… 11
1.3 Design of Experiment (DOE)………………………………........ 20
1.4 Summary of the Review………………………………………… 21
1.5 Objectives of the Present Work ………………………………… 22
1.6 Scope of the Thesis …………………………………………….. 22
Chapter 2 Design and Development of Pulsed Jet Minimum Quantity Lubricant Applicator…………………………………………..
24
2.1 Introduction…………………………………..………………….. 24
2.2 Design of Experiment (DOE) for MQL Applicator...…………… 26
2.3 Full Factorial Analysis for Pulsed Jet MQL Applicator….……... 30
2.4 Fabrication of Pulsed Jet MQL Applicator….…………………... 32
Chapter 3 Experimental Investigations...................................................... 37
3.1 Material Preparation....................................................................... 37
3.2 Selection of Cutting Tool…………………………………….….. 38
3.2 Experimental Procedure and Conditions....................................... 40
3.4 Experimental Results..................................................................... 41
3.4.1 Surface Roughness.............................................................. 41
3.4.2 Cutting Force………………….………………………….. 47
3.4.3 Flank Wear ………………………………………………. 52
Chapter 4 Discussion on Experimental Results…………….…………… 58 4.1 Surface Roughness ….................................................................... 58
4.2 Cutting Force.……………………………..…..……………… 62

xii
4.3 Flank Wear ……..……………….……………….……………… 64
Chapter 5 Conclusions and Recommendations….…................................. 65
5.1 Conclusions…………………...…………………………………. 65
5.2 Recommendations…………...……………………......….……… 66
References........................................................................................................... 67

1
Chapter-1
Introduction
1.1 Introduction
Machining is a process in which a cutting tool is used to remove small chips of
material from the workpiece. To perform the operation, relative motion is required
between the tool and the work. This relative motion is achieved in most machining
operation by means of a primary motion, called "cutting speed" and a secondary motion
called "feed". The shape of the tool and its penetration into the work surface, combined
with these motions, produce the desired shape of the resulting work surface.Machining
plays important role in producing product from different types of material ranging from
soft to hard. Hard materials (45 HRC and harder) include tool steels, mold steels, chilled
and chrome irons, weld overlays and some nickel and cobalt-base superalloys.
Manufacturers use hard materials to extend tool wear life and maintain precision in molds,
gears, tools and dies, aerospace components and processing equipment. Unfortunately, the
characteristics that make hard-material parts perform so effectively that it also make the
materials more difficult to machine. Bringing a hardened part to machine traditionally has
been slow and tool consuming.The traditional approach is to rough and semi finish parts
before hardening via heat treatment if possible, then tediously finish them with round
tools, inserts, grinding or EDM Machining. Parts that begin as hard materials or those
where hardening would affect final precision, require slow processing right from the start.
This process has long been in the common play of the manufacturing industries as no other
alternate and viable solutions were found. Long cycle times, multiple operations and part
setups and excessive work-in-process, all adhered up to increase the manufacturing
costs.The manufacturing industries always seek for alternate solutions that will decrease
the cost of the manufacturing without compromising the quality of the product as well as
the dimensional accuracy. One way to reduce those costs is milling parts in the hardened
state. The moldmaking industry has been a pioneer in hard milling, applying hard yet
tough micro grain carbide cutting tools usually with coatings that increase heat resistance

2
and boost lubricity, CBN, PCBN, Ceramic and diamond tools. Hard milling with carbide
tools typically involves small depth of cut, generating relatively low cutting forces
andusually with coatings that increase heat resistance and boost lubricity. Following these
modern trends in manufacturing are steering the machining processes towards higher
speeds, lower waste and improved product quality. The quality of machined components is
evaluated in respect of how closely they adhere to set product finish and reflective
properties. Dimensional accuracy, tool wear and quality of surface finish are three factors
that manufacturers must be able to control at the machining operations to ensure better
performances and service life of engineering component. In the leading edge of
manufacturing, manufacturers are facing the challenge of higher productivity, quality and
overall economy in the field of manufacturing by machining. To meet the above
challenges in a global environment there is an increasing demand for high material
removal rate (MRR) and also longer life and stability of the cutting tool. Material removal
rates between 150−1500 cm3/min can now be achieved for most materials.Tools and
coatings with hardness up to 9000 HV commercially exist, and the use of Computer
Numerical Control (CNC) machines allows for accuracies down to 10 μm[Byrne et al.
2003].But additional cooling and lubrication of high speed cutting processes is
necessarydue to the high thermal and physical stresses generated during these machining
processeswhich have an impact on the tool life, the quality of the finished workpiece and
the power consumption. In addition, as material is cut a fresh high energy surface is
generated and quickly reacts with the surroundings like oxygen and water in humid air.
The use of cutting fluids provides protection from these reactions, which may negatively
affect the quality of the finished surface.Use of cutting fluid has been a common practice
in manufacturing industries to reduce the heat, facilitate chip removal and lubrication
process. But use of coolants also require additional cost that eventually boosts up the total
manufacturing cost due to cutting fluid’s purchase, usage, storage and disposal. The
increased use of cutting fluids in the traditional machining industries also creates health
hazards for the operators as well as the environment. A number of studies have shown that
the mist that is generated from the use of cutting fluid on the heated surface of the
machined material creates a number of health problems for the operator and people
working in the proximity [Ding and Hong 1998, Thornburg and Leith 2000, Bennett
and Bennett 1987]. Based on these facts an alternate approach to reduce the usage of
cutting fluid has been long in the focus of the industries. A review of the literature

3
connected with the work is presented in this sectionwhich also highlights the latest
developments in the areas related to the present work. The features of hard machining
including cutting fluids in metal machining and machining with Minimum Quantity
Lubricant (MQL) applicator are also presented here.
1.2 Literature Review
Cutting forces, cutting temperature, chip tool interaction, dimensional accuracy,
surface integrity and quality, chip morphology, wear and life of the cutting tool in different
cutting conditions are the main concerns in the research and investigation done so far on
different types of machining operations.While lubrication is necessary in controlling
friction and by consequence the heat generation, more cooling is required in cases where
heat generation considerably affects the machining quality, and where more temperature
control is needed. These high temperatures are due to the fact that nearly all work done in
a machining process is transformed into heat. In a metal cutting operation, the primary heat
source is the result of the plastic deformation work at the shear plane, the boundary
between deformed and undeformed material. The secondary heat source is located at the
tool-chip interface, as a result of the secondary plastic deformation work, as well as
friction. A tertiary heat source could result from friction at the tool flank-workpiece
interface, such as the case of a worn tool edge [Abukhshim et al.2006].In machining
process, the tool removes material from the surface of a less resistant body, through
relative movement and application of force. The material removed called chip slides on the
face of tool submitting it to high normal and shear stresses and moreover to a high
coefficient of friction during chip formation. Most of the mechanical energy used to form
the chip becomes heat, which generates high temperatures in the cutting region. A major
portion of the energy is consumed in the formation and removal of chips. The greater the
energy consumption, the greater the temperature and the frictional force at the tool-chip
interface and consequently the higher is the tool wear. For this reason, conventional
coolant is often used on the cutting tool to prevent overheating. However, the main
problem with conventional coolant is that it does not reach the real cutting area
[Werthem1992]. Moreover because of having high temperature conventional cutting
fluids evaporates before reaching the cutting zone [Dhar and Kamruzzaman 2009].
Hence, heat generated during machining is not removed and is one of the main causes of
the reduction in tool life [Kumar 2002].

4
1.2.1 Cutting Fluid Used in Machining Operation
High temperature in cutting zone has been traditionally tried to be controlled by
using cutting fluids. The coolant effect reduces temperature in cutting zone and the
lubrication action decreases cutting forces. Thus the friction coefficient between tool and
chip becomes lower in comparison to dry machining [Çakıret al. 2004, El Baradie 2007].
The aims of cutting fluid applications were determined as cooling and lubrication in metal
cutting. In addition, cutting fluids can help to disposal of the chips from hole and control
chip formation. Because they decrease contact length between chip and tool, and this
situation has a positive effect on chip breaking. Thus, they can help to achieve better tool
life [Yildizet al. 2007, Stanford et al. 2007]. As cutting fluid is applied during machining
operation, it removes heat by carrying it away from the cutting tool/work-piece interface
[Silliman and Perich 1992]. This cooling effect prevents the tool from exceeding its
critical temperature range beyond which the tool softens and wears rapidly [Bienkowski
1993]. Cutting fluids are used throughout industry in many metal cutting operations and
they are usually classified into three main categories: neat cutting oils, water-soluble fluids
and gases [Diniz and Oliveira 2004]. The three categories of the cutting fluids all have the
generic characteristics required to enhance the cutting process. Yet they possess some
different attributes that are related to their physical estate conditions too. The major needs
in machining are high material removal rate, good work surface finish and low tool wear.
These objectives can be achieved by reducing tool wear using proper cooling system of the
tool during machining. The main objective of using cutting fluids in machining operations
is the reduction of temperature in the cutting region to increase tool life. The cutting fluids
are used in machining operations in order to
reduce friction at the tool-chip and tool work-piece interfaces,
cool both chip and tool, and
remove chip
Furthermore, they have a strong effect on the shearing mechanisms and,
consequently, on the work-part surface finish and tool wear [Diniz et al. 2003, Vikram
and Ramamoorthy 2007]. The positive effect of the use of fluids in metal cutting was
first reported in 1894 by F. Taylor [1906], who noticed that by applying large amounts of
water in the cutting area, the cutting speed could be increased up to 33% without reducing

5
tool life. Since then, cutting fluids have been developed resulting in an extensive range of
products covering most work-piece materials and operations. According to Kress [1997],
the costs associated with the use of cutting fluids represent approximately 17% of the
finished work-piece cost against 4% spent with tooling. Kwon [2000] studied flank wear
by incorporating cutter temperature and physical properties of coating and work materials
and stated use of cutting fluid has a positive impact on flank wear but the flood cooling
method also reduces the effectiveness of the cutting fluid as too little amount of the cutting
fluid reaches the tool workpiece interface.Thus it is recommended that proper amount of
cutting fluid as well as certain attributes of the cutting fluids is also necessary to provide
the required cooling during the machining process.
Proper selection and application of cutting fluid generally improves tool life. At
low cutting speed almost four times longer tool life was obtained by such cutting
fluid[Satoshi et al. 1997] althoughit was observed that the surface finish did not improve
significantly. It has been seen previously that copious amount of cutting fluid in machining
leads to environmental pollution mainly because during machining operations, workers
could be exposed to cutting fluids by skin contact and inhalation because of the mist
created when the cutting fluid comes in contact with the heated surface during the
machining operation[Ding and Hong 1998, Thornburg and Leith 2000, Bennett and
Bennett 1987].Along with that several types of additives and chemical compounds are
used with conventional cutting fluids to increase its cooling and lubrication properties.
Chemical agents such as amines and nitrites are used for corrosion inhibitors, phosphates
and borates for water softening, soaps and wetting agents for lubrication, phosphorus,
chlorine and sulfur compounds for chemical lubrication. Bactericides are added to control
the growth of micro-organisms such as bacteria, algae and fungi [Baradie1996]. These
chemical compounds and the additives which are used cause the techno-environmental
problems [Paul et al. 2001]such as:
Required extra floor space and additional systems for pumping, storage,
filtration, recycling, chilling etc.
Neat oils which are used cause skin disorder and irritation of the hair roots
Dermatitis are caused by bacteria and the biocides which are used to control
the growth of bacteria

6
Asthma, bronchitis, irritation of the respiratory tract, breathing difficulties,
hypersensitivity pneumonitis and lung cancer are caused metalworking fluid
mist and vapor
Irritations of the respiratory tract or flu-like symptoms are caused by
inhalation of bacteria and fungi
The use of unrefined mineral oils is responsible to skin cancer
Water pollution and soil contamination during disposal of cutting fluids
Environmental problems are occurred during dissociation of chemical compounds
at high cutting temperature.
Furthermore, the cost of treating the waste liquid is high and the treatment itself is
a source of air pollution. Skin exposure to cutting fluid can cause various skin diseases
[NIOSH 1998]. In general, skin contact with straight cutting oils cause folliculitis, oil
acne, and keratoses while skin exposure to soluble, semi-synthetic and synthetic cutting
fluid would result in irritant contact dermatitis and allergic contact dermatitis. Another
source of exposure to cutting fluids is by inhalation of mists or aerosols. Airborne
inhalation diseases have been occurring with cutting fluid aerosols exposed workers for
many years. These diseases include lipid pneumonia, hypersensitivity pneumonitis,
asthma, acute airways irritation, chronic bronchitis, and impaired lung function [NIOSH
1998]. In response to these health effects through skin contact or inhalation, the National
Institute for Occupational Safety and Health (NIOSH) has recommended that the
permissible exposure level (PEL) is 0.5 mg/m3 as the metalworking fluid concentration on
the shop floor.Albeit the PEL, in a number of places it has been found that maintaining a
PEL value was not always possible based on a few facts. Hardened materials, for example,
requires a greater amount of cutting fluid, increasing the PEL value and causing
detrimental effect on the environment as well as the humans around the machining
operation. Thus, based on these facts, the manufacturing industries are looking for
alternative solutions. Decreasing the usage of the cutting fluid, usage of cutting fluid with
which the exposure limit of the cutting can be kept under limit, machining without cutting
fluid are few of the solutions that the manufacturing industries are currently seeking for
without affecting the quality and surface integrity of the material to be machined.

7
1.2.2 Hard Machining
Hard machining is a relatively recent technology that can be defined as a
machining operation, using tools with geometrically defined cutting edges, of a work piece
that has hardness values typically in the 45-70HRc range. Hard machining always presents
the challenge of selecting a cutting tool insert that facilitates high-precision machining of
the component, but it presents several advantages when compared with the traditional
methodology based in finish grinding operations after heat treatment of work pieces.
Completely dry cutting has been a common industry practice for the machining of
hardened steel parts. These parts typically exhibit a very high specific cutting energy.
Traditional beliefs indicate that completely dry cutting of them, as compared to flood
cutting, lowers the required cutting force and power on the part of the machine tool as a
result of increased cutting temperature. However, achievable tool life and part finish often
suffer under completely dry condition because of the increase in temperature. Therefore,
the permissible feed and depth of cut have to be restricted. Under these considerations, the
concept of minimum quantity lubrication presents itself as a possible solution for hard
turning in achieving slow tool wear while maintaining cutting forces/power at reasonable
levels, provided that the minimum quantity lubrication parameters can be strategically
tuned.
In the hard turning processes, the high hardness of materials creates large cutting
forces when turned with carbide inserts. For this reason, rigid and precise machine tools
are required to expel any vibration and chatter. Tonshoff et al. [1986] found that the large
negative rake angles (from the edge chamfer) on tools used for hard machining yield large
dynamic thrust forces that require adequate machine rigidity, spindle power, damping
characteristics, and accuracy of motion along the axes of the machine. Bosssom [1990]
found that tools with chamfered edges produced cutting forces twice as large as non-
chamfered tools. Chryssolouris[1982] showed that when machining in a poor stiffness
setup, tools failed quickly due to edge fracture. These needs have led to recent machine
tool designs that improve stiffness and damping by several methods. New machines have
incorporated polymer composite materials in the machine base, reduced the number of
joints in the machine, and developed improved slide ways such as hydrostatic designs
[Sheehy 1997, Devitt 1998]. Advances in the control capabilities have also improved the
accuracy of the machines.

8
Hard turning and grinding both operations are time consuming as well as not very
efficient. So, the ideal case is elimination of all machining operations. But as the market
competition demands for producing parts with certain dimensional accuracy, which was
previously done using grinding processes are now gradually replaced by hard turning if
and only if the hard turning can produce parts with similar dimensional characteristics,
geometric precision, and quality surface. Several studies have investigated the capability of
the process to compete with grinding, and most have concluded that at proper conditions
with a good machine, hard turning can produce dimensional accuracy and surface finishes
acceptable for most applications. Matsumoto et al. [1986] were able to hard turn parts with
surface finish ranging from 0.045-0.197 µm, and surface waviness from 0.775-1.26 µm.
They had determined that requirements for a ball bearing surface were less than 0.2 µm for
Ra surface finish and less than 1.5 µm for waviness. Similar results were found by
Jochmann and Wirtz [1999], who produced consistent peak-to-valley finishes below 1.0
µm, roundness below 0.2 µm, and cylindricity below 1.0 µm. Abrao and Aspinwall
[1996]were able to produce a surface finish with roughness value Ra as low as 0.14 µm.
If hard turning is to replace any grinding operation, it must be capable of
producing surfaces of acceptable quality. This includes both the surface topography
(surface finish) and surface integrity, which is achieved when “the surface of a component
meets the demands of a specific stress system and environment” [Field et al. 1972].
Ramesh et al. [1999] defined an “extended surface integrity data set” which includes:
surface finish, microstructure, microhardness, fatigue resistance, residual stress state, and
frictional characteristics.
To discuss the effects of hard turning on residual stresses, the surface influences
of hard turning compared to grinding should be mentioned. Compared to grinding, the
force components are large, particularly the thrust force, which is generally larger than the
cutting force in hard turning. If the tool loading is thought of as a Hertzian contact, the
maximum compressive stress induced in the workpiece occurs at a depth approximately
0.7 times the contact area of the tool. Because the contact area is larger than grinding (a
single grit) and load is increased, larger residual compressive stresses that penetrate deeper
below the workpiece surface result in hard turned components. This was verified by
Brinksmeier et al. [1982] and Konig et al. [1993]. As expected, the magnitude and depth of

9
residual stresses are a function of tool geometry and process conditions [Matsumoto et al.
1986, Tonshoff et al. 1995, Brinksmeier et al. 1982 and Thiele 1998].
Unlike residual tensile stress, reasonable levels of compressive stress are
desirable. Based on the residual stress caused by mechanical loading only, hard turned
surfaces should exhibit increased fatigue life compared to ground surfaces. However, the
undesirable tensile stresses generated by heat are superimposed on the compressive stress
[Tonshoff et al. 1996, Konig 1993]. As tool flank wear increases, so does the frictional
energy between the tool flank and workpiece, as well as the depth of the compressive
stress induced by mechanical loading. Thus, increasing tool wear results in larger tensile
stresses near the surface, which is then followed by steep stress gradients with a larger
compressive stress further below the surface. The stress pattern with less overall change
was generated by a tool with very little flank wear compared to the other stress pattern,
which was generated with a significantly worn tool.
Dhar and Kamruzzaman[2009] conducted an experiment by turning 17CrNiMo6
and 42CrMo4 under dry and high pressure cooling conditions. It was reported that high
pressure cooling enable to reduce cutting temperature up to 25% depending upon process
parameters. High pressure coolant reduced friction, built-up-edge formation, thermal
distortion of the tool and work. It was observed that high pressure coolant reduced the
flank wear, thus the tool life was improved. Better surface finish was obtained under high
pressure cooling condition due to reduction of wear and damage at the tool tip. [Kovacevic
et al.1995] investigated the effect of high pressure coolant/lubricant in improving the
thermal/frictional conditions in milling operations. A high pressure water jet was used
during the investigation. Application ofcutting fluid at high pressure enhanced the
effectiveness of cutting performance and led tothe reduction in the quantity of cutting fluid
and reduction in the amount of disposal whichis a primary concern of Environmental
Protection Authorities (EPA). From this investigation, itwas also evident that applying
cutting fluid in the form of a jet at higher pressures into thecutting zone is more beneficial
than conventional fluid application techniques such asflood cooling.If the coolant is
applied at the cutting zone through a high speed nozzle, it could reduce the contact length
and co-efficient of friction at chip-tool interface and then cutting force and temperature
may be reduced and tool life can be increased [Mazurkiewicz et al. 1998, Kumar et al.
2002]. High-pressure is often the solution to get the coolant to the target so it can cool,
10
lubricate, and sometimes perform its third function, breaking chips that do not break neatly
with ordinary machining processes [Lacalle et al. 2000]. Concern for the environment,
health and safety of the operators, as well as the requirements to enforce the environmental
protection laws and occupational safety and health regulations are compelling the industry
to consider a high-pressure coolant (HPC) machining process as one of the viable
alternative instead of using conventional cutting fluids.
The conventional coolant method as based on a floodingsystem is not always
effective as the coolant often fails topenetrate into the tool chip interface during the
machiningprocess [Paul et al. 2000].Metal cutting fluids changes the performance of
machining operations because of their lubrication, cooling, and chip flushing functions.
Typically, in the machining of hardened steel materials, no cutting fluid is applied in the
interest of low cutting forces and low environmental impacts. Minimum quantity
lubrication (MQL) presents itself as a viable alternative for hard machining with respect to
tool wear, heat dissertation, and machined surface quality. MQL, also known as
“Microlubrication”, [MaClure et al. 2007] and “Near-Dry Machining” [Klocke and
Eisenblatter, 1997], is the latest technique of delivering metal cutting fluid to
thetool/work interface. Using this technology, a little fluid, when properly selected and
applied, can make asubstantial difference in how effectively a tool performs. In
conventional operations utilizing flood coolant, cutting fluids are selected mainly on the
basis of their contributions to cutting performance. In MQL however, secondary
characteristics are important. These include their safety properties,biodegradability,
oxidation and storage stability.This is important because the lubricant must be compatible
with the environment and resistant to long term usage caused by low consumption
[Wakabayashi et al. 2006]. In MQL, lubrication is obtained via the lubricant, while a
minimum cooling action is achieved by the pressurized air that reaches the tool/work
interface. Further, MQLreduces induced thermal shock andhelps to increase the workpiece
surface integrity in situations of high tool pressure [Attanasio et al. 2006].Ronan et al.
[2003]compared the mechanical performance of minimum quantity lubrication to
completely dry lubrication for the turning of hardened bearing-grade steel materials based
on experimental measurement of cutting forces, tool temperature, white layer depth, and
part finish. The results indicate that the use of minimum quantity lubrication leads to
reduced surface roughness, delayed tool flank wear, and lower cutting temperature, while
also having a minimal effect on the cutting forces.

11
1.2.3 Application of MQL in Hard Machining
The following sections review the recent studies on the application of MQL
machining in drilling, milling, turning, and grinding, comparing the MQL machining
performance with conventional flood lubrication and dry machining. The performance is
evaluated by comparing cutting temperatures, cutting forces, tool wear, and machining
quality under the different machining conditions. Unless otherwise specified, external
MQL with pure oil is applied in all of the reviewed experiments.
Vadarajan et al.[2002] have introduced a new MQL application technique which
overcomes the problems caused by mist. In this method, small quantities of cutting fluid
were applied in form of high velocity, narrow, pulsed jet. The amount of cutting fluid used
was only 2 ml/min. The performance in hard turning of hardened tool steel during minimal
cutting fluid application was superior to that during dry turning and conventional flood
turning on the basis of cutting force, tool life, surface finish, cutting ratio, cutting
temperature and tool-chip contact length. Anyway, focusing a pulsed jet to the cutting zone
poses no problem in turning because the cutting tool is stationary [Varadarajan et al.
2002]. This process also can be done on high speed milling as proven by
ThanongsakThepsonthi in May 2005 with his paper “Investigation into minimal cutting
fluid application in high speed milling of hardened steel using carbide mills”. From all
investigations, the minimal cutting fluids application in pulse jet form has shown to be a
viable alternative to the current, flood and dry cutting method that being used widely in
industries.
Zeilmann et al. [2006] compared the effects of internal and external application of
MQL in the drilling of a titanium alloy (Ti-6Al-4V), at speeds between 10 and 50 m/min,
feeds between 0.1 and 0.2 mm/rev, with coated and uncoated carbide tools. The most
stable behavior of cutting temperatures was observed when applying conventional cooling
internally, followed by internal MQL and dry cutting. The higher temperatures obtained
when applying internal MQL had a positive effect in reducing the feed forces when
compared with internally supplied flood cooling, but adverse effects were obtained with
dry cutting due to excessive chip entanglement at high temperatures. However, the
maximum temperatures obtained when applying internal MQL were 50% lower than those
with external MQL.

12
Khan et al. [2009] applied external vegetable oil MQL in turning of steel (AISI
9130) using an uncoated carbide inserts. Tests were conducted with a 1 mm depth of cut at
cutting speeds between 223 and 483 m/min and feed rates in the range of 0.1 to 0.18
mm/rev. The pure oil MQL flow rate was 100 ml/h with an air pressure of 6 bar. The
performance of MQL was compared with that of dry machining and flood cooling at a rate
of 360 l/h. It was found that MQL provided a 10% reduction of temperatures compared to
flood cooling. This effect was more prominent at higher speeds, producing smoother and
brighter chips and preventing any BUE formation.
Sadeghi et al. [2009] used MQL at rates between 20 and 140 ml/h, and 4 bar air
pressure, to compare the effects of the tribological conditions when grinding titanium (Ti-
6Al-4V). Aluminum oxide (Al2O3) wheels were used at a wheel speed of 15 m/s, work
speed of 40 m/s, and depth of cut of 0.007 mm. Considerable reduction in cutting forces
was obtained when applying MQL, as compared to cutting with flood cooling. In addition,
better performance was obtained when the MQL fluid was synthetic oil, than a vegetable
oil. In terms of surface roughness, MQL grinding can achieve similar results as flood
cooling. Flood cooling slightly outperformed MQL, however. The comparison of different
MQL oil flow rates showed that an optimal flow rate exists; 60 ml/h, with the existing
setup combination and materials.
Lathkar and Basu[2001] investigated the effect of application of graphite based
grease on cutting performance during turning of medium alloy steels with
minimumquantity lubrication using tungsten carbide tools and compared the results with
dryturning. Results indicated that there was improvement in cutting performance in the
form of reduction in tool wear and improvement in surface finish. Deshmukh and Basu
[2006] investigated the influence of solid lubricants like MoS₂, MoS₂-based grease,
graphitebased grease and silicon compound mixed with SAE 20 oil and found that the
applicationof such semisolid lubricant improved the cutting performance. On a similar line
in the present investigation, it is planned to explore whether silicon grease can act as a
cutting performance enhancer during surface milling of hardened AISI4340 steel with
minimal fluid application using a high velocity narrowpulsed jet of cutting fluid.
Heinemann et al. [2006] stated that continuous MQL supply is beneficial in terms of tool
life, whereas interrupting the MQL supplyleads to a substantial drop in tool life, especially

13
in the case of heat-sensitive drills. With respect to the type ofMQL lubricant, a low viscous
type with high cooling capability gives rise to a notably prolonged tool life.
Minimum quantity lubrication technique reduces the amount of consumption of
cutting fluid at a considerable amount. Along with that, the MQL system facilitates drastic
reduction in the tool chip interaction. This leads to reduction in cutting force which
decreases the tool wear. Reduced tool-chip and tool-work interactions also leads to lower
thermal distortion and tool wear. This leads to improvement in surface finish and
dimensional accuracy [Dhar et al. 2007].
Kamata et al. [2007] studied the effect of the MQL air pressure on high speed
finish-turning of Inconel 718, using a biodegradable synthetic ester. It was found that when
using external MQL with an oil flow rate of 16.8 ml/h and an air pressure of 4 bar, the tool
wear obtained was consistently lower than with flood cooling (3.7 L/min) or dry
machining. An increase in air pressure from 4 bar to 6 bar yielded higher tool wear, similar
to dry cutting. It was suggested that increased oxidation, due to the more abundant oxygen,
was the reason. The possibility that the excess air resulted in excessive atomization of the
MQL fluid, thus not reaching the cutting zone, was not considered. When applying argon
as the carrier gas, at a pressure of 4 bar, the tool life was in fact shorter than that with air or
under dry conditions. This is likely due to the lower specific heat and thermal conductivity
of argon, compared to air. An increase in lubricant supply from 16.8 ml/h to 31.8 ml/h
caused an increase in tool life, without a significant improvement in the machined surface
finish.
In a similar study, Obikawa[2006]et al. examined the effects of MQL flow
parameters on the cutting temperature and tool wear. Internal application of MQL (7 ml/h
with vegetable oil; 3 bar and 7 bar air pressures) was used in grooving experiments on
0.45% carbon steel, using uncoated and triple coated tools (TiN/TiCN/TiC). Tests were
conducted at high speeds of up to 300 m/min, and a constant feed of 0.12 mm/rev. The
internal MQL supply (through the tool) proved to be more effective in reducing tool wear,
when compared with the external MQL, as it enhanced the concentration of the oil supply
in the cutting zone. A decrease in maximum temperature and tool wear were observed
when the MQL air pressure was increased, for a fixed oil flow rate. This indicated a
potential effect of the injection parameters on the atomization of the lubricant, and

14
consequently its effect on machining. The observed temperature reduction using MQL was
also strongly dependent on the tool wear.
Bhowmick et al. [2008] used diamond-like-carbon-coated (DLC) drill bits in the
drillingof an aluminum-silicon alloy, at a speed of 50 m/min and feed of 0.25 mm/rev.
They compared thrust force and torque values when machining dry, with distilled water as
the MQL fluid (30 ml/h), and with emulsion flood cooling (30,000 ml/h). The results
obtained showed comparable thrust force and torque values for flood cooling and MQL.
Applying MQL in drilling resulted in considerably lower adhesion levels as well as more
stable cutting forces, when compared with dry drilling. The results also highlighted the
better performance of non-hydrogenated DLC coated drills, compared to hydrogenated
DLC coated drills, in terms of thrust force, torque, and Buit-UpEdge (BUE) formation,
when water MQL is used.
The main drawbacks of the MQL method is the application of cutting fluid in the
form of mist which increases the exposure of hazardous aerosols in the shop floor
[Anshuet al. 2007]. The vapor, mist and smoke generated during the use of MQL in
machining can be considered as undesirable byproducts, since they contribute to increase
the index of airborne pollutants. This has become a factor for concern, requiring an
adequate exhaustion system in the machine tool. Special techniques for transporting chips
may be necessary and productivity may decrease due to the thermal impact on the
machined components. The compressed air lines generate noise that usually exceed the
legally established limits [Machado and Diniz 2000]. The limitations of MQL system are
being taken into attention and a number of measures are taken to decrease those. For
example, the use of compressed air can be replaced using fuel pumps working as pressure
developer and hence reducing the amount of noise the MQL system develops.
Rahman et al. [2002] investigated MQL technique on milling of ASSAB 718 HH
steel of 35 HRc with uncoated carbide inserts. The rate of flow of cutting fluid was 8.5
ml/h during MQL and 42,000 ml/min during flood application. The comparison of cutting
performance indicated that MQL can definitely be regarded as a replacement for dry
cutting and conventional flood cooling owing to the drastic reduction in lubricant
consumption. They also found that there was a considerable reduction in cutting force
components for the MQL technique as compared to dry milling and milling with flood

15
cooling. Fracture or chipping was not common for the MQL aided inserts and surface
finish obtained during MQL application was comparable to that during flood cooling.
There are two basic types of MQL delivery systems: external spray and through-
tool. The external spray system consists of a coolant tank or reservoir which is connected
with tubes fitted with one or more nozzles. The system can be assembled near or on the
machine and has independently adjustable air and coolant flow for balancing coolant
delivery. It is inexpensive, portable, and suited for almost all machining operations.
Through-tool MQL systems are available in two configurations; based on the method of
creating the air-oil mist. The first is the external mixing or one-channel system. Here, the
oil and air are mixed externally, and piped through the spindle and tool to the cutting zone.
The advantages of such systems are simplicity and low cost; they are suited to be
retrofitted to existing machines with high-pressure, through the tool coolant capability.
They are easy to service as there are no critical parts located inside the spindle. Also this
system provides the flexibility of fine tuning the placement of the nozzle to facilitate better
effect on the machining. The disadvantage is that the oil-mist is subjected to dispersion and
separation during its travel from the nozzle. To minimize oil drop outs, a mist of relatively
fine particles is used, and in certain cases this often limits the amount of lubrication that
can be supplied to the cutting zone and consequently affects the performance of the cutting
process. The second configuration is the internal mixing or two channel systems. Most
commonly in a two channel system, two parallel tubes are routed through the spindle to
bring oil and air to an external mixing device near the tool holder where the mist is
created. This approach requires a specially designed spindle. Such systems have less
dispersion and dropouts and can deliver mist with larger droplet sizes than external mixing
devices. They also have less lag time when changing tools between cuts or oil delivery rate
during a cut. However, the systems are more difficult to maintain; critical parts are located
inside the spindle [Filipovicand 2006].
In the case of typical MQL, cooling ability depends only on the rate of flow of air.
MQL with water droplets which are also known as oil film on water droplet (OoW) is a
new technique, has a large cooling ability because the water droplets will not only act as
the oil carrier but will also evaporate fast on the tool and work surface to their size,
eventually cooling the surface by absorbing the latent heat by evaporative heat transfer.
According to Itigawa et al. [2006], this cooling ability is important not only for

16
dimensional accuracy but also for tribological phenomena between the tool and work
surface such as adhesion. In addition the water droplets ensure that their lubricant coating
gets deposited and spreads over the work and tool surface due to the droplets’ inertia.
Lubricant concentration in MQL varies between 0.2 and 500 ml/hr., and does not
recirculate through the coolant delivery system. Since very good lubrication properties are
required in MQL, vegetable oil or synthetic ester oil are used instead of mineral oil. Air
pressure is roughly 5 bars [Filipovicand 2006]. MQL is consumption lubrication as the
bulk of the lubrication applied is evaporated at the point of application. This evaporation,
in concert with the compressed air stream, cools the workpiece. The remaining heat is
dissipated through the tool and the chips. The chips, workpiece and tool remain nearly dry
in an ideally adjusted MQL system. Wakabayashi et al.[2003] introduced synthetic polyol
esters and described their capabilities as MQL fluids. These represent a potential
replacement for vegetable-based MQL oils, particularly with regard to their optimal
secondary performance characteristics. All vegetable oils display high biodegradability.
Synthetic esters, however, provide a wide range of biodegradability depending on their
combined molecular structures of acids and alcohols. This characteristic, in conjunction
with their suitable viscosities, prompted Wakabayashi, et al.[2006], to identify these
lubricants for further examination.
Physical properties and biodegradability of polycol esters were compared with a
vegetable oil. The viscosity, total acid number, pour point and biodegradability for polycol
ester oil were 19.1mm2/s, 0.02mgKOH/g, 45oC and 100% respectively. These
characteristics for vegetable oil were 35.6 mm2/s, 0.04 mgKOH/g, 20˚ C and 98%
respectively. The molecular weights of polycol ester oil and vegetable oil were also
compared. The molecular weight of the oil film increased by more than 10%.The
molecular weight of vegetable oil increased by 65%. In contrast, there was no significant
change in the molecular weights of polyol esters. Most vegetable oils consist of a number
of ester compounds mainly derived from a combination of glycerin and fatty acids.
Vegetable oils are usually liquids at room temperature, due to their unsaturated
bonds. Unfortunately, unsaturated bonds are chemically unstable and may cause vegetable
oils’ molecular weight to increase. A detailed investigation of this behavior was carried
out using GPC analysis. The results indicated that some of the molecules in vegetable oil
had changed into compounds having higher molecular weights. Results of the UV analysis,

17
which can selectively detect changes in unsaturated double bonds, indicate the unsaturated
structure decreased significantly. This result supports the hypothesis that the unsaturated
bond structure of vegetable oil molecules is the main cause of their easy degradation by
oxidation polymerization. The polyol esters chosen as preferable biodegradable lubricants
in this investigation are synthesized from a specific polyhydric alcohol rather than
glycerin. Their molecules can greatly improve oxidation stability; they are free from
unsaturated bonds.Regardless, they can be liquid at room temperature. Compared with
vegetable oils, the synthetic polyol esters studied were optimal lubricants for MQL
machining from the standpoint of maintaining a clean working environment.
Another secondary characteristic studied concerned the long-term storage
potential of polyol esters and vegetable oils. Lubricant containers are often stored outside,
and the temperature in the containers can rise as high as 70˚C. Since an MQL system
consumes very little lubricant, the lubricant must remain stable under such conditions. In
order to simulate this storage situation, an oxidation test was conducted at 70˚C for 4
weeks. Changes in viscosity and Total Acid Number (TAN) were measured. The change
in viscosity for polyol ester oil and vegetable oil after the storage stability test were 0.01%
and 1.5% and the change in total acid number (TAN) were 0.01% and 0.18% respectively.
While the viscosity and TAN of polyol ester were almost constant, the values for vegetable
oil increased considerably. These results confirm the stability of the molecular structure of
the synthetic esters regarding oxidative degradation, thus promoting their stability in
storage[Wakabayashi et al. 2006].
From a practical point of view, the cutting fluids used in MQL need to be storable
for long periods of time, as they are only used in minimal quantities. In the storage
containers, the temperatures can rise up to 70⁰ C and therefore the fluids need to withstand
this environment for long periods, without degradation. They also need to have a good
oxidation resistance, so as to avoid the formation of an adhesive layer, in case they are left
on the equipment.
It is clear that the applicability of near-dry machining will depend on the process,
the cutting conditions (cutting speed, chip thickness), the tool material and geometry
(insert, coating), the workpiece material, and the MQL supply parameters (internal,
external, flow rates, type of fluid). In high speed machining, wear regimes are either
mechanically activated such as adhesion, abrasion, and fatigue, or thermally activated such

18
as diffusion, all contributing to tool life reduction. Other forms of wear exist, such as
erosion (chemical wear) and micro chipping[Kishawy et al., 2005]. Although they are
often present in combinations, the dominant wear regime varies with the aforementioned
machining conditions.
Milling is a material removal process that applies to various operations such as
planning, slotting, routing, and orbital drilling. In end-milling, the cutting is performed at
the tip as well as the sides of the end-mill, thus the lubrication system must supply all these
areas if adequate lubrication is necessary. Yan et al.[2012] investigated the significance of
the MQL injection parameters on the milling of 50CrMnMo steel. Tests were conducted at
a cutting speed of 220 m/min and a feed of 0.14 mm/tooth. The axial depth of cut used was
0.5 mm, and the radial depth of cut was 8 mm. The oil flow rate was varied between 13.9
and 58.4 ml/h, and the air pressure was varied between 2 and 6 bar. Within this range, the
change in oil flow rate had negligible effects on flank wear, except at the lower levels. The
increase in air flow rate led to a reduction in tool wear, reportedly due to better chip
removal and the improved penetration of the flow to the cutting zone. Comparison of MQL
with dry and flood cooling conditions showed that MQL produced the lowest tool flank
wear and average roughness of the machined surface.
Rahman et al.[2001] applied MQL in low speed milling of steel (ASSAB 718
HH). In these tests, MQL was applied using a mineral oil with anti-wear and extreme
pressure additives, at flow rate of 8.5 ml/h and air pressure of 5.2 bar. Tests were
performed at a constant depth of cut (0.35 mm), with speeds in the range of 75 and 125
m/min, and feeds between 0.01 and 0.03 mm/tooth. Considerable reduction in cutting
forces and thermal stresses in the case of MQL, compared to flood and dry cutting, was
observed. No catastrophic tool failure occurred in the case of MQL, in contrast with flood
cooled and dry cutting. In addition, the lowest amount of burr formation was obtained
using MQL. In a similar study, but at higher speeds, Liao et al. [2007] used an oil flow
rate of 10 ml/h and air pressure of 4.5 bar, as MQL flow parameters in the milling of
hardened steel (NAK80). Tests with TiAlN and TiN coated carbide tools were conducted
at speeds between 150 and 250 m/min, and feeds between 0.1 and 0.2 mm/tooth. The axial
depth of cut and the radial depth of cut were 0.6 mm and 5 mm, respectively. The same
conditions were used in tests with dry and flood coolant (20 l/min), in order to study the
feasibility of MQL using biodegradable esters. The results showed that the lowest cutting

19
forces were in the case of flood coolant, followed by MQL and dry cutting. The lowest
tool wear values, however, were obtained under MQL, while flood cooling resulted in
thermal cracking in the tool. The higher thermal wear in cutting tools at high speeds
resulted in higher surface roughness values in the workpiece, when flood cooling was
used. This trend was reversed at lower speeds, where flood cooling proved superior to
MQL, making MQL a more suitable cooling method for high speed machining.
Kishawy et al.[2005] applied MQL (synthetic ester with EP additives) in milling
of cast aluminum-silicon alloy (A356). Tests were conducted at speeds up to 5,225 m/min,
using diamond coated and uncoated carbide inserts. The study was aimed at comparing
MQL with flood and dry machining, in terms of tool life, cutting forces, and machined
surface quality. The results showed that the cutting forces in the case of MQL and flood
cooling were similar up to a speed of 2,000 m/min, beyond which flood cooling becomes
superior in reducing cutting forces. As expected, dry machining exhibited the highest
cutting forces. MQL cutting minimized the difference in the chip thickness ratio between
sharp and worn tools. Also the lowest volume of adhered aluminum was obtained in the
case of the MQL environment.
Hwang et al.[2009]evaluated the machinability of aluminum (Al6061) in milling
tests using MQL (vegetable oil) and flood as the mode of lubrication. Analysis of Variance
(ANOVA) was used to evaluate the importance of the different parameters on the surface
roughness and cutting forces. The results showed that the cutting forces were largely
dependent on the cutting parameters, as opposed to the mode of lubrication. The surface
roughness values, however, were dependent on all the cutting conditions. Little difference
in cutting forces was found, but the roughness values were lower in the case of MQL,
consistent with previous studies.Hwang et al.[2009] compared tribological environments
using titanium (Ti-6Al-4V) as the workpiece material. Tests were conducted using dry,
flood, and vegetable oil MQL with flow rates between 2 and 10 ml/h and air pressure of
5.2 bar. All tests were carried out at speeds between 40 and 140 m/min, feeds of 0.05 to
0.2 mm/rev, axial depth of cut of 0.5 mm, and radial depths of cut between 2 and 8 mm.
The MQL supply was efficient in reducing the tool adhesion levels, which was the main
wear mechanism, and was strongly dependent on the coolant supply method. MQL led to
significantly longer tool life, particularly at higher speeds, while flood cooling was
ineffective even when compared to dry cutting. The use of MQL also resulted in lower

20
levels of thermal cracking in the tool, compared to flood and dry machining, due to the
lower temperature gradients which were significant in the case of flood cooling. The lower
tool wear rate in the case of MQL also had a strong impact on reducing the cutting forces.
Thepsonthi, et al.[2009] and Marzurkiewicz, et al. [1989] indicated that the
method of coolant application with high pressure jet could give better machining
performance in terms of cutting force, tool life, surface finish, cutting temperature and
tool-chip contact length. Machado and Wallbank[1997]conducted machining experiments
using aventuri to mix compressed air with an air pressure of 2.3 bar with small quantities
of liquid lubricant, water or soluble oil where the mean flow rate was between 3 to 5
ml/min. The literature also indicates that the MQL has many advantages in terms of
environmental, economic and better machining quality. When dealing with steel materials,
most of the research and applications of MQL are mainly focused on the milling and
turning operations [Abou-El-Hossein 2008]. In addition, the investigations on high speed
milling by using MQL technique are required further study especially on machining
hardened steel and stainless steel [Sun et al 2006].
Investigating the effect of application of graphite based grease mixed with base
oil on cutting performance during turning of medium alloy steels using tungsten carbide
tools, Lathkharet al.[2001] found that there was improvement in cutting performance. The
influence of solid lubricants like MoS2, MoS2-based grease, graphite based grease and
silicon compound mixed with SAE 20 oil was investigated by Deshmukh and Basu[2001]
found that the presence of grease with cutting fluid has enhanced the cutting performance
to some extent. A high velocity narrow jet of cutting fluid was applied during surface
milling of hardened AISI 4340 steel with silicon grease to investigate whether the cutting
performance is enhanced with the same line of investigation.
1.3 Design of Experiment (DOE) Experimental design is a critically important tool in engineering for continuous
improvement of the performance of manufacturing process. Statistical experiments are
generally carried out to explore, estimate or confirm [Jiju 2003]. Exploration consists of
gathering and understanding data to learn more about the process or product
characteristics. Estimation refers to determining the effects of process variables or factors
on the output performance characteristic. This information is used to estimate the settings

21
of factors to achieve maximum output. Confirmation implies verifying the predicted
results obtained from the experiment. The application of experimental design is useful in
all the above phases. A well designed experiment can ensure improved process outputs,
reduced development time and reduction in overall cost. Traditional approach of
experimental design is empirical in nature. In this approach one factor is varied at a time
keeping all other variables in the experiment fixed. This approach depends upon
guesswork, luck, experience and intuition for its success. Moreover, this type of
experimentation required large resources to obtain a limited amount of information about
the process. One Variable-At-a-Time experiments often are unreliable, inefficient, time
consuming and may yield false optimum condition for the process. Statistical thinking and
statistical methods play an important role in planning, conducting, analysis and
interpreting data from engineering experiments. When several variables influence a certain
characteristic of a product, the best strategy is then to Statistical design of experiment
which can give valid, reliable and sound conclusions that can be drawn effectively,
efficiently and economically [Jiju 2003].
1.4 Summary of the Review
A review of the study presents that the modern manufacturing industries are
seeking manufacturing processes to increase the production rate without sacrificing
quality. Although hard machining is a process that is used for a long time but due to the
longer machining time required for the operations, various alternatives as cryogenic
cooling, minimum quantity lubricant, pulsed jet machining MQL are being used
frequently. These alternatives processes have shown significant improvement in terms of
tool wear, temperature and cutting force under different cutting speed, depth of cut and
feed rate.
Minimum Quantity Lubrication provides a better result than not only
conventional flood cooling, but also other cooling processes. Pulsing the MQL provides a
better cooling along with good surface finish and low cutting force. Although different
combinations of cutting velocity, feed and depth of cut exhibits different qualities during
surface milling, MQL has shown significant improvement over other processes.

22
1.5 Objectives of the Present Work
The objectives of the present work are:
(a) Design and development of a pulsed jet Minimum Quantity Lubricant
(MQL) applicator
(b) Experimental investigation on the roles of Minimum Quantity Lubricant
(MQL) by pulsed jet in respects of
(i) Cutting forces and cutting temperature
(ii) Pattern and mechanism of deformation of the cutting tools
(iii) Extent of tool damage and tool life
(iv) Surface roughness
in machining hardened AISI4140 steel at different speed, feed combinations.
(c) The scopes of the present work are design, development and fabrication ofa
pulsed jet MQL applicator that can deliver cutting fluid at different volume
at critical zones during surface milling.
1.6 Scope of the Thesis
To stay ahead in the ever growing competition of the global world, all the
manufacturing industries are seeking for better alternatives of the traditional machining
process that can reduce the cost and have little impact on the environment. Increasing
usage of the hard materials has also caused the increase of temperature during the
machining process. The cutting temperature, which is the cause of several problems
restraining productivity, quality and hence machining economy, can be controlled by the
application of conventional cooling, precision cutting tools during dry machining or by
application of straight oil as coolant in MQL. Keeping this in view, the present research
work has been taken up to design and develop a Pulsed Jet Minimum Quantity Lubricant
Applicator and explore the role of MQL applicatoron the major machinability
characteristics in machining (surface milling) hardened steels by carbide end mill cutter
under different machining conditions as well as to predict tool wear, surface roughness and
cutting force in machining when machining under different environmental condition.
Chapter 1 presents the survey of previous work regarding general requirements
in machining industries, technological-economical-environmental problems associated
with the conventional cooling practices as well as dry machining practice and expected
23
role of MQL on machining hardened steel. It presents specific objectives of this thesis
work and also outlines the methods which have been followed to draw effective results
that commensurate with the goals of the thesis.
Chapter 2presents the design and development of the pulsed jet Minimum
Quantity Lubricant applicator for delivering cutting fluid to the effective cutting zone.
Commonly used DOE methods, steps to follow DOE method and Full factorial analysis,
one of the powerful and popular DOE methods has been adopted to optimize the important
parameters of the applicator are described in this chapter.
Chapter 3 presents the material preparation steps and detail processes involved
for bulk hardening of the sample workpiece for the experimental investigations. The
deliveryprocesses of the cutting fluid from the reservoir to the cutting zone through the
applicator are described in length. Complete experimental set up with experimental
conditions are briefly described in this chapter. Finally the experimental results in terms of
surface roughness, cutting forces and tool wear are represented by different graphs.
Machine responses under different environmental conditions are graphically presented to
observe the behavior of the workpiece, cutting tool on different environment. Effects of
MQL, relative to dry condition on surface roughness, tool wear and cutting forces in
milling hardened steel of hardness about 40 HRC by carbide end mill cutter under different
cutting conditions are also discussed.
Chapter 4 contains the detailed discussions on the experimental results, possible
interpretations on the results obtained.
Finally,Chapter 5 contains a summary of major contributions, recommendation
for the future work and references are provided at the end.

24
Chapter-2
Design and Development of Pulsed Jet Minimum Quantity Lubricant Applicator
2.1 Introduction
A major importance is given on the experimental design. The performance of the
manufacturing process as well as its development depends on the experimental design in a
large scale. Experimental design consists of planning, designing, conducting and analyzing
and drawing reliable valid conclusions that can be later used in an effective manner. A
number of statistical tools are used to explore, estimate or confirm the data acquired
through the use of experimental design [Antony 2003]. Experimentaldesign has proved to
be very effective for improving the process performance and process capability. A
structured approach is used to achieve the most reliable results possible with the minimum
amount of wastage of time and money. This enables to have an overall view of the
manufacturing process with a limited number of experiments. The information gained can
be used to optimize aprocess and define which parameters need to be placed under the
most influencing in orderto maintain the repeatability of a process.The traditional approach
of experimental design is empirical in nature. In this approach one factor is varied at a time
keeping all other variables in the experiment fixed. This approach depends upon
guesswork, luck, experience and intuition for its success. Moreover, this type of
experimentation requires large resources to obtain a limited amountof information about
the process. One variable-at-a-time experiments often are unreliable, inefficient, time
consuming and may yield false optimum condition for the process. Statistical thinking and
statistical methods play an important role in planning, conducting, analyzing and
interpreting data from engineering experiments. When several variables influence a certain
characteristic of a product, the best strategy is then the statistical design of experiment
(DOE) which can give valid, reliable and sound conclusions that can be drawn effectively,
efficiently and economically [Antony 2003].

25
Any experimental design has randomization as the first and basic principle.
Randomization is a process of assigning specific treatments to the experimental units. This
randomization attributes to equal possibilities of each allotment of the treatments. An
experimental unit is the smallest division of the experimental material and a treatment
means an experimental condition whose effect is to be measured and compared. The
randomization is used to remove bias and other sources of extraneous variation which are
not controllable. Moreover, randomization forms the basis of any valid statistical test.
Hence the treatments must be assigned at random to the experimental units.
Randomization can be done in a number of ways. It can be done by drawing numbered
cards from a well-shuffled pack of cards, drawing numbered balls from a well-shaken
container or even taking numbers from a table of random numbers.
Replication is the second principle of any experimental design. This states a
repetition ofthe basic experiment. In other words, it is a complete run for all the treatments
to be tested in the experiment. In all experiments, some variations are introduced. This
type ofvariations can be removed by replication. The experiments are to be performed
more thanonce. An individual repetition is called a replicate. The number of replicates
depends upon the nature of the experimental material. The increase in the number of
replications tends to remove the errors caused by the variations.
However, although randomization and replications are used to remove the
extraneous sources of variation, it is not always possible to remove all the sources. Hence,
a refinement in the experimental technique is required. In other words, a design is to be
selected in such a manner that all extraneous sources of variation are brought under
control. For this purpose, one has to make use of local control, a term referring to the
amount of balancing, blocking and grouping of the experimental units. Balancing means
that the treatments should be assigned to the experimental units in such a way that the
result is a balanced arrangement of the treatments. Blocking means that similar
experimental units should be collected together toform a relatively homogeneous group.
Blocking reduces known but irrelevant sources of variation between units and thus allows
greater precision in the estimation of the source ofvariation under study. The main purpose
of the principle of local control is to increase theefficiency of an experimental design by
decreasing the experimental error. Control in experimental design is used to find out the
effectiveness of other treatments through comparison.

26
Orthogonality concerns the forms of comparison (contrasts) that can be
legitimately and efficiently carried out. Contrasts that can be represented by vectors and
sets of orthogonal contrasts are uncorrelated and independently distributed if the data are
normal. Because of this independence, each orthogonal treatment provides different
information to the others.
In many fields of study it is hard to reproduce measured results exactly.
Comparisons between treatments are much more reproducible and are usually
preferable.Often one compares against a standard or traditional treatment that acts as
baseline.The following steps are involved in the design of experiment:
Defining the objective of the experiment
Selection of the response or output
Selection of the process variables or design parameters (control factors)
Determination of factor levels and range of factor settings
Choice of appropriate experimental design
Experimental planning
Experimental execution
Experimental data analysis and interpretation
2.2 Design of Experiment (DOE)for MQL Applicator
Design of Experiments (DOE) is a methodology that can be effective for general
problem-solving, as well as for improving or optimizing product design and manufacturing
processes. Specific applications of DOE include identifying proper design dimensions and
tolerances, achieving robust designs, generating predictive math models that describe
physical system behavior, and determining ideal manufacturing settings. Much of the
knowledge about products and processes in the engineering and scientific disciplines is
derived from experimentation. An experiment is a series of tests conducted in a systematic
manner to increase the understanding of an existing process or to explore a new product or
process. Design of Experiments, or DOE, is a tool to develop an experimentation strategy
that maximizes learning using a minimum of resources. Design of Experiments is widely
used in many fields with broad application across all the natural and social sciences. It is
extensively used by engineers and scientists involved in the improvement of
manufacturing processes to maximize yield and decrease variability. Often times,

27
engineers also work on products or processes where no scientific theory or principles are
directly applicable. Experimental design techniques become extremely important in such
situations to develop new products and processes in a cost-effective and confident manner.
With modern technological advances, products and processes are becoming
exceedingly complicated. As the cost of experimentation rises rapidly, it is becoming
impossible for the analyst, who is already constrained by resources and time, to investigate
the numerous factors that affect these complex processes using trial and error methods.
Instead, a technique is needed that identifies the "vital few" factors in the most efficient
manner and then directs the process to its best setting to meet the ever-increasing demand
for improved quality and increased productivity. The techniques of DOE provide powerful
and efficient methods to achieve these objectives. Designed experiments are much more
efficient than one-factor-at-a-time experiments, which involve changing a single factor at a
time to study the effect of the factor on the product or process. While the one-factor-at-a-
time experiments are easy to understand, they do not allow the investigation of how a
factor affects a product or process in the presence of other factors. When the effect that a
factor has on the product or process is altered due to the presence of one or more other
factors, that relationship is called an interaction. Many times the interaction effects are
more important than the effects of individual factors. This is because the application
environment of the product or process includes the presence of many of the factors
together instead of isolated occurrences of single factors at different times. Consider an
example of interaction between two factors in a chemical process where increasing the
temperature alone increases the yield slightly while increasing pressure alone has no effect
on the yield. However, in the presence of both higher temperature and higher pressure, the
yield increases rapidly. Thus, an interaction is said to exist between the two factors
affecting the chemical reaction.
The methodology of DOE ensures that all factors and their interactions are
systematically investigated; thus, information obtained from a DOE analysis is much more
reliable and complete than results from one-factor-at-a-time experiments that ignore
interactions and may lead to misleading conclusions.Designed experiments are usually
carried out in five stages planning, screening, optimization, robustness testing and
verification.

28
It is important to carefully plan for the course of experimentation before
embarking upon the process of testing and data collection. A few of the considerations to
keep in mind at this stage are a thorough and precise objective identifying the need to
conduct the investigation, assessment of time and resources available to achieve the
objective and integration of prior knowledge to the experimentation procedure. A team
composed of individuals from different disciplines related to the product or process should
be used to identify possible factors to investigate and the most appropriate response(s) to
measure. A team approach promotes synergy that gives a richer set of factors to study and
thus a more complete experiment. Carefully planned experiments always lead to increased
understanding of the product or process. Well planned experiments are easy to execute and
analyze. Botched experiments, on the other hand, may result in data sets that are
inconclusive and may be impossible to analyze even when the best statistical tools are
available.
Screening experiments are used to identify the important factors that affect the
process under investigation out of the large pool of potential factors. These experiments
are carried out in conjunction with prior knowledge of the process to eliminate
unimportant factors and focus attention on the key factors that require further detailed
analyses. Screening experiments are usually efficient designs requiring few executions,
where the focus is not on interactions but on identifying the vital few factors.
Once attention has been narrowed down to the important factors affecting the
process, the next step is to determine the best setting of these factors to achieve the desired
objective. Depending on the product or process under investigation, this objective may be
to either increase yield or decrease variability or to find settings that achieve both at the
same time.
Once the optimal settings of the factors have been determined, it is important to
make the product or process insensitive to variations that are likely to be experienced in
the application environment. These variations result from changes in factors that affect the
process but are beyond the control of the analyst. Such factors (e.g. humidity, ambient
temperature, variation in material, etc.) are referred to as noise or uncontrollable factors. It
is important to identify such sources of variation and take measures to ensure that the
product or process is made insensitive (or robust) to these factors.

29
This final stage involves validation of the best settings by conducting a few
follow-up experimental runs to confirm that the process functions as desired and all
objectives are met.
There are many methods of design of experiment (DOE) like Multi-vari chart,
Variable search, Full factorials, Taguchi methods etc. Out of several methods of DOE, Full
factorial analysis is a power full and popular homing in technique and hence frequently
used DOE method. Fig.2.1 shows the commonly used DOE method. Almost all the
methods follow some basic methodologies which are appended below:
Identify the important variables or parameters that effect quality through
extensive brainstorming with different expert opinion/participation
Separates those variables into different categories, generally not more than
4 important and most severe variables which are known as Red X (most
serious variable that effects quality) and pink X (Moderately serious which
has moderate impact on quality)
Reduce variations of Red X and pink X through redesign and process
improvement
Other than Red X and Pink X there may be lot many variable that do not
effects quality should not take into consideration for controlling for
minimizing the cost.

30
Fig.2.1 Commonly used DOE methods
2.3 Full Factorial Analysis for Pulsed Jet MQL Applicator
In full factorial analysis in investigation involving 4 variables and two levels of
each factor is called 24 factorial analysis which involve 16 groups of test or combinations.
Normally not more than 4 factors/variables at a time are taken to segregate the critical
variables effect on the experimental setup. Full factorial DOE method is one of the
powerful and popular tools for identifications of the most severe variables which may
cause or affect the performance of the product. Basic principle of the analysis is that every
variable can be tested with all levels (generally two) of every other variable. Experimental
testing of all possible combinations of pre-selected variables and levels allows for the
systematic separation and quantification of all main and interaction effects, thereby giving
the chance of narrowing down the number of variables to one or two which are
comparatively more severe. The complete full factorial analysis involves two main steps
such as preparation of combinatorial matrix which identifies the impact of all individual
variables having two levels for each variables and preparation of ANOVA table to identify
main effect and interaction effect.
Components Search
Paired Comparisons
Multi-vari Chart
5-20 Variables or more
Variables Search
Full Factorials
2-10 Variables or less
Variable-1 (A) Vs Variable-2 (B) Variable-3 (C) Vs Variable-4 (D)
Interaction effects among the variables
Validation Method
Optimization Method

31
First of all visualize the components of the applicator and identify the variables
that affect the performance of the applicator functionality. Identify also the response
variable i.e. independent variable and dependent variable and some other factors which are
not that important but have some impact on the overall performance after interacting with
each other’s. These variables are:
Container size (length and diameter), material and sealing
Volume of the container
Height of the container of the cutting oil from the fuel pump
RPM of the motor running the fuel pump
Number of nozzles of the fuel pump to be used
Diameter of the nozzle injector
Milling cutter type and material
Pressure and flow of the cutting fluid
Process parameters (cutting velocity, table feed and depth of cut)
Machining responses (surface roughness, cutting force and flank wear)
Angle of the spray pattern
After several brain storming session with concern technical staff and all levels of
experts, it has been provisionally identified that out of the above mentioned variables,
depending on the severity following 4 variables as shown in Table 2.1. Table 2.1 are seems
to be vulnerable for the optimized performance of the applicator.
Table 2.1 Most severe variables that effects performance of the MQL applicator
Symbol Factors or variables Level (- or +)
Present Value (-) Experimental(+)
A Diameter of the nozzle injector 1 mm 0.5 mm
B Volume of the container 250 cc 100 cc
C Angle of the spray pattern 60° 30°
D Pulsing frequency 1450 800
Several experiments with the above 4 variables each with 2 levels are performed
and roughness is recorded. A total of 24 or 16 groups were to be tested and among the
different combinations, the ones with the best response outcome (surface roughness) in this

32
case are selected.Due to the time and resource constrained only 8 runs were taken and the
surface roughness was recorded. Preliminary experiments were conducted using a single
jet configuration to find out the viability of MQL application for hard milling and to find a
set of fluid application parameters that can provide minimum surface roughness. The p-
value and f-value of the variables are as shown in Table 2.2. This analysis was carried out
to identify the significance of the fluid application parameters on output performance using
Minitab 17.0 software. The interaction curve of the factors is shows in Fig. 2.2.
Table 2.2 F-value and P-value of the parameters from ANOVA analysis
Symbol Factors or variables F-value P-value
A Diameter of the nozzle injector 0.02 0.901
B Volume of the container 3.05 0.131
C Angle of the spray pattern 0.15 0.708
D Pulsing frequency 3.05 0.131
0
5
10
15
20
25
30
A+
A+
A-
A+A-
Impa
ct o
f A
A-
0
5
10
15
20
25
30C+
C+
C-
C-
A+
Impa
ct o
f C
A-
(a) (b)
Fig.2.2 Graphs(a) and (b) shows the interaction effects between A &D and A & C
2.4 Fabrication of Pulsed Jet MQL Applicator
Based on outcome of full factorial analysis, parameters of the rotary liquid
nitrogen applicator are finalized as shown in Table 2.3 and the components of the
applicator are describe below.
D- D+

33
Table 2.3 Selected parameters for final design of pulsed jet MQL applicator
Symbol Factors or variables Present Value (-)
Experimental (+)
Selected parameters for
final design
A Diameter of the nozzle injector 1 mm 0.5 mm 1 mm
B Volume of the container 250 cc 100 cc 250 cc
C Angle of the spray pattern 60° 30° 30°
D Pulsing frequency 1450 800 1450
The nozzle injector is one of the critical parts of the pulsed jet MQL applicator.
The pulse is provided with the help of a fuel pump. The fuel pump has a plunger with
helical groove which can rotate about its axis and the degree of rotation of the plunger
presets the quantity of fluid delivered per stroke. There is a provision for rotating the
plunger so that the quantity of fluid delivered per stroke can be controlled accurately. The
plunger reciprocates as an AC motor rotates and delivers one pulse of cutting fluid for each
revolution through the fluid injector. The fluid flow alternates in four different outlets.
Three of the outlets are closed and only one outlet is connected with the nozzle injector. A
regulator is used to provide variable speed of the motor which eventually controls the
pulsing frequency of the cutting fluid. The fluid coming out of the nozzle injector consists
of tiny droplets of 68 grade cutting oil. The experimental setup facilitates independent
variation of frequency of pulsing, rate of fluid application. A container was placed above
the fuel pump to provide 68 grade cutting oil. The regulator on the fuel pump was used to
control the amount of the cutting oil in each pulse. The nozzle injector was attached with
the outlet of the fuel pump by means of a semi flexible channel. The channel was used to
provide the nozzle injector the provision to move closer to the milling cutter during the
machining process.

34
Fig.2.3 Schematic view of Pulsed Jet MQL Applicator
The nozzle injector delivers cutting fluid at single pulse per revolution. This
facilitates the application of a minute amount of cutting fluid to be used per pulse during
the machining process. For example, if Q is the amount of fluid application in ml/min and
F is the frequency of pulsing in pulses/min, fluid application per pulse can be expressed as
Q/F. Pulsing jet aids in fluid minimization without compromising the velocity of
individual particles as the pressure at the fluid injector remains constant at the set value. If
the frequency of the pulsing can be varied, the rate of fluid delivery can also be controlled.
If Q is as low as 1 ml/min and the frequency F is 1000 pulses/min then the amount of fluid
delivered per pulse is equal to 0.001 ml.
Fig.2.4 Photographic view of the Pulsed Jet MQL Applicator
Nozzle Injector
Dynamometer
Charge Amplifier
Container
AC Motor
Fuel Pump

35
Two types of nozzle injector were used to test the setup and find the minimum
surface roughness during the experiment. The nozzle injector varied in respect of the spray
angle where one had an angle of 30° and the other had an angle of 60°. The spray angle
does not remain constant as spray length increases. To ensure the continuity of the flow
rate the nozzle injector was tested at different MQL rates and the repeatability of the
system was plotted as shown in Fig. 2.4. From the plot it is seen that the repeatibilty of the
process is always above 95 percent which ensures the consistency of the flow rate during
the experiment. Six different flow rates were tested by running the setup a total of ten
minutes for each flow rate and calculating the amount of the fluid after each minute.Also a
number of factors are responsible to determine the nozzle diameter size as well as the
spray angle of the nozzle injector. Depending on the flow rate and fluid type the nozzle
diameter and spray pattern varies.Liquids more viscous than water form smaller spray
angles, or solid streams, depending upon nozzle capacity, spray pressure, and viscosity.
Drop size increases with the decrease in spray pattern and high pressure process streams
force narrower spray angles. To achieve a wide spray angle normally low pressure streams
are used. As illustrated in the Fig.2.6 below, the spray angle tends to collapse or diverge
with increasing distance from the orifice. Spray coverage varies with spray angle. The
spray angle is assumed to remain constant throughout the entire spray distance.
0 5 100
100
200
300
400
500
Flow
Rat
e (m
l/hr)
Sample Number
Environment 50 ml.hr 75 ml/hr 100 ml/hr 150 ml/hr 200 ml/hr 400 ml/hr
Fig.2.5Repeatability check of the MQL applicator for different flow rates

36
Fig.2.6Schematic view of spray pattern of the cutting fluid
Fig.2.7 Photographic view of spray pattern of the cutting fluid
Fig.2.8CAD view of the nozzle injector Fig.2.9Sectional view of nozzle injector
Fig.2.10Photographic view of Nozzle Injector during milling process
30°
Nozzle Injector
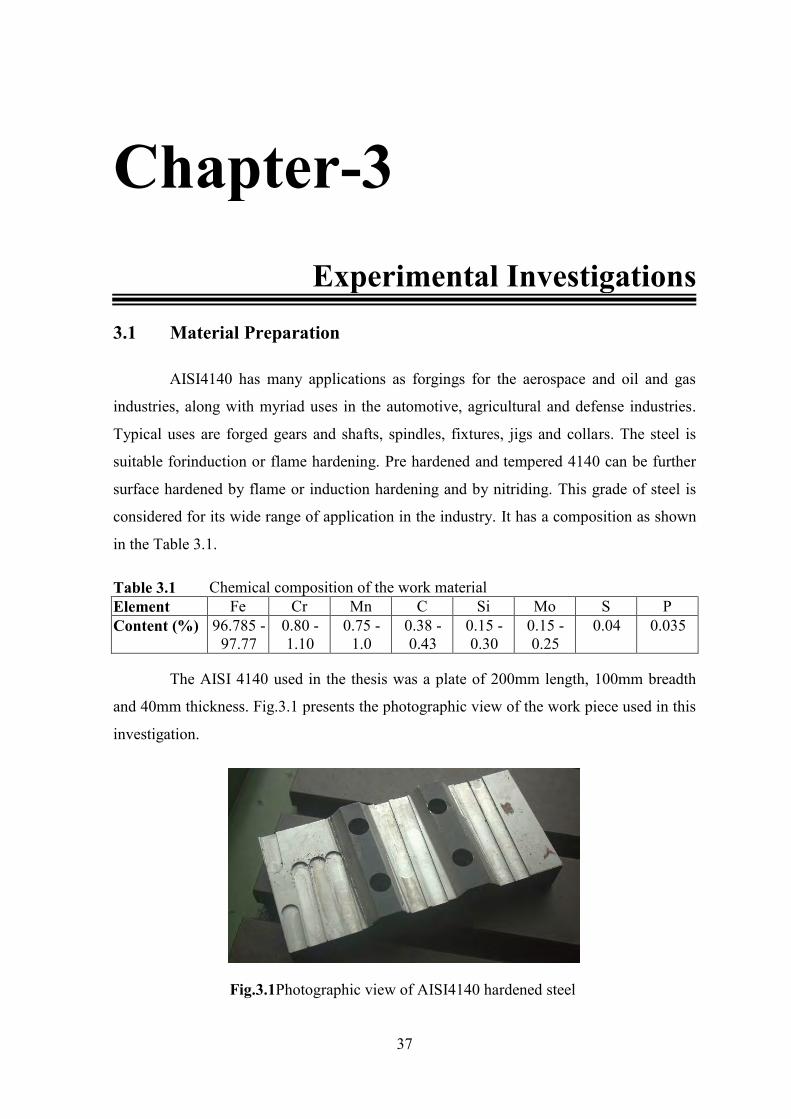
37
Chapter-3
Experimental Investigations 3.1 Material Preparation
AISI4140 has many applications as forgings for the aerospace and oil and gas
industries, along with myriad uses in the automotive, agricultural and defense industries.
Typical uses are forged gears and shafts, spindles, fixtures, jigs and collars. The steel is
suitable forinduction or flame hardening. Pre hardened and tempered 4140 can be further
surface hardened by flame or induction hardening and by nitriding. This grade of steel is
considered for its wide range of application in the industry. It has a composition as shown
in the Table 3.1.
Table 3.1 Chemical composition of the work material Element Fe Cr Mn C Si Mo S P Content (%) 96.785 -
97.77 0.80 -1.10
0.75 - 1.0
0.38 - 0.43
0.15 - 0.30
0.15 - 0.25
0.04 0.035
The AISI 4140 used in the thesis was a plate of 200mm length, 100mm breadth
and 40mm thickness. Fig.3.1 presents the photographic view of the work piece used in this
investigation.
Fig.3.1Photographic view of AISI4140 hardened steel

38
AISI 4140 was heated using an electric furnace (RG-3000C, 240 V, 32 amps) to
attain hardness level.Before loading the work piece, the furnace had to be made oxygen
free to avoid oxidation because a scale is formed on the surface of the work material
during hardening. Two ceramic pipes of internal diameters of 3 mm and 4.5 mm were
connected with the inlet and outlet of the furnace. The other end of the 3 mm internal
diameter pipe was attached to an argon gas cylinder. The electric furnace was sealed and
isolated from the atmosphere by placing an asbestos sheet on the door. Argon gas was then
passed at 7 liters/min and 130 bars pressure through the furnace chamber to drive out air to
make an inert environment. After a few minutes, the furnace was turned on and the
delivery rate of argon gas was dropped to 5.5 liters/min at a pressure of 130 bars. It took
three hours to raise the temperature to 900 C and the material was kept at the heating
chamber for one and a half hour.
For quenching the material a tank of 600 liter capacity was used. Thetemperature
of the quench bath was around 40°C.This oil reduces the absorption of atmospheric gases
that, in turn reduces the amount of bubbles.As a result, the metal surface is drenched with
oil, which cools the surfacemore rapidly than water andremoves a large percentage ofany
scale that may be present.The work piece was taken out from the furnace using a tong and
was immersed vertically into the oil quenching tank without any intermediate delay. The
oil is stirred vigorously for about 20 minutes for uniform cooling and was continued until
the specimen is cool enough.
While quenching several internal stresses like residual stresses are built inside the
material. To relieve the internal stresses and reduce brittleness, tempering should be done.
It was done by heating the workpiece to a specifictemperature (3000C), holdingit at that
temperature for two hours, andthen cooling it, usually inair. The resultant
strength,hardness, and ductility depend on the temperature towhich the specimen is heated
during the tempering process.
3.2 Selection of Cutting Tool
A four flute end mill cutter was used surface mill hardened AISI 4140 steel. The
end mill cutter had a diameter of 12 and a 30-degree helix angle. The length of the flute is
20 mm with a shank of 65mm. The tool’s square end creates sharp, unrounded cuts, and

39
the center-cutting design has cutting teeth at the end of the tool, so it can be fed into the
workpiece like a drill bit. Four flutes produce a better finish than fewer flutes.
End mills are designed to remove material and create multi-dimensional shapes
and profiles. They have cutting edges along the outside diameter and flutes that remove
chips from the cutting area and allow cooling fluids to enter.
Fig.3.2Schematic view of four flute end milling cutter
Fig.3.3 Photographic view of four flute end milling cutter
65
20

40
3.3 Experimental Procedure and Conditions
Compared to the traditional flood cooling, MQL has a number of advantages, the
experiment was primarily performed to find out the effect of MQL application on surface
milling of hardened AISI4140 steel in terms of surface roughness, cutting force and flank
wear of the cutting tool.
The machining test has been carried out by milling of hardened steel in a column
and knee type vertical milling machine (7.5 hp, Sunlike, China) by four flutecarbide
milling cutter at different cutting velocities (Vc) and feeds (So) under dry and MQL cutting
condition.The conditions under which the machining tests have been carried out are briefly
given in Table 3.2.
Table 3.2 Experimental conditions
Machine Tool : Vertical Knee and Column type Milling Machine, China
Work Materials : AISI4140 Hardened steel (dimension: 200x100x40 mm)
Hardness : 40 HRC
Cutting Tool : Carbide End Milling Cutter (Ø12 mm)
Process Parameters
Cutting speed : 12, 16, 22, 27 and 32 m/min
Table feed : 22, 34, 44 and 68 mm/min
Depth of cut : 1.0 mm Cutting Fluid : VG 68 Straight cut cutting oil
Environment : Dry and MQL
MQL Flow rate 50 ml/hr 75 ml/hr 100 ml/hr 150 ml/hr 200 ml/hr
Carbide end mill cutter (Ø12 mm) which has helical higher positive cutting edges
as shown in Fig.3.2 was used in the investigation with straight shank. Cutting force was
measured using a dynamometer. It consists of a load cell type dynamometer with charge
amplifier. The surface roughness of the machined surface after each operation was
measured by a Talysurf roughness checker(Surtronic 3+, Rank Hobson, UK) using a

41
sampling length of 0.8mm.The width of the flank wear was measured using metallurgical
microscope (Carl Zeiss, Germany) fitted with micrometer of 1μm resolution.
3.4 Experimental Results
In the present work, surface roughness, cutting force and flank wear have been
investigated to study the role of Pulsed Jet MQLand to compare with dry milling at
different cutting velocities and table feeds. The cutting speed started from 12 m/min
reaching 5 different levels while table feed started from 22 mm/min at 4 levels and the
depth of cut was 1.0 mm during the surface milling. Tool life tests were conducted at a
cutting velocity of 32 m/min, table feed 68 mm/min and depth of cut 1.5 mm.
Measurements of surface roughness, cutting force and tool wear were done at specific
intervals during each experiment.
3.4.1 Surface Roughness
Surface roughness indicates the state of a machined surface.The shape and size of
irregularities on a machined surface have a major impact on the quality and performance
of that surface, and on the performance of the end product. Measurement of surface
roughness, is necessary to maintain high product performance. Surface integrity, in turn
depends on surface roughness, oxidation, corrosion, residual stresses and surface and
subsurface microcracks.
Surface roughness is an important characteristics to attain during machinability
and is influenced by a number of factors, primarily on tool-work combination and speed-
feed rate combination.
Surface roughness was measured at two different stages,during the calculation of
cutting force, a surface milling operation of 40 mm was done with a depth of cut of 1.50
mm to calculate the surface roughness at different feed and cutting velocity combinations.
The second calculation was done during the measurement of the flank wear where a new
four flute end mill cutter was used to perform the machining operation. After specific
preset machining time, the flank wear of the tool and the surface roughness was measured.
The surface roughness attained during milling of the hardened AISI4140 steel at various
cutting speed and table feed combinations under dry and MQL cooling conditions are

42
shown in Fig.3.4, Fig.3.5, Fig.3.6, Fig.3.7, and Fig.3.7 respectively. The variation of
roughness observed with progress of milling of AISI4140 hardened steel at a particular set
of cutting velocity and table feed under dry, MQL cooling conditions have been shown in
Fig.3.13.
15 20 25 30 350.5
1.0
1.5
2.0
Work material: AISI 4140 SteelFeed Rate: 22 mm/minDepth of cut: 1.50 mm
Surf
ace
Rou
ghne
ss (
m)
Cutting Velocity (m/min)
Environment Dry 50 ml/hr 75 ml/hr 100 ml/hr 150 ml/hr 200 ml/hr
Fig.3.4 Variation of surface roughness with that of cutting velocity at 22 mm/min table
feed under dry and MQL with different flowrates.
15 20 25 30 350.5
1.0
1.5
2.0
Work material: AISI 4140 SteelFeed Rate: 34 mm/minDepth of cut: 1.50 mm
Surf
ace
Rou
ghne
ss (
m)
Cutting Velocity (m/min)
Environment Dry 50 ml/hr 75 ml/hr 100 ml/hr 150 ml/hr 200 ml/hr
Fig.3.5 Variation of surface roughness with that of cutting velocity at 34 mm/min table
feed under dry and MQL with different flowrates.
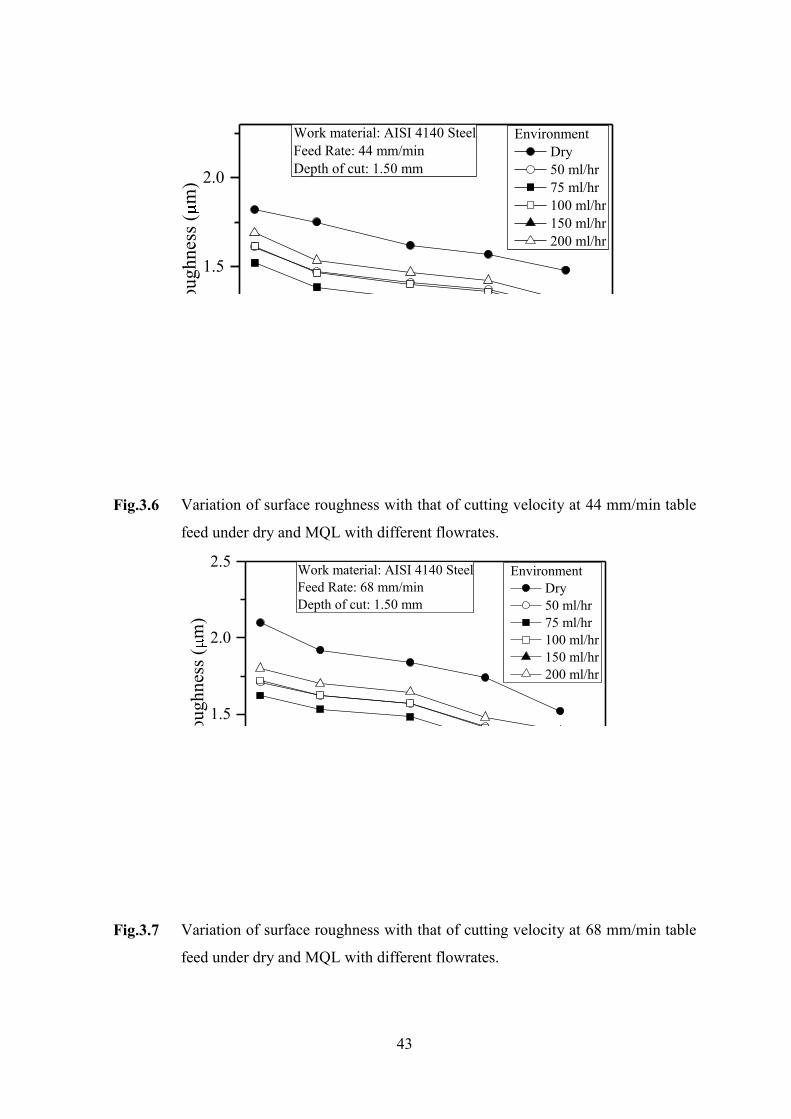
43
15 20 25 30 35
1.0
1.5
2.0
Work material: AISI 4140 SteelFeed Rate: 44 mm/minDepth of cut: 1.50 mm
Surf
ace
Rou
ghne
ss (
m)
Cutting Velocity (m/min)
Environment Dry 50 ml/hr 75 ml/hr 100 ml/hr 150 ml/hr 200 ml/hr
Fig.3.6 Variation of surface roughness with that of cutting velocity at 44 mm/min table
feed under dry and MQL with different flowrates.
15 20 25 30 35
1.0
1.5
2.0
2.5 Work material: AISI 4140 SteelFeed Rate: 68 mm/minDepth of cut: 1.50 mm
Surf
ace
Rou
ghne
ss (
m)
Cutting Velocity (m/min)
Environment Dry 50 ml/hr 75 ml/hr 100 ml/hr 150 ml/hr 200 ml/hr
Fig.3.7 Variation of surface roughness with that of cutting velocity at 68 mm/min table
feed under dry and MQL with different flowrates.

44
20 25 30 35 40 45 50 55 60 65 70
1.0
1.5
2.0
2.5
3.0Work material: AISI 4140 SteelCutting Velocity: 12 m/minDepth of cut: 1.50 mm
Surf
ace
Rou
ghne
ss (
m)
Feed Rate (mm/min)
Environment Dry 50 ml/hr 75 ml/hr 100 ml/hr 150 ml/hr 200 ml/hr
Fig.3.8 Variation of surface roughness with that of feed rate at 12 m/min cutting
velocity under dry and MQL with different flowrates.
20 25 30 35 40 45 50 55 60 65 70
1.0
1.5
2.0
2.5Work material: AISI 4140 SteelCutting Velocity: 16 m/minDepth of cut: 1.50 mm
Surf
ace
Rou
ghne
ss (
m)
Feed Rate (mm/min)
Environment Dry 50 ml/hr 75 ml/hr 100 ml/hr 150 ml/hr 200 ml/hr
Fig.3.9 Variation of surface roughness with that of feed rate at 16 m/min cutting
velocity under dry and MQL with different flowrates.

45
20 25 30 35 40 45 50 55 60 65 70
1.0
1.5
2.0
2.5Work material: AISI 4140 SteelCutting Velocity: 22 m/minDepth of cut: 1.50 mm
Surf
ace
Rou
ghne
ss (
m)
Feed Rate (mm/min)
Environment Dry 50 ml/hr 75 ml/hr 100 ml/hr 150 ml/hr 200 ml/hr
Fig.3.10 Variation of surface roughness with that of feed rate at 22 m/min cutting
velocity under dry and MQL with different flowrates.
20 25 30 35 40 45 50 55 60 65 70
1.0
1.5
2.0
2.5Work material: AISI 4140 SteelCutting Velocity: 27 m/minDepth of cut: 1.50 mm
Surf
ace
Rou
ghne
ss (
m)
Feed Rate (mm/min)
Environment Dry 50 ml/hr 75 ml/hr 100 ml/hr 150 ml/hr 200 ml/hr
Fig.3.11 Variation of surface roughness with that of feed rate at 27 m/min cutting
velocity under dry and MQL with different flowrates.

46
20 25 30 35 40 45 50 55 60 65 700.5
1.0
1.5
2.0
2.5Work material: AISI 4140 SteelCutting Velocity: 32 m/minDepth of cut: 1.50 mm
Surf
ace
Rou
ghne
ss (
m)
Feed Rate (mm/min)
Environment Dry 50 ml/hr 75 ml/hr 100 ml/hr 150 ml/hr 200 ml/hr
Fig.3.12 Variation of surface roughness with that of feed rate at 32 m/min cutting
velocity under dry and MQL with different flowrates.
0 2 4 6 8 10 120
1
2
3
4
5 Work material: AISI 4140 SteelCutting Velocity: 32 m/minFeed Rate: 68 mm/minDepth of cut: 1.50 mm
Surf
ace
Rou
ghne
ss (µ
m)
Time (min)
Environment Dry 75 ml/hr
Fig.3.13 Variation of surface roughness with time at 32 m/min cutting velocity and 68
mm/min table feed rate under dry and MQL.

47
3.4.2 Cutting Force
In milling, cutting forces are exerted in three planes to deform and shear away
material in the form of a chip.Forces experienced by a tool during cutting are detrimental
in design of mechanical structure of cutting machine, predicting power consumption,
determining the tool life and increasing the productivity. Tangential cutting forces
overcome the resistance to rotation and accounts for 70 percent of the total force. Feed
forces account for 20 percent of the total force. Radial forces tend to push away the tool
and account for 10 percent of the cutting forces.Cutting forces are generally resolved into
components in mutual perpendicular directions for convenience of measurement, analysis,
estimation of power consumption and for design of machine-fixture-tool-work systems. In
the present work, the magnitude of cutting force has been monitored by dynamometer at
different cutting velocity and table feed combinations under dry andMQL conditions. The
effects of MQL on the cutting force under different machining conditions have been shown
in Fig.3.14, Fig.3.15, Fig.3.16, Fig.3.17, Fig.3.18, Fig.3.19, Fig.3.20, Fig.3.21, and
Fig.3.22respectively. The variation of cutting force observed with progress of milling of
AISI4140 hardened steel at a particular set of cutting velocity and table feed under dry,
and MQL conditions have been shown in Fig.3.23.
10 15 20 25 30 3560
80
100
120
140
160Work material: AISI 4140 SteelTable feed: 22 mm/minDepth of cut: 1.50 mm
Cut
ting
Forc
e (N
)
Cutting Velocity (m/min)
Environment Dry 50 ml/hr 75 ml/hr 100 ml/hr 150 ml/hr 200 ml/hr
Fig.3.14 Variation of cutting force with that of cutting velocity at 22mm/min table feed
rate under dry and MQL with different flowrates.

48
10 15 20 25 30 3580
100
120
140
160
180
200 Work material: AISI 4140 SteelTable feed: 34 mm/minDepth of cut: 1.50 mm
Cut
ting
Forc
e (N
)
Cutting Velocity (m/min)
Environment Dry 50 ml/hr 75 ml/hr 100 ml/hr 150 ml/hr 200 ml/hr
Fig.3.15 Variation of cutting force with that of cutting velocity at 34mm/min table feed
rate under dry and MQL with different flowrates.
10 15 20 25 30 35
100
120
140
160
180
200
220Work material: AISI 4140 SteelTable feed: 44 mm/minDepth of cut: 1.50 mm
Cut
ting
Forc
e (N
)
Cutting Velocity (m/min)
Environment Dry 50 ml/hr 75 ml/hr 100 ml/hr 150 ml/hr 200 ml/hr
Fig.3.16 Variation of cutting force with that of cutting velocity at 44mm/min table feed
rate under dry and MQL with different flowrates.

49
10 15 20 25 30 35100
120
140
160
180
200
220
240
260 Work material: AISI 4140 SteelTable feed: 68 mm/minDepth of cut: 1.50 mm
Cut
ting
Forc
e (N
)
Cutting Velocity (m/min)
Environment Dry 50 ml/hr 75 ml/hr 100 ml/hr 150 ml/hr 200 ml/hr
Fig.3.17 Variation of cutting force with that of cutting velocity at 68mm/min table feed
rate under dry and MQL with different flowrates.
20 25 30 35 40 45 50 55 60 65 7080
100
120
140
160
180
200
220
240 Work material: AISI 4140 SteelCutting Velocity: 12 m/minDepth of cut: 1.50 mm
Cut
ting
Forc
e (N
)
Feed Rate (mm/min)
Environment Dry 50 ml/hr 75 ml/hr 100 ml/hr 150 ml/hr 200 ml/hr
Fig.3.18 Variation of cutting force with that of feed rate at 12m/min cutting velocity
under dry and MQL with different flowrates.

50
20 25 30 35 40 45 50 55 60 65 70
80
100
120
140
160
180
200
220 Work material: AISI 4140 SteelCutting Velocity: 16 m/minDepth of cut: 1.50 mm
Cut
ting
Forc
e (N
)
Feed Rate (mm/min)
Environment Dry 50 ml/hr 75 ml/hr 100 ml/hr 150 ml/hr 200 ml/hr
Fig.3.19 Variation of cutting force with that of feed rate at 16m/min cutting velocity
under dry and MQL with different flowrates.
20 25 30 35 40 45 50 55 60 65 70
80
100
120
140
160
180
200 Work material: AISI 4140 SteelCutting Velocity: 22 m/minDepth of cut: 1.50 mm
Cut
ting
Forc
e (N
)
Feed Rate (mm/min)
Environment Dry 50 ml/hr 75 ml/hr 100 ml/hr 150 ml/hr 200 ml/hr
Fig.3.20 Variation of cutting force with that of feed rate at 22m/min cutting velocity
under dry and MQL with different flowrates.

51
20 25 30 35 40 45 50 55 60 65 7040
60
80
100
120
140
160
180
200 Work material: AISI 4140 SteelCutting Velocity: 27 m/minDepth of cut: 1.50 mm
Cut
ting
Forc
e (N
)
Feed Rate (mm/min)
Environment Dry 50 ml/hr 75 ml/hr 100 ml/hr 150 ml/hr 200 ml/hr
Fig.3.21 Variation of cutting force with that of feed rate at 27m/min cutting velocity
under dry and MQL with different flowrates.
20 25 30 35 40 45 50 55 60 65 7060
80
100
120
140
160 Work material: AISI 4140 SteelCutting Velocity: 32 m/minDepth of cut: 1.50 mm
Cut
ting
Forc
e (N
)
Feed Rate (mm/min)
Environment Dry 50 ml/hr 75 ml/hr 100 ml/hr 150 ml/hr 200 ml/hr
Fig.3.22 Variation of cutting force with that of feed rate at 32m/min cutting velocity
under dry and MQL with different flowrates.

52
0 2 4 6 8 10 120
50
100
150
200
250
300
350
400
450
500 Work material: AISI 4140 SteelCutting Velocity: 32 m/minFeed Rate: 68 mm/minDepth of cut: 1.50 mm
Cut
ting
Forc
e (N
)
Time (min)
Environment Dry 75 ml/hr
Fig.3.23 Variation of cutting force with time at 12m/min cutting velocity and 68 mm/min
table feed rate under dry and MQL.
3.4.3 Flank Wear
Cutting tool wear is a critical phenomenon during machining process. During
milling, the cutting tool generally fails by abrasion, adhesion, diffusion, chemical erosion
etc. depending upon the tool-work materials and milling condition. Tool wear initiates
with a faster rate, commonly known as break-in-wear, which is caused by micro chipping
at the sharp cutting edge. Premature fail often occurs by mechanical breakage and plastic
deformation under adverse milling conditions. However, in the present investigations with
the cutter and work material and the milling conditions undertaken, the tool failure mode
has been mostly gradual wear.
The growth of flank wear of the four flute end mill cutter has been measured at
preset time intervals of milling operation while recording the cutting force and second,
with the progress of machining time. The growth of flank wear attained after preset
intervals of milling at a specific cutting speed and table feed combination under dry and
MQL conditions are shown in Fig.3.24. The growth of flank wearand corresponding

53
cutting force with progress of milling at a particular set of cutting velocity and table feed
under dry and MQL conditions have been shown in Fig.3.25.
0 2 4 6 8 10 120
20
40
60
80
100
120Work material: AISI 4140 SteelCutting Velocity: 32 m/minFeed Rate: 68 mm/minDepth of cut: 1.50 mm
Tool
Wea
r VB
(µm
)
Time (min)
Environment Dry 75 ml/hr
Fig.3.24 Growth of tool wear with time at 32m/min cutting velocity and 68 mm/min
table feed rate under dry and MQL.
0 20 400
10
20
30
40
50
60
70
80
90
100
Work material: AISI 4140 SteelCutting Velocity: 32 m/minFeed Rate: 68 mm/minDepth of cut: 1.50 mm
Flan
k W
ear (
m)
Cutting Force (N)
Environment Dry 75 ml/hr
Fig.3.25 Variation of flank wear with that of cutting force at 32m/min cutting
velocityand 68 mm/min table feed rate under dry and MQL.
The relationship between cutting velocity, feed rate and surface roughness are
shown in Fig.3.26, Fig.3.27, Fig.3.28, Fig.3.29, Fig. 3.30 and Fig.3.31 for different cutting
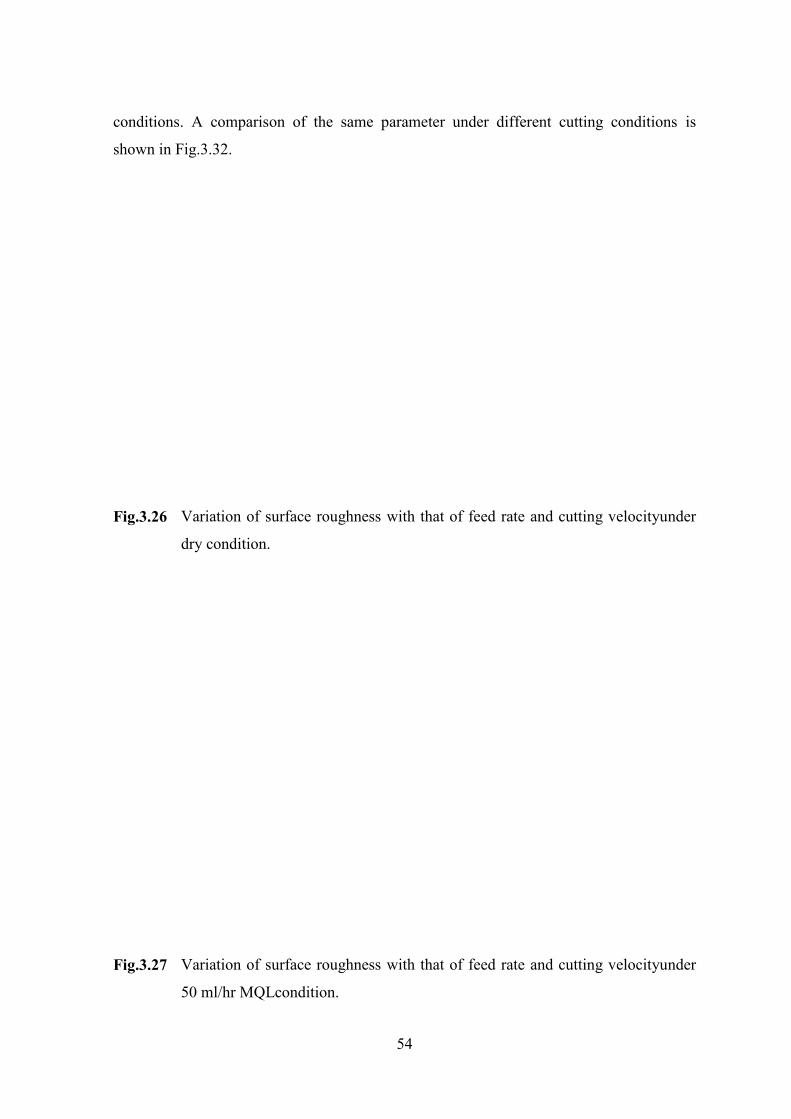
54
conditions. A comparison of the same parameter under different cutting conditions is
shown in Fig.3.32.
15
20
25
3024
36
48
60
0.75
1.00
1.25
1.50
1.75
2.00
Feed Rate (mm/min)
Surf
ace R
oughness (
m)
Cutti
ng Velo
city
(m/m
in)
Fig.3.26 Variation of surface roughness with that of feed rate and cutting velocityunder
dry condition.
15
20
25
3024
36
48
60
0.75
1.00
1.25
1.50
1.75
2.00
Feed Rate (mm/min)
Surf
ace R
oughness (
m)
Cutti
ng Velo
city
(m/m
in)
Fig.3.27 Variation of surface roughness with that of feed rate and cutting velocityunder
50 ml/hr MQLcondition.

55
15
20
25
3024
36
48
60
0.75
1.00
1.25
1.50
1.75
2.00
Feed Rate (mm/min)
Surf
ace R
oughness (
m)
Cutti
ng Velo
city
(m/m
in)
Fig.3.28 Variation of surface roughness with that of feed rate and cutting velocityunder
75 ml/hr MQLcondition.
15
20
25
3024
36
48
60
0.75
1.00
1.25
1.50
1.75
2.00
Feed Rate (mm/min)
Surf
ace R
oughness (
m)
Cutti
ng Velo
city
(m/m
in)
Fig.3.29 Variation of surface roughness with that of feed rate and cutting velocityunder
100 ml/hr MQLcondition.

56
15
20
25
3024
36
48
60
0.75
1.00
1.25
1.50
1.75
2.00
Feed Rate (mm/min)
Surf
ace R
oughness (
m)
Cutti
ng Velo
city
(m/m
in)
Fig.3.30 Variation of surface roughness with that of feed rate and cutting velocityunder
150 ml/hr MQLcondition.
15
20
25
3024
36
48
60
0.75
1.00
1.25
1.50
1.75
2.00
Feed Rate (mm/min)
Surf
ace R
oughness (
m)
Cutti
ng Velo
city
(m/m
in)
Fig.3.31 Variation of surface roughness with that of feed rate and cutting velocityunder
200 ml/hr MQLcondition.

57
0.75
1.00
1.25
1.50
1.75
2.00
24
36
48
60
15
20
25
30
S
urf
ace R
oughness (
m)
Cutting Velocity (m/min) Feed
Rat
e (m
m/m
in)
Fig.3.32 Variation of surface roughness with that of feed rate and cutting velocityunder
dry and MQL with different flowrates.
50 ml/hr 75 ml/hr 150 ml/hr
Dry 200 ml/hr 100 ml/hr
58
Chapter-4
Discussion on Experimental Results 4.1 Surface Roughness
A number of parameters are attributed to define the quality of a workpiece after
different machining processes. The quality of a work material is the main determinant of
its functional ability throughout its service life. A significant proportion of component
failure starts at the surface due to either an isolated manufacturing discontinuity or gradual
deterioration of the surface quality.
Mass finishing processes have been widely adopted throughout industry as the
optimum methodology for producing controlled edge and surface finish effects on many
types of machined and fabricated components. In recent years, mass-media finishing
processes have gained widespread acceptance in many industries, primarily as a
technology for reducing the costs of producing edge and surface finishes. Variations in the
surface texture can influence a variety of performance characteristics. The surface finish
can affect the ability of the part to resist wear and fatigue; to assist or destroy effective
lubrication; to increase or decrease friction and/or abrasion with mating parts; and to resist
corrosion. As these characteristics become critical under certain operating conditions, the
surface finish can dictate the performance, integrity and service life of the
component.Surface finish is also an important index of machinability or grindability
because performance and service life of the machined/ground component are often
affected by its surface finish, nature and extent of residual stresses and presence of surface
or subsurface microcracks, if any, particularly when that component is to be used under
dynamic loading or in conjugation with some other mating part(s). Generally, good surface
finish, if essential, is achieved by finishing processes like grinding but sometimes it is left
to machining. Even if it is to be finally finished by grinding, machining prior to that needs
to be done with surface roughness as low as possible to facilitate and economize the
grinding operation and reduce initial surface defects as far as possible.

59
Cutting fluid improves the surface integrity of work material. As it reduces the
temperature, leading to less wear of the tool, the surface finish of the work material
improves. Moreover, cutting fluid acts as a lubricant that enhances the surface integrity of
the material. However, excessive usage of the cutting fluid not only creates environmental
impact and adheres to the increased cost of manufacturing. Although most of the cutting
fluid used in flood cooling is not completely used in the machining process. In this
scenario, use of Pulsed Jet Minimum Quantity Lubricant has improved the surface
roughness in a number of ways. The MQL process enhances the chip breakability during
machining and reduces the tendency of chip’s adhesion to the tool resulting in less scratch
on the surface finish. Smaller roughness measurements reflect better surface quality of the
workpiece. Surface finish is largely influenced by the cutting force, tool wear and chip
formation. For the current investigative study, surface roughness has been considered as
the main parameter to define quality of the machined work material under dry and MQL
cutting.
Fig.3.4 to Fig.3.32 shown in the previous chapter have expressed a number of
significant impacts of different parameters on the quality of the work material. Fig.3.4 to
Fig.3.7are showing how and to what extent surface roughness has improved with the
increase of the cutting velocity. It is evident from the figures that use of MQL in different
amounts improves the surface finish of the work material, but to different degrees. The
figures express that in almost all the cases, an improvement of the surface finish is found
compared to dry condition. Out of the different flow ratesMQL with 150ml/hr flowrate has
shown the most significant improvement in terms of surface finish under different cutting
velocity. The improvement in surface roughness by increasing the cutting speed can be
explained by being an easy deformation process because of the increasing temperature at
high speeds, i.e. the easydeformation of workpiece type at the cutting side
and around the tip radius. The easily deformed materials can be formed without being
torn.By working at low speeds, the considerable improvement in surface roughness by
increasing thecutting speed reveals the effect ofcutting speed on the surface roughness
clearly. Fig.3.8 to Fig.3.12 depict the change of surface roughness with the change in feed
rate under different cutting conditions. In all the figures it is seen that at a specific cutting
velocity the increase in feed rate decreases the surface integrity i.e. increases the surface
roughness. Although in all the cases, the surface roughness increases with the increase in
the feed rate, the amount of increase varied under dry and different MQL conditions. The
60
percentage reduction in surface roughness attained by dry and MQL cooling condition for
different cutting velocity and table feed has been extracted from the previous figures and
shown in Table 4.1.
It is evident from figuresthat MQL cooling could provide good improvement in
surface finish at the beginning of machining with the fresh cutting edges. This has been
more or less true for all the experimental combinations undertaken as can be seen in
Fig.3.4 to Fig.3.12. This improvement in surface finish by MQL cooling might be due to
the thrust force along with the cutting fluid, reduction in break-in wear and also possibly
reduction or prevention of built-up edge formation depending upon the work material and
cutting condition.
Surface roughness was also measured at different intervals during the
measurement of the tool wear. It was found that with the increase of the machining time,
surface roughness grew substantially. This can be attributed to the increase in the flank
wear with the increase of the machining time. Fig.3.13 also exhibits the same phenomenon
but in most of the readings that were taken, the surface roughness in the dry machining
was higher compared to that of machining with MQL cooling system. Comparison of the
Fig.3.24 with those from Fig.3.13 reveals that the pattern of growth of surface roughness
bears close similarity with that of growth of flank wear in particular. This observation
strengthens the presence of the correlation between flank wear and surface roughness
during dry and MQL cooled machining. Wear at the tool flanks is caused mainly by micro-
chipping and abrasion unlike crater wear where adhesive and diffusion wear are
predominant particularly in machining steels by uncoated carbides. The minute grooves
produced by abrasion and chipping roughen the cutting edge at the tool-tip, which is
directly reflected on the finished surface.Thus it is evident from Fig.3.13 that
millingAISI4140 hardened steel by carbide milling cutter results increase in surface
roughness but at different degrees in dry and MQL cooled machining. However, the degree
at which the surface roughness increased is found more in dry machining than that of MQL
cooled machining.Thus, it can be concluded that MQL shows substantial improvement in
respect of surface finish than dry machining.

61
Table 4.1 Reduction in surface roughness due to dry and MQL cooling in milling
AISI4140 hardened steel
Feed Rate (mm/min)
Cutting Velocity (m/min)
Environment Percentage Reduction in Surface Roughness
Dry MQL (ml/hr)
50 75 100 150 200 50 ml/hr
75 ml/hr
100 ml/hr
150 ml/hr
200 ml/hr Surface Roughness (μm)
22.0
12 1.60 1.38 1.29 1.37 0.86 1.43 13.75 19.25 14.41 46.53 10.37
16 1.50 1.31 1.22 1.30 0.81 1.36 12.67 18.53 13.65 45.85 9.57
22 1.45 1.21 1.12 1.19 0.75 1.25 16.55 22.62 17.98 48.26 14.11
27 1.41 1.18 1.09 1.16 0.73 1.21 16.31 22.55 17.91 48.11 14.03
32 1.35 1.08 0.99 1.05 0.67 1.10 20.00 26.52 22.11 50.40 18.44
34.0
12 1.75 1.52 1.43 1.52 0.94 1.59 13.14 18.17 13.26 46.15 9.17
16 1.65 1.40 1.31 1.39 0.87 1.46 15.15 20.48 15.71 47.39 11.74
22 1.54 1.38 1.29 1.37 0.86 1.43 10.39 16.10 11.07 44.44 6.88
27 1.51 1.25 1.16 1.23 0.78 1.29 17.22 23.05 18.43 48.68 14.58
32 1.42 1.18 1.09 1.16 0.73 1.21 16.90 23.10 18.48 48.48 14.64
44.0
12 1.82 1.61 1.52 1.61 1.00 1.69 11.54 16.37 11.36 45.15 7.17
16 1.75 1.47 1.38 1.46 0.91 1.53 16.00 21.03 16.29 47.92 12.34
22 1.62 1.41 1.32 1.40 0.87 1.47 12.96 18.40 13.50 46.04 9.42
27 1.57 1.37 1.28 1.36 0.85 1.42 12.74 18.34 13.44 45.90 9.36
32 1.48 1.27 1.18 1.25 0.79 1.31 14.19 20.14 15.34 46.80 11.35
68.0
12 2.10 1.71 1.62 1.72 1.06 1.80 18.57 22.76 18.13 49.51 14.27
16 1.92 1.62 1.53 1.62 1.00 1.70 15.63 20.21 15.42 47.69 11.43
22 1.84 1.57 1.48 1.57 0.97 1.65 14.67 19.46 14.62 47.10 10.60
27 1.74 1.42 1.33 1.41 0.88 1.48 18.39 23.45 18.86 49.40 15.03
32 1.52 1.34 1.25 1.33 0.83 1.39 11.84 17.63 12.69 45.34 8.57

62
4.2 Cutting Force
Cutting force is one of the key concerns of any machining process. Cutting force,
along with other parameters attribute to the product quality, functionality and machining
cost. Cutting force increases with the increase of the material strength, shear strength to be
specific. Increase in the cutting force during machining is always detrimental as it
decreases the tool life and increases the surface roughness. Numerous researches have
been carried out to decrease the magnitude of the cutting force during machining.The
figures from Fig.3.14 to Fig.3.22demostratethe change of cutting forces with respect to
different cutting parameters. In almost all the figures representing cutting force as a
function of cutting velocity, it is evident that with the increase in cutting velocity, the
required cutting force decrease although the degree of the change differs with different
machining conditions. However, it is seen that with the increase in table feed rate the
required amount of cutting force increases. This can be attributed to the fact that with the
increase of the table feed rate, the amount of energy required to remove the material
increases. The percentage reduction in cutting force attained by dry and MQL cooling
condition for different cutting velocity and table feed have been extracted from the
previous figures and shown in Table 4.2. It is evident from the figures that the cutting
force required are comparatively low in MQL cooled milling processes and an MQL
condition of 150 ml/hr has provided the best result in terms of improved surface roughness
and lesser cutting force as well as 75 ml/hr.Fig.3.23 shows the variation of cutting force
with machining time while milling AISI4140 hardened steel by carbide milling cutter
under different conditions. The figure depicts that the cutting force increases with the
machining time, along with the increase of the flank wear, evident from Fig.3.24. Thus it
can be concluded that the increase of the substantial cutting force is mainly due to the
increase of the tool wear during the machining process. However, the degree of increase of
thecutting force is more in the dry cutting condition than in the MQL condition of 75
ml/hr.

63
Table 4.2 Reduction in cutting force due to dry and MQL cooling in milling AISI4140
hardened steel
Feed Rate (mm/min)
Cutting Velocity (m/min)
Environment Percentage Reduction in Cutting Force
Dry MQL (ml/hr)
50 75 100 150 200 50 ml/hr
75 ml/hr
100 ml/hr
150 ml/hr
200 ml/hr Cutting Force (N)
22.0
12 15.0 12.0 10.4 11.6 10.4 11.8 20.00 30.67 22.35 30.40 21.65
16 14.0 10.8 9.8 11.0 9.4 11.1 22.86 30.00 21.60 32.89 20.90
22 12.0 9.2 8.2 9.2 8.0 9.3 23.33 31.67 23.47 33.30 22.78
27 11.5 8.7 7.5 8.4 7.6 8.5 24.35 34.78 26.96 34.18 26.30
32 10.0 7.5 7.2 8.1 6.5 8.1 25.00 28.00 19.36 34.75 18.64
34.0
12 18.5 15.8 12.5 14.0 13.7 14.1 14.59 32.43 24.32 25.70 23.65
16 17.0 13.8 11.8 13.2 12.0 13.3 18.82 30.59 22.26 29.38 21.56
22 15.4 12.2 10.5 11.8 10.6 11.9 20.78 31.82 23.64 31.08 22.95
27 14.2 11.8 9.8 11.0 10.3 11.1 16.90 30.99 22.70 27.70 22.01
32 12.5 10.2 8.7 9.7 8.9 9.8 18.40 30.40 22.05 29.01 21.35
44.0
12 21.2 19.0 15.0 16.8 16.5 17.0 10.38 29.25 20.75 22.03 20.05
16 19.3 17.0 13.8 15.5 14.8 15.6 11.92 28.50 19.92 23.37 19.20
22 16.8 15.0 12.1 13.6 13.1 13.7 10.71 27.98 19.33 22.32 18.61
27 15.3 13.1 11.8 13.2 11.4 13.3 14.38 22.88 13.62 25.51 12.85
32 13.4 11.5 10.3 11.5 10.0 11.6 14.18 23.13 13.91 25.34 13.14
68.0
12 23.8 21.5 16.4 18.4 18.7 18.5 9.66 31.09 22.82 21.41 22.13
16 21.0 19.0 14.3 16.0 16.5 16.2 9.52 31.90 23.73 21.29 23.05
22 19.0 16.8 13.5 15.1 14.6 15.3 11.58 28.95 20.42 23.07 19.71
27 17.2 14.8 12.1 13.6 12.9 13.7 13.95 29.65 21.21 25.14 20.51
32 15.3 12.8 11.8 13.2 11.1 13.3 16.34 22.88 13.62 27.22 12.85

64
4.3 Flank Wear
Flank wear is another critical part of any machining process. Flank wear attributes
to the increase of the surface roughness as well as the increase of the cutting force,
requiring substantial amount of energy for machining. The four flute end mill cutter used
in the surface milling exhibited different types of flank wears under different conditions.
Although both dry and MQL condition cutting was performed using the four flute end mill
cutter, no sudden failure of the tool or catastrophic failure was found. The premature
failures mainly happen because of the plastic deformation or macro fractures in the tool
that propagates during machining process.It is also evident from Fig.3.24 that dry
millinghas a higher tool wear rate than that of MQL cutting condition. This can be
attributed to the retention of hardness and sharpness of the cutting edge of the four flute
end mill cutter because of the precise cooling at the chip tool interface, protecting the
newly formed fresh material surface from oxidation and corrosion. MQL also helped in
preventing the BUE and increasing the rate of chip removal during the machining process.
During the dry machining process the rate of flank wear propagation was higher than that
of the MQL condition which indicates that the tool life increases with the MQL applicator.
Fig.3.26 to Fig.3.31 depicts the variation of surface roughness with cutting
velocity and feed rate and from the comparison it is evident that with the decrease of the
cutting velocity surface roughness increases and also with the increase of the feed rate
surface roughness decreases. Fig 3.32 depicts comparison between different machining
conditions and reveals that during dry machining, surface roughness is found to be highest
and an MQL flow rate of 150 ml/hr shows the least amount of surface roughness.

65
Chapter-5
Conclusions and Recommendation 5.1 Conclusions
i. In depth investigation of the effect of Pulsed Jet MQL Applicator in surface
milling of AISI4140 hardened steel is performed on the basis of surface
roughness, cutting force and tool wear.
ii. Surface roughness is found to improve at a substantial rate at different MQL
rates compared to that of dry machining.
iii. Different MQL rates showed different degrees of improvement, the figures
have shown that an MQL rate of 150 ml/hr has the maximum reduction of
surface roughness, around 45%.
iv. Pulsed Jet MQL Applicator reduced the cutting force when compared to dry
cutting by substantial amount.
v. Different MQL rates have shown different degrees of reduction of cutting
force. It is evident from the figure that an MQL rate of 150 ml/hr has the
maximum reduction of cutting force, around 30%.
vi. Improvement of surface roughness and decrease in the amount of cutting
force can be attributed to the lower cutting temperature, favorable chip-tool
interaction, retention of the cutting edge sharpness, prevention of Built Up
Edge during the machining process.
vii. Substantial reduction in the flank wear eventually increases the tool life,
enabling a longer machining time with the same tool with the use of Pulsed
Jet MQL Applicator. The reduction of tool wear might also be attributed to
retardation of abrasion and notching, decrease or prevention of adhesion
decreasing the growth of flank wear.

66
5.2 Recommendations
i. Pulsed Jet MQL Applicator may be further studied to analyze its impacts on
different hardened work materials.
ii. Use of different cutting oils as an alternative to 68 grade cutting oil might
be introduced to see its impact on the work material.
iii. The frequency of the pulsing system should be synchronized with the speed
of the milling cutter to attain the best possible result in terms of machining
and surface integrity.
iv. Use of multiple nozzle injector can be introduced to maximize the effect of
MQL application during the machining process.
v. A facility to remove the oil mist created during the MQL application should
be introduced to reduce health hazard during the machining process.
vi. Nozzle injectors with narrower spray cone should be introduced to deliver
the cutting fluid pinpointing the tool work interaction point.

67
References Abou-El-Hossein, K.A., Cutting fluid efficiency in end milling of AISI Stainless Steel,
Industrial Lubrication and Tribology, Vol.60 (3),pp.115–120, 2008
Abrao, A. M. and Aspinwall, D. K. The Surface Integrity of Turned and Ground Hardened
Bearing Steel, Wear, Vol.196, pp.279-284, 1996
Abukhshim, N.A., P.T. Mativenga, and M.A. Sheikh, Heat generation and temperature
prediction in metal cutting: A review and implications for high speed machining”,
Int. Journal of Machine Tools and Manufacture, Vol.46(7-8), pp.782–800, 2006
Antony, J., “Design of Experiments for Engineers and Scientists”, Elsevier, 2003,
ISBN: 978-0-7506-4709-0
Attanasio, A.,Gelfi, M.,Giardini, C.,Remino, C.,Minimum Quantity Lubrication in
Turning, Wear, Vol.260, pp.333–338, 2006
Baradie, M. A, Cutting Fluids: Part I. Characterization, Journal of Materials Processing
Technology, Vol.56, pp.786–797, 1996
Bennett E.O., Bennett D.L.,Minimizinghuman exposure to chemicals in metalworking
fluids, J. Am. Soc. Lub. Eng. Vol.43 (3), pp.167–175, 1987
Bhowmick, S. and A.T. Alpas, Minimum quantity lubrication drilling of aluminium-
siliocon alloys in water using diamond - like carbon coated drills. International
Journal of Machine Tools and Manufacture, Vol.48(12-13): pp.1429-1443, 2008
Bienkowski, K.,Coolants & lubricants-staying pure, Manuf. Engineering, pp.55–61, 1993

68
Bossom, P. K. Finish Machining of Hard Ferrous Workpieces, Industrial Diamond
Review, Vol.5 pp.228-233, 1990
Brinksmeier, E., Cammett, J.T., Konig, W., Leskovar, P., Peters, J., and Tonshoff, H.K.
Residual Stresses-Measurement and Causes in Machining Processes, Annals of the
CIRP, Vol.31 pp.491-510, 1982
Byrne, G., D. Dornfeld, and B. Denkena,Advancing Cutting Technology, CIRP Annals
Manufacturing Technology, Vol.52(2): pp.483–507, 2003
Çakır, O., Kıyak, M., Altan, E.,Comparison of gases applications to wet and dry cuttings
in turning, J. of Materials Processing Technology, Vol.153-154, pp.35–4,2004
Chryssolouris, G. Effects of Machine-Tool-Workpiece Stiffness on the Wear Behavior of
Superhard Cutting Materials,Annals of the CIRP, Vol.31 (1) pp.65-69, 1982
Deshmukh, S. D., Basu, S. K., Significance of solid lubricants in metal cutting, 22nd
AIMTDR, Madras, pp.421-427, 2006
Dhar, N. R. and Kamruzzaman, M.,The Influence of High Pressure Coolant on
Temperature, Tool Wear and Surface Finish in Turning 17CrNiMo6 and 42CrMo4
Steels, ARPN Journal of Engineering and Applied Sciences, Vol.4, pp.93–103, 2009
Dhar, N. R., Ahmed, M. T., and Islam, S., An experimental investigation on effect of
minimum quantity lubrication in machining AISI 1040 steel, International Journal of
Machine Tools and Manufacture, Vol.47, pp.748–753, 2007
Ding, Y., and Hong, S.Y.,Improvement of Chip Breaking In Machining Low Carbon Steel
by Cryogenically Precooking the Workpiece, Trans. of the ASME, J. of Manuf.
Science and Engg., Vol.120, pp.76–83, 1998
Diniz, A.E., Oliveira, A.J.,Optimizing the use of dry cutting in rough turning steel
operations,Int. Journal of Machine Tools and Manuf., Vol.44, pp.1061–1067, 2004
Diniz, A.E., Ferreira, J.R., Filho F.T.,Influence of lubrication condition on SAE 52100
hardened steel turning at several cutting speed, International Journal of Machine
Tools and Manufacture, Vol.43, pp.317–326, 2003

69
El Baradie, M.A.,Cutting fluids Part I. characterization, Journal of Materials Processing
Technology, Vol.56, pp.787–797, 2007
Field, M., Kahles, J.F., Cammett, J.T. Review of Measuring Methods for Surface Integrity,
Annals of the CIRP, Vol.21 (2) pp.219-238, 1972
Filipovic A., David A. Stephenson, Minimum Quantity Lubrication (MQL): Applications
in Automotive Power-Train Machining, Machining Science and Technology, Vol.10,
pp.3–22, 2006
Heinemann, R., Hinduja, S., Barrow, G.,Petuelli, G.,Effect of MQL on the Tool Life of
Small Twist Drillsin Deep-Hole Drilling, International Journal of Machine Tool and
Manufacture, Vol.46, pp.1–6, 2006
Hwang, Y.K., C.M. Lee, and S.H. Park,Evaluation of machinability according to the
changes in machine tools and cooling lubrication environments and optimization of
cutting conditions using Taguchi method. International Journal of Precision
Engineering and Manufacturing,Vol.10 (3), pp.65–73, 2009
Itigawa, F., Childs, T. H. C., Nakamura, T., and Belluco, W., Effects and mechanism in
minimal quantity lubrication machining of aluminum alloy, Wear, Vol.260 (3),
pp.339–344, 2006
Jochmann, S. and Wirtz, H. Achieving Precision Grinding Quality by hard Turning,
Proceedings of the ASME IMECE; MED- Vol.10, pp.817-823, 1999
Kamata, Y. and T. Obikawa, High speed MQL finish - turning of Inconel 718 with different
coated tools. Journal of Mat. Processing Tech., Vol.192-193, pp. 281-286, 2007
Khan, M.M.A., M.A.H. Mithu, and N.R. Dhar, Effects of minimum quantity lubrication on
turning AISI 9310 alloy steel using vegetable oil - based cutting fluid. Journal of
Materials Processing Technology, Vol.209(1516), pp.5573-5583, 2009
Kishawy, H.A., et al., Effect of coolant strategy on tool performance, chip morphology and
surface quality during high-speed machining of A356 aluminum alloy, International
Journal of Machine Tools and Manufacture., Vol.45(2),pp.219–227, 2005
70
Klocke, F., Eisenblaetter, G.,Dry cutting, CIRP Annals-Manufacturing Technology,
Vol.46(2), pp.519–526, 1997
Konig, W., Berktold, A., and Kock, K.F. Turning versus Grinding-A comparison of
Surface Integrity Aspects and Attainable Accuracies, Annals of the CIRP, Vol.42 (1)
pp.39-43, 1993
Kovacevic, R., Cherukuthota, C. and Mazurkiewicz, M.,High Pressure Waterjet Cooling /
Lubrication to Improve Machining Efficiency in Milling, International Journal of
Machine Tools and Manufacture, Vol.35, pp.1459–1473, 1995
Kress, D.,Dry cutting with finish machining tools, Industrial Diamond Review, Vol.74,
pp.81–85, 1997
Kumar, A.S., Rahman, M.,Ng, S.L.,Effect of High-Pressure Coolant on Machining
Performance, Int. Journal of Advanced Manuf. Tech.”, Vol.20, pp.83–91, 2002
Kwon, P.,Predictive models for flank wear on coated Inserts, International Journal of
Tribology, Vol.122 (1), pp.340–347, 2000
Lacalle, L. N. L. D., Lamikiz, A., Sanchez, J. A. and Cabanes, I., 2001,Cutting Conditions
and Tool Optimization in the High-Speed Milling of Aluminum Alloys, Proc. of the
Institution of Mech. Engineers, Part B: Journal of Engineering Manufacture,
Vol.215, pp.1257–1269, 2001
Lathkhar, G. S., Kharde, R. R., Basu, S. K., Some experiments in machining grease based
solid lubricants, Journal of the Institution of Engineers, Vol.82, pp.1–6, 2001
Liao, Y.S., H.M. Lin, and Y.C. Chen,Feasibility study of the minimum quantity lubrication
in high-speed end milling of NAK80 hardened steel by coated carbide tool, Int.
Journal of Machine Tools and Manuf., Vol.47(11),pp.1667–1676,2007
Machado, A. R., and Diniz, A. E., Advantages and disadvantages of the use of the cutting
fluids, Machining Congress, Sao Paolo, Sp, Brazil, 2000
Machado, A.R., and J. Wallbank,The effect of extremely low lubricant volumes in
machining, Wear, Vol.210,pp.76–82, 1997

71
MaClure, T. F., Adams, R.,Gugger, M. D., Gressel, M.G., Comparison of Flood vs.
Microlubrication on Machining Performance, 2007,
Marzurkiewicz, M., Z. Kubala, and J. Chow, “Metal machining with high pressure water
jet cooling Assistance - a new possibility”, Journal Engineering Industry, Vol.111,
pp.7–12, 1989
Matsumoto, Y., Barash, M.M., Liu, C., R. Effect of Hardness on the Surface Integrity of
AISI 4340 Steel, Journal of Engineering for Industry, Vol.108, pp.169-175, 1986
NIOSH,Criteria for A Recommended Standard: occupational Exposure to Metalworking
Fluids Cincinnati, OH: U.S. Department of Health and Human Services, Centers for
Disease Control and Prevention, National Institute for Occupational Safety and
Health. DHHS (NIOSH) Pub. No.98–102, 1998
Obikawa, T., Y. Kamata, and J. Shinozuka, High-speed grooving with applying MQL. Int.
Journal of Machine Tools and Manufacture, Vol.46(14), pp. 1854-1861, 2006
Paul, S., Dhar, N.R., and Chattopadhyay, A.B,Beneficial Effects of Cryogenic Cooling
over Dry and Wet Machining on Tool Wear and Surface Finish in Turning AISI 1060
Steel, J. of Materials Processing Technology, Vol.116, pp.44–48, 2001
Paul,S., Dhar, N. R., and A.B. Chattopadhyay, Benificial effects of cryogenic cooling over
dry and wet machining on tool wear and surface finish in turning AISI 1061
steel,ICAMT. Malaysia, 2001
Rahman, M., A. Senthil Kumar, and S. ManzoorUl,Evaluation of minimal quantities of
lubricant in end milling, International Journal of Advanced Manufacturing
Technology, Vol.18(4),pp.235–241, 2001
Rahman, M.,Kumar, A. S., and Salam, M. U.,Experimental Evaluation on the Effect of
Minimal Quantities of Lubricant in Milling,International Journal of Machine
Tools & Manufacture, Vol. (5), pp.539–547, 2002
Ramesh, A., Thiele, J.D., Melkote, S.N. Surface Integrity In AISI 4340 And AISI 52100
Finish Hard Turned Steels: A Comparative Study,Proceedings of the ASME
IMECE, MED- Vol.10, pp.831-837, 1999

72
Ronan Autret, Steven Y. Liang, Professor George W.Woodruff, Minimum Quantity
Lubrication in Finish Hard Turning, School of Mechanical Engineering Georgia
Institute of Technology Atlanta, GA 30332–0405, 2003
Sadeghi, M.H., et al., Minimal quantity lubrication-MQL in grinding of Ti6Al-4V titanium
alloy. Int. Journal of Advanced Manuf. Tech.,Vol.44 (5-6), pp.487-500, 2009
Satoshi, I., Teiji,Y.,Shinichi, M. and Kazauo, M.,Machinability of Ni3Al Based
Intermetallic Compounds, J. of Material Processing Tech., Vol.63, pp.181–186, 1997
Sheehy, T. Taking the Hard Out of Hard Turning, Manufacturing Engineering, SME,
February 1997
Silliman, J.D., Perich, R.,Cutting and grinding Fluids: selection and application-Second
Edition, Society of Manufacturing Engineers, pp.216, 1992
Stanford, M.,Lister, P.M.,Kibble,K.A., Investigation into the effect of cutting environment
on tool life during the milling of a BS970-080A15 (En32b) low carbon steel, Wear,
Vol. 262, pp.1496–1503, 2007
Sun, J., et al.,Effects of coolant supply methods and cutting conditions on tool life in end
milling titanium alloy, Machining Science and Tech., Vol.10(3),pp.355–370, 2006
Taylor, F.W.,On the art of cutting metals, Trans. ASME, pp. 28–31, 1906
Thepsonthi, T., M. Hamdi, and K. Mitsui,Investigation into minimal cutting-fluid
application in high-speed milling of hardened steel using carbide mills, International
Journal of Machine Tools & Manufacture, Vol.49, pp.156–162, 2009
Thiele, Jeffrey D. An Investigation of Surface Generation Mechanisms for Finish Hard
Turning of AISI 52100 Steel, Master’s Thesis, Georgia Institute of Technology,
1998.
Tonshoff, H.K., and Hetz, F. Surface Integrity of Difficult to Machine Materials,2nd IMEC
Session II, pp.120-136, 1986
Thornburg, J., Leith, D.,Mist Generation during Metal Machining, Journal of Tribology
(ASME), Vol.122, pp.544–549, 2000

73
Varadarajan, A.S., Philip, P.K. and Ramamoorthy, B., Investigations on Hard Turning
with Minimal Cutting Fluid Application (HTMF) and It’s Comparison with Dry and
Wet Turning, Int. J. Machine Tools Manufact, Vol.42, pp.193–200, 2002
Vikram Kumara Ch R., Ramamoorthy, B.,Performance of coated tools during hard
turning under minimum fluid application, Journal of Materials Processing
Technology, Vol.185, pp.210–216, 2007
Wakabayashi, T., Inasaki, I., Suda, S., and Yokota, H., Tribologial Characteristics and
Cutting Performance of Lubricant Esters for Semi-Dry Machining, CIRP Annals,
Vol.51(1), pp.61–64, 2003
Wakabayashi, T., Inasaki, I., and Suda, S., Tribological Action and Optimal Performance:
Research Activities Regarding MQL Machining Fluid, Machining Science and
Technology, Vol.10, pp.59–85, 2006
Wakabayashi, T., Ichiro Inasaki and Satoshi Suda., Tribological Action and Optimal
Performance: Research Activities Regarding MQL Machining Fluids, Machining
Science and Technology, Vol.10, pp.59–85, 2006
Werthem, R. and Rotberg, J.,Influence of High Pressure Flushing through the Rake Face
of the Tool, Annals CIRP, Vol.41 (1), pp.101–106, 1992
Yan, L., S. Yuan, and Q. Liu, Influence of minimum quantity lubrication parameters on
tool wear and surface roughness in milling of forged steel, Chinese Journal of
Mechanical Engineering, Vol. 25(3),pp. 419–429, 2012
Yildiz, Y., Gunay, M., Seker, U.,The effect of the cutting fluid on surface roughness in
boring of low carbon steel–technical communication, Machining Science and
Technology, Vol.11, pp.553–560, 2007
Zeilmann, R.P. and W.L. Weingaertner, Analysis of temperature during drilling of
Ti6Al4V with minimal quantity of lubricant. Journal of Materials Processing
Technology, Vol.179(1-3), pp.124-127, 2006