design and performance analysis of mppt,buck boost
TRANSCRIPT

A Project report on
DESIGN AND PERFORMANCE ANALYSIS OF MPPT,BUCK BOOST
CONVERTER/MODELLING OF SPV SYSTEMS
For the partial fulfilment of the requirements for the degree of B. Tech in Electrical Engineering
By
SRISHTICHAKRABORTY(11701617029)
SWETNEELGUPTA(11701617022)
ARPANBHOWMICK(11701617069)
SIBILMANDI(11701618003)
Under the supervision of
Prof(Dr.)AshokeMondal,Professor,DepartmentofElectricalEngineering,RCCIIT
DepartmentofElectricalEngineering
RCCINSTITUTEOFINFORMATIONTECHNOLOGY
CANALSOUTHROAD, BELIAGHATA,KOLKATA–700015,WESTBENGAL
Maulana Abul Kalam Azad University of Technology(MAKAUT)
©2021

CERTIFICATE
To HOD
This is to certify that the project work entitled “Design and performance
analysisof MPPT BUCK BOOST Converter/Moddeling of SPV systems”is the
bona fidework carried out by Srishti Chakraborty(11701617029),Swetneel
Gupta(11701617022) ,Arpan Bhowmick (11701617069) Sibil
Mandi(11701618003), thestudents of B.Tech in the Dept. of Electrical
Engineering, RCC Institute ofInformation Technology (RCCIIT), Canal South Road,
Beliaghata, Kolkata-700015,affiliated to Maulana Abul Kalam Azad University of
Technology(MAKAUT), West Bengal, India, during the academic year 2020-21, in
partialfulfillment of the requirements for the degree of Bachelor of Technology
inElectrical Engineering and that this project has not submitted previously for
theawardof anyother degree,diplomaand fellowship.
Signatureofthe Guide: Signatureof theHOD :
Name: Name:
Designation : Designation:-
Signature of the External
Examiner:Name:
Designation:
ACKNOWLEDGMENT
It is our great fortune that we have got opportunity to carry out this project
workunder the supervision of . Prof. Dr. Ashoke Mondalin the Department
ofElectrical Engineering, RCC Institute of Information Technology (RCCIIT) ,
CanalSouth Road , Beliaghata, Kolkata-700015, affiliated to Maulana Abul Kalam
AzadUniversity of Technology (MAKAUT), West Bengal, India. We express our
sincerethanks and deepest sense of gratitude to our guide for his constant
support,unparalleledguidanceandlimitlessencouragement.
Wewould alsoliketoconveyour gratitudeto allthefacultymembersandstaffsof the
Department of Electrical Engineering, RCCIIT for their whole
heartedcooperationto makethis workturn into reality
Signatureofthestudent
SrishtiChakraborty(11701617029)
SwetneelGupta(11701617022)
ArpanBhowmick(11701617069)
SibilMandi(11701618003)

ABSTRACT
It is essential to convert the energy obtained withphotovoltaic panel from low efficiency
withmaximum possible efficiency. So the concept of maximum power point Tracking
(MPPT) basedisintroduced as it ensures energy conversion withhighest efficiency in the
Buck-Boost converter . Inthis study, Buck -Boost converter fed by solar panels and
controlled by MPPT techniques are examined and their performance analysis by
hardware designing to observed. In this experiment when the output voltage can not
require the fulfillment the charging requirement of battery then the boost converter will
work and it will increase the level of voltage so that it can charge the battery. When we
do not want that much high voltage level then the buck converter will operate and
reduce the level of voltage. In this process MPPT will ensure that maximum power
should always transfer to the load.

Table of contents:
1. Introduction………………………………………………………………………………………………….1
2. Theory……………………………………………………………………………………………………………………2-18
2.1 Maximum Power Point Tracking……………………………………………………………………………………2-3
2.2 Different types of MPPT Logic……………………………………………………………………………………….4-11
2.2.1 Perturb and Observe………………………………………………………………………………………..5-6
2.2.2 Incremental Conductance……………………………………………………………………………….7-8
2.2.3 Fuzzy Logic…………………………………………………………………………………………………….9-10
2.2.4 Parasitic Conductance…………………………………………………………………………………….11
2.2.5 A typical PV panel…………………………………………………………………………………………….12-15
2.2.6 Buck Boost Converter………………………………………………………………………………………16-18
3 Components…………………………………………………………………………………………………………………………19-37
3.1 IRF540n-MOSFET……………………………………………………………………………………………………………20-22
3.2 IRF9Z24Np-MOSFET………………………………………………………………………………………………………..23-26
3.3 7809VoltageRegulator…………………………………………………………………………………………………….27
3.4 HallCurrentSensor…………………………………………………………………………………………………………...28-29
3.5 0.96’’OLEDDisplay……………………………………………………………………………………………………………..30
3.6 220Uf50vCapacitor…………………………………………………………………………………………………………….31
3.7 100UhPowerInductor………………………………………………………………………………………………………..31
3.8 10Uf25vCapacitor…………………………………………………………………………………………………………..32
3.9 1N4819SchottkyDiode…………………………………………………………………………………………………..32-33
3.10 ArduinoNano…………………………………………………………………………………………………………………34-36
3.11 2pinterminalblock…………………………………………………………………………………………………………37
3.12.Dot Vero Board .……………………………………………………………………………………………………………………37
4 BlockDiagram…………………………………………………………………………………………………….38-47
5 CircuitDiagram……………………………………………………………………………………………………39
6 FlowChart ……………………………………………………………………………………………………………..48 7 ResultandDiscussion ……………………………………………………………………………………………..49-50 8 Software Simulation Circuit……………………………………………………………………………………..51-55 9 ConclusionandReference ………………………………………………………………………………………….56-57

INTRODUCTION
The past few years have been filled with news of fuel price hikes, oil spills, andconcerns of global
warming. People are finding the benefits of having their ownrenewable energy system more attractive
than they ever have before. The biggestform of renewable energy to benefit from this is solar PV systems.
However, theoutput power of a PV panel is largely determined by the solar irradiation and thetemperature
of the panel. At a certain weather condition, the output power of aPV panel depends on the terminal
voltage of the system. To maximize the poweroutput of the PV system, a high-efficiency, low-cost
DC/DC converter with
anappropriatemaximumpowerpointtracking(MPPT)algorithmiscommonlyemployed to control the
terminal voltage of the PV system at optimal values
invarioussolarradiationconditions.BasicboostconvertersworkwellwiththeMPPTcontrol as long as the load
can accept a voltage from the minimum output of thePV panel all the way up a certain value (e.g., 5
times) subject to practical limits ofthe duty cycle (e.g., 80%). The system needs to be robust enough that
when theconsumer wants to expand their energy production by adding more panels, theydon’t need to
replace their entire system. The DC/DC converter and MPPT
controlalgorithmproposedinthisworkwillimplementalloftheseimprovementsinhopescreating a highly
efficient, low-cost, and highly reliable solar PV system for
cleanandrenewablepowergeneration.Sincethepowergeneratedfromthephotovoltaic module depends on the
temperature and the solar radiation, thesefactors must be taken into account while designing the maximum
power pointtracker. The main goal of the MPPT is to move the module operating voltage
closetothevoltageatwhichthePVproducesthemaximumpowerunderallatmosphericconditions. MPPT is very
important in PV systems. Different techniques have beendeveloped to maximize the output power of the
photovoltaic module. They haveadvantages and limitations over the others. These techniques vary in
complexity,inthenumberof sensorsrequired,intheir convergencespeedand inthecost.
THEORY
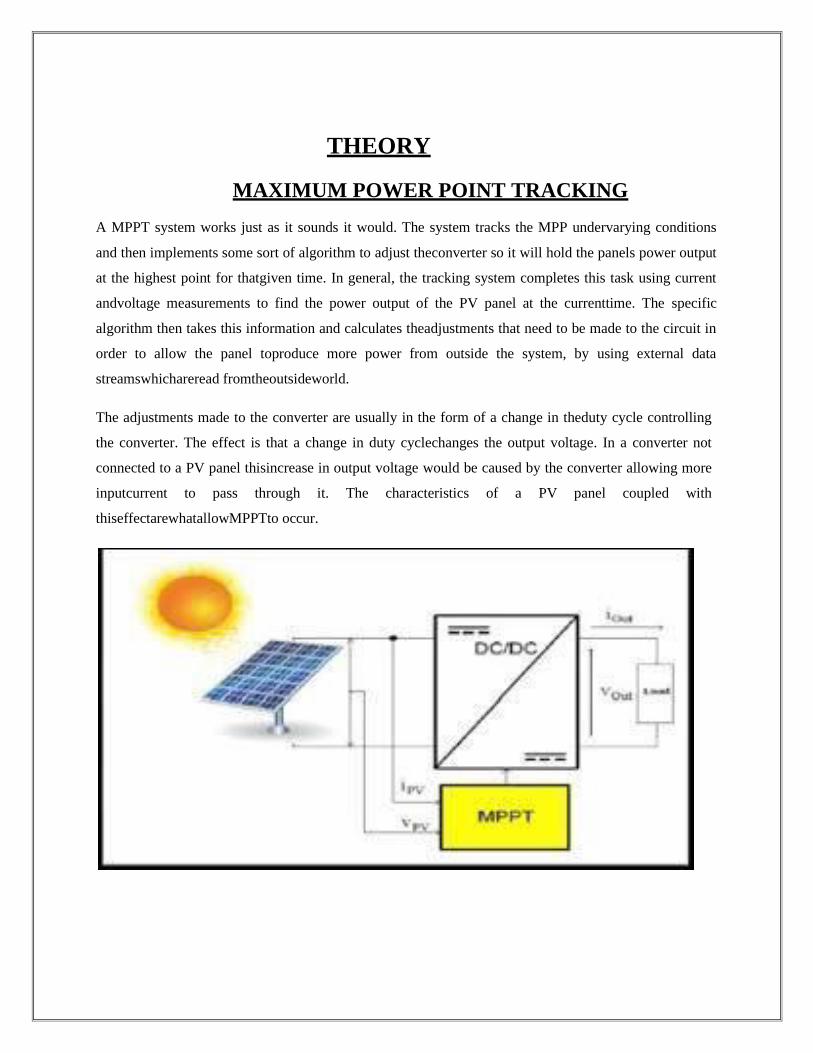
MAXIMUM POWER POINT TRACKING
A MPPT system works just as it sounds it would. The system tracks the MPP undervarying conditions
and then implements some sort of algorithm to adjust theconverter so it will hold the panels power output
at the highest point for thatgiven time. In general, the tracking system completes this task using current
andvoltage measurements to find the power output of the PV panel at the currenttime. The specific
algorithm then takes this information and calculates theadjustments that need to be made to the circuit in
order to allow the panel toproduce more power from outside the system, by using external data
streamswhichareread fromtheoutsideworld.
The adjustments made to the converter are usually in the form of a change in theduty cycle controlling
the converter. The effect is that a change in duty cyclechanges the output voltage. In a converter not
connected to a PV panel thisincrease in output voltage would be caused by the converter allowing more
inputcurrent to pass through it. The characteristics of a PV panel coupled with
thiseffectarewhatallowMPPTto occur.

Figure1:-ImplementationofMPPT
When the current of a PV panel increases the voltage will eventually begin todecrease, and when the
voltage increases the current will eventually decrease.When the duty cycle of the converter is increased
the current allowed to passfrom the PV panel to the converter is increased. This causes the PV panel to
movefrom the point it is currently operating at on the I-V curve to the next point with ahigher current
output, moving left. This in turn decreases the voltage output bythe PV panel. Once the operating point of
the panel is able to be changed analgorithm can be implemented to control this change, thus forming a
MPPTsystem. Each algorithm may act differently but this is the basis for most all MPPTsystems
Fig2:-I-VandP-VcharacteristicsofMPPT

Different types of MPPT Logic
Renewable energy is an important and valuable tendency in the global market, asit answers the need for
producing energy without harming the environment. Dueto a combination of factors, the demand for
energy generated from
photovoltaicsolarcellshasbeenincreased.Oneofthesefactors:loweroperationalandmaintenancecosts,noaudib
lenoise,nofuelcost,andThegeneratedenergyisfreeof pollution. The photovoltaic solar cells for home
applications are also a goodenergy solution in remote and developing countries and especially countries
thatown a good amount of solar radiation. PV is indeed not just a good possibility forthe future, but
already a profitable and promising solution for present
energyneeds.However,thecurrentchallengeistofocusnotonlyontheenergyharvestedbutalsoontheefficiencyof
theoverallprocess,whichincludesthecontrolofMPPT
Thedifferentways toimplementMPPTare: -
1. PerturbandObserve(P&O).
2. IncrementalConductance.
3. FuzzyLogic.
4. ParasiticCapacitance

Perturb and Observe(P&O)Method
The P&O algorithm based on increasing or decreasing the array terminal voltage,orcurrent,atregular
period andthencomparingtheoutputpower ofthePVwiththose of the previous sample point . Based on the
simple mathematical condition(dP/dV = 0). when the PV array operates to the left area of the MPP curve,
theoutput power will be increased due to the increase in voltage and output powerdecreases on increasing
voltage when the same operates to the right area of theMPP Curve. Hence if dP/dV> 0, the system keeps
the disturbance, and if dP/dV<0, the disturbance should be reversed. The process repeats until the
operatingpoint is across to the maximum power point. where P and V are power andvoltage at output of
PV module respectively. The main advantage of the P&Oalgorithm is its simplicity. In general, this
method shows a good operationprovided the solar radiation does not deviate too quickly. The classic
perturb andobserve (P&O) method has the disadvantage of poor efficiency at steady stateand low
irradiation, the operating point oscillates around the MPP voltage(usuallyfluctuates lightly) butnever
reaches
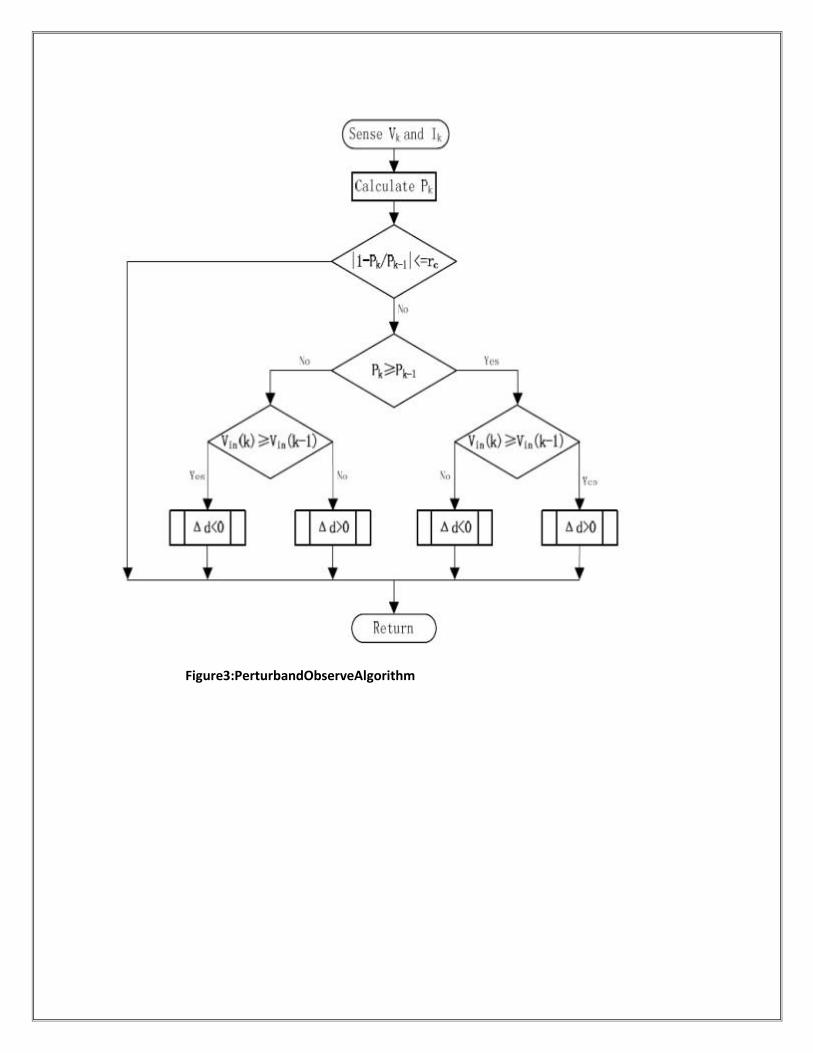
Figure3:PerturbandObserveAlgorithm

Incremental Conductance Method
The method of Incremental Conductance works when the dP/dV = 0, because thederivative of the power
of the PV module is equal to zero at the MPP, the positiveresults off the left area of the MPP curve and
negative results on the right of theMPPcurve
dP/dV=0 AtMPP dp/dv>0 AtLeftareaofMPP
dp/dv<0 AtRightareaof MPP
Table1:-MathematicalpropertiesofIncrementalconductance
𝑑𝑝/𝑑𝑉= 𝑑𝐼𝑉/𝑑𝑉≅𝐼+ 𝑉(𝛥𝐼/𝛥𝑉)………………………. (1)For
MPP,Putting𝑑𝑃/𝑑𝑉=0
Itgives
𝐼+(𝛥𝐼/𝛥𝑉) =0……………………….(2)
So we have
𝛥𝐼/𝛥𝑉=−1𝑉 At maximumpoint
𝛥𝐼/𝛥𝑉>−1𝑉 Leftofmaximumpoint
𝛥𝐼/𝛥𝑉<−1𝑉 Rightof maximumpoint
Accordingtoequation1and2,TheflowchartofICmethodisshowninFigure
4. The maximum power point of PV system can be tracked by comparing theI/V to ΔI/ΔV.
𝑉𝑟𝑒𝑓is the reference voltage of the PV array operation. When
theMPPisachievedatthatmoment,𝑉𝑟𝑒𝑓mustbeequaltoVmp.Whenithappens,thesystem keeps the
output voltage at MPP until a change in is occur or the change
inatmosphericconditions.TheICalgorithmdecidedtodecreasingorincreasingthe
𝑉𝑟𝑒𝑓toalways reachthenew MPP.
The advantage of this technique is its ability to track more accurately in extremelyvariable
weather conditions and less oscillating behavior is shown around the MPPcompared to the
Perturbation and Observation technique.
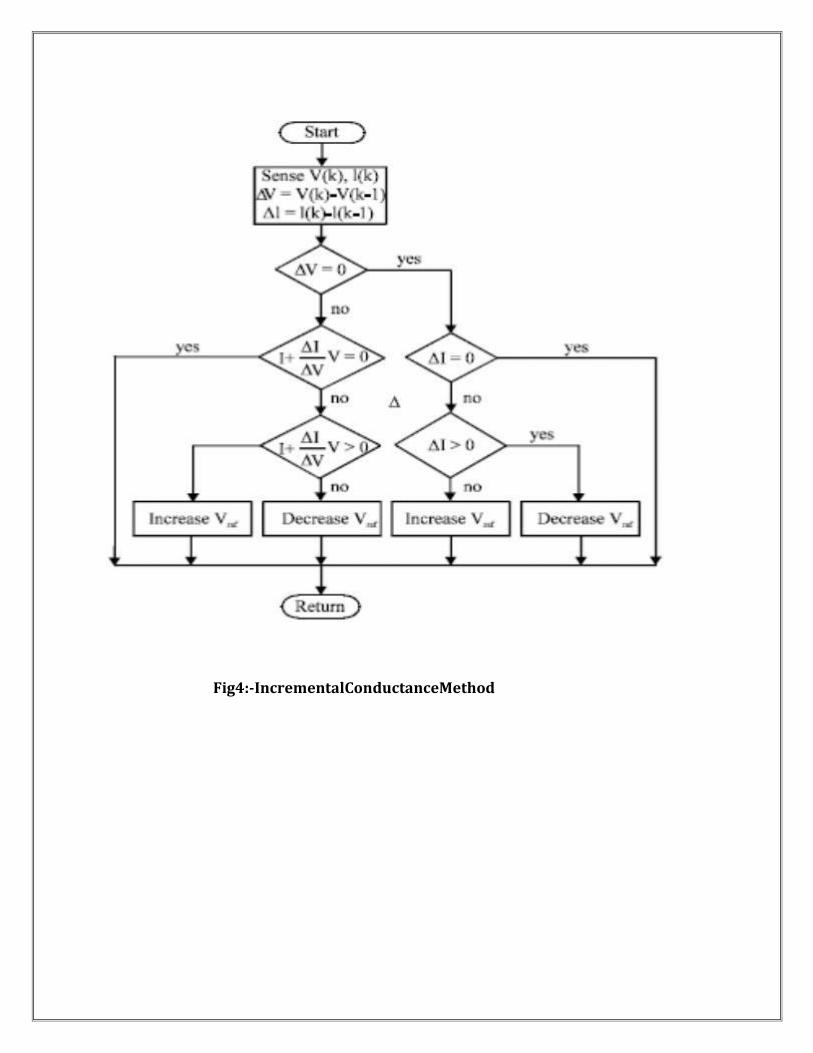
Fig4:-IncrementalConductanceMethod
FUZZY LOGIC METHOD
Fuzzy logic based intelligent MPPTs have been gained more attention because oftheir capability
to handle nonlinearity associated with the system. Due to lack ofprecise modeling of PV modules
and uncertainty in the performance of PV
systemduetovaryingirradianceandtemperature,thefuzzyMPPT(FMPPT)isfoundtobemore suitable
for tracking of MPP than conventional algorithms in PV
Systems.FMPPTcandealwithuncertaintysuchasunmodeledphysicalquantities,nonlinearity and
unpredictable changes in operating point of the PV system.
ThisMPPTtechniqueenhancesthechoiceofthevariablestepsizeofthedutycycleandtherefore
improves the performances of photovoltaic system. The concept of thisalgorithm is to compute
the variable step according to the slope value of Power-Voltage characteristic for photovoltaic
module. Then, it provides the appropriatevalueof dutycycle.
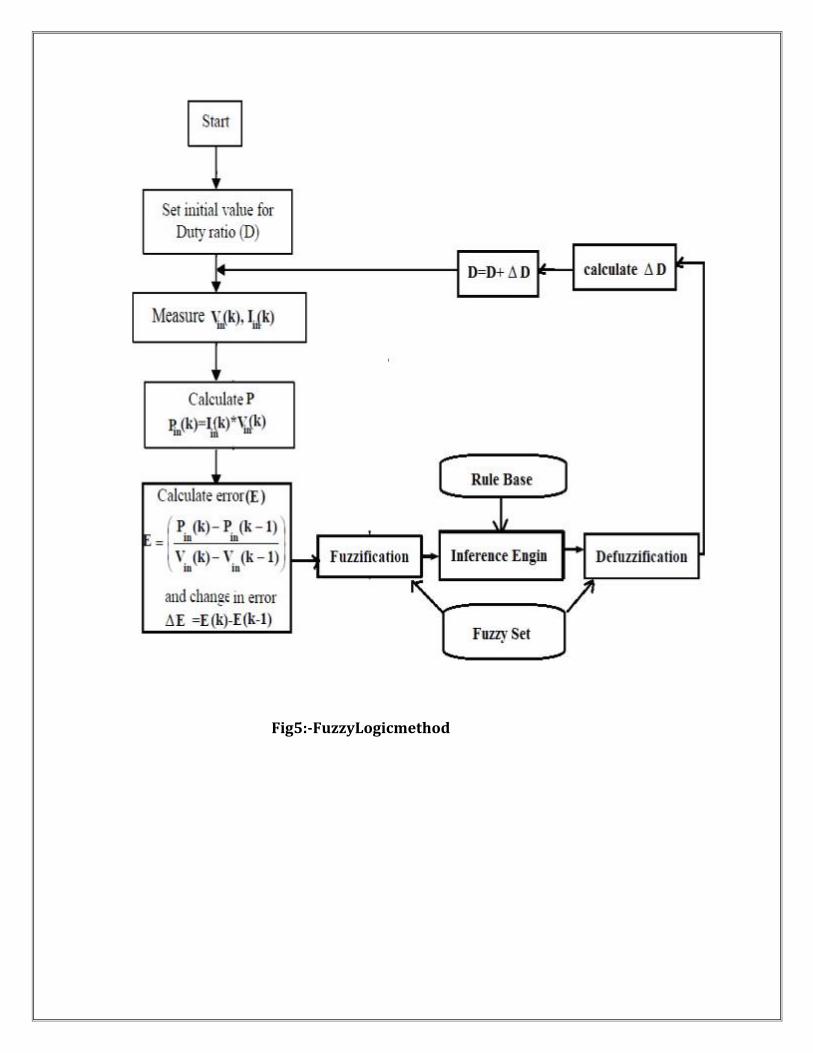
Fig5:-FuzzyLogicmethod

Parasitic Capacitance Method
Parasiticcapacity(PC)methodshowssimilaritieswiththeICmethod.However,changing of
parasitic junction capacity (PJC) value is taken into account in thismethod. PJC occurs as
result of charge accumulation in p-n junction area andthe inductance associated to the
connections of PV cells. Actually, there aretwo main components (parasitic capacitance and
inductance) called thereactive parasitic components. It is determined that the parasitic
capacitancereduces the error signal when the PV panel is operating outside the
MPP,slowing down the system dynamic [41]. But these unavoidable losses are usedasan
importantparameterindeterminingtheMPP.Byaddingthe
current i(t)=c(dv/dt) demanded by this capacity to (1), the following equation isobtained:
Derivativeofmultiplyingthisequationbythepanelvoltage canbewritten as
Three terms in this expression represent the instantaneous conductance, voltageoscillations due
to parasitic capacities, and incremental conductance,respectively.First-and second-
orderderivativesof arrayvoltagehavetakenthe
A.C. ripple components into account. If the capacity value is assumed as zero inthe equation
of IC algorithm is obtained. Parasitic capacity is modeled as acapacitor that is parallel
connected to each cell in a PV module. Therefore,parallel connection of modules increases
the amount of parasitic capacity forMPPT. As a result of this, the efficiency of PC method is
reached to maximumvalueinhigh-powerPVsystems thatincludenumerousparallel-connected

A typical PV Panel
PV panels, also known as solar panels capture the sun’s energy and convert itinto
electricity. Electricity generated by PV panels is mostly used for
poweringhouseholdappliancesand equipment.
The most typical PV panel system is the grid-connected system, which as its nameindicates, is
connected to the national grid. This means that at night, when thesolarpanelsdonotwork,youcan
useelectricityfromthegrid.
Moreover, if your solar system produces more electricity than what you need, youcan sell the
surplus back to the grid, and effectively make money by having solarpanels at home if you
make use of solar panel grants, like the Smart ExportGuarantee(SEG).
The second type of PV panel system is the stand alone system, which is notconnected to the
grid. In this case you can add solar batteries to the system tohave electricity when it gets dark.
This system can be really convenient in remoteareas where there is no alternative for other
sources of electricity. Nowadays,thousands of people power up their homes and business with
the help of PVpanels.
Fig6:-Differenttypesofsolarcellandsolarpanel
Solar cells output power in what is called an I-V curve. A typical I-V and P-V curveofasolar
cellcanbeseenin Figure1. Thiscurverepresentswhatthecurrent

output by the solar cell would be as the output voltage is varied and vice versa.Thiscurvecan
beeasily obtained fromtheI-Vcurvethroughtheequation
P=V xI.
There are three other important aspects of a solar cell also shown in Figure 1. Thefirst two are
the open circuit voltage (Voc) and the short circuit current (Isc) of thecell. The open circuit
voltage is the voltage that is output to the cell terminalswhen the cell is exposed to light and
there is no current flowing between theterminals. This is also the maximum voltage that can be
produced by the cell,which makes knowing this number useful when designing a circuit or load
toconnect to the cell terminals. The short circuit current is the current that will flowwhen the cell
is under light and the terminals are shorted together. This is
themaximumcurrentthatcanbeoutputbythespecificsolarcell.Thethirdimportant aspect of a solar
cell is the MPP. This is the point where the cell isoperating at maximum efficiency and
outputting the highest power available. TheMPP also has voltage at maximum power (Vmp) and
current at maximum power(Imp)
pointsassociatedwithit.Eachindividualcellisrelativelylittleinsizeandcan only produce a small
amount of power. The Voc of an individual solar cell isusually approximately 0.6 V. The cells
become much more useful when combinedin an array to create a PV panel. When connected
together the cells propertiesadd together to create an I-V curve that has the same appearance as
that of anindividual cell but is larger in magnitude. The cells in an array are
usuallyconnectedinseriestoobtainahigherandmoreappropriateterminalvoltage
Fig7:-ArepresentativeI-VandP-VcurveforasolarcellshowingtheMPPandA PVcell
CHARACTERISTICS OF SOLAR MODULE
Short Circuit Current of Solar Cell
Themaximumcurrentthatasolarcellcandeliverwithoutharmingitsownconstriction. It is measured
by short circuiting the terminals of the cell at
mostoptimizedconditionofthecellforproducingmaximumoutput.Thetermoptimizedconditionused
because for fixed exposed cell surface the rate of production
ofcurrentinasolarcellalsodependsupontheintensityoflightandtheangleatwhichthe light falls on the
cell. As the current production also depends upon the surface area of the cell exposed to light, it
is better to express maximum current
densityinsteadmaximumcurrent.Maximumcurrentdensityorshortcircuitcurrentdensityratingisnothi
ngbutrationofmaximumorshortcircuitcurrenttoexposedsurface area of the cell.
Where
Isc= shortcircuitcurrent
Jsc =maximum current densityA=
thearea of solarcell.
1.1 Open Circuit Voltage of Solar Cell
It is measured by measuring voltage across the terminals of the cell when no
loadisconnectedtothecell.Thisvoltagedependsuponthetechniquesofmanufacturing and temperature
but not fairly on the intensity of light and area
ofexposedsurface.Normallyopencircuitvoltageofsolarcellnearlyequalto0.5to
0.6volt.Itis normallydenotedbyVoc.
Maximum Power Point of Solar Cell
Themaximumelectricalpoweronesolarcellcandeliveratitsstandardtestcondition. If we draw the v-i
characteristics of a solar cell maximum power
willoccuratthebendpointofthecharacteristiccurve.Itisshowninthev-
icharacteristicsofsolarcellbyPm.
Current at Maximum Power Point
Thecurrentatwhichmaximumpoweroccurs.CurrentatMaximumPowerPointisshowni
n thev-icharacteristicsof solarcellbyIm
Voltage at Maximum Power Point
The voltage at which maximum power occurs. Voltage at Maximum PowerPoint is
shown in thev-icharacteristicsofsolar cellbyVm.
Fill Factor of Solar Cell
The ratio between product of current and voltage at maximum power point
totheproductofshortcircuitcurrentandopencircuitvoltageofthesolarcell.
Efficiency of Solar Cell
Itisdefinedastheratioofmaximumelectricalpoweroutputtotheradiationpowerinputtothecellanditisex
pressedinpercentage.Itisconsideredthattheradiationpower on the earth is about 1000 watt/square
metre hence if the exposed surfacearea of the cell is A then total radiation power on the cell will
be 1000 A watts.Hencetheefficiencyof asolar cellmaybeexpressed as
Theoutputcurrenttotheloadcanbeexpressedas
𝐼=𝐼𝑃𝑉−𝐼𝑜((𝑉+)𝑛𝑘𝑇𝑎−1)
Where:
• Iis theoutputcurrent ofthesolarmodule(A),
• Vistheoutputvoltageofthesolarcell(V),whichcanbeobtainedbydividingthe
outputvoltageof thePVmodulebythenumber ofcells inseries,

• IPVis thecurrentsourceofthesolarmodulebysolarirradiance(A),
• Ioisthereversesaturationcurrentofadiode(A),NSistheseriesconnection
numberof thesolarmodule,
• n is the idealfactorofthediode(n=1~2),
• qistheelectricchargeofan electron(1.6×e−19c),
• kistheBoltzmann’s constant(1.38×10⁻²³j/K),
• Tis theabsolutetemperatureof thesolarcell.
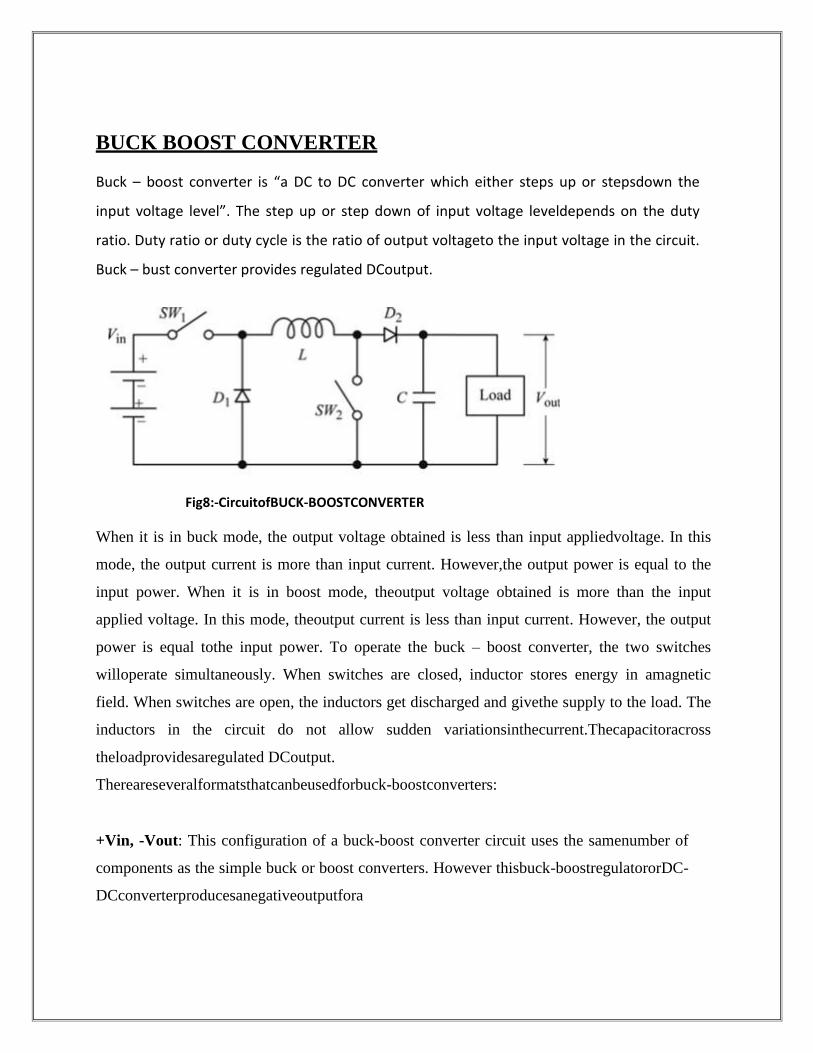
BUCK BOOST CONVERTER
Buck – boost converter is “a DC to DC converter which either steps up or stepsdown the
input voltage level”. The step up or step down of input voltage leveldepends on the duty
ratio. Duty ratio or duty cycle is the ratio of output voltageto the input voltage in the circuit.
Buck – bust converter provides regulated DCoutput.
Fig8:-CircuitofBUCK-BOOSTCONVERTER
When it is in buck mode, the output voltage obtained is less than input appliedvoltage. In this
mode, the output current is more than input current. However,the output power is equal to the
input power. When it is in boost mode, theoutput voltage obtained is more than the input
applied voltage. In this mode, theoutput current is less than input current. However, the output
power is equal tothe input power. To operate the buck – boost converter, the two switches
willoperate simultaneously. When switches are closed, inductor stores energy in amagnetic
field. When switches are open, the inductors get discharged and givethe supply to the load. The
inductors in the circuit do not allow sudden variationsinthecurrent.Thecapacitoracross
theloadprovidesaregulated DCoutput.
Thereareseveralformatsthatcanbeusedforbuck-boostconverters:
+Vin, -Vout: This configuration of a buck-boost converter circuit uses the samenumber of
components as the simple buck or boost converters. However thisbuck-boostregulatororDC-
DCconverterproducesanegativeoutputfora
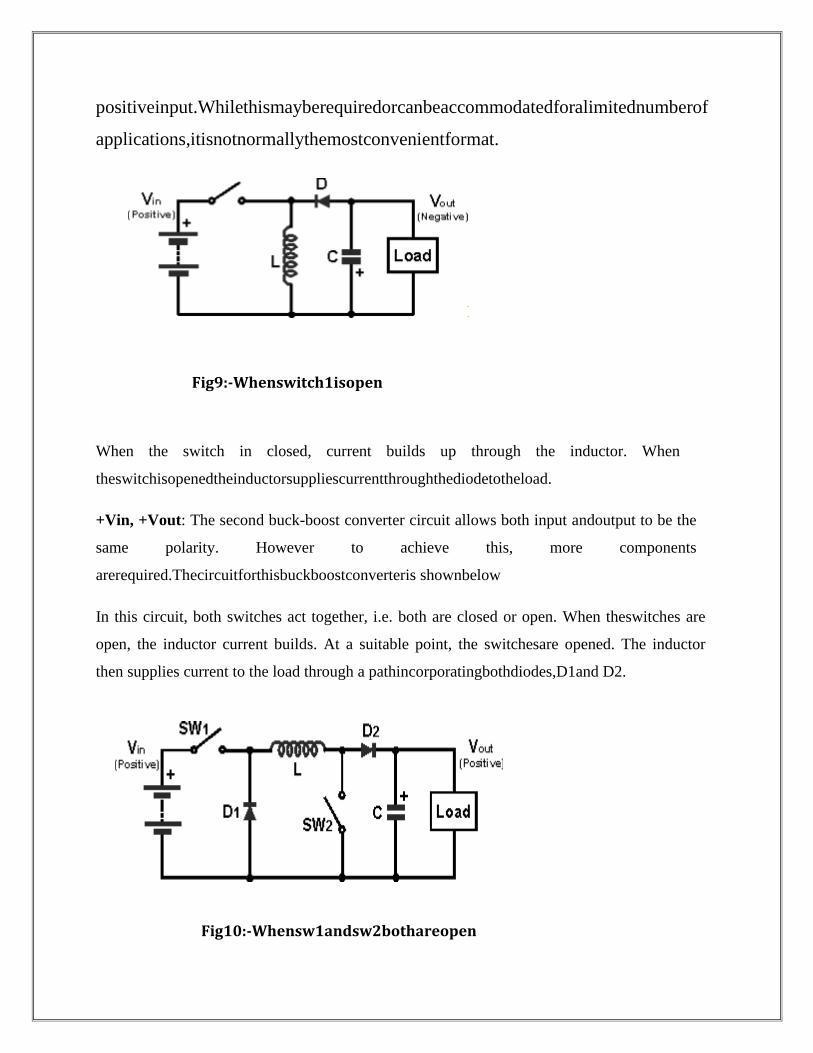
positiveinput.Whilethismayberequiredorcanbeaccommodatedforalimitednumberof
applications,itisnotnormallythemostconvenientformat.
Fig9:-Whenswitch1isopen
When the switch in closed, current builds up through the inductor. When
theswitchisopenedtheinductorsuppliescurrentthroughthediodetotheload.
+Vin, +Vout: The second buck-boost converter circuit allows both input andoutput to be the
same polarity. However to achieve this, more components
arerequired.Thecircuitforthisbuckboostconverteris shownbelow
In this circuit, both switches act together, i.e. both are closed or open. When theswitches are
open, the inductor current builds. At a suitable point, the switchesare opened. The inductor
then supplies current to the load through a pathincorporatingbothdiodes,D1and D2.
Fig10:-Whensw1andsw2bothareopen


Components

IRF9Z24N
1. Lead-Free
2. AdvancedprocessTechnology
3. Dynamicdv/dtrating
4. 175°COperatingTemperature
5. Fastswitching
6. P-channel
7. FullyAvalancheBreakdown
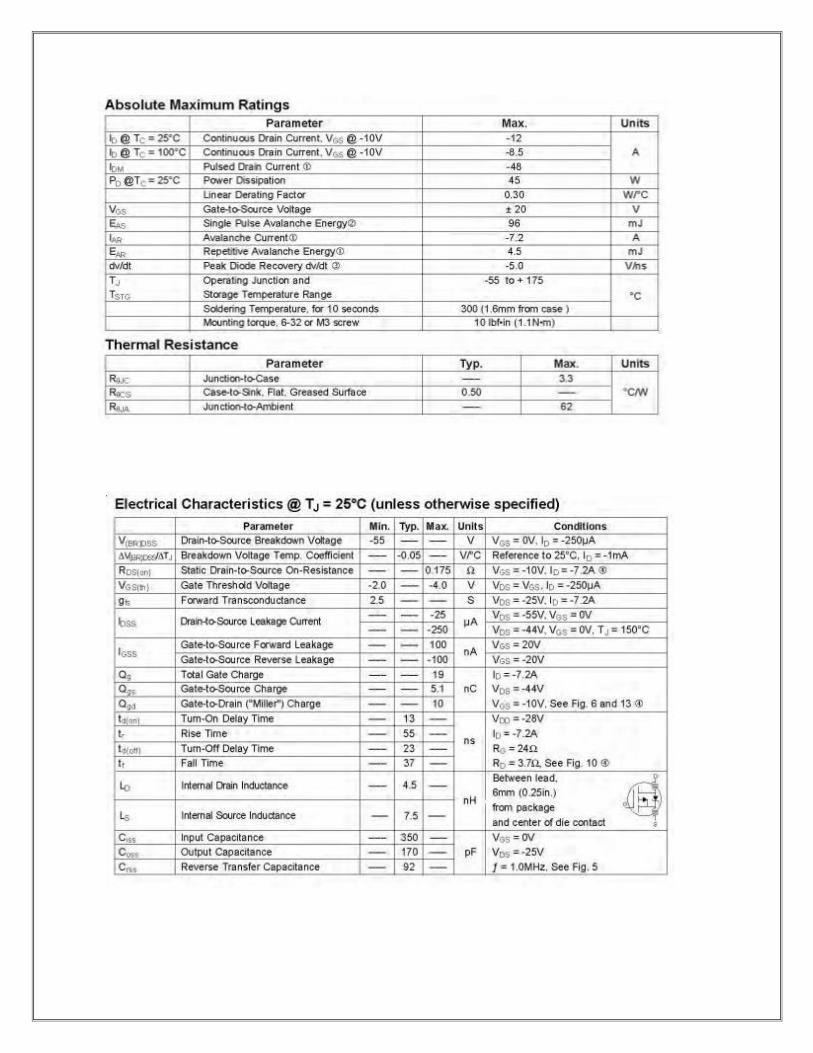

Fig13a:-UnclampedInductiveTestCircuit
Fig13b:-UnclampedInductiveWaveforms
Fig14a:-BasicGateChargewaveform

IRF540N
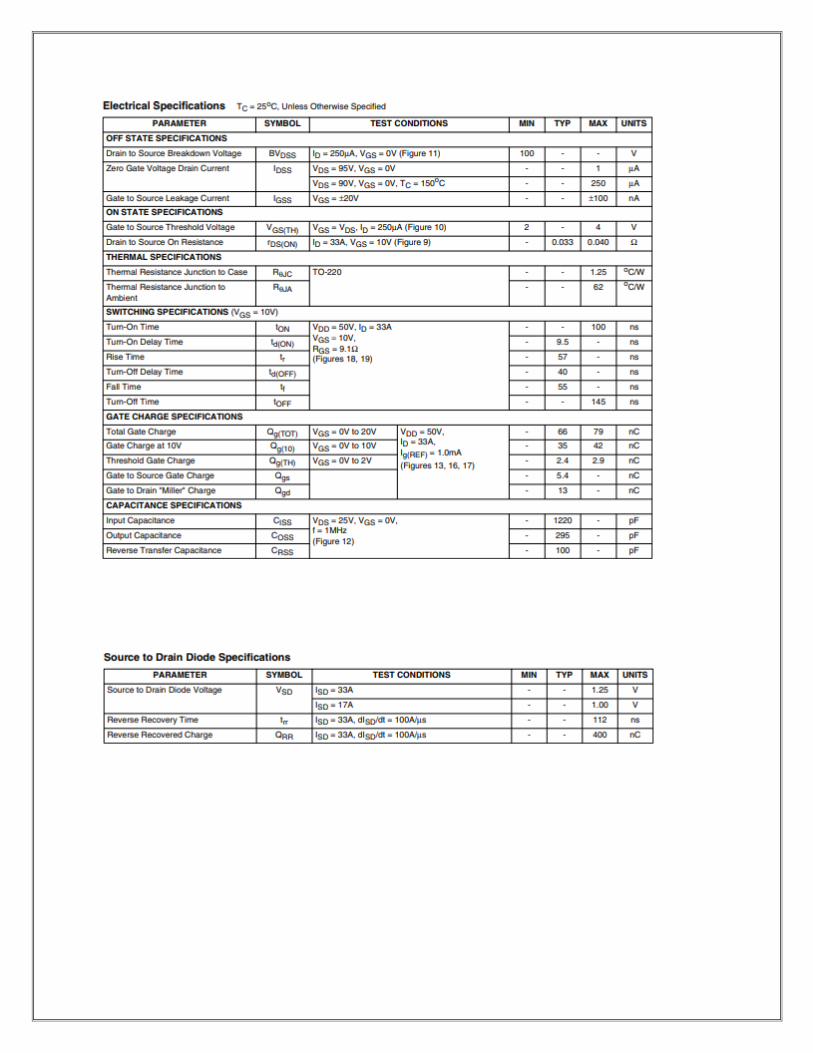

Fig15a:-UNCLAMPEDENERGYTESTCIRCUIT Fig15b:-UNCLAMPEDENERGYWAVEFORMS
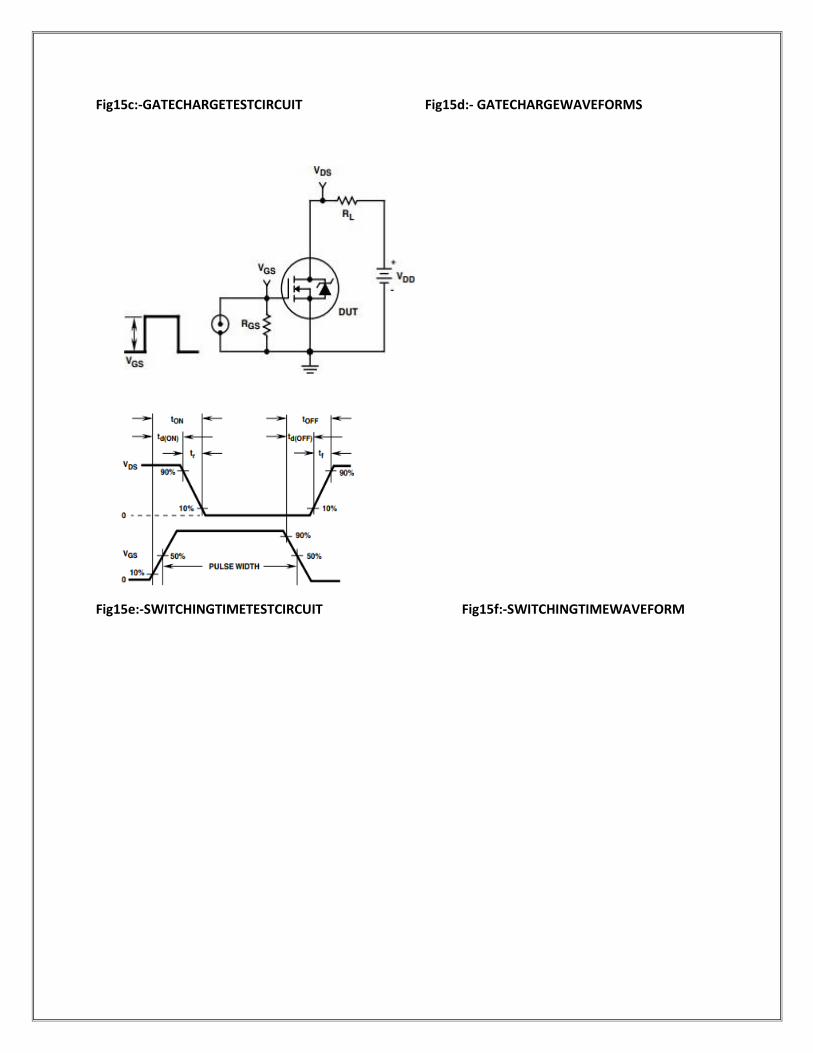
Fig15c:-GATECHARGETESTCIRCUIT Fig15d:- GATECHARGEWAVEFORMS
Fig15e:-SWITCHINGTIMETESTCIRCUIT Fig15f:-SWITCHINGTIMEWAVEFORM
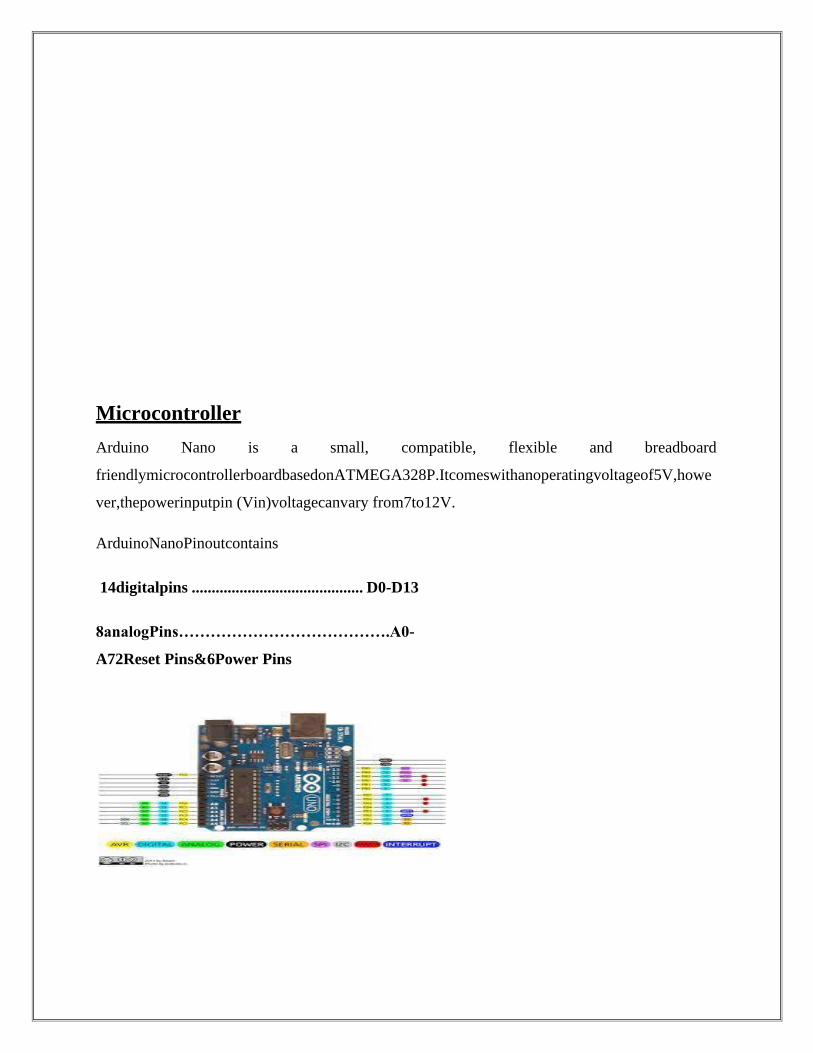
Microcontroller
Arduino Nano is a small, compatible, flexible and breadboard
friendlymicrocontrollerboardbasedonATMEGA328P.Itcomeswithanoperatingvoltageof5V,howe
ver,thepowerinputpin (Vin)voltagecanvary from7to12V.
ArduinoNanoPinoutcontains
14digitalpins ........................................... D0-D13
8analogPins………………………………….A0-
A72Reset Pins&6Power Pins
It has built in 8channel, 10-bit ADC that can measure approx. 5mV minimum. Pin A0-A5 can
beusedas digitalpinifrequired.
It hasDAC of8-bitthatcan giveoutputfrom0to5 V.PWMPins3,5,6,9,10,&11doesthisoperation.
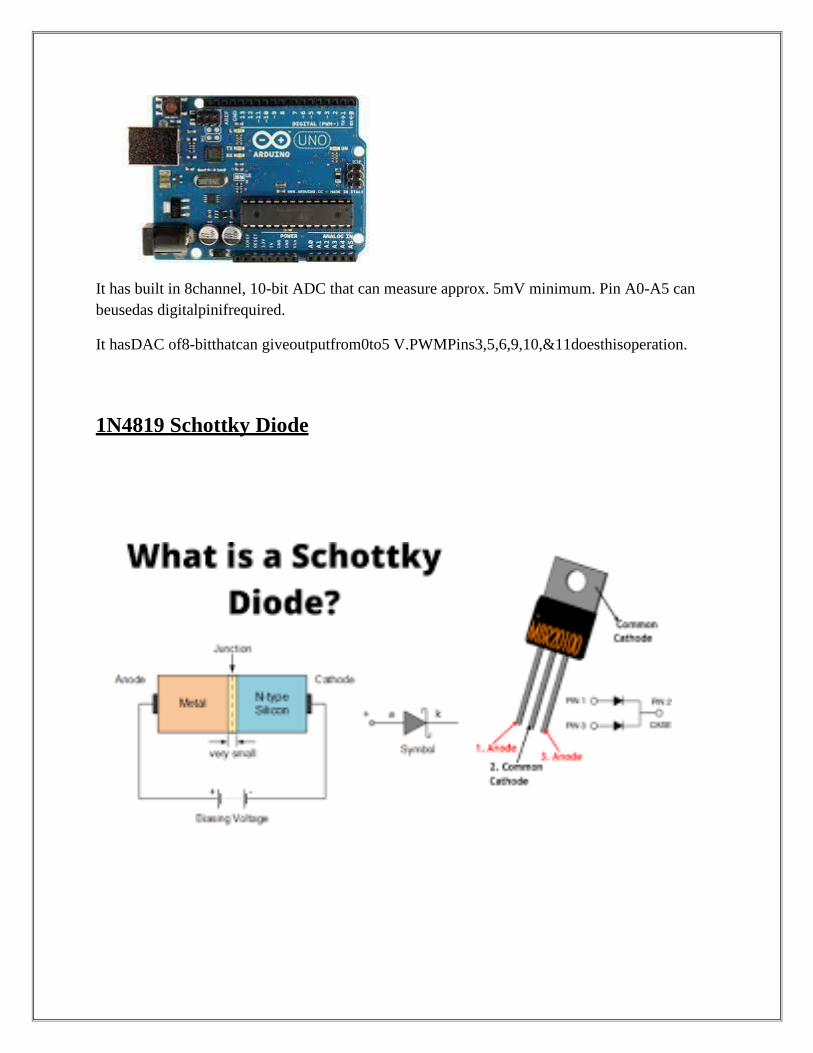
1N4819 Schottky Diode
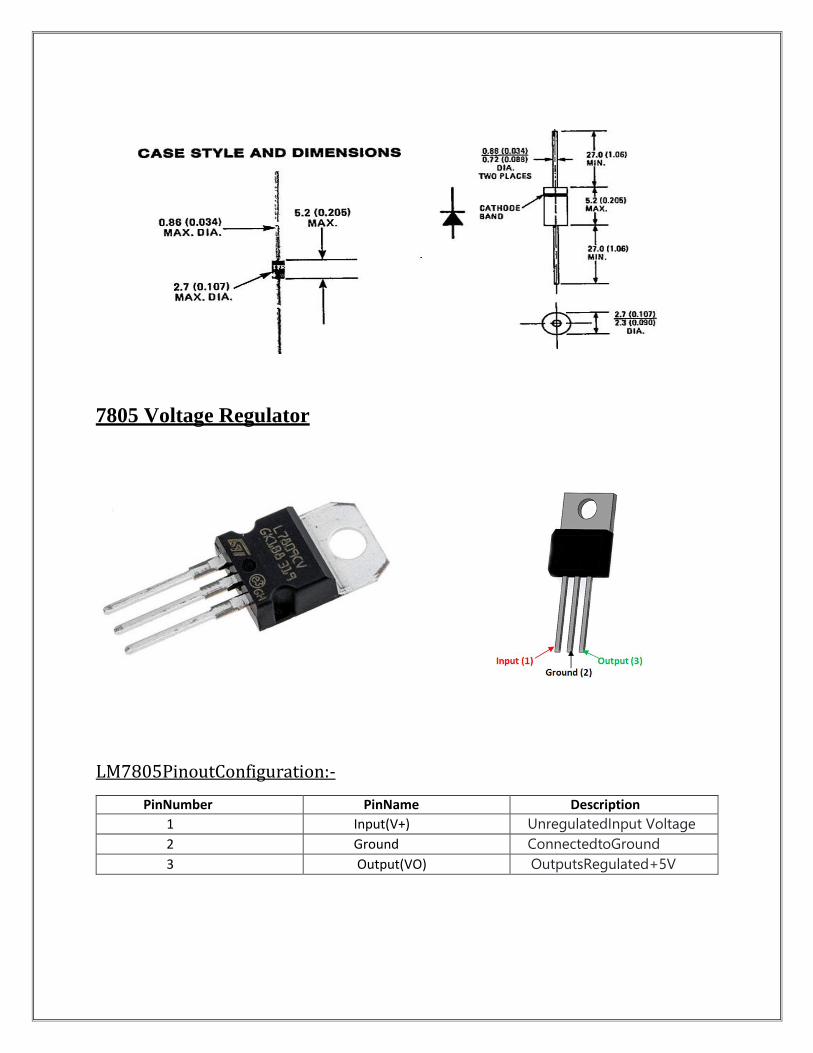
7805 Voltage Regulator
LM7805PinoutConfiguration:-
PinNumber PinName Description
1 Input(V+) UnregulatedInput Voltage
2 Ground ConnectedtoGround
3 Output(VO) OutputsRegulated+5V
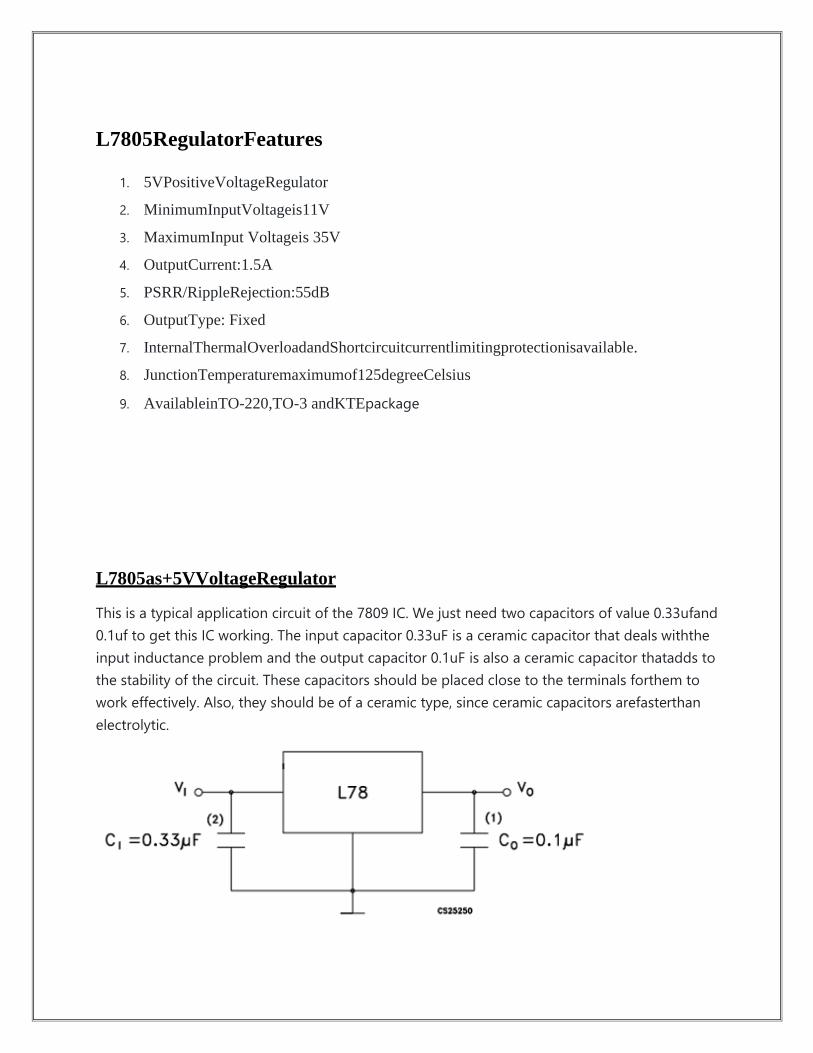
L7805RegulatorFeatures
1. 5VPositiveVoltageRegulator
2. MinimumInputVoltageis11V
3. MaximumInput Voltageis 35V
4. OutputCurrent:1.5A
5. PSRR/RippleRejection:55dB
6. OutputType: Fixed
7. InternalThermalOverloadandShortcircuitcurrentlimitingprotectionisavailable.
8. JunctionTemperaturemaximumof125degreeCelsius
9. AvailableinTO-220,TO-3 andKTEpackage
L7805as+5VVoltageRegulator
This is a typical application circuit of the 7809 IC. We just need two capacitors of value 0.33ufand
0.1uf to get this IC working. The input capacitor 0.33uF is a ceramic capacitor that deals withthe
input inductance problem and the output capacitor 0.1uF is also a ceramic capacitor thatadds to
the stability of the circuit. These capacitors should be placed close to the terminals forthem to
work effectively. Also, they should be of a ceramic type, since ceramic capacitors arefasterthan
electrolytic.

7805Applications
1. Constant+5Voutputregulatortopowermicrocontrollersandsensorsinmostoftheprojects
2. AdjustableOutputRegulator
3. CurrentLimiterforcertainapplications
4. RegulatedDualSupply
5. OutputPolarity-Reversal-ProtectionCircuit
0.96’’OLEDDisplay
1. ThinOLEDDisplay
2. 0.96"OLEDDisplay,OLED0.96"
3. Suitableforwearabledevice
4. Type:Graphic
5. Structure:COG
6. 128x 64DotMatrix
7. Built-incontrollerSSD1306
8. 3VPowersupply
9. 1/64duty
10. Interface:6800,8080,SPI,I2C
11. DisplayColor:White/Yellow /Blue

Capacitor
Capacitorswhichhavebeenusedinthisprojectare
1. 220u F50V Capacitor
2. 10u F25V Capacitor
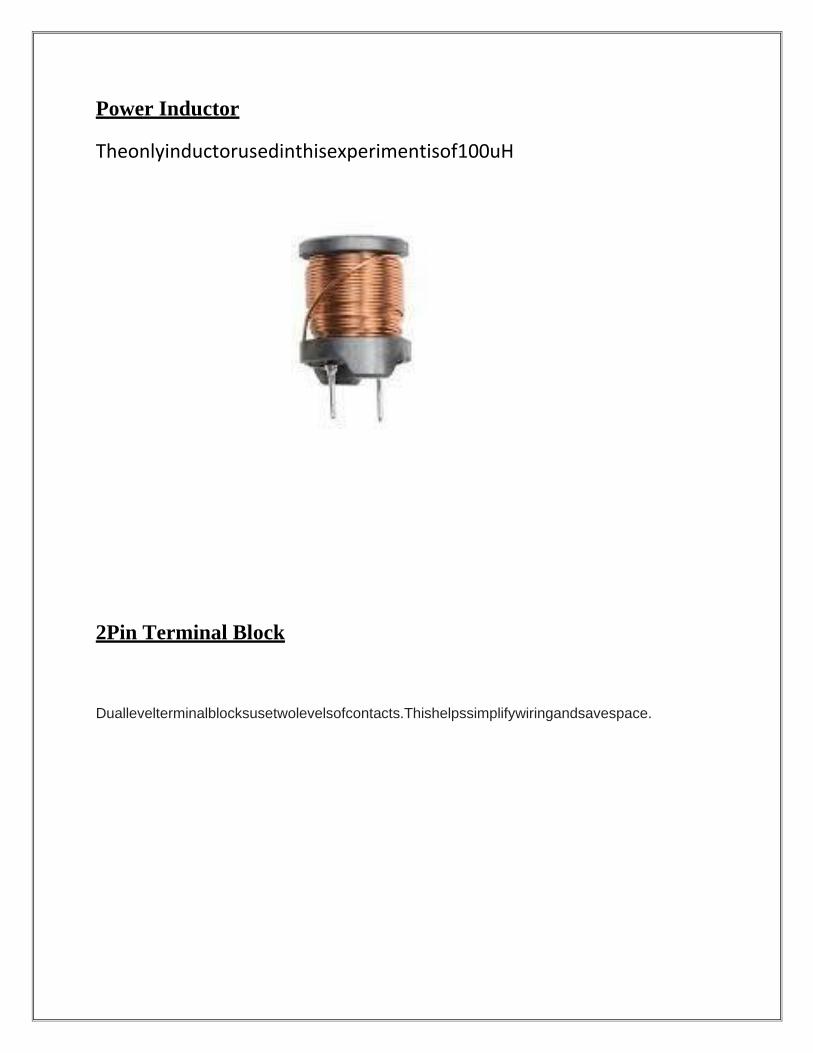
Power Inductor
Theonlyinductorusedinthisexperimentisof100uH
2Pin Terminal Block
Duallevelterminalblocksusetwolevelsofcontacts.Thishelpssimplifywiringandsavespace.

Dot VeroBoard
It was introduced as a general-purpose material for use in constructing
electroniccircuits - differing from purpose-designed printed circuit boards (PCBs)
in that
avarietyofelectronicscircuitsmaybeconstructedusingastandardwiringboard
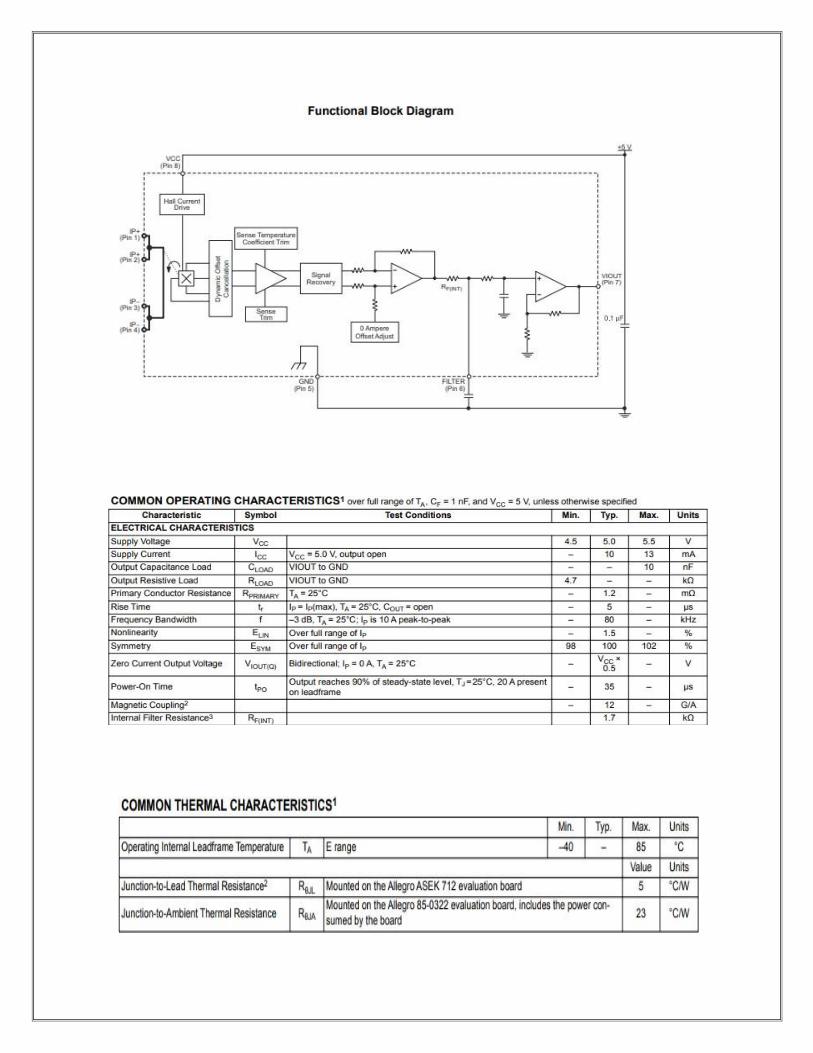
HallCurrent Sensor

ACS712provideseconomicaland precisesolutionsforACor DCcurrentsensing inindustrial,commercial, and
communications systems. The device consists of a precise, low-offset, linear Hall sensorcircuitwith a
copperconductionpathlocatednear thesurfaceofthedie.
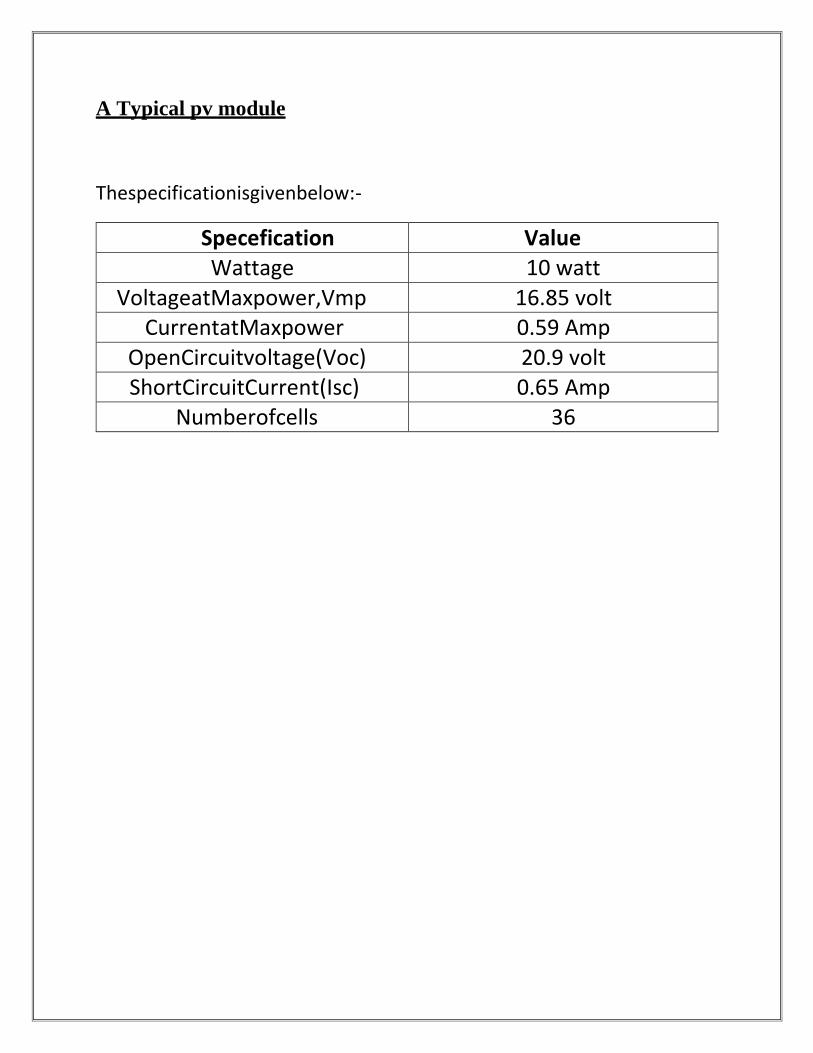
A Typical pv module
Thespecificationisgivenbelow:-
Specefication Value Wattage 10 watt
VoltageatMaxpower,Vmp 16.85 volt CurrentatMaxpower 0.59 Amp
OpenCircuitvoltage(Voc) 20.9 volt ShortCircuitCurrent(Isc) 0.65 Amp
Numberofcells 36
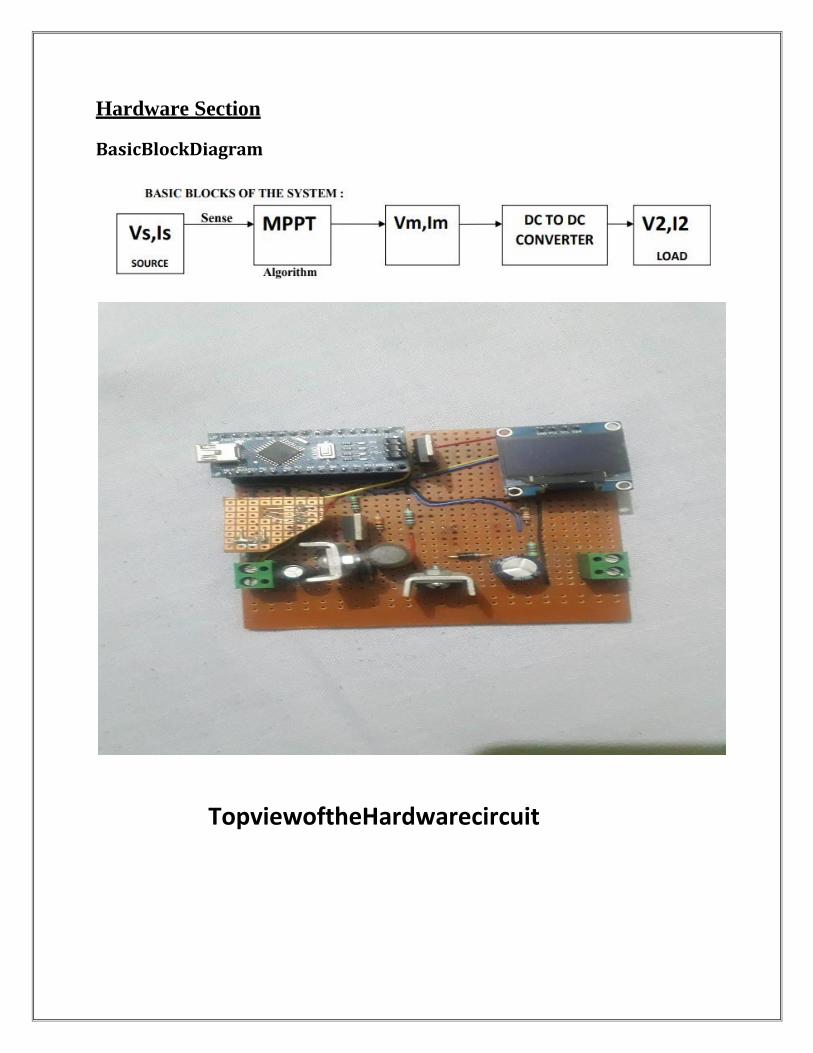
Hardware Section
BasicBlockDiagram
TopviewoftheHardwarecircuit
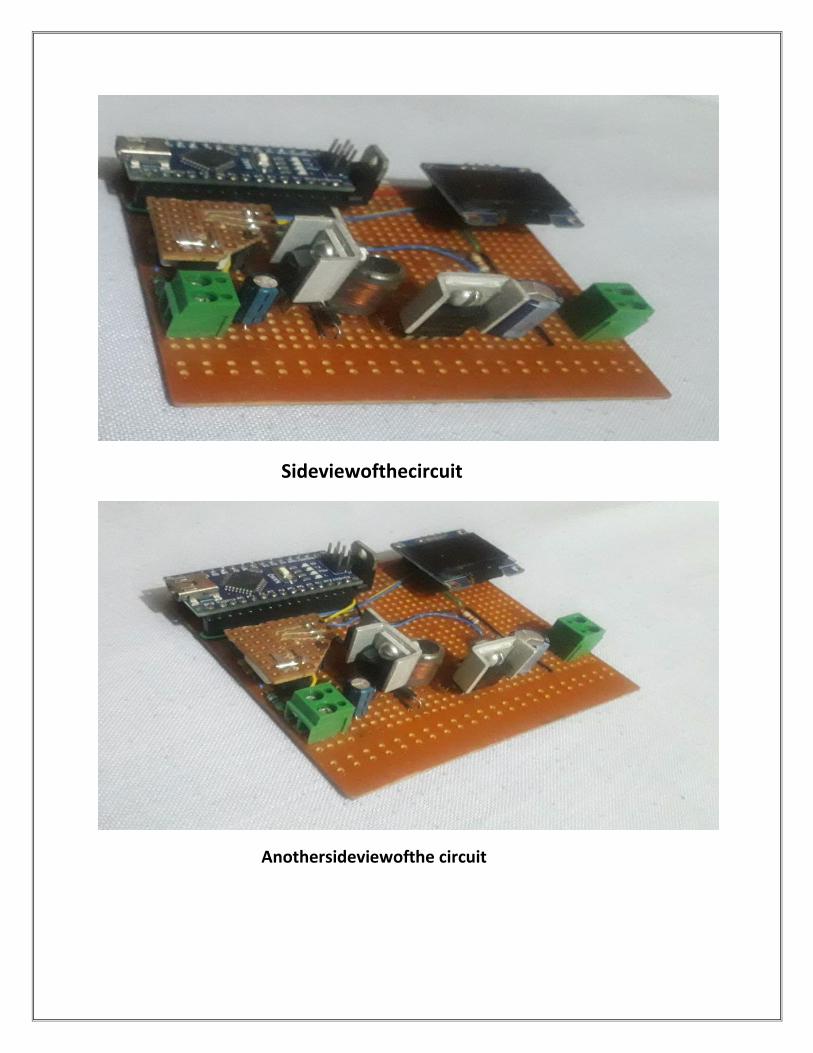
Sideviewofthecircuit
Anothersideviewofthe circuit

Circuit Diagram and their operation
For easy understandingwe are separating the parts and try to understand theworkingof each part
Communication Protocol
The proper descriptions of digital message formats as well as rules are
knowncommunicationprotocols.
1. Protocol:Asetofrulesandregulationsiscalledaprotocol.
2. Communication: Exchange of information from one system to anothersystemwith
amedium iscalledcommunication.
3. Communication Protocol: A set of rules and regulations that allow
twoelectronicdevicesto connectto exchangethedatawith oneand another.
Therearetwotypesofcommunicationprotocolswhichareclassifiedbelow
1. InterSystemProtocol
2. IntraSystemProtocol
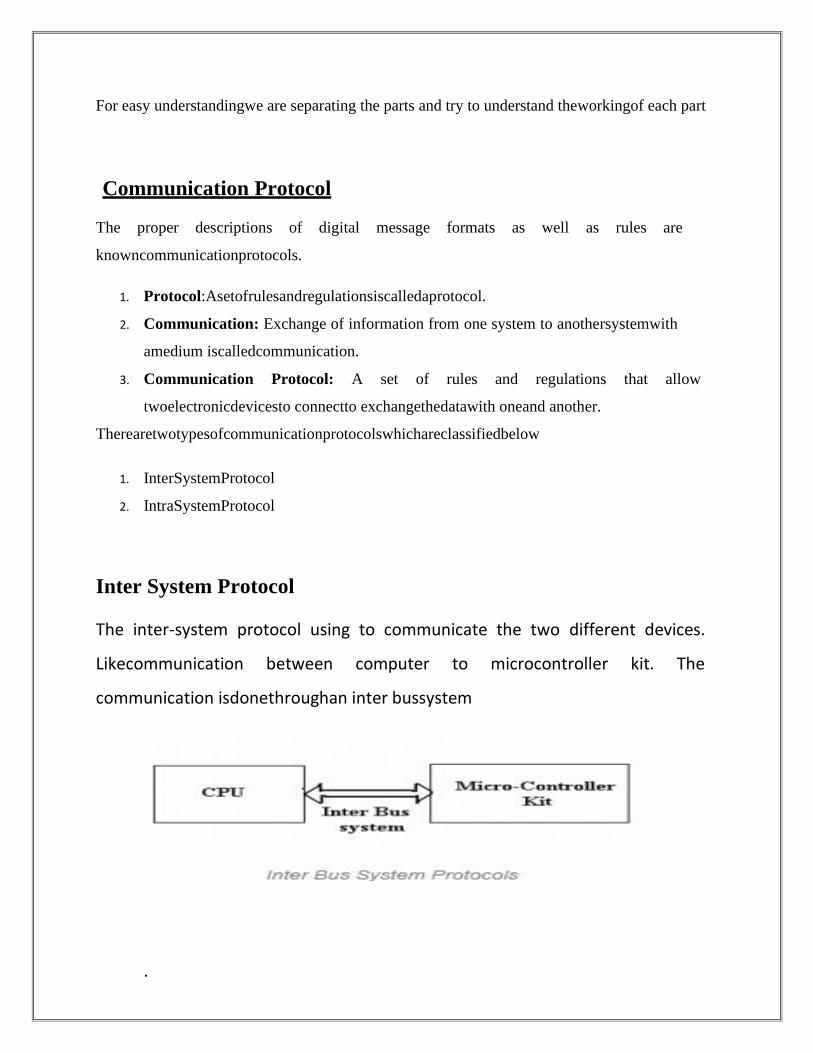
Inter System Protocol
The inter-system protocol using to communicate the two different devices.
Likecommunication between computer to microcontroller kit. The
communication isdonethroughan inter bussystem
.
Thedifferentcategoriesofintersystemprotocolmainlyincludethefollowing
1. UARTProtocol
2. USARTProtocol
3. USBProtocol
Intra SystemProtocol
TheIntrasystemprotocolisusedtocommunicatethetwodeviceswithinthecircuitboard. While using
these intra system protocols, without going to intra
systemprotocolswewillexpandtheperipheralsofthemicrocontroller.Thecircuitcomplexity and
power consumption will be increased by using the intra systemprotocol. Using intra system
protocols circuit complexity and power consumption,thecostis decreasedand itis
verysecuretoaccessingthedata.
Thedifferentcategoriesofintrasystemprotocolmainlyincludethefollowing.
1. I2CProtocol
2. SPIProtocol
3. CANProtocol
HerewehaveusedI2CProtocolsoourmain discussionwillbeonI2Cprotocol
I2C Protocol
I2C stands for Inter Integrated circuit and it requires only two wires connecting
allperipheralstothemicrocontroller.I2CrequirestwowiresSDA(serialdataline)andSCL(serialclockli
ne)tocarryinformationbetweendevices.Itisamastertoaslavecommunicationprotocol.Eachslavehasa
uniqueaddress.Themasterdevicesendsthe address of the target slave device and reads/writes the
flag. The addressmatches any slave device that the device is ON, the remaining slave devices
aredisabled mode.
Once the address is match communication proceed between the master and thatslave device and

transmitting and receiving the data. The transmitter sends 8-bitdata, the receiver replies 1-bit of
acknowledgment. When the communication iscompletedmasterissuesthestopcondition.
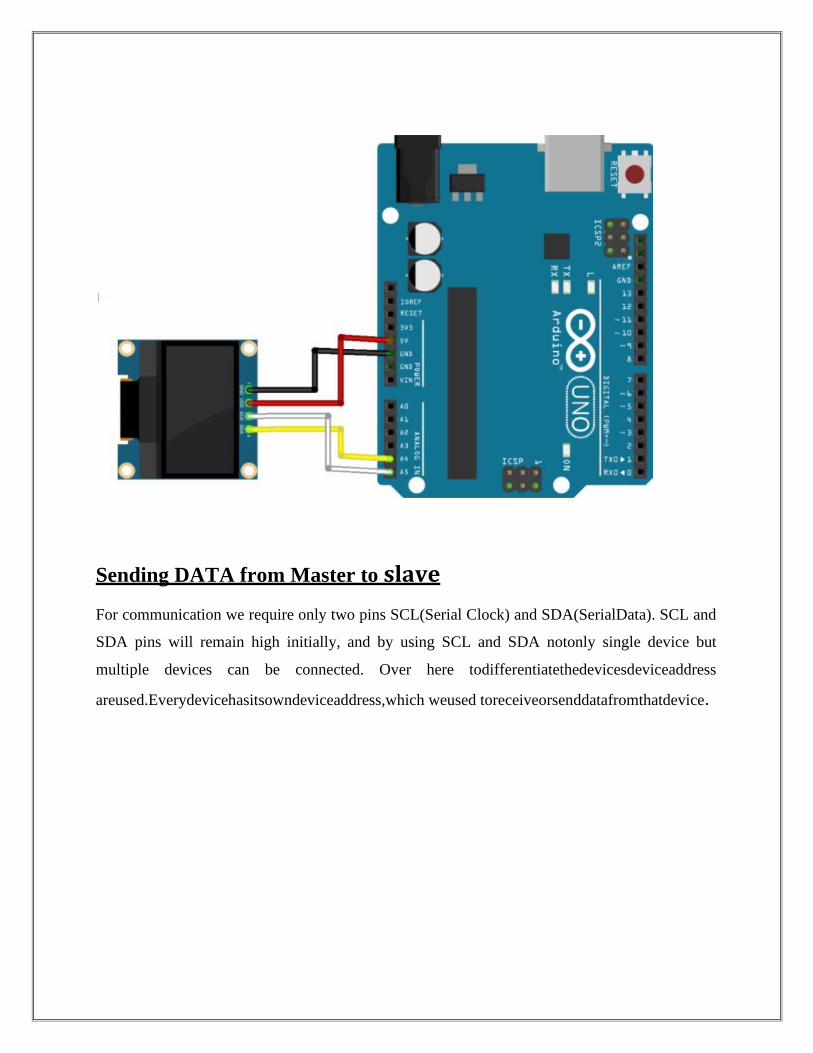
Sending DATA from Master to slave
For communication we require only two pins SCL(Serial Clock) and SDA(SerialData). SCL and
SDA pins will remain high initially, and by using SCL and SDA notonly single device but
multiple devices can be connected. Over here todifferentiatethedevicesdeviceaddress
areused.Everydevicehasitsowndeviceaddress,which weused toreceiveorsenddatafromthatdevice.

Receving DATA from Slave to Master
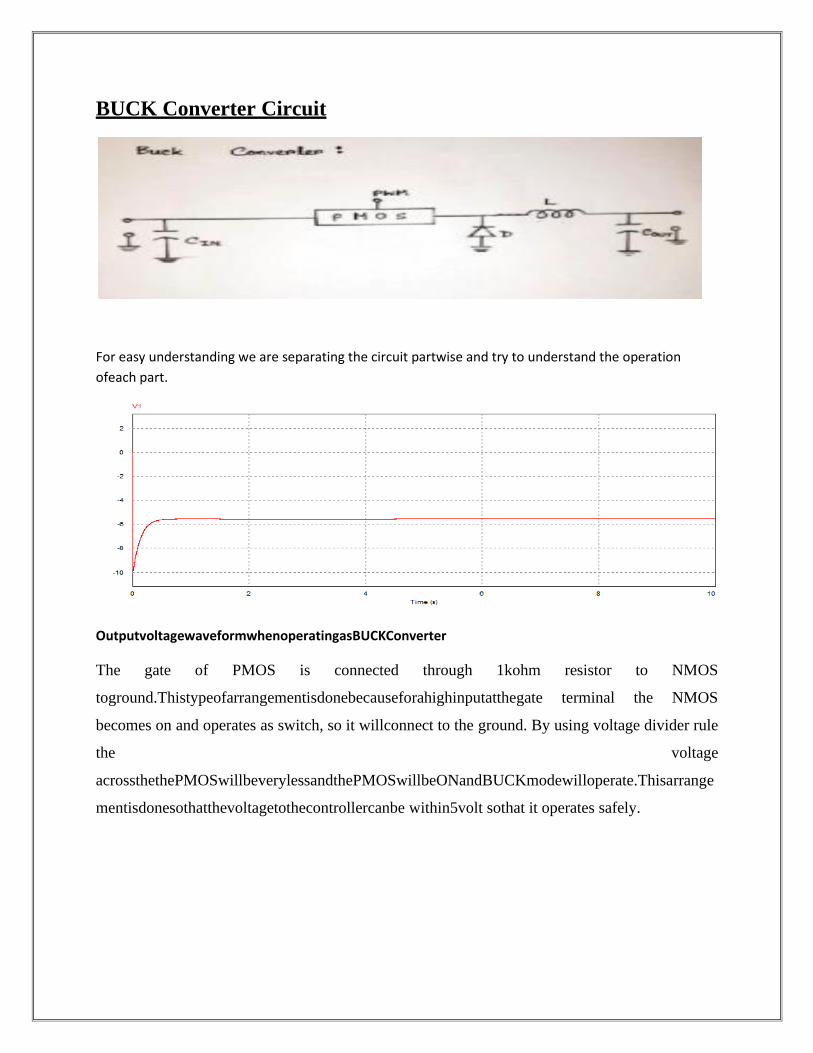
BUCK Converter Circuit
For easy understanding we are separating the circuit partwise and try to understand the operation
ofeach part.
OutputvoltagewaveformwhenoperatingasBUCKConverter
The gate of PMOS is connected through 1kohm resistor to NMOS
toground.Thistypeofarrangementisdonebecauseforahighinputatthegate terminal the NMOS
becomes on and operates as switch, so it willconnect to the ground. By using voltage divider rule
the voltage
acrossthethePMOSwillbeverylessandthePMOSwillbeONandBUCKmodewilloperate.Thisarrange
mentisdonesothatthevoltagetothecontrollercanbe within5volt sothat it operates safely.
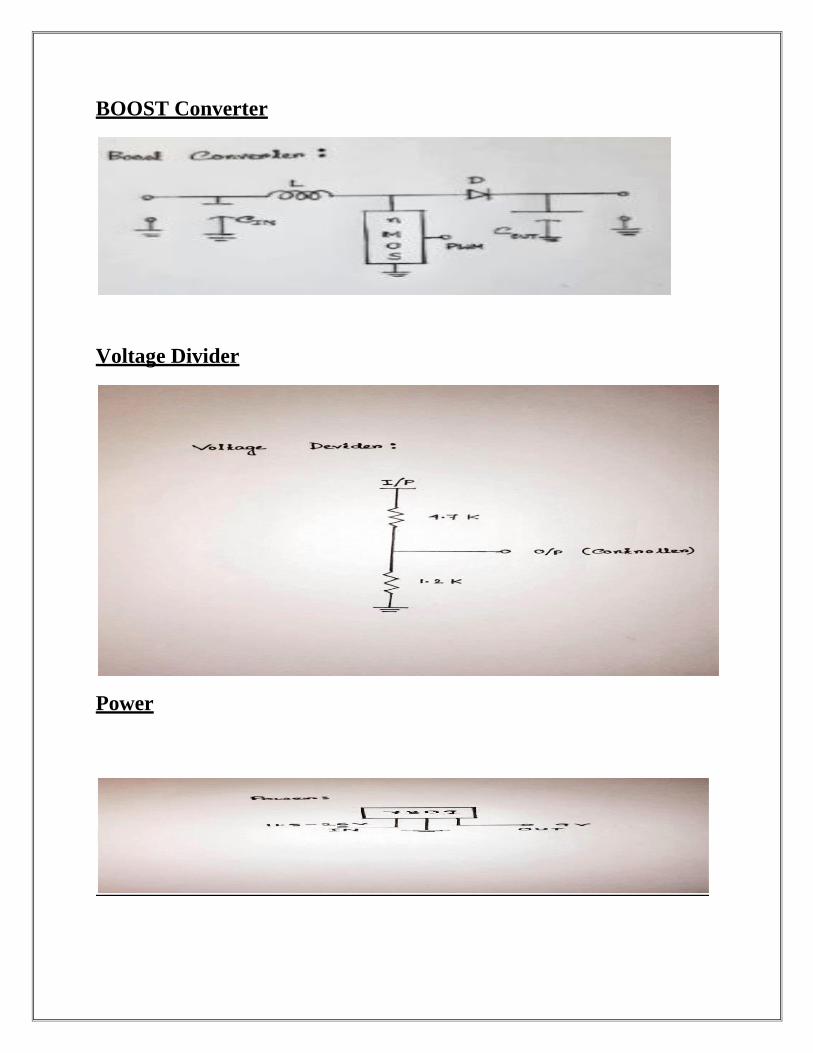
BOOST Converter
Voltage Divider
Power
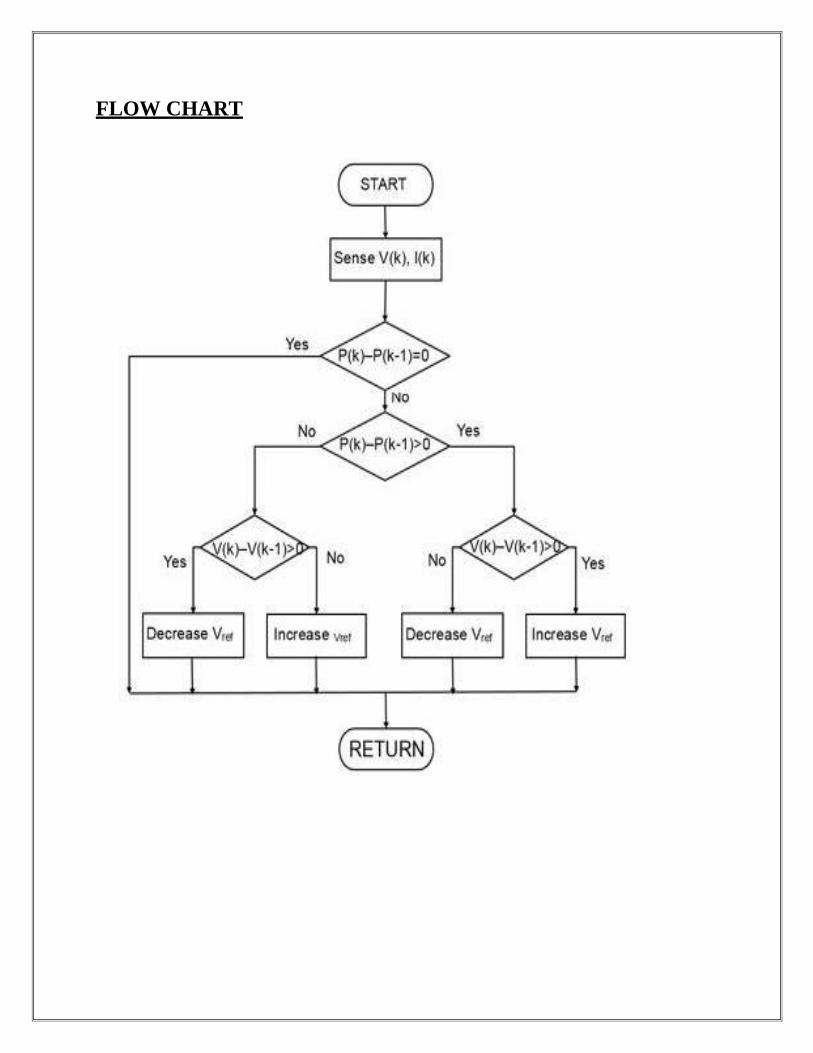
FLOW CHART

Result and Discussion
MPPT(Maximum power point tracker) logic is mainly usedis mainlyused to ensure the
maximum power flow.So when the output voltageis less than the input voltage then the boost
mode will on and
increasetheoutputvoltagesosothatmaximumpowercantransfertotheload.Similarly when the output
voltage is more than the input voltage thenthe buck mode will on and decrease the output
voltage level so thatmaximumpowercan transferred totheload.
Fig:-Result showing the BOOST mode operation
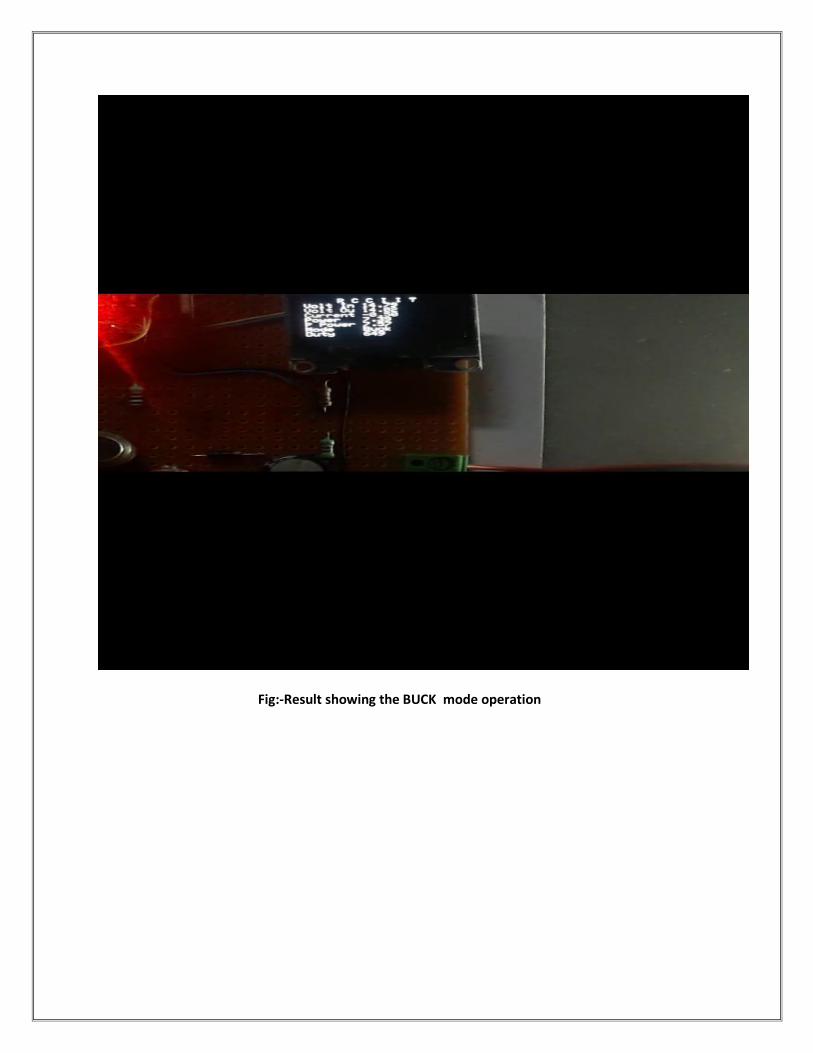
Fig:-Result showing the BUCK mode operation

Software Simulation ckt
Fig:-Matlab Simulation ircuit Diagram

Simulation Components
MATLAB:- MATrixLABoratory is basically popularwith
thenameMATLAB.InonesentenceMATLABis theLanguageof TechnicalComputing.
TheMATLABplatformisoptimizedforsolvingengineeringandscientific
problems. The matrixbased MATLAB language is the world’s most natural way toexpress
computational mathematics. Built-in graphics make it easy to visualizeand gain insights from
data. A vast library of prebuilt toolboxes lets us get startedright away with algorithms essential
to our domain. The desktop environmentinvites experimentation, exploration, and discovery.
These MATLAB tools andcapabilitiesareallrigorouslytestedanddesigned to worktogether.
Features of Matlab:-
Simulink:-Simulink® is a block diagram environment for
multidomainsimulation and Model-Based Design. It supports simulation,
automatic codegeneration,andcontinuoustestandverificationofembedded
systems.
LanguageFundamentals:Syntax,operators,datatypes,arrayindexingandmanipulation
Mathematics:Linearalgebra,differentiationandintegrals,Fouriertransforms,andot
hermathematics
Graphics:Two-andthree-dimensionalplots,images,animation,visualizationData
Import and Analysis: Import and export, preprocessing, visualexploration
Programming Scripts and Functions: Program files, control
flow,editing,debugging
AppBuilding:AppdevelopmentusingAppDesigner,GUIDE,oraprogrammatic23|
Pageworkflow

Advanced Software Development: Object-oriented programming; codeperformance;
unit testing; external interfaces to Java®, C/C++, .NET and otherlanguages
Desktop Environment: Preferences and settings, platform differencesSupported
Hardware: Support for third-party hardware, such as webcam,Arduino®, and Raspberry Pi™
hardware. Also the MicroLab box can be used to gettherealtimeoutputfromtheSimulinkfiles
About Simulink: Simulink® is a block diagram environment for multidomainsimulation and
Model-Based Design. It supports simulation, automatic codegeneration, and continuous test and
verification of embedded systems. Simulinkprovides a graphical editor, customizable block
libraries, and solvers for modelingand simulating dynamic systems. It is integrated with
MATLAB®, enabling us toincorporate MATLAB algorithms into models and export simulation
results toMATLAB for further analysis. To run the model in real time on a target computer,we
made use of the Simulink RealTime™ for HIL simulation, rapid
controlprototyping,andotherreal-timetestingapplications.Inthisproject,ourHardware and Software
part both are based on Simulink. In the software part thewhole thing is simulated in Simulink and
in the hardware part the control signal
isalsogeneratedusingtheSimulinkfilebygettingarealtimeoutputusingMicroLabBoxand
dSPACEsoftware

Simulation wave forms:-

Future Scope
The work that had been carried out by the researchers,the designing of MPPT controller, should
be extended bytrackinglargernumberofinput
parameterswhicharevaryingwithrespecttothetimesuchasparametersvariations of the system. In
order to get accurate MPPTpoint,therecentmathematicalalgorithmssuchasZ-infinity
algorithmsshouldbeimplemented.
There are several application of this project like Batterycharging. It is used in Hybrid power
plant so that
overallefficiencycanbeincreased.ThebuckmodecanbeusedinInverterapplication.Itisalsousedtoena
bletheIOTmode.

Conclusion
From this project on Design and analysis of MPPT BUCK BOOSTConverter /
Modelling of SPV system we can learnt about MPPTtheory,different typeofMPPT
logic.We gatherclear
knowledge on BUCK BOOST converter, it’s operation duringswitch on and switch
offand can analyze the waveformsclearly. We get a clear vison on the hardware
componentswhich have been used in this experiment. Different types
ofcommunication protocols and their uses are now clear to
us.WebecomefamiliarizeaboutI2Ccommunicationprotocol.Ourknowledge have
been enhanced a lotby doing this
projectUndertheguidanceofourmentorProf.Dr.AshokeMondal.
We are very much honoured to have him as a mentor and weare alsoverymuch
thankfulto theentireElectricalDepartmentofRCCIITforgivingus thechanceto
workonthisproject.
References
1. Bernardo, P. C. (2009). A High Efficient Micro-controlled Buck Converter
withMaximumPower PointTrackingforPhotovoltaicSystems.
2. Hua, C. (1998). Implementation of a DSP-Controlled Photovoltaic System withPeak Power
Tracking. IEEE Transactions on Industrial Electronics, vol. 45, no. 1,99-107.
3. Itako, K. (2005). A New Current Sensorless MPPT Control Method for
PVGeneration Systems. Proceedings of the European Conference on
PowerElectronicsand Applications,1-9.
4. Jiang, Y. (2011). Study and Evaluation of Load Current Based MPPT Control
forPVSolarSystems.Proceedingsofthe2011IEEEEnergyConversionCongress
5. Morales-Saldana, J. A. (2006). Modeling and Control of Boost Converter with
aSingleSwitch.32ndAnnualConferenceonIEEEIndustrialElectronics,591-596
6. Mrabti,T.(2009).RegulationofElectricPowerofPhotovoltaicGeneratorsWithDC-DC Converter
(Buck Type) and MPPT command. ICMCS '09. InternationalConferenceon
MultimediaComputingand Systems,322-326.
7. Orellana, M. (2010). Four Switch Converter for Photovoltaic DC-DC
PowerApplications.36thAnnualConferenceIEEEIndustrialElectronicsSociety,469-474.
8. Pan,C.(1999).AFastMaximumPowerPointTrackerforphotovoltaicPower
9. Systems.Proceedingsofthe25thAnnualConferenceoftheIEEEIndustrialElectronicsSociet
yConference,390-393.
10. Salas,V.(2006).ReviewoftheMaximumPowerPointTrackingAlgorithmsforStand-Alone
Photovoltaic Systems. Solar Energy Materials & Solar Cells, vol. 90,no.11,1555-1578.
