design guidelines for agent based model visualization
TRANSCRIPT

11/20/09 3:30 PMDesign Guidelines for Agent Based Model Visualization
Page 1 of 32http://jasss.soc.surrey.ac.uk/12/2/1.html
©Copyright JASSS
Daniel Kornhauser, Uri Wilensky and William Rand (2009)
Design Guidelines for Agent Based Model VisualizationJournal of Artificial Societies and Social Simulation vol. 12, no. 2 1
<http://jasss.soc.surrey.ac.uk/12/2/1.html>
For information about citing this article, click here
Received: 14-Aug-2008 Accepted: 01-Feb-2009 Published: 31-Mar-2009
Abstract
In the field of agent-based modeling (ABM), visualizations play an important role in identifying,communicating and understanding important behavior of the modeled phenomenon. However, manymodelers tend to create ineffective visualizations of Agent Based Models (ABM) due to lack ofexperience with visual design. This paper provides ABM visualization design guidelines in order toimprove visual design with ABM toolkits. These guidelines will assist the modeler in creating clearand understandable ABM visualizations. We begin by introducing a non-hierarchical categorization ofABM visualizations. This categorization serves as a starting point in the creation of an ABMvisualization. We go on to present well-known design techniques in the context of ABM visualization.These techniques are based on Gestalt psychology, semiology of graphics, and scientific visualization.They improve the visualization design by facilitating specific tasks, and providing a common languageto critique visualizations through the use of visual variables. Subsequently, we discuss the applicationof these design techniques to simplify, emphasize and explain an ABM visualization. Finally, weillustrate these guidelines using a simple redesign of a NetLogo ABM visualization. These guidelinescan be used to inform the development of design tools that assist users in the creation of ABMvisualizations.
Keywords:Visualization, Design, Graphics, Guidelines, Communication, Agent-Based Modeling
Introduction
1.1A major purpose of agent-based models is to visually convey the behavior of the model clearly andquickly. An effective visualization of an ABM identifies the important model elements and helps theuser to understand the model's behaviors. However, designing an effective visualization can bechallenging for model authors, most of whom do not have visual design training. Establishingprinciples for designing cognitively efficient, aesthetic and communicative visualizations can guide

11/20/09 3:30 PMDesign Guidelines for Agent Based Model Visualization
Page 2 of 32http://jasss.soc.surrey.ac.uk/12/2/1.html
researchers in their graphic design process of agent-based models. Cognitive efficiency (Cobb 1997)takes place when swift perceptual inferences replace slow cognitive comparisons (Healey 1995). Acognitively efficient visualization can facilitate the detection of important features, such as thediscovery of emergent behavior, by providing an optimal representation to facilitate tasks such ascluster detection. Aesthetics is another key consideration for ABM visualization design. An aestheticvisualization can add visceral appeal (Norman 2004; (Brath 2005), thus improving the visualizationby highlighting its message and increasing its memorability.
1.2Some ABM visualizations are more easily understood than others and some are more aesthetic thanothers (see Figure 1). Developing effective guidelines to increase the accuracy and readability of theABM visualizations can assist in the comprehension and appeal of the underlying model.
Innate Immune Response (An 2004)
NetLogo User Community Model
ProbLab Genetics (Abrahamson 2004)
NetLogo Curricular Model
a) Confusing and Unaesthetic Visualizations
Heat Bugs (Wilensky 2004)
NetLogo Library Model
DLA Alternate Linear (Wilensky 2004)
NetLogo Library Model
b) Clear and Aesthetic VisualizationsFigure 1. Examples of ineffective unaesthetic visualizations versus effective aesthetic visualizations inNetLogo. Note that in the visualizations on the left a), the authors chose to prioritize other criteria: Inthe Innate Immune Response Model, the author used a red garish background to represent the color ofblood. In the Prolab Genetics Model, the author used neon colors given that they tend to captivate the
interest of children. In this paper we prioritize cognitively efficient representations above accuratefigurative representations or motivational representations.
1.3The difficulty in creating a cognitively efficient and aesthetic ABM visualization resides in the open-ended and unconventional representation of agent based models. Other software used for modeling,such as Geographic Information Systems (GIS) or spreadsheets provide more canonical and

11/20/09 3:30 PMDesign Guidelines for Agent Based Model Visualization
Page 3 of 32http://jasss.soc.surrey.ac.uk/12/2/1.html
constrained representations such as maps in GIS or plots in spreadsheets. The design of theseconstrained representations is possible to automate, for example the computer can assist the user increating maps and a wide variety of diagrams and plots. However, this is difficult to achieve in ABMvisualization given the diversity of ABM depictions. The nature of agent-based modeling frameworksdemands a wide array of graphic representations (see Figure 2) that are usually custom-made for eachmodel. Thus, well-designed ABM visualizations requires an in-depth knowledge of visualizationguidelines and the skill to use those guidelines to craft clear and aesthetic visualizations.
1.4In this paper, we first describe and categorize ABM visualizations created in NetLogo (Wilensky1999a). This categorization aims to introduce the reader to the diversity of visualizations in ABM andsome of the better practices in ABM visualization design. Afterwards, we discuss how Gestaltpsychology, semiology of graphics and scientific visualization can inform the design of ABMvisualizations. Through this discussion we hope to introduce ABM developers to techniques forimproving their visualizations such as, foreground/background segregation, informed use of visualvariables, and removal of visual interferences. Then, we present the goals for applying thesetechniques: to simplify, emphasize and explain the visualization. Finally, we examine a redesign of anABM visualization to illustrate these ideas.
Background
2.1Visualization guidelines for an agent-based model draw from both aesthetic and cognitive designtraditions. Aesthetic design techniques have a long history originating in artistic and graphic designdeveloped over centuries. However, cognitive design techniques were only studied recently,originating with Gestalt psychology research in the early twentieth century.
2.2Aesthetic visualization techniques involve color theory, image composition, and other visualconsiderations seeking to remove discordant structures and highlight a message. A detailed discussionof graphic aesthetics is outside the scope of this paper, but the reader can gain some basic knowledgein this area by consulting introductory references (Pipes 2004; Maeda 1999). However, to effectivelyemploy aesthetic design, reading art and design theory is insufficient, it is a craft primarily acquired byactively practicing with an expert. Nevertheless, aesthetic designs do follow certain general rules suchas, balance, unity, harmony, scale and proportion, and contrast and emphasis. By understanding thesedesign criteria the developer of ABM visualizations should be capable of articulating when, how andwhy a visualization is pleasing to the eye.
2.3Cognitive visualization techniques tend to be more explicit than aesthetic techniques and therefore canbe more easily conveyed and systematized. Cognitive visualization techniques have been developed inseveral fields, starting in Gestalt psychology (Wertheimer 1923).
2.4Gestalt psychology is a theory of mind with the motto 'The whole is greater than the sum of its parts'.Gestalt psychologists studied with mechanisms of visual recognition of figures and whole forms froma collection of simple lines and curves.
2.5Jacques Bertin developed another significant visualization framework in his seminal book, TheSemiology of Graphics (Bertin 1967). In his work, Bertin, defines a coherent and comprehensivesymbol scheme where he presents visual variables and studies the type and quantity of informationthey can convey.
2.6There are many other significant frameworks that have been developed to study visualization,particularly in the field of statistics. (Tukey 1977; Tufte 1983).
2.7In the 1980s, with the advent of personal computers, scientific visualization became a distinct field,

11/20/09 3:30 PMDesign Guidelines for Agent Based Model Visualization
Page 4 of 32http://jasss.soc.surrey.ac.uk/12/2/1.html
building upon research in fields such as cognitive psychology and psychophysics to improvevisualization techniques. Currently, a wide array of material is available, from comprehensivevisualization textbooks (MacEachren 1995; Ware 2002), to specialized papers that address specifictopics such as real-time multivariate data visualization (Healey, 1996) or color schemes in computerdisplays (Harrower & Brewer 2003).
2.8Capturing which of these techniques apply to ABM visualization design is difficult due to themultidisciplinary nature and breadth of visualizations. Additionally, prioritizing which techniques aremore relevant than others increases the challenge. One way to solve this problem is to approach it inthe same way that other disciplines such as art, design or architecture have done. These disciplineshave advanced by documenting their best practices and by creating guidelines for their craft. In asimilar vein, we will begin by studying and classifying visualizations created with NetLogo.
2.9We use models from the NetLogo models library (Wilensky 1999b) as data for our classification. Wechose to use the NetLogo modeling environment since it provides a wealth of ABM visualizations inits extensive models library and has a very large and active user community which also contributesand publishes models (Wilensky & Reisman, 2006). Our need for ABM visualization guidelinesstemmed in part out of the desire to improve NetLogo's visualizations and to provide the NetLogouser community with visualization guidelines for submitting their models. Furthermore, NetLogoprovides several key features that facilitate ABM visualization design. NetLogo is designed to be both'low threshold' and 'high ceiling' (Wilensky, 2001; Tisue & Wilensky, 2004). Consequently, NetLogoprovides high-level primitives for programming and visualizing an ABM model. These high levelABM primitives liberate the programmer from implementing low level programming of control anddata structures to address agents; giving more time to attend to the visualization design. Additionally,high-level graphics primitives within NetLogo enable users to rapidly prototype differentvisualizations in tight iterative cycles without having to learn the intricacies of low-level graphicslibraries.
Guidelines
3.1We present three sets of guidelines for ABM visualization design.
3.2The first set of guidelines is an ad hoc classification of ABM visualizations currently found in theNetLogo Models Library. This classification can familiarize the novice with the breadth and boundsof existing ABM visualizations. This overview of visualizations can assist the modeler in starting toauthor his/her own model inspired by visualizations similar to the one she/he wishes to create. Oftenone of the easiest ways to design a visualization is to look at other visualizations that have similarproperties and to emulate them in ways that make sense within the context of the new model.
3.3The second set of guidelines presents well-known visualization principles in the context of ABMvisualizations. By learning about these principles, model authors can remove or replace the elementsof the design that cause confusion. These principles provide the authors with a firm grounding in howthey can increase the visualization's comprehension.
3.4The third set of guidelines sets clear objectives for applying the visualization principles. The modelercan improve the visualization by simplifying and emphasizing its message. These goals should alwaysbe kept in mind to ensure that the design principles are applied appropriately.
Non-hierarchical Classification of Agent Based Model Visualizations
4.1

11/20/09 3:30 PMDesign Guidelines for Agent Based Model Visualization
Page 5 of 32http://jasss.soc.surrey.ac.uk/12/2/1.html
There are now several ABM toolkits available. It is impractical to categorize all of the ABMvisualizations of every model in each ABM toolkit, and therefore we have chosen to examine theNetLogo models library. Based on this extensive library (over 200 models) the authors havedeveloped a set of distinct tags (see Figure 2-a 2-b 2-c). Our approach was inspired by (Lohse, 1994)who classified static visualizations but we did not use external subjects to perform the classification.We clustered screenshots of similar visualizations displayed in the NetLogo Samples Model Library.However, on some occasions if the screenshot did not clearly demarcate a category, we ran the modelin NetLogo to observe the model's behavior. Due to the open-ended design of ABM visualizations wefind it is impractical to try to classify them using a rigid taxonomy, therefore we created an ad-hocnon-hierarchical classification. The sole purpose of these classification tags is to orient the novice tothe possibilities and limitations of ABM visualizations.
4.2Labeling the NetLogo Models Library has several advantages. First, the visualizations are intrinsicallydriven by agents since NetLogo models are constructed with data structures and primitives implicitlyimbued with ABM semantics. Moreover, NetLogo visualizations share the same graphical andprogrammatic primitives; thus they can be compared and analyzed using the same criteria. Finally, theNetLogo Models Library goes through a strict checkout process assuring that the models havesufficient quality and accuracy to be deployed for use in educational institutions.
4.3This classification could be improved substantially, particularly by asking external subjects to tag theimages and by using dynamic NetLogo animations instead of static images from the screenshots.However, we consider this first classification suitable for our purposes, namely, assisting the novice inlocating a visualization category to initially guide his or her model's visualization design.
4.4The classification of models is purely visual. It does not take into account the particular phenomenonbeing explored by the model. In other words, we did not consider the subject area or discipline of themodel. Of course, some visualizations in the same category share the same type of phenomenon, but itis not unusual to find unrelated phenomena appearing in the same category. This classification is notmeant to be a rigid comprehensive classification; on the contrary, it is meant to be an easilyunderstandable and flexible overview. Thus, the modeler should envision the model that theyeventually want to develop and then examine categories below based on that conception, to find astarting point for the design of their new visualization.
4.5We divide ABM visualizations into three main categories: conventional, unstructured and structured.Conventional visualizations make use of previously established representations while unstructuredvisualizations display abstract or irregular patterns, and structured visualizations convey meaningthrough shape or regular patterns. These categories should not be conceived of as mutually exclusive.Indeed, visualizations can encompass several categories and can even switch categories depending onthe state of the simulation. Many tags can describe one model, and the same tag can be used todescribe many models. We created categories that convey a certain sense of the potential of ABMgraphics to the novice.
4.6Conventional ABM visualizations encompass established representations of mathematical and/ornatural phenomena. The viewer understands these representations since he has seen or studied similarrepresentations previously. This exposure may have taken place in several contexts such as aneducational institution or popular culture. For instance, in recent years fractals have enterededucational institutions and mainstream culture -- thus an educated audience can now understand thecontext and relevance of a fractal in a visualization when previously they would have been unable tocomprehend the representation.
4.7We divided the rest of ABM visualizations into two categories: structured ABM visualizations andunstructured ABM visualizations. Note that this is not a rigid categorization; an unstructured ABMvisualization can become a structured ABM visualization through emergent behavior. These

11/20/09 3:30 PMDesign Guidelines for Agent Based Model Visualization
Page 6 of 32http://jasss.soc.surrey.ac.uk/12/2/1.html
visualizations are not understood due to a predetermined convention; the viewer uses his visualintuition and the documentation accompanying the visualization to process and give meaning to thevisual features. The aim of our classification is to differentiate the key mechanisms the viewer usesfor understanding a visualization. In structured visualizations the shape or clusters formed by theagents plays a primal role, while in an unstructured visualization no contours or areas are markedlydefined, instead the viewer uses the spatial distribution of the agents and their color, shape andorientation to make sense of the image.
Tag Name Visualization Examples Short Description
Cellular Automata
Cellular automata consist of regular grids ofagents where a finite number of states areusually mapped to a color.
Physics representations
Conventional physics representations havebeen historically used to illustrate naturalphenomena.
Fractal
Fractals and L-systems have particular butwell- established visualization techniques.
Geometrical
Geometrical patterns are generated throughspatial interaction of agents.
Figure 2. Conventional ABM visualizations encompass well-established mathematicalrepresentations or natural phenomena. The viewer understands these graphical representations only
because he has seen or studied similar representations previously
Tag Name Visualization Examples Short Description
Few interacting mobileagents (Turtles inNetLogo)
A few mobile agents driven by simple rulescan display complex behavior.
Many interacting mobileagents (Turtles inNetLogo)
Many mobile agents can display complexspatial or color patterns.
Many interacting mobileand immobile agents(Patches and Turtles inNetLogo)
Many mobile agents in the foregroundinteracting with many immobile agents inthe background. These visualizations canbecome structured visualizations after anemergent pattern arises.
Figure 3. Unstructured ABM visualizations appear as irregular spatial patterns. They mostly conveyinformation through the perception of the change of color, texture or spatial distribution of the
composition. They are mostly characterized by an irregular spatial distribution of agents.
Tag Name Visualization Examples Short Description
Flow simulations
Flow simulations are composed of agentsthat are perceived to flow (such as trafficsimulations).
Aggregation
Aggregation is a phenomenon found in

11/20/09 3:30 PMDesign Guidelines for Agent Based Model Visualization
Page 7 of 32http://jasss.soc.surrey.ac.uk/12/2/1.html
biology or physics. We classify thesemodels as regular structures formed byagents.
Emergent patterns withmobile agents
(Turtles in NetLogo)
These systems start with interspersedrandom agents that over time create anemergent pattern. There are many types ofemergent patterns such as clustering ortypes of synchronization.
Emergent patterns withimmovable agents
(Patches in NetLogo)
These models are subsets of cellularautomata, but they often model concretenatural phenomena instead of abstractmathematic phenomena.
Emergent Pattern withPatches and Turtles
In these models the interaction betweenmobile and immobile agents createsclusters. Note that these can becomeunstructured visualizations if the clustersdisperse.
Figurative
Figurative models represent real worldobjects that are not merely clusters ofagents: a cell, a plant, and a dinner.
Particle Systems
In particle systems, each agent is driven bythe interaction of its physical propertiessuch as mass and shape with external forcessuch as gravity, wind or viscosity.
Abstract
These visualizations do not represent anynatural, physical, or mathematicalphenomenon but use a canonicalrepresentation.
Figure 4. Structured ABM visualizations form an abstract or figurative shape or regular pattern.These visualizations are characterized by a regular spatial positioning of agents creating clusters,
regions, aggregations, or particle trajectories.
Design Principles
5.1After completing an initial design, the iterative redesign of an ABM visualization can be divided intotwo parts: removing confusion and adding clarity. Removing confusion can be achieved byeliminating cognitive and aesthetic obstacles. Adding clarity can be accomplished by incorporating orreinforcing visual cues to emphasize the model's key variables and by increasing its aesthetic appeal.These enhancements should result in an unambiguous, memorable and pleasing visualization, whichallows the viewer to easily focus on the main message of the model.
5.2At a high level, cognitive hurdles can arise from an unintended holistic perception of agents. Thisoften occurs when the author's visualization fails to take into account Gestalt principles. For example,the use of figurative icons instead of abstract shapes will impede the viewer's perception of the imageas a whole. You can observe, in Figure 5-a, that circles tend to merge together to produce new shapes,while the human icons overlap, but do not merge. Gestalt psychologists observed this phenomenonwhen they first studied visualizations. They observed that it is easier to perceive a whole given the

11/20/09 3:30 PMDesign Guidelines for Agent Based Model Visualization
Page 8 of 32http://jasss.soc.surrey.ac.uk/12/2/1.html
merger of abstract shapes rather than it is to perceive a whole from set figurative objects thatperceptually overlap but do not merge.
5.3At a lower level, semiotic hurdles can occur as misrepresentations due to erroneous mappings frommodel variables to their visual portrayal. For example, the use of an unintuitive color scheme canconfuse the viewer by mapping a numeric value to an unexpected color (A color scheme maps valuessuch as: 10, 20, 30, 40, to colors such as: red, yellow, green, blue). This often happens in toolkits thatdo not provide pre-constructed color schemes since the modeler is left on its own to assemble colorschemes with color systems such as RGB or HSV. However, building a color scheme requires deepknowledge about color representations hence is difficult to do without prior experience. For example,the construction of a divergent spectral or "rainbow" color can be a challenge as seen in Figure 5-b.Many requirements have to be satisfied such as placing the yellow color in the middle of the scheme,avoiding the confusion of the outermost purple and red colors, and being careful to map the red colorto the highest numerical value even if it has the lowest numerical hue. This issue is addressed in manyenvironments such as Geographic Information Systems (GIS) platforms (e.g., ArcView), orVisualization Toolkits (e.g., VTK), by providing pre-built color schemes assembled around aperceptual correspondence. ColorBrewer is an online tool designed to help people select perceptuallytested color schemes (Harrower & Brewer 2003). Seen in Figure 5-c, ColorBrewer is an excellentstarting point for color scheme selection. Thus, scientific software such as R, MATLAB orMathematica have adopted ColorBrewer schemes. We also created a NetLogo extension to facilitatethe selection and mapping of ColorBrewer schemes in NetLogo(http://ccl.northwestern.edu/papers/ABMVisualizationGuidelines/palette/)
5.4Finally, at the lowest level, perceptual impediments arise when we exceed the limitations of our low-level visual system. Visual features that are difficult to distinguish can disable our pre-attentiveprocessing capabilities. Pre-attentive processing can be hindered by other cognitive phenomena suchas interference between visual features (Healey 2006), or temporal aliasing (Bach 2006) (see Figure5-d).
a) The human silhouette icons on the left overlap, while the circle shapes on the right merge tocreate new compound shapes. Thus, it seems easier to perceive new compound shapes on theright than in the left. This Virus model (Wilensky 1998a) is athttp://ccl.northwestern.edu/netlogo/models/Virus.
b) Notice in the model above on the left how the red color stands for cold (since it is at thebottom of the scale) while pink color stands for hot (at the top of the scale); this color mapping is

11/20/09 3:30 PMDesign Guidelines for Agent Based Model Visualization
Page 9 of 32http://jasss.soc.surrey.ac.uk/12/2/1.html
not intuitive. A superior mapping can be perceived on the right created with a color brewer colorscheme (Harrower & Brewer 2003). This Heat Diffusion model (Wilensky 1998b) is athttp://ccl.northwestern.edu/netlogo/models/HeatDiffusion. The original Heat Diffusion model anda revised version with color schemes can be found athttp://ccl.northwestern.edu/papers/ABMVisualizationGuidelines/HeatDiffusionRedesign.
.
c) On the left, the ColorBrewer webpage (http://colorbrewer.org) displaying a divergent spectralcolor scheme used in the previous right Figure. On the right, the palette NetLogo extension(http://ccl.northwestern.edu/papers/ABMVisualizationGuidelines/palette/) for convenientselection and mapping of ColorBrewer Schemes in NetLogo.
d) The red versus blue color contrast in the left causes the Bezold spreading optical illusion,where a color seems to spread past its bounds. (Note that this optical illusion is better perceivedon a CRT or LCD display, which renders white with luminosity, as opposed to print where whiteappears as a lack of pigmentation) The smallest effective difference (Tufte 1996) should be usedto avoid the optical illusion, as demonstrated in the example on the right. The example on theleft has red and blue saturated colors causing the optical illusion. The examples on the middleand right do not cause the illusion. The example in the middle has NetLogo blue and red basemultihued colors based on ColorBrewer colors, and the image on the right has two hues of bluealso based on ColorBrewer color schemes. The Rumor Mill model (Wilensky 1998c) is athttp://ccl.northwestern.edu/netlogo/models/RumorMill.
Figure 5. Examples of different perception phenomena in visualizations
Gestalt Principles
6.1Some Gestalt principles can help explain and predict a viewer's perception of a collection of graphicalelements such as a visual representation of agents. Gestalt laws remain practical today due to theirsimplicity and generality, and have been applied to enhance contemporary visualizations (Nesbitt &Friedrich 2002).
6.2For instance, a model author can improve an ABM visualization by understanding and using the

11/20/09 3:30 PMDesign Guidelines for Agent Based Model Visualization
Page 10 of 32http://jasss.soc.surrey.ac.uk/12/2/1.html
"Figure-ground segregation" mechanisms studied extensively by the Gestaltists. In NetLogo,immobile agents called 'patches' usually reside in the visualization's background, while mobile agentscalled 'turtles' usually reside in the foreground. A common problem in ABM visualizations ariseswhen foreground and background are not easily distinguishable as in the model displayed in Figure 1-a at the beginning of the paper. The distinction between these two types of agents needs to beimmediately and effortlessly perceived in an animation; the separation between background andforeground should be reinforced.
6.3Gestalt principles explain how a viewer will perceive a set of disjointed visual elements by groupingthem into coherent structures. These principles are relevant to ABM visualizations given that singleagents can be considered as disjoint visual elements, and a collection of agents can be viewed as acoherent structure. As a result, Gestalt principles of organization provide an explanation for how thevisual relations among agents can give rise to the perception of an emergent form or behavior. Beloware some Gestalt principles (Goldstein, 1999) relevant to ABM visualizations:
The principle of similarity (Figure 6-a): "Similar things appear to be grouped together".
The principle of proximity (Figure 6-b): "Things that are near each other appear to be grouped together".
The principle of common fate (Figure 6-c): "Things that are moving together appear to be grouped together".
a) Similarity
NetLogo Voting Model with Patches
Color Similarity: You can distinctly perceive thegreen and blue groups. This Voting Model(Wilensky 1998d ) is athttp://ccl.northwestern.edu/netlogo/models/Voting.
b) Proximity
Termites Model with Turtles
Distance Proximity: You can clearly perceive theyellow clusters formed by the yellow wood chips.This Termite model (Wilensky 1998e) is athttp://ccl.northwestern.edu/netlogo/models/Termites.
c) Common Fate

11/20/09 3:30 PMDesign Guidelines for Agent Based Model Visualization
Page 11 of 32http://jasss.soc.surrey.ac.uk/12/2/1.html
t1 t2 t3
Flocking Model with Turtles
Common Fate: These are three frames of an animation. In them you can perceive the groups of Boidsmoving together from the top right corner to the bottom left corner. This flocking model (Wilensky1998f) based on Reynolds classic Boids (Reynolds, 1987) is athttp://ccl.northwestern.edu/netlogo/models/Flocking.
Figure 6. Examples of different perception phenomena in visualizations
Basic Visual Variables: Position, Size, Shape, Color, Orientation & Value
7.2In order to improve a visualization the author needs to critique his or her design. This implies havinga vocabulary to describe his or her visualization and a framework to establish the alternatives for aredesign. This is why visual variables are useful. By providing a common language to deconstruct avisualization's graphic design, visual variables facilitate communication and the analysis of thegraphical structure of a representation. This analysis can identify problems in a visualization andreveal plausible design alternatives.
7.2Bertin (1967; 1983) defined the visual variables as position, size, shape, color, orientation, value (i.e.relative darkness or lightness of a color) and texture. These visual variables can translate directly intoan agent's graphic properties. The table below (see Figure 7) contains an agent-based representation ofBertin's visual variables. In this table, rows represent the visual variables while columns represent theagent type: a single turtle, turtles, a single patch, and patches. Note that texture does not have a row asa separate visual variable, since texture requires multiple agents, it is displayed in the columns labeled'Turtles' and 'Patches' formed by groups of agents.
Agent Type
VisualVariable
Turtle Turtles Patch Patches
Position
Orientation
Does not Apply:
Patches are usuallyrepresented by anupright square andpolygon
Value

11/20/09 3:30 PMDesign Guidelines for Agent Based Model Visualization
Page 12 of 32http://jasss.soc.surrey.ac.uk/12/2/1.html
Color
Size
Does not Apply:
The size of the patchremains constantthroughout the grid.
Shape
Does not Apply:
The shape of thepatch remainsconstant throughoutthe grid.
Does not Apply:
In NetLogo a patch isrepresented by asquare. Few ABMtoolkits support othergrid shapes (e.g.hexagons)
Figure 7. Bertin's Visual Variables illustrated with NetLogo. An interactive applet, which changeseach visual variable individually, can be viewed at
http://ccl.northwestern.edu/papers/ABMVisualizationGuidelines/VisualVariables/.7.3
While Bertin's basic ideas provide some understanding of the advantages and disadvantages of a givenrepresentational choice, it is not immediately apparent how to make use of this information inanimated computational visualizations. Bertin carefully prefaced his work with the disclaimer that itwas not immediately applicable to "cinematic displays', but conceived 'expressly for print' (Bertin,1967; Bertin, 1983). As a result, the "movement" or "change" visual variable is not included in hisframework. However, recent discussions of Bertin's framework (Carpendale 2003), have consideredincluding movement as a visual variable. Additionally, in recent years, research on animatedvisualization has explicitly been addressed by visualization experts using cognitive science tounderstand how visual features should be used in real time multimodal displays (Healey et al, 1996)
Basic Visual Variables Properties: Selective, Associative, Quantitative, Order &Length
8.1In this section we describe another part of Bertin's framework in order to support the selection ofappropriate visual variables for an ABM visualization. It is not always straightforward to find the bestway of representing a model's variable when it can be signified by value, color, shape, size, ororientation. Thus, understanding the characteristics of each visual variable can assist the modeler infinding the most appropriate visual variable to support a given task.
8.2The characteristics of visual variables can indicate how a variable may aid or hinder the performanceof a task. Below we present Bertin's visual variable characteristics within the context of agent basedmodeling:
Selective: A visual variable is selective when an agent can be immediately distinguished fromits surrounding agents.Associative: A visual variable is associative when groups of agents can be instantly perceived.Quantitative: A visual variable is quantitative when it allows a quick estimation of numericalratios among agents.

11/20/09 3:30 PMDesign Guidelines for Agent Based Model Visualization
Page 13 of 32http://jasss.soc.surrey.ac.uk/12/2/1.html
Order: A visual variable is ordered when it affords an unambiguous and swift comparison, orordering of the agents. Length: The length of a visual variable describes how many distinctvalues it supports, and therefore how much information the variable can convey.
8.3The first four characteristics (selective, associative, quantitative, order) can help the model authordecide if a visual variable is suitable to accomplish a given task (target detection, cluster detection,ratio estimation, value distinction). For example, a square can be difficult to locate in a group ofcircles as seen in Figure 8-c1. The last characteristic (length) assists the model author in determiningif a visual variable has sufficient resolution to represent a model's variable. If a visual variable doesnot have the necessary length to represent the model's variable none of the tasks above can beaccomplished due to a resolution mismatch.
8.5Illustrations, developed in NetLogo, of the visual variables characteristics can be viewed in Figures 8and 9. They were inspired by Figures in Bertin (1967) and Carpendale's (2003) research. Figure 8contains turtle agents and Figure 9 contains patch agents. Turtle agents are usually represented bycircles in order to keep the examples devoid of unnecessary interferences, except in the orientation orshape rows where the heading or shape of the agent is fundamental.
8.6In Figures 8 and 9, the columns hold five different characteristics of visual variables (selectivity,associativity, quantitative, order, and length), and the rows hold six different visual variables(position, size, shape, value, color, and orientation). The first two columns contain illustrationsdepicting the selectivity and associativity of each visual variable in a 2D space. The agents arearranged randomly for performing detection tasks such as boundary and target detection. Theseillustrations contain 50 agents, which we consider a reasonable amount for a detection task. Thereader can change the number of agents and other features in an interactive applet available online(link in Figure 8). In the following three columns, the agents are arranged linearly for ratio estimation(quantitative), value comparison (order) and the depiction of their length (length).
8.7In Figures 8 and 9, the green checkmark means that the visual variable easily supports thecharacteristic. For example, in the first row and column, we can observe that the position visualvariable supports selectivity. The orange tilde means that the visual variable may support thecharacteristic but care should be taken to assure it does. Finally, the cross means that the visualvariable does not support the characteristic well and its use should be avoided whenever possible.
Description of a Turtle's Visual Variable Characteristics.
8.8In this section we will discuss the characteristics of each visual variable: position, shape, size, value,color and orientation. This section should be read while referring to Figure 8 and 9 or the applet athttp://ccl.northwestern.edu/papers/ABMVisualizationGuidelines/VisualVariables/.
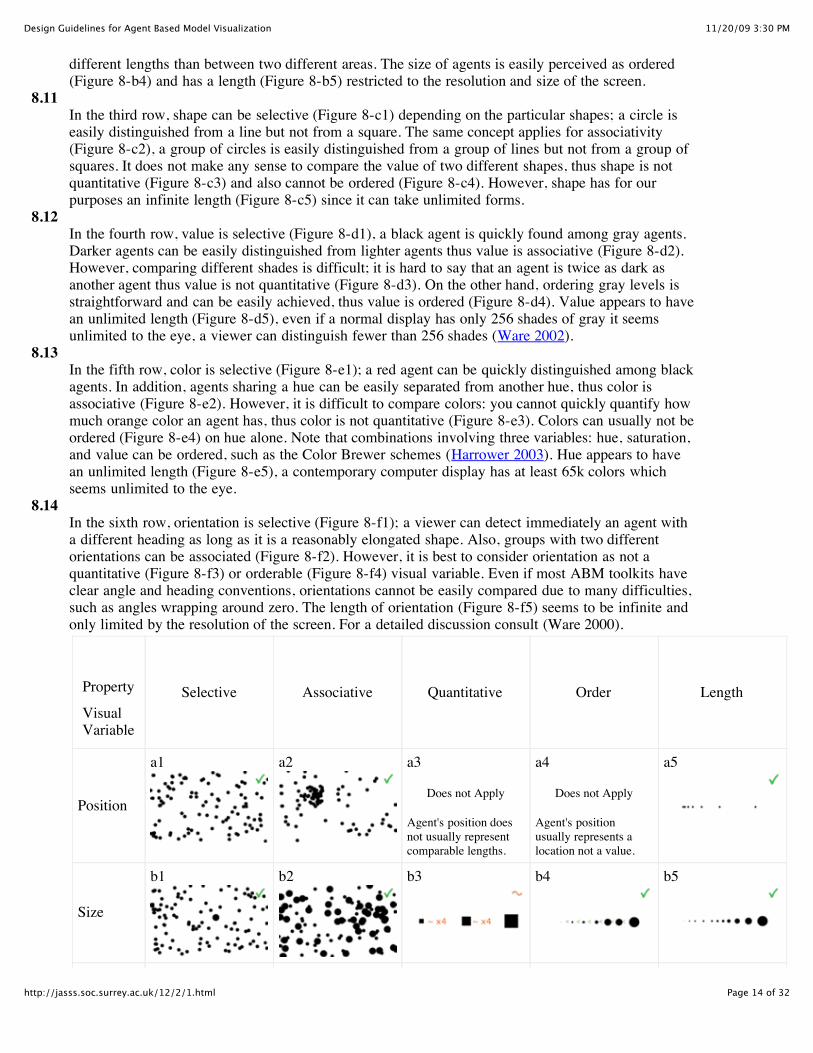
8.9In the first row, position is selective (Figure 8-a1), thus it allows pinpointing every single agent with adifferent location. Additionally, it is associative (Figure 8-a2) since you can perceive immediatelyclusters of agent. In agent-based models, the position does not usually represent a value, instead itrepresents a geometric location, and thus we decided that it could not be used as either a quantitative(Figure 8-a3) or ordered (Figure 8-a4) visual variable. The length (Figure 8-a5) of position, orlocation, is limited to the resolution and size of the screen.
8.10In the second row, size is selective (Figure 8-b1), a reasonably larger agent can be singled outimmediately, while a smaller agent can be noticed but it takes considerably more time. Two groupswith different sizes can be discerned independent of their position; thus size supports associativity(Figure 8-b2). Size can be quantitative (Figure 8-b3) but it is easier to estimate the ratio between two
11/20/09 3:30 PMDesign Guidelines for Agent Based Model Visualization
Page 14 of 32http://jasss.soc.surrey.ac.uk/12/2/1.html
different lengths than between two different areas. The size of agents is easily perceived as ordered(Figure 8-b4) and has a length (Figure 8-b5) restricted to the resolution and size of the screen.
8.11In the third row, shape can be selective (Figure 8-c1) depending on the particular shapes; a circle iseasily distinguished from a line but not from a square. The same concept applies for associativity(Figure 8-c2), a group of circles is easily distinguished from a group of lines but not from a group ofsquares. It does not make any sense to compare the value of two different shapes, thus shape is notquantitative (Figure 8-c3) and also cannot be ordered (Figure 8-c4). However, shape has for ourpurposes an infinite length (Figure 8-c5) since it can take unlimited forms.
8.12In the fourth row, value is selective (Figure 8-d1), a black agent is quickly found among gray agents.Darker agents can be easily distinguished from lighter agents thus value is associative (Figure 8-d2).However, comparing different shades is difficult; it is hard to say that an agent is twice as dark asanother agent thus value is not quantitative (Figure 8-d3). On the other hand, ordering gray levels isstraightforward and can be easily achieved, thus value is ordered (Figure 8-d4). Value appears to havean unlimited length (Figure 8-d5), even if a normal display has only 256 shades of gray it seemsunlimited to the eye, a viewer can distinguish fewer than 256 shades (Ware 2002).
8.13In the fifth row, color is selective (Figure 8-e1); a red agent can be quickly distinguished among blackagents. In addition, agents sharing a hue can be easily separated from another hue, thus color isassociative (Figure 8-e2). However, it is difficult to compare colors: you cannot quickly quantify howmuch orange color an agent has, thus color is not quantitative (Figure 8-e3). Colors can usually not beordered (Figure 8-e4) on hue alone. Note that combinations involving three variables: hue, saturation,and value can be ordered, such as the Color Brewer schemes (Harrower 2003). Hue appears to havean unlimited length (Figure 8-e5), a contemporary computer display has at least 65k colors whichseems unlimited to the eye.
8.14In the sixth row, orientation is selective (Figure 8-f1); a viewer can detect immediately an agent witha different heading as long as it is a reasonably elongated shape. Also, groups with two differentorientations can be associated (Figure 8-f2). However, it is best to consider orientation as not aquantitative (Figure 8-f3) or orderable (Figure 8-f4) visual variable. Even if most ABM toolkits haveclear angle and heading conventions, orientations cannot be easily compared due to many difficulties,such as angles wrapping around zero. The length of orientation (Figure 8-f5) seems to be infinite andonly limited by the resolution of the screen. For a detailed discussion consult (Ware 2000).
Property
VisualVariable
Selective Associative Quantitative Order Length
Position
a1 a2 a3
Does not Apply
Agent's position doesnot usually representcomparable lengths.
a4
Does not Apply
Agent's positionusually represents alocation not a value.
a5
Size
b1 b2 b3 b4 b5

11/20/09 3:30 PMDesign Guidelines for Agent Based Model Visualization
Page 15 of 32http://jasss.soc.surrey.ac.uk/12/2/1.html
Shape
c1 c2 c3
Does not Apply
An agent's shape doesnot usually represent aquantity.
c4 c5
Value
d1 d2 d3 d4 d5
Color
e1 e2 e3 e4 e5
Figure 8. Visual Variables Characteristics of Turtles. An interactive applet can be viewed athttp://ccl.northwestern.edu/papers/ABMVisualizationGuidelines/VisualVariablesProperties/ .
Description of Patches' Visual Variable Characteristics
8.15Patches lack many of the turtles' visual variables such as size, shape, and orientation. Indeed, inNetLogo all patches have the same size, they are all square, and since squares are not thin elongatedshapes they do not have an orientation. Nonetheless, patches share some of the turtle's characteristicssuch as position, value and color, but a patch's position is somewhat different than a turtle's location.For example, a patch's position tends to be more selective and associative than in turtles, since theirdiscrete positioning forbids patches from overlapping and since neighboring patches are located backto back. The length of patch visual variables is restricted to multiples of the patch size.
8.16For the sake of brevity, we will not describe thoroughly each cell as we did on the previoussubsection, the reader can apply an the same reasoning we used for the turtles to the patches.
Property
VisualVariable
Selective Associative Quantitative Order Length
Position
a1 a2 a3
Does not Apply
Agent's position doesnot usually representcomparable lengths.
a4
Does not Apply
Agent's positionusually represents alocation not a value.
a5
Value
b1 b2 b3 b4 b5

11/20/09 3:30 PMDesign Guidelines for Agent Based Model Visualization
Page 16 of 32http://jasss.soc.surrey.ac.uk/12/2/1.html
Size
c1 c2 c3 c4 c5
Figure 9. Visual Variable Characteristics of Patches. An interactive applet can be viewed athttp://ccl.northwestern.edu/papers/ABMVisualizationGuidelines/VisualVariablesProperties/ .
Other Visual Variables
Transparency, Texture, Crispness & Resolution
9.1We previously discussed some of the basic visual variables mentioned by Jacques Bertin in 'TheSemiology of Graphics' (Bertin 1967). In this section, we will briefly mention other moresophisticated visual variables such as transparency, texture, crispness and resolution. A thoroughtreatment of these visual variables is beyond the scope of this paper. We refer the reader to textbooksby MacEachren (1995) and Ware (2002) for an in depth discussion of these variables, though theirtreatment is not specific to ABM visualizations.
9.2Variables such as transparency, texture, crispness and resolution can be valuable in ABMvisualizations. Below we present a few examples using these visual variables in ABM visualization.Transparency can assist in the perception of agents covering or overlapping other agents as seen inFigure 10-a. Texture can increase the number of variables that can be simultaneously displayed(though it considerably decreases the resolution as seen in Figure 10-b (Julesz 1986 ; Ware 2002).Crispness allows the user to focus on a particular agent while maintaining its context -- a techniqueknown as semantic depth of field Figure as seen in 10-c (Kosara 2001). Also, resolution can bedecreased by blurring each individual agent to allow the user to easily perceive the macro behavior ofthe model as in Figure 10-d.
a) Example of agents with transparency in the middle and right images. (Colby 1991).
a) Example of a vector field generated in NetLogo
b) Example highlighting agent micro behavior.

11/20/09 3:30 PMDesign Guidelines for Agent Based Model Visualization
Page 17 of 32http://jasss.soc.surrey.ac.uk/12/2/1.html
with arrows on the left and with texture on the rightgenerated by agent with textons (Jules 1986; Ware
1995).
Focus on a single agent with a halo on the left;while on the right we blurred the individual
agents.
d) Examples of agents with decreased resolution to enable easy observation of emergent macro behavior
Figure 10. Examples of transparency, textures, resolution, and crispness in ABM visualizations. (We created these images using experimental NetLogo builds, except for Figure 10-d on the right where we
blurred a screenshot with a graphics program)
Change
9.3ABM visualizations are intrinsically animated since change over time is the most straightforward wayto represent behavior. In this section, we will discuss issues that frequently arise while updating ABMvisualizations. A thorough treatment of dynamic visual variables is beyond the scope of this paper.For a detailed definition of these visual variables we refer the readers to (MacEachren , 1995) whodefines six dynamic variables: duration, rate of change, order, display date, frequency andsynchronization. Note that their treatment is not specific to ABM visualizations, but rather targeted tomaps.
9.4Smooth graphical transitions are quite challenging to update for ABM toolkits such as NetLogo wherean interactive Agent Based Model is executed in real time. The challenge is to balance the use of CPUtime between displaying graphics and performing model calculations. If CPU time is devotedexclusively to graphics updates, the model's calculations grind to a halt. On the other hand, if thecomputational effort is solely dedicated to the model's calculations the graphics slow down to anunacceptable rate. Note however, that this is not an issue in information visualization where the datais readily available for display since it is already stored and does not have to be computed. This is animportant distinction between information visualization and interactive ABM visualization. Ininformation visualization most of the CPU cycles can be used to update graphics and interact with theuser.
9.5This results in two main issues that arise in ABM animation:
Temporal aliasing, when the agents become visually hard to track since they abruptly 'jump'from one location to another instead of smoothly 'sliding' between positions. (Korein 1983)Irregular frame rate, where the frame rate fluctuates over time depending on the complexity ofthe model calculations in such a way that it confuses and frustrates the user.
9.6Spatio-temporal aliasing or non-smooth jerky motion can pose insurmountable perceptual challengesin ABM visualizations where the user is trying to keep track of the agents in the simulation. Theproblem of temporal aliasing has long been recognized and many anti-aliasing techniques have beendeveloped including supersampling and motion blur. Currently, supersampling is usually the onlyoption that the model author can implement, where he increases temporal resolution by interpolating

11/20/09 3:30 PMDesign Guidelines for Agent Based Model Visualization
Page 18 of 32http://jasss.soc.surrey.ac.uk/12/2/1.html
intermediate agent positions between two locations. A good rule of thumb is to move the object atmost 1/3 of its size between each frame (Ware 2002). This criterion does not apply if the object isvery small (such as 1 pixel wide) or very large. Motion blur probably requires accessing lower levelgraphics, which are usually inaccessible in a high level toolkit.
9.7Irregular frame rate is due to the changing computational load at each iteration. This unpredictablerate can confuse and frustrate the viewer. If the computational load fluctuates due to a changingnumber of agents, the model author can try to stabilize updates by intentionally slowing down themodel to the lowest possible frame rate.
9.8Ideally, agents should be bounded with physical restrictions (viscosity, inertia, etc ..) in such a waythat agents change their position or appearance in a smooth predictable manner. In the future, thesephysical restrictions and other artifacts such as the previously mentioned (temporal aliasing andregular frame rate) should be automatically handled by toolkits. New developments in hardware andsoftware will implement this functionality. For example in hardware, multi processors systems orGPUs (Graphical Processor Unit) can be solely dedicated to graphics and perform the necessarycomputations. Additionally in software, new animation frameworks are managing individual elementson a frame-by-frame basis. In these new frameworks, a smooth animation can be created byspecifying the start and end position -- the libraries calculate the intermediate locations for a smoothtransition.
9.9There are however many visualization aspects that cannot be automated, for example facilitating aparticular user such as tracking, estimation or segregation. Additionally, the model author shouldprevent visual interferences such as those discussed in the next section.
Cognitive Science Visualization Principles
10.1Cognitive Science has elucidated many principles of effective, as well as misleading, visualizations.Here we focus on two cognitive phenomena the user should be concerned with when creating anABM visualization: pre-attentive visual processing and visual interference. Creating visualizationsthat can be pre-attentively processed and are free of visual interference enables a viewer to performfast, automatic and spatially parallel operations to understand the visualization. Pre-attentiveoperations can detect visual features such as intensity, hue, and orientation and assist in tasks such asboundary detection and high-speed target tracking (Healey 1995; 1996). However, pre-attentiveoperations can be impeded by visual interference. For example, visual interference can occur when achosen visual variable conflicts with another visual variable. Another example of visual interferenceoccurs when a selected visual variable is so dominant that it makes the other visual variablesimperceptible.
Pre-attentive Visual Processing
10.2Pre-attentive visual processing enables the fast and scalable perception of the features of avisualization. It allows the viewer to process animations containing a large number of graphicelements, as is often the case in ABM animations. Pre-attentive visual tasks can usually beaccomplished in less than a quarter of a second (Ware 2004), independent of the number of graphicelements involved, which allows the viewer to process high-speed, information-rich ABM animations.
10.3In order to construct an ABM visualization that can be processed pre-attentively, the modeler mustpinpoint the visual tasks him requires from the viewers. By doing so, the modeler can select theoptimal visual features to accomplish the task and construct a visualization that allows the viewer to

11/20/09 3:30 PMDesign Guidelines for Agent Based Model Visualization
Page 19 of 32http://jasss.soc.surrey.ac.uk/12/2/1.html
accomplish the task pre-attentively. For example, the visualization's author can select color or size toperform pre-attentive visual tasks, shown in Figure 11, such as target detection, boundary detection,region tracking, counting and estimation (Healey 2006).
10.4Pinpointing the task depends on the phenomena the modeler wishes the viewer to focus on. Thesephenomena can be either macro- or micro-behaviors of the model. Perceiving macro-behaviorinvolves tasks such as boundary detection or region tracking. Both of these tasks assist the viewer indiscerning and tracking clusters of agents. Macro-behavior perception can be supported by othervisual tasks as well, such as estimation, which facilitates the approximation of the quantity of agentssharing a visual feature (independent of their position and quantity).
10.5Perceiving micro-behavior involves tasks such as target detection, where the user must focus on thebehavior of a single agent amongst all the agents. Tracking a single agent can be quite a challenge ina flock of agents where the user is distracted by the movement and direction changes of other agents.
Disease Solo Model
Target detection task
Segregation Model
Boundary detection task
Radioactive Decay Model
Estimation and counting
Figure 11. Examples of target detection, boundary detection, and counting & estimation tasks inNetLogo Models. The Disease Solo Model (Wilensky 2005) is at
http://ccl.northwestern.edu/netlogo/models/DiseaseSolo. The Segregation Model (Wilensky 1998g) isat http://ccl.northwestern.edu/netlogo/models/Segregation. The Radioactive Decay Model (Wilensky
1998h) is at http://ccl.northwestern.edu/netlogo/models/Decay10.6
Pre-attentive perception demands different design priorities in dynamic animations than in staticimages. For example, in static images, feature comparison takes place in space, thus spatial resolutionplays an important role. However in dynamic animations feature comparison takes place in time.Thus, the temporal resolution is more important than the spatial resolution, since the changes in timeare crucial to studying behavior. So high spatial resolution, which is helpful in static images in orderto provide a large information density, should usually be avoided in dynamic visualizations in order tofacilitate a rapid cognition for each frame of the animation.
10.7Once the modeler has pinpointed the task necessary to highlight a specific phenomenon, he can beginby ensuring there is no visual interference confusing the user. If visual interference exists, he shouldchange or remove the visual variables causing the visual interference. In the next section we willdiscuss some examples of visual interference in ABM visualizations.
Visual interference
10.8Visual interference, as described by Callaghan (1989), takes place when a pre-attentive task is

11/20/09 3:30 PMDesign Guidelines for Agent Based Model Visualization
Page 20 of 32http://jasss.soc.surrey.ac.uk/12/2/1.html
hindered by the concurrent use of interfering visual features. For example, estimation is hampered inhue-luminance interference, since luminosity is prioritized over hue by the low-level visualprocessing system (see Figure 12-a and 12b).
10.9This particular interference is caused by a "feature hierarchy that appears to exist in the visual system"(Healey 2006). Other interferences emanating from the feature hierarchy are: color-over-shape, hue-on-form and hue-on-texture. Examples of each of these types of interference can be observed inChristopher's Healey's comprehensive review (http://www.csc.ncsu.edu/faculty/healey/PP/index.html).Additionally, these three interferences can be observed in Figure 12-c and 12-d,
Simple Kinetics Model
a) Bright white atoms interfering with the hueestimation
Simple Kinetics Model
b) This is a redesign of Figure 12-a. Darker grayatoms in order to avoid the luminance-on-hueinterference
Ethnocentrism Model
c) In this model it is very hard to group theagents by shape or color due to color-over-shape
and hue-on-form interference.
Ethnocentrism Model
d) This is a redesign of Figure 12-c. Verydistinct shapes with the relatively equal “ink
area” were chosen to make it easier todiscriminate by shape or color.
Figure 12. In the ABM visualizations a) and b), the key visual feature to distinguish is hue, whichallows the viewer to estimate the number of red and green molecules. However, on the left, the brightwhite atoms interfere with the hue estimation. Changing the bright white atoms to darker gray atoms

11/20/09 3:30 PMDesign Guidelines for Agent Based Model Visualization
Page 21 of 32http://jasss.soc.surrey.ac.uk/12/2/1.html
remedies the luminance-on-hue interference. Note that this interference is mostly perceived on aCRT or LCD display, which renders white with luminosity, as opposed to print where white appearsas a lack of pigmentation. The Simple Kinetics 1 (Wilensky 1998i) Model is athttp://ccl.northwestern.edu/netlogo/models/SimpleKinetics1. In the Figures 12-c and 12-d there areseveral key features to distinguish, mainly shape and color. This model contains four shapes: squares,hollow squares, circles, and hollow circles. They were replaced by crosses, dots, horizontal lines, andvertical lines. It was originally unfeasible to group the squares (filled square and hollow squares) dueto the difference of luminosity between the hollow and filled shapes. The creation of textures allowsthe viewer to distinguish color and shape independently. However, this redesign still suffers fromother interferences such as hue on texture. This redesign does not solve all the issues of this model,however it is an improvement. The NetLogo Ethnocentrism model (Wilensky 2006) is athttp://ccl.northwestern.edu/papers/ABMVisualizationGuidelines/EthnocentrismUserStudy/.
10.10Visual interference can occur in agent-based models when the agent's variables are mapped to visualfeatures without considering whether they interfere or not. By being aware of well-known visualinterference patterns, the modeler can determine when interference is occurring and prevent it. Theperception of the main variables in agent-based visualization should not be hampered when displayingsecondary variables. Whenever possible, the modeler should display the model's variables of interestin accordance with their perceptual salience. The perceptual salience of a visual feature depends onthe task, but for many tasks the most salient visual features tend to be luminance and hue, followed bysize, length orientation and shape (Healey 2006).
Design Objectives
11.1Design principles are not sufficient to improve a visualization, certain objectives need to beestablished in order to guide, when and how, design principles enhance the visualization. In thissection we present the intent for applying the previously stated principles: to simplify, to emphasizeand to explain.
11.2Design criteria have been studied at length by many visualization researchers such as Tufte. However,the criterion for improving a visualization changes depending upon the type of visualization and thetask at hand. Unlike mainstream visualizations, ABM representations display a behavior mostly drivenby rules rather than data. Thus, dynamic ABM visualizations need to fulfill different requirementsthan usual static descriptive depictions.
11.3In static visualizations, where the viewer has the option of carefully studying the motionless image,high data density is recommended to provide as much information as possible. However, within anABM animation, a low data density is recommended to allow the viewer to follow changes in thevisualization. ABM animations ought to be simple and emphasize their key variables to facilitate pre-attentive processing in spite of containing a multitude of changing graphical elements.
11.4Another difference is that ABM visualizations are often unique and therefore they cannot beunderstood as easily as common, conventional visualizations such as histograms or pie charts. MostABM visualizations are custom designed to depict a particular phenomenon, and consequently, theyare not intuitively understood. Many ABM visualizations share common graphical elements, but theseelements can represent different objects or properties. For example, a circular agent may represent aparticle in one visualization or a node in a network in another visualization. These visualizations thatlack convention can only be understood if the author designs visual explanations that make explicitthe point of the model.
Design Approach

11/20/09 3:30 PMDesign Guidelines for Agent Based Model Visualization
Page 22 of 32http://jasss.soc.surrey.ac.uk/12/2/1.html
11.5Below, we describe several steps for incorporating some of the design principles mentionedpreviously: simplify, emphasize and explain. These steps are intrinsically generic due to the open-ended nature of ABM visualizations. However, we believe this approach can offer some structure foriteratively redesigning an ABM visualization. Note that, depending on the type of visualization themodeler can find more rigorous frameworks that can also apply to their design. For example, (Jones1998) provides a detailed map-making approach in his textbook 'Geographical Information Systemsand Computer Cartography'. In the Figure 13 below we summarize an approach to redesigning anABM visualization
Figure 13. Generic design workflow of an ABM visualization. Initial implementation of the modelfollowed by an iterative redesign composed by 3 steps Simplify, Emphasize, and Explain.

11/20/09 3:30 PMDesign Guidelines for Agent Based Model Visualization
Page 23 of 32http://jasss.soc.surrey.ac.uk/12/2/1.html
Simplify
11.6Simplifying ABM visualization enables the user to concentrate on the model's main behaviors withoutunnecessary distractions. One of the first enhancements to an ABM visualization is to remove clutteror in Tufte's words "Chart Junk" (Tufte, 1983). Clutter in ABM is usually caused by dispensablegraphic elements created for testing and debugging purposes during the model's conception. Avisualization displaying many variables needed to debug a model may not be optimal for viewing themodel's important behaviors. The viewer can be overwhelmed and confused by the visual variablesuseful to the model's author, but devoid of meaning for the intended audience.
11.7This tends to happen especially in development environments where graphical elements can be addedeasily. Thus, the modeler would benefit by uncluttering his / her visualization before he presents it toother users. Removing construction and debugging graphical elements enables the observer to easilyperceive a certain behavior or pattern.
11.8When there are a large number of simultaneous behaviors and graphical elements to observe, theviewer should have the option to hide graphical elements until they reach a set of cognitivelymanageable features. For instance, in GIS environments, this is accomplished through the use oflayers. Users can turn layers off and on in order to allow a GIS user to show and hide information in amap as they examine the data.
11.9Another similar way to simplify a visualization is to divide it into two or more visualizations, whereeach one renders different model variables, such as the Rumor Mill model below in Figure 14.
Rumor Mill Model “normalview”
Blue indicates where the rumorhas spread.
Rumor Mill “when heard view”
Yellow indicates when therumor was heard. A brightervalue stand for where the rumorwas first heard. A darker valuestands for where the rumor washeard recently.
Rumor Mill “times heard view”
Green indicates how manytimes it was heard. The moresaturated the green means thatthe rumor was heard moretimes.
Figure 14. Several views of the Rumor Mill Model: This model shows how a rumor spreads. Therumor spreads when a person (represented by a patch) tells a rumor to a neighbor (represented by anadjacent patch). At each time step, every person who knows the rumor randomly chooses a neighbor
to tell the rumor to diffuse. You can view the Rumor Mill Model (Wilensky 1998c) athttp://ccl.northwestern.edu/netlogo/models/RumorMill.
Emphasize

11/20/09 3:30 PMDesign Guidelines for Agent Based Model Visualization
Page 24 of 32http://jasss.soc.surrey.ac.uk/12/2/1.html
11.10In animations the user must instantly perceive how the system behaves frame by frame. Thisperception can only be achieved using pre-attentive processing. For instance, the user does not havetime to think about selecting a target, he ought to be able to select and follow a target using his lowlevel cognitive abilities. One technique used to support pre-attentive processing is to represent amodel variable using several redundant visual variables.
11.11For example, as shown in Figure 15, the association of the orientation of agents in the left-handimage can be enhanced by mapping the orientation of the agent to a hue as shown in the centerimage. The perception of orientation can further be emphasized by use of elongated shapes, asillustrated in the right image.
Flocking Model “normal view”
No emphasis on alignment. Inthis image turtles are randomlyassigned a shade of yellow.
Flocking model with redundantvariable
Added emphasis on alignmentby using hue: Turtles with thesame direction have the samecolor. Clusters with the sameheading can be easilydistinguished.
Flocking model with redundantvariable and emphasis.
Most of the emphasis is onalignment using hue,orientation and shape. Notehow the heading is moreapparent with elongated shapes.Observe how the heading ofoverlapping agents is moreapparent.
Figure 15. Redundant visual features of the flock alignment. This redesigned flocking model is athttp://ccl.northwestern.edu/papers/ABMVisualizationGuidelines/FlockingRedesign/
11.12The use of several visual variables to represent a single model variable is a common technique.Redundant visual variables can increase the legibility and expressiveness of interactive maps forvisual data exploration (Andrienko, 1999). Thus, using redundant visual variables in agent basedmodels, should facilitate the cognition of information within ABM animation.
Explain
11.13ABM visualizations usually have only one viewing mode depicting the macro-behavior of the model.However, the audience should have the option of viewing the agents' micro-behaviors as well.Observing the micro-behavior can provide a more meaningful visualization by making the rulesdriving the model readily available to the audience. Usually, the micro-behavior is clearly understoodby the modeler since he went through the process of developing the model. He observed the rules fora single agent when he authored the model. However, this is not the case for a viewer who isobserving the model for the first time. Without knowledge of the micro-behavior that produces the

11/20/09 3:30 PMDesign Guidelines for Agent Based Model Visualization
Page 25 of 32http://jasss.soc.surrey.ac.uk/12/2/1.html
macro-behavior, first time users can be overwhelmed by the movement of many agents.11.14
Thus, the user should have the option of changing the visualization in order to observe specificbehaviors such as the behavior of a variable at either a system-wide or individual agent level. Asimple way to allow the viewer to observe the agents micro behavior, is to hide all agents except theones that will be used to illustrate the micro-behavior. In this manner, we can suppress unnecessarymoving graphical elements in the visualization that distract the viewer. This operation can be easy orquite difficult to implement depending upon the model's sophistication, the viewer's familiarity withthe model, and the language primitives of the modeling toolkit.
11.15Furthermore, the visualization of a single agent allows for the depiction/representation of patterns thatwould be impossible to follow with all the agents on screen. For example in Figure 16 on the right, theviewer can see the displacement of a single agent in time by asking the agent to leave a visible trail.However, it would be impossible to use this same technique with multiple agents, since the trailswould merge and become indistinguishable. This is distinct from modeling a single agent, all theagents are present in the model but only one agent, the spatially proximate agents and theirinteractions are visible.
Virus Model “normal view”
Virus model in a macro behavior view.
Virus Model “micro-behavior View”
Virus model in a micro behavior view. You canobserve the green trail of a healthy individual,which becomes sick when the trail changes tored. Additionally, you can see the individualwho transmitted the virus in a darker shade ofred linked by a line.
Figure 16. It is difficult to observe the micro-behavior in the left image, while in the right image,micro-behavior is explicitly shown: an agent is sick, becomes healthy, and has an offspring.
http://ccl.northwestern.edu/papers/ABMVisualizationGuidelines/VirusUserStudy .
Redesign Example
12.1The intent of this section is to convey, through a simple example, the thought process behind theredesign of an ABM visualization. This example will take advantage of the various concepts we havediscussed earlier in this paper and present them in a systematic, applied manner.
12.2The model below is implemented in NetLogo and replicates the conservation of electric currentpassing through two different materials. It was created as part of the NetLogo Investigations inElectromagnetism project (NIELS) (Sengupta 2006). NIELS develops ABM curricular units inphysics (electrostatics, electricity and magnetism) intended for high school, middle school and

11/20/09 3:30 PMDesign Guidelines for Agent Based Model Visualization
Page 26 of 32http://jasss.soc.surrey.ac.uk/12/2/1.html
undergraduate students. We will describe modifications performed during the redesign of this electricconduction model, which was conceived to provide a conceptual understanding of the resistancephenomenon.
12.3This redesign was carried out as part of our research for this paper. In a five-hour session the authorsof this paper provided feedback and suggestions to the model's first author. The modeler incorporatedsome of the proposed improvements and devised new enhancements of his own based on thefeedback. The redesign continued with minor consultations over a few weeks after the initial session.http://ccl.northwestern.edu/papers/ABMVisualizationGuidelines/SeriesCircuitUserStudy
12.4In the initial visualization below, electrons are represented by red rings filled with a black disk as seenin Figure 17. The electrons move horizontally from the right negative terminal to the left positiveterminal (blue and red backgrounds) over two different conducting materials (yellow and blackbackgrounds). Their movement does not perfectly follow a straight line; it incorporates a smallvibration representing a minor random component.
Figure 17. Initial visualization redesign of Series Circuit Model12.5
An unintended consequence of having electrons as black disks with red rings is that they aredistinguished using two different visual cognitive mechanisms. The first mechanism to identify anelectron is a change in value (intensity) of the dots. In this case electrons are perceived as black dots.The second mechanism to recognize the electrons is closure (Ware 2004); in this case the closedshape of the rings allows the model user to discern electrons. The electrons appear as red rings overthe black background. This dual perceptual mechanism for the same entity causes an unnecessarycognitive load for the viewer. This can be easily resolved by filling the electrons with a solid color,hence assigning them a fixed representation regardless of the changing background color. This can beseen below in Figure 8.
Figure 18. Foreground enhancement of Series Circuit Model12.6
Another issue is that the conductors represented by the yellow and black backgrounds display anexcessive contrast. Yellow is the hue with the highest intensity while black has the lowest intensity.However, the background should have a low contrast and low intensity in order to facilitate effortlessbackground/foreground segregation.
12.7Also, the electrons are too large, causing them to be perceived as regions that intersect rather thanindividual points. Representing the electrons as small bright points as seen in Figure 19 can facilitatethe counting and estimation task, since you do not have to process their intersections when theyoverlap.

11/20/09 3:30 PMDesign Guidelines for Agent Based Model Visualization
Page 27 of 32http://jasss.soc.surrey.ac.uk/12/2/1.html
Figure 19. Foreground enhancement of Series Circuit Model12.8
Changing the background conductor's color to similar shades of brown lowers the background'scontrast and intensity. Additionally, the reduced electron size allows the viewer to perceive them as adistribution of dots rather than overlapping circles. Independently, notice that electrons are againperceived as black rings on the far right red background. Thus, the dual representation we wanted toavoid initially, of the electrons as rings, is still taking place.
Figure 20. Foreground enhancement of Series Circuit Model12.9
We changed the electron's color to orange to avoid this dual representation in Figure 20. However,this change did not prove useful; the orange hue is still too close to red. Notice how visible electronsare over the blue background (blue and orange are complementary) while the single electron at thebottom of the red background is virtually invisible. Moreover, the wire's brown hue is distracting;while the brown hue has the necessary contrast and intensity properties, its color does not convey anymeaning and is unnecessary.
Figure 21. Final design of Series Circuit Model12.10
In this final visualization we simplified the design in Figure 21 by using two shades of gray for theconductors. The electrons have a dark red to distinguish them from the background. And we placedlabels over the terminals to make their charge explicit.
12.11Other changes were made to improve movement, however they can only be perceived in ananimation. For example the motion of the electrons was jerky due to temporal aliasing. Thediscontinuous motion of electrons through the wire was difficult to track visually since the electronsmoved with relatively large steps. In order to make the electrons easier to follow, the step thatelectrons took between frames was decreased to render the movement more smooth and continuous.(i.e. temporal anti-aliasing).
Conclusion
13.1

11/20/09 3:30 PMDesign Guidelines for Agent Based Model Visualization
Page 28 of 32http://jasss.soc.surrey.ac.uk/12/2/1.html
communicative and cognitively efficient ABM visualizations. We began by presenting a briefclassification of ABM visualizations categorizing them into conventional, structured and unstructuredvisualizations, which can be used as a basis for finding visualizations that are useful as a starting pointfor a new visualization. We continued by describing how established design frameworks such asvisual variables and Gestalt laws can be contextualized in ABM. Then, we discussed ABMvisualization design goals: to simplify, emphasize and explain. Finally, we presented an example toillustrate the process driving a redesign.
13.2These guidelines aim to reduce the cognitive load for the viewer by facilitating the perception andcognitive processing of key behaviors in an ABM. Tools and environments that facilitate the use ofcolor, shape and movement to represent a behavior in computational media have only becomeavailable in the last two decades. Although some of the guidelines presented in this paper are wellknown in the scientific visualization literature, they have not been applied to agent-based models orreached an ABM audience. In fact, design guidelines geared towards displaying information inconventional static representations such as plots, histograms, and other commonplace depictionsappear in a variety of educational contexts, but in general, dynamic visualization design withanimated graphics has not yet found its way into standard educational curricula.
13.3ABM visualizations have different requirements than traditional visualizations. While traditionalvisualization can convey data with static graphics ABM visualization needs to convey behaviorinstead of data using dynamic graphics. This behavior of an agent-based model must be rendered in aperceivable and recognizable manner. In the real world, images obey the laws of nature so thatvariations are usually discernible to the eye and understood by the mind due to their visuallycontinuous and predictable behavior. However, an ABM model is a computational abstraction, whichcan exhibit abrupt visual changes that can be hard or impossible to track or understand. To effectivelycommunicate, the author of an ABM model visualization should be capable of identifying inefficientgraphical representations and know how to redesign them. Thus, a model's author should be aware ofthe bounds of visual cognition and perception in order to locate these unperceivable or overwhelmingeffects. Then, he or she should strive to make these changes perceivable and understandable usingvisual design. This paper has laid out some design guidelines in order to equip authors to create betterABM visualizations.
13.4In future research we will examine more advanced and novel tools for ABM visualization. We plan toexpand the expressive range of visual variables, while taking into account the user's perceptual andcognitive capabilities. This will include features mentioned previously such as luminous transparency,textons, and spatial temporal anti-aliasing. We have already developed new dialogs and primitives toaid visual variable selection, such as the NetLogo palette extension enabling users to choose colorschemes that facilitate a meaningful mapping from value to color. We plan to develop shape andtexture selection assistants. We are currently testing these tools to find out if they help users improvetheir visualization design.
References
ANDRIENKO, G L (1999) Interactive maps for visual dataexploration, International Journal ofGeographical Information Science,vol. 13, issue 4, p 355.
ALBERS, J (1975) Interaction of Color. Yale University Press,New Haven, CT.
BERTIN, J (1967) Sémiologie graphique, Paris-DenHaag: Mouton.
BERTIN, J (1983) Semiology of Graphics, Translated by W. Berg, Universityof Wisconsin Press.

11/20/09 3:30 PMDesign Guidelines for Agent Based Model Visualization
Page 29 of 32http://jasss.soc.surrey.ac.uk/12/2/1.html
BRATH, R (1997) Metrics for effective information visualization,Proceedings of the 1997 IEEESymposium on Information Visualization (InfoVis'97), p.108, October 18-25.
BRATH, R M Peters and R Senior, (2005) Visualization forCommunication: The Importance ofAesthetic Sizzle, IEEE IV05.
BACH, M, Poloschek CM (2006) Optical Illusions. Adv Clin NeurosciRehab (ACNR) 6:20–21.
BACH, M (1997-2) 67 Optical Illusions & Visual Phenomena. Lastupdated 26-Nov-2006. RetrievedDecember 1, 2006, from Bach Micheal's web site: http://www.michaelbach.de/ot/index.html
CALLAGHAN, T. C. (1989) Interference and domination in texture segregation: Hue, geometricform, and line orientation. Percep. Psychophys. 46, 4, 299-311.
CARPENDALE, M S T (2003) Considering visual variables as a basisfor information visualization.Technical Report 2001-693-16, Departmentof Computer Science, University of Calgary, Calgary,Canada.
COBB T, (1997) Cognitive efficiency: Toward a revised theory ofmedia. Educational TechnologyResearch & Development, 45 (4), 21-35.
COLBY G, Scholl L, (1991) Transparency and blur as selective cuesfor complex visual information, SPIE Vol. 1460, Image Handling andReproduction Systems Integration, pages 114–125.
GOLDSTEIN, E B (1999) Sensation and Perception (5th Edition). Brooks/Cole Publishing.
HARROWER, M A & Brewer C A, (2003) ColorBrewer.org: An OnlineTool for Selecting ColorSchemes for Maps, The Cartographic Journal 40(1): 27-37.
HEALEY, C G, Booth K S, & Enns, J T (1995). VisualizingReal-Time Multivariate Data UsingPreattentive Processing ACM Transactionson Modeling and Computer Simulation 5, 3, 190-221.
HEALEY, C G, Booth K S, & Enns J T (1996) High-Speed VisualEstimation Using PreattentiveProcessing ACM Transactions on Human ComputerInteraction 3, 2, 107-135.
HEALEY, C G, St. Amant R, & Elhaddad M. (1999)"ViA: APerceptual Visualization Assistant." InProceedings 28th AppliedImagery Pattern Recognition Workshop, (Washington, D.C., pp. 1-11.
HEALEY, C G (2006) Perception in Visualization, Last updated17-Jan-2007. Retrieved December 1,2006, from Christopher Haley's web site: http://www.csc.ncsu.edu/faculty/healey/PP/index.html(comprehensive review updated regularly).
ITTEN, J (1970) The Elements of Color. Van Nostrand ReinholdCompany, New York, NY.
JONES, C (1998) Geographical Information Systems and ComputerCartography, Longman, Harlow,England.
JULESZ, B (1986) Texton gradients: The texton theory revisited, BiologicalCybernetics, vol. 54, pp.245-251
KLEIN, J (2002) Breve: a 3D simulation environment for thesimulation of decentralized systems andartificial life. Proceedings ofArtificial Life VIII, the 8th International Conference on the SimulationandSynthesis of Living Systems. The MIT Press.
KOSARA R, Miksch S, Hauser and H, (2001) Semantic Depth of Field, Proc.IEEE Symp. Information

11/20/09 3:30 PMDesign Guidelines for Agent Based Model Visualization
Page 30 of 32http://jasss.soc.surrey.ac.uk/12/2/1.html
Visualization (InfoVis2001), IEEE CS Press, LosAlamitos, Calif., pp. 97- 104.
KOREIN J, Badler N, (1983) Temporal anti-aliasing in computergenerated animation, Proceedings ofthe 10th annual conference on Computergraphics and interactive techniques, p.377-388, July 25-29,Detroit, Michigan, United States
LUKE, S, Catalin Balan G, Panait L, Cioffi-Revilla C, and Paus S (2003)MASON: A Java Multi-Agent Simulation Library, Proceedings of the Agent 2003Conference.
LOHSE, G L Biolsi, K. Walker, N. Rueter, H. H. (1994) " AClassification of VisualRepresentations", VOL 37; NUMBER 12, pages 36,ACM Communications.
MAEDA, J (1999) Design by Numbers, The MIT Press.
MINAR N, R Burkhart, C Langton, and M AskenazI (1996) The Swarmsimulation system: a toolkitfor building multi-agent simulations. WorkingPaper 96-06-042, Santa Fe Institute, Santa Fe.
NESBITT, K V, Friedrich C. (2002) Applying Gestalt Principles toAnimated Visualizations ofNetwork Data. Proc. IV 2002, IEEE ComputerSociety Press, London, UK, 10-12 July.
NORTH, M J , N T Collier, and J.R. Vos, (January 2006)"Experiences Creating ThreeImplementations of the Repast Agent ModelingToolkit," ACM Transactions on Modeling andComputer Simulation,Vol. 16, Issue 1, pp. 1-25, ACM, New York, New York, USA.
MACEACHREN, A (1995) How Maps Work, The Guilford Press.
NORMAN, D A (2004). Emotional design: why we love (or hate)everyday things. New York: BasicBooks.
PIPES, A (2004) Foundations of Art and Design, Laurence KingPublishing.
RESNICK, M (1994) Turtles, Termites, and Traffic Jams, MITPress, Cambridge.
REYNOLDS, W C (July 1987) Flocks, herds and schools: A distributedbehavioral model, Volume21, Issue 4, Pages: 25–34, Year of Publication:1987.
RUCKERS, R (1993) Artificial Life Lab, Waite Group Press.
SCHELLING, T. (1978). Micromotives and Macrobehavior. New York:Norton.
TISUE, S. & WILENSKY U. (2004). NetLogo: Design andimplementation of a multi-agent modelingenvironment, Proceedings of Agent2004.
TUKEY, J (1977) Exploratory Data Analysis, Addison-Wesley.
TUFTE, E (1983) The Visual Display of Quantitative Information, GraphicsPress.
TUFTE, E (1996). Visual Explanation, Graphic Press,Cheschire, Conn.
TUFTE, E (2006). Beautiful evidence, Graphic Press,Cheshire, Conn.
WARE, C (2004). Information Visualization, 2nd Ed., MorganKaufmann.
WARE, C, (2002). Purchase H, Colpoys L and McGill M, Cognitivemeasurements of graphaesthetics, Information Visualization.

11/20/09 3:30 PMDesign Guidelines for Agent Based Model Visualization
Page 31 of 32http://jasss.soc.surrey.ac.uk/12/2/1.html
WERTHEIMER, M (1923). Untersuchungen zur Lehre von der Gestalt, II(Laws of organization inperceptual forms). PsycholocheForschung, 4, 301-350. Excerpts translated and reprinted in W. D.Ellis(Ed.), A source book of Gestaltpsychology (pp. 71-88). New York: Harcourt, Brace and Co., 1939.
WILENSKY, U (2001) Modeling Nature's Emergent Patterns withAgent-Based Languages,Proceedings of Eurologo 2001.
WILENSKY, U. and Reisman, K. (2006). Thinking like a wolf, a sheepor a firefly: Learning biologythrough constructing and testing computationaltheories. Cognition & Instruction, 24(2), 171-209.
Models and Computer Software
ABRAHAMSON, D andWILENSKY, U (2004).NetLogo ProbLab Genetics model. http://ccl.northwestern.edu/netlogo/models/ProbLabGenetics. Center for Connected Learning andComputer-Based Modeling,Northwestern University, Evanston, IL.
AN, G (2004). Innate Immune Response Department of Trauma, CookCounty Hospital. http://ccl.northwestern.edu/netlogo/models/community/InnateImmune Response
KORNHAUSER, D (2007). NetLogo Palette Extensionhttp://ccl.northwestern.edu/papers/ABMVisualizationGuidelines/palette/.Center for ConnectedLearning and Computer-BasedModeling, Northwestern University, Evanston, IL.
SENGUPTA, P & Wilensky, U (2007). NetLogo Series Circuitmodel. http://ccl.northwestern.edu/netlogo/models/SeriesCircuit.Center for Connected Learning andComputer-Based Modeling, NorthwesternUniversity, Evanston, IL.
WILENSKY, U (1999a). NetLogo. http://ccl.northwestern.edu/netlogo. Center for Connected Learning and Computer-BasedModeling.Northwestern University, Evanston, IL.
WILENSKY, U (1999b). NetLogo Models Library.http://ccl.northwestern.edu/netlogo/models/.Northwestern University, Evanston, IL.
WILENSKY, U (2005). NetLogo Disease Solo model. http://ccl.northwestern.edu/netlogo/models/DiseaseSolo.Center for Connected Learning andComputer-Based Modeling, NorthwesternUniversity, Evanston, IL.
WILENSKY, U (2004a). NetLogo DLA model. http://ccl.northwestern.edu/netlogo/models/DLA. Center for Connected Learning and Computer-BasedModeling,Northwestern University, Evanston, IL.
WILENSKY, U (2006). NetLogo Ethnocentrism model. http://ccl.northwestern.edu/netlogo/models/Ethnocentrism.Center for Connected Learning and Computer-Based Modeling, NorthwesternUniversity, Evanston,IL.
WILENSKY, U (2004b). NetLogo Heatbugs model. http://ccl.northwestern.edu/netlogo/models/Heatbugs.Center for Connected Learning and Computer-Based Modeling,Northwestern University, Evanston, IL.
WILENSKY, U (1998a). NetLogo Virus model. http://ccl.northwestern.edu/netlogo/models/Virus. Center for Connected Learning and Computer-

11/20/09 3:30 PMDesign Guidelines for Agent Based Model Visualization
Page 32 of 32http://jasss.soc.surrey.ac.uk/12/2/1.html
Based Modeling,Northwestern University, Evanston, IL.
WILENSKY, U (1998b). NetLogo Heat Diffusion model. http://ccl.northwestern.edu/netlogo/models/HeatDiffusion.Center for Connected Learning andComputer-Based Modeling, NorthwesternUniversity, Evanston, IL.
WILENSKY, U (1998c). NetLogo Rumor Mill model. http://ccl.northwestern.edu/netlogo/models/RumorMill.Center for Connected Learning and Computer-Based Modeling, NorthwesternUniversity, Evanston, IL.
WILENSKY, U (1998d). NetLogo Voting model. http://ccl.northwestern.edu/netlogo/models/Voting.Center for Connected Learning and Computer-Based Modeling, NorthwesternUniversity, Evanston, IL.
WILENSKY, U (1998e). NetLogo Termites model. http://ccl.northwestern.edu/netlogo/models/Termites.Center for Connected Learning and Computer-Based Modeling, NorthwesternUniversity, Evanston, IL.
WILENSKY, U (1998f). NetLogo Flocking model. http://ccl.northwestern.edu/netlogo/models/Flocking.Center for Connected Learning and Computer-Based Modeling, NorthwesternUniversity, Evanston, IL.
WILENSKY, U (1998g). NetLogo Segregation model. http://ccl.northwestern.edu/netlogo/models/Segregation.Center for Connected Learning and Computer-Based Modeling, NorthwesternUniversity, Evanston, IL.
WILENSKY, U (1998h). NetLogo Decay model. http://ccl.northwestern.edu/netlogo/models/Decay.Center for Connected Learning and Computer-Based Modeling, NorthwesternUniversity, Evanston, IL.
WILENSKY, U (1998i). NetLogo Simple Kinetics 1 model. http://ccl.northwestern.edu/netlogo/models/SimpleKinetics1.Center for Connected Learning andComputer-Based Modeling, NorthwesternUniversity, Evanston, IL.
Return to Contents of this issue
© Copyright Journal of Artificial Societies and Social Simulation, [2009]