design of a text detection system via hypothesis
TRANSCRIPT

Design of a Text Detection System viaHypothesis Generation and Verification
Sam S. Tsai∗, Vasu Parameswaran†, Jerome Berclaz†,Ramakrishna Vedantham†, Radek Grzeszczuk†, Bernd Girod∗
∗Department of Electrical Engineering, Stanford Univeristy, Stanford, CA†Nokia Research Center, Nokia, Sunnyvale, CA ??
Abstract. Text-detection is a well-established topic within the docu-ment recognition domain, but detecting text in natural scenes has provedto be considerably harder due to the large variability of text appearances,and due to dominating clutter. In this paper, we begin with a practicalmodel for text appearance and use it to motivate the design of a textdetection system consisting of two stages: a hypothesis generation stageand a hypothesis verification stage. For hypothesis generation, we adaptthe Maximally Stable Extremal Regions (MSER) algorithm for the taskof text detection by a combination of judicious parameter selection and acomputationally efficient multi-scale analysis of MSER regions. For hy-pothesis verification, we design simple and fast image operations thatproduce features highly discriminative of text, which require minimaltraining, whose performance bounds can be specified, and which can betuned in terms of intuitively understandable properties of text such asfont, stroke-width, spacing, etc. Our final contribution is a new datasetof images of urban scenes annotated for text. The annotations includenot only bounding boxes but also a richer set of text attributes. Thereare about 6000 text items in the dataset making it to our knowledge,the largest, most challenging, and most detailed text dataset for urbanscenes1. We show improved performance than state-of-the-art on thewell-known ICDAR datasets and results on our new dataset.
1 Introduction
While text detection is a mature topic within the document analysis domain,detecting text in unconstrained outdoor scenes is much more challenging dueto two main difficulties. Firstly, the visual appearance of text is highly variabledue to different possible fonts, styles, backgrounds, viewpoints, and camera pa-rameters (geometric as well as radiometric). These infuencing parameters aretypically unknown. Secondly, the text footprint is typically a small fraction ofthe image (often a few hundred pixels in an image of several megapixels). Hencethe text detector needs to be especially robust to clutter. Text detection in un-constrained scenes has many applications including navigational assistance forthe visually impaired, visual text translation, image indexing, digital map cre-ation, etc. For these applications to be practical, the text detector needs to benot only accurate but also very fast.
?? These authors are currently with Microsoft Corporation.1 http://msw3.stanford.edu/∼sstsai/SanFranciscoText

2 S. S. Tsai et al.
In this paper, we make four novel contributions. First, we propose a modelfor text appearance in an image, and from it, motivate the design of a two-stage text detection system consisting of a hypothesis generation stage and ahypothesis verification stage. Our second contribution is a novel adaptation ofthe Maximally Stable Extremal Regions (MSER) algorithm [1]. We show howMSER parameters can be tuned in a principled way to best detect individualcharacters in a manner robust to image noise and contrast. Image blur is afrequent problem when using MSER to detect characters, causing them to getmerged with each other or with the background. We tackle this problem by tun-ing MSER to return overlapping level sets in its output per real region, therebybetter preserving the integrity of individual characters. We minimize the com-putational cost required to analyze the larger number of regions by performinga multi-scale histogram filtering of the MSER outputs. Our third contribution isthe direct exploitation of our proposed model for the design of simple and fastfilters that are highly discriminative of text at the word level, forming the texthypothesis verification stage. A key novelty in this paper is our demonstrationthat two well-motivated features are able to achieve a performance better thanstate-of-the-art using a simple Gaussian model, obviating the need for a largenumber of features or more sophisticated classifiers. Our fourth contribution isa new ground-truthed dataset of images containing text.Prior Work: There have been two main approaches for text detection in naturalscenes: Classifier based approaches apply a text-classifier to windows of differ-ent sizes and positions in the image. For example, Zhong et al. [2] detect textcaptions in video by exploiting the spatial periodicity of text. Ye et al. [3] applywavelet filtering and Support Vector Machines (SVM) to classify text. Chen et al.[4, 5] design weak classifiers based on spatial gradient distributions, intensities,and edge-linking and use Adaboost to create a strong text classifier. Zhang etal. [6] extract feature from intensity and perform chinese character classificationfrom the image. Classifier based approaches are helpful if high recall performanceis desired, but a lot of training data is typically needed, and precision is oftenlower. Connected-component (CC) based approaches detect potential characters,link them together, and apply constraints to eliminate non-text regions. The topscoring entry reported in [7] uses adaptive binarization to detect CCs and groupsthem via geometric constraints. Epshtein et al. [8] detect text via an interme-diate ‘stroke-width-transform’ image and connecting components with similarstroke-width. Shivakumara et al. [9] extract CCs via Fourier-Laplace filteringand K-means clustering and detect text lines via different constraints. Neumanet al. [10] use MSER and SVMs to detect characters based on features such asaspect ratio, number of holes, etc. and grouping them considering multiple wordhypothesis. Chen et al. [11] use MSER and edge pruning for character detection,followed by character linking and text line formation to detect text. Other CCbased methods include [12] and [13].
2 Motivating the Design Choices
Text Model: Searching for text in an image requires a model, either implicitlyor explicitly. But it is difficult to define a model that captures all the variability

Text Detection via Hypothesis Generation and Verification 3
Fig. 1. Left: Bayesian Network for Text Appearance in an Image (best viewed in color),Right: System Design
of text such as fonts, styles, viewpoints, contrasts, etc. Nevertheless text in thereal 3D world satisfies the following properties which could form the basis for atext detector:
1. For a given font, various text geometric attributes such as the stroke width,character height, and character spacing are fairly constant across the text.
2. Readability constrains stroke-width and spacing, given the text height.
3. The bounding box around the text is bimodal in intensity assuming sometype of background.
We capture the main variables governing the generation process of 3D text andits 2D appearance in an image, via a Bayesian Network (BN) shown in Figure 1.Our use of the BN is to mainly identify the influencing hidden variables and notfor recovering all of them, per se. Doing so allows us to make informed designchoices for robustness to influencing variables where possible, and to make theassumptions and limitations of the system explicit, where it is not possible. Weassume the following: (1) Out-of-plane rotations are negligible, (2) The minimumtext/background contrast requirement is specified, and (3) The intensity noisedistribution is specified (this could be specified or computed using methods suchas [14]).
Referring to the BN in Figure 1, characters can be modeled as strokes gener-ated by moving a ‘pen’ of given thickness (i.e. stroke width) along the charactersskeleton. Let H be the height of a character, L = λH its 1D curved length (i.e.the ‘stroke-length’), B = βH the bounding-width of a character, S = ψH thestroke-width, D = δH the inter-character spacing, and m the number of charac-ters in a word. Note that the quantities (λ, β, ψ, δ) are random variables denotingrespectively the character length, width, stroke width, and inter-character spac-ing relative to the text height. Given a choice of alphabet (e.g. English, Chineseetc.), style (i.e. bold, italic, regular), and font (e.g. Arial, etc.), the choice mapsto probability distributions for λ, β, ψ, and δ. One chooses the number of char-acters, m, and draws m instances from the four distributions to create a set

4 S. S. Tsai et al.
of characters for the word2. Choices for text height, and colors for backgroundand text generate the word in the 3D world. Choices for viewpoint, camera, andillumination, finally determine text appearance in the image.System Design: We expect that the text properties outlined above will man-ifest themselves as correlations between the random variables (λ, β, ψ, δ). Ac-cordingly, our design includes a Text Hypothesis Verification module that ex-ploits such correlations. In section 4, we derive simple and fast image operationsthat correspond directly to statistcal tests encoding such correlations, remark-ably, without needing to estimate all the random variables. Complementing thismodule, we design a Text Hypothesis Generation module that detects charac-ters. Practically, any segmentation method can be used to detect characters. Innatural scene images, views of text may be from different viewpoints and angles.Illumination along the text line may change, and the focus may not be exactlyon the text, causing blur. The dataset we introduce includes panoramic snap-shots taken periodically along a drive through San Francisco. The cameras aretuned to picture the whole scene, and so some text may not get adequate expo-sure and contain more noise. The blur and noise in these images is sometimesworse than in images from a camera phone. We note that MSER is known forrobustness to different viewpoints, illuminations, and contrasts, addressing someof the remaining influencing variables in the BN. Text characters typically havea low-gradient interior and a high gradient boundary and so correspond wellto stable regions Accordingly, we base the text hypothesis generation moduleon MSER. In contrast to past methods (e.g. [11][10]), our novelty is that weavoid using MSER as a black-box. Given our task of character detection andthe imaging characteristics, we (1) tune MSER parameters to optimally detectcharacters given user-specified minimum contrast requirements and the imagenoise distribution, and (2) adapt it for robustness to image blur. The module isdescribed in detail in Section 3). Note that MSER is a region detector and isagnostic to text geometric attributes.
In summary, the design includes two complementary modules for text hypoth-esis generation and verification, which, together with our assumptions, ensurethat all the influencing variables in the BN are addressed.
3 Text Hypothesis Generation
3.1 Character Candidate Generation using MSER
MSER [1] is a region detector that finds stable regions in an image. Thresholdingthe image with a given threshold Ith produces regions having intensity belowIth. When the relative change in area of a given region is small when Ith ischanged, the region is considered stable. A popular implementation of MSER [15]is configurable with three main parameters: Delta which controls the step-size forMSER thresholding, maxVariation which is a threshold on the maximum allowedarea change, and minDiversity which controls the merging of overlapping MSERregions. The same values for Delta and maxVariation can produce very differentregions under differing contrasts and image noise. In low contrast, a large Delta
2 In this work we do not incorporate a language model.
Text Detection via Hypothesis Generation and Verification 5
0
0.5
1
1.5
2
0
5
10
15
20
0
0.5
1
1.5
2
x 105
maxVariation
Delta
Err
on
eo
us P
ixe
ls
0
0.5
1
1.5
0
10
20
30
40
0
0.5
1
1.5
2
x 105
maxVariation
Delta
Err
on
eo
us P
ixe
ls
0
0.5
1
1.5
2
0
5
10
15
20
0.5
1
1.5
2
2.5
3
x 105
maxVariation
Delta
Err
on
eo
us P
ixe
ls
0
0.5
1
1.5
0
10
20
30
40
0
0.5
1
1.5
2
2.5
3
x 105
maxVariation
Delta
Err
on
eo
us P
ixe
ls
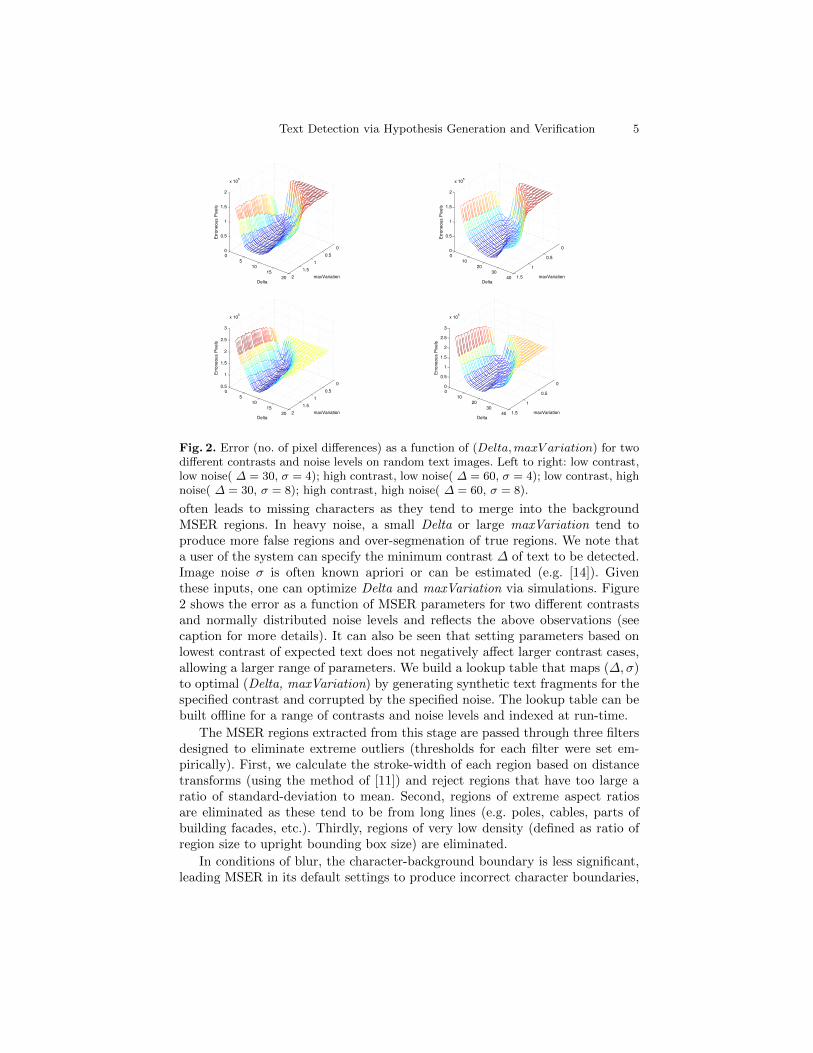
Fig. 2. Error (no. of pixel differences) as a function of (Delta,maxV ariation) for twodifferent contrasts and noise levels on random text images. Left to right: low contrast,low noise( ∆ = 30, σ = 4); high contrast, low noise( ∆ = 60, σ = 4); low contrast, highnoise( ∆ = 30, σ = 8); high contrast, high noise( ∆ = 60, σ = 8).
often leads to missing characters as they tend to merge into the backgroundMSER regions. In heavy noise, a small Delta or large maxVariation tend toproduce more false regions and over-segmenation of true regions. We note thata user of the system can specify the minimum contrast ∆ of text to be detected.Image noise σ is often known apriori or can be estimated (e.g. [14]). Giventhese inputs, one can optimize Delta and maxVariation via simulations. Figure2 shows the error as a function of MSER parameters for two different contrastsand normally distributed noise levels and reflects the above observations (seecaption for more details). It can also be seen that setting parameters based onlowest contrast of expected text does not negatively affect larger contrast cases,allowing a larger range of parameters. We build a lookup table that maps (∆,σ)to optimal (Delta, maxVariation) by generating synthetic text fragments for thespecified contrast and corrupted by the specified noise. The lookup table can bebuilt offline for a range of contrasts and noise levels and indexed at run-time.
The MSER regions extracted from this stage are passed through three filtersdesigned to eliminate extreme outliers (thresholds for each filter were set em-pirically). First, we calculate the stroke-width of each region based on distancetransforms (using the method of [11]) and reject regions that have too large aratio of standard-deviation to mean. Second, regions of extreme aspect ratiosare eliminated as these tend to be from long lines (e.g. poles, cables, parts ofbuilding facades, etc.). Thirdly, regions of very low density (defined as ratio ofregion size to upright bounding box size) are eliminated.
In conditions of blur, the character-background boundary is less significant,leading MSER in its default settings to produce incorrect character boundaries,

6 S. S. Tsai et al.
top
middle
bottom
Fig. 3. Left to right: Input, Typical MSER regions using settings of [15] (several char-acters are missed), Our MSER regions.
and worse, merging of adjacent characters. The MSER parameter minDiversitywhich controls merging of overlapping regions, can be set to a low value (set to0.1 in our experiments), such that several ‘layered’ MSER regions are returnedper real region, often including the correct character boundary in one of them.The additional computational cost required is minimized by a spatial histogramanalysis of the MSER layers. From here on, we refer to the MSER regions ascharacter candidates. The character candidate selection process is shown in Al-gorithm 1 and described below.
3.2 Character Candidate Selection
Input: Natural scene image Im, Lower/Upper scale ranges(Li, Ui), i = 1..N
Output: Character candidates {CC}, Pairwise Links {l}M ← sort by size(extractMSER(Im));for i← 1 to N do
Gi ← {m|m ∈M,Li ≤ size(m) < Ui};Mi ← {m|m ∈ Gi, pixels(m) 6⊂ pixels(mc),∀mc ∈ Gi,6 ∃m1,m2 ∈ Gi, pixels(m1) ⊂ pixels(mc),pixels(m2) ⊂ pixels(mc), pixels(m1)
⋂pixels(m2) = ∅};
Hi ← GenerateHistogram( Mi);CCi, li ← PairwiseConnect( Hi, Mi);
endAlgorithm 1: Character candidate selection (high level view).
We process groups of character candidates determined based on their sizes (hencethe call to sort by size). We configure MSER via a low minDiversity value,thus forcing it to return multiple regions (level-sets) per real region. The algo-rithm systematically considers each such region as it relates to other regions.The groups are divided from small to large, with logarithmic step changes andoverlapping sizes.
For each group Gi, we retain character candidates that are largest and con-tain at most one smaller region. Character candidates that contain more thantwo other character candidates are ignored as these will be considered in thehigher scales (this step corresponds to calculation of Mi in the algorithm). Fig-ure 4 (a) shows examples of 3 sets of the character candidates of different sizesand locations generated from the image in Figure 3.

Text Detection via Hypothesis Generation and Verification 7
(a) (b) (c) (d)
Fig. 4. (Best viewed in color) Intermediate results of three different locations shownin Fig. 3. (a), detected MSER regions at three different scales. (b), the histogram atdifferent scales. (c), the sum of adjacent histogram bins and the valid bins are withinthe green box. (d) The character candidates and links for the three locations.
We generate a spatial histogram of these character candidates, which simplygives the number of character candidates in each spatial location, as shown inFigure 4 (b). The bin size is set based on a user-specified minimum charactersize expected in the image (set to 20 in our experiments). Our use of the spatialhistogram is to impose a constraint on the minimum number of characters in aword (currently set to 3). Specifically, for each bin in the histogram, we countthe sum of the number of character candidates in the bin and horizontally adja-cent bins. If the sum of the character candidates does not exceed the minimumthreshold, we discard the character candidates in the current bin. Spatial binssatisfying the threshold are shown in Figure 4 (c).
The last line in the for loop forms pair-wise connections between candidates.We look at the remaining character candidates of the same bin and horizontallyadjacent bins, and link them together if they overlap vertically. Shown in Figure4 (d) are pairs of character candidates that are linked. These linked charactercandidates form connected sets of character candidates used for generating textline hypotheses.
3.3 Hypothesizing Text Lines
To verify whether character candidates are valid, we check if they can be con-structed as characters of a text line. We assume that text lines are straight,which is true for the vast majority of text found in urban scenes. To hypothesizetext lines, we fit straight lines to the centroids of character candidates of eachconnected set of character candidates. The text line that contains the largestnumber of characters form the hypothesized line and the characters are removedfrom the connected set. The process is iterated in each connected set until notext lines can be further extracted.
4 Text Hypothesis Verification
We design a word-level verification module that is as independent as possiblefrom the previous stages. Our goal is to: (1) Derive constraints on text modelvariables that are expected to have low entropy, using the observations we maderegarding constraints on the stroke-width, text-height and spacing in section

8 S. S. Tsai et al.
2, and (2) Derive measures in the image domain that mirror these constraints.Consider the binarized box of a text fragment of height H and containing mcharacters (please recall notation used in section 2). The area occupied by thetext alone is:
AT =
m∑i=1
LiSi = H2m∑i=1
λiψi = mH2(λψ) (1)
where X denotes the sample mean of X, i = 1..m. The bounding box area is:
AB = HW = H2m∑i=1
βi + δi = mH2(β + δ
)(2)
Taking the ratio of the two areas makes the measure invariant to the number ofcharacters m and the word height H:
ω =AT
AB=
(λψ)
β + δ(3)
ω can be computed trivially from the word hypothesis. If the stroke-width wereknown, we can divide ω by the relative stroke width sample mean ψ to obtain3:
α =AT
ψAB
=(λψ)
ψ(β + δ
) ≈ λ
β + δ(4)
Let’s turn attention back to the text model variables in section 2. We syn-thesized about 31000 random text fragments from 200 English fonts with allcombinations of plain, bold, italic, upper and lower cases. Figure 5 (left) showsa scatter-plot between the variables λ, ψ, (β + δ). While there is no correlationapparent, the subspace (λ, β + δ) (right) shows a strong linear correlation andhence the probability distribution of their ratio can be expected to have lowentropy. Empirically, the signal-to-noise ratio (i.e. mean to standard-deviation)of the four text model variables λ,ψ,β, and δ, is less than half that for λ/ (β + δ)(which has SNR of about 6.63). The quantity λ/ (β + δ) precisely correspondsto the image feature α, which thus forms a feature highly discriminative of text.We can calculate α from the hypothesized box image only needing to estimatethe relative stroke-width ψ. Interestingly it is possible to calculate α withouthaving to recover any text model variable by borrowing from the field of stereol-ogy [16], which estimates higher dimensional quantities accurately, from rapidlycomputable lower dimensional statistics.
Given that stroke width is nearly constant, the curved length (λ) is approx-imately half the perimeter (as stroke width is a small fraction of the perime-ter). One could obtain the perimeter via skeletonization, but skeletonizationoften does not produce the expected skeleton, especially for complex shapes.The perimeter can be estimated in a fast and efficient manner as follows: The
3 (λψ) ≈ λ̄ψ̄ is reasonable because empirically, λ and ψ are weakly correlated (Pearsoncorrelation of 0.4). Contrast this to λ and β + δ whose Pearson correlation is 0.94.

Text Detection via Hypothesis Generation and Verification 9
0
1
2
3
4
5 0
0.5
1
1.5
2
0
0.05
0.1
0.15
0.2
Char Width + Spacing: β+δCurved Length: λ
Str
oke−
Wid
th: ψ
0 0.5 1 1.5 2 2.5 3 3.5 4 4.50
0.2
0.4
0.6
0.8
1
1.2
1.4
1.6
1.8
2
Curved Length: λ
Char
Wid
th +
Spaclin
g: β
+ δ
Fig. 5. Scatterplots: Left: (λ, ψ, (β + δ)), Right: (λ, β + δ)
binarized characters are intersected by a randomized set of parallel lines of spac-ing d, to obtain the number of intersections N . The total curved length of allcharacters is given by [16]:
mλH =πdN
4(5)
We can now calculate α rather simply as follows:
α =λ
β + δ=
(mλH
)H
m(β + δ
)H2
=πdNH
4AB(6)
We also maintain the lengths of the line segments intersecting the characters.We add a second feature, γ as the (standard-deviation/mean) of these lengths.Here we simply exploit the fact that text characters within a word are expectedto have uniform stroke-widths, and hence have a low value for γ.
Fig. 6. Low α (Wide-Latin), High α (Onyx), Low γ (Arial-Narrow), High γ (Didot)
Figure 6 shows extremes in α and γ. Fonts with low α (e.g. Wide-Latin)have wider widths relative to stroke-length and vice-versa (e.g. Onyx), heightsbeing equal. It can also be seen that the Didot font (high γ) has a higher strokewidth variation than Arial-Narrow (low γ). Figure 7 (left) shows the (α, γ) scat-terplot for about 3000 real-image text patches from our new dataset (positiveclass), and about 2000 random non-text patches from the same images (negativeclass). Fitting a 2D Gaussian distribution to the positive samples and applyingincreasing thresholds on the distance to the center, we obtain the ROC curveshown on the right. An equal-error operating point is (0.09, 0.91) which is quitegood, considering that there are only two easily computed features and that thepositive class includes a large variety of text of different fonts and sizes. Fur-thermore, the user can easily tune this module based on expected fonts, needingonly synthetic data, and tolerable miss detection and false alarm rates. Trainingfor all experiments in this paper was done on synthetic data.

10 S. S. Tsai et al.
0 1 2 3 4 5 6 7 8 9 100
0.5
1
1.5
2
2.5
3
3.5
4
4.5
5
α
γ
Non−text
Text
0 0.1 0.2 0.3 0.4 0.5 0.6 0.7 0.8 0.9 10
0.1
0.2
0.3
0.4
0.5
0.6
0.7
0.8
0.9
1
False positive rate
Tru
e p
ositiv
e r
ate
Fig. 7. (α, γ) scatterplot and ROC curve via 2D Gaussian (best viewed in color).
Some false positives escape the above tests due to features typical in an urbanenvironment such as repeated windows and bricks which tend to mimic text. Wedeal with such cases by: (1) Comparing the characters to each other and rejectingthe text box if half of the neighboring characters match each other. A matchis defined in a template matching sense: if 85% of the pixels of the binarizedcharacters match, then the characters are said to be matching. (2) Checking thesolidity of each character, and rejecting the text box if a significant number ofcharacters have a solidity (defined as the proportion of object pixels within itsconvex hull) that is greater than 0.95.
5 San Francisco Text Data Set
The most well known dataset for text detection in natural scenes is the ICDAR2003 and 2011 dataset [7, 17] consisting of about two hundred test and train-ing images. The images, hand picked to represent challenges in natural sceneimagery, are mostly well focused but skewed towards diversity (e.g. text withinor overlapping other text, hand drawn text, one-two character long text, multi-colored text etc.). While the datasets, largely containing the same images butwith different annotation and scoring methods, provide a good starting pointfor validating text detection algorithms, they do not represent challenges of thekind and frequency typical in urban scenes, the main focus of our paper.
Other datasets include Epshtein et al.’s [8] street scene imagery, similar toICDAR but harder, and Wang and Belongie’s [18] Street View Text databasecontaining images with annotations, but mainly for evaluating word-spottingalgorithms given a lexicon, which is a different goal from this paper’s goal, whichis text detection without a lexicon.
We present a set of street scene images where all natural and legible textis annotated. The images are from several blocks from downtown San Fran-cisco (SF) and capture all the challenges one encounters for text detection inurban scenes at their normal frequencies The images form four faces of a cubicpanorama [19]. A few examples of the images with overlaid annotations are givenin Figure 8. Each text annotation is labeled with a unique tag. For text thatoccurs repetitively in multiple images, the same tag is used to describe them.
Each annotation includes the following information: (1) Location, indicatedby the four corners of an oriented bounding box surrounding the text, (2) Textcontents, if English, with occluded characters identified, (3) Physical appearance,such as “plain”, “ornamental”, “logo”, etc. (see Figure 9), (4) Special character-

Text Detection via Hypothesis Generation and Verification 11
Fig. 8. Sample SF images with annotations: Left to Right: Forward facing image,Right-side facing image, Backward facing image, Left-side facing image.
Fig. 9. Examples of “plain” (left) and “ornamental” (right) text.
istics, such as “extruded”, “reflective”, “fragmented”, and “reversed” (see Figure10), and (5) Background, such as “wall”, “ad sign”, “billboard”, “store sign”,“store awning”, “road surface” and even “no-background” (see Figure 11).
6 Experimental Results
We use both the San Francisco data set and the ICDAR data sets for our ex-periments. While the San Francisco data set is a better representation of urbanscenes taken in a systematic fashion, we experiment with the ICDAR data setmainly for validation and comparison.ICDAR detection measure: For the ICDAR 2003 dataset, [20, 7], precisionand recall is calculated as follows: For two boxes (e, t), the matching score is:mh(e, t) = Area(e ∩ t)/Area(r(e, t)), where r(e, t) is the minimum sized hori-zontal box that encloses e and t. Let E be the set of estimated horizontal textboxes and T be the set of ground truth text boxes in an image. Then, theprecision on a single image is p = (
∑e∈E maxt∈Tmh(e, t))/|E|, while the re-
call is r = (∑
t∈T maxe∈Emh(e, t))/|T |. The precision and recall for the wholedata set is given by the average of score per image. The f -score is defined asf = 1/(α/p + α/r), with α typically set to 0.5. For the ICDAR 2011 dataset,the evaluation method in [21] is used as suggested by the text detection rules.SF Text Data Set detection measure: In our newly presented data set,the text is annotated using oriented boxes. For two oriented boxes (e, t), thematching score is calculated as mo(e, t) = Area(e ∩ t)/Area(e ∪ t). Then, sim-ilar to the ICDAR measure, the precision of an image is calculated as p =(∑
e∈E maxt∈Tmo(e, t))/|E|, while the recall is r = (∑
t∈T maxe∈Emo(e, t))/|T |,for a set of estimated boxes E and ground truth annotated boxes T .Text detection results: Table 1 shows results on the ICDAR data sets. OnICDAR 2011, the proposed system improves recall and the f -score at practi-cally the same precision, relative to recently reported results in [22]. Like [22],our method does not improve on all three measures of the top scoring (and un-published) method in [17]. Furthermore, quoting Neumann and Matas [22], the
Fig. 10. Left to right:“Extruded”, “Reflective”, “Non-Planar”, “Fragmented” text.

12 S. S. Tsai et al.
Fig. 11. Left to right: “Ad sign”, “Billboard”, “Flag”, “No-background”.
competition “...was held in an open mode where authors supply only outputs oftheir methods on a previously published competition dataset”. The proposed sys-tem improves performance on precision over the recently reported results of [23]at the same recall for ICDAR 2003. While the ICDAR dataset provides a goodstarting point for validating a text detection method, as noted in Section 5, thereis a larger than normal proportion of outliers in the dataset making systematicexploration using principled methods difficult. Our method mainly misses textthat is within text and text on transparent surfaces where different scene con-tents are blended together, etc. Since our focus is mainly on urban rather thannatural scenes, our use of the ICDAR dataset was mainly for validation.
The SF dataset results (Table 2) demonstrate more clearly the strengths ofthe design choices we made in our system.
ICDAR 2011 Data set p r fKim’s method [17] 0.83 0.62 0.71Proposed 0.73 0.66 0.69Neumann et al [22] 0.73 0.65 0.69Yi’s method [24] 0.67 0.58 0.62
ICDAR 2003 Data set p r fProposed 0.74 0.61 0.67Minetto et al [23] 0.73 0.61 0.67Chen et al [11] 0.73 0.60 0.66Epshtein et al. [8] 0.73 0.60 0.66Neumann et al [25] 0.65 0.64 0.63
Table 1. (p, r) on the ICDAR data sets
SF Data set p r, f (P) r, f (O) r, f (HP)Proposed 0.42 0.49,0.45 0.42,0.42 0.56,0.48Proposed (no verification) 0.32 0.49,0.39 0.43,0.37 0.56,0.41Chen et al [11] 0.17 0.46,0.25 0.45,0.25 0.54,0.26
Table 2. (p, r) on the SF data set (right).
Note that precision is reported using all ground truth and all detections. Re-call is reported for different categories to highlight the different challenges in thedata set: “plain(P)”, “ornamental(O)”, “horizontal plain(HP)” text. Note that“ornamental” consists of text with special characteristics. The table also showsresults from [11] on the dataset. The row labeled ‘Proposed (no verification)’corresponds to results using only the MSER improvements described in section3 which already improves signficantly over their method, which uses MSER asa black-box. The row labeled ‘Proposed (no verification)’ corresponds to resultswithout use of the statistical tests from Section 4 showing the significant im-provement that the verification tests bring for negligible loss in recall. Figure 12shows sample detection results (please refer to caption for color codes). On theleft is an instance where the system detects all text with no false alarms inspiteof clutter. On the right is an instance where the system performs poorly dueto heavy noise coupled with poor contrast, ornamental text with no character

Text Detection via Hypothesis Generation and Verification 13
Fig. 12. Examples of detected results where we perform well(left) and poorly(right).The red overlays are the annotated boxes, the purple overlays are the detected boxes,and the green overlays are the intersects of the boxes.
separation, and non-uniform text interior. There are two false positives detectedon the tree due to leaves mimicking text. It can be noted that the overall lowerperformance on the SF data set relative to the ICDAR data set underscores itsmany challenges, which we hope will stimulate further research.
Computational complexity: The computation time of our system dependson imaging conditions (illumination, contrast, noise) and scene content (no. ofregions). On ICDAR, our system takes roughly 1.8 seconds/image on a 2.53GHz single core machine. On the SF dataset containing larger (4Mpix), non-well-focused, and noisier images, it takes on average 11 seconds/image. Most ofthe computation time is spent on generating the MSER regions. The multi-scaleanalysis, hypothesis generation and the verification steps are relatively fast. Notethat our focus for this work was the principled design of a text detection systemfor best accuracy rather than speed, and these numbers are for unoptimizedcode.
7 ConclusionsWe presented a text detection system for urban scenes comprised of modules forhypothesis generation and verification. We motivated the elements of the systemvia a practically useful model for text. We systematically tuned and presenteda multi-scale adaptation of the MSER algorithm for detecting characters ad-dressing challenges such as blur, noise, and image contrast variations typical inoutdoor scenes. We exploited relationships between variables of the text model toderive simple, easily computable, fast, yet highly discriminative features for text.We introduced a new text detection dataset that is larger, richer, and more de-tailed than previous datasets, and which we hope will serve as a new benchmarkdataset for text detection in urban scenes. We showed improved performanceover the state-of-the-art on the ICDAR dataset as well as the new dataset. Fu-ture work is planned along several lines for improved performance: (a) Use oflocal noise estimates (rather than global) in the detection stage, (b) Exploitingconstraints such as language models, distributions of number of characters perword etc. in the verification stage, and (c) Exploiting contextual cues typical inurban environments (e.g. lines from facades for partial scene geometry).
Acknowledgements: The authors would like to thank Xin Chen (Nokia Loca-tion & Commerce) for the SF text dataset used in this paper.

14 S. S. Tsai et al.
References
1. Matas, J., Chum, O., Urban, M., Pajdla, T.: Robust wide baseline stereo frommaximally stable extremal regions. In: British Machine Vision Conference. (2002)
2. Zhong, Y., Zhang, H., Jain, A.: Automatic caption localization in compressedvideo. IEEE TPAMI. (2000)
3. Ye, Q., Huang, Q., Gao, W., Zhao, D.: Fast & robust text detection in images andvideo frames. IVC (2005)
4. Chen, X., Yuille, A.: Detecting and reading text in natural scenes. In: CVPR.(2004)
5. Chen, X., Yuille, A.: A time-efficient cascade for real-time object detection: Withapplications for the visually impaired. In: CVPR - Workshops. (2005)
6. Zhang, J., Hanneman, A., Yang, J., Waibel, A.: A robust approach for recognitionof text embedded in natural scenes. In: ICPR. (2002)
7. Lucas, S.: ICDAR 2005 text locating competition results. In: ICDAR. (2005)8. Epshtein, B., Ofek, E., Wexler, Y.: Detecting text in natural scenes with stroke
width transform. In: CVPR. (2010)9. Shivakumara, P., Phan, T.Q., Tan, C.L.: A laplacian approach to multi-oriented
text detection in video. IEEE Trans. Pattern Anal. Mach. Intell. (2011)10. Neumann, L., Matas, J.: A method for text localization and recognition in real-
world images. ACCV (2010)11. Chen, H., Tsai, S.S., Schroth, G., Chen., D.M., Vedantham, R., Grzeszczuk, R.,
Girod, B.: Robust text detection in natural images with edge-enhanced maximallystable extremal regions. In: IEEE ICIP. (2011)
12. Retornaz, T., Marcotegui: Scene text localization based on the ultimate opening.International Symposium on Mathematical Morphology (2007)
13. Leon, M., Mallo, S., Gasull, A.: A tree structure based caption text detection ap-proach. IASTED Int. Conference on Visualization, Imaging, and Image Processing(2005)
14. Liu, C., Szeliski, R., Kang, S.B., Zitnick, C., Freeman, W.: Automatic estimationand removal of noise from a single image. IEEE PAMI (2008)
15. Vedaldi, A., Fulkerson, B.: VLFeat: An open and portable library of computervision algorithms (2008) http://www.vlfeat.org/.
16. Huang, Y., Klette, R.: A comparison of property estimators in stereology anddigital geometry. In: Combinatorial Image Analysis, Lecture Notes in ComputerScience,. (2005)
17. Shahab, A., Shafait, F.; Dengel, A.: Icdar 2011 robust reading competition chal-lenge 2: Reading text in scene images. In: ICDAR. (2011)
18. Wang, K., Belongie, S.: Word spotting in the wild. ECCV (2010)19. Greene, N.: Environment mapping and other applications of world projections.
Computer Graphics and Applications, IEEE (1986)20. Lucas, S., Panaretos, A., Sosa, L., Tang, A., Wong, S., Young, R.: ICDAR 2003
robust reading competitions. In: ICDAR. (2003)21. Wolf, C., Jolion, J.M.: Object count/area graphs for the evaluation of object
detection and segmentation algorithms. IJDAR 8 (2006)22. Neumann, L., Matas, J.: Real-time scene text localization and recognition. CVPR
(2012)23. Minetto, R., Thome, N., Cord, M., Stolfi, J., Precioso, F., Guyomard, J., Leite, N.:
Text detection and recognition in urban scenes. In: Computer Vision for RemoteSensing of the Environment. (2011) 227–234
24. Yi, C., Tian, Y.: Text string detection from natural scenes by structure-basedpartition and grouping. IEEE Trans. Image Processing 20 (2011)
25. Neumann, L., Matas, J.: Text localization in real-world images using efficientlypruned exhaustive search. In: ICDAR. (2011) 687–691