designing a proxy carbon price strategy for
TRANSCRIPT

1
Designing a Proxy Carbon Price Strategy for Smith College
Breanna Jane Parker
Advisors: Dr. Alexander Barron, Dano Weisbord, and
Dr. Susan Sayre
Submitted to the Program of Environmental Science and Policy of Smith College in partial fulfillment of the requirements for the
Degree of Bachelor of Arts with Honors
May 14, 2018

2
Abstract This thesis to Design a Proxy Carbon Price Strategy for Smith College was written to internalize the social cost of carbon emissions into financial decision-making. The reason a carbon price is necessary is because the current market price for fossil fuels omits the social cost of carbon emissions, which contribute to climate change (IPCC, 2014; Stern, 2008) A proxy carbon price is a virtual price - meaning it does not apply an actual fee - to acknowledge the social cost of carbon in financial decisions. In general, the proxy carbon price can be used to evaluate investment or purchase decisions. The institutional driver for this thesis derives primarily the Study Group on Climate Change (SGCC) request to “Develop an internalized cost of carbon emissions—such as a carbon-proxy price—to help guide major capital budget management and other decision- making processes” (SGCC, 2017). This thesis identified that many business and governments are using carbon price strategies, but only four academic institutions are doing so. As a consequence, there is a lack of peer-reviewed literature, which must be filled through experimentation and publication. In order to understand how a proxy carbon price might be implemented at Smith College this thesis identified and experimented with strategies to incorporate the proxy carbon price into financial decisions, using a mix of background research, stakeholder interviews, and pilot examples. Based on my research into possible carbon prices, the Smith College Committee on Sustainability (COS) recommended a proxy carbon price within the range of $60-$75 per MTCO2e 1(COS, 2018) which was implemented here as a price starting at $70 per MTCO2e. A pilot project on Renewable Energy Credit procurement demonstrated the general application of the proxy price for placing a value on avoided carbon emissions. For cases that include capital and operating costs, the proxy carbon price should be incorporated into the Lifecycle Cost method for financial decision-making. A Proxy Carbon Lifecycle Cost method can be performed using an Excel tool that was adapted from the Harvard Lifecycle Cost Calculator (Harvard, 2017). Its application was demonstrated with a pilot project on Washburn House, which illustrated the cost- and carbon- saving options of energy retrofit options. This thesis provides 8 recommendations regarding a Proxy Carbon Price Strategy for Smith College.
1 Metric ton of carbon dioxide equivalent emissions (MTCO2e) 2 A carbon asset is any infrastructure, vehicle, electricity, or other source that emits carbon emissions and is owned by the institution.

3
Acknowledgments
This thesis was made possible by the generous support and guidance by my
incredibly intelligent and kind advisors Dr. Alex Barron, Associate Professor of
Environmental Science & Policy, Dano Weisbord, the Director of Sustainability &
Campus Planning and Dr. Susan Stratton Sayre, the Assistant Professor of
Economics. Not only did my advisors support me through my thesis work, but they
also taught me nearly everything I know about climate change, sustainable solutions,
and environmental policy. I will admit that before I came to Smith College I did not
believe in anthropogenic climate change. My advisors enlightened me about the
complex and urgent problem of climate change, which truly changed my life and,
quite literally, took my head out of the stars. I will be forever grateful to my advisors
and to Smith College for giving me the opportunity to learn about the world and to
invigorate me with passion to make sustainable changes in the world.
I also want to thank the Smith College stakehol`ders that provided me with
insights about the institution to help me develop the Proxy Carbon Price Strategy for
Smith College. Thank you to the folks in Facilities Management, Karl Kowitz, Karla
Youngblood, Charlie Conant, Morgan Wilson, Cheryl Obremski, and Roger Mosier
for meeting with me to discuss the current practices of the institution and strategies
for incorporating the Proxy Carbon Price Strategy. And a special thank you to the
Energy Manager, Matt Pfannenstiel, for working with me to adapt the Smith College
Proxy Carbon Lifecycle Cost Calculator from the Harvard Lifecycle Cost Calculator.
Also, a special thank you to Peter Gagnon for providing me with key insights into

4
how to integrate the proxy carbon price into the current practices of capital project
evaluation and for his support of the Proxy Carbon Price Strategy. Additionally, I
would like to thank Mike Howard, the Executive Vice President for Finance &
Administration, for his insights about the Lifecycle Cost method and for asking
excellent questions about the Proxy Carbon Price Strategy. Also, thank you to David
DeSwert, the Associate Vice President for Finance & Administration, for answering
my questions about financial planning at Smith College. Finally, thank you to Emma
Kerr, the Campus Sustainability Coordinator, for helping me identify carbon
emissions at Smith College.
Also, thank you to the external collaborators for providing me with insights
and advise during the development of the Proxy Carbon Price Strategy for Smith
College. Thank you to Casey Pickett, of Yale University, Aurora Winslade, of
Swarthmore College, Nathaniel Graf, of Swarthmore College, Shana Weber, of
Princeton University, and Caroleen Verly, of Harvard University, for answering my
questions and providing me with key insights.
I would also like to thank the Study Group on Climate Change for developing
sustainability goals for Smith College and for specifically requesting the
development of an internalized cost of carbon for Smith College. Furthermore, I
would like to thank the Committee on Sustainability for their support and selection
of the Smith College proxy carbon price value. The institutional support for this
thesis to Design a Proxy Carbon Price Strategy for Smith College enabled me to
complete this thesis. It is my hope that Smith College will use this research to
become a more sustainable institution to support future generations.

5

6
TABLE OF CONTENTS CHAPTER I: INTRODUCTION: SMITH COLLEGE PROXY CARBON PRICE STRATEGY ........................................................................................................................ 8 CHAPTER II: BACKGROUND ...................................................................................... 14
SECTION A: CARBON EMISSIONS ARE AN ENVIRONMENTAL EXTERNALITY ..................... 14 SECTION B: STRATEGIES TO INTERNALIZE THE EXTERNALITY ........................................ 15 SECTION C: GOVERNMENT CARBON PRICE POLICIES ...................................................... 20
Government Carbon Price Policy Around the World .................................................. 21 Government Carbon Price Policies in the United States ............................................. 23
SECTION D: BUSINESSES AROUND THE WORLD ............................................................... 24 SECTION E: ACADEMIC INSTITUTIONS ............................................................................ 26 SECTION F: CARBON PRICE VALUES ............................................................................... 27
Integrated Assessment Models .................................................................................... 27 Government Carbon Prices ........................................................................................ 30 Carbon Offset Market Price ....................................................................................... 33 Academic Institution Carbon Prices ........................................................................... 34
CHAPTER III: METHODS ............................................................................................. 36 SECTION A: PROCESS AND PROJECT DEVELOPMENT ....................................................... 36 SECTION B: QUALITATIVE RESEARCH METHODS ............................................................ 39
Internal Stakeholders ................................................................................................. 39 External Stakeholders ................................................................................................ 44
SECTION C: ADAPTING THE HARVARD LIFECYCLE COST CALCULATOR FOR SMITH COLLEGE ........................................................................................................................ 46
Marginal Utility Cost by Source ................................................................................. 47 Escalation Rates by Source ........................................................................................ 49 Carbon Emission Rates by Source .............................................................................. 51
SECTION D: PILOT PROJECTS .......................................................................................... 55 Washburn House Retrofit ........................................................................................... 55 Renewable Energy Credit Procurement ...................................................................... 57
CHAPTER IV: RESULTS AND DISCUSSION .............................................................. 59 SECTION A: LESSONS FROM GOVERNMENTS, BUSINESSES, AND ACADEMIC INSTITUTIONS 59 SECTION B: INSIGHTS FROM THE INSTITUTION ................................................................ 66 SECTION C: SELECTING THE SMITH COLLEGE PROXY CARBON PRICE VALUE ................. 69 SECTION D: PROXY CARBON PRICE STRATEGY INTEGRATION METHODS ........................ 72 SECTION E: SENSITIVITY ANALYSIS ............................................................................... 75 SECTION F: PILOT PROJECTS ........................................................................................... 78
Washburn House Retrofit ........................................................................................... 78 Renewable Energy Credit Procurement ...................................................................... 85
CHAPTER V: CONCLUSIONS AND RECOMMENDATIONS ................................... 90 CONCLUSIONS ................................................................................................................ 90 RECOMMENDATIONS FOR SMITH COLLEGE ..................................................................... 95
CHAPTER VI: FUTURE WORK ................................................................................... 101 BIBLIOGRAPHY ............................................................................................................ 104 EXTERNAL COLLABORATORS .................................................................................... 112 APPENDIXES ................................................................................................................. 113

7
INDEX OF FIGURES AND APPENDIXES Figures FIGURE 1 - SMITH'S CARBON EMISSIONS THROUGH TIME, INCLUDING PROJECTED
EMISSION REDUCTIONS. 11 FIGURE 2 – A COMPARISON OF REVENUE NEUTRAL CARBON FEE AND PROXY CARBON
PRICE MODELS. 19 FIGURE 3- CARBON PRICE POLICIES AROUND THE WORLD. SOURCE: WORLD BANK
AND ECOFYS, 2017 22 FIGURE 3- REGIONAL GREENHOUSE GAS INITIATIVE (RGGI) IS A CAP AND TRADE
SYSTEM FOR THE ELECTRICITY SECTOR IN THE NORTHEAST. NOTICE THAT THE PRICE SIGNAL IS LOW AND FLUCTUATES OVER TIME DUE TO MARKET MECHANISMS. 32
FIGURE 4- CARBON PRICE VALUE: THERE IS A WIDE RANGE OF CARBON PRICE ESTIMATES WHICH ARE ILLUSTRATED IN ASCENDING ORDER. 35
FIGURE 7- SMITH COLLEGE ORGANIZATION CHART. ALL STAKEHOLDERS WERE IN THE BRANCH OF THE EXECUTIVE VICE PRESIDENT OF FINANCE AND ADMINISTRATION. SOURCE: SMITH COLLEGE, 2017 40
FIGURE 8- A SCHEMATIC OF THE SMITH COLLEGE COMBINED HEAT AND POWER (CHP) PLANT. 52
FIGURE 9- CARBON PRICES FROM GOVERNMENTS, BUSINESS, MARKETS, AND ACADEMIC INSTITUTIONS. 69
FIGURE 10- THE PROXY CARBON PRICE OF UTILITIES AND FUELS AT SMITH COLLEGE AS A PERCENT OF THE TOTAL COMMERCIAL MARKET COST AND PROXY CARBON COST. THESE RESULTS SHOULD BE INTERPRETED AS A PER UNIT BASIS. 76
FIGURE 11- THE NET PRESENT VALUE (NPV) OVER TIME FOR THE WASHBURN HOUSE RETROFIT OPTION OF SEALING THE FLOORS. THE DISCOUNTED PAYBACK PERIOD OCCURS WHEN THE LINE INTERSECTS WITH THE X-AXIS. THIS GRAPH WAS CREATED USING THE PROXY CARBON LIFECYCLE COST EXCEL TOOL. 81
FIGURE 12- THE NET PRESENT VALUE (NPV) OVER TIME FOR THE WASHBURN HOUSE RETROFIT OPTION OF INSULATING THE WALLS. THE DISCOUNTED PAYBACK PERIOD OCCURS WHEN THE LINE INTERSECTS WITH THE X-AXIS. THIS GRAPH WAS CREATED USING THE PROXY CARBON LIFECYCLE COST EXCEL TOOL. 82
FIGURE 13- THIS BAR GRAPH COMPARES THE 20 YEAR TOTAL COST OF OWNERSHIP OF THE THREE OPTIONS FOR THE WASHBURN HOUSE RETROFIT ANALYSIS USING ONLY THE INITIAL COST AND THE UTILITY COST OF STEAM. THIS BAR GRAPH WAS CREATED USING THE PROXY CARBON LIFECYCLE COST EXCEL TOOL. 84
FIGURE 14- THIS BAR GRAPH COMPARES THE 20 YEAR TOTAL COST OF OWNERSHIP OF THE THREE OPTIONS FOR THE WASHBURN HOUSE RETROFIT ANALYSIS USING THE INITIAL COST, THE UTILITY COST OF STEAM, AND THE PROXY CARBON PRICE OF $70 PER MTCO2E. THIS BAR GRAPH WAS CREATED USING THE PROXY CARBON LIFECYCLE COST EXCEL TOOL. 84
Appendixes APPENDIX 1- INTERNAL STAKEHOLDER QUESTIONS
102 APPENDIX 2- READAHEADS TO KEY INTERNAL STAKEHOLDERS
107 APPENDIX 3- EXTERNAL STAKEHOLDER QUESTIONS
118 APPENDIX 4- VARIABLE DATA FOR ADAPTING THE HARVARD LIFECYCLE COST CALCULATOR
121 APPENDIX 5-WASHBURN HOUSE RETROFIT PILOT PROJECT RESULTS FROM THE PROXY CARBON LIFEYCLE COST CALCULATOR
122

8
Chapter I: Introduction: Smith College Proxy Carbon Price Strategy
Climate change is a complex and urgent problem that will require creative,
sustainable solutions. The consumption of fossil fuels and changes of land use
produce greenhouse gas emissions, especially Carbon Dioxide (CO2), which results
in changes to the Earth’s climate (IPCC, 2015). The current market price for fossil
fuels does not capture the full cost to society (i.e. a negative externality) (Stern,
2008). In future decades, centuries, and millennia, climate change will act as a driver
of geological processes in the new geological epoch called the Anthropocene
(Schwägerl, 2011). Furthermore, the consequences of climate change are a social
justice issue because climate change will impact economies and societies around the
world and particularly impact developing countries and low-income people. (Stern,
2008; UNFCCC, 2016). The science is clear and it is apparent that sustainable
actions are needed avoid the worst impacts of global climate change. This thesis
investigates one possible strategy to stimulate actions to reduce greenhouse gas
emissions (hereafter carbon emissions) at Smith College by internalizing the social
cost of carbon into financial decisions through a proxy carbon price.
A proxy carbon price is a way to acknowledge carbon emissions in financial
decisions and favor low-carbon options (Gillingham et al., 2017). It is a virtual price
that is calculated, though not actually charged, at the point of purchase to evaluate
the impact of carbon emissions to society. A proxy carbon price can be used to
highlight cost- and carbon- saving opportunities to transition to a low-carbon
institution (CDP, 2017; Morris, 2015; Cassidy, 2016). Additionally, a proxy carbon
price can be used to illustrate the institutional value of avoided carbon emissions

9
from innovative low-carbon investments. Ultimately, a proxy carbon price is a
financial tool to acknowledge carbon emissions in financial decisions and favor low-
carbon options to transition to a low-carbon institution and provide net benefits to
society through avoided climate damages.
Currently, governments around the world are turning to carbon pricing as a
strategy to mitigate carbon emissions and meet National Determined Contributions
(NDC) to the Paris Climate Accord (World Bank, Ecofys 2017). Businesses are
responding by integrating a carbon price into business strategy. As of 2017, over
1,300 businesses are currently using or have disclosed plans to implement a carbon
price in their business strategy to hedge against the financial risk of carbon
regulation (CDP, 2017).
Traditionally, colleges and universities have been centers of education,
experimentation, and innovation (Weisbord et al., 2012). Frank Wolak, a Stranford
University economist articulated that, “the primary roles of research universities is
knowledge creation and dissemination. Universities are especially well placed to
address the challenges of pricing greenhouse gas emissions in light of the technical
and implementation challenges involved” (Wolak, 2014). There are many academic
institutions in the United States that are well suited for experimenting with carbon
pricing techniques because they have the knowledge and the capability to conduct
research.
A recent paper in Nature, “Lessons from first campus carbon-pricing
scheme,” described Yale Carbon Charge, which is an experiment to model a revenue
neutral carbon tax (Gillingham et al., 2017). The report also discussed using proxy

10
carbon pricing as a strategy for institutions and businesses to incentivize low-carbon
investments. In response to the Gillingham paper, Dr. Alex Barron and I wrote a
Correspondence in Nature, “Test proxy carbon prices as decision-making tools,”
elaborating upon reasons why experimentation is necessary to understand how to
maximize the benefits of a proxy carbon price (Barron and Parker, 2018).
Smith College is poised to experiment with a proxy carbon price strategy as a
way to address the complex, urgent issue of climate change and expand the literature
on this new idea. Futhermore, engaging students in the research of the proxy carbon
price can address the Strategic Plan initiative, Campus as Classroom (Strategic Plan,
2016). Therefore, Smith College has an opportunity to become a leader in the
emerging field of carbon pricing and increase the institution’s social capital.
This thesis to Design a Proxy Carbon Price Strategy for Smith College
addresses an institutional need for strategies to mitigate carbon emissions. Smith
College signed the American College & University Presidents’ Climate Commitment
(ACUPCC) to become carbon neutral by 2030. Currently, Smith College annually
emits approximately 26,000 metric tons of carbon dioxide equivalent (hereafter
MTCO2e) (AASHE-Stars, 2017). Therefore, Smith College needs to mitigate carbon
emissions or purchase carbon offsets to achieve the ACUPCC commitment (Figure
1).

11
Figure 1 - Smith's Carbon Emissions through time, including projected emission reductions (SGCC, 2017).
The overarching research question is how can Smith College incorporate a
proxy carbon price into the current practices of making financial decisions in capital
budget management and sustainability projects? This thesis addresses the request by
the Study Group on Climate Change to “Develop an internalized cost of carbon
emissions—such as a carbon-proxy price—to help guide major capital budget
management and other decision- making processes” (SGCC, 2017). Additionally,
this thesis explores using proxy carbon price as an environmental economic tool to
meet Smith College’s carbon neutrality goal of 2030 by incentivizing low-carbon
options for capital projects. Specifically, this thesis demonstrates the proof of
concept of using a proxy carbon price through two pilot projects: Washburn House
Retrofit and the Renewable Energy Credit Procurement Project.

12
The primary purpose of this thesis was to pursue scholarly research on proxy
carbon pricing as a strategy to mitigate carbon emissions and consequential climate
change. Ultimately, the goal of the Design a Proxy Carbon Price Strategy for Smith
College is to align the academic institution’s mission of education and sustainability
with the operations of the institution, thereby creating positive institutional change.
The research for this thesis to Design a Proxy Carbon Price Strategy for
Smith College begins with Chapter II: Background, which demonstrates the
environmental economic need for a carbon price to internalize the social cost of
carbon into financial decisions and describes options for selecting the proxy carbon
price. Additionally, it reviews the use of carbon pricing by governments, businesses,
and academic institutions around the world. This section answers the research
questions, why should an institution incorporate a proxy carbon price?
The next is Chapter III: Methods, which articulates how I designed a Proxy
Carbon Price Strategy for Smith College. In this Chapter, I discuss my methods for
engaging with internal stakeholders at Smith College and external collaborators at
other academic institutions. Additionally, I provide a review of how I adapted the
Harvard Lifecycle Cost Calculator to the specifications of Smith College to create
the Proxy Carbon Lifecycle Cost Calculator. The final section articulates how I
selected and developed the pilot projects to demonstrate the proof of concept.
The following is Chapter IV: Results and Discussion, which describes the key
findings of this research. First I describe the key insights from academic institutions,
businesses, and governments, as well as share insights from stakeholder interviews.
Also, I discuss methods for integrating the proxy carbon price into financial

13
decisions and investigate the sensitivity of the proxy carbon price with respect to
other financial costs. Next, I describe the method of using Lifecycle Cost
calculations to contextualize the carbon price among other financial metrics. I deploy
the proxy carbon price through a pilot project of the Washburn House Retrofit.
Additionally, I articulate the method of using the proxy carbon price as a metric for
valuing avoided carbon damages. I demonstrate the proof of concept of this method
for the possible sale of Renewable Energy Credits (RECs). Additionally, I describe
the key insights from the qualitative research of internal stakeholders and articulate
the growing support for the Proxy Carbon Price Strategy at Smith College.
Then, in Chapter V: Conclusions and Recommendations section, I tie together
the key findings from my background research, external collaboration with other
academic institutions, engagement with stakeholders at Smith College, and the
results of the pilot projects. I provide 8 recommendations for Smith College
regarding a Proxy Carbon Price Strategy for Smith College.
The final Chapter is on Future Work. I outline projects for future student
engagement with the proxy carbon price strategy. Additionally, I provide suggestions
for future research to improve upon the precision of the Smith College Proxy Carbon
Lifecycle Cost Excel tool. This thesis is just the beginning of experimenting with
proxy carbon pricing at Smith College.

14
Chapter II: Background Section A: Carbon emissions are an Environmental Externality
The climate is changing on Earth at an unprecedented rate, marking a shift in
geological epochs to the Anthropocene (Schwägerl, 2011). Consuming fossil fuels to
power the modern world produces greenhouse gases (GHGs) such as carbon dioxide,
which in high atmospheric concentrations will produce dangerous changes in the
Earth’s climate system (IPCC, 2014; Stern, 2008; UNFCCC, 2016). Not only will
these changes impact ecosystems and biodiversity, but they will also impact society
and the economy. For instance, projected sea level rise is likely to result in lost real
estate and changes in precipitation are likely to change agriculture yields (IPCC,
2014, Union of Concerned Scientists, 2017). In economic terms, these damages are
known as a negative externality because the individual actions of consuming carbon
goods imposes direct, unintentional, and uncompensated effects on the well being of
society (Nordhaus, 2015; Keohane and Olmstead, 2009).
Typically, free markets are an efficient mechanism to distribute goods
throughout an economy and are also a functional tool to determine the price and
quantity of a good. Specifically, Pareto efficiency occurs at the point where the
marginal cost of production curve (supply) intersects with the marginal benefit of
consumption (demand)). However, if there are negative externalities associated with
a good, then the market price for the good does not reflect the true cost to society
(Nordhaus 2015, Keohane and Olmstead, 2009, Stern, 2008). In the case of a
negative externality, markets will produce too much of the good because the
marginal cost curve is too low as it only reflects the costs of production and does not

15
include the cost of external damages. For carbon emissions, the negative externality
is typically represented by the social cost of carbon emissions (Nordhaus, 2015).
In order to correct the market failure and internalize the negative externality,
the marginal cost curve should be raised to the social marginal cost curve to reflect
the true cost of production or consumption (Keohane and Olmstea, 2009). In effect,
this would result in a new equilibrium at the point of efficiency where the social
marginal cost curve (supply) intersects with the marginal benefit of consumption
(demand). For carbon emissions, the point of efficiency occurs where the marginal
social cost of carbon plus the private marginal cost curve intersects with the marginal
benefit of consumption of fossil fuels. Overall, this would reduce the quantity of the
harmful carbon emission to the efficient point for society where the marginal costs
equal the marginal benefits.
In the case of carbon emissions, determining the social marginal cost of one
metric ton of carbon dioxide equivalent is a challenging task because the multitude
and magnitude of economic damages of climate change are relatively uncertain. In
theory it can be done, however in practice the price is difficult to determine (See
Chapter II: Section C). Nevertheless any price greater than zero is better than
completely omitting the social cost of carbon emissions. A postive price on carbon
emissions will result in a more efficient allocation of capital that better internalizes
the negative externality of climate change into financial decisions.
Section B: Strategies to Internalize the Externality
Putting a price on carbon is one strategy to correct the market failure of the
negative externality of carbon emissions and account for the climate costs of burning

16
fossil fuels in financial decisions (Nordhaus, 2015; World Bank, 2017; Cassidy,
2016). Increasingly governments are using carbon prices to encourage polluters to
find cleaner, lower carbon alternatives (Cassidy, 2016, World Bank, Ecofys, 2017).
There two primary methods that governments are: cap and trade policies and carbon
taxes (See Chapter: II, Section D).
On a smaller scale, carbon pricing is gaining traction in businesses and
institutions as they incorporate a carbon price into their organizations to guide
financial decisions and to acknowledge the social cost of carbon. This is known as an
internal carbon price. There are two primary models for internal carbon pricing: a
revenue neutral carbon fee and a proxy carbon price. Both models have the goal of
internalizing the cost of carbon emissions into the finances of the institution, but they
differ in the details.
This thesis investigates these carbon price models to provide a
recommendation for the internal carbon price model for the institution of Smith
College. The Study Group on Climate Change recommended a proxy carbon price
strategy for Smith College (SGCC, 2017). Nevertheless, I asked the research
question which carbon pricing model is best suited for Smith College? For summary
of the comparison between a carbon fee and a proxy carbon price see Figure 2.
A revenue neutral carbon fee applies a financial fee proportional to the carbon
content. Then the revenue from the carbon fee is returned equally to balance the
budgets. Other times the revenue is used to finance capital projects. This model
functions like a regulatory carbon tax and focuses on operational expenditures. The
data needs for this method are high because it impacts the budget of every utility user

17
and requires building metering infrastructure to measure the carbon content.
Furthermore, this method has a high administrative overhead because staff must
measure the change in annual carbon emissions from the baseline of carbon
emissions to calculate the carbon fee and then return the dividend (Yale Carbon
Charge Task Force, 2017).
A proxy carbon price is a virtual, internal metric to acknowledge carbon
emissions in financial decisions. A proxy carbon price creates an assumed cost
proportional to the amount of carbon equivalent emissions for an investment or
capital project. It is important to note that a proxy carbon price is a virtual price that
values carbon emissions but does not impose an actual fee and, consequently, does
not generate revenue (Gillingham, 2017). The data needs for this method is selective
for projects and does not require metering infrastructure. The proxy carbon price
method does require thorough organization and reporting of financial and carbon
emission records. The proxy carbon price method is scalable from individual projects
to campus-wide evaluations.
A proxy carbon price sends a price signal to decision-makers that reflect the
climate cost of carbon emissions on the environment, society, and the institution. The
proxy carbon price illustrates the social cost of carbon alongside other traditional
financial metrics, making it easier for decision makers to see the full impact of their
decisions (Swarthmore, 2017). It is a way to acknowledge carbon emissions in
financial decisions and highlight cost and carbon saving projects. Additionally, the
proxy price can be used to illustrate the value of avoided climate damages.
Furthermore, it can also incentivize more consistent and cost-effective emission

18
abatement than alternative approaches such as renewable energy procurement targets
or internal efficiency standards (Morris, 2015). Therefore, the proxy carbon price can
be used as a tool to transition to a low-carbon institution.
The proxy carbon price strategy is also a way to identify financial risks
associated with future climate regulation. Smith College is located in Northampton,
Massachusetts, an area that is already in a carbon pricing cap and trade system
known as the Regional Greenhouse Gas Initiative (RGGI, 2018). Additionally, the
Commonwealth of Massachusetts is currently proposing three carbon tax bills (MA
legislature, 2018). As climate regulation grows in the Commonwealth of
Massachusetts, Smith College must consider the financial risk of carbon assets. 2
Another financial risk of the 2030 carbon neutrality commitment called the
American College and University President’s Climate Commitment (ACUPCC)
(SCAMP, 2010). After this date any carbon asset on campus must be eliminated or
offset, through the purchase of carbon offsets. Therefore, any carbon asset on
campus after 2030 has an associated financial risk that will impact the Operating
Budget and Capital Plan. An internal proxy carbon price is a strategy to manage the
financial risks associated with carbon assets currently on campus, such as a building
or vehicle. Ultimately a proxy carbon price can be incorporated into financial
planning to mitigate the financial risk of carbon from new, long-term capital
decisions.
2 A carbon asset is any infrastructure, vehicle, electricity, or other source that emits carbon emissions and is owned by the institution.

19
Ultimately, a proxy carbon price is an environmental economic strategy to
better understand the impact of carbon emissions on the environment, society, and
the College. This internal carbon pricing strategy also has the benefits of being able
to manage the financial risks of carbon assets and highlight opportunities to
transition to a low-carbon institution. On the other hand, the carbon fee models a
revenue neutral carbon tax, which requires greater overhead and institutional
infrastructure.
Figure 2 – A comparison of revenue neutral carbon fee and proxy carbon price models.

20
Section C: Government Carbon Price Policies
There are two primary approaches governments around the world use to price
carbon: cap and trade policies or carbon tax policies. Cap and trade, also known as
an emissions trading system (ETS), is a market approach designed to cap emissions
and distribute tradeable permits to private industry. The cap can be set to achieve
emission reduction targets or simply to cap emissions to prevent them from rising.
Looking to a local example, the Regional Greenhouse Gas Initiative, is a cap and
trade system covering New England (RGGI, 2018). Another primary approach for
governments to put a price on carbon is to apply a carbon tax. An advantage of this
method is that it sends a stable price signal to private industry which can allow
businesses and individuals to integrate the price into business models and money
management to reduce financial risk.
These carbon price policy options allow private industry to choose to reduce
emissions to avoid paying or continue business as usual emissions and pay a fee.
There is the risk that the carbon price selected by these government policies
significantly undervalue the cost of carbon without proper management. Nonetheless,
any price above zero is an improvement from entirely ignoring the social cost of
carbon emissions.
However, is is imortant to note that these polices are regressive, which means that
the imposed fees have a greater distributional impact on low income groups (Paul,
2015). To mitigate the regressive nature of the carbon tax, governments can recycle
the revenue to society through direct rebates, tax reductions, or community
investments.

21
Table 1 Tradeoffs between the government policy options: Carbon Tax and Cap & Trade policy options.
Carbon Tax Cap and Trade Price Signal Stable Fluctuates Selecting the Price Carbon price set by the
government Set at the general equilibrium of the cap and trade market
Emissision Reduction Based on behavior changed induced by the carbon tax
Reduction set by the cap
Government Carbon Price Policy Around the World
In November of 2016 the United Nations Framework Convention on Climate
Change marked the beginning of a new era of global action against climate change
with the Paris Agreement (UNFCC, 2016). Countries around the world have
committed to the voluntary agreement to cooperate in reducing emissions, through
Nationally Determined Contributions (NDCs). Over the next few years governments
around the world are likely to implement domestic and regional emissions trading
systems (ETSs) as well as carbon taxes to achieve NDCs of the Paris Climate
Accord. Since 2016 there have been eight new carbon pricing initiatives around the
world that include carbon taxes and cap and trade policies on state, regional, and
national levels (World Bank, Ecofys, 2017). For example, China has been
experimenting with a cap and trade policy in a sub-regional level and is now
preparing to expand the ETS pilot project to cover the entire country, making it the
largest carbon pricing initiative in the world (World Bank, 2017). Governments
around the world are interested in developing carbon pricing as a strategy to meet
global commitments such as the NDCs to the Paris Agreement, and also, to signal
private industry to transition to a carbon constrained world.

22
Figure 3- Carbon price policies around the world. Source: World Bank and Ecofys, 2017
As of 2017, over 40 national and 25 subnational jurisdictions are pricing
carbon emissions, covering about 15% of global emissions or 8 gigatons of carbon
dioxide equivalent as shown above in Figure 3 (World Bank, EcoFys, 2017). All of
the countries within the European Union, plus Norway, Iceland, and Liechtenstein
are covered by an emission trading scheme. This totals to about 45% of all European
Union emissions. Down in the South Pacific, New Zealand also has an emissions
trading scheme, and Australia implemented a safeguard mechanism of the Emissions

23
Reductions Fund (ERF) to cover about half of the nation’s emissions (World Bank,
EcoFys, 2017).
Government Carbon Price Policies in the United States
The 2016 United States election of President Donald Trump marked a shift
away from progressive environmental policy and climate action. The new
administration has decided to rescind the commitment to the Paris Agreement, to
dismantle the Clean Power Plan, and weaken the power of the Environmental
Protection Agency (EPA) (Executive Order, 13783). Following these sweeping
decisions, the opportunity for carbon pricing on a national level in the near term has
essentially evaporated.
For these reasons, it has become increasingly important for subnational
governments to take climate action and maintain existing environmental policies.
Over a decade ago the state of California enacted AB 32, the Global Warming
Solutions Act, which includes a cap and trade system for greenhouse gas emissions
(California Legislature, 2006). During the summer of 2017, the state reaffirmed its
jurisdiction to cap carbon emissions (California Legislature, 2018). On the other side
of the country, a collection of New England states came together in 2012 to
implement the Regional Greenhouse Gas Initiative (RGGI), which also is a cap and
trade system for carbon emissions (RGGI, 2018).
Recently, there has been some interest in the development of state carbon
pricing policies. In the state of Massachusetts there are currently three proposed
carbon pricing bills, which are gaining traction from local activists and policy
makers (Our Climate, 2017; Goldstein-Rose, 2018). The three proposed carbon tax

24
bills are: An Act relative to creating energy jobs (HB 3473), An Act combating
climate change (SB1821) and An Act to promote green infrastructure, reduce
greenhouse gas emissions, and create jobs (SB1726) (MA Legislature, 2017). The
states of Utah, Washington, Maryland, New York, Hawaii, Rhode Island, Vermont,
Maine, as well as Washington, D.C. have all proposed carbon tax bills, but none have
been implemented to date (Davenport, 2018). Additionally, Oregon is proposing a
cap and trade system to mitigate carbon emissions (Resources for the Future, 2017).
While a national carbon price policy in the US is unlikely due to political feasibility,
there are subnational carbon pricing schemes being proposed or are already
implemented.
Section D: Businesses around the World
Businesses are using an internal carbon price for many reasons as the risks of
climate change and carbon regulation continue to grow. In 2017, over 1,300
companies around the world disclosed plans or current practices of putting a price on
carbon emissions (CDP, 2017). There is a positive trend of more businesses
implementing a carbon price into business strategy, including an 11% increase from
2016 (CDP, 2017). Even big oil companies like BP and Shell are using an internal
carbon price as the risks of climate change and carbon regulation become apparent.
Incorporating an internal carbon price into business strategy is a way to
manage the financial risk of regulation in a carbon constrained world. Recent
government action around the world to implement carbon price policies is
stimulating businesses to use an carbon price to model regulatory carbon pricing
scenarios (CDP, 2017). This is particularly relevant for global companies that must

25
consider multiple governments that are likely to price carbon. Additionally, any
business that has a carbon commitment or goal must either reduce emissions to that
level or purchase carbon offsets. An internal carbon price can model the financial
risk of not meeting a carbon commitment or the financial risk of carbon regulation.
Another reason businesses are using a carbon price in business strategy is to
highlight economic opportunities to transition to a low-carbon company (CDP,
2017). The technology revolution presents many opportunities for research and
development into energy efficiency, renewable energy, and other sustainable
transition tools. The implications of using a carbon price in business strategies are
apparent through the examples of Microsoft and Disney. Microsoft invents
technology to accelerate the transition to a low-carbon economy and also applies “a
financial cost to the carbon impact of our operations, to provide justification to
prioritize efficiency...across the organization” (CDP, 2014). Alternatively, Disney
does not invent transition technology, but instead uses a carbon price to progress
sustainable initiatives while simultaneously having three consecutive years of record-
setting financial performance (CDP, 2014).
Business are also using an internal carbon price to increase their social
capital. A recent report by the Carbon Disclosure project found that “Companies that
use internal carbon prices are signaling to investors that they are aware of the risks
posed by climate change to society and their own companies” (CDP, 2017). Investors
are looking to companies to refine their operations to be more environmentally
sustainable as more people become aware of the dire impacts of climate change.

26
Integrating a carbon price into business strategy is a way for businesses to illustrate
their commitment to combating climate change and gain social capital.
Section E: Academic Institutions
Academic institutions are using an internal carbon price to align campus
operations with the mission of education and sustainability. The primary role of
universities and colleges is to educate future leaders, entrepreneurs, and inventors
with knowledge and critical thinking skills (Winslade, 2017). Traditionally, colleges
have been centers of innovation and experimentation before integrating a new idea
throughout society (Weisbord et al., 2012). Climate change poses unique challenges
because it is a complex problem that interacts with physical systems and
socioeconomic systems. Because of the dynamic and interdisciplinary nature of this
problem, solving it will require innovative solutions.
Academic institutions can fulfill their role as centers for education by
engaging students in experiments on the emerging strategy of internal carbon
pricings. Additionally, academic institutions will benefit from aligning campus
operations with sustainable financial decisions described by theories taught in
environmental economics courses. Furthermore, internal carbon pricing is one
strategy to lower carbon emissions and make more informed financial decisions to
align with the sustainable initiatives at institutions. Internal carbon pricing is worth
testing, especially because there is very little peer-reviewed literature on the topic.
(Gillingham et al., 2017, Barron and Parker, 2018).
There are two primary methods to apply a carbon price within institutions,
which are a proxy carbon price and/or a revenue neutral carbon fee (Figure 2). By

27
implementing an internal carbon price, academic institutions are fulfilling their role
as a thought leader for the complex, urgent problem of climate change. Academic
institutions can use their reputation and privilege of being innovative leaders and
experiment with carbon pricing and share their cutting edge results with the world.
Section F: Carbon Price Values
A crucial piece of information for the Proxy Carbon Price Strategy for Smith
College is a value for the proxy carbon price. Carbon emissions are considered a
negative externality because the social cost of carbon emissions are not captured by
market prices for fossil fuels (Stern, 2018). In a perfect world, the externality is a
knowable and fixed value but the world is complex and constantly changing.
Therefore, it can be a challenge to determine the proxy carbon price value. The
selected Smith College proxy carbon price signifies the institutional value of the
negative externality of carbon emissions in the unit of dollars per one metric ton of
carbon equivalent emissions ($/MTCO2e).
This background section outlines the various approaches for estimating the
price of carbon, which are: Integrated Assessment Models, government policy carbon
prices (carbon tax bills as well as cap and trade systems), carbon offset market
prices, and academic institution carbon prices. Chapter IV: Section C: Selecting the
Smith College Proxy Carbon Price discusses the various approaches to select the
proxy carbon price for Smith College.
Integrated Assessment Models
One common strategy to determine the proxy carbon price is to model
socioeconomic systems in the context of climate change through Integrated

28
Assessment Models (IAMs) (Nordhaus, 2015). IAMs model the complex world using
climate change predictions and socioeconomic damage modules. The key damage
variables within many IAMs are flooding, storm damage, heat-related mortality and
increased medical costs, lost agriculture product, increased energy costs, and loss of
biodiversity (National Academy of Science, 2017). These damages are quantified in
financial terms and then translated into an estimate of the social cost of carbon
emissions per one metric ton of carbon equivalent emissions.
Because Integrated Assessment Models provide future projections, they
require a discount rate to value the cost of carbon over time in net present values.
The discount rate represents the value of future generations as compared to the
present generation (Nordhaus, 2015). This is a highly contentious variable and
significantly alters the value of a carbon price. A very low discount rate suggests that
the future is worth nearly the same as the present, whereas a very high discount rate
suggests that the future is worth much less than the present. A justification for a high
discount rate it that economic growth and technological advances will prepare the
future for climate changes. However, the mounting threats of climate change
combined with economic uncertainty in a constantly changing world may suggest a
lower discount rate (Weitzman, 2013).
A review of the literature suggests that many IAMs underestimate the true
social cost of carbon (World Bank, 2017, Howard, 2014, Stern 2013, Stanford 2015).
For example some IAMs altogether neglect some critical variables like widespread
biodiversity losses, ocean acidification, large migration movements, as well as
vulnerable turning points of irreversible damage (Howard, 2014). With so many

29
variables with uncertainty it can be a bit like looking through “a fuzzy telescope”
(Nordhaus, 2015). While there are uncertainties in these estimates of the social cost
of carbon, they are better than the alternative, which is zero.
The United States federal government under the Obama administration tasked
the Interagency Working Group on the Social Cost of Carbon (IWG-SCC) with
determining the uniform federal price of one metric ton of carbon dioxide equivalent
emissions (IWG-SCC, 2016). The IWG-SCC reviewed three cutting edge Integrated
Assessment Models: DICE, FUND, and PAGE. The IWG-SCC suggested a range of
carbon prices roughly between $10 per MTCO2e to $100 per MTCO2e as shown in
Table 2 (IWG-SCC, 2016). The range is a result of calculation of the carbon price
with various climate and socioeconomic variables on the global scale (National
Academy of Sciences, 2017). The range of prices is a direct result of the different
discount rates applied to the calculation.
The Trump U.S. administration has revised the rate of the social cost of
carbon to include only domestic variables and has selected a high discount rate of
7%. In effect, this has caused a much lower value of the social cost of carbon that
does not capture the full cost. Additionally, the Trump administration also disbanded
the Interagency Work Group on the Social Cost of Carbon (Executive Order 13783,
2017).

30
Table 2- Interagency Working Group on the Social Cost of Carbon 2018 estimates from the 2016 update Technical Support Document Update. The conversion of $2007 to $2017 was completed using the Bureau of Economic Analysis implicit price deflator Gross Domestic Product (GDP) values for 2007 and 2017 (Bureau of Economic Analysis, 2018).
Discount Rate $2007/MTCO2e
(as reported by IWG-SCC)
$2017/MTCO2e
2.5% $60 $70
3.0% $40 $46
5.0% $12 $14
A recent study on an IAM by Stanford suggests a significantly higher carbon
price of $220 per MTCO2e (in 2014$) (Moore and Diaz, 2015). This is a particularly
interesting case because the researchers used the gro-DICE version of the DICE
model, which was also used in the federal study. This IAM estimate is unique
because it accounts for increased vulnerability of developing countries in the context
of climate change. Additionally, this approach integrates climate damages into
economic growth rate estimates, which effectively slows the rate of economic
growth. This is an important difference from most models because it does not assume
that climate damages can be overcome by economic growth (Moore and Diaz, 2015).
Government Carbon Prices
Another approach for determining the carbon price is to turn to government
carbon price policies. Smith College is located in the Commonwealth of
Massachusetts, which currently has three proposed carbon tax bills, which are: An
Act relative to creating energy jobs (HB 3473), An Act combating climate change
(SB1821) and An Act to promote green infrastructure, reduce greenhouse gas

31
emissions, and create jobs (SB1726) (MA Legislature, 2017). These bills all propose
a carbon tax with a moderate carbon price that escalates over time as shown in Table
3.
Table 3 Commonwealth of Massachusetts Proposed carbon tax bills in the Commonwealth of Massachusetts. The carbon prices begin with a weak price signal that steadily grows over time to a minimum of $40 per MTCO2e.
Commonwealth of Massachusetts Bill
Initial Price ($/MTCO2e) Price Trajectory ($/MTCO2e)
SB 1821 $10 Increase $5/year up to $40
HB 1726 $20 Increase $5/year up to $40
HB 3473 $15 Increase $10/year
Additionally, the Commonwealth of Massachusetts participates in a cap and
trade system for the electricity sector in the Northeast, which is called the Regional
Greenhouse Gas Initiative (RGGI) (RGGI, 2018). The cap and trade system operates
by selecting a maximum amount of allowable carbon emissions (cap) and then
allocating tradable permits for one metric ton of carbon equivalent emissions.
Electricity distributors can only emit carbon emissions for which they have a permit,
otherwise they must purchase carbon permits on the RGGI market (RGGI, 2018).
The price signal from this market price is much weaker when compared to
other estimates (Figure 4). The weak price signal is a result of a policy choice to cap
emissions at 2012 levels, rather than reduce emissions to a greater degree. Recent
developments in energy efficiency, clean technology, and renewable energy
integration contribute to the steady decline in emissions in the region resulting in a

32
cap that is too high. As a result, the demand for emission allowance permits fell and
consequently, the auction price dropped to a low value of about $3.00 per MTCO2e
in 2017, as shown in Figure 3 (RGGI, 2017). This price is unlikely to capture the full
social cost of carbon. Nor is it likely to influence consumer behavior significantly
because it is a weak price signal.
Figure 4- Regional Greenhouse Gas Initiative (RGGI) is a cap and trade system for the electricity sector in the Northeast. Notice that the price signal is low and fluctuates over time due to market mechanisms.
Looking to other countries with a carbon pricing schemes also offers a range
options for the price (Table 4). Sweden has the highest carbon tax in the world at
$140 per MTCO2e; France is at $36 per MTCO2e (World Bank and Ecofys, 2017).
One of the largest cap and trade systems in the world is the European Union
Emissions Trading Scheme to cap carbon emissions, which was auctioning permits at
about US$7 during 2017, reaching a peak of US$9.90 MTCO2e in July (European
Union Emission Trading Scheme, 2017). It is likely that countries will need a higher
carbon price signal as they seek deeper reductions in accordance to the Paris Climate
Accord (World Bank and Ecofys, 2017).

33
Table 4: Carbon Prices of select carbon taxes and cap and trade schemes of European countries in 2017.
Country Price per MTCO2e
Sweden, carbon tax $140
France, carbon tax $36
European Union Emissions Trading System (EU-ETS)
$7
Carbon Offset Market Price
Another method to determine the price for carbon is to use the market price
for carbon offsets. A carbon offset represents the emission reduction of one party
that is purchased by another party in order to compensate for an equivalent amount
of emissions. To be considered a valid carbon offset the emission reduction must be
additional, which means that the reduction would not occur without the investment to
reduce carbon emissions. Also the carbon emissions must be permanent (Terrapass,
2018). The price of the carbon offset varies based on the location of the project and
the project quality (Conte, 2010). The quality can vary by the type of project (i.e.
afforestation or energy efficiency investment) and the significance of the co-benefits
resulting from the project to reduce carbon emissions.
Offsets are typically measured per metric ton of carbon dioxide equivalent
emissions and can be purchased in international markets. The price of carbon offsets
range from as low as $2 per MTCO2e to over $70 per MTCO2e as documented in
Table 5 (Conte, 2010). Smith College experimented with generating carbon offsets
locally through the Community Climate Fund, which had a price of $32.70 per
MtCO2e, but the feasibility to generate enough offsets to compensate for emissions is
unlikely.

34
Table 5- Carbon offset market prices
Carbon Offset Market 2018$ per MTCO2e Source
Local ~$30 to $40 Community Climate Fund
Global ~$2 to $70 Carbon Catalog
Academic Institution Carbon Prices
Another approach for selecting the carbon price is to turn to peer academic
institutions in the United States that have already established a carbon price (Table
6). Yale University launched the Carbon Charge at $40 per MTCO2e in July of 2017
(Gillingham, et. al, 2017). This is a fixed carbon price (Picket, 2018). Princeton
University began using a proxy carbon price in 2008 with a carbon price at $35 per
MTCO2e value. Then, the price was raised to its current value of $45 per MTCO2e
(Weber, 2017). Arizona State University just began experimenting with proxy carbon
pricing at a price of about $10 per MTCO2e (Dalyrmple, 2018). It is likely that ASU
will raise the carbon price, but nothing has been established officially. Swarthmore
College has the highest carbon price of known academic institutions with a carbon
price at a value of $100 per MTCO2e (Swarthmore, 2017). The Swarthmore Carbon
Charge Committee selected this price in 2016 and has remained the same.

35
Table 6: United States Academic Institution carbon price values.
Academic Institution 2017$ per MTCO2e
Yale University $40
Princeton University $45
Swarthmore College $100
Arizona State University $10
To summarize, a carbon price represents the value of the negative externality
of climate change known as the social cost of carbon. In theory this value can be
determined, however, in practice there is a wide range of estimates for the value of
one metric ton of carbon equivalent emissions as shown in Figure 4.
Figure 5- Carbon Price Value: There is a wide range of carbon price estimates which are illustrated in ascending order.
Carbon Price Options
US
Dol
lars
201
8

36
Chapter III: Methods Section A: Process and Project Development
This Environmental Science & Policy honors thesis pursues scholarship
through interdisciplinary student research. The overarching research question of this
thesis is how can Smith College acknowledge carbon emissions in capital decisions
and other financial decisions? The purpose of the proxy carbon price is to internalize
the negative externality of the social cost of carbon emissions into financial
decisions. This thesis explores strategies for using the proxy carbon price.
Additionally, it demonstrates the proof of concept of two methods for using the
proxy carbon price through pilot projects.
These methods integrate the Strategic Plan initiative to use the Campus as
Classroom because the thiss involves a distinctive interplay between campus
operations and student engagement. Campus as classroom is an approach to teaching
that connects students and faculty to real-world challenges through experiential and
applied opportunities (Strategic Plan, 2016). Furthermore, this thesis seeks to find
solutions to the urgent problem of climate change.
Prior work by the Smith College Study Group on Climate Change (SGCC)
enabled me to complete this project. President Kathy McCartney tasked the SGCC
with examining how Smith College could most effectively respond to the global
challenge of climat change (McCartney, 2015). In response the SGCC published a
report in 2017 with a series of recommendations, including, “Develop an internalized
cost of carbon emissions—such as a carbon-proxy price—to help guide major capital
budget management and other decision- making processes” (SGCC, 2017).

37
Smith College asigned onto the Higher Education Carbon Pricing
Endorsement Intiative through Our Climate (Page, 2017). Additionally, the College
committed to a carbon neutrality goal of 2030 through the American & University
Presidents’ Climate Commitment (ACUPCC) (SCAMP, 2010). The SGCC
recommendation and these commitments collectively laid the foundation for my
thesis Design a Proxy Carbon Price to Strategy for Smith College.
To begin this research, I first asked the background research questions:
“What is a proxy carbon price and how does it operate? Who in the world is carbon
pricing right now? And, what approaches might inform the Proxy Carbon Price
Strategy for Smith College?” To answer these questions I completed a thorough
literature review of proxy carbon pricing as a strategy to mitigate carbon emissions.
Specifically, I investigated how academic institutions, businesses, and governments
around the world are using a carbon price.
Next, I narrowed in on academic institutions that are actively carbon pricing.
So I asked the research questions: “What carbon pricing strategies are other
academic insitutions using and why? What can I learn from the experiences of other
academic institutions and apply to the Smith College Proxy Carbon Price Strategy?”
To conduct the qualitative research to answer these questions, I attended the 2017
Advancement of Sustainability in Higher Education (AASHE) Conference in San
Antonio, Texas, to collaborate with other carbon pricing leaders at Yale University,
Princeton University, and Swarthmore College.
Next, I turned inward to investigate the current practices of Smith College in
order to determine where and how to incorporate a proxy carbon price into financial

38
decision-making. Therefore, I asked key stakeholders which were decision makers in
Facilites Management and Finance & Administration: “What are the current
practices for evaluating capital projects and long-term investments at Smith College?
Do you have any suggestions or concerns about the plan to design a Proxy Carbon
Price Strategy for Smith College?”
My background research and collaboration with Swarthmore College
suggested that integrating a proxy carbon price with a Lifecycle Cost (LCC) method
was very useful for evaluting capital projects (Swarthmore, 2017). Through
interviews with key stakeholders in the insitution I learned that the current practice
of capital project evaluation does not include a LCC. Therefore, I had to ask another
set of research questions directed at key stakeholders within the institution: “Should
Smith College incorporate LCC evaluations into capital projects?” The positive
response led me to the research questions, “What tool should Smith College use to
calculate the proxy carbon price? What are the parameters for this analysis at Smith
College?” These questions required qualitative research through internal and external
collaboration as well as detailed quantitative research of Smith College data and
Energy Information Agency data.
The final stage of this thesis was to actually apply the proxy carbon price to
pilot projects at Smith College. Therefore, I asked the research question: “What
type(s) of projects are best suited for experimenting with proxy carbon pricing? What
is the sensitivity of energy cost with respect to the proxy carbon price?” To answer
these questions, I conducted two pilot projects: Washburn House Retrofit and
Renewable Energy Credit Procurement. The Washburn House Retrofit pilot project

39
applies the method of Proxy Carbon Lifecycle Cost calculations, whereas the
Renewable Energy Credit Procurment pilot project utilized the method of using the
proxy carbon price to demonstrate the value of avoided carbon emissions resulting
from an investment.
Section B: Qualitative Research Methods
Internal Stakeholders
A primary goal of this thesis was to create a Proxy Carbon Price Strategy
specifically for Smith College. To fulfill this goal I needed to tailor the strategy to
the needs of the institution and integrate it into the current practices. This thesis
represents the co-creation of research through collabortion with faculty and staff
because I engaged with stakeholders from the early stages of research to the final
days of writing this research.
During the process of engaging stakeholders, I held in person interviews with
16 people on campus. I used the RAPID framework to identify which stakeholders to
meet with and to determine their role in the development of the Proxy Carbon Price
Strategy for Smith Collge. RAPID was originally developed by Bain & Company to
assist in designating roles project management and complex decision making that
involves many stakeholders (Bain & Company, 2006). The Harvard Business Review
gave a positive review of this framework for clarifying decision roles and assigning
responsibility in project management (Rogers, 2006). The roles are not mutually
exclusive so key stakeholders in the institution play multiple roles in the project
framework.

40
To assign roles to key stakeholders, I used the Smith College Organization
Chart, the staff directory, and advice from my advisors (Figure 7). The primary focus
within the Organizational Chart was the branch of Executive Vice President of
Finance and Administration. Specifically within this branch I engaged with members
of Facilities Management, Finance & Administration and Campus Sustainability &
Planning.
Figure 6- Smith College Organization Chart. All stakeholders were in the branch of the Executive Vice President of Finance and Administration. Source: Smith College, 2017
In the RAPID framework (Table 7) , the R represents the “recommend” role,
which provides the recommendation for the decision at hand. The A represents the
“agree” role which is the group of people who must be in agreement about the
recommendation for decision. The P represents the “perform” role which is the group
VP for Inclusion, Diversity & Equity
Provost and Dean of the
Faculty
Executive Vice President for Finance and
Administration
Vice PresidentFor
Public Affairs/Strategic Initiatives
Dean of the College and Vice President
for Campus Life
Vice President
forDevelopment
Religious and Spiritual Life
Class Deans
Dean of StudentsHealth ServicesResidence LifeStudent Affairs
Stu. Engagement
Human ResourcesCenter for Early Childhood Educ.
Disability Services
Academic Depts,
Programs and Centers
Associate Provost Botanic GardenCampus SchoolScience Center
InstitutionalResearch/Educ.
Assessment
Museum of Art
School for Social Work
Career Development
Revised: 8/22/2017
Associate VP for
DevelopmentCorporate and
Foundation Rel. Donor RelationsExecutive Educ.
Libraries
ControllerBookstore
Copy and MailPurchasingRisk Mgt/
Compliance
Board of Trustees
Chief Information Officer
(dual report to EVP for Finance and Administration)
Administrative Technology
Public AffairsMedia RelationsComm/Gov Rel.Communications
PublicationsWeb/New Media
Events Mgt.Event Planning
Conference Center
Summer and Non-Degree Programs
Smith Fund
Individual and Planned Giving
Educational Technology
Systems and Network
FinanceGrants Mgt.
BudgetFinancial Planning
Dining Services
Campus Police
Telecommunication
Facilities Mgt.
Rental Properties
Space Planning/ Env. Sustainability
Campaign Information
Security
Vice President forAlumnae Relations
and Executive Director of the
Alumnae Association
AlumnaeRelations
Work & Life
Vice Presidentfor
Enrollment
Athletics Multicultural
Affairs
TitleIX
Registrar
International Study
Associate Dean of the Faculty/Dean
for Academic Development
Jacobson CenterThe Spinelli Center
Graduate Study
Student Fin. Svcs.
Admission
President

41
of people who will put the recommendation into action. The I represents the “Input”
role which supplies the information to develop the recommendation. The D
represents the “Decide” role which is the group of people with the most power to
decide if the recommendation should be put into action. It is also the responsibility
of the Ds to ensure execution of the recommendation to meet the goals of the project
or decision at hand.
Table 7- RAPID framework to identify key stakeholders within the administration of Smith College.
Recommend ● Breanna Parker ● Advisors: Alex Barron, Dano Weisbord, Susan Sayre ● Committee on Sustainability (institutional carbon price)
Agree ● Sustainability Staff ○ Dano Weisbord
● Faculty ○ Susan Sayre (ENV, ECON) ○ Alex Barron (ENV)
● Facilities Management ○ Associate Vice President
■ Roger Mosier ○ Energy Manager
■ Matt Pfannstiel ○ Capital Construction Director
■ Peter Gagnon ○ Project Manager
■ Charlie Conant (Senior PM) ○ Facilities Business Director
■ Karl Kowitz ● Finance and Administration
○ Executive Vice President Finance & Administration ■ Mike Howard
○ Associate Vice President for Financial Planning ■ David DeSwert
Perform ● Facilities ○ Capital Construction Director
■ Peter Gagnon ○ Facilities Business Director
■ Karl Kowitz ○ Facilities Operations Director
■ Karla Youngblood

42
○ Energy Manager ■ Matt Pfannstiel
○ Project Managers ■ Charlie Conant (Senior PM) ■ Morgan Wilson ■ Brandy Fagan
○ 3rd party contractors ● Finance and Administration
○ Associate Vice President for Financial Planning ■ David DeSwert
● Sustainability Staff (Management & Update) ○ Director of Campus Sustainability & Space Planning
■ Dano Weisbord ○ Campus Sustainability Coordinator
■ Emma Kerr
Input ● Sustainability Staff ○ Director of Campus Sustainability & Space Planning
■ Dano Weisbord ○ Campus Sustainability Coordinator
■ Emma Kerr ● Faculty
○ Assistant Professor of Economics ■ Dr. Susan Stratton Sayre
○ Assistant Professor of Environmental Science & Policy ■ Dr. Alex Barron
○ Associate Professor of Engineering ■ Dr. Denise McKhan
● Facilities Management ○ Facilities Business Director
■ Karl Kowitz ○ Facilities Operations Director
■ Karla Youngblood ○ Vice President
■ Roger Mosier ○ Energy Manager
■ Matt Pfannstiel ○ Capital Construction Director
■ Peter Gagnon ● Finance and Administration
○ Executive Vice President Finance & Administration ■ Mike Howard
○ Associate Vice President Financial Planning ■ David DeSwert

43
Decide ● Facilities ○ Associate Vice President
■ Roger Mosier ● Finance and Administration
○ Executive Vice President Finance & Administration ■ Mike Howard
○ Associate Vice President Financial Planning ■ David DeSwert
● President ○ Kathy McCartney
● Board of Trustees
All of the internal stakeholder engagement was conducted through in-person
semi-structured interviews that lasted approximately one hour each. All stakeholders
that were interviewed for this qualitative research gave verbal and/or signed consent
to participate in the study 3. During these meetings I asked questions and fostered a
space for ideas to develop into dialogue (Questions can be found in Appendix 1, 2).
These meetings were not recorded, but I did take notes on the key points and answers
to my questions.
During the Fall Semester of 2017 I primarily met with the stakeholders in the
Input role of the RAPID framework. This round of interviews had the primary goal
of understanding the current practices of making capital decisions. Additionally, the
first round of stakeholder engagement was an opportunity to explain the concept of
proxy carbon pricing and to ask stakeholders if they were familiar with the concept
of carbon pricing. Furthermore, through individual meetings, I created a space for 3 The Smith College Institutional Review Board (IRB) concluded that “the IRB does not need to review this project because ‘the interview questions are about campus purchasing and capital planning policies and do not ask for the individual's attitudes or beliefs about the policies.’” The IRB did recommend receiving informed consent prior to conducting the interviews, which I did. Additionally I took the CITI ethics training prior to conduction interviews on October 11, 2017.

44
stakeholders to request features and make suggestions about the design of the proxy
carbon price strategy.
During the Spring Semester of 2017 I primarily met with stakeholders in the
Agree and Decide category. Most of these were group meetings within departments
(i.e. Facilities Management). This round of interviews had the primary purpose of
updating stakeholders on the research and development of the proxy carbon price
tool and framework. In particular, I worked in close collaboration with the Energy
Manager to determine the parameters for the tool. Broadly, the stakeholder
interviews during the spring semester was an opportunity for stakeholders to provide
feedback and ask questions.
External Stakeholders
I attended the annual Association for the Advancement of Sustainability in
Higher Education (AASHE) Conference in San Antonio, Texas during the
preliminary stages of my research. This proved to be very useful because I was able
to collaborate with other carbon pricing leaders at academic institutions early in the
developmental stage of the Proxy Carbon Price Strategy. Additionally I attended the
workshop, “Carbon Pricing & Higher Ed: Internal Carbon Fees, Shadow Prices for
LCA, Engaging Beyond the Campus.”
While at the conference, I interviewed the carbon price policy representatives
from Yale University, Princeton University, and Swarthmore College. I met with
each of them individually, in person, to ask questions regarding the carbon pricing
policy at their respective institution (Pickett, 2017; Winslade, 2017; Weber, 2017;
Graf, 2017). The style of the interview was semi-structured to allow ideas to

45
transform into dialogue. These interviews were not recorded, but I took notes on the
key points and answers to my questions. Upon return to Smith, I continued
collaboration through e-mail with carbon pricing leaders at Yale University,
Princeton University, and Swarthmore College for additional information during the
design and development phase of the proxy carbon price strategy.
Each interview lasted about 45 minutes to an hour and was composed of about
10 questions; these questions were the same for each interview (Appendix 3). At the
beginning of each interview I first explained the goals and objectives of my thesis to
Design a Proxy Carbon Price stategy for Smith College. Then, I began asking
questions regarding the details of their carbon pricing strategy. The key pieces of
information that I needed to know what the value of the carbon price, the carbon
price model, and the types of decisions that it applies to. Additionally, I asked if
there were any examples or key insights they could offer from their experience with
carbon pricing. Finally, at the end of each interview I asked for their contact
information and for any advice they had to offer.
Also at the AASHE conference I attended the workshop, “Carbon Pricing &
Higher Ed: Internal Carbon Fees, Shadow Prices for LCA, Engaging Beyond the
Campus” on October 18, 2017 with Dr. Alex Barron. The workshop was led by
Aurora Winslade, the Director of Sustainability, and Nathaniel Graaf, the Climate
Action Senior Fellow, both from Swarthmore College, and Casey Pickett, Director of
the Carbon Charge at Yale University. The workshop began with presentations on
the different carbon pricing models that each school was experimenting with.
Workshop attendees were encouraged to collaborate and discuss strategies for

46
integrating a carbon price into the financial plans of their respective academic
institutions.
Section C: Adapting the Harvard Lifecycle Cost Calculator for Smith College
I adapted the Harvard Lifecycle Cost Calculator (Harvard LCC) to the
specifications of Smith College to create the Proxy Carbon Lifecycle Calculator
(Proxy Carbon LCC) using Excel. This tool calculates the future and present costs to
understand the Lifecycle Costs over a 20 year study period (Harvard, 2018).
It was necessary to adapt the internal variables of the Harvard LCC calculator
to the specifications of the institution because utility rates and greenhouse gas
content vary by source (EIA, 2018; Verly, 2018). To adapt the Harvard LCC
Calculator, I interviewed the Sustainability Coordinator at Harvard University,
Caroleen Verly on March 1, 2018 (Verly, 2018). I called the Sustainability
Coordinator for a 30 minute interview to discuss the function of the Harvard LCC
and the adaptation (Harvard Readahead, 2018). Additionally, I collaborated with the
Smith College Energy Manager, Matt Pfannenstiel, to establish institutional variables
for the Proxy Carbon LCC.
The adaptation process for the the Proxy Carbon Lifecycle Excel tool
involved data content changes to align with institutional and regionally specific data
as well as aesthetic changes to promote the institutional brand. The variables of the
utility rates, escalation rates, and carbon emissions were modified to the Smith
College specifications because they vary according to campus infrastructure, the
region, fuel source, and escalation rate. Additionally, I created a new tab called
“Charts” to visualize the costs of each option. In this tab I created a stacked bar chart
47
to illustrate the initial net cost, operating & maintenance costs, utility costs, and the
proxy carbon costs. The lifecycle costs are displayed in net present value terms over
the 20 year study period. Each of these cells are linked to the data within the
calculator (as specified in the Excel comments for each cell) so that the charts will be
propogated simultaneously.
Marginal Utility Cost by Source
To begin the adaptation process, I first needed to identify the utility rates,
escalation rates, and carbon emissions that were specific to Smith College. My
primary sources for these data were Smith College Historical Utility Data
speadsheet, Smith College Master GHG spreadsheet ,and the United States Energy
Information Agency (EIA) databases (Pfannenstiel, 2017; Kerr, 2017; Energy
Information Agency, 2016, 2017). Then, the data was organized into a spreadsheet
that can be found in Appendix 4.
Once the rates were established, the data were changed within the respective
cells in the tab labeled “Price GHG Detail.” Additionally, the labels for the utility
columns of “Details_Baseline,” “Details_Alt A,” and “Details_Alt C” were also
changed. The final adaptation was for aesthetics; the Smith College logo was
inserted at the top of the calculator to promote the institutional brand.
To determine the marginal cost for heat and electricity I used the institutional
rates for Smith College. These rates are unique to Smith because the College has an
Combined Heat and Power plant (CHP) on campus. The CHP produces steam for a
turbine to produce electricity and then uses the steam to heat the buildings on
campus. These marginal costs for heat and electricity were obtained from the records

48
kept by the Energy Manager within Smith College Facilities Management department
(Pfannesteil, 2017).
Chilled water for cooling is produced through a dual source of commercial
electricity and steam from the CHP. To create chilled water the cogeneration plant
produces electricity to power four electric chillers and steam to fuel two absorption
chillers on campus. This dual source system does not have metering, which makes it
very difficult to determine the marginal prices and greenhouse gas content. For the
purpose of this pilot phase this project, the rate was estimated at $1.92/ton-day. To
calculate this value I used Smith College data analyzed by GreenerU to find the
electricity consumption per ton hour. Then I multiplied that by the cogeneration rate
of electricity and by 24 hours to find the rate per ton-day (Adamian, 2018). This
number should be revised as outlined in Future Work.
The marginal costs of the remaining variables of commercial electricity price,
fuel oil number 2 and 6, as well as transportation diesel and gasoline were derived
from the U.S. Energy Information Agency (EIA) databases (Appenix 4). The EIA
data varied in availability by geographic precision and most recent update. The fuel
oils data were selected at the national scale, the transportation diesel data were
selected at the New England scale, and the transportation gasoline data were selected
at the Massachusetts scale. Another small gap in data was the fuel oil #6 because the
EIA only had data available up to 2016, while the others had more recent updates of
2017. I chose to use the best available data for each source, rather than maintain
consistency across the geographic scale and time in the database. Nevertheless, I
maintained consistency of the source through the EIA database.

49
Escalation Rates by Source
Perhaps the most challenging part of adapting the Harvard LCC calculator
was estimating the escalation rates. An escalation rate is an estimate of the change in
price of a good or service over a given period of time. The escalation of each
variable is located in the column denoted “MTCDE” on the “Price GHG Detail” tab
of the LCC spreadsheet.The formula for estimating an escalation rate can be derived
from the formula to calculate compound interest, where P2 is the present value, P1 is
the past value, t is the time between P2 and P1 and e is the escalation rate over the
given period of time.
Equation 1- Escalation Rate
P2 =P1 (1+e)t
!!!!
= (1+e)t
(!!!!
)1/t=1+e
Escalation rate=(𝑷𝟐𝑷𝟏
)1/t-1
To conduct the analysis, three data sources were used in order to determine
the appropriate estimate of the escalation rates for utilities, labor, materials for the
life cycle cost calculator. The first method used historical data from Smith College to
determine the increase in price of water, electricity and natural gas. The second
method used data from the United States Energy Information System (EIA) for
commercial electricity, fuel oil #2, fuel oil #6, and transportation gasoline. The third
method used the Consumer Price Index for Urban Consumers (CPI-U) from the
Bureau of Labor Statistics for the variables of materials and labor (2018).

50
The reason why this historical analysis is limited to utilities is purely because
that was the only available data for analysis. Specifically, the time period 2010-2016
was selected to estimate the escalation because natural gas prices were relatively
stable during that time period. Extending the period beyond 2010 could be
misleading due to the external influences of the spread of hydraulic fracturing for
natural gas in the United States and the 2008 economic recession. The natural gas
projection is particularly relevant to Smith because the CHP plant on campus uses
natural gas. Consequently, the fluctuations in price of natural gas became embedded
into the institutional prices of electricity and steam because of the CHP plant. For
consistency, Smith historical data over the same time period was used to estimate the
escalation rates for water and electricity.
To be consistent among methods, the federal estimates based data from the
United States Energy Information System (EIA) on the of escalation rates for
commercial electricity, fuel oil #2 and #6, and transportation gasoline were selected
over a seven-year period from 2010-2016. Another reason for choosing a seven-year
time period is because the longer the time period for estimating an escalation rate,
the greater the uncertainty. Essentially, the farther into the future escalation rates
project, there is a greater likelihood for fluctuations in price due to global trade,
resource shortages or surpluses, and unexpected events like the 2008 economic
recession.
For the purpose of this study the escalation rates of labor and materials was
derived from the Consumer Price Index for Urban Consumers (CPI-U) from the
Bureau of Labor Statistics to identify the inflation rate for the most present year

51
(Bureau of Labor Statistics, 2018). The CPI-U is a measure of the average change of
prices of goods and services paid by urban consumers (Bureau of Labor Statistics,
2018).
Carbon Emission Rates by Source
The purpose of the proxy carbon price is to place a monetary value on
emissions that contribute to climate change in order to value them in project
evaluations. To do so, it is essential to know the carbon emission rate of each
variable of the Proxy Carbon Lifecycle Cost Excel tool. The marginal of each
variable is located in the column denoted “MTCDE” on the “Price GHG Detail” tab
of the Proxy Carbon LCC spreadsheet.
A question relevant to identifying the carbon emission rate for utilites at
Smith College is: how does the design of the campus’s energy infrastructure alter the
carbon emissions for electricity and steam? The campus has a combined heat and
power plant (CHP) that operates to produce electricity and steam for heat as
illustrated by Figure 8. This infrastructure design accentuates the need to use
institutional rates for carbon emission rates. However, the precise carbon emission
rates for electricity and steam to produce heat had not been determined at the time of
this study (Pfannenstiel, 2018).

52
Figure 7- A schematic of the Smith College Combined Heat and Power (CHP) plant.
Source: Smith College Consulting Engagement for Scamp 2.0 from the Energy Manager, Matt Pfannesteil.
To determine estimates for the carbon emission rate of the CHP, I
collaborated with the Energy Manager, Matt Pfannenstiel. We used the Greenhouse
Gas protocol tool “Allocation of Emissions from a Combined Heat and Power (CHP)
Plant” to identify emissions deriving from the Smith College CHP (Greenhouse Gas
Protocol and World Resource Institute, 2006). An assumption we made was to use
the total energy of steam and an enthalpy value that aligned with water vapor.
Additionally, we made the assumption to only use the primary source of natural gas
and omit the contribution of the fuel oil to determine the carbon emission rate of the
CHP. Therefore, this is a conservative estimate that should be refined as outline in
Chapter V: Future Work.
The first step to determing the carbon emission rate deriving from the CHP
was to determine the total carbon emissions of the CHP. To do so, we used the total
Campus
Cogen
Electric Grid
Natural Gas
3 Boilers
Absorption Chillers
Electric Chillers
Electricity
Steam
Detailed Current Centralized System
Chilled Water
Onsite PV

53
natural gas in the most recent year in units of cubic feet as criteria for the
Greenhouse Gas protocol tool “Allocation of Emissions from a Combined Heat and
Power (CHP) Plant”. Please note that for the year of 2017, the Power Plant Report
estimated the efficiency of the CHP incorrectly because the main meter was off by
8% when compared to the utility meter (Pfannenstiel, 2018). To adjust the value, a
factor of 1.08 was used to account for the meter discrepancy.
The next step was to break down the carbon emissions into the outputs of
electricity and steam for heat. For the purpose of the pilot phase the chilled water
carbon emissions was assumed to be equivalent to the Harvard estimate and was not
calculated using Smith data because it is not used very often and the production
process is very complicated which makes it very time consuming to determine. This
number should be refined by future work. The total annual quantity of steam and of
electricity was identified from Spreadsheet data and converted into the common unit
of MMbtu.
Once the total quantity of steam and electricity was found, the two primary
outputs were added together to determine the total energy output of the CHP. The
next step was to find the percent of energy used to produce steam or electricity
(Equation 1.2). Finally, Equation 1.3 describes the carbon emission rate for steam as
a proportion of the total emissions resutling from energy production (Equation 1.3).
The last calculation brought the outputs together again to find the carbon emission
rate of the CHP overall in units of MTCO2e per MMBtu (Equation 1.4).

54
Equation 2- Percent of Energy to Produce a MMbtu of steam at the Smith College CHP plant
𝑃𝑠 =𝑇𝑠𝑇𝑐ℎ𝑝
Equation 3-Effective Marginal Carbon Emissions of Steam at the Smith College CHP plant
𝐸𝑓𝑓𝑒𝑐𝑡𝑖𝑣𝑒 𝑀𝑎𝑟𝑔𝑖𝑛𝑎𝑙 𝐶𝑎𝑟𝑏𝑜𝑛 𝐸𝑚𝑖𝑠𝑠𝑖𝑜𝑛𝑠 𝑜𝑓 𝑆𝑡𝑒𝑎𝑚 =𝑃𝑠 ∗ 𝐺𝑐ℎ𝑝
𝑇𝑠
Equation 4- Carbon equivalent emissions from the Smith College CHP plant
𝐶𝑎𝑟𝑏𝑜𝑛 𝑒𝑞𝑢𝑖𝑣𝑎𝑙𝑒𝑛𝑡 𝑒𝑚𝑖𝑠𝑠𝑖𝑜𝑛𝑠 𝑜𝑓 𝐶𝐻𝑃 =𝐺𝑐ℎ𝑝𝑇𝑐ℎ𝑝
Where,
Ps=Percent of Energy to produce steam
Ts=Annual Total Steam
Tchp=Annual Total Energy CHP
Gchp=Annual Total Greenhouse Gas CHP
The same methods were used to determine the carbon emission rate for
electricity.
The carbon emission rates for the remaining variables of commercial
electricity, fuel oils, and transportations fuels were obtained from the Office of
Campus Sustainability Records (GHG Master Spreadsheet, 2017; Emma Kerr, 2018).
These institutional values were derived from the University of New Hampshire
Campus Carbon Calculator. A key variable that is dependent on the region is the
carbon emission rate of commercial electricity because ISO-NE has a lower fossil
fuel intensity than the national grid (ISO-NE, 2016). One modification was made to
the transportation diesel because the campus fleet uses B20 diesel, which is a biofuel
blend that has a smaller carbon emission rate than traditional diesel (GHG Master
Spreadsheet, 2017).

55
Section D: Pilot Projects This section describes the methods for two proxy carbon price pilot projects:
Washburn House Retrofit and Renewable Energy Credit Procurement. These pilot
projects will respectively demonstrate the proof of concept of using the Proxy
Carbon Lifecycle Cost Calculator method and the proxy carbon price to demonstrate
the value of avoided carbon emissions resulting from an investment.
Washburn House Retrofit
The Washburn House Retrofit pilot project used the Proxy Carbon Lifecycle
Cost Calculator method to analyze three options: 1) Existing Baseline, 2) retrofit to
seal the envelope of the building prevent thermal convective loss, and 3) retrofit to
seal the envelope and insulate the walls to improve the thermal blanket. The data
needed for the calculator is the initial cost, the replacement cost (if it differs from the
initial), the operating and maintenance costs, the annual utility demand, and the
anticipated lifetime of the project.
For the purpose of this pilot project the escalation rate for steam (the energy
source that will be impacted by the retrofit options) was 3.34% and the institutional
discount rate was 4.00% (Pfannesteil, 2017; DeSwert, 2017). The current Facilities
practice is a payback period for energy efficiency projects is a 5-year payback period
(Pfannesteil, 2017). The proxy carbon price for this pilot project was $70 per
MTCO2e (Committee on Sustainability, Parker, 2018).
The cost and energy data for this pilot project was derived from an
engineering thesis by Etta Grover Silva which was supervised by the Associate
Professor of Engineering, Dr. Denise McKahn (Grover-Silva, 2010). The utility

56
energy data of the Grover-Silva thesis are likely to be reliable because the results
were verified using actual metered data on heating energy consumption for a full
heating season in 2016-2017 for Lawrence and Morris houses. The post-retrofit
consumed within 5% of the predicted amounts using the categorical method
(McKahn, 2018).
Specifically, I used the data from the Graphs spreadsheet for initial cost and
the utility data for thermal energy demand (steam from CHP) (Grover-Silva, 2010).
There was not data on the operating and maintenance costs so they were assumed to
be zero to avoid fabricating data. Also, the anticipated lifetime was not given by the
data so it was assumed to be 21 years to avoid the replacement cost and retaining
value over the 20-year Proxy Carbon Lifecycle Cost calculation. Also it is important
to note that the initial costs for each retrofit option were in $2010. Therefore, I had to
convert the costs into $2017. To do so I used the Bureau of Economic Analysis GDP
deflator factor for 2010 and 2017 (Table 8). Furthermore, there is a risk that these
data are out of date, but it was the best available data for these specific retrofit
options.
Table 8- The conversion of costs from 2010$ to 2017$ of each Washburn Retrofit option.
2010 2017
GDP deflator 100.5 112.8
Initial Cost: Sealing $1,800 $2,019
Initial Cost: Sealing + Insulating the Walls
$12, 095 $13, 567

57
Table 9- Annual energy use of each Washburn retrofit option.
Option Thermal Energy Use (MMBTU/year)
Baseline 645
Sealing the envelope 537
Sealing the envelope and Insulatig the
walls
428
Once the data had been collected for Table 8 and 9, I then used the “Input”
tab of the Proxy Carbon Lifecycle Cost Calculator. It is important to note that I
included the proxy carbon price value of $70/ MTCO2e. Then, I analyzed the data
using the “Results” and “Charts” tab of the Proxy Carbon Lifecycle Cost Calculator.
Renewable Energy Credit Procurement
The Renewable Energy Credit (REC) Procurement evaluation utilized the
proxy carbon price to demonstrate Smith College’s value of avoided carbon
emissions resulting from the RECs. A REC certifies ownership of one Mega-Watt-
hour of renewable electricity and has a market value in units of dollars per Mega-
Watt-hour ($/MWh) (EPA, 2017). The standard unit from the proxy carbon price is
dollars per metric ton of carbon dioxide equivalent ($/MTCO2e). Therefore, it is
possible to translate the proxy carbon price into the units of $/MWh to compare the
value of the REC to the proxy carbon value of avoided carbon emissions.

58
Equation 5- This equation translates the proxy carbon price from the unit of $/MTCO2e to the unit of $/MWh for equal comparison to the Renewable Energy Credit (REC) price.
𝑃𝑟𝑜𝑥𝑦 𝐶𝑎𝑟𝑏𝑜𝑛 𝑉𝑎𝑙𝑢𝑒 𝑜𝑓 𝐴𝑣𝑜𝑖𝑑𝑒𝑑 𝐶𝑎𝑟𝑏𝑜𝑛 𝐸𝑚𝑖𝑠𝑠𝑖𝑜𝑛𝑠 = 𝑃𝑟𝑜𝑥𝑦 𝐶𝑎𝑟𝑏𝑜𝑛 𝑃𝑟𝑖𝑐𝑒 ∗ 𝐶𝑎𝑟𝑏𝑜𝑛 𝐸𝑚𝑖𝑠𝑠𝑖𝑜𝑛 𝑅𝑎𝑡𝑒
Where,
𝑃𝑟𝑜𝑥𝑦 𝐶𝑎𝑟𝑏𝑜𝑛 𝑃𝑟𝑖𝑐𝑒 =$
𝑀𝑇𝐶𝑂2𝑒
𝐴𝑣𝑜𝑖𝑑𝑒𝑑 𝐶𝑎𝑟𝑏𝑜𝑛 𝐸𝑚𝑖𝑠𝑠𝑖𝑜𝑛 𝑅𝑎𝑡𝑒 =𝑀𝑇𝐶𝑂2𝑒𝑀𝑊ℎ
Because,
𝑃𝑟𝑜𝑥𝑦 𝐶𝑎𝑟𝑏𝑜𝑛 𝑉𝑎𝑙𝑢𝑒 𝑜𝑓 𝐴𝑣𝑜𝑖𝑑𝑒𝑑 𝐶𝑎𝑟𝑏𝑜𝑛 𝐸𝑚𝑖𝑠𝑠𝑖𝑜𝑛𝑠 =$
𝑀𝑊𝐻=
$𝑀𝑇𝐶𝑂2𝑒
∗𝑀𝑇𝐶𝑂2𝑒𝑀𝑊ℎ
The data for the greenhouse gas emission rate was derived from the ISO-NE
regional grid because the RECs would eliminate the need for commercial electricity
and thus avoid the corresponding carbon emissions. The carbon emission rate for
ISO-NE was 0.38 MTCO2e per MWh in 2018 at the time of this study (ISO-NE,
2018). The rate varies according to Locational Marginal Units and time (LMUs). A
LMU represents the marginal unit of energy that responds to the constantly changing
electrical system demand by providing the next increment of electricity (Lau and
Wong, 2015).

59
Chapter IV: Results and Discussion Section A: Lessons from governments, businesses, and academic institutions Carbon pricing is an environmental economic strategy to mitigate carbon
emissions. Governments around the world are considering implementing carbon
price policies, especially in the wake of the Paris Climate Accord. On a local level,
the state of Massachusetts has three proposed carbon tax bills, which are gaining
traction.
As carbon regulation continues to grow, businesses are responding by
modeling a carbon-constrained world using internal carbon pricing schemes. As of
2017, over 1,300 businesses reported that they plan to, or are already, using an
internal carbon price in their business strategy (CDP, 2017). The primary reasons
that businesses use an internal carbon price is to manage the financial risk of
regulation and carbon commitments and to highlight opportunities to transition a
low-carbon company. Furthermore, businesses are using an internal carbon price to
gain social capital by indicating to investors that they are a climate conscious
company.
Academic institutions are using internal carbon prices as a way to align the
missions of education and sustainability to the operations of the institution. Prior to
this research there was not documentation on which academic institutions use an
internal carbon price. As of 2018, there are over 40 academic institutions out of
5,300 in the United States that have endorsed using an internal carbon price (Our
Climate, 2016). According to the research, there are only 4 are actively using an
internal carbon price, which is starkly less than the number of businesses around the

60
world. Currently, Princeton University, Yale University, Swarthmore College, and
Arizona State University are experimenting with internal carbon pricing (Yale
Carbon Charge Task Force, 2016; Princeton University, 2008; Swarthmore College,
2017; Dalrympe, 2018). This results section describes the models of all active
internal carbon pricing models at academic institutions in the United States as shown
in Table 10. Furthermore, this section describes lessons from other academic
institutions that can be applied to the Smith College proxy carbon price strategy.
Princeton University has the oldest carbon pricing policies of the academic
institutions. In 2008, the University began using a proxy carbon price in capital
decisions within the facilities department (Princeton University, 2008). To
incorporate the proxy carbon price into financial decisions the Director of
Sustainability created an Excel spread-sheet tool to calculate the lifecycle cost of
operating and maintenance costs (Weber, 2017). The Excel tool calculates the
present value of lifecycle costs with the proxy price, over a 60-year period. This is
the only financial metric it calculates, but it also included a tab specifically for
qualitative comparisons among the alternative project options.
While the Princeton carbon pricing policy has been operating for the longest
time, there is currently no analysis of outcomes of using the proxy carbon price. The
initial institutional carbon price was $35 per metric ton CO2e but it was later raised
to $45 per metric ton CO2e. Initially, the proxy carbon price did very little to impact
decisions, but later the price was raised to send a stronger price signal (Weber,
2018). However, even after the increase, the proxy price has altered very few
decisions, but not zero (Weber, 2017).

61
It is my hypothesis that the proxy carbon price used by Princeton has only a
small impact on total cost of large capital projects and, consequentionally, it has not
altered many capital decisions. Furthermore, the Princeton University’s calculator
does not use the proxy carbon price to evaluate payback periods or other financial
criteria that may alter capital decisions, which may be another reason why it has not
altered any capital decisions. Without sufficient project data it is not possible to test
the hypothesis.
Princeton University provided an important lesson for Smith College: Once
the proxy carbon price strategy is in place, it is essential to record project data and to
document the reason why particular alternatives were selected. Carbon pricing is a
relatively new strategy that is worth testing and refining. In order to effectively
experiment with an internal carbon price, it is important to assess the impact of the
price signal. This can be done by evaluating proxy carbon priced projects
retrospectively and then recording and later applying key findings.
Yale University launched the Yale Carbon Charge Project in July of 2016 to
experiment with a revenue neutral carbon fee (Yale Carbon Charge Task Force.
2016; Gillingham, K., et, al., 2017) This internal carbon price model strongly aligns
with the regulatory risk approach because it is designed to mimic a revenue neutral
carbon tax. Furthermore, the initial price of the carbon charge was selected at $40
per MtCO2e, but is not escalating (Yale Carbon Charge Task Force, 2016).
The Carbon Charge operates by measuring the carbon emissions from each
administrative unit (e.g. Chemistry Department, Provost) and levying the carbon fee
on their share of emissions (Pickett, 2017).This policy structure is enabled by the use

62
of electricity meters to record the coorresponding carbon emissions of the buildings
of each administrative units. To minimize the impact on the administrative unit’s
budget while maintaining the carbon price signal, the revenue is rebated to be
revenue neutral. At the end of each fiscal year the emissions from each
administrative unit is compared to the emissions baseline. Based on performance,
each administrative unit recieves their proportional rebate to mitigate the impact of
the fee. If the administrative unit emissions are less than the baseline, then the rebate
will be postive. An administrative unit can maximize its rebate by reducing carbon
emissions significantly below the baseline, which provides a clear incentive.
A key finding from the Yale report, Preliminary Results from Learning by
Doing that is applicable to Smith is, “The combination of clear information and a
carbon pricing scheme increases understanding, motivation, and action for reducing
energy use at Yale” (Yale Carbon Charge Task Force, 2016). With the right
information and price signal a university can utilize the creative minds of many and
lower emissions collectively. A clear benefit of a carbon pricing strategy is that it is
a way to start communicating and considering carbon emissions on campus. This was
also supported by Swarthmore College which emphasizes the importance of
engagment and education through their shadow price policy (Winslade, 2017).
The Swarthmore Carbon Charge Program is a dual approach to carbon pricing
because it utilizes both a carbon fee to departments and a proxy price to evaluate
capital purchases (Swarthmore, 2017). The program began in 2016 with goals to
incentivize emission reductions, to provide capital for emission reducing projects, to
create a platform to educate and engage the community in carbon pricing.

63
Swarthmore College is also taking an activist role to build momentum for
governmental carbon pricing by collaborating with Our Climate (Swarthmore, 2017;
Our Climate, 2017).
Swarthmore implemented an annual charge on each department or office
budget to generate capital for emission reducing projects. The Carbon Charge
Committee charges a rate of 1.25% on each of office and department for their carbon
use, but excludes charging individuals through salaries and benefits (Swarthmore,
2017). In the first year it totaled $340,000, which included an additional $40,000 of
voluntary donations to the Carbon Charge to support sustainable projects (Winslade,
2017). The Swarthmore Carbon Charge is also revenue neutral because all of the
collected fees are returned to the departments. What makes this policy different from
Yale’s revenue neutral carbon fee is that all departments receive equal rebates,
regardless of performance.
A critique of this particular revenue neutral fee method is that the fee and
rebate is not correlated to carbon emissions. Instead, the fee is equal proportion of
1.25% of the budget for each department. Because it is only a financial charge, the
carbon fee does not account for emission reductions in the same way as regulatory
revenue neutral carbon taxes or the Yale revenue neutral carbon fee model. For
instance, if one department lowers emissions and another stays the same, they would
both have the same charge. As a consequence of this design there is not a strong
incentive for departments to reduce emissions because if a department lowers its
emissions from one year to the next, they will be charged the same amount as a
department that does not lower its emissions. Nevertheless, incorporating a carbon
64
fee into the budget of each department is beneficial because it awknowledges carbon
emissions and may stimulate discussions on carbon emission reduction strategies.
Swarthmore College also uses a proxy carbon price to evaluate capital
projects as part of the Carbon Charge (Swarthmore, 2017). The shadow price
provides a framework for incorporating the costs of carbon into Capital Planning and
Project Management for evaluating alternatives of facilities projects (Winslade, Graf,
2017). In order to contextualize the carbon price Swarthmore conducts a lifecycle
cost calculation to determine the initial and future costs over a 20-year period. For
implementation, Swarthmore adapted the Harvard Lifecycle Cost analysis calculator
to their institutional specifications and also to include the proxy carbon price of $100
per metric ton CO2e (Swarthmore, 2017; Winslade, 2017; Graf, 2017). At the time of
this study, Swarthmore has not published any results because the policy was
implemented about a year ago.
Nonetheless, Swarthmore College provided Smith College with insights on
how to make the proxy carbon price functional for evaluating capital project options
by integrating the proxy carbon price into a Lifecycle Cost (Winlade, 2017; Graf,
2017). Swarthmore measures the lifecycle cost over a designated study period and
applies a proxy price to carbon emissions for evaulating facilities projects in Capital
Planning and Project Management. Swarthmore College adopted a proxy carbon
price to establish a metric for informing capital decisions. To conduct the proxy
carbon price lifecycle costing evaluations, Swarthmore adapted the Harvard
Lifecycle Cost Calculator, which is unique because it includes a carbon price cell.

65
The calculator is highly accessible because it is an Excel tool that is available online,
for free.
This research found another academic instituion that is experimenting with a
proxy carbon price, however nothing official has been written to date (Weber, 2018).
Arizona State University (ASU) is actively experimenting with a proxy carbon price
of about $10 per MTCO2e in select projects ((ASU) Dalrymple, 2018). Specifically,
they are incorportating a proxy price into the financial plan for new carbon neutral
buildings and EV charging stations, as well as their template for evaluating projects
for the Sustainability Investment Revoling Fund (SIRF). Once the pilot projects have
been evaluated, ASU will considering developing an institutional proxy carbon price
strategy to help drive achievement towards sustainability goals ((ASU) Dalrymple,
2018).
Another academic that is considering, but not actively, experimenting with
carbon pricing is Vassar College. The Vassar Climate Action Plan stated that the
College should considering implementing an internal carbon charge (Vassar, 2016).
The report suggested adopting a carbon fee or a proxy carbon price to capital project
evaluations. Like Swarthmore and Princeton, Vassar would like to design a lifecycle
costing tool to contextualize the proxy carbon price with other financial costs. Vassar
indicated that they were likely to adopt a social cost of carbon estimate from the U.S.
Environmental Protection Agency (EPA). This research could not confirm Vassar
College has taken action beyond the white paper “Vassar Climate Action Plan”
(Vassar, 2016).

66
Table 10: Academic Institutions in the United States actively using a carbon price. This table includes the policy type and year of implementation.
Academic Institution Carbon Price Policy Year of Implentation Princeton University Proxy Carbon Price 2008 Yale University Revenue Neutral Carbon
Fee 2016
Swarthmore College Proxy Carbon Price & Revenue Neutral Carbon
Fee
2016
Arizona State University Proxy Carbon Price 2018
Section B: Insights from the Institution
Interviews with key stakeholders indicated that the current practices of
evaluating capital projects at Smith College does not include a carbon price and
rarely includes a lifecycle cost calculation, except for the largest capital projects,
such as the Neilson Library renovation (Pfannenstiel, 2017; Gagnon, 2017; Kowitz,
2017). Instead the financial criteria for most projects are the initial price and the
payback period (Pfannenstiel, 2017; Kowitz, 2017; Mosier, 2017). Additionally,
there are a host of other qualitative decision metrics such as sustainability, reliability,
performance, contracts, and business characteristics that are used to inform capital
decisions (Kowitz, 2017). These dynamics result in a semi-structured framework for
making capital decisions.
The current structure of making capital decisions is very centralized within
Facilities management (Mosier, 2018). Additionally, the institutional infrastructure
lacks energy metering for buildings and departments (Pfannenstiel, 2018). These
factors are reasons why the College does not have individual energy budgets for each
department. This differs from Yale and Swarthmore, which have decentralized
budgeting and energy metering, which enables the deployment of the revenue neutral
carbon fee method. The policy choice to use the proxy carbon price method is best

67
suited for Smith College because the institution has centralized decision-making and
lacks energy metering at the granular department level.
The proxy carbon price strategy is an opportunity to provide more structure to
capital project evaluations in Facilities Management. In a meeting with the Project
Managers, they advised that the proxy carbon price be deployed in the program and
conceptual design phases of project development (Facilities Meeting, 2018). The
evaluation could be completed internally be project managers or by third party
contractors for long-term capital projects (Facilities Meeting, 2018; Pfannesteil,
2017).
Another observation from interviews with Smith stakeholders is that the
current practice for record keeping of capital project data is not very well organized.
There is a shared drive on the computers of Facilities Management that contains
many folders, spreadsheets, and data. However, the data is not organized in an
accessible way for everyone to locate the data they need (Pfannenstiel, 2018;
Gagnon, 2017). Therefore, the current practices for data storage is not clear where
information is stored and results in a lack of transparency about project information.
Additionally, I noticed that some spreadsheets were not completed with all of the
project information. The lack of transparency and complete record keeping proved to
be a significant challenge for acquiring the necessary data for the Proxy Carbon
Lifecycle Cost pilot projects.
The interest for internal carbon pricing at Smith College began in 2016
through a memo from Dr. Alex Barron, assistant professor of Environmental Science
& Policy (Memo, 5-24-16). This strategy gained the support of the Study Group on

68
Climate Change, which included a request in the 2017 report to develop an
“internalized cost of carbon- such as a proxy carbon price” to create institutional
change at Smith College (SGCC, 2017). The results from qualitative interviews with
stakeholders in Facilities Management Finance & Administration indicate that the
foundational work for proxy carbon price at Smith College was successful because
many of the stakeholders were already familiar with the concept of carbon pricing
(Pfannenstiel, 2017; Gagnon, 2017; Kowitz, 2017, DeSwert, 2017; Howard, 2017).
The institutional support for this thesis enabled fluid conversations that garnered
further support for the proxy carbon price strategy at Smith College.
Already, the initial interest is gaining support for tangible action to implement
the proxy carbon price strategy and lifecycle cost tool from key stakeholders in the
Facilities Management and Finance & Administration departments at Smith College.
Mike Howard communicated support of the adoption of Lifecycle Costing integrated
with the introduction of proxy carbon pricing at Smith College, “Understanding the
full lifecycle costs of our capital projects, including the cost of carbon, will allow the
college to understand the full cost of capital projects. With this information at hand,
Smith will now be able to better allocate scarce capital to projects that will have the
most significant positive impact on the college in the long term” (Howard, 2018).The
Capital Construction Director, Peter Gagnon shared, “I am very excited to
experiment with Breanna Parker’s Proxy Carbon Lifecycle Cost (Proxy Carbon LCC)
calculator and will encourage my project managers to do the same. I believe with the
use of the Proxy Carbon LCC calculator, Capital Projects will move forward with a

69
more formalized analysis of the true costs of our decision making when related to
new and renovation projects.”
Section C: Selecting the Smith College Proxy Carbon Price Value
In order to develop the Proxy Carbon Price Strategy, Smith College must
select a value for the proxy carbon price. The Smith College Committee on
Sustainability met on March 28, 2018 to select the proxy carbon price for Smith
College (COS Memo, 3-28-18). There is no single correct way to select the level of
a proxy carbon price, but it is clear that any value is an improvement over zero.
There are a wide variety of carbon price as illustrated in Figure 9.
Figure 8- Carbon prices from governments, business, markets, and academic institutions.

70
There are a few strategies for selecting the proxy carbon price from the wide
range of price, which include the following approaches: pragmatic, social cost of
carbon, regulatory, implicit price, or aligning with peer institutions. The pragmatic
approach suggests simply picking a number that works for the institutions and then
refining the number as needed. The implicit price approach uses the carbon for the
cost to achieve a carbon emission reduction target or goal. The social cost of carbon
approach uses Integrated Assessment Models to determine the financial damage of
carbon emissions on the economy and society. Aligning with peers is an approach
particularly relevant to academic institutions.
The social cost of carbon approach reflects the estimate of socio-economic
damages resulting from climate change (Nordhaus, 2015). In theory, this reflects the
true negative externality of carbon emissions. However, in practice Integrated
Assessment Models (IAMs) are used to estimate the value and include uncertainties.
The Interagency Working Group on the Social Cost of Carbon estimate the social
cost of carbon using IAMs. At a discount rate of 2.5% the social cost of carbon in
2018 is $70 per MTCO2e (IWG-SCC, 2016).
The regulatory risk approach to carbon pricing is used extensively by
businesses to prepare for future carbon regulation. Currently, the state of
Massachusetts participates in the Regional Greenhouse Gas Initiative (RGGI), which
is the existing financial risk of carbon emissions (RGGI, 2018). The current market
price is very near the price floor, which results in a weak price signal (~$4 per
MTCO2e). While a Federal climate policy seems unlikely in the next few years, there
are several carbon tax bills are under consideration in the Massachusetts legislature

71
(MA Legislature, 2017). These proposed carbon tax bills are evidence of future
regulatory risk of carbon emissions.
The implicit price approach models the cost of carbon offsets to achieve the
2030 carbon neutrality goal (Smith College, 2010). Carbon offsets are created by
reducing emissions (e.g. planting trees, capturing methane) and then sold in
voluntary (or regulatory) markets. However, the carbon offset price to reduce a
metric ton of carbon is wide-ranging and varies based on quality and type of the
offset (Forest Trend Ecosystems Marketplace, 2017). Smith has been collaborating
with Hampshire, Williams, and Amherst College on the Community Climate Fund to
generate local carbon offsets through investments in emission reduction projects, but
the costs are higher than other voluntary offset products (Weisbord, 2017). The wide
range of prices makes it difficult to narrow in on an institutional proxy carbon price.
This approach results in a range of less than $2 per MTCO2e for a low quality carbon
offset to over $70 per MTCO2e for a high quality and/or local carbon offset.
Another approach for selecting the price is to compare across the carbon
prices of our peer institutions. Princeton University began using a proxy carbon price
in 2008 with a carbon price at $35 per MTCO2e (Princeton University, 2008). The
price was later raised to its current value of $45 per MTCO2e (Weber, 2017). Yale
University launched the Carbon Charge at $40 per MTCO2e in July of 2017
(Gillingham et al., 2017). Swarthmore College has the highest carbon price at
academic institutions with a value of $100 per MTCO2e, which was established in
2017 (Swarthmore College, 2017). This approach results in a range of $35 to $100
per MTCO2e.

72
After reviewing these approaches, Dr. Alex Barron and I recommended that
Smith College select the price range of $60 to $70 per MTCO2e. This price range is
consistent with the IWG-SCC social cost of carbon estimate at 2.5% discount rate
which place a higher value on the impacts on future generations and may better
reflect the true social cost of carbon (IWG-SCC, 2016; Moore & Diaz, 2015).
Furthermore, this price is consistent with a trajectory towards 2 degrees Celsius
(Barron, 2018). This also aligns with the implicit price approach because there is a
greater supply of local offsets with educational and community co-benefits at this
price range. Additionally, this price will more than prepare for future climate
regulation because it is higher than the carbon prices of the RGGI cap and trade
system and the initial price of the proposed Massachusetts carbon tax bills. The final
reason for selecting this price is because it is the “goldilocks” price between our peer
institutions.
The Smith College Committee on Sustainability selected the recommended
range of $60 to $75 per MTCO2e for the proxy carbon price on March 28, 2017. For
the purpose of this thesis, I aligned with the Interagency Working Group on the
Social Cost of Carbon estimate of the 2018 social cost of carbon at a 2.5% discount
rate to select the proxy carbon price of $70 per MTCO2e (IWG-SCC, 2016). As
stated in the Recommendations section, the proxy carbon price should be reviewed
and evaluated to ensure that it is effective.
Section D: Proxy Carbon Price Strategy Integration Methods
The following strategy describes how the proxy carbon price can be used to
make informed decisions about reducing carbon emissions through a new investment.

73
The primary purpose of using a proxy carbon price is to acknowledge the social cost
of carbon emissions in financial decisions. In general, the proxy carbon price
represents the value of avoided carbon emissions resulting from an investment or
purchase. For cases that include capital and operating costs, the proxy carbon price
should be incorporated into the Lifecycle Cost method for financial decision-making.
A Lifecycle Cost Calculation is a standardized approach to evaluating the
present and future of costs of project alternatives to make more informed decisions
(Testa, et.al, 2011). Typically, an LCC includes the costs of initial price, utility,
operation, maintenance, and replacement price minus the projected residual value of
a project over a study period (Harvard, 2017). Incorporating a proxy carbon price
into the lifecycle costing methods illustrates the social cost of the carbon content
alongside other operating and maintenance costs in the common metric of money.
Hereafter, the method for integrating the proxy carbon price with the Lifecycle Cost
method shall be called the Proxy Carbon Lifecycle Cost method (Proxy Carbon
LCC).
The Proxy Carbon Lifecycle Cost (Proxy Carbon LCC) method is particularly
well suited for informing long-term decisions. The Proxy Carbon Lifecycle Cost
method should be used to compare across project options that perform the same
function 4(ASTM, 2017). At a minimum, this method illustrates the financial metrics
of total cost of ownership and the payback period for each project option. Therefore,
4 This method is best suited for comparing across options once the capital project has been selected. For example, this method could be used to evaluate a relighting project. The options could be the baseline of halide light bulbs, fluorescent lights, and LED. All options perform the same function of lighting a building, but have different initial costs, expected lifetimes, and energy use.

74
this method is especially well suited for projects with a substantial percentage of the
total costs occur during operation (i.e. energy, maintenance) with respect the initial
market price. (Engineering Economy, 2006; Woodard, 1997; ASTM, 2017). This
method of using a proxy carbon price illustrates how the carbon price signal can
indicate which option is most economically efficient when considering the negative
externality of carbon emissions via the proxy price. Incorporating the proxy carbon
price alters the total cost of ownership, as well as the payback period of projects, by
internalizing the social cost of carbon into financial accounting.
Additionally, this method can be used to highlight opportunities to mitigate
carbon emissions. A Proxy Carbon LCC evaluation would inform the decision maker
if the new sustainable option has operational cost- and carbon- savings to justify the
investment. The baseline “do nothing” option would not have an initial investment,
but would result in higher operation costs for utilities and carbon emissions. Whereas
a lower carbon investment option would have an initial cost, but would have lower
operating costs for utilities and carbon emissions. Therefore, the Proxy Carbon LCC
would illustrate if the cost savings from the utilities and proxy carbon price justify
the low-carbon investment, with respect to the baseline “do nothing” option.
In order to conduct a Proxy Carbon LCC calculation for a capital project, a
decision-maker must have a tool to evaluate the lifetime of costs. The primary reason
for this is because the calculation involves escalating commodity prices over the
study period and discounts the costs into present values before taking the sum of all
costs, which is quite complicated and involves a lot of math. Rather than create a
new LCC tool, I used the insight from Swarthmore College to adapt the Harvard

75
Lifecycle Cost Calculator to the specifications of Smith College (Winslade, 2017;
Graf, 2017). The additional criterion that was fulfilled for the selecting a Lifecycle
Cost tool was the inclusion of the proxy carbon price. A critique of this tool is that
the study period is only 20 years, yet some capital projects (e.g. Buildings) have a
longer lifespan (Pfannenstiel, 2017).
Section E: Sensitivity Analysis
The proxy carbon price can impact decisions by illustrating cost and carbon
savings resulting from a low carbon option. Additional, the proxy carbon price
adjusts the payback period for low-carbon options by accounting for savings
resulting from a reduction in carbon emissions and the corresponding social cost of
carbon. For these reasons, the proxy carbon price could tip the scale to alter some
capital decisions that are made using the Lifecycle Cost method and/or the payback
period. The Smith College proxy carbon price of $70/MTCO2e represents the
institutional value of the social cost of carbon. At the proxy carbon price of
$70/MTCO2e, what is the impact of the proxy carbon price with respect to the utility
and fuel prices of the Proxy Carbon Lifecycle Cost calculation? And, what is the
sensitivity of each of the variables?
The Proxy Carbon Lifecycle Cost calculator calculates financial results of
capital projects over 20 year operational cost, as well as initial and replacement cost.
The variables for analysis are the utilities and fuels Smith College purchases.
Currently, Smith College purchases the utility and fuels of ISO-NE electricity and
chilled water as well as the fuels of diesel, gasoline, fuel oil #2 and #6. Additionally
the Smith College Combined Heat and Power Plant produces electricity and steam

76
for heat using the primary fuel source of natural gas and an additional fuel source of
fuel oil #6. (Pfannesteil, 11-8-17; Master Spreadsheet, 2017).
Of the operational cost variables of the Proxy Carbon LCC the greatest
negative externality is fuel oil followed by steam, fuel oil #2, and transportation
gasoline (Figure 10). Please note that the carbon emissions resulting from Smith
electricity and steam that are produced by the Smith CHP assumes only the natural
gas contribution and omits the fuel oil #6 estimate, which results in a low estimate.
Figure 9- The proxy carbon price of utilities and fuels at Smith College as a percent of the total commercial market cost and proxy carbon cost. These results should be interpreted as a per unit basis.
For energy efficiency projects, the utility and fuel savings are likely to
indicate the greatest cost- and carbon- savings, using the Lifecycle Cost method.
This is because the utility and fuel variables change in parallel for energy efficiency
projects because the carbon emissions of the utilities result from the consumption of
fossil fuels. Therefore there is benefit from conducting the Lifecycle Cost calculation

77
for fuel efficiency projects. Furthermore, the utility savings illustrate actual cost
savings to the institution.
In special cases, the difference in initial and replacement costs plus the
operational cost could be very close to equal so the proxy carbon price could
potentially tip the scale to incentivize the low-carbon option. Furthermore, the proxy
carbon price will alter the payback period of the capital project options and may
further incentivize the low-carbon option. Therefore, the proxy carbon price still has
value because it acknowledges carbon emissions in financial decisions and supports
utility cost-saving projects.
For fuel switching projects, the proxy carbon price is likely to have a greater
impact than commercial utility and fuel savings along. This is primarily because the
commercial price for utilities and fuels do not change in parallel because there are
different market costs for each fuel type and different proxy carbon price for each
fuel type because carbon emission rates vary be the source of fuel. Furthermore, the
proxy carbon price consistently has a greater weight of the total cost of fuels than
utility costs, except for steam (Table 11). Therefore, if projects switch from a fuel
source with a high carbon content to a low-carbon fuel or switch to electricity, which
has a much lower carbon emissions, then the Proxy Carbon LCC will indicate
significant proxy carbon savings.

78
Table 11- Smith College uses fossil fuels for utilities to run the college. These all have carbon emissions and corresponding proxy carbon prices as well as commercial prices, denoted “energy price” in the table. The units for both the proxy carbon price of $70/MTCO2e and the energy price are in the same units in the final column of this table.
The data from the column labeled Proxy Carbon Price ($70/MTCO2e) is
equivalent to the value of avoided carbon emissions. Therefore, these values can be
used to evaluate specific investment options that do not require the use of the Proxy
Carbon LCC (i.e. Renewable Energy Credits).
Section F: Pilot Projects
Washburn House Retrofit
The Washburn House Retrofit Pilot Project uses the Proxy Carbon Lifecycle
Cost Calculator to evaluate two energy efficiency retrofit options with respect to a
baseline “do-nothing” approach. The pilot project investigates the influence of the
proxy carbon price with respect to institutional financial criteria over a 20-year study
period. Current institutional practices would not calculate the full lifecycle costs
and/or the social cost of carbon. This pilot project demonstrates the proof of concept
of using the Proxy Carbon Lifecycle Cost Calculator to evaluate retrofit options for a
building. This pilot project is scalable to other buildings on campus.
Washburn House was built in 1878 and is in need of upgrades because
building is in poor condition relative other residential houses on campus (Weisbord,

79
2018). The building is situated near the Neilson Library, which is currently under
construction for a major renovation. Because of this, there will not be any students
living at Washburn House until 2021 when the renovation is complete. These
circumstances present an opportunity to improve the building through renovation
retrofits to make the building more energy efficient and result in cost- and carbon-
savings.
The Washburn Retrofit Pilot Project builds off of previous Smith College
student research identified retrofit options for analysis. The Department of
Engineering thesis “Cost Effective Efficiency Improvements of Building Thermal
Envelopes” assessed opportunities for possible energy efficiency retrofit options in
buildings on Smith College campus, including Washburn House (Grover-Silva,
2010). For the purpose of this Pilot Project the retrofit options selected for analysis
were: Option 1) sealing the envelope mitigate convective thermal loss and Option 2)
seal the envelope and insulate the walls of the building to reduce thermal loss. The
retrofit options are sequential, according to standard engineering practices, which is
why option 2) includes both retrofit options (McKhan, 2018).
There are three scenarios analyzed by the Proxy Carbon Lifecycle Cost
Calculator: The first scenario is the Baseline “do nothing” approach, option 1) and
option 2). The total cost of ownership represents the initial, and lifecycle costs,
including a proxy carbon price, over a 20-year period escalated and discounted
appropriately. The simple payback calculates how long in years it would take to
payback the initial cost using only operational energy savings, whereas the
discounted payback period calculates how long in years it would take to payback the

80
initial cost using operational energy and carbon savings discounted to the net present
value. The proxy carbon price captures the savings from the social cost of carbon,
which is reflected by reduction in the discounted payback period proportional to the
reduction in carbon emissions.
The baseline consumption of steam for heat is 645 MMbtu annually, which
results in about 48 MTCO2e at a proxy carbon cost of $3360 in annual social
damages. Over a 20-year period this would result in 960 MTCO2e equivalent to
$67,200 in proxy carbon costs. There was not an initial cost for this option because it
assumes the existing conditions. The total cost of ownership for the baseline scenario
of Washburn House period is $148,195.
The retrofit option to seal the floors would reduce the annual consumption of
steam to 537 MMbtu, and reduce carbon emissions by 17%. Selecting this option
would save 160 MTCO2e over a 20-year period, resulting in a $11,130 savings of
social damage as indicated by the proxy carbon price. This option has an initial price
of $2,020 and a total cost of ownership of $125,440 (2017 real dollars). The
discounted payback period without the proxy carbon price is about 1.5 years, well
within the existing Facilities practice of a 5-year payback period. The proxy carbon
reduces the discounted payback period to about 1 year, as illustrated by Figure 11.
The proxy carbon price does not shift the discounted payback period to the
institutional practice of a 5-year payback period. Additional data from the results
page of the Proxy Carbon LCC for sealing the floors can be found in Appendix 5.
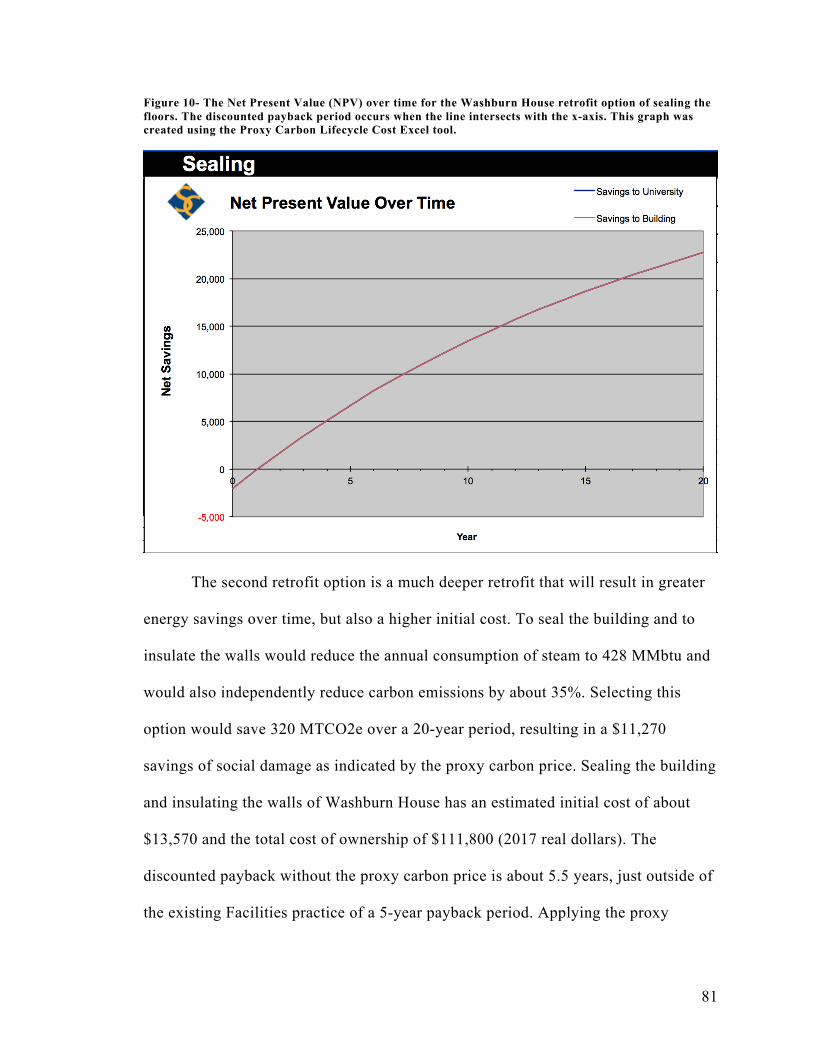
81
Figure 10- The Net Present Value (NPV) over time for the Washburn House retrofit option of sealing the floors. The discounted payback period occurs when the line intersects with the x-axis. This graph was created using the Proxy Carbon Lifecycle Cost Excel tool.
The second retrofit option is a much deeper retrofit that will result in greater
energy savings over time, but also a higher initial cost. To seal the building and to
insulate the walls would reduce the annual consumption of steam to 428 MMbtu and
would also independently reduce carbon emissions by about 35%. Selecting this
option would save 320 MTCO2e over a 20-year period, resulting in a $11,270
savings of social damage as indicated by the proxy carbon price. Sealing the building
and insulating the walls of Washburn House has an estimated initial cost of about
$13,570 and the total cost of ownership of $111,800 (2017 real dollars). The
discounted payback without the proxy carbon price is about 5.5 years, just outside of
the existing Facilities practice of a 5-year payback period. Applying the proxy

82
carbon price reduces the discounted payback period to less than 4 years, as illustrated
in Figure 12. The proxy carbon price shifts the discounted payback period within the
existing Facilities metric of a 5-year payback period. Additional data from the results
page of the Proxy Carbon LCC for sealing the envelope plus insulating the walls can
be found in Appendix 5.
Figure 11- The Net Present Value (NPV) over time for the Washburn House retrofit option of insulating the walls. The discounted payback period occurs when the line intersects with the x-axis. This graph was created using the Proxy Carbon Lifecycle Cost Excel tool.
Comparing across the options to retrofit Washburn House, the initial cost
ascend from Baseline of zero, to the retrofit of sealing the floors, to the retrofit of
insulating the walls. The Proxy Carbon Lifecycle Cost Calculation indicates that both
retrofit options to seal the floors and insulate the windows have a total cost of
ownership over a 20-year period that is less than the Baseline “do-nothing
approach.” This is because the majority of the costs occur during operation to supply

83
heat via steam to the residential house. Furthermore, the savings to investment ratio
(SIR) for the retrofit option of sealing the floors is 12 years and for the retrofit
option of insulating the walls is 2 years. The Proxy Carbon Lifecycle Cost
Calculation indicate that the retrofit options of sealing the floors insulating the walls
of Washburn House would benefit the institution financially in the long-run because
total cost of ownership is lower than the Baseline and because the both retrofit
options have a positive savings to investment ratio.
The proxy carbon price acknowledges the social cost of carbon in the capital
decision and visually illustrates them on the “Charts” table as illustrated in Figure
14. As indicated by Figure 13, the Lifecycle Cost analysis, independent of the proxy
carbon price, would illustrate a lower TCO for the two energy-saving retrofit options
with respect to the baseline. The proxy carbon price reduces the discounted payback
period for both retrofit options. The discounted payback period for the retrofit option
to seal Washburn House is within the current Facilities practice of a 5-year payback
period, independent of the proxy carbon price. The discounted payback period for the
retrofit option to seal and to insulate walls of Washburn was altered by the proxy
carbon price to be within the current Facilities practice of a 5-year payback period.

84
Figure 12- This bar graph compares the 20 year total cost of ownership of the three options for the Washburn House Retrofit analysis using only the initial cost and the utility cost of steam. This bar graph was created using the Proxy Carbon Lifecycle Cost Excel tool.
Figure 13- This bar graph compares the 20 year total cost of ownership of the three options for the Washburn House Retrofit analysis using the initial cost, the utility cost of steam, and the proxy carbon price of $70 per MTCO2e. This bar graph was created using the Proxy Carbon Lifecycle Cost Excel tool.
85
Renewable Energy Credit Procurement
Smith College has decided to invest in a renewable energy project located in
Maine because the campus lacks the space to facilitate the construction of renewable
energy infrastructure (Weisbord, 2018). Smith College has signed a contract for a
renewable energy project that will produce carbon-free electricity for the ISO-NE
grid and produce Class I regulatory Renewable Energy Certificates (RECs)5
(Weisbord, 2018). A Renewable Energy Credit (REC) is a permit that designates
ownership of renewable electricity generation that can be used in greenhouse gas
accounting (EPA, 2016). The Renewable Energy Credits would allow Smith College
to claim carbon emission reductions to progress towards the carbon neutrality goal of
2030.
Should Smith College keep the Class I RECs and retire the equivalent carbon
emissions or sell the Class I RECs? The proxy price can be used as a financial metric
for determining the procurement of Renewable Energy Credits (RECs). The proxy
carbon price represents how much Smith College values the social damage of carbon
emissions. Therefore, Smith College should be willing to pay up to the proxy carbon
price for avoided carbon emissions resulting from an investment opportunity. This
pilot project demonstrates the method of using the proxy carbon price to demonstrate
5 There are two classes of Renewable Energy Certificates’ (RECs) that have the purpose of fulfilling compliance obligations or voluntary commitments. Class I RECs represent any new renewable energy facility that began commercial operation after 1998, whereas Class II RECs represent any renewable source that began prior to 1989. Class I and II RECS can be produced by solar photovoltaic, solar thermal electric, wind energy, small hydropower, landfill methane and anaerobic digester gas, marine or hydrokinetric energy, geothermal energy, or eligible biomass fuel (MA Legislature, 2009).
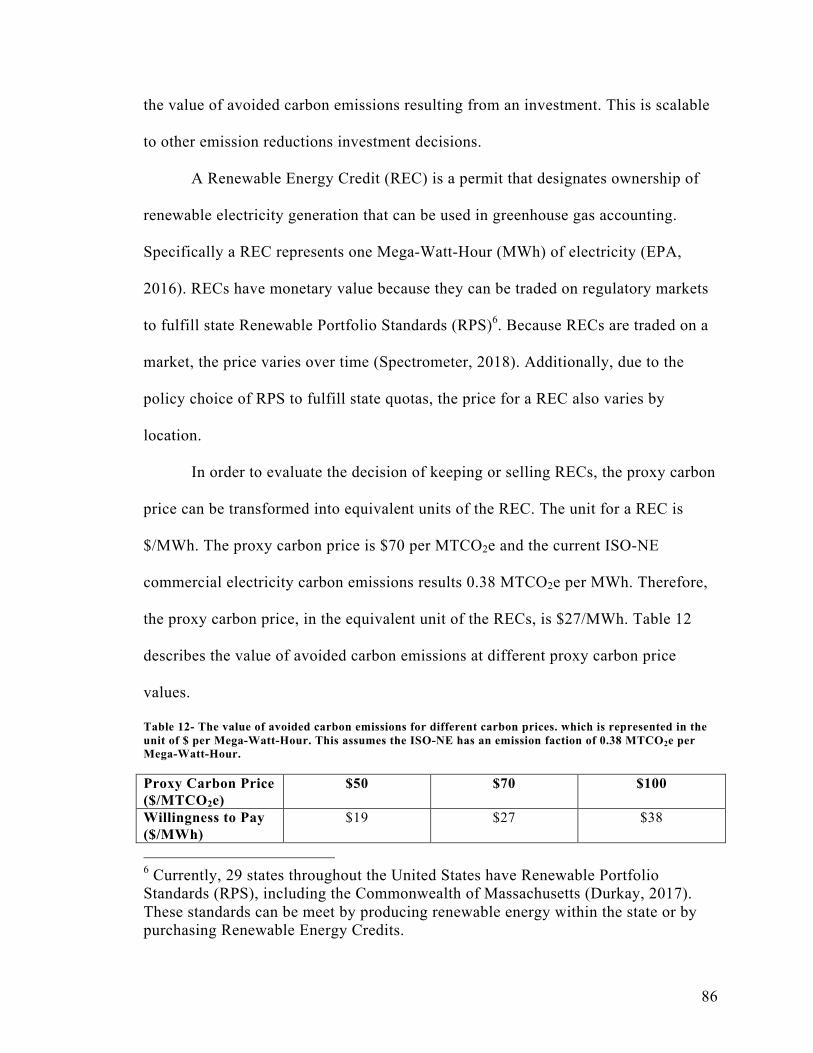
86
the value of avoided carbon emissions resulting from an investment. This is scalable
to other emission reductions investment decisions.
A Renewable Energy Credit (REC) is a permit that designates ownership of
renewable electricity generation that can be used in greenhouse gas accounting.
Specifically a REC represents one Mega-Watt-Hour (MWh) of electricity (EPA,
2016). RECs have monetary value because they can be traded on regulatory markets
to fulfill state Renewable Portfolio Standards (RPS)6. Because RECs are traded on a
market, the price varies over time (Spectrometer, 2018). Additionally, due to the
policy choice of RPS to fulfill state quotas, the price for a REC also varies by
location.
In order to evaluate the decision of keeping or selling RECs, the proxy carbon
price can be transformed into equivalent units of the REC. The unit for a REC is
$/MWh. The proxy carbon price is $70 per MTCO2e and the current ISO-NE
commercial electricity carbon emissions results 0.38 MTCO2e per MWh. Therefore,
the proxy carbon price, in the equivalent unit of the RECs, is $27/MWh. Table 12
describes the value of avoided carbon emissions at different proxy carbon price
values.
Table 12- The value of avoided carbon emissions for different carbon prices. which is represented in the unit of $ per Mega-Watt-Hour. This assumes the ISO-NE has an emission faction of 0.38 MTCO2e per Mega-Watt-Hour.
Proxy Carbon Price ($/MTCO2e)
$50 $70 $100
Willingness to Pay ($/MWh)
$19 $27 $38
6 Currently, 29 states throughout the United States have Renewable Portfolio Standards (RPS), including the Commonwealth of Massachusetts (Durkay, 2017). These standards can be meet by producing renewable energy within the state or by purchasing Renewable Energy Credits.

87
The scale of the renewable energy project would produce approximately the
equivalent of Smith College’s purchased electricity annually from the ISO-NE grid
(Master GHG spreadsheet, 2017). Therefore, the project would produce enough
RECs to eliminate Smith’s Scope 2 emissions from purchased electricity, which is
about 8% (AASHE-Stars, 2017). The value of all carbon emissions from purchased
ISO-NE electricity is equivalent to $243,000, according to a proxy carbon price of
$70/MTCO2e.
If the College chooses to sell the Class I regulatory RECs, the institution can
use the money to purchase cheaper, lower quality Certified RECs from the voluntary
Green Power Market7. Alternatively, the College could use the money from the sale
of the RECs to purchase carbon offsets8 that could also progress the College towards
carbon neutrality. The final option to progress towards carbon neutrality from the
sale of the RECs is to invest the money in energy efficiency capital projects on
campus.
In order to decide if the College should keep the regulatory Class I RECs or
sell the regulatory Class I RECs, consider the following relationships.
7 The voluntary markets are driven by commercial electricity consumer demand for carbon neutral energy, not regulation, so they are separate from mandatory markets to ensure that double claims are avoided. As a result, voluntary markets operate on a supply and demand market, unhindered by regulatory distortions. The current voluntary green power market trends indicate a 45% increase in the number of customers and a 19% increase in sales (NREL, 2017). 8 A carbon offset represents the emission reductions of one party that is purchased by another party to compensate for an equivalent amount of emissions. The emission reduction must be additionally and permanent (Terrapass, 2018).

88
Relationship 1: If the Proxy Carbon Price per MWh is greater than or equal to the
Class I REC price, then the College should keep the Class I REC.
If this relationship is true, then the College values carbon at least as much as the
Class I REC is worth. In this case the College should keep the Class I REC and retire
that amount of carbon equivalent emissions in greenhouse gas accounting.
Relationship 2: If the Proxy Carbon Price per MWh is less than the Class I REC
price, then the College should sell the Class I REC.
If this relationship is true, then the College does not value carbon as much as the
Class I REC is worth. In this case the College should sell the Class I REC and,
consequently, cannot eliminate that amount of carbon equivalent emissions in
greenhouse gas accounting.
To demonstrate the proof of concept of I shall use the data in Table 13 to
evaluate the decision using the REC relationships. Renewable Energy Credit prices
fluctuate with respect to time, location, and type (Regulatory or Voluntary).
Therefore, the decision to keep or sell the RECs should be evaluated during the year
that the project is completed.
According to the 2018 data, Smith College should keep the regulatory Class I
RECs either from Maine or Massachusetts. This is because Relationship 1 is fulfilled
because the proxy carbon price of ISO-NE electricity ($/MWh) is greater than the
REC-Massachusetts and REC-Maine ($/MWh). The total value of RECs from Maine
is less than RECs from Massachusetts, so the College should keep the Maine RECs.

89
Table 13- The value of avoided carbon emissions compared to Renewable Energy Credits’ cost.
Source
Rate ($/MWh)
Total value to reduce carbon emissions by 8%
($) Proxy Carbon Price of ISO-NE
27 243,000
-------------------------------------
-------------------------------------
-------------------------------------
REC- Regulatory Massachusetts (2018)
18 162,000
REC- Regulatory Maine (2018)
8 72,000
REC-Certified (2016, best available data)
1 9,000

90
Chapter V: Conclusions and Recommendations Conclusions
This thesis to Design a Proxy Carbon Price Strategy for Smith College was
developed to acknowledge the social cost of carbon emissions in financial decisions
within the institution. The proxy carbon price is a virtual price that does not apply an
actual fee to impact the capital budget. Implementing a proxy carbon price into the
financial framework for evaluating financial decisions may incentivize the purchase
of low-carbon options (Gillingham et al., 2017). The reason it is important to
purchase low-carbon options for future purchases is because of the complex and
urgent problem of climate change and because Smith College signed the American
College & University Presidents’ Climate Commitment (ACUPCC), which means
that Smith College is committed to becoming carbon neutral by 2030 (Smith College,
2010).
This thesis was written in response to the Study Group on Climate Change
request to “Develop an internalized cost of carbon emissions—such as a carbon-
proxy price—to help guide major capital budget management and other decision-
making processes” (SGCC, 2017). All of the Smith College stakeholders were
familiar with the concept of carbon pricing, which may be attributed to the
advancement of formal sustainability goals through the Study Group on Climate
Change report. While the stakeholders were familiar with the concept of proxy
carbon pricing, the current practices of the institution never used a proxy carbon to
evaluate financial decisions, prior to this thesis. Therefore, the overarching research
question this the thesis to Design a Proxy Carbon Price Strategy for Smith College is

91
how can the institution acknowledge carbon emissions in capital and other financial
decisions?
An important part of the research process to develop the Proxy Carbon Price
Strategy for Smith College was to conduct a thorough review on carbon price
strategies deployed by governments, businesses, and academic institutions. Smith
College is located in the Commonwealth of Massachusetts, which currently has three
proposed carbon tax bills and already participates in the cap and trade system, the
Regional Greenhouse Gas Initiative (RGGI), which puts a price on carbon for
electricity sales (MA Legislature, 2017; RGGI, 2018). Governments around the
world are turning to carbon pricing as a strategy to meet the Nationally Determined
Contributions to mitigate climate change (World Bank and Ecofys, 2017; UNFCCC,
2016).
In response to the growing trend of regulatory carbon pricing, businesses are
responding by incorporating a carbon price into business strategy. As of 2017, over
1,300 businesses are currently using or have disclosed plans to implement a carbon
price (CDP, 2017). This is in stark contrast to the number of academic institutions
that have disclosed using a carbon price. According to this research, there are only
four academic institutions in the United States that are actively using a carbon price
and one academic institution has plans to use a carbon price (Yale Carbon Charge
Task Force, 2016; Swarthmore College, 2017; Princeton University, 2008; (ASU)
Dalrymple, 2018; Vassar College, 2015). Because there are so few academic
institutions actively using a carbon price, there is a lack of peer-reviewed literature

92
or guidance on developing a proxy carbon price strategy. There is a need to fill this
gap through experimentation.
A key milestone for the Proxy Carbon Price Strategy at Smith College was the
selection of a proxy carbon price by the Smith College Committee on Sustainability.
Selecting the carbon price was a challenge because there is a wide range of values
from less than $5 per MTCO2e to over $200 per MTCO2e (See Chapter II: Section
C). There are also a variety of approaches to selecting the proxy carbon price which,
include the pragmatic approach, using the social cost of carbon estimates, implicit
price, aligning with peer institutions, and the regulatory risk approach. The
Committee utilized these approaches to select a price range of $60 to $75 per metric
ton of carbon dioxide equivalent emissions (MTCO2e). For the purpose of this thesis,
Dr. Alex Barron and I selected a proxy carbon price of $70 per metric ton of carbon
dioxide, which is equivalent to the Interagency Working Group on the Social Cost of
Carbon (IWG-SCC) estimate in $2017 at a 2.5% discount rate (IWG-SCC, 2016).
To integrate the proxy carbon price into financial decisions of the institution,
I outlined two methods for using the proxy carbon price. One method is to use the
proxy carbon price independently as metric for the value of avoided carbon
emissions resulting from an investment or purchase. This method was demonstrated
using the pilot project of the Renewable Energy Credit Procurement analysis. The
key finding from this pilot project was that the proxy carbon price can be
transformed from a measurement of the social cost of carbon for one metric ton of
carbon equivalent emissions to the social cost of carbon emissions for a unit of
energy or fuel. This is scalable to other forms of fossil fuel consumption (Table 11).

93
Another method to incorporate the proxy carbon price into financial decisions
at Smith College is to the Proxy Carbon Lifecycle Cost Calculator (Proxy Carbon
LCC). This method integrates the proxy carbon price into a Lifecycle Cost
framework. A Lifecycle Cost evaluates the present and future costs over a given
study period for a purchase (Harvard, 2017; ASTM, 2017). Carbon emissions occur
over the lifetime of a project through fossil fuel consumption during operation.
Therefore, the Lifecycle Cost method is ideal for incorporating the proxy carbon
price. The current practices for capital project purchase evaluation at Smith College
do not typically include a Lifecycle Cost. Therefore, I adapted the Harvard Lifecycle
Cost Calculator to the specifications of Smith College so that decision-makers can
perform Proxy Carbon Lifecycle Cost evaluations.
The Proxy Carbon Lifecycle Cost method is best suited for evaluating options
for a selected capital project. The Washburn House Retrofit pilot project
demonstrated the Proxy Carbon Lifecycle Cost method. This pilot project illustrated
that the proxy carbon price alters the discounted payback period. For the retrofit
option to seal the envelope, the total cost of ownership is lower than the baseline and
the discounted payback period is within the current practice metric, independent of
the proxy carbon price. For the retrofit option to seal the envelope and insulate the
walls, the total cost of ownership is lower than the baseline and the discounted
payback period is within the current practice metric, once proxy carbon price
applied. A key finding from this pilot project was that the energy savings,
independent of the proxy carbon price, demonstrate the cost- and carbon- saving for
some options, but not all. Furthermore, this finding illustrates that the proxy carbon

94
price may incentivize the low-carbon option, particularly when financial metrics of
the Lifecycle Cost is close to equal. A challenge for this pilot project was the lack of
organized and accessible data on the costs of each retrofit option. This challenge may
be overcome by more rigorous standards for data collection and storage as outlined
by Recommendation 6.
Ultimately, the Proxy Carbon Price Strategy for Smith College is a way to
make informed financial decisions that include the social cost of carbon. The proxy
carbon price is a virtual price that may incentivize low-carbon options, particularly
when using the Proxy Carbon Lifecycle Cost method to evaluate capital project
purchasing decisions. The method to use the proxy carbon price to determine the
willingness to pay for avoided carbon emissions can highlight opportunities to
mitigate Smith College’s contribution to climate change and work towards the
carbon neutrality goal of 2030 (Smith College, 2010). This thesis to Design a Proxy
Carbon Price Strategy for Smith College captures the academic institution’s mission
of education through student research and aligns the operations of Smith College
with the sustainability goals outlined by the Study Group on Climate Change.
Furthermore, this thesis addresses the need for experimentation with proxy carbon
pricing as a strategy to mitigate carbon emissions that contribute to anthropogenic
climate change.

95
Recommendations for Smith College
1. Use a proxy carbon price strategy to acknowledge the social cost of carbon
emissions in financial decisions.
This thesis addresses the Institutional Change request by the Study Group on
Climate Change (SGCC): “Develop an internalized cost of carbon emissions—such
as a carbon-proxy price—to help guide major capital budget management and other
decision- making processes” (SGCC, 2017). The purpose of the Proxy Carbon Price
Strategy is to acknowledge the social cost of carbon into capital decisions and other
financial decisions. A proxy carbon price is a virtual cost, meaning it does not charge
an actual fee to the institution (Gillingham, 2017; Cassidy, 2016). A key finding
from the Renewable Energy Credit pilot project is that the proxy carbon price can
demonstrate the institutional willingness to pay for an investment opportunity to
reduce carbon emissions. Therefore, the Proxy Carbon Price Strategy may act as a
sustainable transition tool to work towards the American College and University
Presidents Climate Commitment of carbon neutrality by 2030 (Smith College, 2010).
2. Select the proxy carbon price value of $70 per metric ton of carbon dioxide
equivalent emission (MTCO2e) and update the value as needed.
The Committee on Sustainability recommended the proxy carbon price range
of $60-75 per one metric ton carbon equivalent emissions (Committee on
Sustainability, 2018). Within that range, I recommend the institutional carbon price
of $70 per metric ton of carbon dioxide equivalent emissions. This price is
equivalent to the findings of the Interagency Work Group on the Social Cost of
Carbon in $2017 with a 2.5% discount rate (National Academy of Science, 2017;

96
Interagency Working Group on the Social Cost of Carbon, 2016; Bureau of
Economic Analysis, 2018).
An important lesson from the United States Interagency Working Group on the
Social Cost of Carbon (IWG-SCC) is that the carbon price must be reviewed and
updated frequently (IWG-SCC, 2016). This is a necessity because climate and
socioeconomic factors are constantly changing (National Academy of Science,
2017). Another possible reason to update the price is that the current price signal is
untested for actually lowering carbon emissions on campus. Therefor the proxy
carbon price must be evaluated and perhaps changed to align with sustainability or
financial goals of Smith College.
3. Smith College should incorporate the method of Lifecycle Cost (LCC) to the
current practices of capital project evaluations within Facilities
Management.
The Lifecycle Cost method should be used for evaluating capital decisions
because it demonstrates the present and future costs to estimate the total cost over a
study period9 to make informed decisions. This method is particularly useful for
long-term projects that have a high operating cost relative to the initial cost. The
Washburn House Retrofit pilot project illustrated that the LCC method can identify
cost- and energy-saving options that also result in carbon savings.
The Lifecycle Cost method should be used to evaluate capital projects in the
Facilities Management Department (Howard, 2018; Gagnon, 2018; Pfannenstiel,
2018; Weisbord, 2018). To perform the Lifecycle Cost, I recommend that project
9 The study period that was selected for the purpose of this research was 20 years. This study period should be revised after evaluating the effectiveness of the method.
97
managers or 3rd party contractors use the Smith College Proxy Carbon Lifecycle Cost
calculator. This tool can be used to highlight opportunities to save money and energy
while also reducing carbon emissions through capital projects such as, building
retrofits, energy efficiency upgrades, and fuel switching, among many other capital
project options, with or without the proxy carbon price.
4. Smith College should incorporate the proxy carbon price into the Lifecycle
Cost method outlined in Recommendation 3.
Carbon emissions occur during the operating lifetime of capital projects (i.e.
electricity, gasoline for vehicles). Therefore, it is essential to apply the proxy carbon
price to carbon emissions over the operating lifetime of a capital project. The
Lifecycle Cost method is well suited to incorporate the proxy carbon price because it
evaluates the initial and operating costs over a long-term study period. Therefore, the
Lifecycle Cost method can contextualize the proxy carbon price among other
traditional financial costs such as the initial market price, labor, and utility costs,
among others. This method is likely to be most useful for capital decision-makers
because the primary criteria for making capital decisions are most often financial
criteria (Kowitz, 2017; Pfannenstiel, 2018).
5. Engage students in proxy carbon price research and development.
Student engagement with proxy carbon price research and development
should be a priority because it is an opportunity to align the mission of education
with sustainable operating practices of the institution. Furthermore, the Proxy
Carbon Price Strategy addresses the complex and real-world problem of climate
change. Therefore, engaging students in the research and development of the

98
Strategy utilizes the Campus as Classroom technique (Smith College Strategic Plan,
2016). I have outlined a few of the possible opportunities to engage students witht
the Proxy Carbon Price Strategy in the Chapter: Future Work.
6. Record all data for projects that use the Proxy Carbon Price Strategy in a
folder in the Smith College Shared Drive.
It is imperative that the data from the Proxy Carbon Lifecycle Cost calculations
are recorded, organized and stored so that future research can be conducted using the
data. Specifically, all data on the present and future costs as well as the utility
consumption of each project should be recorded. The data should be stored in a
folder that is clearly labeled and accessible to the members of the organizational
branch of the Executive Office of Finance and Administration. Another consideration
is to make the data accessible to faculty members so they can identify opportunities
for student research using the Proxy Carbon Price Strategy to fulfill
Recommendation 5.
7. Update the utility cost rates and the escalation rates in the Proxy Carbon
Lifecycle Cost Calculator as needed.
The variables within the Proxy Carbon Lifecycle Cost Calculator should be
updated with the best available data in order to make accurate decisions using this
method. In particular the cost and escalation variables for utilities are likely to
change over time. Therefore, it is necessary to update the data to provide accurate
results from the Proxy Carbon LCC. The institutional rates should be updated using
Smith College data from Facilities Management records and the purchased goods’
rates should be updated using data from the Energy Information Agency.

99
Additionally, the escalation rates of labor and materials should be updated using data
from the Consumer Price Index for Urban Consumers (CPI-U).
I also recommend that the Committee on Sustainability should oversee the
update process and make the final decision on how frequently to update the data
because it is the responsibility of the Committee to implement the recommendations
from the 2017 report. I recommend that students conduct the update of the Proxy
Carbon Lifecycle Cost Calculator because it is an opportunity to utilize the Campus
as Classroom initiative and fulfill Recommendation 5. The Committee on
Sustainability should also select the student(s) to complete the update. The utility
rates should be recorded in the Master Utility Cost and GHG Rate Spreadsheet to
maintain a record of the utility rates used for the tool.
8. Pilot Project Recommendations
a. Renewable Energy Credit Procurement
The Renewable Energy Credit Procurement pilot project demonstrated the
method of using the proxy carbon price as the value of avoided emissions to evaluate
an investment decision. This is scalable to other carbon emission reductions
investment or purchase decisions. A Renewable Energy Credit represents the market
value of one Mega-Watt-hour (MWh) of renewable electricity. According to the
recommended proxy carbon price of $70 per MTCO2e the willingness to pay for
RECs to avoid carbon emissions is about $27 per MWh. I recommend that Smith
College use the following relationships to determine if Smith College should sell the
RECs or keep the RECs:
100
• If the Proxy Carbon Price per MWh is greater than or equal to the Class I
REC price, then the College should keep the Class I REC.
• If the Proxy Carbon Price per MWh is less than the Class I REC price, then
the College should sell the Class I REC.
b. Washburn House Retrofit
I recommend that Smith College retrofit Washburn House by selecting the
retrofit options of sealing between the floors and insulating the walls. The option to
seal the envelope would reduce carbon emissions in Washburn House by 17% and
the option to seal the envelope and insulating the walls would reduce carbon
emissions in Washburn House by 35%.
This recommendation is justified by the Proxy Carbon Lifecycle Cost
calculation, which illustrates that both of the retrofit options have a lower total cost
of ownership than the baseline “do-nothing” approach. Furthermore, they both have
positive savings to investment ratios, which means the retrofit options will save at
least as much money as they cost. Additionally, the proxy carbon price alters the
discounted payback period such that both retrofit options fall within the current
practice of a 5-year payback period.

101
Chapter VI: Future Work Academic institutions can act as a living laboratory for experimenting with
the sustainable tool of carbon pricing. However, this research indicated that there
were only four United States academic institutions that are actively using carbon
pricing. Therefore, Smith College has a major opportunity to become a leader in the
emerging field of carbon pricing. Researchers at Smith College should share the
results of the Proxy Carbon Price Strategy experiments in a peer-reviewed journal.
This is a crucial step in the scientific method and should be emphasized because
there is a significant need for research on carbon pricing. Furthermore, sharing
results of the carbon pricing experiments is especially important right now because
there is an urgency to scale the implementation of this carbon mitigation strategy in
the context of climate change.
Once the Proxy Carbon Price Strategy has been used in financial decisions at
Smith College, there is an incredible opportunity for research through retrospective
analysis. I’m most curious about the influence of a proxy carbon price to actually
lower carbon emissions. More specifically, are there specific types of decisions that
are best suited for using the Proxy Carbon Lifecycle Cost method?
Also, what types of projects can use the proxy carbon price independent of
the Lifecycle Cost method (i.e. Renewable Energy Credit Procurement Pilot
Project)? The proxy carbon price can demonstrate the value of avoided carbon
emissions from a new investment or purchase. I hypothesize that the scale for this
method of analysis could be expanded to encompass campus-wide purchases through
the Capital Plan.

102
Another way to engage students is to have them update the internal variables of
the Proxy Carbon Lifecycle Cost Excel tool. The more frequently these variables are
updated, the more accurate they will be for estimating the costs of projects. To have
the best available information the calculator should be updated once a year because
the primary databases in the EIA and at Smith College are updated annually
(Pfannenstiel, 2018; EIA, 2017). In the future students could gain research
experience by seeking out the best available data from the institutional, regional, and
national sources. Through this experience, students can build data analysis skills and
gain practical experience working with Excel spreadsheets and databases.
Furthermore, this is another opportunity to progress the Campus as Classroom
initiative through the Proxy Carbon Price Strategy for Smith College.
Another project for future research is to determine the utility rate for chilled
water. Chilled water is produced through a dual source of commercial electriciy and
steam from the Combined Heat and Power (CHP) plant at Smith College, which
makes it difficult to isolate the cost of chilled water. This research assumed the cost
determined by GreenerU, but should be revised through further research to achieve
more accurate results from the Proxy Carbon Lifecycle Cost Excel tool.
The final suggestion for future research is also in regards to the Proxy Carbon
Lifecycle Cost Excel tool and a complication resulting from the Combined Heat and
Power (CHP) plant at Smith College. The estimate for the carbon emssions for
electricity and steam to produce heat from the CHP assumed only the contribution
from natural gas, the primary source of fuel for the CHP. The CHP also uses fuel oil
#6 in the boilers to produce extra steam to heat the buildings when necessary.

103
Therefore, a more detailed analysis of the carbon emissions resulting from the
production of electricity and steam from the CHP should be conducted. The updated
values for carbon emissions from electricity and steam will improve the accuracy of
calculations for the Proxy Carbon Lifecycle Cost Excel tool.

104
Bibliography ASTM E917-17. (2017). Standard Practice for Measuring LIfe-Cycle Costs of Buildings and Buildings Systems. ASTM International, 2017 Book of Standards Volume 04.11. Retrieved from, https://www.astm.org/Standards/E917.htm DOI: 10.1520/E0917-17 Association for the Advancement of Sustainability in Higher Education (AASHE). 2017. “Sustainability Tracking, Assessment & Rating System (STARS): Smith College: Operations: Air & Climate”. Association for the Advancement of Sustainability in Higher Education (AASHE). 2017. Retrieved from, https://stars.aashe.org Association for the Advancement of Sustainability in Higher Education (AASHE). 2017. AASHE Conference & Expo. 2017. The Association for the Advancement of Sustainability in Higher Education. Accessed July, 2017. https://conference.aashe.org/program/workshops/. Bain & Company (2011). RAPID: Bain’s tool to clarify decisions accountability. Bain & Company (2011). http://www.bain.com/publications/articles/RAPID-tool-to-clarify-decision-accountability.aspx Barron, A., Parker. B. (2018.) Test proxy carbon prices as decision-making tools. Nature 553, 405 (2018). doi: 10.1038/d41586-018-01078-2 Barron, Alex. Memo. Potential Smith College Engagement on Carbon Pricing, To: Mike Howard, Dano Weisbord, Amy Rhodes; From: Alex Barron. May 24, 2016. E-mail document. Accessed May, 2017. Buckley, Chris. 2017. Xi Jinping Is Set for a Big Gamble With China’s Carbon Trading Market. The New York Times, June 23, 2017, sec. Asia Pacific. https://www.nytimes.com/2017/06/23/world/asia/china-cap-trade-carbon-greenhouse.html. Bureau of Labor Statistics, 2018. Consumer Price Index for Urban Consumers (CPI-U) Home : U.S. Bureau of Labor Statistics. (2018.). Retrieved from https://www.bls.gov/cpi/ Bureau of Economic Analysis (BEA). 2018. National Data: Implicit Price Deflators for Gross Domestic Product. (United States Department of Commerce, 2018. Retrieved from, https://bea.gov/iTable/iTable.cfm?reqid=19&step=3&isuri=1&1921=survey&1903=13#reqid=19&step=3&isuri=1&1910=x&0=-99&1921=survey&1903=13&1904=2010&1905=2017&1906=q&1911=0 California Legislature. 2006. 2018. “AB 32 Assembly Bill - Bill Analysis.” 2006. Retrieved from, http://leginfo.legislature.ca.gov/faces/billAnalysisClient.xhtml.

105
Cassady, Alison, and Gwynne Taraska. 2016 “Proxy Carbon Pricing.” Center for American Progress. Accessed June, 2017. https://www.americanprogress.org/issues/green/reports/2016/04/18/135580/proxy-carbon-pricing/. CDP. (2017). Putting a price on Carbon Integrating climate risk into business planning. CDP. Retrieved from https://b8f65cb373b1b7b15feb-c70d8ead6ced550b4d987d7c03fcdd1d.ssl.cf3.rackcdn.com/cms/reports/documents/000/002/738/original/Putting-a-price-on-carbon-CDP-Report-2017.pdf?1507739326 CDP. (2014). Corporate use of carbon prices Commentary from corporations, investors and thought leaders. CDP. 2014. Retrieved from https://b8f65cb373b1b7b15feb-c70d8ead6ced550b4d987d7c03fcdd1d.ssl.cf3.rackcdn.com/cms/reports/documents/000/000/851/original/companies-carbon-pricing-implications-2014.pdf?1472037024 Davenport, Coral (2018. In a Gamble to Make Climate Change a Political Win, a Governor Pursues a Carbon Tax. New York Times, Web. 2018. Retrieved from, https://www.nytimes.com/2018/03/01/climate/jay-inslee-carbon-tax.html Durkay, Jocelyn. (2017). "State renewable portfolio standards and goals." National Conference of State Legislature. United State of America Government. Retrieved from. http://www.ncsl.org/research/energy/renewable-portfolio-standards.aspx European Union Emissions Trading System. (2018). EU Emissions Trading System (EU ETS) Retrieved from https://ec.europa.eu/clima/policies/ets_en Executive Order 13783. 2017. Presidential Executive Order on Promoting Energy Independence and Economic Growth. (2017). Retrieved from, https://www.whitehouse.gov/presidential-actions/presidential-executive-order-promoting-energy-independence-economic-growth/ Forest Trends Ecosystem Marketplace. (2017). Unlocking potential: State of voluntary carbon offset. Forest Trends Ecosystem Marketplace. Retrieved from, https://www.cbd.int/financial/2017docs/carbonmarket2017.pdf Grover-Silva, Etta Lauren, "Cost effective efficiency improvements of building thermal envelopes" (2010). Theses, Dissertations, and Projects. 1512. https://scholarworks.smith.edu/theses/1512 GHG Master Spreadsheet. (2017). Google Drive, Owner: Emma Kerr. Office of Campus Sustainability. Gillingham, K., Carattini, S., & Esty, D. (2017). Lessons from first campus carbon-pricing scheme. Nature News, 551(7678), 27. https://doi.org/10.1038/551027a
106
Greenhouse Gas Protocol and World Resource Institute. 2006. Calculation Tool: Allocation of GHG Emissions from a Combined Heat and Power (CHP) Olant. Version 1.0. World Resource Institute. 2006. Retrieved from, http://www.ghgprotocol.org Harvard University, Sustainability. (2018). Life cycle Costing. Harvard University Sustainability. Retrieved from, https://green.harvard.edu/topics/green-buildings/life-cycle-costing Howard, (2014.) Omitted damages: What’s missing from the social cost of carbon. Cost of Carbon.org 2014. Retrieved from, http://costofcarbon.org/files/Omitted_Damages_Whats_Missing_From_the_Social_Cost_of_Carbon.pdf Interagency Working Group on the Social Cost of Carbon (IWG-SCC). 2016. Technical Support Document: Technical Update of the Social Cost of Carbon for Regulatory Impact Analysis United States Environmental Protection Agency Under Executive Order No. 12866. (2013, November 26). Retrieved from https://www.federalregister.gov/documents/2013/11/26/2013-28242/technical-support-document-technical-update-of-the-social-cost-of-carbon-for-regulatory-impact IPCC International Panel on Climate Change (IPCC). (2014). IPCC Fifth Assessment Report. Retrieved from, https://www.ipcc.ch/report/ar5/. ISO New England Inc., (2018.) ISO New England Electric Generator Air Emissions Report. ISO-NE. Retrieved from https://www.iso-ne.com/static-assets/documents/2018/01/2016_emissions_report.pdf Keohane, N. and Sheila Olmstead. 2007. Markets and the Environment. Island Press. Print. Koch, N., et. al, (2014). Causes of the EU ETS price drop: Recession, CDM, renewable policies or a bit of everything?- New evidence. Energy Policy Vol. 73, p. 676-685. https://doi.org/10.1016/j.enpol.2014.06.024 Lau and Wong, 2015. Quantifying Pollution Impact from New Generation and Demand-Side Management. CIGRE and ISO New England Inc. Retrieved from http://cigre-usnc.tamu.edu/wp-cntent/uploads/2015/10/Lau.pdf Massachusetts Legislature. (2009). Section 11F: Renewable energy portfolio stand for retail electricity supplies. General Laws of the commonwealth of Massachusetts Part 1, Tittle II, Chapter 25A, Section 11F. Retrieved from, https://malegislature.gov/Laws/GeneralLaws/PartI/TitleII/Chapter25A/Section11F

107
Massachusetts legislature, 2017. “H. 1726, H. 3473, S. 1821” Accessed November 1, 2017. https://malegislature.gov/Bills/Search. McCarthy, Shawn. (2017). “Carbon Pricing in Canada.” Historica Canada: The Canadian Encyclopedia. http://www.thecanadianencyclopedia.ca/en/article/carbon-pricing-in-canada/. Moore, Frances C. and Diaz, Delavane B. 2015. “Temperature Impacts on Economic Growth Warrant Stringent Mitigation Policy.” Nature Climate Change 5 (2): 127–31. https://doi.org/10.1038/nclimate2481. Morris, A. (2015). Why the federal government should shadow price carbon. Brookings. Retrieved March 20, 2018, from https://www.brookings.edu/blog/planetpolicy/2015/07/13/why-the-federal-government-should-shadow-price-carbon/ Norris, G. (2001). Integrating life cycle cost analysis and LCA. The International Journal of Life Cycle Assessment. Vol. 6, Issure 2, pp 118-120. Retrieved from, https://doi.org/10.1007/BF02977849 National Academy of Sciences, Engineering, and Medicine. 2017. Valuing Climate Damages: Updating Estimation of the Social Cost of Carbon Dioxide. Washington, DC: The National Academy Press. doi://doi.org?10.17226/24651. Nordhaus, William. 2015. Climate Casino: Risk, Mitigation, and Economics for a Warming World. Yale University Publishing Press. Accessed October 2016. O’Shaughnessy, E., Heeter, J., Cook, J., & Volpi, C. (2017). Status and Trends in the U.S. Voluntary Green Power Market (2016 Data) (No. NREL/TP-6A20-70174). National Renewable Energy Lab. (NREL), Golden, CO (United States). https://doi.org/10.2172/1416112 Page, A. (2017). Our Climate: A Bold Campaign To Put A Price On Carbon. Our Climate. Retrieved from, https://www.leonardodicaprio.org/our-climate-a-bold-campaign-to-put-a-price-on-carbon/ Fremstad A. and Paul, M. 2017. A Short-Run Distributional Analysis of a Carbon Tax in the United States. Political Economy Research Institute at the University of Massachusetts Amherst. 2017. Retrieved from, https://www.peri.umass.edu/media/k2/attachments/WP434.pdf trum Princeton University. (2008). The Princeton University Sustainability Plan. Princeton University Reports, 2008. Retrieved from https://www.princeton.edu/reports/sustainability-plan-20080219/

108
Regional Greenhouse Gas Initiative RGGI, 2017 “Regional Greenhouse Gas Initiative (RGGI) CO2 Budget Trading Program - Home.” Accessed December 11, 2017. http://rggi.org/. Regional Greenhouse Gas Initiative (RGGI). (2018). CO2 Budget Trading Program. Retrieved from http://rggi.org/ Rogers, R. and Blenko, M. (2006). Who has the D?: How clear decision roles enhance organizational performance. Harvard Business Review (2006). Retrieved from, https://hbr.org/2006/01/who-has-the-d-how-clear-decision-roles-enhance-organizational-performance Resources for the Future. 2017. “Cap-and-Trade Policy Potential in Oregon: Addressing Emissions Leakage.” 2017. Resources for the Future. November 29, 2017. http://www.rff.org/blog/2017/cap-and-trade-policy-potential-oregon-addressing-emissions-leakage. Sander de Bruyn, Marisa Korteland, Agnieszka Markowska, Marc Davidson, Femke de Jong, Mart Bles, Maartje Sevenster. 2010. “Shadow Prices Handbook.” CE Delft. March. Accessed July, 2017. http://www.cedelft.eu/publicatie/shadow_prices_handbook_%3A_valuation_and_weighting_of_emissions_and_environmental_impacts/1032. Second Nature, 2018 American College and University Presidents Climate Commitment- The President's’ Climate Leadership Commitments. Second Nature. 2018. Retrieved from, http://secondnature.org/climate-guidance/the-commitments/ Smith College, Study Group on Climate Change (SGCC). (2017). Smith College: Study Group on Climate Change Report. Retrieved from https://www.smith.edu/climatechange/ Smith College, Committee on Sustainability. (2010). "Sustainability and Climate Action Plan (SCAMP)." (2010) Smith College. Smith College, Committee on Sustainability. (2018). "Committee on Sustainability." Smith College (2018). Retrieved from, https://www.smith.edu/about-smith/sustainable-smith/climate-leadership Smith College. (2016). Strategic Planning | Smith College. (2016.) Retrieved from https://www.smith.edu/about-smith/strategic-planning) Schwägerl, W. (2011). Living in the Anthropocene: Toward a New Global Ethos. Yale School of Forestry and Environmental Studies (2011). Retrieved from https://e360.yale.edu/features/living_in_the_anthropocene_toward_a_new_global_ethos

109
Stanley Rosenberg | Massachusetts Senate President. (2017). Stanley Rosenberg Website (2018). Retrieved from, http://www.stanrosenberg.com/ Stern. N. (2008). Stern Review: The economics of climate change. American Economic Review: Papers & Proceedings 2008, 98:2, –37 http://www.aeaweb.org/articles.php?doi= 0. 257/aer.98.2. Swarthmore College (2017.) The Carbon Charge: Carbon Pricing Policy. Retrieved from https://www.swarthmore.edu/sustainability/swarthmore-carbon-charge-program Swarthmore College. (2017). Swarthmore carbon charge program: The shadow price. Swarthmore College. Retrieved March 9, 2018, from https://www.swarthmore.edu/sustainability/swarthmore-carbon-charge-program Terrapass. 2018. What Makes a Quality Carbon Offset. Terrapass. 2018. Retrieved from, https://www.terrapass.com/quality-carbon-offset Testa, Francesco, Fabio Iraldo, Marco Frey and Ryan O’Connor (2011). Life Cycle Costing, a View of Potential Applications: from Cost Management Tool to Eco-Efficiency Measurement, Supply Chain Management, Dr. pengzhong Li (Ed.), ISBN: 978-953-307-184-8, In Tech Union of Concerned Scientists (2017). When rising seas hit home: Hard choices ahead for hundreds of US coastal communities. Union of Concerned Scientists (2017). Accessed January 30, 2018. https://www.ucsusa.org/global-warming/global-warming-impacts/when-rising-seas-hit-home-chronic-inundation-from-sea-level-rise. United Nations Environment Programme (UNEP), Society of Environmental Toxicology and Chemistry (SETAC). (2009). Guidelines for Social LIfe Cycle Assessments of Products. ISBN: 978-92-807-3021-0 DTI/1164/PA United States Environmental Protection Agency (EPA). (2016). “Renewable Energy Certificates (RECs) [Overviews and Factsheets].” Environmental Protection Agency (EPA). Retrieved from https://www.epa.gov/greenpower/renewable-energy-certificates-recs United States Environmental Protection Agency (EPA). (2017). Understanding global warming potentials. U.S. EPA. (2017). Retrieved from, https://www.epa.gov/ghgemissions/understanding-global-warming-potentials United Nations Framework Convention on Climate Change (UNFCC) 2016. The Paris Agreement. UNFCC, 2016. Retrieved from, http://unfccc.int/paris_agreement/items/9485.php

110
Vassar College. 2016. Climate Action Plan. Vassar College Committee on Sustainability and the Office of Sustainability. 2016. Retrieved from, https://sustainability.vassar.edu/docs/2016_Vassar_CAP.pdf Water Research Foundation (WERF). (2011). Overview: What is Life Cycle Costing? GWRC, GHD Consulting Inc. (2011). Retrieved from http://simple.werf.org/simple/media/LCCT/index.html Weisbord. Dano, et, al., (2012). Greening the Bottom Line. Sustainable Endowments Institute (SEI). (2012).Greening the Bottom Line. Retrieved from, http://greenbillion.org/wp-content/uploads/2012/11/Greening-the-Bottom-Line-2012. Weitzman ML. 2013. Tail-Hedge Discounting and the Social Cost of Carbon. Journal of Economic Literature. 2013. 51 (3) :873-882. Retrieved from, https://scholar.harvard.edu/weitzman/publications/tail-hedge-discounting-and-social-cost-carbon-0 WERF. N.D. Overview: What is Life Cycle Costing? (n.d.). Retrieved October 28, 2017, from http://simple.werf.org/simple/media/LCCT/index.html Wolak, Frank. (2014). “Universities Can Do Better Than Symbolism: A Revenue-Neutral Carbon Tax.” SIEPR Policy Brief. October 2014. Retrieved from, http://siepr.stanford.edu/publicationsprofile/2821 World Bank, Ecofys. (2017). Pricing Carbon. World Bank. 2017. http://www.worldbank.org/en/programs/pricing-carbon. World Bank. (2017). Report of the High-Level Commission on Carbon Prices. Washington, DC: World Bank. Retrieved from https://www.carbonpricingleadership.org/report-of-the-highlevel-commission-on-carbon-prices/ Woodard, D. (1997). Life cycle costing-Theory, information acquisition and application. International Journal of Project Management. Volume 16, Issue 6, pg. 335-344. (1997). Retrieved from, https://doi.org/10.1016/S0263-7863(96)00089-0 Yale Carbon Charge Task Force. 2016. “Yale University’s Carbon Charge: Preliminary Results from Learning by Doing.” Yale University. Web August, 2017. http://carbon.yale.edu/sites/default/files/files/Carbon_Charge_Pilot_Report_20161010.pdf Yale Carbon Charge Task Force. 2016. Yale University’s Carbon Charge: Preliminary Results from Learning by Doing. Yale University. 2016. Retrieved from, https://cbey.yale.edu/sites/default/files/Carbon_Charge_Pilot_Report_20161010.pdf Internal Stakeholders

111

112
External Collaborators

113
Appendixes Appendix 1: Internal Stakeholder questions
Karl Kowitz
Facilities Business Operations Director
Friday October 13, 2017
Confidentiality & Consent: yes
1. What is the scope of your decisions?
2. What criteria do you use to make decisions?
3. How far do you plan financially into the future
4. What is your operating budget?
5. What do you report on vehicles?
6. What is the stock of vehicles and how often does it change?
7. Are there electric vehicles?
8. Do you know of any other people in the institution that I should meet with?
David DeSwert
Associate Vice President for Financial Planning
October 24, 2017
Confidentiality & Consent: yes
1. What is your role in the finances of Smith College?
2. Who reports to you? And whom do you report to?
3. Have you heard of carbon pricing as a way to mitigate carbon emissions?

114
4. Do you know the carbon pricing policy tool proxy carbon pricing?
5. Do capital management projects conduct life cycle cost assessments? Which
ones, is there a threshold?
6. What is the process of an idea for a capital project to the creation of an RFP?
7. Who determines the budget for a capital project?
8. Are there a minimum number of options that must be evaluated before making
a decision?
9. Who determines those options?
Matt Pfannenstiel
Energy Manager-Facilities Management
November 8, 2017
Confidentiality & Consent: yes
1. Are you familiar with the concept of carbon pricing?
2. What is your role in the institution?
3. Do you conduct energy analysis in the design phase of the project?
4. Do you conduct a carbon analysis in the design phase of the project?
5. How do you think a proxy carbon price could be integrated into Smith
College decisions?
6. How do capital management projects progress from idea to completion?
7. What kind of features would be useful in a tool to calculate a proxy carbon
price LCC?
8. Do you know of any other people in the institution that I should meet with?

115
Peter Gagnon
Capital Project Manager-Facilities Management
November 17, 2017
Confidentiality & Consent: yes
1. Are you familiar with the concept of carbon pricing?
2. What is your role in the institution?
3. What is the scope of your decisions?
4. How far do you plan financially into the future?
5. Do you conduct a life cycle cost assessment?
6. Would it be feasible to use a LCC?
7. What features would you want to include in the LCC tool?
Roger Mosier
Also in attendance: Dano Weisbord
Associate Vice President of Facilities Management and Director of Campus
Sustainability & Space Planning
November 27, 2017
Confidentiality & Consent: yes
1. Are you familiar with the concept of carbon pricing?
2. What is your role in the institution?
3. Specifically in capital management projects?
4. How far do you plan into the future for the Capital Plan?
5. Who helps develop the Capital Plan?
116
6. Does Smith currently use Lifecycle Cost Calculation?
7. What criteria do you use to develop the Capital Plan?
8. What reports/data does the college have on past projects?
Peter Gagnon, Matt Pfannenstiel, Charlie Connant, Allison, Cheryl Obremski,
Morgan Wilson, Dano Weisbord
Smith College Facilities Management
March 15, 2018
1. Are there any features that should be added or modified in the LCC tool?
2. Where should the proxy carbon price be integrated into current practices of
capital project decisions?
3. Who should complete the inputs in the tool for project alternatives?
4. Who should oversee and evaluate the results of the tool to make a decision?
5. Where should the records for project data be kept? How often should that be
reviewed in regards to the effectiveness of the proxy carbon price?
6. Who should update the variables within the tool?
7. Do you have any comments, questions, or concerns?
Dr. Denise McKahn
Professor of Engineering
March 22, 2018
Confidentiality & Consent: yes

117
1. What building would you recommend for a pilot project for the proxy carbon
price strategy?
2. What data do you have on that Washburn House?
3. What should the baseline and alternative scenarios be for the Proxy Carbon
Lifecycle Cost calculation?
4. How can the carbon equivalent emissions of the Combined Heat and Power
Plant be separated into the variables of heat, chilled water, and electricity?
5. What sources do you recommend for data on the labor and material of the
retrofit options?

118
Appendix 2: Readaheads to Key Internal Stakeholder
To: Mike Howard
From: Breanna Parker, Smith 2018
CC: Dr. Alex Barron, Dano Weisbord
Topic: Discussion on Proxy Carbon Pricing at Smith College
Meeting: Campus Center, 9AM 12/14/17
Purpose
To discuss proxy carbon pricing for use at Smith. Your input is very valuable, so I
would like to ask you a few questions about an implementation strategy, and in
return answer any questions you may have.
Background
My honors thesis addresses the recommendation by the Study Group on
Climate Change to explore implementing a proxy carbon price on campus. I am
working with Dr. Alex Barron, Dr. Susan Sayre, Dano Weisbord and collaborating
with Smith stakeholders.
My research questions are: How can Smith College incorporate the social
costs of carbon into decision-making using life cycle proxy carbon pricing as a
tool? Who makes key capital decisions and should implement the life cycle proxy
carbon price project evaluation tool? What types of projects would work best for life
cycle proxy carbon pricing?

119
This semester I have been conducting background research on proxy prices
and studying other schools that have implemented carbon prices and are
experimenting with different methods and tools. In addition, I interviewed key
stakeholders in Facilities Management and Finance and Administration including,
David DeSwert, Thu Quach, Roger Mosier, Peter Gagnon, Karl Kowitz, Karla
Youngblood, and Matt Pfannenstiel.
While the research is still developing, preliminary findings include the
importance of using a proxy carbon price to acknowledge carbon emissions in long-
term projects and as a risk management tool. Including a Life Cycle Cost with the
proxy price will allow capital decision-makers to see the full picture of social and
economic costs, instead of just the initial price. These strategies will likely work best
on capital projects, not only because of the lifespan, but also because of the
significant influence they have on the campus operations and mission.
Topics for Discussion
Life Cycle Costing
Have you used Life Cycle Costing at Smith or at other institutions? Do you
have suggestions or concerns about applying it here?
How do you determine the discount rate for Smith? How often is this
evaluated?
Your perspective on the decision making at Smith
What are the criteria currently used to make decisions for capital plan
projects?

120
From a financial perspective, what types of projects do you think would fit
best for applying a proxy carbon price?
From your position do you see benefits of proxy carbon pricing or have
concerns?
To: Smith College Committee on Sustainability
From: Alex Barron and Breanna Parker (‘18)
cc: Dano Weisbord, Susan Sayre
Topic: Smith College Proxy Carbon Price
*Please note that this Memo includes old monetary values for some of the social cost
of carbon values, which were corrected in this thesis to reflect the most up to date
values. This is the reason why the range of $60-$75 per MTCO2e was selected,
rather than a single value.
Summary: In order to implement a proxy carbon price, Smith College must select an
initial price to test. The 4 most common frameworks companies, governments and
institutions use to set a proxy price are: 1) the social cost of carbon, 2) regulatory
risk, 3) carbon markets, and 4) peer institutions. These are discussed below to inform
discussion of a recommendation for a proxy price at Smith.
Background
The Study Group on Climate Change recommended that Smith College
“Develop an internalized cost of carbon emissions—such as a carbon-proxy price—
to help guide major capital budget management and other decision-making
processes.”(1) During the 2017-18 academic year we have been working to develop a

121
framework and tool for a proxy carbon price that will allow Smith to account for
climate change in key decisions. Selecting the level of the proxy carbon price is an
important policy decision so we are seeking guidance from the Committee on
Sustainability on establishing the initial level to be used in the piloting of the tool.
There is no single correct way to select the level of a proxy carbon price, but
it is clear that any value is an improvement over zero. However, there are multiple
approaches to selecting the value, depending upon whether the focus is on
accounting for the social cost of carbon, mitigating regulatory risk, accounting for
carbon markets, or aligning with peers. These approaches are not exclusive and the
range of values suggested by each overlap. Below we briefly describe each approach.
For context, the proxy carbon price will be used to compare costs between
options (for example two types of window or fleet vehicles) over their lifetime of use
- including operating costs and carbon impact. The proxy price internalizes both the
potential costs to Smith associated with future climate regulation and the climate
damages associated with the emissions. The price is only used in decision-making,
and it does not reflect actual cost to the institution (we can discuss details).
1) The Social Cost of Carbon
Carbon dioxide emissions cause economic damages to current and future
generations, but these damages are not reflected in the price of carbon sources e.g.
fossil fuel (2). In theory, an optimal carbon tax would be set to reflect the social cost
of carbon and result in an efficient market (3, 4). Economists estimate the social cost
of carbon using models that integrate climate changes with socioeconomic damage

122
modules (2, 6). Many of these models include consequences such as sea level rise,
flooding, storm damage, lost agriculture production, and heat related health issues.
However, they omit critical variables like widespread biodiversity losses, ocean
acidification and also tend to underestimate the impact of climate change on the
economy (5, 7).
Price range: $10 to $220 per metric ton of CO2e (hereafter “ton”), depending upon
assumptions
2) Regulatory Risk
Over 1,300 companies are currently using or planning to implement internal carbon
prices and a major reason is to manage risk associated with future climate policy (8).
The proxy price screens for decisions that would not make sense in light of future
climate policy. For example Shell, Exxon Mobil, and Hess all use an internal carbon
price in their business strategy to anticipate a carbon-constrained world (8). While a
Federal climate policy seems unlikely in the next few years, several carbon tax bills
are under consideration in the Massachusetts legislature (9).
Price range businesses: $5 to $150 per metric ton (General Motors to Stanley Black
& Decker Inc.)
Price Range legislation: MA proposed bills: $10-$20 starts prices rising to $40 per
metric ton or higher
3) Current Markets

123
Some organizations set internal carbon prices based on existing carbon markets. For
example, to achieve carbon neutrality any emissions reductions that Smith can’t
achieve on campus could be offset by reducing emissions elsewhere with offsets.
Offsets are created by reducing emissions (e.g. planting trees, capturing methane)
and then sold in voluntary (or regulatory) markets (10). The offset price to reduce a
metric ton of carbon is wide-ranging and varies based on quality and type of the
offset. Smith has been collaborating with Hampshire, Williams, and Amherst College
on the Community Climate Fund to generate local carbon offsets through
investments in emission reduction projects, but the costs are higher than other
voluntary offset products (11).
Price range: less than $1 to more than $50 per metric ton
Another source of market prices are existing trading systems. Currently, the state of
Massachusetts participates in the Regional Greenhouse Gas Initiative (RGGI), which
is a market designed to cap emissions (12). The current market price is very near the
price floor, which results in a weak price signal (~$4). The European Union
established the first market system to cap emissions and trade for permits and has
fluctuated between about $5 and $35 but is currently at about $7 (13,14).
Price range: $2 to $35 per metric ton
4) Peer institutions
Princeton University began using a proxy carbon price in 2008 with a carbon price at
$35. The price was later raised to its current value of $45 per ton (16). Yale
University launched the Carbon Charge at $40 per ton in July of 2017 (15). This

124
program models a revenue neutral carbon fee that highlights a regulatory risk
approach. Swarthmore College has the highest carbon price at academic institutions
with a value of $100 per ton, which was established in 2017 (17).
Price range: $45 to $100 per metric ton
Options
As described above, carbon prices in the business world range from less than $5 to
over $100, as do estimates of the damages from carbon emissions. In our research,
we have grouped candidate prices into 4 general price ranges, which are described
below with a description of how they align with the criteria above.
A- Weak price signal ($5-15/ton) [Not recommended]
• A price in this range is consistent with: • Estimates of the social cost of carbon that do not take into account impacts of
climate change on other countries and/or place a very low value on impacts on future generations
• The low end of carbon prices used by businesses to plan for risk (General Motors $5/ton)(8)
• Prices found in existing carbon markets (RGGI <$5/ton, EU-ETS <$10/ton) that are not stringent enough to achieve decarbonization consistent with the Paris Agreement
• Prices for voluntary offsets that may vary in quality and in the degree to which they actually reduce emissions
• Prices below the carbon taxes being considered in the Massachusetts legislature
• Prices below those used by other academic institutions B- Common Estimates (~$40/ton)
• A price in this range is consistent with: • The most frequently cited estimate of the social cost of carbon (which takes
into account the global impacts of climate damage but is still missing many critical impacts)
• Carbon prices used by some oil companies to plan for risk (Shell and Hess) • Carbon prices that are roughly consistent with a trajectory towards 2 degrees
C (19) • Offsets that are locally produced with educational and community co-benefits

125
• Near-term prices for carbon taxes being considered in the Massachusetts legislature ($40/ton) (9)
• Prices used by Princeton ($45/ton) and Yale ($40/ton) (15,16) C- Higher Carbon Prices (~$60/ton) [Recommended option]
• A price in this range is consistent with: • Estimates of the social cost of carbon which place a higher value on the
impacts on future generations and may better reflect the true social cost of carbon as estimates are updated to include more missing damages (5)
• Carbon prices used by companies such as TransCanada and Michelin to plan for risk (8)
• Carbon prices that are consistent with a trajectory towards 2 degrees C • A greater supply of local offsets with educational and community co-benefits • Higher carbon prices that might be seen in future legislation
D- Highest Carbon Prices (~$100/ton) • A price in this range is consistent with: • Some of the most recent literature on the social cost of carbon which places
the a high value on future generations (low discount rates) and better accounting for risk aversion (values up to $220/ton) (7)
• Some of the highest carbon prices used by businesses (Stanley Black & Decker, Inc., Novartis) (8)
• The current carbon tax in Sweden is ($126/ton) (18) • The internal carbon price currently used by Swarthmore College ($100/ton)
(17)
Recommendation
In our review, estimates in the A range represent markets that are currently not
achieving the needed reductions, a social cost of carbon that significantly discounts
future generations, and is less ambitious than many other schools and institutions.
The B range is the common value among social cost of carbon estimates, proposed
Massachusetts regulation, and on the lower end of our peer institutions. The C range,
or the Goldilocks price, is our recommendation because it is a value between our
peer institution prices that is safely in line with a 2 degree C target and places a
higher value on future generations. The D range is the higher end of the carbon
prices, which may be more in line with the true cost of climate damages, but may be
significantly higher than is needed, especially to start.

126
Escalation
One final detail is that we recommend that any price selected rise over time. This the
increased damages from any given ton as GHG levels increase in the atmosphere.
Escalation rates for the above options can be taken from USG modeling (typically
about 2%/year - a $40 price in 2020 become $50 in 2030).
Readahead Committee on Sustainability Literature Cited
Smith College. (2017). Smith College: Study Group on Climate Change Report.
Retrieved from https://www.smith.edu/climatechange/
Nordhaus, W. (2015). Climate Casino: Risk, Mitigation, and Economics for a
Warming World. Yale University Publishing Press.
Nathaniel Keohane, & Sheila Olmstead. (2007). Markets and the Environment.
Island Press.
Stern Review. (2006). Stern review: The economics of climate change. Stern Review.
Retrieved from
http://mudancasclimaticas.cptec.inpe.br/~rmclima/pdfs/destaques/sternreview_report
_complete.pdf
Howard, (2014.) Omitted damages: What’s missing from the social cost of carbon.
Cost of Carbon.org 2014. Retrieved from,
http://costofcarbon.org/files/Omitted_Damages_Whats_Missing_From_the_Social_C
ost_of_Carbon.pdf

127
Interagency Working Group on the Social Cost of Carbon (IWG-SCC). (2016).
Technical Support Document: Technical Update of the Social Cost of Carbon for
Regulatory Impact Analysis Under Executive Order No. 12866. (2016, November
26). Retrieved from https://www.epa.gov/sites/production/files/2016-
12/documents/sc_co2_tsd_august_2016.pdf
Moore, F. C., & Diaz, D. B. (2015). Temperature impacts on economic growth
warrant stringent mitigation policy. Nature Climate Change, 5(2), 127. Retrieved
from https://doi.org/10.1038/nclimate2481
Carbon Disclosure Project (CDP). (2017). Putting a price on carbon Integrating
climate risk into business planning. Carbon Disclosure Project. Retrieved from
https://b8f65cb373b1b7b15feb-
c70d8ead6ced550b4d987d7c03fcdd1d.ssl.cf3.rackcdn.com/cms/reports/documents/0
00/002/738/original/Putting-a-price-on-carbon-CDP-Report-2017.pdf?1507739326
Massachusetts Legislature, 2017. Bills S. 1821, S. 1726, H. 3473. Retrieved from
https://malegislature.gov/Bills/Search.
Forest Trends Ecosystem Marketplace. (2017). Unlocking potential: State of
voluntary carbon offset. Forest Trends Ecosystem Marketplace. Retrieved from,
https://www.cbd.int/financial/2017docs/carbonmarket2017.pdf
Local-Community Climate Fund CET report
Regional Greenhouse Gas Initiative (RGGI). (2018). CO2 Budget Trading Program.
Retrieved from http://rggi.org/
European Union Emissions Trading System. (2018). EU Emissions Trading System
(EU ETS) Retrieved from https://ec.europa.eu/clima/policies/ets_en

128
Koch, N., et. al, (2014). Causes of the EU ETS price drop: Recession, CDM,
renewable policies or a bit of everything?- New evidence. Energy Policy Vol. 73, p.
676-685. https://doi.org/10.1016/j.enpol.2014.06.024
Gillingham, K., Carattini, S., & Esty, D. (2017). Lessons from first campus carbon-
pricing scheme. Nature News, 551(7678), 27. https://doi.org/10.1038/551027a
Princeton University. (2008). The Princeton University Sustainability Plan.
Princeton University Reports, 2008. Retrieved from
https://www.princeton.edu/reports/sustainability-plan-20080219/
Swarthmore College (2017.) The Carbon Charge: Carbon Pricing Policy. Retrieved
from https://www.swarthmore.edu/sustainability/swarthmore-carbon-charge-program
World Bank, EcoFys. (2017). Carbon price watch 2017. World Bank Climate
Change. Retrieved from
http://documents.worldbank.org/curated/en/699641497346643090/Carbon-pricing-
watch-2017
World Bank. (2017). Report of the High-Level Commission on Carbon Prices.
Washington, DC: World Bank. Retrieved from
https://www.carbonpricingleadership.org/report-of-the-highlevel-commission-on-
carbon-prices/

129
Appendix 3: External Stakeholder questions
Semi-structured interview questions prepared for the Association of the
Advancement of Sustainability in Higher Education (AASHE) conference.
Confidentiality & Consent: yes Casey Picket, Yale University; Shana Weber,
Princeton University; Aurora Winslade and Nathaniel Graf, Swarthmore
College
1. Does your institution use an internal carbon pricing model? Which one?
[if no, skip to No questions]
2. How long has the institution had it for?
3. What is the value for the carbon price?
a. What is the discount rate?
b. What sources were used to establish the carbon price?
4. What kind of decisions does carbon price apply too?
a. What types of capital management decisions is the carbon price
applied to?
b. How does the institution decide which projects to implement the
carbon price? What is the criteria?
5. How does the institution apply the carbon price once you have selected the
carbon price?
6. Can you explain an example of when a carbon price affected the decision
making process of a project?
a. How many decisions have been altered by a carbon price?
b. Are these data publically available?

130
7. What were the greatest institutional barriers to implementing the carbon
price?
8. What was one thing that was surprisingly difficult OR successful about
implementing the carbon price?
9. Did you monitor the responses of officials and/or students to the
implementation of the proxy carbon price?
a. If yes, how so?
No:
10. Is the institution thinking about implementing a carbon price? Why?
a. Which type(s)?
b. What are the motivations for the institution to implement a carbon
price?
11. What are the barriers that to implementing a carbon price?
12. Where is the institution at in the development process for a carbon price
policy?
Additional Questions:
13. Do you know of any schools, governments, or businesses that are actively
using a proxy carbon price?
14. Do you have any advice, questions, or comments for me as I develop a proxy
carbon price policy for Smith College?
Caroleen Verly
131
Harvard University
Phone Call
March 1, 2017
Confidentiality & Consent: Oral
1. Why does Harvard use the lifecycle cost calculator? And not include the
carbon price?
2. What are the project criteria to use the lifecycle cost calculator?
3. What types of projects work best with lifecycle cost calculations? Are there
any specific variables or criteria to look for?
4. Who performs the lifecycle cost calculation?
5. Is there any retrospective analysis conducted on the LCC usage and decision
making at Harvard?
6. How do decisions makers justify their decision if they select a project that is
not the best LCC option?
7. How does Harvard determine the greenhouse gas content (MTCDE) for each
utility, (e.g. natural gas, electricity)? What is the reference?

132
Appendix 4: Parameters for adapting the Harvard Lifecycle Cost Calculator to the Proxy Carbon Lifecycle Cost calculator

133
Appendix 5- Washburn House Retrofit Pilot Results from the Proxy Carbon
Lifecycle Cost calculator
These are the results for the retrofit options to sealing the envelope and
insulating the walls.
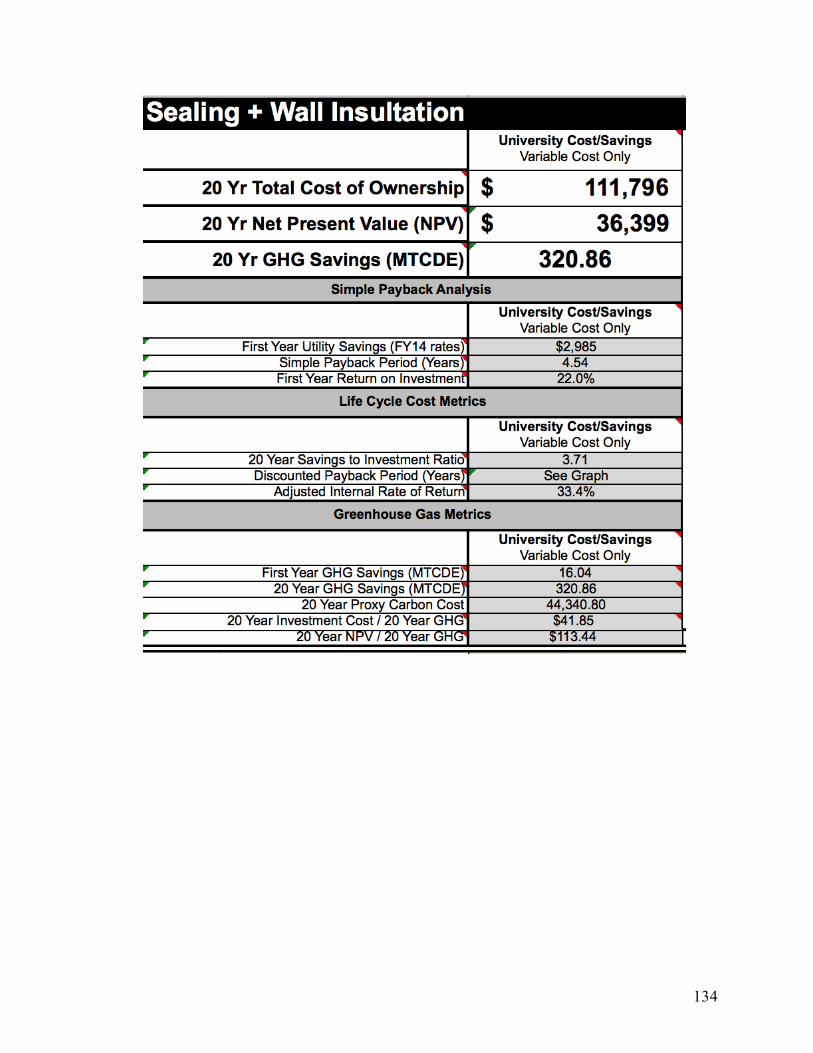
134