designing renewable carbon from lignin with a controlled
TRANSCRIPT

University of Tennessee, Knoxville University of Tennessee, Knoxville
TRACE: Tennessee Research and Creative TRACE: Tennessee Research and Creative
Exchange Exchange
Doctoral Dissertations Graduate School
12-2019
Designing Renewable Carbon from Lignin with a Controlled Designing Renewable Carbon from Lignin with a Controlled
Morphology for Supercapacitor and Polymer Composite Morphology for Supercapacitor and Polymer Composite
Applications Applications
Hoi Chun Ho University of Tennessee, [email protected]
Follow this and additional works at: https://trace.tennessee.edu/utk_graddiss
Recommended Citation Recommended Citation Ho, Hoi Chun, "Designing Renewable Carbon from Lignin with a Controlled Morphology for Supercapacitor and Polymer Composite Applications. " PhD diss., University of Tennessee, 2019. https://trace.tennessee.edu/utk_graddiss/5718
This Dissertation is brought to you for free and open access by the Graduate School at TRACE: Tennessee Research and Creative Exchange. It has been accepted for inclusion in Doctoral Dissertations by an authorized administrator of TRACE: Tennessee Research and Creative Exchange. For more information, please contact [email protected].

To the Graduate Council:
I am submitting herewith a dissertation written by Hoi Chun Ho entitled "Designing Renewable
Carbon from Lignin with a Controlled Morphology for Supercapacitor and Polymer Composite
Applications." I have examined the final electronic copy of this dissertation for form and content
and recommend that it be accepted in partial fulfillment of the requirements for the degree of
Doctor of Philosophy, with a major in Energy Science and Engineering.
Amit Naskar, Major Professor
We have read this dissertation and recommend its acceptance:
Timothy Tschaplinski, David Harper, Niki Labbe, Christopher Bowland
Accepted for the Council:
Dixie L. Thompson
Vice Provost and Dean of the Graduate School
(Original signatures are on file with official student records.)
Designing Renewable Carbon from Lignin with a Controlled Morphology for Supercapacitor and Polymer Composite
Applications
A Dissertation Presented for the
Doctor of Philosophy Degree
The University of Tennessee, Knoxville
Hoi Chun Ho December 2019

ii
ABSTRACT
Lignin is an abundant, underutilized, and renewable material that can also be used as feedstock for many industrial products. As part of the recent push for renewable materials development, this dissertation explores controlling the morphology of lignin-derived carbonaceous products via simple means for energy storage and polymer composite applications.
Lignin is a complex, multifunctional, and diverse molecule, and its functionalities depend on biomass source and isolation methods. Attempts have been made to produce lignin-derived spherical carbon particles but with limited success. In order to better understand the mechanism for controlling carbonized lignin’s morphology, a good first step is to study a simpler carbohydrate. Through the hydrothermal reaction of sugar and biomass pretreatment byproducts in aqueous medium, I learned the self-assembly mechanism of hydrochar spheres. Laboratory experiments and modeling revealed that when hydrothermal reaction was carried out in an emulsion medium, hollow hydrochar spheres with abundant microporosity can be formed. After carbonization and surface activation, the carbon produced can be used as supercapacitor electrodes.
Before attempting hydrothermal processing of lignin, I aimed to find a simple way to control carbonized lignin’s porosity in solid state via induced crosslinking during melt-mixing with a 10% rubbery macromolecule. After stabilization and one-step carbonization and surface activation, derivative carbon’s surface area and supercapacitor electrode performance was increased. With the lessons learned from solid-state lignin crosslinking and synthesis of carbohydrate-derived spherical hydrochar via solvothermal pathways, I focused on designing a method to produce spherical carbon particles from lignin. By subjecting lignin with solvothermal treatment in DMSO, a good solvent for lignin, spherical stabilized lignin particles were made. In a solvothermal condition, lignin crosslinking caused lignin precipitation, much like carbohydrate-derived spherical hydrochar. After carbonization, uniform spherical carbon was formed without templates, scaffolds, surfactants, or copolymers.
Lastly, I discovered that by using a simple self-assembly of lignin in nanoprecipitation, spherical lignin nanoparticles can be produced and stabilized in air without superheating in solvents. Using hydrothermal treatment, lignin nanoparticles could also be stabilized. However, hydrothermally stabilized particles released less volatiles during carbonization, leading to fewer defects and porosity in the resulting free-flowing carbon useful as polymer reinforcing agent.

iii
TABLE OF CONTENTS
INTRODUCTION...................................................................................................... 1
Chemistry of Lignin............................................................................................... 1 Lignin as an Underutilized Byproduct .................................................................. 2 Lignin-Derived Chemicals .................................................................................... 2 Lignin-Derived Fuels ............................................................................................ 4 Lignin as a Polymer Blend Component ............................................................... 6 Carbonized Lignin ................................................................................................ 7
Carbon Fiber ..................................................................................................... 7 Carbon Black .................................................................................................... 8 Activated Carbon .............................................................................................. 9 Carbon Application--Polymer Reinforcement ................................................ 10 Carbon Application--Electrical Double-Layer Capacitor, Supercapacitor, Electrodes ....................................................................................................... 11 Synthesizing Carbon with a Controllable Morphology--Activated Carbon .... 13 Synthesizing Carbon with a Controllable Morphology—Spherical Carbon Particles .......................................................................................................... 14
Challenges with Lignin Utilization ...................................................................... 16 Introduction of Biorefinery Liquid Effluence ....................................................... 17 Objectives ........................................................................................................... 18
Overarching Goal............................................................................................ 18 Specific Objective 1 (Chapter I) ..................................................................... 19 Specific Objective 2 (Chapter II) .................................................................... 20 Specific Objective 3 (Chapter III) ................................................................... 21 Specific Objective 4 (Chapter IV) ................................................................... 21
References ......................................................................................................... 23 CHAPTER I: AMENDING THE STRUCTURE OF RENEWABLE CARBON FROM BIOREFINERY BYPRODUCT-STREAMS FOR ENERGY STORAGE APPLICATIONS ..................................................................................................... 34
Abstract ............................................................................................................... 35 Introduction ......................................................................................................... 35 Results and Discussion ...................................................................................... 37
Structure of the Carbonaceous Materials ...................................................... 37 Gas Adsorption-Desorption and Surface Characteristics.............................. 45 Supercapacitor Application............................................................................. 50
Conclusions ........................................................................................................ 53 Methodology ....................................................................................................... 54
Hydrothermal Synthesis and Carbonization .................................................. 54 Activation ........................................................................................................ 54 Characterization.............................................................................................. 54 Computational Model...................................................................................... 55
Acknowledgements ............................................................................................ 56

iv
References ......................................................................................................... 58 Appendix ............................................................................................................. 63
CHAPTER II: A SOLVENT-FREE RENEWABLE CARBON SYNTHESIS FROM LIGNIN WITH TUNABLE POROSITY FOR SUPERCAPACITOR ELECTRODES ................................................................................................................................ 68
Abstract ............................................................................................................... 69 Introduction ......................................................................................................... 69 Results and Discussion ...................................................................................... 71 Conclusions ........................................................................................................ 79 Experimental Section ......................................................................................... 80
Lignin Preparation Method ............................................................................. 80 Sample Preparation ........................................................................................ 80 Carbon Precursor Characterization ............................................................... 80 Carbon Characterization ................................................................................ 81
Acknowledgements ............................................................................................ 81 References ......................................................................................................... 83 Appendix ............................................................................................................. 86
CHAPTER III: A SIMPLE METHOD FOR SYNTHESIS OF MICRONIZED CARBON SPHERES FROM LIGNIN .................................................................... 94
Abstract ............................................................................................................... 95 Introduction ......................................................................................................... 95 Experimental ....................................................................................................... 97 Results and Discussion ...................................................................................... 98 Conclusions ...................................................................................................... 108 Acknowledgements .......................................................................................... 109 References ....................................................................................................... 110 Appendix ........................................................................................................... 113
CHAPTER IV: SYNTHESIZING LIGNIN-DERIVED CARBON NANOSPHERES AND THEIR APPLICATION IN POLYMER COMPOSITES ............................... 125
Abstract ............................................................................................................. 126 Introduction ....................................................................................................... 126 Results and Discussion .................................................................................... 128 Conclusions ...................................................................................................... 135 Methodology ..................................................................................................... 135
Preparation of Nanosized-Lignin-Derived Carbon Sphere Particles........... 135 Preparation of Carbon-Polymer Composites ............................................... 136 Characterization............................................................................................ 136
Acknowledgements .......................................................................................... 137 References ....................................................................................................... 138 Appendix ........................................................................................................... 141
CONCLUSION ..................................................................................................... 142 VITA ...................................................................................................................... 143

v
LIST OF TABLES Table 1.1. Surface area and pore volume measured from nitrogen adsorption
isotherm. ......................................................................................................... 46 Table S1.1. Iron and potassium contents of all samples analyzed by inductively
coupled plasma optical emission spectrometry (ICP-OES). The minimal redox peaks in the cyclic voltammetry experiments and the low metal contents lead us to believe pseudocapacitance does not play a major role in the results. With that said, metal species did affect electrodes’ conductivity confirmed by electrochemical impedance spectroscopy and 5000 cycle stability results. ............................................................................................... 63
Table 2.1. Surface area, pore volumes, and capacitances at 100 mA/g for all carbon samples. ............................................................................................. 76
Table S2.1. Signal assignment in the 13C NMR spectrum of GLB Lignin. ........... 87 Table S2.2. Summary of oxygen analysis of all carbon precursor samples. ....... 90 Table S2.3. Summary of internal resistances, or equivalent series resistances
(ESR) of all carbon-derived electrode samples. ............................................ 93 Table 4.1. The diameters of the lignin precipitates from dialysis and lignin-derived
carbon nanosphere particles. ....................................................................... 129 Table 4.2. The oxygen contents of the stabilized lignin. ..................................... 134 Table S4.1. X-ray photoelectron spectroscopy results of the lignin-derived carbon
nanosphere particles. ................................................................................... 141

vi
LIST OF FIGURES
Figure 0.1: A schematic of an electrical double-layer capacitor device. .............. 12 Figure 1.1. Carbon spheres from the simple HTC synthesis (N carbon samples
that are made without use of any surfactant). (a) A schematic representation of the evolution of carbon spheres during simple HTC. SEM images of N samples with (b) 20, (c) 45, and (d) 165 minutes HTC durations showing carbon morphology evolving from amorphous irregular-shaped carbon to spherical particulate carbon with increasing HTC time. (e) TEM image of a single N carbon sphere with 45 minutes HTC duration (N45). (f) Thickness profile of the single N45 sphere showing a solid spherical structure formation. ........................................................................................................ 38
Figure 1.2. Carbon spheres from emulsion-based HTC synthesis (Y samples). (a) A schematic representation of the evolution of carbon spheres during emulsion-based HTC. SEM images of Y samples with (b) 45, (c) 165, and (d) 45 minutes HTC showing perfectly spherical structures with the longer HTC durations and a revelation of their hollow nature with broken spheres. (e) TEM image of a single Y sphere with 45 minutes HTC (Y45) showing its hollowness. (f) Thickness profile of the single Y45 sphere showing its thin shell, ca. 0.2 µm. SEM images of activated Y sample with (g) 45 minutes and (h) 165 minutes HTC showing the retention of carbon morphology after activation. Insert of (g) reveals the retention of hollow nature of spheres. (i) Y sample with 20 minutes HTC showing the out out-of-equilibrium structures, and (j) activated Y sample with 20 minutes HTC which retained the out-of-equilibrium structures after activation. ........................................................... 41
Figure 1.3. Spherical hollow carbon from steam pretreated woodchip liquid effluence. (a) SEM image. (b) and (c) TEM images. ..................................... 42
Figure 1.4. CGMD simulations of surfactant polymer mixtures replicating the surfactant-sugar emulsion HTC experiment. The top panel shows evolution of the bead formation inside the central simulation cell at (a) 3 million, (b) 4 million, (c) 5 million and (d) 8 million simulation time steps. The red and yellow color spheres represent surfactant head and tail segments. The grey color spheres represent the polymer molecules (sugar derivative in experiment). The images at (e) and (f) exhibit a single bead formed by surfactant molecules in the presence of surfactant as shown in blue circle in (d) and when the surfactants are stripped off from the same, respectively. The intermolecular structure factor, S(Q) for the bulk and near surfactant polymer molecules are plotted in (g) in red and blue color for high-Q range. The bulk and near surfactant polymer molecules are circled in (d) in red and blue colors also. The low-Q range profiles of S(Q) for the bulk and near surfactant polymers is shown in green and magenta color, respectively. The inset in (g) shows the snapshots for a completely stripped off surfactant system. ............................................................................................................ 44

vii
Figure 1.5. Carbon surface characteristics based on gas adsorption-desorption isotherm and porosity. (a), (b), and (c) Isotherms for adsorption-desorption for aY, Y and N series samples respectively. (d) Pore size distributions for different samples determined using the Quenched Solid Density Functional Theory (QSDFT). (e) Pore size distributions at longer length scales > 2nm to 200 nm. The color schemes are shown in the legends. ................................ 47
Figure 1.6. Small angle X-ray scattering (SAXS) data for N45 and Y45 carbon samples. .......................................................................................................... 49
Figure 1.7. Capacitance measurement using carbonaceous materials as electrodes of EDL supercapacitors. (a) Cyclic voltammetry IV curves for Y45 at 10, 20, 50, 100 and 200 mVs-1 scan rates. The legends are in mVs-1 (b) Charge-discharge experiments for Y45 sample at 200, 500, 1000 and 2000 mAg-1 current densities. Legends are in mAg-1. (c) Capacitances for all the samples as shown in the legend color code. (d) Table showing the capacitance values at two different scan rates. (e) Electrochemical impedance spectroscopy (EIS) results and (f) Cycle stability of aY20, aY45, and aY165....................................................................................................... 51
Figure S1.1. Thermogravimetric analysis of all hydrothermal synthesized samples prior to high temperature carbonization. Onset of thermal decomposition, thermal stability, and yield all follow the trend with 165>45>20 for N samples due to longer hydrothermal synthesis duration provides larger degrees of stabilization. The same conclusion however, cannot be drawn for the Y samples mainly because of the residue paraffin oil being burned off at ca. 300°C. All samples saw decomposition and carbonization up till ca. 700°C. Weights stay largely constant after ca. 700°C. N samples have noticeably steeper slopes and weight loss at ca. 400°C to 700°C due to volatile evolution which are less pronounce in the Y samples due to different carbonization mechanism. ..................................... 64
Figure S1.2. Electrochemical testing of the carbonaceous products when used as supercapacitor electrodes. Cyclic voltammetry of (a) Y20, (b) Y165, (c) N20, (d) N45, (e) N165, (f) aY20, (g) aY45, and (h) aY165 at 10, 20, 50, 100, and 200 mV s-1 scan rates. .................................................................................. 65
Figure S1.3. Electrochemical testing of the carbonaceous products when used as supercapacitor electrodes. Charge discharge curves of (a) Y20, (b) Y165, (c) N20, (d) N45, (e) N165, (f) aY20, (g) aY45, and (h) aY165 at 200, 500, 1000, and 2000 mA g-1 current densities. ............................................................... 66
Figure S1.4. Surface characterization and electrochemical testing of woodchip pretreatment liquid effluence-derived activated carbon. (a) Isotherm, (b) Pore size distribution, and density functional theory calculation reveals an abundance in microporosity (72%) and a smaller amount of mesoporosity (28%). (c) Cyclic voltammetry with symmetric rectangular shapes (at 10, 20, 50, 100, and 200 mV s-1 scan rates), (d) Charge discharge profiles with symmetric triangular shapes (at 200, 500, 1000, and 2000 mA g-1 current densities), and (e) Electrochemical impedance spectroscopy Nyquist plot indicating almost ideal capacitive behavior. (f) Capacitance vs. scan rates.

viii
(g) 5000 cycle stability with 90.5% capacitance retention supporting electrode’s practical application. .................................................................... 67
Figure 2.1. Scanning electron microscope images of carbonized GLB lignin and its rubber composites. a)-c) Doped lignin-derived carbon from composition with 90% lignin and 10% NBR. d)-f) Undoped lignin-derived carbon, i.e., carbon from 100% lignin. Left to right are samples with no stabilization time, one-hour stabilization, and six-hour stabilization. .......................................... 72
Figure 2.2. Thermal stability of carbon precursors with varied degree of crosslinking. Differential scanning calorimetry data of a) undoped GLB lignin carbon precursors and b) NBR doped GLB lignin carbon precursors. Thermogravimetric analysis of c) undoped GLB lignin carbon precursors and d) NBR doped GLB lignin carbon precursors. The insert of c) is a photograph of all undoped GLB lignin carbon precursors. (From left to right: P-GLB, P-1-GLB, and 6-P-GLB) ........................................................................................ 73
Figure 2.3. Chemical characteristics of carbon precursors with varied degree of crosslinking. Fourier-transform infrared spectroscopy of a) undoped GLB lignin carbon precursors and b) NBR doped GLB lignin carbon precursors. 75
Figure 2.4. Gas adsorption-desorption data. a) Isotherms and b) pore-size distributions of all GLB lignin carbons. ........................................................... 75
Figure 2.5. Performance of supercapacitor electrodes. a) Capacitance vs. current density of all samples. b) Typical charge discharge profiles at 100, 200, 500, 1000, and 2000 mA/g and c) Typical cyclic voltammetry at 10, 20, 50, 100, and 200 mV/s with doped GLB lignin-derived carbon as an example. d) Nyquist plots and e) enlarged Nyquist plots of all carbon electrodes. f) Cycle stability of GLB lignin derided carbon, doped GLB lignin-derived carbon, GLB lignin with one-hour stabilization-derived carbon. ................................. 78
Figure S2.1. 13C NMR spectra of GLB lignin......................................................... 86 Figure S2.2. HMQC spectrum of GLB lignin. Assigned lignin substructures are in
Figure S2.3. .................................................................................................... 88 Figure S2.3. Lignin substructures detected by HMQC. (A) β-O-4’; (B) β-5’
(phenylcoumaran structure); (C) β-β’ (resinol structure); (G) guaiacylpropane unit; (S) syringyl propane unit; (S’) syringyl propane unit with carbonyl at Cα; (H) p-hydroxyphenolpropane unit. ................................................................. 89
Figure S2.4. Differential scanning calorimetry data of a) undoped GLB lignin carbon precursors and b) NBR doped GLB lignin carbon precursors. ......... 90
Figure S2.5. Charge discharge profiles at 100, 200, 500, 1000, and 2000 mA/g of a) GLB lignin-derived carbon, b) GLB lignin with one hour stabilization-derived carbon, c) GLB lignin with six hours stabilization-derived carbon, d) Doped GLB lignin with one hour stabilization-derived carbon, and e) Doped GLB lignin with six hour stabilization-derived carbon. ................................... 91
Figure S2.6. CV at 10, 20, 50, 100, and 200 mV/s of a) GLB lignin-derived carbon, b) GLB lignin with one hour stabilization-derived carbon, c) GLB lignin with six hours stabilization-derived carbon, d) Doped GLB lignin with one hour stabilization-derived carbon, and e) Doped GLB lignin with six hour stabilization-derived carbon. .......................................................................... 92

ix
Figure 3.1. Scanning electron micrographs of carbon derived from solvothermally-treated lignin for a) 5 hours, b) 10 hours, c) 15 hours, and d)
20 hours at 200C. Inset image in (c) shows the emergence of spherical char (scale bar in c) inset image is 5μm). (e) X-ray diffractograms of 20 hours
solvothermally-treated lignin carbonized at 800C, 1200C, and 1600C show increase in (002) peak intensity with increase in temperature. Transmission electron micrographs of the surfaces of 20 hours
solvothermally-treated lignin carbonized at f) 800C, g) 1200C, and h)
1600C. ......................................................................................................... 100 Figure 3.2. Coarse-grained molecular dynamics simulations showing evolution of
spherical carbon beads from lignin. a) Initial simulation setup of 12-mer lignin molecules in a cubic box. Evolution of crosslinked lignin structures evolution for b) 1 million, c) 3 million, and d) 4 million LJ time-steps. e) Color representation of d) clearly visualizes the spherical structures. f) Radial distribution function of layered monomers inside the spherical shaped structures. ..................................................................................................... 102
Figure 3.3. Physical characterization of all solvothermally-treated solutions: a) viscosity vs. shear rate, b) shear stress vs. shear rate, c) thermograms from differential scanning calorimetry, d) size exclusion chromatography and the peak molecular weights, and e) onset of thermal degradation from thermogravimetric analysis........................................................................... 103
Figure 3.4. Fourier-transform infrared spectroscopy of solvothermally-treated solution. ......................................................................................................... 105
Figure 3.5. Carbon (left panel) and Proton NMR (right panel) spectra of solvothermally-treated lignin solutions with 0, 5, 10, 15, and 20 hours of treatment. ...................................................................................................... 106
Figure 3.6. Lignin substructures of a) β-O-4’, b) β-β’ (resinol structure), and c) β-5’ (phenylcoumaran structure) ..................................................................... 107
Figure S3.1. MD simulation analysis. a) Coarse-grained lignin beads represented in the FENE model. The gray beads are the backbone of lignin, and the red beads are crosslinking sites. b) Crosslinked bond formation as a function of time. As can be seen the lignin monomers crosslinks very quickly. c) Mean-square-displacement of the backbone as a function of time. The slope ~ 1.0 at long time shows diffusive regime representing the system is under equilibrium. .................................................................................................... 113
Figure S3.2. Photographs of solvothermally-treated lignin precipitate for a) 20 hours and b) 15 hours. Optical microscope images of solvothermally-treated lignin precipitate for c) 20 hours and d) 15 hours. ....................................... 114
Figure S3.3. a) FTIR and b) DSC of DMSO degradation products. ................... 115 Figure S3.4. Physical characterization of all solvothermally-treated lignin
solutions by thermogravimetric analysis. ..................................................... 116 Figure S3.5. 13C NMR spectra of the aliphatic region (10-40 ppm) of
solvothermally-treated lignin solutions with 0, 5, and 10 hours of treatment. ...................................................................................................................... 116

x
Figure S3.6. 13C NMR spectra of the region between ca. 52-61 ppm of solvothermally-treated lignin solutions with 0, 5, and 10 hours of treatment. ...................................................................................................................... 117
Figure S3.7. 13C NMR spectra of the region between ca. 67-89 ppm of solvothermally-treated lignin solutions with 0, 5, and 10 hours of treatment. ...................................................................................................................... 118
Figure S3.8. 13C NMR spectra of the region between ca. 100-160 ppm of solvothermally-treated lignin solutions with 0, 5, and 10 hours of treatment. ...................................................................................................................... 119
Figure S3.9. 13C NMR spectra of the region between ca. 160-190 ppm of solvothermally-treated lignin solutions with 0, 5, and 10 hours of treatment. ...................................................................................................................... 120
Figure S3.10. Proton NMR spectra for the region between ca. 0.5-2.4 ppm of solvothermally-treated lignin solutions with 0, 5, and 10 hours of treatment. ...................................................................................................................... 121
Figure S3.11. Proton NMR spectra for the region between ca. 5.8-9.8 ppm of solvothermally-treated lignin solutions with 0, 5, and 10 hours of treatment. ...................................................................................................................... 122
Figure S3.12. Proton NMR spectra for the region between ca. 9.45-10 ppm of solvothermally-treated lignin solutions with 0, 5, and 10 hours of treatment. ...................................................................................................................... 123
Figure S3.13. Proton NMR spectra for the region between ca. 3-4.2 ppm of solvothermally-treated lignin solutions with 0, 5, and 10 hours of treatment. ...................................................................................................................... 124
Figure 4.1. Scanning electron images of a) lignin precipitates from dialysis, b) stabilized lignin in air, c) stabilized lignin in hydrothermal condition with the headspace filled with air prior to the start of the reaction, d) stabilized lignin in nitrogen, and e) stabilized lignin in hydrothermal condition with the headspace purged with nitrogen prior to the start of the reaction. .............. 128
Figure 4.2. a) Differential scanning calorimetry, b) viscosity vs. shear rate, c) shear stress vs. shear rate, and d) expanded shear stress vs. shear rate of the lignin-derived carbon nanosphere particles and styrene-butadiene rubber composites. ................................................................................................... 130
Figure 4.3. a) The compiled surface area and pore volume, b) isotherms, and c) pore size distributions from nitrogen adsorption-desorption experiments of the lignin-derived carbon nanosphere particles. .......................................... 132
Figure 4.4. Thermal gravimetric analysis of the stabilized lignin. ....................... 134

1
INTRODUCTION
Chemistry of Lignin
Lignin is identified as a structurally complex,1 highly branched, and multifunctional polymer2 with various functional groups: aliphatic, phenolic hydroxyl, carboxyl, carbonyl, and methoxyl groups. It is a molecule found in plants that can make up to almost half of its weight.1 In woods, while cellulose made up of ca. 70% of its weight, lignin can make up the other 30% with a minor component of hemicellulose.3 Much like engineering composites, lignin in plants acts as a matrix polymer which holds tight to the cellulose fibers, giving plants their strength. Lignin molecules are phenylpropane units made from different aromatic alcohol precursors. These are coumaryl alcohol, guaiacyl alcohol, and syringyl alcohol. When plants grow, these aromatic alcohol precursors link together to form a complex three-dimensional molecule.4 Lignin structures are very complex, and their types are very diverse. Based on the different environments that plants grow in and the plant species, e.g., pine, poplar, eucalyptus, corn stover, miscanthus, and switchgrass,5 lignin molecules can differ extensively. The molar mass, polydispersity, and the glass transition temperature, three critical parameters for polymer production from lignin, varies with the origin of the lignin molecule.1 Besides the different plant species, lignin molecules also differ based on the type of process used to separate them from the plant biomass. There are two main types of processes: sulfur process and sulfur-free process. They produce four main types of lignin: kraft lignin, sulfite lignin, solvent pulping lignin, and soda lignin.6 Kraft lignin, which is lignin derived from the sulfur process, contains 1-2% of sulfur. It also contains a large number of condensed structures and phenolic hydroxyl groups. Lignosulfonate lignin (sulfite lignin), the other lignin type from the sulfur process, has a considerable amount of sulfur in the form of sulfonate groups. It is the most studied lignin type for industrial applications such as binders, adhesives agents, additives, etc. However, lignosulfonate is often contaminated by impurities from the lignin extraction process, which affect its reactivity during polymer production downstream. Organosolv lignin and soda lignin are the two types of lignin from the sulfur-free process.1 Organosolv lignin is generally purer and of higher quality. Soda lignin, the second type of lignin from the sulfur-free process can sometimes contain high silicate and other inorganic contents due to the extraction procedure.7

2
Lignin as an Underutilized Byproduct Lignin is, in fact, the second most abundant natural polymer after cellulose but is one of the most underutilized resources.8 It can be a byproduct mainly from the pulping industry. Currently, the majority of lignin produced is only burnt as a low-cost fuel for heat recovery at an equivalent value of ca.4 cents a pound.9 To isolate lignin from biomass, specialty enzymes, acids, bases, organic solvents, or hydrothermal methods are used to dissolve different plant components for accessing cellulose, the primary product. Lignin is in turn left behind.10 A typical pulping plant can produce ca. 100K to 200K tons of lignin per year.5 In total, it has been estimated that 50 million tons a year of lignin is produced just from the paper and pulp industry,2 but only two percent of it is being commercially utilized to produce value-added products.1 Despite its low utilization, new pulping plants continue to be built. Traditionally, pulping plants produce more lignin than their energy needs, leading to lignin production continuing to soar.5 It was predicted that by 2022, new pulping plants would produce an additional 62 million tons of lignin.11 Pulping plants are keenly interested in making value-added products from lignin as an additional revenue stream.5 The abundant availability of this renewable material could meet the needs for global concern of energy independence, rural development, and climate.12 Strategies to utilize lignin for these needs include developing lignin-derived low-cost carbon fibers, plastics, adhesives, foams, membranes, thermoplastic elastomers, carbon, fuels, chemicals, etc., which mostly are produced from petroleum currently.1 However, each application faces its hurdles. For example, because of the diversity and multifunctionality of lignin, scientists face challenges in producing lignin-derived fuels and chemicals with high purity. Many competing reaction pathways of lignin yield multiple product streams in a process, making them unusable without extensive separation and purification processes.13 To further exemplify challenges with lignin valorization, it is convenient first to introduce the different applications of lignin-based products.
Lignin-Derived Chemicals
Searching for a viable way to produce lignin-derived chemicals is a hot area of research. Some of the many chemicals actively being researched are vanillin, syringic acid, dicarboxylic acids, phenols, and dimethyl sulfide.14-15 With some of the lignin’s unique properties, it has also been explored to use as a resin,16 adhesive,17 binder,18 and dietary supplement.14 However, because of the multifunctionality and the diverse nature of lignin, most processes being

3
developed can only achieve a low yield and low selectivity for the targeted compound. As a result, additional costly purification steps are often needed.19 One of the most successful lignin-derived chemicals would be the production of vanillin.20 Vanillin is a common cosmetic, food, and beverage additive for flavoring purpose and is the main ingredient in vanilla. Since 1937, lignin has been used to produce vanillin until the wider adaptation of petroleum‐based feedstocks.21 The most common method to produce lignin-derived vanillin is the wet aerobic oxidation process. This process involves treating lignin at 160–170 °C under 10–15 bar pressure in an alkaline solution with the presence of a catalyst in air.22 The yield of vanillin is low and is typically under 20 %.23 As a result, robust purification steps are needed. The most common method would be first to react vanillin with bisulfite to increase its solubility in water. Impurities can then be separated by the extraction of an organic solvent with vanillin remaining in the aqueous phase. 24 With the high cost of purification and production, lignin only produces 15% of the global production of vanillin. Currently, the majority of vanillin is produced from petroleum sources. Only less than 1% is extracted from vanilla beans.15, 23 Using lignin as part of a resin blend is also an attractive application. Epoxies and phenolics are two promising areas.25 Lignin can be used as an adjunct crosslinker.26 For example, for a lignin-derived epoxy system, lignin can first be reacted with epichlorohydrin and subsequent purified.26 In 2000, lignin-based epoxy resin system was commercialized and produced at an industrial scale until the liquidation of the company in 2000.17 In 2001, lignin has been attempted to replace part of an epoxy resin for printed circuit board and exhibited properties comparable to commercial products.16 However, impurities in lignin often complicate the effort for using lignin as a resin.17 Alternatively, in phenol-formaldehyde resin productions, lignin can be used as part of the precursor instead of phenol.27 It has been shown that with the incorporation of lignin, the rigidity of the polymer was increased.28 Lignin-derived phenol-formaldehyde resins can be used as environmentally friendly adhesives for plywood, chipboard, or fiberboard. Using lignin as a dietary supplement is another active area of development.14 Lignin has shown to be a good free-radicals scavenger14 and potentially a natural antioxidant.29 Other work has shown that lignin can also contain antiviral,30 antibiotic, and anti-carcinogenic activities and has the potential to be of additional dietary fiber for animal feeds.31 Many of these applications will require further research and are still under development in terms of the optimal dosage and potential side effects.31

4
Lignin-Derived Fuels
As mentioned above, 50 million tons of lignin are produced annually, just from the paper and pulp industry. Due to the United States Renewable Fuel Standard, as part of the Energy Independence and Security Act of 2007, which set roadmaps for the implementation of biofuel production, the number of biorefineries in the US and in turn, lignin production, is projected to increase. With an increasing amount of lignin, it became necessary to find a viable usage of lignin such as a high-demand commodity. Currently, the most viable usage of lignin is in fuels.32 Ample research has been done on lignin-derived fuels. Comparing to common liquid fuels, lignin is a much larger molecule with ca. 800-900 carbon atoms and ca. 35% oxygen. For common fuels like gasoline and diesel, they contain only 5-10 and 12-20 carbon atoms respectively with no oxygen content. As a result, the general strategy of making lignin-derived fuels is by depolymerizing lignin into smaller molecules, decreasing the O/C content, and increasing the H/C content.32 Lignin depolymerization can be performed in a plethora of ways. However, these methods usually result in a complex mixture of products, and each compound constitutes to a few percent.33 A few of the lignin depolymerization methods are described below.
1) Pyrolysis One of the most promising routes is pyrolysis. For example, fast pyrolysis
is the thermal treatment of lignin at ca. 375-530 C in an inert environment. During fast pyrolysis, lignin breaks down, forming many phenolic compounds.32 Lignin breaks down along with the cleavage of its interunit linkages via deoxygenation, hydrogenation, dealkylation, and demethoxylation.13 Lignin pyrolysis often comprises of a mixture of bio-oil, gas, and char. 32 For the purpose of lowering the required pyrolysis reaction temperature, a hydrogen atmosphere and a catalyst can be provided for the system. In addition, catalytic hydropyrolysis produces fuels with lower oxygen contents.19
2) Sub-and-supercritical water
The depolymerization of lignin can also be carried out in an aqueous environment. In the presence of water, ether linkages, alkyl groups, and methoxyl groups on lignin are easily cleaved. Residual lignin and lignin fragments can also concurrently be crosslinked into larger molecules.34-37 For an increase bio-oil yield, it has been shown that the addition of
5
alkaline into the sub-and-supercritical water treatment of lignin would promote its hydrolysis.38-39
3) Solvent depolymerization For high yields of lignin depolymerization products, instead of aqueous solvents, lignin can be subjected to organic solvents like ethanol,40-43 methanol,44-45 acetone/water,46 and butanol47 for its solvothermal treatment. The typical solvothermal treatment of lignin takes place at ca. 200–350 °C with a self-generated pressure for its depolymerization.19
To convert depolymerized lignin phenolics into value aromatics and alkanes to be used in the drop-in replacement of liquid fuels, upgrading would need to be carried out. Hydrodeoxygenation is a typical method for such upgrading. Hydrodeoxygenation usually involves the treatment of lignin-derived phenolics in
a hydrogen environment at high pressure and temperature between 200-500 C with the presence of a catalyst. The hydrogen environment can come in the form of a pressurized gas or a hydrogen-donor solvent such as formic acid.48-49 During the reaction, oxygen is removed as water, saturating the aromatics.32 The challenge with lignin-derived bio-oil upgrading would be finding a robust catalyst and fundamental understanding of lignin chemistry32 Another type of lignin-derived fuel can be syngas. During the production of lignin-derived syngas, lignin decomposes and gives off a mixture of gaseous products like hydrogen, carbon dioxide, carbon monoxide, methane, and possibly dihydrogen sulfide gas. The gas mixtures are collectively known as syngas. Syngas can be used for generating electricity or be further reformed into liquid fuels and chemicals. Lignin-derived syngas can be carried out mainly by lignin pyrolysis or gasification.19
1) Gasification Under a high-temperature environment, lignin degrades, giving off volatile gaseous compounds. The incomplete combustion of lignin leaves behind char residue, which can further react with its gaseous products like carbon monoxide and steam to be further gasified.50 Gasification of lignin can be carried out in the presence of steam, oxygen, and catalysts.51
2) Pyrolysis
As mentioned, pyrolysis of lignin gives off a host of products which include hydrogen and methane, the main components of syngas.52 However, pyrolysis of lignin typical yields a large amount of solid residue of up to 40% and thus, limiting the fraction of lignin biomass that can be gasified.19

6
Lignin as a Polymer Blend Component Polymers, e.g. plastics, are currently primarily made from petroleum. Interests in lowering fossil fuel dependence raised the interest of finding renewable polymer fillers. Many favorable properties of lignin put it as a desirable candidate. For example, Thielemans and Wool stated that lignin incorporation into a polymer could improve its stiffness, thermal stability, biodegradability, and oxidation resistivity.53 However, many drawbacks of lignin make its application as a polymer filler challenging. According to Wu and Glasser, “lignin is obviously designed as a high impact strength, thermally resistant thermoset polymer”; however, there are “technical limitations and constraints imposed by the polymeric nature” of lignin.3 For example, lignin is a brittle material. In many cases, when lignin is mixed into polymer matrices, the elongation at break is generally decreased, while the tensile strength can sometimes be maintained.54 Secondly, a lignin's phenyl rings, phenolic hydroxyl groups, and aliphatic hydroxyl groups are likely to associate with each other in an intermolecular fashion. Interaction through hydrogen bonding, van der Waal’s attraction, intermolecular crosslinking,55 and pi-pi stacking of aromatic groups are possible.56 These cause lignin to self-aggregation resulting in a lack of dispersion of lignin57 within polymer matrices, especially with thermoplastics.58 By using simple methods, our research group is progressively improving lignin’s miscibility in polymer matrices. For example, Akato et al. found that adding 10% PEO into lignin acrylonitrile butadiene styrene (ABS) blends, ABS’s mechanical properties can be largely maintained. PEO played a crucial plasticizing role in lignin while stiffening the ABS. PEO addition allows the lignin domains to disperse better, reducing their domain sizes from 300-1000 nm to 200-500 nm.59 Tran et al. turned their attention to optimizing lignin-NBR blends by studying different acrylonitrile contents and mixing temperatures. Lignin-NBR crosslinking was utilized to tune the composite’s morphology and performance. The produced products have “unprecedented yield stress” of up to 45 MPa.60 Most recently, by meticulously tuning lignin-NBR’s dynamic temperature-induced crosslinking, Nguyen et al. were able to mix up to 60% lignin in NBR and produced a shape memory rubbery material. When coated with a thin layer of metallic nanoparticles, its conductivity can be altered with strain, possibly serving as a good health monitor for structures.61 Other research groups have proposed many other strategies. These include creating more uniform lignin prior to polymer blending. In terms of lignin Tg and molecular weight, it can be modified by fractionation,62 crosslinking,2 and depolymerization.63 Soft segments can also be introduced into lignin,54 making it less brittle. To increase lignin’s compatibility with a polymer matrix, it can be

7
modified chemically.58 Last but not least, bioengineering has made advances to make lignin with more desirable properties, such as reducing its crosslink densities and making it more extractable.64 Using lignin as a macromolecular precursor of a polymer and even a filler in a polymer matrix is ongoing work. On par with lignin-polymer blends, a focus on the carbon and composite research community for lignin valorization is carbonized lignin.
Carbonized Lignin Carbon Fiber Carbon fibers are high-performance materials that have great specific strength, stiffness, temperature stability, and wear resistance.65 Polyacrylonitrile (PAN) is the traditional carbon fiber precursor. Many desirable mechanical properties of carbon fibers can be originated from their graphitic layers, aligning along the fiber, giving great mechanical strength. PAN-derived carbon fibers have been widely used as reinforcement in advanced composites for the aerospace, construction, and automotive industries.66 In the past decade, policy changes have mandated automobiles to meet higher fuel economy standards. To meet the new regulation, car manufacturers turned to carbon fiber-reinforced composites as replacement of steel and other metals to reduce vehicles’ weight and increase their fuel economy. However, carbon fibers made from polymeric precursor such as polyacrylonitrile (PAN) are too costly for automotive application compared to steel. Prompting new research interest in developing low-cost carbon fiber, positioning lignin as the next viable carbon fiber precursor.67 Because of lignin’s aromatic structure, it was perceived to be useful for making graphitic structures.68 Much like PAN-derived carbon fibers; lignin can first be spun into lignin fibers in a molten or solvated state, thermally stabilized, and finally carbonized in a pyrolysis process.5 During lignin pyrolysis, its abundant functionalities yield volatiles, oxidized products, gasses, and moisture, creating pores and defects on the fibers.69 The resulting lignin-derived carbon fibers contain a large amount of porosity and lacking orientation in their graphitic structures.70 Porosity and defects are detrimental to structural carbon fibers.71 As oppose to lignin-derived carbon fibers, the traditional PAN-derived carbon fibers have little porosity with long-range ordered graphitic structure, giving desirable mechanical properties.72 Ongoing work aims to develop a better understanding on the fiber-forming precursor synthesis and lignin chemistry.5

8
It is known that a carbon fiber’s properties are mainly dependent on its precursor.68 On this front, researchers are trying different lignin types, blending with additives, and co-spinning lignin with another polymer.68 Lignin is a polydisperse polymer with low degradation temperature relative to its softening temperature, making fiber spinning and stabilization challenging and crucial. To tackle this, lignin fractionation prior to spinning has been attempted.71 It was also proposed that the addition of plasticizers and functionalizing lignin could lower its softening point, facilitating its processing. With this, much attention with lignin-derived carbon fiber has turned to specialty carbon fiber such as using electrospinning to producing porous carbon fibers in the nano-scale for special functionality.68 Carbon Black Carbon blacks are fine particles fused into chain shaped aggregates ranging from 10-500nm that are mainly composed of elemental carbon. It is usually produced by the incomplete combustion of natural gases, oil, or other fossil fuels. The type of feedstock, reaction time, and reaction temperature define the type of carbon black made. The types of carbon black can vary in size, shape, porosity, and degree of aggregation, which can affect its mechanical properties, processability, miscibility with polymers, tinting ability, electric conductivities, etc..73 Carbon black serves as an additive for many purposes such as to enhance material performance, coloring, conductivity, viscosity, static charge control, and UV protection. We can find carbon black in many products like coatings, polymers, fibers, paper, cement, concrete, batteries, metals, foams, printing inks, etc.74 Even though the use of carbon black is diverse, over 90% of the carbon black produced is used in rubber applications. Many processes can be used to make carbon black. The most adapted process, which accounts for more than 98 % of the world’s annual carbon black production is the furnace black process. 74 In this process, a liquid hydrocarbon, e.g. heavy oil, is used as a feedstock and a gas, e.g. natural gas, is used as a heat source. The feedstock and heat source are sprayed and combusted in a furnace. Within seconds, the mixture is quenched by cold water, and the reaction stops. Carbon black traveling in the gas is cooled down, filtered, collected, and palletized. In the end, free-flowing pitch-black powder with >95% carbon content can be formed.74 These particles produced consist of concentrically arranged, graphite-like crystallites. However, the graphite layers are often twisted and disordered, making carbon black a disordered form of graphitic carbon at best. If needed,
ordered graphite can be produced with a graphitization process at ca. 3000 C.74 Heteroatoms like oxygen, nitrogen, and sulfur functionalized on carbon black surface are common. If the carbon black is designed as an additive for a polar matrix, oxidative treatment can be carried out to induce additional oxygen content

9
of up to 15%. These additional functional groups like carbonyl, carboxyl, phenol, ether, etc., can give better polymer matrix-carbon black interaction. 74 In many ways, carbon black is similar to carbon fiber. Challenges in producing lignin-derived carbon black are similar to challenges in making lignin-derived carbon fibers. The many challenges, however, can potentially be of advantage to lignin-derived activated carbon. The fourth chapter of this dissertation further discusses lignin’s potential as a carbon precursor for polymer composite applications. Activated Carbon Activated carbon is a highly porous carbonaceous material.75 It is largely made up of amorphous structures with randomly oriented domains of microcrystalline structures and slit-shaped pores.76 The microcrystallites can be functionalized with heteroatoms like oxygen and nitrogen. These defects expand aromatic carbon sheets when compared to graphite.77 Morphology of an activated carbon depends on its precursor and the carbonization and activation parameters.78 Common activated carbon precursors can be fossil fuels like coal and lignite or biomass like coconut shells, wood, and animal manure.79 Typically, biomass can be made into activated carbon with carbonization and activation processes. Carbonization involves thermally induced chemical changes in carbon precursors along with the formation of evolved gases.80 Functional groups and volatiles from lignin continuously degrade the chemical structure over a broad temperature range typically yielding 30-50 % carbonized
carbon up to ca. 1000 C in an inert environment.81-82 Activation in an oxidizing environment results in the removal of carbon, which develops an extensive porous structure. Pores on activated carbon can come in many forms. When a pore is larger than 50 nm, it is classified as a macropore. When a pore is between 2 nm to 50 nm, it is classified as a mesopore. When a pore is 2 nm or less, it is classified as a micropore.83 When pores are connected, they create a network. If the network is in a coordinated fashion, it is sometimes termed a hierarchical porous structure. The porosity of an activated carbon often defines its properties and applications.84 During lignin-derived activated carbon synthesis, oxygen functional groups like hydroxy, carboxyls, aldehydes, phenolics, and methoxyl can be developed along with aliphatic and aromatic carbons.75 The abundant surface area, pore volume, and functional groups can be beneficial in applications such as CO, CO2, and heavy metal adsorption for air and water purifications.75 Besides from air and water purification applications, because of the high thermal and chemical stability, activated carbon has a plethora of other uses. These usages include soil treatment, separations, catalysis, energy storage, pharmaceuticals, and food.85

10
Due to the high carbon content and functionalized phenolic structure of lignin, it can be considered as one of the ideal precursors for activated carbon.68 The second chapter of this dissertation exemplified how functional groups on lignin can be utilized for designing activated carbon. Carbon Application--Polymer Reinforcement As mentioned in the carbon black section, the main application of carbon black is serving as a polymer reinforcement for polymer composite application. It is also used at low concertation as a pigment. Depending on the size, shape, porosity, and the degree of aggregation, carbon black can affect the mechanical properties, processability, tinting ability, and electric conductivities of the polymer composites produced.73
A high performing carbon reinforcement requires a 1) good interaction with matrix
and 2) strong mechanical properties. Reinforcement-matrix interactions can
come in the form of chemical and physical interactions.86 For physical
interactions, reinforcement’s surface roughness and porosity are important
factors. For chemical interactions, surface functional groups are the key. As a
polymer reinforcement, carbon black with small sizes are preferable, ideally
below 100nm. The smaller carbon black particles provide a larger surface for
polymer matrices to interact. Interactions between carbon reinforcement and
polymer can be complex, including Van der Waals forces, covalent bonds, and
mechanical interlocking.87 In case of carbon black reinforced rubber, bound
rubber is the term for rubber matrix that is located adjacent to the surface of
carbon black particles, which is tightly interacted with the carbon reinforcement,
serving as the interface between the matrix and the reinforcement phase. It is
widely assumed that bound rubber is the strongest part and the amount of it
reflects the strength of the composite. With NMR, it was estimated that the bound
rubber layer could be 0.5-5 nm in thickness.88
Traditionally, carbon black is manufactured from the incomplete combustion of
fossil fuels such as tar and coal tar.89 Lignin, a renewable material, can be a
good alternative feedstock. If lignin-derived reinforcing carbon can be made at a
low cost with great mechanical properties, they can find immediate use.60
Recently, the world has seen a shortage in the carbon black supply and is
projected to worsen. When tire demand is assumed to grow according to GDP, it
is predicted that by 2025, the North American carbon black shortage will reach
365 million pounds, mainly limited by domestic production capacity and raw
materials in the US. Currently, carbon black demand is already 84% of the
production capacity. While domestic production is limited, import is another
option to meet the growing demand. However, imports will be highly depending
on oil price, which is volatile and remains relatively low. The carbon black

11
shortage in the American market is imminent; however, Asia’s carbon black
market is even more alarming mainly due to policy changes.90
Recently, the Chinese government has drastically tightened the financial market,
environmental regulation, and inspection. Many carbon black manufacturers are
forced to shut down. With the growing automotive demand, carbon black price
soars. Carbon black manufacturers that managed to stay in business saw
massive growth in net profit ranging from two to five folds from 2017-2018.
Because China is one of the major exporters of carbon black, it created a domino
effect across the region like India.91
The acute carbon black shortage in India has caused the carbon black price to
surge 60% within six months prior to February of 2018. Even with the sudden
growth in domestic tire production need due to the recent ban on Chinese tire
import, local tire companies are forced to cut production. The Indian carbon black
shortage is also harming the belt, hose, and rubber economy, which all rely on
carbon black,92 making a case for alternative carbon black feedstock research.
Carbon Application--Electrical Double-Layer Capacitor, Supercapacitor, Electrodes Electrical double-layer capacitors (EDLC), or supercapacitors, are energy
storage devices with power performances that fit in between dielectric capacitors
and batteries from the Ragone plot, which exemplifies the energy and power
relationships for different energy storage devices.93 EDLC store energy based on
two different principles: 1) Electrical double-layer capacitance from the pure
electrostatic charge accumulation on the electrode interface, and 2) the pseudo-
capacitance based on fast and reversible redox processes.94 Unlike traditional
batteries, the electrostatic separation between ions in electrolyte and electrons in
electrodes in EDLC allows for higher charge-discharge rates and stabilities.95-97
Using porous carbonaceous materials to serve as electrodes has gathered
significant interest,98-99 especially when derived from renewable materials.100-102
An EDLC consists of two porous electrodes, which usually are made of carbon.
(Figure 0.1) The two electrodes are attached to two current collectors, which are
separated by a separator soaked in an electrolyte solution. When a voltage
source is connected with the current collectors, a potential is applied, charging
the two electrodes. When charged, the anions in the electrolyte would be
attracted, migrated, and eventually adsorbed onto the positive electrode surface.
Cations, on the other hand, would be attracted, migrated, and eventually
adsorbed onto the negative electrode surface. When the electrode surfaces are
saturated, they are now in the charged state. Discharging of an EDLC takes
place when a charged device is connected to a load. During discharging, the

12
electrolyte ions would desorb from the electrode surface into the bulk electrolyte
solution. The desorption also allows the flow of electrons from the anode into the
cathode, generating current. When utilizing electrodes made from lignin, cost and
sustainability can be of added advantages.
As mentioned, EDLC rely on the physical separation of charges for energy
storage.103 Because physical charge separation is the key, high-performing
EDLC correlate directly with the carbon electrodes’ porosity and accessible
surfaces by electrode ions.104 The accessible pores are the active sites which
allow electrode charges to interact with electrolyte ions, thus storing energy. As a
result, capacitances generally follow the same trend as surface area and pore
volume based on the governing formula for capacitors, C= ε·A/d, where C is the
capacitance of the EDLC, ε is the product of electrolyte dielectric constant and
permittivity of free space, A is the surface area between the electrode and
electrolyte, and d is the separation distances between ions in the electrolyte and
the electrons in the electrodes.44
The cutting edge electrodes fabricated using graphene or graphene-like
materials can have capacitances as high as ca. 300 F/g.105-106 However, those
exotic carbon materials can cost three times more than the current commercial
EDLC carbon electrodes made from coconut shell.107 In EDLC, where half of
their material cost comes from the carbon electrodes,107 cost barrier can easily
+
+
+
+
+
+
+
+
-
-
-
-
-
-
-
-
+
-
+
+
+
+
+
+
+
+
-
-
-
-
-
-
-
-
+
-
+
+
+
+
+
+
+
+
-
-
-
-
-
-
-
-
+
-
- +
DischargingCharging
Wire
Current collector
Porous carbon electrode
Electrolyte ions
Separator
Figure 0.1: A schematic of an electrical double-layer capacitor device.

13
prevent market penetration, making a strong case for developing low-cost
biomass-derived carbon electrodes.
Synthesizing Carbon with a Controllable Morphology--Activated Carbon As mentioned in the previous sections, activated carbon with high porosity can be desirable for many applications including serving as supercapacitor electrodes. Because of the availability of abundant functional groups and high carbon content on lignin, the pyrolysis of lignin alone can produce porous carbon.70 However, the porosity created can be irregular.69 To gain better control in developing a desirable porosity and higher surface area activated carbon. The addition of activating agents or templates will be required.
1) Physical activation In physical activation, carbon precursors or carbonized material are typically infused in an oxidizing gas such as CO2 or steam at ca. 600–
1200 C.108 Depending on the gas species used, abundant microporosity can usually be developed.75 During activation, oxidizing gas oxidizes away the more reactive carbon, creating porosity. Although it is desirable for the burn off to take place in the internal structure of carbon, it can be difficult to control and lead to unwanted burn off at the external surface of carbon.109 Compared to chemical activation, physical activation can be more convenient and does not require the washing of residual chemical activating agent upon activation.110
2) Chemical activation Chemical activation can be similar to physical activation in the sense that instead of using oxidizing gasses as the activating agent, it involves
H3PO4, KOH, NaOH, or others activating at 450–900 C in an inert environment.75 During activation, metal species intercalate within the carbon, stretching its lattice.111 Upon activation, metal species have to be washed off, creating pores. When comparing to physical activation, chemical activation can result in better pore development. However, the washing step could lead to environmental concerns.110
3) Hard templating and soft templating Much like the templating for spherical carbon mentioned below, both hard and soft templating can be used for generating porosity on carbonaceous materials. When combined with an activating agent above, templating can induce well-controlled porosity on the resulting activated carbon’s surface. Hard templating can be classified into two approaches. The first can be embedding a template into the carbon precursor. Upon carbonization and the removal of the template, pores can be generated from the space previously occupied by the template.112 In the other approach, a networked structure can be created by impregnating carbon precursor into the pores of a template. Upon carbonization and the removal of the

14
template, carbonaceous materials with an interconnected porous structure can be produced.113 For soft templating, an emulsion with surfactants can be used with the carbon precursor dissolved in one phase. Upon carbonization and the volatilization of the surfactant and solvent, porosity would be generated by the space previously occupied by the second phase.114
Synthesizing Carbon with a Controllable Morphology—Spherical Carbon Particles In the case of carbon black and activated carbon, there have been growing interests in creating carbon products with a spherical shape.112, 115-119 Spherical carbon particles can potentially be beneficial for increasing its packing density and processability.120 Spherical carbon has shown promises as a suitable scaffold, template, or capsule for metal species and catalyst.121 It can also be advantageous in catalysis, adsorption, and energy storage applications.112, 115-118,
122-123 Having a simple method to finely control the shape and morphology of carbonaceous materials is still a challenge. Current state-of-the-art methods are 1) hard templating, 2) soft templating and, 3) solvothermal treatment.124
1) Hard templating Hard templating usually involves carbonization of a carbon precursor with a sacrificial scaffold. The carbon precursor could be coated on top of the scaffold, or the scaffold could be particles filled within a carbon precursor. Upon carbonization, the scaffold can be burned off during the process, or be removed by solvent extraction, leaving behind a carbonaceous material with a reverse morphology of the scaffold. Silica is a common hard template of choice.124 For a typical carbon sphere particles production from glucose, it has been shown that a functionalized spherical porous silica particles can be an effective template. Glucose solution was first deposited onto the silica particles through electrostatic attraction. Upon carbonization, glucose-derived carbon can be produced with a silica core. After silica sacrificial template removal, hollow carbon sphere particles remained.125 Two significant drawbacks of this method are that it is time-consuming and expensive.124 Obtaining an effective template with a strong interaction with the particular carbon precursor is critical. The process can be tedious. In addition, a hard-templating method usually requires the removal of the sacrificial template upon carbonization. The template removal step can involve additional heating and or undesirable chemicals like strong bases and hydrofluoric acid.125
2) Soft templating Soft templating can be methods that utilize soft templates like Pluronic block copolymers, surfactants, and their derived vesicles, micelles, and bilayers as scaffolds. With the appropriate scaffolds, carbon precursors can self-assemble into different morphologies. Soft templating is often

15
combined with solvothermal treatments as mentioned below. Upon self-assembly, carbon precursors with the desirable morphology can be subjected to high-temperature carbonization step to be converted into carbonaceous materials. During the carbonization step, soft-templates often burn off as volatiles, allowing the carbonization step to also serve as the soft template removal step.118
3) Solvothermal treatment Solvothermal treatments involve heating carbon precursors in a solvent at a temperature above its boiling point. In a sealed reactor, a self-generated pressure will be maintained in the closed system.126 This is a versatile and potentially scalable method to process biomass.127 A few solvothermal treatments of lignin involve organic solvents, e.g. DMSO in chapter III of this dissertation; however, most use water. When water is used as the solvent, solvothermal treatment can be termed hydrothermal treatment.
When used at a temperature above ca. 350C with a vapor pressure of ca. 20 MPa, biomass gasification dominates. Biomass liquefaction typically
takes place between 250-300C for the production of bio-oil. The production of biomass-derived carbon, the focus of this research, typically
takes place around 150-250C.126 For this low-temperature hydrothermal treatment of biomass, it can also be termed hydrothermal stabilization or hydrothermal carbonization. In this dissertation, these words will be used interchangeably. Many biomass sources contain a high amount of moisture. The moisture can originate from lignin extraction using solvents or, in the case of chapter IV in this dissertation, water from dialysis nanoprecipitation of lignin. Because solvothermal treatment of biomass requires solvents, one of the major benefits of hydrothermal treatment of biomass is that it does not require the drying of biomass prior to processing.127 The versatility of this treatment also allows the use of different reaction medium, e.g. an emulsion medium in chapter I, soft templating, and hard templating as mentioned earlier.127 Using solvothermal treatment, it has been shown that glucose can undergo dehydration, condensation, and polymerization into hydrochar that self-assemble into hydrochar spheres.128
Although making lignin-derived spherical carbon particles is of great interest, few successful cases have been reported. One reported case involved utilizing a reverse micelle soft template in a water, chloroform, and sodium dodecylbenzenesulfonate surfactant emulsion. With this emulsion, the authors were able to self-assemble depolymerized lignin and high molecular weight functionalized cellulose, hydroxyethylcellulose, into spherical composites. After the composite precipitation by the addition of acetone and solvent removal, the depolymerized lignin and functionalized cellulose composites can be carbonized. Spherical porous carbon can then be made.129 Most recently, another case

16
involved a pair of a good and bad solvent of lignin. The authors first dissolved lignin in a good solvent, a base, then slowly added in an antisolvent, an acid, with stirring and heating. During lignin precipitation in the antisolvent, lignin self-assembled into spherical particles. After drying, the spherical lignin particles can be transferred into a hydrothermal reactor for solvothermal treatment for low-temperature carbonization.130
Challenges with Lignin Utilization
One of the main technological challenges with lignin-derived chemicals or fuels is manufacturing an intermediate or a product with high purity.5 As mentioned in the “Chemistry of Lignin” section, lignin is a diverse, often impure, structurally complex,1 and multifunctional polymer.2 With a wide range of bond strengths in lignin linkages, designing a reaction pathway for the conversion of such a molecule is a challenge. Often time, the depolymerization of lignin also requires catalysts.5 However, the diversity, multifunctionality, and complexity of lignin, again, creates unique challenges to find a single effective catalyst for the purpose. Furthermore, some lignin reactivity and conversion intermediates also poison catalysts.131 Lignin also tends to condensate at high temperatures, turning into unreactive solid residue, lowering product yields, and adding impurities into the reaction products.5
Secondly, lignin is a molecule isolated from biomass. For example, during biomass pulping, cellulose is of higher priority than lignin.5 As a result, pulping processes are optimized for the extraction of the other biopolymer instead of lignin. This partly resulted in an impure lignin product containing chemicals from upstream processing.5 For future research, finding a better extraction pathway for lignin without the scarifies of other biopolymers are essential.
The poor melt-processability of lignin also makes its use as a polymer filler challenging. Often, it is desirable to melt-mix polymer with the lignin fillers.132 However, the low degradation temperature and high thermal transition temperature complicates its mixing. In addition, lignin tends to self-aggregate in a polymer blend, and it can be challenging to produce a homogeneous blend.60 Via hydrogen bonding, Van der Waal’s interaction, and pi-pi stacking of aromatic groups, lignin tends to phase-separate in polymer blends.56 Last but not least, lignin is known to be a brittle material.54 When a high amount of lignin filler is used, the resulting mechanical properties of the polymer blend become poor.133
For carbonized lignin, the highly branched and globular nature of lignin made the formation of graphitic structures in structural carbon products difficult.5 In most cases, only amorphous, disordered, glassy carbons are produced.134 In addition,
17
lignin’s high thermal transition temperature and low degradation temperature makes it a poorly processable material. As a result, the production of lignin-derived carbonaceous materials can be a very slow process.72 Specifically, prior to carbonization, precursor often requires a stabilization step, creating additional crosslinks to give higher carbon yields with a desirable shape.5 Lignin crosslinking kinetics can be slow, requiring a prolonged ramping temperature to ensure the reaction temperature staying below lignin’s glass transition temperature to prevent its fusion at fiber stage prior to carbonization.72
Tremendous work is currently underway to produce more uniform lignin molecules with less structural complexity, less diversity, and better properties for materials development using advance tools available in processing, biology, and chemistry.5 Hemicellulose or its derived simple sugars, however, are better-defined molecules with simpler structures. These sugar molecules can be a good first step into studying new mechanisms in synthesizing carbon with a controllable morphology.
Introduction of Biorefinery Liquid Effluence
As discussed in the “Chemistry of Lignin” section, lignin is a complex molecule and can be a challenging molecule for studying its carbonization mechanism and designing carbonaceous products from it. However, saccharides from biomass can be relatively simpler and better understood molecules. Therefore, I aimed to first study and understand the mechanism behind the carbonization of these biomass-derived saccharides prior to designing lignin-derived carbonaceous materials, which is the final goal of this dissertation. Traditional biofuel production mainly relies on starch-based feedstocks such as corn grains and sugarcane, collectively known as first-generation biofuel.135 However, because of the debate on food vs. fuel use of corn, the long term goal was to switch to second-generation biofuel produced from cellulose because of its potentially low cost, abundance, and reliable supply.136 Cellulose, along with lignin and hemicellulose, is the main components in biomass. 135 However, in its native form, biomass is structurally complex and recalcitrant to chemical and enzymatic activities necessary for cellulose to be treated in biorefinery processes.5 As a result, for the utilization of biomass in biorefineries, it often requires pretreatments prior to its processing to liberate the cellulose fibers.136 One of the most common pretreatment methods can be a steam explosion because of its limited use of solvents, chemicals, and energy, thus lowering the cost requirement. Steam explosion of biomass begins with treating biomass in
superheated steam at a temperature of 160-240 C and pressure between 0.7-

18
4.8 MPa.135 During the treatment, steam infiltrates into the biomass, exfoliating fibers, and partially hydrolyzing mainly the hemicellulose. During its hydrolysis, hemicellulose and some cellulose partially break down into simple sugars including glucose and xylose.137 The partially hydrolyzed carbohydrate remains in the liquid phase.135 Upon cooling, the biomass is partially deconstructed. Cellulose becomes more accessible in the solid fraction for downstream enzymatic processes.138 Sometimes, additional acid catalysts can also be employed.137, 139 Before its use, the cellulose-rich solid fraction needs to be washed. The washing step would wash away mainly the partially hydrolyzed hemicellulose. Inevitable, the pretreatment condition would also partially hydrolyze less reactive linkages of lignin and cellulose. Thus, the washing solution is often impure, very dilute, and is not utilized.1 It has been estimated that this would decrease the yield of a biorefinery by 20-25%.135 While lignin has been the center of attention for years as a co-product, the most overlooked byproduct is this impure sugar stream in liquid effluence from biorefinery pretreatment plants.140 With the projected increase in the number of advanced lignocellulosic biorefineries because of the United States Renewable Fuel Standard,32 it is important to capture and utilize all components of a biomass. For this purpose, this dissertation will start by exploring a way to increase the efficiencies of biorefineries by utilizing this byproduct-stream sugar for manufacturing of carbon materials.
Objectives
Overarching Goal The overall objective of this research is to develop simple methods to control the morphology of lignin-derived carbon. With an optimized morphology, carbonized lignin can be beneficial for energy storage and polymer composite applications. For electrode applications, activated carbon produced should be of high porosity, which allows high surface area to harbor electrolyte ions in the case of a supercapacitor.141 For polymer composite applications, the carbon should be of good mechanical properties with desirable physical and chemical surface characteristics for strong adhesion with the polymer matrix.142 Lignin has shown preliminary promises as a good precursor of carbon for electrode and polymer composite applications. Furthermore, when made into spherical particles, a carbon’s processability and packing density could potentially be increased.120 Although there have been significant interests in making lignin-derived spherical carbon particles, currently available methods involve intricate templates, scaffolds, surfactants, and others.129, 143 Lignin’s hydrothermal conversion―one of the common methods to

19
manufacture spherical carbon particles―is not as efficient as that occurs with cellulosic precursors. Hydrothermal treatment is a method that involves heating carbon precursors suspended in an aqueous medium inside a closed superheated chamber under pressure.144 It is a versatile procedure that allows the self-assembly of carbon precursor with or without a template to produce hydrochar having different shapes.141 The centralized hypothesis of this research is that most lignin has inadequate solubility in water due to its functionality and molecular architecture, limiting its ability to self-assembly in a hydrothermal reactor like linear polysaccharides. To fulfill the goal of manufacturing spherical carbon particles from lignin and to rationally design a production method to do so, I first aimed to understand the mechanism of carbon precursor self-assembly in hydrothermal conditions. I specifically chose hydrolyzed carbohydrate and biomass pretreatment effluence containing hydrolyzed sugars and lignin as the precursor to yield spherical carbon particles. Then, I focused on understanding the mechanisms of lignin crosslinking to devise improved pathways to produce lignin-derived carbon. Non-spherical carbon monoliths from lignin and its highly porous activated residues were used in making supercapacitor electrodes. Lessons learned from these exercises were subsequently adopted to find a simpler path in manufacturing spherical carbon nanoparticles for polymer composite application. A simple method to produce carbonized lignin would provide a way for lignin utilization and a value-added product stream for the budding biorefinery and paper and pulp industry. The specific objectives investigated in this dissertation work include: (1) Hydrothermal synthesis of solid and hollow spherical carbon particles from carbohydrate hydrolysate and performance analysis of porous activated carbon as supercapacitor electrode (Chapter I); (2) Understanding non-spherical porous carbon synthesis from lignin via stabilization of rubber-modified monolithic lignin precursor (Chapter II); (3) Synthesis of lignin-derived carbon particles from solvated lignin under solvothermal conditions (Chapter III); and (4) Stabilization and carbonization of spherical lignin as carbon precursor via dry powder processing and hydrothermal conversion (Chapter IV). Salient features from each of these specific investigations discussed in detail throughout different Chapters of this dissertations are summarized below.
Specific Objective 1 (Chapter I) Hydrothermal treatment of simple sugars usually causes hydrolysis, self-assembly, and crosslinking of the thermally polymerized residues into spherical hydrochar.3, 7, 11, 24 This chapter investigated the evolution of hydrochar morphology derived from sugar through the following steps:
1) Controlled hydrochar morphology using different compositions of hydrothermal mediums.
2) Monitored evolution of hydrochar spheres.

20
3) Demonstrated the versatility of the spherical carbon production method by converting an impure biomass pretreatment liquid effluence into spherical carbon particles with a controllable morphology for supercapacitor electrode application.
Spherical hydrochar has been produced from sugar via dehydration, condensation, and polymerization reactions. As the sugar dehydrated, its hydrophobicity increased. As the sugar-derivative polymerized, its molecular weight increased, and the polymerized sugar chains agglomerated due to hydrophobicity. Those agglomerates eventually nucleated and precipitated out of solution as spheres. Hydrothermal reaction products at different reaction intervals were studied to analyze the structures of the carbon and its performance as supercapacitor electrodes. The hollow carbon sphere particles produced from hydrothermal condition with an emulsion medium were expected to exhibit superior performance as a supercapacitor electrode than the solid carbon sphere particles due to higher porosity. Subsequently, an impure liquid effluence stream from pretreated biomass was successfully turned into hollow spherical carbon for supercapacitor electrode application.
Specific Objective 2 (Chapter II) Melt-mixing of lignin with acrylonitrile butadiene rubber (NBR) lead to dispersed lignin domains in rubber matrix.60 Under reduced NBR content, the phase morphology reversed to disperse rubber domains in lignin matrix. When heated under mild temperatures, lignin could crosslink with NBR or with itself.132 The ability of NBR to be blended and crosslinked with lignin can deliver a mechanism to control the morphology of the lignin derivative. Following steps were used to synthesize lignin-based porous carbon for supercapacitor electrode:
1) Melt-mixed NBR into lignin to control lignin’s morphology. 2) Utilized NBR as a sacrificial template to induce porosity on lignin-derived
carbon and its activated derivative. 3) Explored lignin functional groups for their controlled-crosslinking under a
low-temperature stabilization/oxidation condition in air. 4) Produced activated carbon with tailored morphology through mixing of
NBR with lignin, lignin crosslinking with NBR, and crosslinking of lignin with other lignin molecules for an improved supercapacitor electrode performance.
The addition of a small amount of NBR (10%) into lignin lead to a rubber dispersed lignin morphology that can be retained via thermal stabilization. Subsequent carbonization eliminated rubber template and formed porous carbon. As a carbon’s morphology directly relates to its polymer precursor’s degree of crosslinking,145 carbon and activated carbon with different morphologies were prepared to tune supercapacitor electrodes’ performance.

21
Specific Objective 3 (Chapter III) Chapter I taught me that a hydrothermal treatment of simple sugar in an aqueous medium under mildly heated condition causes its dehydration, condensation, polymerization, self-assembly, agglomeration, and precipitation into spherical hydrochar particles. Chapter II found that under a mildly heated condition in an oxidizing environment, lignin can undergo crosslinking and stabilization. In this chapter, I explored if one can combine the lessons to create lignin-derived carbon sphere particles by relying on its ability to form a crosslinked solvated network in a solvothermal condition. I undertook the following steps in this specific work:
1) Produced uniform lignin-derived carbon sphere particles using a simple solvothermal treatment of lignin in a solvent―DMSO.
2) Monitored evolution of spherical stabilized lignin under solvothermal conditions.
3) Investigated the mechanism behind lignin degradation, crosslinking, and self-assembly under solvated environments using spectroscopic tools.
Superheating solution of lignin in DMSO under a dilute condition produced spherical carbonaceous aggregates of lignin-derivatives. Sufficient reaction temperature and reaction time successfully stabilized and crosslinked lignin to yield spherical shapes of lignin residues in the solvothermal medium. The precursors delivered lignin-derived carbon sphere particles of 0.8-3.6 μm
diameter. Specific Objective 4 (Chapter IV) In this chapter, I continued the quest for a simple method to produce spherical carbon particles with a controllable morphology from lignin. Superheating a flammable organic solvent, like DMSO, as studied in Chapter III, may not be desirable. An alternative solution could be nano-scale precipitation of precursor prior to thermal or oxidative stabilization. In polymer research, nanoprecipitation is an established method to produce nanospheres from a polymer.146-147 While lignin-derived activated carbon is a well-researched area,69, 148 lignin-derived carbon nanosphere particles for polymer composite application have seen little success. Stabilization is the key to produce carbon for polymer composite applications. In lignin-derived carbon fiber research, stabilization of lignin fiber in air is a preferred method.72 However, with the promises solvothermal treatment had shown in Chapter I and III, hydrothermal stabilization of lignin nanospheres for the production of nanosphere carbon particles for composite application could be feasible. With that goal, I investigated with the following steps:
1) Utilized dialysis nanoprecipitation to produce uniform lignin-derived nanospheres.
2) Identified stabilization conditions that could preserve the shape of nano-spherical lignin during conversion into carbon.

22
3) Investigated the effectiveness of hydrothermal treatment for the stabilization of lignin-derived carbon nanosphere particles in terms of their porosity, defect, surface chemical functionality, and adhesion strength with a styrene-butadiene rubber matrix.
The degradation of lignin side chains during hydrothermal stabilization lowered the volatiles generated during carbonization, decreased the final carbon’s porosity and defects, and enhanced its adhesion strength with the rubber matrix.

23
References
1. Laurichesse, S.; Averous, L., Chemical modification of lignins: Towards biobased polymers. Progress in Polymer Science 2014, 39 (7), 1266-1290. 2. Saito, T.; Brown, R. H.; Hunt, M. A.; Pickel, D. L.; Pickel, J. M.; Messman, J. M.; Baker, F. S.; Keller, M.; Naskar, A. K., Turning renewable resources into value-added polymer: development of lignin-based thermoplastic. Green Chemistry 2012, 14 (12), 3295-3303. 3. Wu, L. C. F.; Glasser, W. G., Engineering plastics from lignin. I. Synthesis of hydroxypropyl lignin. Journal of Applied Polymer Science 1984, 29 (4), 1111-1123. 4. Dorrestijn, E.; Laarhoven, L. J.; Arends, I. W.; Mulder, P., The occurrence and reactivity of phenoxyl linkages in lignin and low rank coal. Journal of Analytical and Applied Pyrolysis 2000, 54 (1-2), 153-192. 5. Ragauskas, A. J.; Beckham, G. T.; Biddy, M. J.; Chandra, R.; Chen, F.; Davis, M. F.; Davison, B. H.; Dixon, R. A.; Gilna, P.; Keller, M.; Langan, P.; Naskar, A. K.; Saddler, J. N.; Tschaplinski, T. J.; Tuskan, G. A.; Wyman, C. E., Lignin valorization: improving lignin processing in the biorefinery. Science 2014, 344 (6185), 1246843. 6. Chakar, F. S.; Ragauskas, A. J., Review of current and future softwood kraft lignin process chemistry. Industrial Crops and Products 2004, 20 (2), 131-141. 7. Gosselink, R.; Abächerli, A.; Semke, H.; Malherbe, R.; Käuper, P.; Nadif, A.; Van Dam, J., Analytical protocols for characterisation of sulphur-free lignin. Industrial Crops and Products 2004, 19 (3), 271-281. 8. Chung, Y.-L.; Olsson, J. V.; Li, R. J.; Frank, C. W.; Waymouth, R. M.; Billington, S. L.; Sattely, E. S., A renewable lignin–lactide copolymer and application in biobased composites. ACS Sustainable Chemistry & Engineering 2013, 1 (10), 1231-1238. 9. Muller, P. C.; Glassert, W. G., Engineering plastics from lignin. VIII. Phenolic resin prepolymer synthesis and analysis. The Journal of Adhesion 1984, 17 (2), 157-173. 10. Humbird, D.; Davis, R.; Tao, L.; Kinchin, C.; Hsu, D.; Aden, A.; Schoen, P.; Lukas, J.; Olthof, B.; Worley, M. Process design and economics for biochemical conversion of lignocellulosic biomass to ethanol: dilute-acid pretreatment and enzymatic hydrolysis of corn stover; National Renewable Energy Lab.(NREL), Golden, CO (United States): 2011. 11. Langholtz, M.; Downing, M.; Graham, R.; Baker, F.; Compere, A.; Griffith, W.; Boeman, R.; Keller, M., Lignin-derived carbon fiber as a co-product of refining cellulosic biomass. SAE International Journal of Materials and Manufacturing 2014, 7 (1), 115-121. 12. Stocker, T., Climate change 2013: the physical science basis: Working Group I contribution to the Fifth assessment report of the Intergovernmental Panel on Climate Change. Cambridge University Press: 2014.

24
13. Kang, S.; Li, X.; Fan, J.; Chang, J., Hydrothermal conversion of lignin: A review. Renewable and Sustainable Energy Reviews 2013, 27, 546-558. 14. Calvo‐Flores, F. G.; Dobado, J. A., Lignin as renewable raw material.
ChemSusChem 2010, 3 (11), 1227-1235. 15. Ren, T.; Qi, W.; Su, R.; He, Z., Promising Techniques for Depolymerization of Lignin into Value‐added Chemicals. ChemCatChem 2019, 11 (2), 639-654. 16. Kosbar, L. L.; Gelorme, J. D.; Japp, R. M.; Fotorny, W. T., Introducing biobased materials into the electronics industry. Journal of Industrial Ecology 2000, 4 (3), 93-105. 17. Stewart, D., Lignin as a base material for materials applications: Chemistry, application and economics. Industrial crops and products 2008, 27 (2), 202-207. 18. Mathiasson, A.; Kubat, D., Lignin as binder in particle boards using high frequency heating. Holz als Roh-und Werkstoff 1994, 52 (1), 9. 19. Azadi, P.; Inderwildi, O. R.; Farnood, R.; King, D. A., Liquid fuels, hydrogen and chemicals from lignin: A critical review. Renewable and Sustainable Energy Reviews 2013, 21, 506-523. 20. Pinto, P. C. R.; da Silva, E. A. B.; Rodrigues, A. E., Lignin as source of fine chemicals: vanillin and syringaldehyde. In Biomass Conversion, Springer: 2012; pp 381-420. 21. Sun, Z.; Fridrich, B.; de Santi, A.; Elangovan, S.; Barta, K., Bright Side of Lignin Depolymerization: Toward New Platform Chemicals. Chem Rev 2018, 118 (2), 614-678. 22. Luo, J.; Melissa, P.; Zhao, W.; Wang, Z.; Zhu, Y., Selective lignin oxidation towards vanillin in phenol media. ChemistrySelect 2016, 1 (15), 4596-4601. 23. Mota, M. I. F.; Rodrigues Pinto, P. C.; Loureiro, J. M.; Rodrigues, A. E., Recovery of vanillin and syringaldehyde from lignin oxidation: a review of separation and purification processes. Separation & Purification Reviews 2016, 45 (3), 227-259. 24. Fache, M.; Boutevin, B.; Caillol, S., Vanillin production from lignin and its use as a renewable chemical. ACS sustainable chemistry & engineering 2015, 4 (1), 35-46. 25. Kim, M. G.; Miller, G. D.; Haupt, R. A.; Strickland, R. C., Comparison of strandboards made with phenol-formaldehyde resin and resins modified with TVA acid-hydrolysis lignin. Forest products journal 1994, 44 (4), 63. 26. Simionescu, C. I.; Rusan, V.; Macoveanu, M. M.; Cazacu, G.; Lipsa, R.; Vasile, C.; Stoleriu, A.; Ioanid, A., Lignin/epoxy composites. Composites science and technology 1993, 48 (1-4), 317-323. 27. Tejado, A.; Kortaberria, G.; Pena, C.; Labidi, J.; Echeverría, J.; Mondragon, I., Lignins for phenol replacement in novolac‐type phenolic formulations, part I: Lignophenolic resins synthesis and characterization. Journal of applied polymer science 2007, 106 (4), 2313-2319. 28. Tejado, A.; Kortaberria, G.; Peña, C.; Blanco, M.; Labidi, J.; Echeverría, J.; Mondragon, I., Lignins for phenol replacement in novolac‐type phenolic

25
formulations. II. Flexural and compressive mechanical properties. Journal of applied polymer science 2008, 107 (1), 159-165. 29. Dizhbite, T.; Telysheva, G.; Jurkjane, V.; Viesturs, U., Characterization of the radical scavenging activity of lignins––natural antioxidants. Bioresource Technology 2004, 95 (3), 309-317. 30. Yamamoto, Y.; Shirono, H.; Kono, K.; Ohashi, Y., Immunopotentiating activity of the water-soluble lignin rich fraction prepared from LEM--the extract of the solid culture medium of Lentinus edodes mycelia. Biosci Biotechnol Biochem 1997, 61 (11), 1909-12. 31. Baurhoo, B.; Ruiz-Feria, C.; Zhao, X., Purified lignin: Nutritional and health impacts on farm animals—A review. Animal Feed Science and Technology 2008, 144 (3-4), 175-184. 32. Laskar, D. D.; Yang, B.; Wang, H.; Lee, J., Pathways for biomass‐derived
lignin to hydrocarbon fuels. Biofuels, Bioproducts and Biorefining 2013, 7 (5), 602-626. 33. Azadi, P.; Carrasquillo-Flores, R.; Pagán-Torres, Y. J.; Gürbüz, E. I.; Farnood, R.; Dumesic, J. A., Catalytic conversion of biomass using solvents derived from lignin. Green Chemistry 2012, 14 (6), 1573-1576. 34. Zhang, B.; Huang, H.-J.; Ramaswamy, S., Reaction kinetics of the hydrothermal treatment of lignin. In Biotechnology for Fuels and Chemicals, Springer: 2007; pp 487-499. 35. Karagöz, S.; Bhaskar, T.; Muto, A.; Sakata, Y., Comparative studies of oil compositions produced from sawdust, rice husk, lignin and cellulose by hydrothermal treatment. Fuel 2005, 84 (7-8), 875-884. 36. Saisu, M.; Sato, T.; Watanabe, M.; Adschiri, T.; Arai, K., Conversion of lignin with supercritical water− phenol mixtures. Energy & Fuels 2003, 17 (4), 922-928. 37. Sasaki, M.; Goto, M., Recovery of phenolic compounds through the decomposition of lignin in near and supercritical water. Chemical Engineering and Processing: Process Intensification 2008, 47 (9-10), 1609-1619. 38. Vigneault, A.; Johnson, D. K.; Chornet, E., Base‐catalyzed depolymerization of lignin: separation of monomers. The Canadian Journal of Chemical Engineering 2007, 85 (6), 906-916. 39. Heitz, M.; Wu, G.; Lapointe, J.; Rubio, M., Hydrolytic depolymerization of a steam explosion lignin. Journal of wood chemistry and technology 1995, 15 (4), 515-528. 40. Cheng, S.; Wilks, C.; Yuan, Z.; Leitch, M.; Xu, C. C., Hydrothermal degradation of alkali lignin to bio-phenolic compounds in sub/supercritical ethanol and water–ethanol co-solvent. Polymer Degradation and Stability 2012, 97 (6), 839-848. 41. Nagy, M.; David, K.; Britovsek, G. J.; Ragauskas, A. J., Catalytic hydrogenolysis of ethanol organosolv lignin. Holzforschung 2009, 63 (5), 513-520.

26
42. Tang, Z.; Zhang, Y.; Guo, Q., Catalytic hydrocracking of pyrolytic lignin to liquid fuel in supercritical ethanol. Industrial & Engineering Chemistry Research 2010, 49 (5), 2040-2046. 43. Miller, J.; Evans, L.; Littlewolf, A.; Trudell, D., Batch microreactor studies of lignin and lignin model compound depolymerization by bases in alcohol solvents. Fuel 1999, 78 (11), 1363-1366. 44. Tsujino, J.; Kawamoto, H.; Saka, S., Reactivity of lignin in supercritical methanol studied with various lignin model compounds. Wood science and technology 2003, 37 (3-4), 299-307. 45. Barta, K.; Matson, T. D.; Fettig, M. L.; Scott, S. L.; Iretskii, A. V.; Ford, P. C., Catalytic disassembly of an organosolv lignin via hydrogen transfer from supercritical methanol. Green Chemistry 2010, 12 (9), 1640-1647. 46. Gosselink, R. J.; Teunissen, W.; van Dam, J. E.; de Jong, E.; Gellerstedt, G.; Scott, E. L.; Sanders, J. P., Lignin depolymerisation in supercritical carbon dioxide/acetone/water fluid for the production of aromatic chemicals. Bioresour Technol 2012, 106, 173-7. 47. Yoshikawa, T.; Yagi, T.; Shinohara, S.; Fukunaga, T.; Nakasaka, Y.; Tago, T.; Masuda, T., Production of phenols from lignin via depolymerization and catalytic cracking. Fuel Processing Technology 2013, 108, 69-75. 48. Kleinert, M.; Barth, T., Towards a lignincellulosic biorefinery: direct one-step conversion of lignin to hydrogen-enriched biofuel. Energy & Fuels 2008, 22 (2), 1371-1379. 49. Xu, W.; Miller, S. J.; Agrawal, P. K.; Jones, C. W., Depolymerization and hydrodeoxygenation of switchgrass lignin with formic acid. ChemSusChem 2012, 5 (4), 667-75. 50. Wiinikka, H.; Carlsson, P.; Granberg, F.; Löfström, J.; Marklund, M.; Tegman, R.; Lindblom, M.; Gebart, R., Design and methodology of a high temperature gas sampling system for pressurized black liquor gasification. Fuel 2010, 89 (9), 2583-2591. 51. Azadi, P.; Farnood, R., Review of heterogeneous catalysts for sub-and supercritical water gasification of biomass and wastes. International Journal of Hydrogen Energy 2011, 36 (16), 9529-9541. 52. Ferdous, D.; Dalai, A. K.; Bej, S. K.; Thring, R. W., Production of H2 and medium heating value gas via steam gasification of lignins in fixed‐bed reactors.
The Canadian Journal of Chemical Engineering 2001, 79 (6), 913-922. 53. Thielemans, W.; Wool, R. P., Lignin esters for use in unsaturated thermosets: Lignin modification and solubility modeling. Biomacromolecules 2005, 6 (4), 1895-1905. 54. Glasser, W. G.; Barnett, C. A.; Rials, T. G.; Saraf, V. P., Engineering plastics from lignin II. Characterization of hydroxyalkyl lignin derivatives. Journal of Applied Polymer Science 1984, 29 (5), 1815-1830. 55. Nyman, V.; Rose, G.; Ralston, J., The colloidal behaviour of kraft lignin and lignosulfonates. Colloids and surfaces 1986, 21, 125-147. 56. Deng, Y.; Feng, X.; Yang, D.; Yi, C.; Qiu, X., Pi-pi stacking of the aromatic groups in lignosulfonates. BioResources 2012, 7 (1), 1145-1156.

27
57. Mousavioun, P.; Doherty, W. O.; George, G., Thermal stability and miscibility of poly (hydroxybutyrate) and soda lignin blends. Industrial Crops and Products 2010, 32 (3), 656-661. 58. Hilburg, S. L.; Elder, A. N.; Chung, H.; Ferebee, R. L.; Bockstaller, M. R.; Washburn, N. R., A universal route towards thermoplastic lignin composites with improved mechanical properties. Polymer 2014, 55 (4), 995-1003. 59. Akato, K.; Tran, C. D.; Chen, J.; Naskar, A. K., Poly(ethylene oxide)-Assisted Macromolecular Self-Assembly of Lignin in ABS Matrix for Sustainable Composite Applications. ACS Sustainable Chemistry & Engineering 2015, 3 (12), 3070-3076. 60. Tran, C. D.; Chen, J.; Keum, J. K.; Naskar, A. K., A New Class of Renewable Thermoplastics with Extraordinary Performance from Nanostructured Lignin‐Elastomers. Advanced Functional Materials 2016, 26 (16), 2677-2685.
61. Nguyen, N. A.; Meek, K. M.; Bowland, C. C.; Barnes, S. H.; Naskar, A. K., An Acrylonitrile–Butadiene–Lignin Renewable Skin with Programmable and Switchable Electrical Conductivity for Stress/Strain-Sensing Applications. Macromolecules 2017, 51 (1), 115-127. 62. Kelley, S. S.; Ward, T. C.; Rials, T. G.; Glasser, W. G., Engineering plastics from lignin. XVII. Effect of molecular weight on polyurethane film properties. Journal of applied polymer science 1989, 37 (10), 2961-2971. 63. Mahmood, N.; Yuan, Z.; Schmidt, J.; Xu, C. C., Preparation of bio-based rigid polyurethane foam using hydrolytically depolymerized Kraft lignin via direct replacement or oxypropylation. European Polymer Journal 2015, 68, 1-9. 64. Vanholme, R.; Storme, V.; Vanholme, B.; Sundin, L.; Christensen, J. H.; Goeminne, G.; Halpin, C.; Rohde, A.; Morreel, K.; Boerjan, W., A systems biology view of responses to lignin biosynthesis perturbations in Arabidopsis. Plant Cell 2012, 24 (9), 3506-29. 65. Saito, T.; Perkins, J. H.; Vautard, F.; Meyer, H. M.; Messman, J. M.; Tolnai, B.; Naskar, A. K., Methanol fractionation of softwood Kraft lignin: impact on the lignin properties. ChemSusChem 2014, 7 (1), 221-8. 66. Yao, S.-S.; Jin, F.-L.; Rhee, K. Y.; Hui, D.; Park, S.-J., Recent advances in carbon-fiber-reinforced thermoplastic composites: A review. Composites Part B: Engineering 2017. 67. Council, N. R., Assessment of fuel economy technologies for light-duty vehicles. National Academies Press: 2011. 68. Chatterjee, S.; Saito, T., Lignin-Derived Advanced Carbon Materials. ChemSusChem 2015, 8 (23), 3941-58. 69. Ho, H. C.; Nguyen, N. A.; Meek, K. M.; Alonso, D. M.; Hakim, S. H.; Naskar, A. K., A Solvent-Free Synthesis of Lignin-Derived Renewable Carbon with Tunable Porosity for Supercapacitor Electrodes. ChemSusChem 2018, 11 (17), 2953-2959. 70. Sangchoom, W.; Mokaya, R., Valorization of Lignin Waste: Carbons from Hydrothermal Carbonization of Renewable Lignin as Superior Sorbents for CO2 and Hydrogen Storage. ACS Sustainable Chemistry & Engineering 2015, 3 (7), 1658-1667.

28
71. Baker, D. A.; Rials, T. G., Recent advances in low‐cost carbon fiber manufacture from lignin. Journal of Applied Polymer Science 2013, 130 (2), 713-728. 72. Norberg, I.; Nordström, Y.; Drougge, R.; Gellerstedt, G.; Sjöholm, E., A new method for stabilizing softwood kraft lignin fibers for carbon fiber production. Journal of applied polymer science 2013, 128 (6), 3824-3830. 73. Jha, V. Carbon black filler reinforcement of elastomers. Queen Mary, University of London, 2008. 74. What is Carbon Black? https://www.thecarycompany.com/media/pdf/specs/orion-what-is-carbon-black.pdf (accessed 09-23). 75. Carrott, P.; Carrott, M. R., Lignin–from natural adsorbent to activated carbon: a review. Bioresource technology 2007, 98 (12), 2301-2312. 76. Do, D. D., Adsorption analysis: equilibria and kinetics. Imperial college press London: 1998; Vol. 2. 77. Bansal, R. C.; Goyal, M., Activated carbon adsorption. CRC press: 2005. 78. Marsh, H.; Reinoso, F. R., Activated carbon. Elsevier: 2006. 79. Mattson, J. S.; Mark, H. B., Activated carbon: surface chemistry and adsorption from solution. M. Dekker: 1971. 80. Cruz, D. C., Production of Bio-coal and Activated Carbon from Biomass. 2012. 81. Caballero, J. A.; Font, R.; Marcilla, A.; Conesa, J. A., New kinetic model for thermal decomposition of heterogeneous materials. Industrial & engineering chemistry research 1995, 34 (3), 806-812. 82. Varhegyi, G.; Antal Jr, M. J.; Jakab, E.; Szabó, P., Kinetic modeling of biomass pyrolysis. Journal of analytical and Applied Pyrolysis 1997, 42 (1), 73-87. 83. Sing, K. S. W., Reporting physisorption data for gas/solid systems with special reference to the determination of surface area and porosity (Recommendations 1984). Pure and Applied Chemistry 1985, 57 (4), 603-619. 84. Zdravkov, B. D.; Čermák, J. J.; Šefara, M.; Janků, J., Pore classification in the characterization of porous materials: A perspective. Central European Journal of Chemistry 2007, 5 (2), 385-395. 85. Yahya, M. A.; Al-Qodah, Z.; Ngah, C. Z., Agricultural bio-waste materials as potential sustainable precursors used for activated carbon production: a review. Renewable and Sustainable Energy Reviews 2015, 46, 218-235. 86. Kawahara, S.; Yamamoto, Y.; Isono, Y., Controlling the Performance of Filled Rubbers. 日本レオロジー学会誌 2014, 42 (2), 79-88.
87. Leblanc, J. L., Rubber–filler interactions and rheological properties in filled compounds. Progress in polymer science 2002, 27 (4), 627-687. 88. Wolff, S., Chemical aspects of rubber reinforcement by fillers. Rubber Chemistry and Technology 1996, 69 (3), 325-346. 89. Kang, M.-J.; Heo, Y.-J.; Jin, F.-L.; Park, S.-J., A review: role of interfacial adhesion between carbon blacks and elastomeric materials. Carbon letters 2016, 18 (1), 1-10.

29
90. Moore, M. Carbon black shortage is now a reality. http://www.tirebusiness.com/article/20180508/NEWS/180509948/carbon-black-shortage-is-now-a-reality (accessed Aug. 8th). 91. Zhang, F. China carbon black prices surge on supply shortage. https://www.icis.com/resources/news/2018/03/12/10201445/china-carbon-black-prices-surge-on-supply-shortage/# (accessed Aug. 8th). 92. Kumar, K. Carbon black shortage puts rubber industry in crisis https://economictimes.indiatimes.com/industry/miscellaneous/carbon-black-shortage-puts-rubber-industry-in-crisis/articleshow/62948056.cms (accessed Aug. 8th). 93. Hall, P. J.; Bain, E. J., Energy-storage technologies and electricity generation. Energy policy 2008, 36 (12), 4352-4355. 94. Liu, J.; Wang, X.; Gao, J.; Zhang, Y.; Lu, Q.; Liu, M., Hollow porous carbon spheres with hierarchical nanoarchitecture for application of the high performance supercapacitors. Electrochimica Acta 2016, 211, 183-192. 95. Zhang, L. L.; Zhao, X. S., Carbon-based materials as supercapacitor electrodes. Chem Soc Rev 2009, 38 (9), 2520-31. 96. Largeot, C.; Portet, C.; Chmiola, J.; Taberna, P. L.; Gogotsi, Y.; Simon, P., Relation between the ion size and pore size for an electric double-layer capacitor. J Am Chem Soc 2008, 130 (9), 2730-1. 97. Raymundo‐Piñero, E.; Cadek, M.; Béguin, F., Tuning carbon materials for supercapacitors by direct pyrolysis of seaweeds. Advanced Functional Materials 2009, 19 (7), 1032-1039. 98. Ulaganathan, M.; Jain, A.; Aravindan, V.; Jayaraman, S.; Ling, W. C.; Lim, T. M.; Srinivasan, M. P.; Yan, Q.; Madhavi, S., Bio-mass derived mesoporous carbon as superior electrode in all vanadium redox flow battery with multicouple reactions. Journal of Power Sources 2015, 274, 846-850. 99. Xue, Q.; Sun, J.; Huang, Y.; Zhu, M.; Pei, Z.; Li, H.; Wang, Y.; Li, N.; Zhang, H.; Zhi, C., Recent Progress on Flexible and Wearable Supercapacitors. Small 2017, 13 (45). 100. Xu, B.; Hou, S.; Cao, G.; Wu, F.; Yang, Y., Sustainable nitrogen-doped porous carbon with high surface areas prepared from gelatin for supercapacitors. Journal of Materials Chemistry 2012, 22 (36), 19088-19093. 101. Tang, Z.; Pei, Z.; Wang, Z.; Li, H.; Zeng, J.; Ruan, Z.; Huang, Y.; Zhu, M.; Xue, Q.; Yu, J.; Zhi, C., Highly anisotropic, multichannel wood carbon with optimized heteroatom doping for supercapacitor and oxygen reduction reaction. Carbon 2018, 130, 532-543. 102. Fan, Y.-M.; Song, W.-L.; Li, X.; Fan, L.-Z., Assembly of graphene aerogels into the 3D biomass-derived carbon frameworks on conductive substrates for flexible supercapacitors. Carbon 2017, 111, 658-666. 103. Simon, P.; Gogotsi, Y., Materials for electrochemical capacitors. Nat Mater 2008, 7 (11), 845-54. 104. Chmiola, J.; Yushin, G.; Gogotsi, Y.; Portet, C.; Simon, P.; Taberna, P. L., Anomalous increase in carbon capacitance at pore sizes less than 1 nanometer. Science 2006, 313 (5794), 1760-3.

30
105. Tian, W.; Gao, Q.; Zhang, L.; Yang, C.; Li, Z.; Tan, Y.; Qian, W.; Zhang, H., Renewable graphene-like nitrogen-doped carbon nanosheets as supercapacitor electrodes with integrated high energy–power properties. Journal of Materials Chemistry A 2016, 4 (22), 8690-8699. 106. Xu, Y.; Lin, Z.; Zhong, X.; Huang, X.; Weiss, N. O.; Huang, Y.; Duan, X., Holey graphene frameworks for highly efficient capacitive energy storage. Nat Commun 2014, 5, 4554. 107. Weinstein, L.; Dash, R., Have exotic carbons failed? Materials Today 2013, 16 (10). 108. Zhang, T.; Walawender, W. P.; Fan, L.; Fan, M.; Daugaard, D.; Brown, R., Preparation of activated carbon from forest and agricultural residues through CO2 activation. Chemical Engineering Journal 2004, 105 (1-2), 53-59. 109. Allen, S.; Whitten, L.; McKay, G., The production and characterisation of activated carbons: a review. Developments in Chemical Engineering and Mineral Processing 1998, 6 (5), 231-261. 110. Ioannidou, O.; Zabaniotou, A., Agricultural residues as precursors for activated carbon production—a review. Renewable and sustainable energy reviews 2007, 11 (9), 1966-2005. 111. Shahkarami, S. CO2 Capture from Gases using Activated Carbon. University of Saskatchewan, 2017. 112. Lee, J.; Kim, J.; Hyeon, T., Recent progress in the synthesis of porous carbon materials. Advanced Materials 2006, 18 (16), 2073-2094. 113. Ma, Z.; Kyotani, T.; Liu, Z.; Terasaki, O.; Tomita, A., Very high surface area microporous carbon with a three-dimensional nano-array structure: synthesis and its molecular structure. Chemistry of materials 2001, 13 (12), 4413-4415. 114. Saha, D.; Li, Y.; Bi, Z.; Chen, J.; Keum, J. K.; Hensley, D. K.; Grappe, H. A.; Meyer, H. M., 3rd; Dai, S.; Paranthaman, M. P.; Naskar, A. K., Studies on supercapacitor electrode material from activated lignin-derived mesoporous carbon. Langmuir 2014, 30 (3), 900-10. 115. Deshmukh, A. A.; Mhlanga, S. D.; Coville, N. J., Carbon spheres. Materials Science and Engineering: R: Reports 2010, 70 (1-2), 1-28. 116. Hu, B.; Wang, K.; Wu, L.; Yu, S. H.; Antonietti, M.; Titirici, M. M., Engineering carbon materials from the hydrothermal carbonization process of biomass. Adv Mater 2010, 22 (7), 813-28. 117. Nieto-Márquez, A.; Romero, R.; Romero, A.; Valverde, J. L., Carbon nanospheres: synthesis, physicochemical properties and applications. Journal of Materials chemistry 2011, 21 (6), 1664-1672. 118. Sun, X.; Li, Y., Hollow carbonaceous capsules from glucose solution. J Colloid Interface Sci 2005, 291 (1), 7-12. 119. Wang, H.; Yan, T.; Shi, L.; Chen, G.; Zhang, J.; Zhang, D., Creating Nitrogen-Doped Hollow Multiyolk@Shell Carbon as High Performance Electrodes for Flow-Through Deionization Capacitors. ACS Sustainable Chemistry & Engineering 2017, 5 (4), 3329-3338.

31
120. Sun, X.; Li, Y., Colloidal carbon spheres and their core/shell structures with noble‐metal nanoparticles. Angewandte Chemie International Edition 2004, 43 (5), 597-601. 121. Callister, W. D.; Rethwisch, D. G., Materials science and engineering. John wiley & sons NY: 2011; Vol. 5. 122. Duan, H.; Yan, T.; Chen, G.; Zhang, J.; Shi, L.; Zhang, D., A facile strategy for the fast construction of porous graphene frameworks and their enhanced electrosorption performance. Chem Commun (Camb) 2017, 53 (54), 7465-7468. 123. Wang, Z.; Yan, T.; Chen, G.; Shi, L.; Zhang, D., High Salt Removal Capacity of Metal–Organic Gel Derived Porous Carbon for Capacitive Deionization. ACS Sustainable Chemistry & Engineering 2017, 5 (12), 11637-11644. 124. Wang, J.; Nie, P.; Ding, B.; Dong, S.; Hao, X.; Dou, H.; Zhang, X., Biomass derived carbon for energy storage devices. Journal of Materials Chemistry A 2017, 5 (6), 2411-2428. 125. Ikeda, S.; Tachi, K.; Ng, Y. H.; Ikoma, Y.; Sakata, T.; Mori, H.; Harada, T.; Matsumura, M., Selective adsorption of glucose-derived carbon precursor on amino-functionalized porous silica for fabrication of hollow carbon spheres with porous walls. Chemistry of materials 2007, 19 (17), 4335-4340. 126. Kruse, A.; Funke, A.; Titirici, M. M., Hydrothermal conversion of biomass to fuels and energetic materials. Curr Opin Chem Biol 2013, 17 (3), 515-21. 127. Titirici, M.-M., Sustainable carbon materials from hydrothermal processes. John Wiley & Sons: 2013. 128. Sun, X.; Li, Y., Colloidal carbon spheres and their core/shell structures with noble‐metal nanoparticles. Angewandte Chemie 2004, 116 (5), 607-611. 129. Shimada, T.; Hata, T.; Kijima, M., Thermal Conversion of Lignin–Cellulose Composite Particles into Aggregates of Fine Carbon Grains Holding Micro- and Mesoporous Spaces. ACS Sustainable Chemistry & Engineering 2015, 3 (8), 1690-1695. 130. Mao, H.; Chen, X.; Huang, R.; Chen, M.; Yang, R.; Lan, P.; Zhou, M.; Zhang, F.; Yang, Y.; Zhou, X., Fast preparation of carbon spheres from enzymatic hydrolysis lignin: Effects of hydrothermal carbonization conditions. Sci Rep 2018, 8 (1), 9501. 131. Wang, H.; Male, J.; Wang, Y., Recent advances in hydrotreating of pyrolysis bio-oil and its oxygen-containing model compounds. Acs Catalysis 2013, 3 (5), 1047-1070. 132. Bova, T.; Tran, C. D.; Balakshin, M. Y.; Chen, J.; Capanema, E. A.; Naskar, A. K., An approach towards tailoring interfacial structures and properties of multiphase renewable thermoplastics from lignin–nitrile rubber. Green Chemistry 2016, 18 (20), 5423-5437. 133. Ouyang, W.; Huang, Y.; Luo, H.; Wang, D., Poly (lactic acid) blended with cellulolytic enzyme lignin: Mechanical and thermal properties and morphology evaluation. Journal of Polymers and the Environment 2012, 20 (1), 1-9.

32
134. Saha, D.; Payzant, E. A.; Kumbhar, A. S.; Naskar, A. K., Sustainable mesoporous carbons as storage and controlled-delivery media for functional molecules. ACS applied materials & interfaces 2013, 5 (12), 5868-5874. 135. Agbor, V. B.; Cicek, N.; Sparling, R.; Berlin, A.; Levin, D. B., Biomass pretreatment: fundamentals toward application. Biotechnol Adv 2011, 29 (6), 675-85. 136. Lynd, L. R.; Weimer, P. J.; van Zyl, W. H.; Pretorius, I. S., Microbial cellulose utilization: fundamentals and biotechnology. Microbiol Mol Biol Rev 2002, 66 (3), 506-77, table of contents. 137. Mosier, N.; Wyman, C.; Dale, B.; Elander, R.; Lee, Y. Y.; Holtzapple, M.; Ladisch, M., Features of promising technologies for pretreatment of lignocellulosic biomass. Bioresour Technol 2005, 96 (6), 673-86. 138. Rabemanolontsoa, H.; Saka, S., Various pretreatments of lignocellulosics. Bioresource technology 2016, 199, 83-91. 139. Sun, Y.; Cheng, J., Hydrolysis of lignocellulosic materials for ethanol production: a review. Bioresour Technol 2002, 83 (1), 1-11. 140. Wang, Y.; Yang, R.; Li, M.; Zhao, Z., Hydrothermal preparation of highly porous carbon spheres from hemp ( Cannabis sativa L.) stem hemicellulose for use in energy-related applications. Industrial Crops and Products 2015, 65, 216-226. 141. Ho, H. C.; Goswami, M.; Chen, J.; Keum, J. K.; Naskar, A. K., Amending the Structure of Renewable Carbon from Biorefinery Waste-Streams for Energy Storage Applications. Sci Rep 2018, 8 (1), 8355. 142. Tang, L. G.; Kardos, J. L., A review of methods for improving the interfacial adhesion between carbon fiber and polymer matrix. Polymer composites 1997, 18 (1), 100-113. 143. He, Z.-W.; Yang, J.; Lu, Q.-F.; Lin, Q., Effect of structure on the electrochemical performance of nitrogen-and oxygen-containing carbon micro/nanospheres prepared from lignin-based composites. ACS Sustainable Chemistry & Engineering 2013, 1 (3), 334-340. 144. Moreno, J. M. C.; Swamy, S. S.; Fujino, T.; Yoshimura, M., Carbon nanocells and nanotubes grown in hydrothermal fluids. Chemical Physics Letters 2000, 329 (3-4), 317-322. 145. Jeon, J. W.; Zhang, L.; Lutkenhaus, J. L.; Laskar, D. D.; Lemmon, J. P.; Choi, D.; Nandasiri, M. I.; Hashmi, A.; Xu, J.; Motkuri, R. K.; Fernandez, C. A.; Liu, J.; Tucker, M. P.; McGrail, P. B.; Yang, B.; Nune, S. K., Controlling porosity in lignin-derived nanoporous carbon for supercapacitor applications. ChemSusChem 2015, 8 (3), 428-32. 146. Legrand, P.; Lesieur, S.; Bochot, A.; Gref, R.; Raatjes, W.; Barratt, G.; Vauthier, C., Influence of polymer behaviour in organic solution on the production of polylactide nanoparticles by nanoprecipitation. Int J Pharm 2007, 344 (1-2), 33-43. 147. Hornig, S.; Heinze, T.; Becer, C. R.; Schubert, U. S., Synthetic polymeric nanoparticles by nanoprecipitation. Journal of Materials Chemistry 2009, 19 (23), 3838-3840.

33
148. Saha, D.; Van Bramer, S. E.; Orkoulas, G.; Ho, H.-C.; Chen, J.; Henley, D. K., CO2 capture in lignin-derived and nitrogen-doped hierarchical porous carbons. Carbon 2017, 121, 257-266.

34
CHAPTER I: AMENDING THE STRUCTURE OF RENEWABLE CARBON FROM BIOREFINERY BYPRODUCT-STREAMS FOR
ENERGY STORAGE APPLICATIONS

35
A version of this chapter was originally published by Hoi Chun Ho, Monojoy Goswami, Jihua Chen, Jong K. Keum, and Amit K. Naskar: Ho, Hoi Chun, Monojoy Goswami, Jihua Chen, Jong K. Keum, and Amit K. Naskar. "Amending the Structure of Renewable Carbon from Biorefinery Waste-Streams for Energy Storage Applications." Scientific reports 8, no. 1 (2018): 8355.
A.N. and H.H. designed the study. H.H. synthesized all samples and did scanning electron microscope imaging, gas adsorption desorption experiments, and electrochemical testing. M.G. performed the computational modeling. J.K conducted the Small Angle X-ray Scattering. J.C. and H.H. collected the transmission electron images. A.N. conceived the scope of work and directed the research. All authors contributed to the writing and preparing figures for the manuscript.
Abstract
Biorefineries produce impure sugar byproduct streams that are being underutilized. By converting this byproduct to a profitable value-added-product, biorefineries could be safeguarded against low oil prices. We demonstrate controlled production of useful carbon materials from the byproduct concentrate via hydrothermal synthesis and carbonization. We devise a pathway to producing tunable, porous spherical carbon materials by modeling the gross structure formation and developing an understanding of the pore formation mechanism utilizing simple reaction principles. Compared to a simple hydrothermal synthesis from sugar concentrate, emulsion-based synthesis results in hollow spheres with abundant microporosity. In contrast, conventional hydrothermal synthesis produces solid beads with micro and mesoporosity. All the carbonaceous materials show promise in energy storage application. Using the reaction pathway, perfect hollow activated carbon spheres can be produced from byproduct sugar in liquid effluence of biomass steam pretreatment units. The renewable carbon product demonstrated a desirable surface area of 872 m2/g and capacitance of up to 109 F/g when made into an electric double layer supercapacitor. The capacitor exhibited nearly ideal capacitive behavior with 90.5% capacitance retention after 5000 cycles.
Introduction
In the pursuit of a sustainable economy, both renewable energy and renewable chemical practices must be adopted. While the former can be produced from

36
many sources, one feasible option for the combination of renewable energy and chemicals so far emanates from biorefineries.1 However, with the current low oil price, biorefineries need improved profitability to compete with fossil fuels. This would require manufacturing of diversified products and effective utilization of byproducts for materials applications.1-2 While lignin has been the center of attention for years as a co-product, the most overlooked byproduct is the impure sugar stream in liquid effluence from biorefinery pretreatment plants.3 There exists a state-of-the-art technology that utilizes biomass, pretreated by acids or alkali, to break down amorphous carbohydrates to sugars for better cellulose accessibility.4 Sugar content in the biomass pretreatment liquid effluence can contain maximum of 50% of the initial hydrolysable carbohydrate from the biomass.5-7 Therefore, the efficiency of biorefineries can be improved significantly if this byproduct-stream sugar can be captured in a simple, cost-effective way without a need for extensive purification and apply it to materials design. However, a challenge, for biorefinery co-product generation from the byproduct-stream, is the low concentration of soluble carbohydrates.1 Concentrating this liquid effluence using waste heat, which is widely available in biorefineries, is achievable and already a common practice in Kraft pulping mills.1, 6 Utilization of this untapped biomass sugar could be prioritized and one of the potential applications can be its conversion to carbon particles with tunable morphologies as a medium for renewable energy storage, such as electric double layer (EDL) supercapacitors.
Over the last decade, there has been growing interest in tailoring carbon sphere structures for different applications in renewable energy sectors. For EDL supercapacitor electrode applications, spherical carbon with a tunable porosity and controllable particle size distribution is of great interest.8-13 The variety of structures can provide excellent performance for catalysis, adsorption, and energy storage.8-12, 14-15 Carbon spheres can be made from several methods.8-10,
16-21 One of the most inexpensive methods to date is hydrothermal carbonization (HTC). HTC is a relatively green technology and scalable to industrial production levels.9 The HTC method is applicable to precursors with high moisture content much like the carbohydrates in pretreatment liquid effluence.22 To better control the porosity, size, and shape of the carbon spheres, different strategies including templating and self-assembly were employed together with HTC.16 Hard templating, which often uses silica as the template, can be one of the most straightforward ways to synthesize carbon spheres with a controllable morphology.14, 23 However, for silica hard templating, the most critical step is to obtain a template having strong interaction with the carbon precursor. The process is very tedious, and the removal of the template requires corrosive chemicals like sodium hydroxide or even hydrofluoric acid13, undesirable for green chemistry application. On the contrary, soft template synthesis does not require significant preparation or removal of the template.20-21

37
I propose the synthesis of carbonaceous matter in a controllable manner using soft templating, followed by HTC and subsequent high temperature carbonization of solid HTC-derivatives. Emulsion (made from oil, water, and surfactant) and water-based HTC were carried out at different time-scales to study the evolution of spherical carbon products. The two synthesis routes were then correlated with the resulting carbon morphology, porosity, and surface characteristics. Furthermore, the carbon products derived from renewable sugar were investigated as EDL electrodes for supercapacitor application. Supercapacitors store energy based on two different principles: EDL capacitance from the pure electrostatic charge accumulation at the electrode interface, and (2) the pseudo-capacitance based on fast and reversible redox processes at characteristic potentials.17 Out of these two mechanisms, we synthesized and characterized EDL supercapacitors and hence we will discuss the EDL supercapacitors only in this article. Surface activation of carbon products was conducted using KOH. we performed large-scale molecular dynamics (MD) simulations to understand the evolution and characteristics of the pore structures in an emulsion-based system. While previous studies have shown the possibility of producing carbon spheres from carbohydrates and even acid or alkaline pretreated biomass-derived hydrolyzed hemicellulose using HTC, detailed understanding on the structural evolution with respect to the hydrothermal reaction media is not fully understood.3, 7, 11, 24 In this study, we used sugarcane-derived table sugar as a model molecule to establish the physics and the carbon formation mechanism. we then corroborated the findings using the result from laboratory-made steam-pretreated liquid effluence from woodchips. After establishing that perfectly hollow carbon spheres can be made from pretreatment liquid effluence, we explored the potential application of the model material as supercapacitor electrodes. This study exhibits a pathway to design sustainable energy storage materials from the byproduct stream of a future biorefinery.
Results and Discussion
Structure of the Carbonaceous Materials The HTC of a carbohydrate precursor involves a four-step process – dehydration, condensation, polymerization, and aromatization as shown schematically in Figure 1.1(a).23, 25 The process is as follows: sugar molecules dehydrate, forming mainly a furfural-derivative26 that decomposes into organic acid, and/or other species.27 As the reaction continues, furfural and the excess dehydrated sugar condensate and polymerize. The growing “heads” in the polymer chain consist of reactive hydrophilic hydroxyl groups while the center of the chain becomes relatively dehydrated and hydrophobic. The center of the polymer chain then aromatizes with other chain centers to form a larger hydrophobic core. The aggregated chains, therefore, form spherical, micelle-like structures with a

38
Figure 1.1. Carbon spheres from the simple HTC synthesis (N carbon samples that are made without use of any surfactant). (a) A schematic representation of the evolution of carbon spheres during simple HTC. SEM images of N samples with (b) 20, (c) 45, and (d) 165 minutes HTC durations showing carbon morphology evolving from amorphous irregular-shaped carbon to spherical particulate carbon with increasing HTC time. (e) TEM image of a single N carbon sphere with 45 minutes HTC duration (N45). (f) Thickness profile of the single N45 sphere showing a solid spherical structure formation.

39
hydrophobic core and hydrophilic corona.28 This evolution mechanism of the spherical carbonaceous aggregates was perfectly captured by scanning electron microscopy (SEM) [Figure 1.1(b-d)] with the water-based HTC synthesis (abbreviated as N system representing ‘No’ surfactants). In Figure 1.1, hydrothermal carbonization for 45 minutes (N45) and for 165 minutes (N165) give rise to micelle like structure and consequently spherical carbon structures [Figure 1.1(c-d)]. However, the 20 minutes sample (N20) with insufficient polymerization time exhibits out-of-equilibrium amorphous irregular-shaped structures with no carbon spheres [Figure 1.1(b)]. Interestingly, this shows that the micellar morphologies evolve from an irregular-shaped amorphous carbonaceous material to a perfectly shaped spherical particulate carbon as HTC time is increased. As the dehydrated sugar polymers aromatize during HTC, polymer cores continuously give off volatiles, lose functional groups, and carbonize further. Thus, when HTC duration increased, HTC samples became more carbonized and thermally stable, as seen in the thermogravimetric analysis (TGA) [Figure S1.1] of the HTC products. TGA results also show that carbon yield during high temperature carbonization increases as the HTC duration increases. Therefore, longer HTC time produces compact carbon spheres. For
example, N45 samples show sphere diameter of 6.31.5μm [Figure 1.1(c)] while
N165 samples have spheres of diameter 3.31.6μm [Figure 1.1(d)]. The N45 carbon, under transmission electron microscope (TEM), exhibits a perfectly spherical solid structure as shown in Figure 1.1(e). The perfectly spherical structure has been corroborated by the cross-sectional thickness profile shown in Figure 1.1(f). Ferric chloride, primarily used as a catalyst during HTC synthesis, plays a critical role in carbonization and aromatization.29-30,31 When hydrolyzed, ferric chloride forms ferric hydroxide or oxide and hydrochloric acid (HCl) in water.31 As such the resulting acid catalyzes dehydration of the sugar; reducing sugar intermediates in this system could partially reduce ferric ions to ferrous ions and then be subsequently oxidized into various iron oxide species. Therefore, it is possible that some spheres may have traces of iron oxide at the micelle core.29,
31 However, most iron was likely removed during final acid wash of the resulting carbon except any iron oxide protected within carbon shells. Inductively coupled plasma optical emission spectrometry (ICP-OES) confirms that all samples obtained after carbonization and acid washing contain <1.2% of iron with the lowest being 0.28% of Y20 [Table S1.1]. The low iron contents together with the minimal traces of iron redox peak in the cyclic voltammetry experiments of the supercapacitor electrodes prepared from these carbonaceous materials indicate that the energy storage device is primarily an EDL capacitor, and hence pseudo-capacitance plays minimal role in the results.
While carbon sphere formation in HTC is an established mechanism, the detailed procedure for emulsion medium HTC is far from understood. We denoted emulsion synthesized carbon samples as Y samples, indicating presence of

40
surfactant and oil in the reaction medium. The mechanism is schematically shown in Figure 1.2(a). In the emulsion formed by sodium dodecyl sulfate (SDS) surfactant (1 g/100 ml), water and paraffin oil (4:1 v/v), surfactant molecules form surfactant micelles. First, sugar naturally dissolves in the water phase. As HTC progresses, the sugar molecules in water behave much like the N samples and consequently dehydrate, condensate, polymerize, and aromatize. The hydrophobicity of the dehydrated and polymerized condensed sugar molecules gradually increases. The hydrophobic polymerized sugar molecules are entropically attracted towards the hydrophobic core of the surfactant micelles in the emulsion. Note that the hydrophobic tail (dodecyl) and the hydrophilic head (sulfate) of the SDS are denoted by the yellow and red color, respectively [Figure 1.2(a)]. As HTC continues, a layer-by-layer self-assembly of the sugar molecules in the surfactant micelle gives rise to the hollow carbon structures. The spherical carbon samples from emulsion-based HTC after 45 and 165 minutes (Y45 and Y165 carbons, respectively) can be seen in Figure 1.2(b-c). The hollow nature of Y45 is revealed from the crumbled sphere in Figure 1.2(b) and (d-f). The TEM image in Figure 1.2(e) reveals a sphere having a bright core and dark edges indicating a hollow structure. In contrast to Figure 1.1(f) where the cross-section thickness profile of N45 shows that the center of N45 sphere is the thickest part, Figure 1.2(f) shows the Y45 bead having a hollow structure with the shell thickness of ca. 0.2 µm. Unfortunately, these broken spherical particles were not observed in the Y165 sample due to the longer HTC reaction. For long enough HTC reaction duration, the carbon shells can grow thicker and thus prevent the spheres from breaking. This mechanism also explains the smaller sizes of Y45
samples (2.50.5μm) as compared to 3.91.2μm for Y165 samples, as the longer HTC duration in Y165 allows sugar molecules to be part of a single micelle in a closely packed form. KOH activation of Y45 and Y165 [denoted as aY45 and aY165 respectively, Figure 1.2(g-h)] retained their morphologies with a slight
increase in size to 4.01.7μm and 4.141.62μm respectively compared to their precursors [Figure 1.2(b-c)]. The slight increase in sphere sizes after activation is due to the addition of oxygen containing functional groups on carbon during activation, thereby expanding the carbon structure. Like N20, emulsion-based HTC was prematurely stopped after 20 minutes (Y20 sample) before the sugar molecules had a chance to form these hollow spherical structures, giving rise to out-of-equilibrium structures without carbon spheres [Figure 1.2(i-j)]. The emulsion-based carbon bead formation will be elaborated further using Molecular Dynamics simulation in a later section.
So far, we discussed the pathway to produce solid and hollow carbon spheres from simple sugar molecules using water and emulsion-based HTC techniques. Subsequently, we will discuss the understanding of the self-assembly these sugar-derived Y and N samples and energy storage properties. Prior to that, we wanted to apply the same technique to synthesize carbon from biomass pretreatment liquid effluence as the long-term goal is to utilize carbon precursors from industrial effluence to produce sustainable energy storage materials. Liquid

41
Figure 1.2. Carbon spheres from emulsion-based HTC synthesis (Y samples). (a) A schematic representation of the evolution of carbon spheres during emulsion-based HTC. SEM images of Y samples with (b) 45, (c) 165, and (d) 45 minutes HTC showing perfectly spherical structures with the longer HTC durations and a revelation of their hollow nature with broken spheres. (e) TEM image of a single Y sphere with 45 minutes HTC (Y45) showing its hollowness. (f) Thickness profile of the single Y45 sphere showing its thin shell, ca. 0.2 µm. SEM images of activated Y sample with (g) 45 minutes and (h) 165 minutes HTC showing the retention of carbon morphology after activation. Insert of (g) reveals the retention of hollow nature of spheres. (i) Y sample with 20 minutes HTC showing the out out-of-equilibrium structures, and (j) activated Y sample with 20 minutes HTC which retained the out-of-equilibrium structures after activation.

42
effluence from steam pretreated woodchips was prepared and subsequently carbonized following the same emulsion medium and carbonization parameters as the Y165 sample. The resulting carbons show perfectly hollow spherical structure from the SEM and TEM images as shown in Figure 1.3 (a-c). These results from the biomass pretreatment liquid effluence prove that hollow carbon spheres can be produced as a value-added-product from biorefinery byproducts, and these carbonaceous materials followed the same functionalities as that of Y samples. Carbon spheres produced herein are smaller and with thinner shells. It is known in literature that hydrothermally produced carbon sphere sizes are affected by the type of carbon precursors,32 which can explain the smaller sphere sizes when comparing to the Y samples. For a simpler processing viewpoint, woodchip pretreatment liquid effluence was fed directly without being further concentrated into the hydrothermal synthesis reactor after being emulsified. The sugar extracted in the liquid was estimated to be ~30% of the initial woodchip mass. As a result, the sugar content in HTC used for the woodchip pretreatment effluent hydrothermal synthesis was lower than that of the Y samples, leading to the thinner carbon shell produced.11 To the best of our knowledge, this is the first controllable hollow carbon sphere synthesis of biomass pretreatment liquid effluent from steam pretreated biomass using emulsion-based HTC. The success of this method demonstrates that this approach has potential for carbonaceous materials synthesis from a wide range of biorefinery byproduct materials. I believe that there is a mixture of hollow and solid spheres obtained during emulsion-based HTC, as not all Y45 and Y165 spherical carbons are formed with the assistance of surfactant micelles and therefore not all of them are hollow. To further examine the coexistence of hollow and solid spherical beads in emulsion HTC, we performed coarse-grained molecular dynamics (CGMD) simulations.
Figure 1.3. Spherical hollow carbon from steam pretreated woodchip liquid effluence. (a) SEM image. (b) and (c) TEM images.

43
The underlying principle behind the structure formation conjectured in the previous section can also be verified using computational modeling. The simulations are carried out using LAMMPS package33 in a canonical ensemble (see Methods Section for computational details). In an emulsion system, where surfactant number density is at or over the critical micelle number, the surfactants start forming the micelle at an early simulation time. Figure 1.4(a) shows formation of such micelle at as early as 3 million simulation time steps. Figure 1.4(b-d) show evolution of the carbon structures at 4, 5, and a fully equilibrated 8 million simulation time steps. At the beginning of simulations (beginning of HTC in experiments), between 3-4 million-time steps, it can be assumed that the charges on the polymer chains (sugar) are not fully stripped off. Therefore, when polymer (sugar) molecules are near the surfactant micelle, the micelle corona (red color beads) attracts the charges on the polymer chains. As HTC progresses, polymer chains get further dehydrated and gradually become hydrophobic. These hydrophobic backbones are then absorbed by the surfactant micelle cores due to strong enthalpic forces between many surfactant tails (which are hydrophobic) and hydrophobic polymer chains. The evolution from Figure 1.4(b) to Figure 1.4(c) shows a gradual change towards totally spherical beads consisting of surfactant and polymer molecules. The equilibrium structure in Figure 1.4(d) consists of spherical beads formed by surfactant head and surfactant tail (red and yellow) along with the polymer chains (gray). Concurrently in Figure 1.4 (a-d), we also observe progress of a separate bead formation consisting of only polymer (grey color) molecules. As these polymer chains are far away from the surfactant micelle, interaction between those polymer molecules with surfactants is unfavorable. As a result, these polymer chains form individual beads with other polymer molecules only. The computer simulations show the presence of both hollow and solid spheres in an emulsion system.
The inset of Figure 1.4(g) shows only the carbonaceous spherical structure after the surfactant molecules are evolved at high temperature. Two types of spheres are observed in the emulsion-based technique, solid spheres (shown in red circle) formed by only sugar aggregated (hydrogen-bonded) beads and hollow spheres (shown in blue circle) formed by sugar polymers absorbed by surfactant micelles. Because of the difference in their formation mechanisms, we expect a difference in their morphology too. The solid spheres, away from the surfactant micelle, show smooth surfaces. Whereas, the hollow spheres are seen to exist in the surfactant micelle environment. A closer look at the single bead formed by sugar absorbed surfactant micelles reveals that the surfactants serve as templates [as in Figure 1.4(e)], resulting in rough surfaces as shown in Figure 1.4(f) once the surfactants are completely burnt off. The difference in surface roughness and porosity is reiterated in detail in the structural investigation in Figure 1.4(g). We show the inter-particle structure
factor defined as, 1
𝑁∑ 𝑒−𝑖𝑄.𝑟𝑖𝑗𝑖𝑗 between the polymer molecules only. Here Q is
the wave vector, rij is the distance between two particles and N is the total

44
Figure 1.4. CGMD simulations of surfactant polymer mixtures replicating the surfactant-sugar emulsion HTC experiment. The top panel shows evolution of the bead formation inside the central simulation cell at (a) 3 million, (b) 4 million, (c) 5 million and (d) 8 million simulation time steps. The red and yellow color spheres represent surfactant head and tail segments. The grey color spheres represent the polymer molecules (sugar derivative in experiment). The images at (e) and (f) exhibit a single bead formed by surfactant molecules in the presence of surfactant as shown in blue circle in (d) and when the surfactants are stripped off from the same, respectively. The intermolecular structure factor, S(Q) for the bulk and near surfactant polymer molecules are plotted in (g) in red and blue color for high-Q range. The bulk and near surfactant polymer molecules are circled in (d) in red and blue colors also. The low-Q range profiles of S(Q) for the bulk and near surfactant polymers is shown in green and magenta color, respectively. The inset in (g) shows the snapshots for a completely stripped off surfactant system.

45
number of particles. The near-surfactant S(Q) (blue lines), is calculated from
polymer molecules within 2σ while the bulk S(Q) (red lines) is obtained from the
same molecules 2σ distance away from the surfactant molecule, where σ is the Lennard-Jones diameter of each monomer. The near-surfactant S(Q) represents polymer molecules from only those polymer spherical beads that are agglomerated within surfactant micelles. The bulk S(Q) represents polymer molecules that are not associated with the surfactant micelles. As our focus is to understand the molecular level self-assembly in bulk and near-surfactant, we concentrate on S(Q) at high-Q, i.e., shorter length-scale properties. The polymer molecules in bulk show wide and weaker peaks (red), representing essentially agglomerated structures with broad distribution. The bulk molecules are parts of the sphere formed solely by polymer chains and their wider peaks represent swollen structures with a relatively smoother surface. For polymers near the surfactant molecules (blue lines), well-defined structures are observed with peak
at 0.33, 0.44, 0.55, 0.66 σ-1, and so on. The structures show equally spaced molecules representing a layering of the polymer molecules within the micelle. It suggests that when the polymers enter the micelle core, they position themselves between the surfactant molecules thereby giving rise to the layering structure. As the surfactants are evolved, the empty spaces left result in molecular level porous structures. This molecular level investigation corroborates the hypothesis that carbon morphology can be controlled using different formation mechanisms. This analysis supports very well the collected electron micrographs and the proposed mechanism discussed in previous sections. Gas Adsorption-Desorption and Surface Characteristics Based on the MD simulation, we expect the rougher surface from emulsion-based Y samples to generate higher surface area due to 1) the hollow nature of the carbon spheres and 2) the templating of surfactants. We calculated the surface area and pore volumes as obtained from gas adsorption-desorption experiments in Table 1.1. Surface areas of Y45 and Y165 are approximately double those of N45 and N165. While no bead formation was observed with the 20 minutes HTC samples, the surfactant templating effect alone exfoliates Y20 carbons resulting in notably higher surface area than that in N20 carbons. In terms of HTC duration, surface area and pore volume both decreases as HTC duration time increases, for both Y and aY samples (Table 1.1) due to consolidation of layered structured pores collapsing. The trend was not as obvious with the N samples, as all three samples have surface area around 300 m2 g-1. To further increase the surface area of the carbon samples and eventually their capacitance performance, we activated Y samples with KOH. KOH acts as both the activating and templating agent, creating new pores and enlarging
existing pores. As it heats up, KOH melts at 360°C, infiltrating into macropores of carbon. As an activating agent, KOH etches new micropores and mesopores on the carbon surfaces. After washing, these emptied pores are exposed, changing the surface area and pore size distribution considerably.34 The mechanism of KOH activation can be complex. Generally speaking, it can be represented as

46
6KOH + C = 2K + 3H2 + 2K2CO3.35-36 The highest surface areas and pore volumes were achieved by KOH activation. The aY20, aY45, and aY165 give rise to 1495, 1384, and 1037 m2g-1 surface areas with 0.627, 0.577, and 0.418 ccg-1 pore volume respectively. The molecular scale templating effect from surfactants can also be seen by the increase in microporosity which is observed in the isotherms in Figure 1.5(a-c). The steep initial rise at low relative pressure suggests micropore filling.37 Higher amounts of micropore filling (Figure 1.5(a)) for the Y samples can be seen. Y and aY isotherms contain the shape of Type I isotherms while N isotherms resemble Type II isotherms.38 The percent micropore and mesopore were also quantified in Table 1.1. It should be noted that the MD simulation fails to predict the mesoporosity of solid beads of the N samples. MD simulations are performed in an emulsion-based system and hence it cannot predict the N sample morphology accurately. A separate MD simulation of the N system was not performed to quantify the mesoporosity in the simulation. For Y and aY isotherms, the relatively flat plateau region suggests the limited amount of multilayer filling, or the presence of meso or macropores. N isotherms, on the contrary, have noticeable hysteresis, indicating capillary condensation in mesopores.39 These features are also observed in the pore-size distribution analysis in Figure 1.5(d)
Sample Surface Area
m2
g-1
Pore Volume
m3
g-1
Percent micropore
Percent mesopore
aY20 1495 0.627 88.0 12.0
aY45 1384 0.577 84.1 15.9
aY165 1037 0.418 87.0 13.0
Y20 1058 0.414 91.8 8.2
Y45 743 0.347 90.1 9.9
Y165 605 0.314 81.7 18.3
N20 297 0.391 43.8 56.2
N45 273 0.416 37.7 62.3
N165 337 0.305 59.1 40.9
Table 1.1. Surface area and pore volume measured from nitrogen adsorption isotherm.

47
Figure 1.5. Carbon surface characteristics based on gas adsorption-desorption isotherm and porosity. (a), (b), and (c) Isotherms for adsorption-desorption for aY, Y and N series samples respectively. (d) Pore size distributions for different samples determined using the Quenched Solid Density Functional Theory (QSDFT). (e) Pore size distributions at longer length scales > 2nm to 200 nm. The color schemes are shown in the legends.
(c)
(a)
(b)
Longer Length Scale
(e)
(d)

48
and its magnified version (from 2nm onward) in Figure 1.5(e). The mesoporous characteristics of N samples can be explained in the following: N sugar polymers were polymerized into their final shape in bulk without being templated with hydrophobic segments of a surfactant. Thus, the polymerized sugars in N samples self-assemble randomly without being fully dehydrated. During the high temperature carbonization step, these functional groups evolved as volatiles, as
shown in the TGA plots in Figure S1.1 between ca. 200°C to ca. 700 °C, activating and creating channels within the structure. This gives rise to the mesoporous structures in the final carbonized products. In contrast, the Y samples did not have mesopores as a result of micelle formation with the surfactant causing the sugar polymers to dehydrate before being incorporated in the hydrophobic core. This is evident by the smaller weight loss from the TGA
plots in Figure S1.1 compared to the N counterparts between ca. 400°C to ca.
700°C. Hence, this mechanism suppresses the amount of mesopores that can be formed in an emulsion-based HTC as observed with the Y samples. To summarize, the layering effect between surfactants and sugar-derived carbonaceous polymers gave rise to higher surface area with smaller micropores for the Y samples while the evolution of available volatiles from activated N samples created larger mesopore channels during the high temperature carbonization step.
Small angle X-ray scattering (SAXS) characterization of two selected samples was carried out to investigate the presence of porous structure within the samples. Figure 1.6 depicts the SAXS curves for the carbonized N45 and Y45 samples. One of the most notable differences was that Y45 exhibits a scattering shoulder in the high-Q region, i.e., 0.1 < Q < 0.6 nm-1 while N45 merely shows asymptotic decay in scattering intensity. Here, Q is the magnitude of the scattering vector defined as Q=|Q|=4πλ-1sinθ, with λ and θ being the wavelength of incident X-ray beam and half of the scattering angle, respectively. The high-Q scattering feature of Y45 indicates the existence of nanometer scale structures created during carbon synthesis by the assistance of the surfactant where hydrophobic carbon precursors accumulated inside the micelle and these segments were separated by the hydrophobic surfactant tail and/or the oil molecules. By considering the curve shape of the high-Q scattering shoulder
showing Intensity Q-1, we employed the Guinier-Porod model for cylindrical objects to fit the high-Q scattering shoulder.40 The data fit, indicated the existence of cylindrical pores with an average diameter of 8.6 Å (or 0.86 nm). Note that both N45 and Y45 exhibit a power law with a fractal dimension of approximately 3 in the low-Q region revealing the presence of a 3-dimensional (3D) network structure. We anticipate that they are 3D bridged pores of the samples. The N45 sample shows a steeper slope than that of the Y45 sample in low-Q region indicating larger porous structure existing within the N45 samples (see Figure 1.6). These measured data corroborate very well with the measured pore volume and surface area shown in Table 1.1. Specifically, the pore volume and surface

49
Figure 1.6. Small angle X-ray scattering (SAXS) data for N45 and Y45 carbon samples.
0.01 0.1 11E-6
1E-5
1E-4
1E-3
0.01
0.1
1
10
100
Inte
nsity, a.u
.
Q, Å-1
N45
Y45
Fit_Guinier-Porod model
Q-1

50
area of N45 and Y45 are (ca. 0.416 vs. 0.347 m3g-1) and (ca. 273 vs. 743 m2g-1), respectively. Supercapacitor Application To this end, we demonstrate the application of these renewable carbonaceous materials for renewable energy storage systems. We used the synthesized porous carbonaceous particles to prepare electrodes for EDL. EDL supercapacitors, are energy storage devices with power performances that fit in between dielectric capacitors and batteries from the Ragone plot, which exemplifies the energy and power relationships for different energy storage devices.41 Unlike batteries and pseudo-capacitors, EDL supercapacitors do not rely on faradaic reactions.42 Thus, these type of supercapacitors have higher charge-discharge rates and stabilities.43 EDL supercapacitors rely solely on the electrostatic separation between ions in electrolyte and electrons in electrodes.44
Using porous carbonaceous materials to serve as electrodes has gathered significant interest,45-46 especially when derived from renewable materials.47-49
Figure 1.7(a-b) display typical cyclic voltammetry current-voltage (CV) curves and charge-discharge profiles respectively for Y45 sample as an example. The rest of the CV and charge-discharge curves can be found in Supporting Information. The CV curves show symmetrical rectangular shapes and the charge-discharge profiles show nearly symmetric triangular shapes for all scan rates and current densities. This represents good to excellent capacitive performances. Capacitances generally follow the same trend as surface area and pore volume based on the governing formula for capacitors, C= ε·A/d, where C is the capacitance of the supercapacitor, ε is the product of electrolyte dielectric constant and permittivity of free space, A is the surface area between the electrode and electrolyte, and d is the separation distances between ions in the electrolyte and the electrons in the electrodes. As a result, the amount of charge that can be stored, i.e. capacitance, increases with increasing accessible surface.44 Therefore, aY20 and aY45 with the highest surface areas of all samples give the highest capacitance of up to 113 F g-1. The direct correlation between surface area and capacitance can be observed in Figure 1.7(c-d), where a summary of the capacitance values is shown. The notable exception to the trend is N165 and Y165 samples. Y165 has a higher surface area when compared to N165 but not its capacitance. Although many factors can cause this discrepancy, at least one of the major factors is the pore characteristics of the two samples. From the gas adsorption-desorption experiments, it has been shown that N samples have larger pores than the Y samples. The Quenched Solid-State Functional Theory (QSDFT) model showed that Y165 has 56% of its pores smaller than 0.64 nm, which was the lower limit of the pore size measurements. N165, however, only has 46% of such small pores. Although solvated potassium ion has a size of 0.31nm and solvated hydroxyl ion has a size of 0.35nm50 which are much smaller than the 0.64nm limit, we may still speculate that the larger pores in N165, partly compensated its low surface area

51
(c)
(a)
(b)
(f)(e)
Figure 1.7. Capacitance measurement using carbonaceous materials as electrodes of EDL supercapacitors. (a) Cyclic voltammetry IV curves for Y45 at 10, 20, 50, 100 and 200 mVs-1 scan rates. The legends are in mVs-1 (b) Charge-discharge experiments for Y45 sample at 200, 500, 1000 and 2000 mAg-1 current densities. Legends are in mAg-1. (c) Capacitances for all the samples as shown in the legend color code. (d) Table showing the capacitance values at two different scan rates. (e) Electrochemical impedance spectroscopy (EIS) results and (f) Cycle stability of aY20, aY45, and aY165.
Sample
C (F/g)
at 10
mV/s
C (F/g)
at 200
mV/s
aY20 113.09 74.98
aY45 110.34 61.42
aY165 98.72 44.83
Y20 77.11 55.63
Y45 70.16 49.24
Y165 28.75 13.12
N20 9.28 6.67
N45 11.33 9.80
N165 28.38 18.75
(d)

52
for capacitance. Many micropores of Y165 could have blocked electrolyte ions from reaching the carbon electrode surface, reducing the effective surface area on the electrode for capacitance applications.51-52 Mesoporosity on the other hand, could make the diffusion of electrolyte ions onto carbon electrode surfaces easier, contributing to high capacitance, especially when fast diffusion of ions are required, as in the case with a high scan rate.50, 53 As a result, N165 and Y165 have similar capacitances at a slow scan rate, but as the scan rate increases, N165 gradually outperforms Y165. Similarly, other Y samples generally have poorer rate handling capability in comparison to the N samples. Noticeably, aY165 rate handling capability was the worst followed by aY45. Similar to Y165, the first suspect for explaining the poor rate handling was the kinetic limitation from pore size distribution. However, the DFT results of aY165 and aY45 did not differ much from aY20 which the only other activated sample but with good rate handling capability.
The activated samples were further analyzed using electrochemical impedance spectroscopy. Figure 1.7(d) shows the Nyquist plots exhibit almost vertical lines at the low frequency region, representing behaviors closer to an ideal capacitor.17, 54 A shallower slope closer to 45° as seen at the mid to low frequency range represents Warburg resistance which indicates the slow diffusion of ions on the surface of the electrodes.55 One can also find a good indication of the equivalent series resistance when extrapolating the vertical portion of the curve to the x-axis on the Nyquist plot.56-57 Notably, aY165 curve is shifted to the right relative to aY45 and with aY20 being the furthest left curve. This indicates
impedance of aY165 is higher than aY45 then closely followed by aY20. This explains the trend observed with a steeper drop in capacitance vs. scan rate curve in Figure 1.7c for aY165 than aY45 and aY20 with the shallowest drop discussed earlier. We believe the main reason in their conductivity differences are due to the different amounts of metal species in the activated samples and thus their capacitance rate handling capability. Indeed, earlier ICP-OES results in Table S1.1 showed that aY45 and aY165 have the highest amount of metal species from the iron catalyst and the KOH activation process. Specifically, aY165 contains 0.897% iron and 0.535% potassium, the highest, followed by aY45, then aY20 with the least with 0.313 % iron and 0.211% potassium.
Because of the promising capacitances, 5000 long term cycling stability was evaluated for all activated samples as shown in Figure 1.6(e). Capacitance retentions of 98.3%, 97.2% and 99.8% for aY20, aY45, and aY165 respectively were measured, revealing high cycle stability performances during practical applications.
So far, we have shown supercapacitor properties of samples made from sugar-derived carbonaceous materials. To correlate the functionalities of sugar-derived activated carbon with real world byproduct management, the hollow carbon

53
spheres made from woodchip pretreatment liquid effluence was activated and characterized. A surface area of 872 m2/g and a pore volume of 0.511 cc/g were obtained. When made into supercapacitor electrodes, capacitance of 109 F/g was measured with a scan rate of 5mV/s which maintained a 90.5% capacitance retention after 5000 cycles (Figure S1.4). The desirable result and nearly ideal capacitive behavior reinforced the potential for biorefineries to utilize its biomass byproduct using simple emulsion-based hydrothermal synthesis for EDL supercapacitor electrode applications as a value-added product.
Conclusions
I have analyzed the evolution of spherical carbon particles and pore formation mechanisms from sugars via hydrothermal synthesis. The morphologies of these products can be controlled by modifying the composition of the media and thus altering the carbonization mechanisms. Both computational and experimental results show an intriguing effect that carbon morphologies evolve from a poorly defined charcoal material to perfectly shaped spherical carbon as HTC time increases. The size of the spheres can also be controlled by the HTC duration. Because of the differences in reaction mechanisms, surfactant loaded precursor in the emulsion medium self-assembled into hollow spheres (Y sample) whereas in the absence of surfactant in simple hydrothermal reaction medium, the precursors only yield solid spheres (N Sample). In terms of porosity, Y samples have higher surface area and microporosity due to their hollow nature and the layered templating effect caused by the surfactant molecules. In contrast, N samples are both microporous and mesoporous mainly due to the evolution and activation of volatiles during carbonization. The carbon surface area analysis, molecular dynamics simulations, and the measured small-angle x-ray scattering data reveal the templating effect of surfactants on the emulsion-based hydrothermal synthesis of carbons. When these carbons were made into EDL electrodes of supercapacitors, the observed supercapacitances correlated very well with the measured surface areas and exhibited excellent capacitive behaviors. Particularly, the Y samples synthesized for short duration (20‒45 minutes) show very high capacity (ca. 50‒80 F/g) even at high scan rates. The best performing Y samples were then activated with KOH, and surface areas and capacitances further improved up to 1495 m2 g-1 and 113 F g-1, respectively, with a 98.3% capacitance retention for aY20 after 5000 cycles. Finally, we produced supercapacitor electrodes from liquid effluence of steam pretreated woodchips that are typically a byproduct of biorefineries using the same reaction pathway. Perfectly hollow spheres can be synthesized from the woodchips. The resulting activated hollow carbon spheres exhibited a desirable surface area of 872m2/g and capacitance of up to 109 F/g. Almost ideal capacitive behaviors were observed with 90.5% capacitance retention after 5000 cycles. Thus, we provide a potential solution for deriving energy harvesting materials from a renewable

54
resource. While the investigation was performed at a laboratory scale, the simplicity of the overall synthesis technique can easily be scaled up to industrial standards. The advantage of this method is threefold: (1) the synthesis technique is simple, (2) the method can be used in parallel with biorefinery unit operation, and (3) the cost of biorefineries will eventually decrease since a byproduct can be converted into an energy storage material. We believe this work will influence a change in the practices of biorefineries towards achieving their goal of competing with fossil fuels.
Methodology
Hydrothermal Synthesis and Carbonization HTC of carbon was conducted from 120ml 0.5M sucrose (Diamond Crystal, Savannah, GA) and 0.5M FeCl3 solution. In another case, 0.5M sucrose and 0.5M FeCl3 solution were made from an emulsion of ultrasonicating 1.2g sodium dodecyl sulfate (SDS), 24ml paraffin oil (Merck-KGaA, Darmstadt, Germany), and 96ml DI water. The hydrothermal reactions were carried out for 20, 45, or 165 minutes. Additionally, liquid effluence of steam pretreated woodchips (obtained from carpentry waste from eastern Tennessee mixed hardwood biomass) at
180°C for 12 hours was made into an emulsion just like the previous case with SDS and paraffin oil then subsequently HTC for 165 minutes with 1.2g FeCl3. Amount of carbohydrate resulted in the liquid effluence was estimated at around 2.5g. All chemicals were purchased from Sigma-Aldrich unless noted otherwise. Synthesis was done in a 200 mL PPL lined stainless steel autoclave (Columbia
International). The autoclave was placed in an oven at 200°C for a specific synthesis time. The hydrothermal synthesized solid product was then placed in a
quartz tube inside a tube furnace and carbonized at 1000°C for 20 minutes in a nitrogen atmosphere. The carbonized material was then washed with 0.5M HCl and water. Activation KOH was ground with the dried samples in a 2:1 (KOH:sample) ratio. Ground samples were then ramped in a tube furnace under a nitrogen atmosphere at the
rate of 8°C per minute to 800°C and held for 30 minutes. The activated samples were then cooled, washed with water, and dried. The activated ID carbon materials were designated as “aID” carbon (i.e. activated Y20 is named as aY20). Characterization Scanning electron microscope (SEM) images were collected with a Hitachi S4800. Carbon sphere diameters were measured by Image J software and characterized by the mean and standard deviation of 10 randomly chosen spheres within a sample. Transmission electron microscope (TEM) images were
55
taken using a Zeiss Libra 120 Transmission Electron Microscope operating at 100kV. Samples were dispersed onto a carbon film coated copper grid before analysis. Thermal gravimetric analysis was investigated by a Q500, TA instruments. For each sample, ca. 15 mg was used for measurement onto a platinum pan. Temperature was ramped to 105ºC at 10ºC/min, held for 30 min, and ramped to 1000ºC at 7.5ºC/min in nitrogen atmosphere. Inductively coupled plasma optical emission spectrometry was outsourced to Galbraith Laboratories Inc., a commercial analytical chemistry laboratory service in Knoxville, TN. Nitrogen adsorption desorption experiments were carried out with a Quantachrome Autosorb iQ at 77K. Surface area, pore size distribution, and pore volume were determined using the Quenched Solid Density Functional Theory (QSDFT).58 For capacitance measurements, the carbonaceous material was first mixed with a conductive carbon black (Timcal super C45) at 8:1 ratio then with 10 wt. % aqueous Polytetrafluoroethylene (60% dispersion in water). The mixture was then mixed in ethanol to form a paste. The paste was then coated on two 7/16th in. diameter Ni-foam circles and dried overnight. These current collectors were then pressed and used as electrodes in symmetrical two-electrode cells with 6M KOH as electrolyte. Filter paper served as the separator. Two stainless steel rods were used to clamp on the electrode-filter paper-electrode complex and the complex was housed inside a Teflon Swagelok cell. VersaSTAT 4 (Princeton Applied Research) was used to perform cyclic voltammetry, charge-discharge, and electrochemical impedance spectroscopy (EIS) experiments. A 0 to 0.8V voltage window was used. Scan rates varied from 10mV s−1 to 200m V s−1 and from 200mA g-1 to 2000 mA g-1. EIS was conducted at a frequency of 500 kHz to 50 mHz with an amplitude of 10mV. The specific capacitances were calculated from C = 2q/mE, where E is the voltage window of 0.8V, m is the mass of the carbon sample used, and q is the charge accumulated calculated from VersaStudio software. Cycle stability was conducted on a Arbin battery cycler (Arbin Instrument) at 500mA g-1. Small-Angle X-ray Scattering (SAXS) data were acquired at the Center for Nanophase Materials Sciences (CNMS) in Oak Ridge National Laboratory on an Anton Paar SAXSess mc2. The scattered beam was recorded on a CCD detector (PI-SCX, Roper) with a pixel resolution of 2084 x 2084 and pixel dimensions of 24 x 24 µm2. The data collection time was 20 minutes. For the measurements, the X-ray was generated at 40 kV/50 mA at a beam wavelength of λ = 1.541 Å (Cu Kα radiation). The generated X-ray beam was slit-collimated using a Kratky camera giving rise to the beam size of 18 mm (Length) x 0.4 mm (Width) and the collected SAXS data were desmeared and expressed as intensity versus q, where q = (4π sinθ)/λ after subtraction of detector dark current and background scattering. Computational Model Coarse-grained molecular dynamics (CGMD) simulations were performed on a dilute mixture of sugar and SDS surfactant. The sugar molecules were modeled

56
as short polymer chains of 15 monomeric units with 4 hydrophilic monomers with charges on the polymer backbone. The charges on the polymer chains allows the chain to be slightly polar thereby mimicking the polar hydroxyl groups of the sugar molecules. The SDS surfactants were modeled as 12-mer polymer chains with 1-mer hydrophilic polar head and 11-mer hydrophobic tails has been done in previous CGMD studies.59-60 While the experiments were performed in both water and emulsion (in SDS), we performed only one set of simulation in SDS (emulsion in experiments). The purpose of the simulation was to understand the self-assembly of carbonaceous bead formation irrespective of the presence of absence of SDS, we chose the latter. The interactions between the neutral monomers were modeled using Lennard-Jones (LJ) force-field (FF) while the charge interactions were modeled using explicit Coulomb interactions. Each monomer bead was represented by mass, m, and Lennard-Jones bead diameter, σ. For the simulations, we considered the mass and LJ diameter equal to 1 and
0.97 respectively, same for all monomers. As the variation of m and σ of sugar
and surfactant monomers are relatively small, hence this choice m and σ would provide critical self-assembly information without drastically altering the fundamental physics. The model system consisted of 2000 polymer chains and
2000 surfactant molecules in a periodic box of 100 σ X100 σ X100 σ at a
density, 0.064/ σ3. In experiments, the hydrothermal carbonization process strips off the charges on the sugar and SDS molecules. Therefore, the most realistic way to computationally model hydrothermal carbonization would be to strip off the charges after a certain simulation time. Hence, we modeled the carbonization process by stripping off the charges from both the polymers and surfactants after equilibrating for 5 million LJ time-steps. By deleting all the charges from the system, the interaction between the monomers becomes solely hydrophobic, representing a purely carbonaceous material. The polymer chains and surfactant molecules undergo self-assembly during equilibration, however, to achieve equilibration for a fully hydrophobic (no-charge scenario) system, we ran 3 million more-time steps. All the simulation parameters are in reduced units. The
temperature is fixed at, T* = 1.0 kBT/𝜀 and the simulation time step is fixed at, Δt
= 0.01 σ. The visualization of MD trajectories was generated by VMD code61 and the structural analysis was performed using the in-house code.
Acknowledgements
Research was sponsored by the Laboratory Director’s R&D Program of Oak Ridge National Laboratory, managed by UT Battelle, LLC, for the U.S. Department of Energy. H.H. acknowledges support from the U.S. Department of Energy (DOE), Office of Energy Efficiency and Renewable Energy, BioEnergy Technologies Office Program. The authors would also like to thank Dr. Yunchao Li from Oak Ridge National Laboratory for the electrode testing help, Dr.
57
Francisco Sotomayor from Quantachrome Instruments for the support with gas adsorption desorption experiments, and Ms. Sherry Razo from Oak Ridge National Laboratory for the schematic drawings. The MD simulations were performed at the National Center for Computational Sciences (NCCS) and used resources of the Oak Ridge Leadership Computing Facility (OLCF) at the ORNL, which is supported by the Office of Science of the U.S. DOE under contract number DE-AC05-00OR22725. SAXS (J.K.K) and electron microscopy (J.C. and H.H.) experiments and computer simulations were conducted at the Center for Nanophase Materials Sciences (CNMS), which is sponsored by the ORNL Scientific User Facilities Division, DOE Office of Basic Research Sciences.

58
References
1. Biorefinery Optimization Workshop Summary Report; U.S. Department of Energy, Energy Efficiency & Renewable Energy: Chicago, Illinois, October, 2016. (https://www.energy.gov/eere/bioenergy/downloads/biorefinery-optimization-workshop-summary-report) 2. Gonzalez, R. W.; Treasure, T.; Phillips, R. B.; Jameel, H.; Saloni, D., Economics of cellulosic ethanol production: Green liquor pretreatment for softwood and hardwood, greenfield and repurpose scenarios. BioResources 2011, 6 (3), 2551-2567. 3. Wang, Y.; Yang, R.; Li, M.; Zhao, Z., Hydrothermal preparation of highly porous carbon spheres from hemp (Cannabis sativa L.) stem hemicellulose for use in energy-related applications. Industrial Crops and Products 2015, 65, 216-226. 4. Ragauskas, A. J.; Beckham, G. T.; Biddy, M. J.; Chandra, R.; Chen, F.; Davis, M. F.; Davison, B. H.; Dixon, R. A.; Gilna, P.; Keller, M., Langan, P.; Naskar, A. K.; Saddler, J. N.; Tschaplinski, T. J.; Tuskan, G. A.; Wyman, C. E., Lignin valorization: improving lignin processing in the biorefinery. Science 2014, 344 (6185), 1246843. 5. Saratale, G. D.; Jung, M.-Y.; Oh, M.-K., Reutilization of green liquor chemicals for pretreatment of whole rice waste biomass and its application to 2, 3-butanediol production. Bioresource technology 2016, 205, 90-96. 6. Kumar, A. K.; Sharma, S., Recent updates on different methods of pretreatment of lignocellulosic feedstocks: a review. Bioresources and Bioprocessing 2017, 4 (1), 7. 7. Falco, C.; Sieben, J. M.; Brun, N.; Sevilla, M.; Van der Mauelen, T.; Morallón, E.; Cazorla‐Amorós, D.; Titirici, M. M., Hydrothermal Carbons from Hemicellulose‐Derived Aqueous Hydrolysis Products as Electrode Materials for Supercapacitors. ChemSusChem 2013, 6 (2), 374-382. 8. Deshmukh, A. A.; Mhlanga, S. D.; Coville, N. J., Carbon spheres. Materials Science and Engineering: R: Reports 2010, 70 (1), 1-28. 9. Hu, B.; Wang, K.; Wu, L.; Yu, S. H.; Antonietti, M.; Titirici, M. M., Engineering carbon materials from the hydrothermal carbonization process of biomass. Advanced Materials 2010, 22 (7), 813-828. 10. Nieto-Márquez, A.; Romero, R.; Romero, A.; Valverde, J. L., Carbon nanospheres: synthesis, physicochemical properties and applications. Journal of Materials chemistry 2011, 21 (6), 1664-1672. 11. Sun, X.; Li, Y., Hollow carbonaceous capsules from glucose solution. Journal of colloid and interface science 2005, 291 (1), 7-12. 12. Lee, J.; Kim, J.; Hyeon, T., Recent progress in the synthesis of porous carbon materials. Advanced Materials 2006, 18 (16), 2073-2094. 13. Wang, H.; Yan, T.; Shi, L.; Chen, G.; Zhang, J.; Zhang, D., Creating nitrogen-doped hollow multiyolk@ shell carbon as high performance electrodes

59
for flow-through deionization capacitors. ACS Sustainable Chemistry & Engineering 2017, 5 (4), 3329-3338. 14. Duan, H.; Yan, T.; Chen, G.; Zhang, J.; Shi, L.; Zhang, D., A facile strategy for the fast construction of porous graphene frameworks and their enhanced electrosorption performance. Chemical Communications 2017, 53 (54), 7465-7468. 15. Wang, Z.; Yan, T.; Chen, G.; Shi, L.; Zhang, D., High Salt Removal Capacity of Metal–Organic Gel Derived Porous Carbon for Capacitive Deionization. ACS Sustainable Chemistry & Engineering 2017, 5 (12), 11637-11644. 16. Roberts, A. D.; Li, X.; Zhang, H., Porous carbon spheres and monoliths: morphology control, pore size tuning and their applications as Li-ion battery anode materials. Chemical Society Reviews 2014, 43 (13), 4341-4356. 17. Liu, J.; Wang, X.; Gao, J.; Zhang, Y.; Lu, Q.; Liu, M., Hollow porous carbon spheres with hierarchical nanoarchitecture for application of the high performance supercapacitors. Electrochimica Acta 2016, 211, 183-192. 18. Lu, A. H.; Hao, G. P.; Sun, Q.; Zhang, X. Q.; Li, W. C., Chemical synthesis of carbon materials with intriguing nanostructure and morphology. Macromolecular Chemistry and Physics 2012, 213 (10‐11), 1107-1131. 19. Kim, T.-W.; Chung, P.-W.; Slowing, I. I.; Tsunoda, M.; Yeung, E. S.; Lin, V. S.-Y., Structurally ordered mesoporous carbon nanoparticles as transmembrane delivery vehicle in human cancer cells. Nano letters 2008, 8 (11), 3724-3727. 20. Fang, Y.; Gu, D.; Zou, Y.; Wu, Z.; Li, F.; Che, R.; Deng, Y.; Tu, B.; Zhao, D., A Low‐Concentration Hydrothermal Synthesis of Biocompatible Ordered Mesoporous Carbon Nanospheres with Tunable and Uniform Size. Angewandte Chemie International Edition 2010, 49 (43), 7987-7991. 21. Liu, J.; Yang, T.; Wang, D.-W.; Lu, G. Q. M.; Zhao, D.; Qiao, S. Z., A facile soft-template synthesis of mesoporous polymeric and carbonaceous nanospheres. Nature communications 2013, 4, 2798. 22. Moreno, J. M. C.; Swamy, S. S.; Fujino, T.; Yoshimura, M., Carbon nanocells and nanotubes grown in hydrothermal fluids. Chemical Physics Letters 2000, 329 (3), 317-322. 23. Liu, J.; Wickramaratne, N. P.; Qiao, S. Z.; Jaroniec, M., Molecular-based design and emerging applications of nanoporous carbon spheres. Nature materials 2015, 14 (8), 763. 24. Wen, Z.; Wang, Q.; Zhang, Q.; Li, J., Hollow carbon spheres with wide size distribution as anode catalyst support for direct methanol fuel cells. Electrochemistry communications 2007, 9 (8), 1867-1872. 25. Xia, Y.; Gates, B.; Yin, Y.; Lu, Y., Monodispersed colloidal spheres: old materials with new applications. Advanced Materials 2000, 12 (10), 693-713. 26. Demir-Cakan, R.; Baccile, N.; Antonietti, M.; Titirici, M.-M., Carboxylate-rich carbonaceous materials via one-step hydrothermal carbonization of glucose in the presence of acrylic acid. Chemistry of materials 2009, 21 (3), 484-490. 27. Baccile, N.; Laurent, G.; Babonneau, F.; Fayon, F.; Titirici, M.-M.; Antonietti, M., Structural characterization of hydrothermal carbon spheres by

60
advanced solid-state MAS 13C NMR investigations. The Journal of Physical Chemistry C 2009, 113 (22), 9644-9654. 28. Yu, G.; Sun, B.; Pei, Y.; Xie, S.; Yan, S.; Qiao, M.; Fan, K.; Zhang, X.; Zong, B., Fe x O y@ C spheres as an excellent catalyst for Fischer− Tropsch synthesis. Journal of the American Chemical Society 2009, 132 (3), 935-937. 29. Situ, S. F.; Samia, A. C. S., Highly efficient antibacterial iron oxide@ carbon nanochains from wustite precursor nanoparticles. ACS applied materials & interfaces 2014, 6 (22), 20154-20163. 30. Sheng, H.; Wei, M.; D’Aloia, A.; Wu, G., Heteroatom polymer-derived 3D high-surface-area and mesoporous graphene sheet-like carbon for supercapacitors. ACS applied materials & interfaces 2016, 8 (44), 30212-30224. 31. Chen, M.; Shao, L.-L.; Li, J.-J.; Pei, W.-J.; Chen, M.-K.; Xie, X.-H., One-step hydrothermal synthesis of hydrophilic Fe 3 O 4/carbon composites and their application in removing toxic chemicals. RSC Advances 2016, 6 (42), 35228-35238. 32. Titirici, M.-M.; Antonietti, M.; Baccile, N., Hydrothermal carbon from biomass: a comparison of the local structure from poly-to monosaccharides and pentoses/hexoses. Green Chemistry 2008, 10 (11), 1204-1212. 33. Plimpton, S., Fast parallel algorithms for short-range molecular dynamics. Journal of computational physics 1995, 117 (1), 1-19. 34. Yin, J.; Zhu, Y.; Yue, X.; Wang, L.; Zhu, H.; Wang, C., From environmental pollutant to activated carbons for high-performance supercapacitors. Electrochimica Acta 2016, 201, 96-105. 35. Navarro-Suárez, A. M.; Carretero-González, J.; Roddatis, V.; Goikolea, E.; Ségalini, J.; Redondo, E.; Rojo, T.; Mysyk, R., Nanoporous carbons from natural lignin: study of structural–textural properties and application to organic-based supercapacitors. RSC Advances 2014, 4 (89), 48336-48343. 36. Zhang, W.; Lin, H.; Lin, Z.; Yin, J.; Lu, H.; Liu, D.; Zhao, M., 3 D Hierarchical Porous Carbon for Supercapacitors Prepared from Lignin through a Facile Template‐Free Method. ChemSusChem 2015, 8 (12), 2114-2122. 37. Saha, D.; Orkoulas, G.; Yohannan, S.; Ho, H. C.; Cakmak, E.; Chen, J.; Ozcan, S., Nanoporous Boron Nitride as Exceptionally Thermally Stable Adsorbent: Role in Efficient Separation of Light Hydrocarbons. ACS Applied Materials & Interfaces 2017, 9 (16), 14506-14517. 38. Sing, K.; Everett, D.; Haul, R.; Moscou, L.; Pierotti, R.; Rouquerol, J.; Siemieniewska, T., Commission on colloid and surface chemistry including catalysis. Pure Appl. Chem 1985, 57, 603-619. 39. Thommes, M.; Kaneko, K.; Neimark, A. V.; Olivier, J. P.; Rodriguez-Reinoso, F.; Rouquerol, J.; Sing, K. S., Physisorption of gases, with special reference to the evaluation of surface area and pore size distribution (IUPAC Technical Report). Pure and Applied Chemistry 2015, 87 (9-10), 1051-1069. 40. Hammouda, B., A new Guinier–Porod model. Journal of Applied Crystallography 2010, 43 (4), 716-719. 41. Hall, P. J.; Bain, E. J., Energy-storage technologies and electricity generation. Energy Policy 2008, 36 (12), 4352-4355.

61
42. Zhang, L. L.; Zhao, X., Carbon-based materials as supercapacitor electrodes. Chemical Society Reviews 2009, 38 (9), 2520-2531. 43. Largeot, C.; Portet, C.; Chmiola, J.; Taberna, P.-L.; Gogotsi, Y.; Simon, P., Relation between the ion size and pore size for an electric double-layer capacitor. J. Am. Chem. Soc. 2008, 130 (9), 2730-2731. 44. Raymundo‐Piñero, E.; Cadek, M.; Béguin, F., Tuning carbon materials for supercapacitors by direct pyrolysis of seaweeds. Advanced Functional Materials 2009, 19 (7), 1032-1039. 45. Ulaganathan, M.; Jain, A.; Aravindan, V.; Jayaraman, S.; Ling, W. C.; Lim, T. M.; Srinivasan, M. P.; Yan, Q.; Madhavi, S., Bio-mass derived mesoporous carbon as superior electrode in all vanadium redox flow battery with multicouple reactions. Journal of Power Sources 2015, 274, 846-850. 46. Xue, Q.; Sun, J.; Huang, Y.; Zhu, M.; Pei, Z.; Li, H.; Wang, Y.; Li, N.; Zhang, H.; Zhi, C., Recent progress on flexible and wearable supercapacitors. Small 2017, 13 (45). 47. Xu, B.; Hou, S.; Cao, G.; Wu, F.; Yang, Y., Sustainable nitrogen-doped porous carbon with high surface areas prepared from gelatin for supercapacitors. Journal of Materials Chemistry 2012, 22 (36), 19088-19093. 48. Tang, Z.; Pei, Z.; Wang, Z.; Li, H.; Zeng, J.; Ruan, Z.; Huang, Y.; Zhu, M.; Xue, Q.; Yu, J., Highly anisotropic, multichannel wood carbon with optimized heteroatom doping for supercapacitor and oxygen reduction reaction. Carbon 2018, 130, 532-543. 49. Fan, Y.-M.; Song, W.-L.; Li, X.; Fan, L.-Z., Assembly of graphene aerogels into the 3D biomass-derived carbon frameworks on conductive substrates for flexible supercapacitors. Carbon 2017, 111, 658-666. 50. Zhou, J.; Li, Z.; Xing, W.; Shen, H.; Bi, X.; Zhu, T.; Qiu, Z.; Zhuo, S., A New Approach to Tuning Carbon Ultramicropore Size at Sub‐Angstrom Level for Maximizing Specific Capacitance and CO2 Uptake. Advanced Functional Materials 2016, 26 (44), 7955-7964. 51. Fuertes, A.; Lota, G.; Centeno, T.; Frackowiak, E., Templated mesoporous carbons for supercapacitor application. Electrochimica Acta 2005, 50 (14), 2799-2805. 52. Chmiola, J.; Yushin, G.; Gogotsi, Y.; Portet, C.; Simon, P.; Taberna, P.-L., Anomalous increase in carbon capacitance at pore sizes less than 1 nanometer. Science 2006, 313 (5794), 1760-1763. 53. Hu, P.; Meng, D.; Ren, G.; Yan, R.; Peng, X., Nitrogen-doped mesoporous carbon thin film for binder-free supercapacitor. Applied Materials Today 2016, 5, 1-8. 54. Kötz, R.; Carlen, M., Principles and applications of electrochemical capacitors. Electrochimica acta 2000, 45 (15), 2483-2498. 55. Tran, C. D.; Ho, H. C.; Keum, J. K.; Chen, J.; Gallego, N. C.; Naskar, A. K., Sustainable Energy‐Storage Materials from Lignin–Graphene Nanocomposite‐Derived Porous Carbon Film. Energy Technology 2017, 5 (11),
1927-1935.

62
56. Stoller, M. D.; Ruoff, R. S., Best practice methods for determining an electrode material's performance for ultracapacitors. Energy & Environmental Science 2010, 3 (9), 1294-1301. 57. Zhang, L.; You, T.; Zhou, T.; Zhou, X.; Xu, F., Interconnected hierarchical porous carbon from lignin-derived byproducts of bioethanol production for ultra-high performance supercapacitors. ACS applied materials & interfaces 2016, 8 (22), 13918-13925. 58. Ravikovitch, P. I.; Neimark, A. V., Density functional theory model of adsorption on amorphous and microporous silica materials. Langmuir 2006, 22 (26), 11171-11179. 59. Goswami, M.; Borreguero, J. M.; Pincus, P. A.; Sumpter, B. G., Surfactant-Mediated Polyelectrolyte Self-Assembly in a Polyelectrolyte–Surfactant Complex. Macromolecules 2015, 48 (24), 9050-9059. 60. Borreguero, J. M.; Pincus, P. A.; Sumpter, B. G.; Goswami, M., Unraveling the Agglomeration Mechanism in Charged Block Copolymer and Surfactant Complexes. Macromolecules 2017, 50 (3), 1193-1205. 61. Humphrey, W.; Dalke, A.; Schulten, K., VMD: visual molecular dynamics. Journal of molecular graphics 1996, 14 (1), 33-38.

63
Appendix
Table S1.1. Iron and potassium contents of all samples analyzed by inductively coupled plasma optical emission spectrometry (ICP-OES). The minimal redox peaks in the cyclic voltammetry experiments and the low metal contents lead us to believe pseudocapacitance does not play a major role in the results. With that said, metal species did affect electrodes’ conductivity confirmed by electrochemical impedance spectroscopy and 5000 cycle stability results.
Fe (%) K (%)
Y20 0.285 NA
Y45 0.791 NA
Y165 0.814 NA
N20 1.060 NA
N45 0.300 NA
N165 1.010 NA
aY20 0.313 0.211
aY45 1.170 0.491
aY165 0.897 0.535

64
Figure S1.1. Thermogravimetric analysis of all hydrothermal synthesized samples prior to high temperature carbonization. Onset of thermal decomposition, thermal stability, and yield all follow the trend with 165>45>20 for N samples due to longer hydrothermal synthesis duration provides larger degrees of stabilization. The same conclusion however, cannot be drawn for the Y samples mainly because of the residue paraffin oil being burned off at ca. 300°C. All samples saw decomposition and carbonization up till ca. 700°C. Weights stay largely constant after ca. 700°C. N samples have noticeably steeper slopes and weight loss at ca. 400°C to 700°C due to volatile evolution which are less pronounce in the Y samples due to different carbonization mechanism.

65
Figure S1.2. Electrochemical testing of the carbonaceous products when used as supercapacitor electrodes. Cyclic voltammetry of (a) Y20, (b) Y165, (c) N20, (d) N45, (e) N165, (f) aY20, (g) aY45, and (h) aY165 at 10, 20, 50, 100, and 200 mV s-1 scan rates.

66
Figure S1.3. Electrochemical testing of the carbonaceous products when used as supercapacitor electrodes. Charge discharge curves of (a) Y20, (b) Y165, (c) N20, (d) N45, (e) N165, (f) aY20, (g) aY45, and (h) aY165 at 200, 500, 1000, and 2000 mA g-1 current densities.

67
Figure S1.4. Surface characterization and electrochemical testing of woodchip pretreatment liquid effluence-derived activated carbon. (a) Isotherm, (b) Pore size distribution, and density functional theory calculation reveals an abundance in microporosity (72%) and a smaller amount of mesoporosity (28%). (c) Cyclic voltammetry with symmetric rectangular shapes (at 10, 20, 50, 100, and 200 mV s-1 scan rates), (d) Charge discharge profiles with symmetric triangular shapes (at 200, 500, 1000, and 2000 mA g-1 current densities), and (e) Electrochemical impedance spectroscopy Nyquist plot indicating almost ideal capacitive behavior. (f) Capacitance vs. scan rates. (g) 5000 cycle stability with 90.5% capacitance retention supporting electrode’s practical application.

68
CHAPTER II: A SOLVENT-FREE RENEWABLE CARBON SYNTHESIS FROM LIGNIN WITH TUNABLE POROSITY FOR
SUPERCAPACITOR ELECTRODES

69
A version of this chapter was originally published by Hoi Chun Ho, Ngoc A. Nguyen, Kelly M. Meek, David M. Alonso, Sikander H. Hakim, and Amit K. Naskar: Ho, Hoi Chun, Ngoc A. Nguyen, Kelly M. Meek, David Martin Alonso, Sikander H. Hakim, and Amit K. Naskar. "A Solvent‐Free Synthesis of Lignin‐Derived Renewable Carbon with Tunable Porosity for Supercapacitor Electrodes." ChemSusChem (2018).
A.N., N.N., and H.H. designed the study. D.A. and S.H. prepared the lignin raw material. N.N. and H.H. synthesized all samples. K.M. performed the size exclusion chromatography and nuclear magnetic resonance spectroscopy. H.H did all other material characterization including coordinating with Galbraith Laboratory Inc., Knoxville, TN. for an outsourced oxygen analysis. All authors contributed to the writing and preparing figures for the manuscript.
Abstract
Synthesis of multiphase materials from lignin offers limited success due to the inherent difficulty in controlling dispersion of these renewable hyperbranched macromolecules in the product or its intermediates. Strategic use of the chemically reactive functionalities in lignin, however, enables tuning morphologies of the materials. Here, we tailored lignin oligomer with a rubbery macromolecule followed by thermal crosslinking to form a carbon precursor with phase contrasted morphology at submicron scale. The solvent-free mixing is conducted in a high-shear melt-mixer. With this, the carbon precursor is further modified with potassium hydroxide for a single-step carbonization to yield activated carbon with tunable pore structure. A typical precursor with 90% lignin yields porous carbon with 2120 m2/g surface area and supercapacitor with 215 F/g capacitance. The results show a simple route towards manufacturing carbon-based energy-storage materials, eliminating the need for conventional template-synthesis.
Introduction
Biomass conversion to fuel and chemicals is one of the challenges to reduce the dependence on fossil fuel resources. While great success has been achieved using the cellulose and the hemicellulose fractions,1 lignin remains underutilized2-
3 and many researchers see its valorization as the key to improving the economics of biomass conversions to levels competitive with petroleum.
Recently a new organosolv fractionation method using -valerolactone (GVL) has

70
been reported.4 This method maximizes the conversion of the lignocellulosic biomass to high value products (>80% of the original wood mass to product) and produces a high purity lignin, with a significant amount of β-O-4’ linkages that can be used as a high value co-product, like lignin-derived carbon.5-9 Although major development effort has gone into controlling lignin carbon’s morphology, the scientific community still struggles.10-12 This is likely due to the fact that lignin is a highly branched and complex polymer.2-3 Nevertheless, the plentiful functional groups13 on lignin make it amenable for chemical reactions.2
The research group learned previously that thermal stabilization in air can crosslink lignin itself or with acrylonitrile-butadiene rubber (NBR), giving different thermomechanical properties of the lignin-NBR adducts, hinting to a pathway for better control of morphology.14 Covalent bonds like ether linkages within lignin are thermally sensitive,15 especially when they are next to phenolic rings, due to the resonance effects with the Π electron conjugation. As a good radical scavenger,16 any free radicals generated from the thermally sensitive linkages during stabilization can then crosslink with reactive sites on other lignin molecules resulting in a molecular weight change.17 Concurrently, lignin radicals can also attack the unsaturated carbon-carbon double bonds (C=C) on NBR, in turn, crosslinking with NBR.14, 18 By utilizing lignin crosslinking with different polymers, green polymer blends can be designed. Akato et al. reported by using 10% polyethylene oxide (PEO), lignin can be blended with acrylonitrile butadiene styrene without loss of mechanical properties, potentially reducing the cost and carbon footprint of 3D printing products. Bova et al. successfully produced high performing NBR-lignin blends with a small amount of low cost additives like PEO, carbon black, etc. with tensile strength of up to 25.2MPa and failure strain of up to 140%. Using temperature induced nanoscale-dispersion of lignin, Tran et al. synthesized a NBR blend with outstanding recyclability and yield stress of up to 45MPa. Similarly, Nguyen et al. made a NBR-lignin blend and demonstrated its use for shape memory and sensor application after coating with metallic nanoparticles. Herein, by doping with small quantity of NBR (10 wt. %) and thermally stabilizing lignin, we can tailor the degree of crosslinking in the polymer blends. After carbonization, the lignin-derived carbon morphology can thus be tuned. Previously, lignin carbon’s morphological control commonly relies on polymeric surfactants and solvents.11, 19 For example, Saha et al. used a Pluronic surfactant with tetrahydrofuran and hydrochloric acid (HCl) mix for templating a HCL treated lignin prior to carbonization and activation.19 In another case, a lignin-cellulose mix was dissolved in a chloroform-water mixture with the presence of sodium dodecylbenzenesulfonate prior to acetone precipitation, drying, and carbonization.11 To the best of our knowledge, this is the first attempt towards designing lignin carbon morphology without the use of any solvent or block copolymer templating agents. To maximize the utilization of lignin, a 90% lignin loading was used across all samples. This is so far the highest lignin loading

71
among many lignin-polymer composite work reviewed in this manuscript which have lignin loading anywhere between 10% to 60%.14, 18, 20-21 Using this simple design principle, we aimed to synthesize a better porous carbon from lignin and to improve its performance as supercapacitor electrode.
Results and Discussion
To confirm the possibility of crosslinking reactions within a renewable lignin (GLB-lignin) extracted from hardwood (Birch) biomass using gamma-valerolactone solvent and in the mixtures, 2D nuclear magnetic resonance spectroscopy was conducted to determine the availability of thermally sensitive linkages (see Figure S2.1-3, Table S2.1, Supporting Information). Syringyl propane units (substructures S and S’) were observed at relatively high concentrations, while guaiacyl propane unit (substructure G) and p-hydroxyphenyl propane units (substructure H) were observed at lower concentrations. Within the structural units, GLB lignin contains significant β-O-4’ linkages (substructure A), β-5’ linkages (substructure B), and β-β linkages (substructure C). The presence of these thermally reactive linkages, particularly the β-O-4’ linkages, gives the possibility of free radical formation for cross-linking reactions and macromolecular rearrangements. The current study relies on these reactive sites for tuning the lignin-derived carbon morphology and functionality. In the previous studies, when crosslinking lignin with rubbers was accomplished by simple melt-mixing, small (nanometer to micrometer scale) lignin aggregates dispersed within the rubber matrix were observed. The lignin aggregates were described as “island in the sea” and “spaghetti and meatball” when observed under electron microscopes.14, 18, 20-21 With this in mind, we carbonized a 10 wt.% NBR doped lignin and observed rough macroporous structures under scanning electron microscope (Figure 2.1 a-c), that are independent of stabilization duration. The investigated samples, namely GLB-D, 1-GLB-D, and 6-GLB-D, are the carbonized lignin NBR composites with no stabilization, one-hour stabilization, and six-hour stabilization, respectively. Notably, the “island in the sea” and “spaghetti and meatball” type morphology was retained through the carbonization and activation process. In contrast, all undoped (without NBR) lignin carbon samples show relatively less porous surfaces (Figure 2.1 d-f), resulting from the lack of NBR dispersion. The GLB, 1-GLB, and 6-GLB samples are carbonized undoped lignin with no stabilization, one-hour stabilization, and six-hours stabilization, respectively. It is remarkable that even at as low as 10% NBR doping, as oppose to the 60% NBR loading in the previous studies,18, 20-21 carbon morphology with submicron-scale pore structures can be produced.

72
It is known that porosity of activated carbon produced from polymer precursors like lignin can be controlled by varying the molecular weight of the precursor.6, 22 By stabilizing lignin and lignin NBR composite in air, their degree of crosslinking was controlled, and thus the morphology of the final activated carbon was controlled. The first hint of success in controlling the degree of crosslinking via stabilization in air came as the color changed in lignin samples from a light to dark brown powder (see inset of Figure 2.2c). A more definite way to confirm a change in molecular weight by size exclusion chromatography (SEC) could not be accomplished due to lack of solubility of highly crosslinked samples. For example, SEC can only be performed with GLB and 1-GLB carbon precursors (P-GLB and P-1-GLB). The number average molecular weights (Mn) of P-GLB and P-1-GLB are 4074 g mol-1 and 5400 g mol-1 with polydispersity indices (PDI) of 1.192 and 1.267 respectively. With only one hour of thermal stabilization, the change in Mn is distinguishable to confirm stabilization in the air at 180°C can be used to control the molecular weight of lignin. To unveil the changes in degree of crosslinking for the remaining samples, we approached other indirect methods. An increase in thermal stability can be an
Figure 2.1. Scanning electron microscope images of carbonized GLB lignin and its rubber composites. a)-c) Doped lignin-derived carbon from composition with 90% lignin and 10% NBR. d)-f) Undoped lignin-derived carbon, i.e., carbon from 100% lignin. Left to right are samples with no stabilization time, one-hour stabilization, and six-hour stabilization.

73
Figure 2.2. Thermal stability of carbon precursors with varied degree of crosslinking. Differential scanning calorimetry data of a) undoped GLB lignin carbon precursors and b) NBR doped GLB lignin carbon precursors. Thermogravimetric analysis of c) undoped GLB lignin carbon precursors and d) NBR doped GLB lignin carbon precursors. The insert of c) is a photograph of all undoped GLB lignin carbon precursors. (From left to right: P-GLB, P-1-GLB, and 6-P-GLB)
d)c)
b)a)
140.1°C
125.2°C
154.6°C
161.0°C
172.3°C
170.4°C
Exo
En
do
Exo
En
do

74
indication of crosslinking.14 However, we recognize that the presence of highly branched structures and certain degree of crosslinks within the samples considerably contributed to the broad thermal transitions and thus the thermal transition temperatures might be a crude determinant (Figure S2.4). Nevertheless, the endset temperatures determined from differential scanning calorimetry (DSC) showed a continuous increasing trend from 125.2°C, 140.1°C, to 154.6°C for P-GLB, P-1-GLB, and P-6-GLB respectively. Likewise, the endset temperatures of P-GLB-D samples increased continuously from 161.0°C, 170.4°C, to 172.3°C with no stabilization, one-hour stabilization and six-hours stabilization respectively. The DSC results clearly showed an obvious and expected trend of increasing polymer’s degree of crosslinking with stabilization time (Figure 2.2 a-b). Although less apparent with the doped samples, similar trends were also observed with the onset of thermal degradation as observed from the thermogravimetric analysis (TGA) in Figure 2.2 c-d. On par with DSC and TGA, we expected that crosslinking would cause a change with reactive functional groups in the carbon precursors as shown with Fourier-transform infrared spectra (Figure 2.3 a-b). For undoped carbon precursor, a shift in alkene (C-H) bending frequency was detected from 835 cm-1 and 770 cm-1. The (-O-H) stretch with alcohol and carboxylic acid weakened with stabilization time at 3450 cm-1. In turn, a stronger (-C-O-) stretch (e.g. ether and ester functional groups) was detected at 1170 cm-1. In addition to a few changes in the undoped samples, FTIR spectra of all doped samples have peaks at ca. 970 cm-1 due to the alkene (-C-H) bond and ca. 2350 cm-1 due to the nitrile (-C≡N) stretch from NBR. Nonetheless, as stabilization progressed, the intensity of these peaks lessened as first or second order amine signal at 770 cm-1 and carbonyl group at 1715 cm-1 arose. Gas adsorption-desorption experiments were then conducted with all carbon samples (Figure 2.4). All isotherms exhibit a steep initial climb at low relative pressure followed by a flat plateau, signifying typical type I isotherms with dominant microporosity (Figure 2.4a).23 All isotherms except for GLB and 1-GLB also show small hysteresis, indicating capillary condensation in mesopores.24 Similar features can also be determined from the pore size distributions (Figure 2.4b). Both GLB and 1-GLB samples show a small but still distinct peak at ca. 2-3 nm in the pore-size distribution curve. Whereas, the other four samples show a contrastingly broader peak at ca. 3-5nm. The estimated surface area (SA) and corresponding pore volumes are calculated by Quenched Solid Density Functional Theory, QSDFT, and summarized in Table 2.1. Interesting trends were observed. When GLB lignin is doped with NBR prior to carbonization, the SA of the derived carbon increases from 1750 m2/g to 2120 m2/g. However, when the doped GLB lignin is stabilized before carbonization, the SA of the derived carbon decreases continuously to 1912 m2/g

75
Figure 2.3. Chemical characteristics of carbon precursors with varied degree of crosslinking. Fourier-transform infrared spectroscopy of a) undoped GLB lignin carbon precursors and b) NBR doped GLB lignin carbon precursors.
Figure 2.4. Gas adsorption-desorption data. a) Isotherms and b) pore-size distributions of all GLB lignin carbons.

76
with one-hour stabilization then 1585 m2/g with six hours of stabilization time. For undoped lignin, the SA first increases with stabilization time with 1-GLB giving 2136 m2/g but drops to 1970 m2/g with a six-hours stabilization time. The pore volume shows similar trends as well. Many factors take part in controlling the final porosity of carbons. Jeon et al. recently revealed a significant contribution of precursor molecular weight to the carbon porosity.6 Briefly, low Mn lignin carbon precursor has more free volume, chain ends, and a higher chain mobility, allowing it to be carbonized more easily, leading to higher porosity relative to its higher Mn counterpart.6, 22 The difference in carbon precursor Mn directly relates to the degree of crosslinking as discussed previously in this manuscript with the FTIR, thermal stability, and color change of lignin and lignin-NBR composites in Figure 2.2-3. The second major factor affecting carbon porosity can be volatile generations from the oxygen content of the carbon precursor.6, 22 Due to the possible oxidation of radicals, it is logical to suspect that stabilization altered oxygen content of the carbon precursor. Thus, oxygen analysis was performed on all the carbon precursors. Interestingly, the change in oxygen content is minimal with respect to stabilization time (Table S2.2). Furthermore, potassium hydroxide (KOH) is a well-known carbon activating agent.5, 25 During carbonization, KOH etches pores along carbon surfaces and at the same time provides ample supply of oxygen to the system, drowning out the small difference in oxygen content with the carbon precursors. KOH activation has been studied extensively and can be summarized as: 9
6KOH + 2C = 2K + 3H2 + 2K2CO3.
Table 2.1. Surface area, pore volumes, and capacitances at 100 mA/g for all carbon samples.
Surface area (m2/g) Pore Volume (m3/g) Capacitance (F/g)
GLB 1750 0.733 175 1-GLB 2136 0.893 201 6-GLB 1970 1.098 195 GLB-D 2120 1.33 215 1-GLB-D 1912 1.145 170 6-GLB-D 1585 0.845 154

77
Another source of volatiles for the doped samples comes from the pyrolysis of NBR during carbonization.26 Thus far, lignin-derived activated carbon’s morphological control by thermal stabilization and melt-mixing of NBR in terms of porosity have been discussed in two scales and must be emphasized. We explored porosity in the micrometer scale in the beginning of the manuscript relating to the SEM images presented in Figure 2.1. Here, porosity in the nanometer scale is presented with the result from gas adsorption-desorption experiments relating to Figure 2.2-3 and Table 2.1. NBR doping has a role to play in the development of both micrometer and nanometer size pores. We believe melt-mixing can be a crude process. Porosity generated in the micrometer scale seen from Figure 2.1 may originate from the imperfect mixing of the 10% NBR aggregates within lignin NBR composite. In contrast, the role of the 10%NBR dope here with the nanometer size porosity described by the gas adsorption-desorption originates from the well mixed NBR dispersion within the lignin matrix. To understand the impact of carbon morphology on supercapacitor performance, we synthesized electrodes using the carbon samples and their electrochemical performance was tested. Supercapacitors, unlike Li-ion batteries, rely on the physical separation of charges for energy storage.27 Because physical charge separation is the key, a high performing supercapacitor correlates directly with the carbon electrode’s porosity and accessible surfaces by electrode ions.28 The accessible pores are the active sites which allow electrode charges to interact with electrolyte ions, thus storing energy. As expected, the measured capacitance values largely correlate directly with SA of the carbon samples29 (Table 2.1). It is also anticipated that as current density increases, capacitance decreases, led by the limited rate of electrolyte diffusion through narrow pores relative to the increasing current (Figure 2.5a).19 Herein, GLB lignin-derived electrodes have capacitances of up to 215 F/g with GLB-D. These performances are less than that of the cutting edge electrodes fabricated using graphene or graphene-like materials with capacitances of ca. 300 F/g.30-31 However, those exotic carbon materials can cost three times more than the current commercial supercapacitor carbon electrodes made from coconut shell.32 In a supercapacitor where half of its material cost comes from the carbon electrode,32 cost barrier can easily prevent market penetration, making a strong case for lignin-derived carbon electrodes. Cyclic voltammetry (CV) and charge discharge (CD) experiments were carried out (Figure 2.5b-c with GLB-D as an example). Other CV and CD profiles are showed in Figure S2.5-6. All CV and CD profiles exhibited almost symmetrical rectangular and triangular shapes respectively, suggesting excellent capacitive behaviors. Electrochemical impedance spectroscopy experiments were then conducted. The Nyquist plots of all samples (Figure 2.5d-e) behave like typical resistance-capacitance (R-C) circuits with nearly vertical lines at low frequency,

78
Figure 2.5. Performance of supercapacitor electrodes. a) Capacitance vs. current density of all samples. b) Typical charge discharge profiles at 100, 200, 500, 1000, and 2000 mA/g and c) Typical cyclic voltammetry at 10, 20, 50, 100, and 200 mV/s with doped GLB lignin-derived carbon as an example. d) Nyquist plots and e) enlarged Nyquist plots of all carbon electrodes. f) Cycle stability of GLB lignin derided carbon, doped GLB lignin-derived carbon, GLB lignin with one-hour stabilization-derived carbon.

79
suggesting near ideal capacitive behaviors.33 At a higher frequency, an arc shape with shallower slopes can be observed. The shallower slopes with ca. 45° sitting in between the low and high frequencies signal Warburg resistance, stemming from electrolyte ions diffusion rate.25 The arcs at high frequency usually infer charge transfer resistance, which includes the accessibility of electrolyte ions onto porous carbon surfaces and the electrode’s conductivity. Because the arcs did not extend into full semi-circles, they suggest minimal charge transfer resistance due to mainly larger pores taking parts in charge transfer.19 The internal resistance, or equivalent series resistance, commonly known as ESR, which combines many aforementioned resistances and resistance of the carbon electrodes, bulk electrolytes, and any contact resistance, can be estimated from
the X-intercepts.34 Estimated ESR ranged from 0.238 with 6-GLB sample to
0.466 with GLB sample (Figure 2.S3). With these promising results, the two best performing samples along with GLB-derived electrode were further tested with 5000 cycle stability (Figure 2.5f). All samples have high stability with 101-105% capacitance retention. The rise in capacitance during cycling can be a hint to the improvement of electrode wettability.35 The superior electrochemical stability and reversibility36 supports the use of NBR doping and thermal stabilization for a better lignin-derived carbon electrode design in practical supercapacitance applications.
Conclusions
In summary, this work demonstrates a path for producing controlled morphology in lignin-derived activated carbon without the use of solvents and traditional templating agents. By simple thermal treatment of lignin carbon precursor in air at 180 °C for an optimal duration and/or melt-mixing the lignin with 10 wt.% NBR, we were able to control the degree of crosslinking in the resulting polymeric blends. After carbonization and activation, the degree of crosslinking translated into carbon morphology and porosity, thus increased the SA from 1750 m2/g up to 2120 m2/g. This design approach was also shown to be effective in tailoring lignin-derived carbon in supercapacitor electrode applications. The synthesized electrodes exhibited good capacitive behaviors with capacitance of up to 215 F/g and full capacitance retention even after 5000 cycles. These, and others, new lignin applications will be critical for the development of the future biorefinery. While many works have focused on the production of fuel and chemicals from the cellulose and hemicellulose fractions, getting value from the lignin, beyond its heating value, will enable the low-cost production of building blocks chemicals and bio-fuels.

80
Experimental Section
Lignin Preparation Method To obtain the GLB lignin (Glucan BioRenewables, LLC) white birch was treated
in a 0.1 M sulfuric acid solution 80/20 wt% -valerolactone (GVL)/water for two hours at 121°C. At the end of the reaction the solid cellulose was separated from the GVL/water solution containing the solubilized lignin and hemicellulose by conventional vacuum filtration. To precipitate the lignin, 10 times by mass of water were added to the liquid solution. The lignin was separated from the liquid by centrifugation and washed several times with hot water to remove remaining GVL. Finally, the lignin was dried at room temperature for 24 hours. The lignin was recovered as a light brown fine powder. Sample Preparation GLB lignin was doped with nitrile butadiene rubber (NBR51, 51 mol% nitrile content) (Scientific Polymer) in a 9:1 mass ratio via melt-mixing in a Brabender Plastic Corder internal mixer. The lignin was loaded first at 90 rpm and 180 ºC for 2 min. The NBR51 was then added and continued mixing for a total of 30 min. Melt-mixed composite was then thermally annealed in air at 180 °C for one hour or six hours. The samples were collected and stored at ambient temperature before grounding with KOH in a 1:2 mass ratio. Then samples were loaded and ramped in a furnace under nitrogen for two hours to 800 °C, held for 30 mins, then cooled to ambient temperature. The carbonized samples were collected and washed with water, then dried. GLB lignin carbon without NBR doping were also prepared similarly. Carbon Precursor Characterization Lignin functional groups were studied by 13C NMR and 2D 1H-13C Heteronuclear Multiple Quantum Coherence (HMQC) NMR spectroscopy using methods previously reported37 on a Varian 500 MHz spectrometer at 23 °C with DMSO-d6 as the solvent. Lignin molecular weight and distribution were determined in DMF (with 0.05 mol LiBr) via size exclusion chromatography (SEC) at 60 °C and a flowrate of 1 mL min-1. The SEC system consisted of a Waters 1515 Isocratic HPLC pump equipped with 2414 Refractive Index (RI) detector. Polyethylene oxide/polyethylene glycol standards were used with Styragel HR 3 and HR 4 columns maintained in a column heater compartment. Glass transition temperatures were determined using a differential scanning calorimeter (Q2000, TA instruments). For each sample, ca. 4 mg was loaded in a hermetic pan for measurement. Three heating and cooling cycles were carried out but only the second cycle was used for analysis. Within each cycle, sample was ramped to and back from -80ºC and 250ºC at 10ºC/min. Thermal stability was investigated by a thermogravimetric analyzer (Q500, TA instruments). For each sample, ca. 15 mg was placed onto a platinum pan for measurement. During measurement,

81
nitrogen atmosphere with a flow of 60 mL/min was used. Temperature was first ramped to 105ºC at 10ºC/min, then held for 20 min, before ramping to 650ºC at 10ºC/min. Fourier transform infrared spectroscopy was conducted with a PerkinElmer Frontier instrument. The ATR, attenuated total reflectance method, was used with a force gauge of 60 (a.u). All spectra with ranges from 500 to 4,000 cm-1 were collected with 32 scans at a scan speed of 1 cm/s and a resolution of 1 cm-1. Baseline was subtracted for correction for each measurement. Carbon Characterization Scanning electron microscope (SEM) images were taken from Hitachi S4800 accelerated at 10kV with a working distance of 15mm. Nitrogen adsorption desorption experiments were done with a Quantachrome Autosorb iQ at 77K. Surface area, pore volume, and pore size distribution were determined using the Quenched Solid Density Functional Theory (QSDFT). Oxygen analysis by pyrolysing under helium with a Thermo Finnigan FlashEA™ 1112 Elemental Analyzer (Oxygen Modification) was outsourced to Galbraith Laboratories Inc., a commercial analytical chemistry laboratory service in Knoxville, TN.
For capacitance measurement, the carbon sample was mixed with a conductive carbon black (TIMCAL C45) and Polytetrafluoroethylene (60% dispersion in water) in an 8:1:1 ratio. Ethanol was then added to the mixture to form a paste. The paste was then coated onto two 7/16th in. diameter Ni-foam discs, dried overnight, then pressed and used as current collector electrodes in symmetrical two-electrode cells. Filter paper soaked with 6M KOH was served as the separator and electrolyte. The electrode-filter paper-electrode complex was then housed inside a Teflon Swagelok cell with two stainless steel rods. VersaSTAT 4 (Princeton Applied Research) was used to collect cyclic voltammetry, electrochemical impedance spectroscopy (EIS), and charge discharge profiles. Frequency of 500 kHz to 50 mHz was conducted with EIS at an amplitude of 10mV. Specific capacitances were calculated from C = 2q/mE, where m is the mass of the paste used, E is the voltage window of 0.8V, and q is the charge accumulation calculated from VersaStudio software. The internal resistance, or equivalent series resistance, commonly known as ESR, was estimated from the X-intercepts. Cycle stability was conducted at 500mA g-1on an Arbin battery cycler (Arbin Instrument).
Acknowledgements
This research at Oak Ridge National Laboratory, managed by UT Battelle, LLC, for the U.S. Department of Energy (DOE) under contract DE-AC05-00OR22725, was sponsored by the DOE Advance Manufacturing office. The lignin sample

82
was supplied by Glucan Biorenewables LLC. We thank Dr. Yunchao Li from The University of Tennessee for helping with the electrode testing and Dr. Francisco Sotomayor from Quantachrome Instruments for the continuous support with the gas adsorption desorption experiments.

83
References 1. Ho, H. C.; Goswami, M.; Chen, J.; Keum, J. K.; Naskar, A. K., Amending the Structure of Renewable Carbon from Biorefinery Waste-Streams for Energy Storage Applications. Sci Rep 2018, 8 (1), 8355. 2. Laurichesse, S.; Averous, L., Chemical modification of lignins: Towards biobased polymers. Progress in Polymer Science 2014, 39 (7), 1266-1290. 3. Saito, T.; Brown, R. H.; Hunt, M. A.; Pickel, D. L.; Pickel, J. M.; Messman, J. M.; Baker, F. S.; Keller, M.; Naskar, A. K., Turning renewable resources into value-added polymer: development of lignin-based thermoplastic. Green Chemistry 2012, 14 (12), 3295-3303. 4. Alonso, D. M.; Hakim, S. H.; Zhou, S.; Won, W.; Hosseinaei, O.; Tao, J.; Garcia-Negron, V.; Motagamwala, A. H.; Mellmer, M. A.; Huang, K.; Houtman, C. J.; Labbe, N.; Harper, D. P.; Maravelias, C.; Runge, T.; Dumesic, J. A., Increasing the revenue from lignocellulosic biomass: Maximizing feedstock utilization. Sci Adv 2017, 3 (5), e1603301. 5. Saha, D.; Van Bramer, S. E.; Orkoulas, G.; Ho, H.-C.; Chen, J.; Henley, D. K., CO 2 capture in lignin-derived and nitrogen-doped hierarchical porous carbons. Carbon 2017. 6. Jeon, J. W.; Zhang, L.; Lutkenhaus, J. L.; Laskar, D. D.; Lemmon, J. P.; Choi, D.; Nandasiri, M. I.; Hashmi, A.; Xu, J.; Motkuri, R. K.; Fernandez, C. A.; Liu, J.; Tucker, M. P.; McGrail, P. B.; Yang, B.; Nune, S. K., Controlling Porosity in Lignin‐Derived Nanoporous Carbon for Supercapacitor Applications. ChemSusChem 2015, 8 (3), 428-432. 7. Li, H.; Yuan, D.; Tang, C.; Wang, S.; Sun, J.; Li, Z.; Tang, T.; Wang, F.; Gong, H.; He, C., Lignin-derived interconnected hierarchical porous carbon monolith with large areal/volumetric capacitances for supercapacitor. Carbon 2016, 100, 151-157. 8. Zhang, W.; Zhao, M.; Liu, R.; Wang, X.; Lin, H., Hierarchical porous carbon derived from lignin for high performance supercapacitor. Colloids and Surfaces A: Physicochemical and Engineering Aspects 2015, 484, 518-527. 9. Zhang, W.; Lin, H.; Lin, Z.; Yin, J.; Lu, H.; Liu, D.; Zhao, M., 3 D Hierarchical Porous Carbon for Supercapacitors Prepared from Lignin through a Facile Template‐Free Method. ChemSusChem 2015, 8 (12), 2114-2122. 10. Kang, S.; Li, X.; Fan, J.; Chang, J., Characterization of Hydrochars Produced by Hydrothermal Carbonization of Lignin, Cellulose, d-Xylose, and Wood Meal. Industrial & Engineering Chemistry Research 2012, 51 (26), 9023-9031. 11. Shimada, T.; Hata, T.; Kijima, M., Thermal Conversion of Lignin–Cellulose Composite Particles into Aggregates of Fine Carbon Grains Holding Micro- and Mesoporous Spaces. ACS Sustainable Chemistry & Engineering 2015, 3 (8), 1690-1695.
84
12. Chieffi, G.; Fechler, N.; Esposito, D., Valorization of lignin waste from hydrothermal treatment of biomass: towards porous carbonaceous composites for continuous hydrogenation. RSC Advances 2015, 5 (78), 63691-63696. 13. Saraf, V. P.; Glasser, W. G., Engineering plastics from lignin. III. Structure property relationships in solution cast polyurethane films. Journal of applied polymer science 1984, 29 (5), 1831-1841. 14. Nguyen, N. A.; Meek, K. M.; Bowland, C. C.; Barnes, S. H.; Naskar, A. K., An Acrylonitrile–Butadiene–Lignin Renewable Skin with Programmable and Switchable Electrical Conductivity for Stress/Strain-Sensing Applications. Macromolecules 2017, 51 (1), 115-127. 15. Braun, J.; Holtman, K.; Kadla, J., Lignin-based carbon fibers: Oxidative thermostabilization of kraft lignin. Carbon 2005, 43 (2), 385-394. 16. Thielemans, W.; Wool, R. P., Lignin esters for use in unsaturated thermosets: Lignin modification and solubility modeling. Biomacromolecules 2005, 6 (4), 1895-1905. 17. Sun, Q.; Khunsupat, R.; Akato, K.; Tao, J.; Labbé, N.; Gallego, N. C.; Bozell, J. J.; Rials, T. G.; Tuskan, G. A.; Tschaplinski, T. J.; Naskar, A. K.; Pu, Y.; Ragauskas, A. J., A study of poplar organosolv lignin after melt rheology treatment as carbon fiber precursors. Green Chemistry 2016, 18 (18), 5015-5024. 18. Tran, C. D.; Chen, J.; Keum, J. K.; Naskar, A. K., A New Class of Renewable Thermoplastics with Extraordinary Performance from Nanostructured Lignin‐Elastomers. Advanced Functional Materials 2016, 26 (16), 2677-2685.
19. Saha, D.; Li, Y.; Bi, Z.; Chen, J.; Keum, J. K.; Hensley, D. K.; Grappe, H. A.; Meyer, H. M., 3rd; Dai, S.; Paranthaman, M. P.; Naskar, A. K., Studies on supercapacitor electrode material from activated lignin-derived mesoporous carbon. Langmuir 2014, 30 (3), 900-10. 20. Akato, K.; Tran, C. D.; Chen, J.; Naskar, A. K., Poly(ethylene oxide)-Assisted Macromolecular Self-Assembly of Lignin in ABS Matrix for Sustainable Composite Applications. ACS Sustainable Chemistry & Engineering 2015, 3 (12), 3070-3076. 21. Bova, T.; Tran, C. D.; Balakshin, M. Y.; Chen, J.; Capanema, E. A.; Naskar, A. K., An approach towards tailoring interfacial structures and properties of multiphase renewable thermoplastics from lignin–nitrile rubber. Green Chemistry 2016, 18 (20), 5423-5437. 22. Chatterjee, S.; Saito, T., Lignin-Derived Advanced Carbon Materials. ChemSusChem 2015, 8 (23), 3941-58. 23. Saha, D.; Orkoulas, G.; Yohannan, S.; Ho, H. C.; Cakmak, E.; Chen, J.; Ozcan, S., Nanoporous Boron Nitride as Exceptionally Thermally Stable Adsorbent: Role in Efficient Separation of Light Hydrocarbons. ACS Applied Materials & Interfaces 2017, 9 (16), 14506-14517. 24. Thommes, M.; Kaneko, K.; Neimark, A. V.; Olivier, J. P.; Rodriguez-Reinoso, F.; Rouquerol, J.; Sing, K. S., Physisorption of gases, with special reference to the evaluation of surface area and pore size distribution (IUPAC Technical Report). Pure and Applied Chemistry 2015, 87 (9-10), 1051-1069.

85
25. Tran, C. D.; Ho, H. C.; Keum, J. K.; Chen, J.; Gallego, N. C.; Naskar, A. K., Sustainable Energy‐Storage Materials from Lignin–Graphene Nanocomposite‐Derived Porous Carbon Film. Energy Technology 2017.
26. Naskar, A. K.; Bi, Z.; Li, Y.; Akato, S. K.; Saha, D.; Chi, M.; Bridges, C. A.; Paranthaman, M. P., Tailored recovery of carbons from waste tires for enhanced performance as anodes in lithium-ion batteries. RSC Advances 2014, 4 (72), 38213-38221. 27. Simon, P.; Gogotsi, Y., Materials for electrochemical capacitors. Nat Mater 2008, 7 (11), 845-54. 28. Chmiola, J.; Yushin, G.; Gogotsi, Y.; Portet, C.; Simon, P.; Taberna, P. L., Anomalous increase in carbon capacitance at pore sizes less than 1 nanometer. Science 2006, 313 (5794), 1760-3. 29. Raymundo‐Piñero, E.; Cadek, M.; Béguin, F., Tuning carbon materials for supercapacitors by direct pyrolysis of seaweeds. Advanced Functional Materials 2009, 19 (7), 1032-1039. 30. Tian, W.; Gao, Q.; Zhang, L.; Yang, C.; Li, Z.; Tan, Y.; Qian, W.; Zhang, H., Renewable graphene-like nitrogen-doped carbon nanosheets as supercapacitor electrodes with integrated high energy–power properties. Journal of Materials Chemistry A 2016, 4 (22), 8690-8699. 31. Xu, Y.; Lin, Z.; Zhong, X.; Huang, X.; Weiss, N. O.; Huang, Y.; Duan, X., Holey graphene frameworks for highly efficient capacitive energy storage. Nat Commun 2014, 5, 4554. 32. Weinstein, L.; Dash, R., Have exotic carbons failed? Materials Today 2013, 16 (10). 33. Liu, J.; Wang, X.; Gao, J.; Zhang, Y.; Lu, Q.; Liu, M., Hollow porous carbon spheres with hierarchical nanoarchitecture for application of the high performance supercapacitors. Electrochimica Acta 2016, 211, 183-192. 34. Stoller, M. D.; Ruoff, R. S., Best practice methods for determining an electrode material's performance for ultracapacitors. Energy & Environmental Science 2010, 3 (9), 1294-1301. 35. Peng, H.; Ma, G.; Sun, K.; Mu, J.; Zhang, Z.; Lei, Z., Formation of carbon nanosheets via simultaneous activation and catalytic carbonization of macroporous anion-exchange resin for supercapacitors application. ACS applied materials & interfaces 2014, 6 (23), 20795-20803. 36. Fan, Z.; Liu, Y.; Yan, J.; Ning, G.; Wang, Q.; Wei, T.; Zhi, L.; Wei, F., Template‐Directed Synthesis of Pillared‐Porous Carbon Nanosheet Architectures: High‐Performance Electrode Materials for Supercapacitors.
Advanced Energy Materials 2012, 2 (4), 419-424. 37. Capanema, E. A.; Balakshin, M. Y.; Kadla, J. F., A comprehensive approach for quantitative lignin characterization by NMR spectroscopy. J Agric Food Chem 2004, 52 (7), 1850-60.

86
Appendix
Figure S2.1. 13C NMR spectra of GLB lignin.

87
Table S2.1. Signal assignment in the 13C NMR spectrum of GLB Lignin.
Range (ppm)
Assignment Amount (per 100
Ar)
162-142
CAR-O 192
142-125
CAR-C 208
125-102
CAR-H 212
90-77 Alk-O-Ar, α-O-Alk
53
77-65 γ-O-Alk, OHsec 30
65-58 OHprim 52
58-54 OMe 122
54-52 Cβ-β,’ Cβ-5’ 7

88
Figure S2.2. HMQC spectrum of GLB lignin. Assigned lignin substructures are in Figure S2.3.

89
Figure S2.3. Lignin substructures detected by HMQC. (A) β-O-4’; (B) β-5’ (phenylcoumaran structure); (C) β-β’ (resinol structure); (G) guaiacylpropane unit; (S) syringyl propane unit; (S’) syringyl propane unit with carbonyl at Cα; (H) p-hydroxyphenolpropane unit.

90
Figure S2.4. Differential scanning calorimetry data of a) undoped GLB lignin carbon precursors and b) NBR doped GLB lignin carbon precursors.
Table S2.2. Summary of oxygen analysis of all carbon precursor samples.
Oxygen (%)
P-GLB 29.13% P-1-GLB 29.28% P-6-GLB 29.16% P-GLB-D 25.61% P-1-GLB-D 25.91% P-6-GLB-D 26.59%

91
Figure S2.5. Charge discharge profiles at 100, 200, 500, 1000, and 2000 mA/g of a) GLB lignin-derived carbon, b) GLB lignin with one hour stabilization-derived carbon, c) GLB lignin with six hours stabilization-derived carbon, d) Doped GLB lignin with one hour stabilization-derived carbon, and e) Doped GLB lignin with six hour stabilization-derived carbon.

92
Figure S2.6. CV at 10, 20, 50, 100, and 200 mV/s of a) GLB lignin-derived carbon, b) GLB lignin with one hour stabilization-derived carbon, c) GLB lignin with six hours stabilization-derived carbon, d) Doped GLB lignin with one hour stabilization-derived carbon, and e) Doped GLB lignin with six hour stabilization-derived carbon.

93
Table S2.3. Summary of internal resistances, or equivalent series resistances (ESR) of all carbon-derived electrode samples.
ESR ()
GLB 0.466 1-GLB 0.384 6-GLB 0.238 GLB-D 0.247 1-GLB-D 0.247 6-GLB-D 0.324

94
CHAPTER III: A SIMPLE METHOD FOR SYNTHESIS OF MICRONIZED CARBON SPHERES FROM LIGNIN

95
This chapter is based on a manuscript under preparation. The authors include Hoi Chun Ho, Peter V. Bonnesen, Ngoc A. Nguyen, David A. Cullen, David Uhrig, Monojoy Goswami, Jong K. Keum, and Amit K. Naskar. All authors contributed to designing the experiments and preparing the manuscript. H.H. synthesized all materials. P.B. assisted in the nuclear magnetic resonance spectroscopy studies. N.N. assisted in the rheology studies. D.C. assisted in collecting the transmission electron microscope images. D.U. assisted in the size exclusion chromotography experiments. M.G. assisted in the molecular simulations. J.K. assisted in the x-ray diffraction.
Abstract
I use lignin, to yield monodisperse micronized carbon particles. Synthesis of particulate carbon spheres from an aqueous colloidal suspension of lignin usually involves additional steps such as the addition of surfactant or monomers and subsequent interfacial polymerization, and solvent removal either by slow evaporation or freeze-drying prior to the high temperature carbonization process. In this article, we present a solvothermal synthesis of lignin-derived carbon by strategically using the char forming characteristics of lignin via thermally-induced molecular rearrangement inside a good organic solvent. Use of less polar solvent than water allows nonpolar aromatic char to stay solvated during the reaction and helps to form equally-sized spherical charred product. Computer simulation shows their granular structure formation via thermal reaction in a good solvent. Carbon and proton nuclear magnetic resonance spectroscopy predicts lignin solvothermal reaction products. This method is free from multiphase media, catalysts, or template. The spherical carbon particles from lignin may find use as carbon black, pigments, or plastic product additives.
Introduction Lignin, a renewable feedstock with an annual throughput of 50 million tons from the paper and pulp industry alone,1 is one of the most underutilized resources.2 With the majority of lignin simply burnt as a low-cost fuel at equivalent value of 4 cents a pound3 and only two percent of it being commercially utilized to produce higher value products,4 the biorefinery industry is very interested in finding additional value of lignin.5 One area of interest is to produce spherical carbon particles from lignin. Carbon is a versatile product, and when made into spheres, can potentially increase its processability and packing density.6 Furthermore, it can also serve as a good scaffold, template, or capsule for metal species and catalysts.7-9 Lignin-derived carbon spheres can also be used as drop-in replacements for carbon black for rubber reinforcement, pigments, or plastic product additives.10 Pyrolysis of lignin indeed leaves porous carbon residue that can be milled into powder.11 However, such particles lack the uniform shape and surface

96
smoothness required for efficient packing required to reach acceptable bulk densities for further use. Synthesis of particulate carbon spheres from colloidal suspension of lignin usually involves additional steps such as the addition of surfactant or monomers and subsequent interfacial polymerization,12 precipitation,13 freeze-drying, and very slow solvent removal prior to the carbonization process.14 Moreover, the retention of spherical carbon particle shape during pyrolysis remains a grand challenge. One explored strategy involved the utilization of nitrogen containing carbon precursors such as polyaniline or poly(N-ethylaniline)12 or azo-functionalized lignin (diazotization reaction with lignin)14 that thermally crosslinks. Their spherical shape and additional functionality can be retained in the resulting carbon derivative as a higher capacity electrode. A slightly different strategy involves synthesis of composite particles from depolymerized lignin and high molecular weight hydroxyethylcellulose with the assistance of reverse micelles in water, chloroform, and sodium dodecylbenzenesulfonate surfactant to form an emulsion. After precipitation in acetone, filtration, and high temperature carbonization, spherical structures were retained, and porous carbon spheres can be made.13 Direct hydrothermal synthesis from lignin yields heterogenous char due to a lack of lignin solubility in neutral water.15-17 Under subcritical hydrothermal (<300 C) conditions, a major fraction of lignin remains insoluble in aqueous phase and undergoes solid-state char formation while a solubilized fraction hydrolyzes yielding phenols. These phenols subsequently polymerize and produce polyphenol-derived hydrochar in the form of microspheres. Additionally, hydrochar deposited on the insoluble lignin further reduces lignin hydrolysis and solubility. Therefore, heterogeneous char formation is inevitable. Contrastingly, hydrothermal synthesis from lignin in aqueous alkali delivers a carbonaceous hydrochar material that yields highly porous activated carbon after high temperature treatment.18 So we wondered how does one synthesize less porous, micronized carbon spheres of uniform size via minimal use of additional reagents and unit operations? To address the question above, we devised a one-pot solvothermal synthesis of less porous lignin-derived carbon by strategically using the char forming characteristics of lignin via thermally induced molecular rearrangement (depolymerization and polymerization) inside a good organic solvent (i.e., in absence of water). The solvent we selected here was dimethylsulfoxide (DMSO), an excellent solvent for lignin. DMSO is less polar than water and thus, nonpolar aromatic char did not precipitate from the solvent immediately. This would likely help to avoid heterogeneous char (combination of flakes, chunks, and microspheres) formation that is common in direct hydrothermal synthesis of lignin. The formation of the carbon sphere is also verified using coarse-grained molecular dynamics simulations. This procedure guarantees that lignin use is maximized, while minimizing the need for other synthetic chemicals. To the best of our knowledge, this is the first report on producing uniform-sized spherical carbon from lignin without use of a copolymer, surfactant, or catalyst but with a single organic solvent.
97
Experimental
In a typical experiment, 9 g of lignin (Glucan Biorenewables, LLC) was dissolved in 180 mL DMSO (Fischer Scientific). The solution was then poured into a 300 mL glass lined Parr reactor equipped with a safety rupture disc and needle valve.
The reactions were then carried out for 5, 10, 15, and 20 hours at 200 C with a Parr heater. After the reaction, the reactor was cooled and fully depressurized by opening the needle valve. The solution was vacuum filtered, collected, and analyzed. Any solid collected from vacuum filtration was then carbonized at 800
C, 1200 C, or 1600 C for an hour in a quartz tube furnace under a nitrogen atmosphere. If no solid was collected from a particular reaction, the reacted solution was then vacuum dried prior to carbonization. All carbonized products were then collected and analyzed. Hitachi S4800 scanning electron microscope (SEM) was used for imaging lignin carbon spheres. Image J analysis was used to measure carbon particle diameters from the SEM images. Transmission electron microscope (TEM) images were taken using a Fei Titan Transmission Electron Microscope operating at 300 kV. Samples were dispersed onto a carbon film coated copper grid before analysis. KEYENCE VHX 2000 digital microscope was used to image solvothermally-treated lignin precipitates. Solvothermally-treated solutions were studied by carbon and proton nuclear magnetic resonance (NMR) using reported methods19 with DMSO-d6 at 23 °C on a Varian VNMRS 500 MHz spectrometer operating at 499.717 MHZ for proton. Solvothermally-treated lignin particle sizes were determined using size exclusion chromatography (SEC) in DMF with 0.05M LiBr with a flow rate of 0.5 mL min-1 at 60 °C. Polyethylene oxide/polyethylene glycol standards were used with Styragel HR 3 and HR 4 columns maintained in a column heater compartment. The SEC system consists of a Waters 1515 Isocratic HPLC pump equipped with 2414 Refractive Index (RI) detector. PerkinElmer Frontier instrument was used to conduct Fourier transform infrared spectroscopy equipped with an attenuated total reflection setup (ATR). The liquid sample was dropped on the ATR crystal window for measurement. All spectra were collected at a scan speed of 1 cm s-1 and resolution of 1 cm-1 with 32 scans. Baseline was subtracted and corrected prior to measurement. A thermogravimetric analyzer (TGA Q500, TA instruments) was used to study thermal stability. For each measurement, ca. 10 mg was used with a platinum pan under a nitrogen atmosphere with a flow of 60 mL/min. The temperature was first ramped to 195 °C at 10 °C/min, held for 60 mins, cooled, before ramping to 800 °C at 10 °C/min. Melting behavior of the investigated lignin solutions was studied using a differential scanning calorimetry (DSC Q2000, TA instruments). For each measurement, ca. 10 mg was used with a hermetic pan. Three cycles of heating and cooling between -83 °C and 50 °C at a ramp rate of 10 °C/min were performed. Only the second cycle was used for analysis. The rheology data
98
were collected using a discovery hybrid rheometer (DHR3, TA instruments). All measurements were performed at 25 °C with a 40 mm cone (2ᵒ) and Peltier plates. For X-ray diffraction patterns of carbon particles, a PANalytical Empyrean with a Cu tube (λ = 1.5405 Å) was used operating at a current of 40 mA, voltage of 45 kV, and a step size of 0.01° exposure. LAMMPS molecular dynamics simulations were performed on a system of 5000 random lignin coils of 12 monomers each. Coarse-grained lignin beads are shown in Figure S3.1a. The beads were connected by FENE bonds and the inter-molecular interactions were initiated by Lennard-Jones (LJ) potential. The red-side chains are monomers with crosslinking sites that can form networked heterogeneous lignin. The simulations were performed with the NVE ensemble (microcanonical ensemble) with Langevin thermostat for temperature control. The damping constant for Langevin thermostat was kept high (damping = 10.0) so that the solvent interactions were stronger, representing a good implicit solvent. The choice of a good solvent in this implicit solvent simulation resulted from the experimental condition that used DMSO as a solvent, which is a good solvent. The NVE time-integration was done with a Lennard-Jones (LJ) time-step
of 0.01 t, where t is the reduced time defined as, = t(m/2)1/2. Here, is the
energy well-depth of the LJ potential, m is the mass of each bead, and is the monomer diameter. The mass of the beads was normalized to the mass of
methylene monomer, and the temperature was normalized to KB/, i.e., T* =
KBT/. The simulations were run for 4 million LJ time steps to equilibrate after 99% crosslinking was achieved in 500,000 LJ time-steps. As can be seen from Figure S3.1b, the total 7413 bonds were formed out of 7500 bonds as quickly as 100,000-time steps. To show that equilibrium was achieved, we calculated the mean-square-displacement (MSD) of the backbone monomers. Figure S3.1c shows the MSD of the backbone monomers for 1 million LJ time-steps after 4 million equilibration time. The long-time MSD shows a slope of ~ 1.0, representing the diffusive regime. This establishes that the system was in equilibrium. One more million time-steps were run to collect statistics for the calculation of thermodynamic properties.
Results and Discussion
Recently, we reported an interesting structural evolution of biorefinery liquid effluence-derived carbon from an amorphous irregular shaped mass into perfect carbon spheres with the progress of hydrothermal carbonization.20 Similarly, we performed solvothermal treatment of dissolved lignin in DMSO in a Parr reactor for 5, 10, 15, and 20 hours at 200C. Solid char yield was only observed after vacuum filtration of the 15 and 20 hours solvothermally-treated solution (T15-P and T20-P for the solid char and T15-S and T20-S for the solution respectively). Photographs

99
and optical microscope images of the solid char can be seen in Figure S3.2. Images obtained in the scanning electron microscope (SEM) after high temperature carbonization of T15-P, T20-P, as well as vacuum oven dried T5-S and T10-S (T5-P and T10-P respectively), demonstrate the evolution of the lignin into carbon spheres (Figure 3.1a-d). Irregular structures can first be observed in the carbonized T5-P and T10-P (T5-C and T10-C respectively). At 15 hours, fused beads can be observed with T15-C, showing an interesting onset of sphere emergence (Figure 3.1c insert). At 20 hours, uniformly less fused carbon beads can be observed with T20-C, reaching their final structure. When carbonized, T20-P has the potential for practical applications including serving as polymer fillers or electrode carbon. When T20-P was carbonized at 800C, 1200C, or 1600C, a clear trend of increasing structural orders can be observed with increasing carbonization temperature (Figure 3.1e). X-ray diffraction (XRD) revealed three distinct peaks at ~24, ~44 and ~80, signifying typical graphitic peaks of (002), (100), and (110) respectively.21 As carbonization temperature increases, XRD peaks develop and sharpen, indicating formation of higher degree of ordered graphitic structure. A similar trend can also be observed from the bright-field transmission electron micrographs with mesographitic domains being developed (Figure 3.1 f-h). The crystallite structure of T-20P carbonized at 1600C could translate into improved electric conductivity or mechanical strength.22 Although studying lignin solvothermal synthesis in a good solvent is novel, prior work has been done to study lignin carbonization under solvothermal conditions in other aqueous solvents or mixtures.23 All work previously reported showed very little control over the char’s morphology during solvothermal treatment and char produced were irregularly shaped much like T5-C and T10-C.23-26 A work around was recently reported that involves first synthesizing spherical lignin particles by first dissolving lignin in a good solvent then slowly adding in an antisolvent27-28 with stirring and heating. After drying, spherical lignin particles can be transferred to a hydrothermal reactor for char synthesis.29 This method does not require any copolymer, catalyst, or surfactant but can only produce highly polydisperse non-uniform lignin char spheres. Very brittle lignin spheres obtained after solvent precipitation do not hold their shape during processing and hydrothermal carbonization. The report, however, suggests hydrothermal conditioning at temperature above 230C can yield spherical carbon and prolonged treatment yields larger spheres. In this study, all lignin readily dissolves in a single good solvent, DMSO, and with sufficient polymerization time, condensed structure formed here would nucleate and precipitate out of solution in a similar fashion as carbohydrate-derived carbon spheres20 described by the LaMer model,30a) thus, giving lignin char a very well-defined and uniform spherical shape. For T5-S and T10-S,

100
Figure 3.1. Scanning electron micrographs of carbon derived from solvothermally-treated lignin for a) 5 hours, b) 10 hours, c) 15 hours, and d) 20
hours at 200C. Inset image in (c) shows the emergence of spherical char (scale bar in c) inset image is 5μm). (e) X-ray diffractograms of 20 hours
solvothermally-treated lignin carbonized at 800C, 1200C, and 1600C show increase in (002) peak intensity with increase in temperature. Transmission electron micrographs of the surfaces of 20 hours solvothermally-treated lignin
carbonized at f) 800C, g) 1200C, and h) 1600C.

101
much like carbohydrate hydrothermal carbonization kinetics,20 spherical equilibrium shape was not reached, yielding irregularly shaped carbon. The evolution of carbon beads from lignin in good solvents is further corroborated by coarse-grained (CG) molecular dynamics (MD) simulations. The simulated structures at different simulation time-steps are shown in Figure 3.2. The simulations are performed on 5000 uncrosslinked lignin molecules of 12 monomeric units in a cube of 80x80x80 3 as shown in Figure 3.2a, where is the monomer diameter. We used Kremer-Grest bead-spring model30b) to design the polymer chains (Figure S3.1(a)), in which the polymer chains are connected by Finite Extensible Non-linear Elastic (FENE) bonds. The nonbonded interactions are modelled by Lennard-Jones interactions. The cross-linking of 12-mer lignin molecules is performed by creating bonds between crosslinking agents when they approach a bond distance of 1.3s. Crosslinking agents are modelled as side-chains of the CG 12-mer molecules (Figure S3.1(a)). Once a bond between two side-chain agents is formed, crosslinking is considered successful. 97% crosslinking is achieved within half million Lennard-Jones (LJ) time-steps (Figure S1(b). The crosslinked lignin structures start forming beads within 1 million time-steps as shown in Figure 3.2b. Figure 3.2c-e show structures at 3 and 4 million LJ time-steps. As can be seen the structures are mostly spherical in shape and about the same size. The equilibrium is achieved within 4 million time-steps. We confirm the equilibration by observing the mean-square-displacement (MSD) of the monomers (Figure S3.1(d). MSD shows long-time diffusive regime (slope ~ 1.0), representation of a fully equilibrated system. The statistical properties are calculated from 1 million more LJ time-step after equilibration. The radial distribution function in Figure 3.2f shows equally spaced peaks, representing layered monomers inside the spherical shaped structures. The quickly formed spherical structures in good solvents corroborates the experimental finding that these structures can be formed easily in a good solvent. The structures are formed due to strong van der Waals interactions between monomers. A noticeable viscosity change in thermally treated solutions was observed. When we quantified the observation under a rheometer (Figure 3.3a-b), viscosity and shear stress both increased with 5 hours of solvothermal treatment in T5-S. Within the first 5 hours, lignin can be thermally reacted, rearranged, and polymerized into a more stable networked structure, leading to a higher viscosity and stress. Afterwards, viscosity and shear stress of T10-S, T15-S, and T20-S decreased continuously with the increasing solvothermal reaction time. The reduction in viscosity can be explained by the formation of granular structure from the solvated networked lignin macromolecule and likely some degree of precipitation of the less polar condensed char. Since significant precipitation was not observed after filtration of T10 samples, very likely the partially crosslinked gel of polyphenol precursor fell through the filter paper. The polymerization of lignin that enhances networked structures in solution was apparent from slight shear thinning behaviour (at 10 – 30 s-1 shear rate region) of the solution after 5 hours solvothermal conditioning.

102
Figure 3.2. Coarse-grained molecular dynamics simulations showing evolution of spherical carbon beads from lignin. a) Initial simulation setup of 12-mer lignin molecules in a cubic box. Evolution of crosslinked lignin structures evolution for b) 1 million, c) 3 million, and d) 4 million LJ time-steps. e) Color representation of d) clearly visualizes the spherical structures. f) Radial distribution function of layered monomers inside the spherical shaped structures.

103
Figure 3.3. Physical characterization of all solvothermally-treated solutions: a) viscosity vs. shear rate, b) shear stress vs. shear rate, c) thermograms from differential scanning calorimetry, d) size exclusion chromatography and the peak molecular weights, and e) onset of thermal degradation from thermogravimetric analysis.
a)
d)
e)
b)
c)
3895
34288401
24486901
17261401
Exo E
ndo

104
To further understand the solute-solvent interactions, we turned to the thermal characteristics of T0-S to T20-S using differential scanning calorimetry (DSC). Any changes in solvent-solute interaction strength should be captured by the tendency for the solution to crystallize and thus change its melting point. We also surmise that the liquified lignin fraction, obtained after prolonged solvothermal treatment, contaminated the solvent and dramatically lowered the freezing point of DMSO. DMSO shows the highest and sharpest melting point at ca. 17 C. After lignin addition, T0-S had a lowered melting point at ca. 13 C. The strengthened solute-solvent interaction with T5-S further reduced the melting point to ca. 5 C (Figure 3.3c), agreeing with the rheology result. Interestingly, the melting point continued to drop and broaden with increasing solvothermal reaction time. The broadening is likely due to the diverse lignin reaction soluble products, yielding different interactions with solvent. With the long solvothermal treatment, these products have an overall increase in solute solvent interaction. Surprisingly for T15-S and T20-S, no freezing point can be observed. This led us to believe that only dissolvable lignin fragments were left after vacuum filtration, which were able to interact strongly and intercalate within the solvent and completely prevented the solution from crystalizing. We also recognize that possible DMSO decomposition could lead to a reduction in the melting behaviour of the solvent. To deconvolute the two, we conducted further DSC and FTIR experiments (Figure S3.3). The drop and eventual disappearance of melting for T10-S, T15-S, and T20-S however, did not explain the drop in their viscosity and shear stress. Perhaps, lignin pyrolyzed oligomers remained soluble in DMSO, plasticized the solvent, and prevented freezing of the miscible solution. To further investigate the presence of dissolvable lignin fragments as well as the onset of highly crosslinked char precipitation, size exclusion chromatography (SEC) was carried out for all solvothermally-treated solutions (Figure 3.3d). Based on the chromatograms and particle sizes, we confirmed that after 5 hours of solvothermal reaction, significant polymerization took place and a fraction of T5-S molecular weight (MW) increased. Bimodal distributed peaks were observed, originating from lignin fragments and the polymerized products. T10-S has a very similar chromatogram as T5-S but small shifts in peaks indicate a small decrease in MW. Beyond 10 hours, MW of T15-S and T20-S decreased continuously with only single distinct peaks consistent with the precipitation of char. Unfortunately, because of the low MW nature of the lignin and the solvothermally-reacted products, all chromatograms overlapped with the region after ca. 53 mins consisting of solvents and dissolved liquified organics and gasses. It is not reliable to integrate the chromatograms to obtain any weight or number average MW and polydispersity index. The peak MW (Mp) however, can still be identified. In this system, fragmentation and polymerization of lignin take place simultaneously. To further understand the degree of fragmentation versus polymerization, all dried and precipitated solids, T0-P – T20-P, were studied with thermogravimetric analysis (TGA) as shown in Figure 3.3e and S4. Lignin fragmentation should result in a drop in thermal stability. On the contrary, polymerization of lignin fragments should result in a rise in thermal stability.31 The TGA data show a continuous decrease of thermal

105
stability from T0-P, T5-P, to T10-P, indicating the dominance of lignin fragmentation into smaller molecules. For T15-P and T20-P, which only consist of the precipitated polymerized solid char, thermal stability increased continuously reflecting the higher degree of crosslinking and stabilization.31 Lignin fragmentation and continuous crosslinking into char observed thus far agreed perfectly with reported literature on hydrothermal treatment.23, 32 Specifically, it was reported that aromatic aldehydes, organic acids, phenolics, methane, and other gases can first be formed from degradation and fragmentation of mainly alkyl and methoxy units on lignin via reactive ether, C-C, and possibly C-OMe linkages.26 The production of gases was noted with a rise in reactor pressure after solvothermal reaction. Next, these smaller phenolics, hydrocarbons, and residual lignin can condense and polymerize into higher molecular weight oligomers and char.23-26 Unlike the reactive functional groups, the lignin aromatic structures are highly stable during solvothermal conditions and are generally retained.23, 33-35 To elucidate lignin char evolution chemically, Fourier-transform infrared spectroscopy (FTIR) and nuclear magnetic resonance (NMR) were used to analyse all solvothermally-treated solutions (Figure 3.4-3.5 and S3.5-3.13). Although lignin and its derived products were not known to give clear FTIR or NMR spectra due to their structural complexity and multifunctionality, a few trends were observed that were in confirmation with the previous studies.23, 25-26, 36 From FTIR, it is evident that ca. 850-970 cm-1 peaks are shifting and weakening, signifying a possible dealkylation and rearrangement of alkenes (C-H) especially in the T15-S and T20-S samples. All changes observed from the FTIR described here are very prominent with T15-S and T20-S due to the precipitation of char at ca. 10 hours. Next, the condensation of (C-O) ethers and esters can be observed from the increase at ca. 1200 cm-1. The breaking of methoxy groups on the guaiacylpropane units and the syringyl propane units of lignin can be seen
Figure 3.4. Fourier-transform infrared spectroscopy of solvothermally-treated solution.

106
T10-S
T5-S
T0-S
-2-101234567891011121314(ppm)
-101030507090110130150170190210230(ppm)
-101030507090110130150170190210230(ppm)
T20-S
T15-S
Me
tho
xy
Aliphatics
1o
Alc
oh
ol
2o
Alc
oh
ol/
Eth
ers
AromaticsCarbonyls
T20-S
T15-S
AliphaticsMethoxy/Alcohol
-2-1012345678910111213f1 (ppm)
Aliphatics
T20-S
T15-S
T10-S
T5-S
T0-S
T20-S
T15-S
T10-S
T5-S
T0-S
Methoxy/
Alcohol
Figure 3.5. Carbon (left panel) and Proton NMR (right panel) spectra of solvothermally-treated lignin solutions with 0, 5, 10, 15, and 20 hours of treatment.

107
from shifts at ca. 1300 cm-1. Peaks from ca. 1450 cm-1 and ca. 1550-1750 cm-1 signal the rearrangement in (C-C) and (C-H) and aromatic rings, respectively. Changing of CH2 and CH3 due to the dealkylation from lignin and repolymerization can be seen from peaks between ca. 2800-3000 cm-
1. The large peaks at ca. 3450 cm-1 indicate a change in (-OH) hydroxyl groups, possibly due to the breaking of primary alcohols and acids from lignin. To study functional groups and char evolution more robustly, we turned to NMR (Figure 3.5 and S3.5-S3.13). Spectra from T0-S to T10-S were first analysed. Some common lignin substructures can be seen in Figure 3.6. Similar to what was observed in the FTIR, it was immediately apparent that T20-S and T15-S spectra were quite different from T10-S, T5-S, and T0-S spectra. When studied in detail, it was observed that the β-O-4 linkages are highly thermally sensitive ether bonds, especially when they are adjacent to ring structures, due to resonance effects.37 As observed in the carbon NMR, between ca. 77-90 ppm, peaks all faded into the baseline with T5-S and T10-S, which is expected from the ethers breaking (Figure S3.7). Similarly, the broad group of peaks centered at ca. 71.5 ppm in the T0-S sample are greatly decreased in the T5-S sample, which in turn shows the appearance of a broad group of peaks centered at ca. 76 ppm and a sharper peak ca. 67.5 ppm, possibly indicating changes in the bonding environments of the various C--O linkages. The cluster at 76 ppm in the T5-S sample decreases and widens into many other smaller peaks in the T10-S sample, showing the rearrangement of the dynamic aliphatic ether bonds and possibly even secondary hydroxyl groups. Additionally, lignin alkyl bonds like Cβ-β’ and Cβ-5’ are relatively weak. When hydrolyzed and rearranged as seen in the weakening and shifting at ca. 54 ppm, they create aromatic aldehydes.23 It has been observed that at higher temperatures, methoxy
Figure 3.6. Lignin substructures of a) β-O-4’, b) β-β’ (resinol structure), and c) β-5’ (phenylcoumaran structure)
A B C
G S S’ H
α
α α
α
α α αα
β
β ββ
γ
4’ γ
γ
γ
4’
5’
A B C
G S S’ H
α
α α
α
α α αα
β
β ββ
γ
4’ γ
γ
γ
4’
5’
A B C
G S S’ H
α
α α
α
α α αα
β
β ββ
γ
4’ γ
γ
γ
4’
5’
a) b) c)HO
HO
O
O
O
O
O
OCH3
OCH3
OCH3
O
O
O
HO
OCH3
OCH3
OCH3
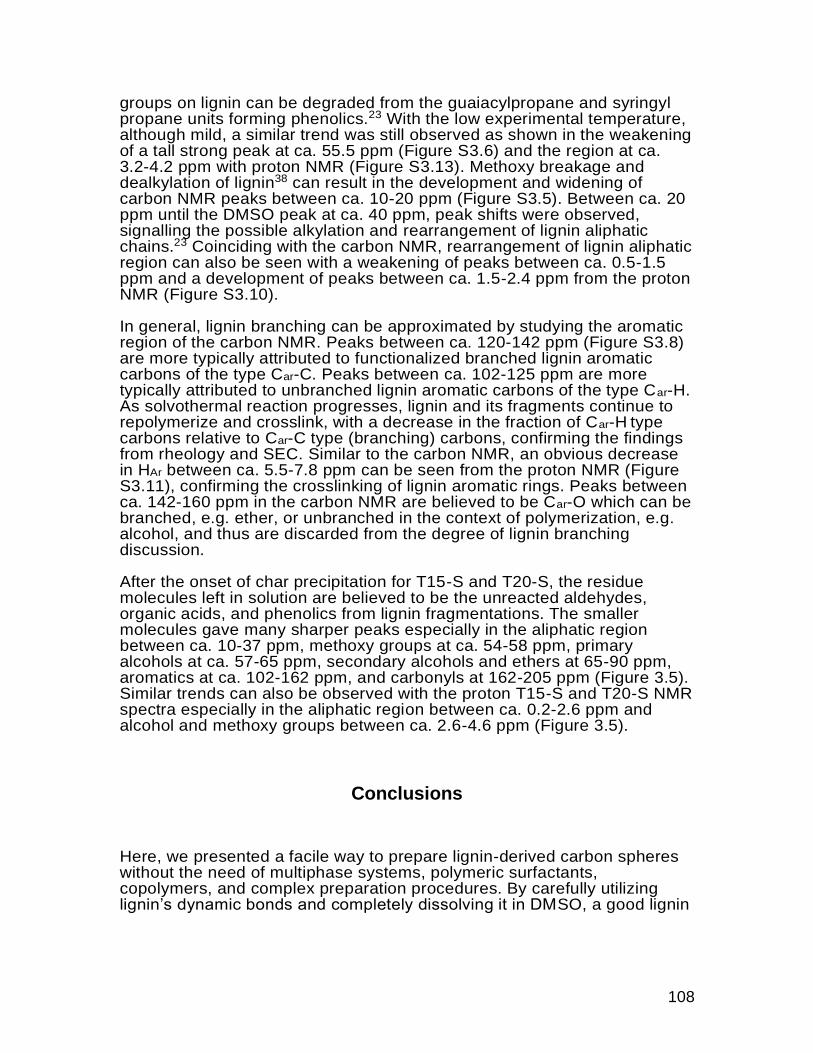
108
groups on lignin can be degraded from the guaiacylpropane and syringyl propane units forming phenolics.23 With the low experimental temperature, although mild, a similar trend was still observed as shown in the weakening of a tall strong peak at ca. 55.5 ppm (Figure S3.6) and the region at ca. 3.2-4.2 ppm with proton NMR (Figure S3.13). Methoxy breakage and dealkylation of lignin38 can result in the development and widening of carbon NMR peaks between ca. 10-20 ppm (Figure S3.5). Between ca. 20 ppm until the DMSO peak at ca. 40 ppm, peak shifts were observed, signalling the possible alkylation and rearrangement of lignin aliphatic chains.23 Coinciding with the carbon NMR, rearrangement of lignin aliphatic region can also be seen with a weakening of peaks between ca. 0.5-1.5 ppm and a development of peaks between ca. 1.5-2.4 ppm from the proton NMR (Figure S3.10). In general, lignin branching can be approximated by studying the aromatic region of the carbon NMR. Peaks between ca. 120-142 ppm (Figure S3.8) are more typically attributed to functionalized branched lignin aromatic carbons of the type Car-C. Peaks between ca. 102-125 ppm are more typically attributed to unbranched lignin aromatic carbons of the type Car-H. As solvothermal reaction progresses, lignin and its fragments continue to repolymerize and crosslink, with a decrease in the fraction of Car-H type carbons relative to Car-C type (branching) carbons, confirming the findings from rheology and SEC. Similar to the carbon NMR, an obvious decrease in HAr between ca. 5.5-7.8 ppm can be seen from the proton NMR (Figure S3.11), confirming the crosslinking of lignin aromatic rings. Peaks between ca. 142-160 ppm in the carbon NMR are believed to be Car-O which can be branched, e.g. ether, or unbranched in the context of polymerization, e.g. alcohol, and thus are discarded from the degree of lignin branching discussion. After the onset of char precipitation for T15-S and T20-S, the residue molecules left in solution are believed to be the unreacted aldehydes, organic acids, and phenolics from lignin fragmentations. The smaller molecules gave many sharper peaks especially in the aliphatic region between ca. 10-37 ppm, methoxy groups at ca. 54-58 ppm, primary alcohols at ca. 57-65 ppm, secondary alcohols and ethers at 65-90 ppm, aromatics at ca. 102-162 ppm, and carbonyls at 162-205 ppm (Figure 3.5). Similar trends can also be observed with the proton T15-S and T20-S NMR spectra especially in the aliphatic region between ca. 0.2-2.6 ppm and alcohol and methoxy groups between ca. 2.6-4.6 ppm (Figure 3.5).
Conclusions
Here, we presented a facile way to prepare lignin-derived carbon spheres without the need of multiphase systems, polymeric surfactants, copolymers, and complex preparation procedures. By carefully utilizing lignin’s dynamic bonds and completely dissolving it in DMSO, a good lignin

109
solvent, we have created uniform and spherical carbon from this highly underutilized industrial effluence with a solvothermal process at low temperature. Lignin-derived sphere evolution was observed by SEM. A similar trend of quick spherical structure formation was also confirmed by coarse-grained MD simulations. Under solvothermal condition, lignin continues to degrade into fragments. Simultaneously, residue lignin and its fragments polymerize and condense into highly crosslinked structures eventually precipitating out of solution following the LaMer model into spherical char. Precipitation started at ca. 10 hours of solvothermal reaction, but equilibrium uniform spherical carbon was only observed with 20 hours of solvothermal reaction. This work presented a much-improved strategy of manufacturing lignin-derived carbon spheres potentially impacting many industries.
Acknowledgements
This research at Oak Ridge National Laboratory, managed by UT Battelle, LLC, for the U.S. Department of Energy (DOE) under contract DE-AC05-00OR22725, was sponsored by the Office of Energy Efficiency and Renewable Energy, BioEnergy Technologies Office Program. The NMR, XRD, and TEM portion of this research was conducted at the Center for Nanophase Materials Sciences, which is a DOE office of Science User Facility. The lignin sample was supplied by Glucan Biorenewables, LLC.

110
References
1. Saito, T.; Brown, R. H.; Hunt, M. A.; Pickel, D. L.; Pickel, J. M.; Messman, J. M.; Baker, F. S.; Keller, M.; Naskar, A. K., Turning renewable resources into value-added polymer: development of lignin-based thermoplastic. Green Chemistry 2012, 14 (12), 3295-3303. 2. Chung, Y.-L.; Olsson, J. V.; Li, R. J.; Frank, C. W.; Waymouth, R. M.; Billington, S. L.; Sattely, E. S., A renewable lignin–lactide copolymer and application in biobased composites. ACS Sustainable Chemistry & Engineering 2013, 1 (10), 1231-1238. 3. Muller, P. C.; Glassert, W. G., Engineering plastics from lignin. VIII. Phenolic resin prepolymer synthesis and analysis. The Journal of Adhesion 1984, 17 (2), 157-173. 4. Laurichesse, S.; Averous, L., Chemical modification of lignins: Towards biobased polymers. Progress in Polymer Science 2014, 39 (7), 1266-1290. 5. Ragauskas, A. J.; Beckham, G. T.; Biddy, M. J.; Chandra, R.; Chen, F.; Davis, M. F.; Davison, B. H.; Dixon, R. A.; Gilna, P.; Keller, M.; Langan, P.; Naskar, A. K.; Saddler, J. N.; Tschaplinski, T. J.; Tuskan, G. A.; Wyman, C. E., Lignin valorization: improving lignin processing in the biorefinery. Science 2014, 344 (6185), 1246843. 6. Sun, X.; Li, Y., Colloidal carbon spheres and their core/shell structures with noble‐metal nanoparticles. Angewandte Chemie International Edition 2004, 43 (5), 597-601. 7. Callister, W. D.; Rethwisch, D. G., Materials science and engineering. John wiley & sons NY: 2011; Vol. 5. 8. Sun, X.; Liu, J.; Li, Y., Use of carbonaceous polysaccharide microspheres as templates for fabricating metal oxide hollow spheres. Chemistry–A European Journal 2006, 12 (7), 2039-2047. 9. Sun, X.; Li, Y., Colloidal carbon spheres and their core/shell structures with noble‐metal nanoparticles. Angewandte Chemie 2004, 116 (5), 607-611. 10. Puziy, A. M.; Poddubnaya, O. I.; Sevastyanova, O., Carbon Materials from Technical Lignins: Recent Advances. Top Curr Chem (Cham) 2018, 376 (4), 33. 11. Snowdon, M. R.; Mohanty, A. K.; Misra, M., A study of carbonized lignin as an alternative to carbon black. ACS Sustainable Chemistry & Engineering 2014, 2 (5), 1257-1263. 12. He, Z.-W.; Yang, J.; Lu, Q.-F.; Lin, Q., Effect of structure on the electrochemical performance of nitrogen-and oxygen-containing carbon micro/nanospheres prepared from lignin-based composites. ACS Sustainable Chemistry & Engineering 2013, 1 (3), 334-340. 13. Shimada, T.; Hata, T.; Kijima, M., Thermal Conversion of Lignin–Cellulose Composite Particles into Aggregates of Fine Carbon Grains Holding Micro- and Mesoporous Spaces. ACS Sustainable Chemistry & Engineering 2015, 3 (8), 1690-1695.

111
14. Zhao, H.; Wang, Q.; Deng, Y.; Shi, Q.; Qian, Y.; Wang, B.; Lü, L.; Qiu, X., Preparation of renewable lignin-derived nitrogen-doped carbon nanospheres as anodes for lithium-ion batteries. RSC Advances 2016, 6 (81), 77143-77150. 15. Kang, S.; Li, X.; Fan, J.; Chang, J., Characterization of hydrochars produced by hydrothermal carbonization of lignin, cellulose, D-xylose, and wood meal. Industrial & engineering chemistry research 2012, 51 (26), 9023-9031. 16. Ding, J.; Wang, H.; Li, Z.; Cui, K.; Karpuzov, D.; Tan, X.; Kohandehghan, A.; Mitlin, D., Peanut shell hybrid sodium ion capacitor with extreme energy–power rivals lithium ion capacitors. Energy & Environmental Science 2015, 8 (3), 941-955. 17. Wang, H.; Li, Z.; Tak, J. K.; Holt, C. M. B.; Tan, X.; Xu, Z.; Amirkhiz, B. S.; Harfield, D.; Anyia, A.; Stephenson, T.; Mitlin, D., Supercapacitors based on carbons with tuned porosity derived from paper pulp mill sludge biowaste. Carbon 2013, 57, 317-328. 18. Kijima, M.; Hirukawa, T.; Hanawa, F.; Hata, T., Thermal conversion of alkaline lignin and its structured derivatives to porous carbonized materials. Bioresource technology 2011, 102 (10), 6279-6285. 19. Capanema, E. A.; Balakshin, M. Y.; Kadla, J. F., A comprehensive approach for quantitative lignin characterization by NMR spectroscopy. J Agric Food Chem 2004, 52 (7), 1850-60. 20. Ho, H. C.; Goswami, M.; Chen, J.; Keum, J. K.; Naskar, A. K., Amending the Structure of Renewable Carbon from Biorefinery Waste-Streams for Energy Storage Applications. Sci Rep 2018, 8 (1), 8355. 21. Li, Z.; Lu, C.; Xia, Z.; Zhou, Y.; Luo, Z., X-ray diffraction patterns of graphite and turbostratic carbon. Carbon 2007, 45 (8), 1686-1695. 22. Pierson, H. O., Handbook of carbon, graphite, diamonds and fullerenes: processing, properties and applications. William Andrew: 2012. 23. Kang, S.; Li, X.; Fan, J.; Chang, J., Hydrothermal conversion of lignin: A review. Renewable and Sustainable Energy Reviews 2013, 27, 546-558. 24. Dinjus, E.; Kruse, A.; Troeger, N., Hydrothermal carbonization–1. Influence of lignin in lignocelluloses. Chemical engineering & technology 2011, 34 (12), 2037-2043. 25. Lei, Y.; Su, H.; Tian, R., Morphology evolution, formation mechanism and adsorption properties of hydrochars prepared by hydrothermal carbonization of corn stalk. RSC Advances 2016, 6 (109), 107829-107835. 26. Yong, T. L.-K.; Matsumura, Y., Reaction kinetics of the lignin conversion in supercritical water. Industrial & Engineering Chemistry Research 2012, 51 (37), 11975-11988. 27. Qian, Y.; Deng, Y.; Qiu, X.; Li, H.; Yang, D., Formation of uniform colloidal spheres from lignin, a renewable resource recovered from pulping spent liquor. Green Chemistry 2014, 16 (4), 2156-2163. 28. Xiong, W.; Yang, D.; Zhong, R.; Li, Y.; Zhou, H.; Qiu, X., Preparation of lignin-based silica composite submicron particles from alkali lignin and sodium silicate in aqueous solution using a direct precipitation method. Industrial Crops and Products 2015, 74, 285-292.

112
29. Mao, H.; Chen, X.; Huang, R.; Chen, M.; Yang, R.; Lan, P.; Zhou, M.; Zhang, F.; Yang, Y.; Zhou, X., Fast preparation of carbon spheres from enzymatic hydrolysis lignin: Effects of hydrothermal carbonization conditions. Sci Rep 2018, 8 (1), 9501. 30. Mer, V. K. L., Nucleation in phase transitions. Industrial & Engineering Chemistry 1952, 44 (6), 1270-1277. 31. Ho, H. C.; Nguyen, N. A.; Meek, K. M.; Alonso, D. M.; Hakim, S. H.; Naskar, A. K., A Solvent-Free Synthesis of Lignin-Derived Renewable Carbon with Tunable Porosity for Supercapacitor Electrodes. ChemSusChem 2018, 11 (17), 2953-2959. 32. Wikberg, H.; Ohra-aho, T.; Pileidis, F.; Titirici, M.-M., Structural and morphological changes in kraft lignin during hydrothermal carbonization. ACS Sustainable Chemistry & Engineering 2015, 3 (11), 2737-2745. 33. Kruse, A.; Funke, A.; Titirici, M. M., Hydrothermal conversion of biomass to fuels and energetic materials. Curr Opin Chem Biol 2013, 17 (3), 515-21. 34. Baccile, N.; Falco, C.; Titirici, M.-M., Characterization of biomass and its derived char using 13 C-solid state nuclear magnetic resonance. Green Chemistry 2014, 16 (12), 4839-4869. 35. Kruse, A.; Dahmen, N., Water–a magic solvent for biomass conversion. The Journal of Supercritical Fluids 2015, 96, 36-45. 36. Hu, J.; Shen, D.; Wu, S.; Zhang, H.; Xiao, R., Effect of temperature on structure evolution in char from hydrothermal degradation of lignin. Journal of Analytical and Applied Pyrolysis 2014, 106, 118-124. 37. Braun, J.; Holtman, K.; Kadla, J., Lignin-based carbon fibers: Oxidative thermostabilization of kraft lignin. Carbon 2005, 43 (2), 385-394. 38. Funke, A.; Ziegler, F., Hydrothermal carbonization of biomass: a summary and discussion of chemical mechanisms for process engineering. Biofuels, Bioproducts and Biorefining 2010, 4 (2), 160-177.

113
Appendix
b)
c)
a)
b)
c)
a)
b)
c)
a)
Figure S3.1. MD simulation analysis. a) Coarse-grained lignin beads represented in the FENE model. The gray beads are the backbone of lignin, and the red beads are crosslinking sites. b) Crosslinked bond formation as a function of time. As can be seen the lignin monomers crosslinks very quickly. c) Mean-square-displacement of the backbone as a function of time. The slope ~ 1.0 at long time shows diffusive regime representing the system is under equilibrium.

114
Under the experimental conditions, we believe a minority, in the range of a single digit percentage, of DMSO solvent could be decomposed into dimethyl sulfide (DMS), dimethyl disulfide (DMDS), and bis(methylthio)methane (BMTM).1 We repeated the experiment without lignin and analyzed DMSO degradation with FTIR and DSC (Figure S3.3). During solvothermal condition, peaks developed at ca. 3100-3200 cm-1, ca. 1600-1700 cm-1, ca. 1400 cm-1, ca. 1000 cm-1, ca. 600 cm-1, and ca. 200 cm-1. These peaks are characteristics of DMS, DMDS, and
BMTM. Because of their lower freezing points, e.g. -98C for DMS, we see a drop in the freezing of solvent up till the ca. 10 hours of solvothermal treatment. DMSO degradation might have approached equilibrium at this point, affecting the freezing point minimally. This experiment verified that the changes in solvent freezing behavior as shown in the manuscript was indeed due to lignin.
100 μm 100 μm
a) b)
c) d)
Figure S3.2. Photographs of solvothermally-treated lignin precipitate for a) 20 hours and b) 15 hours. Optical microscope images of solvothermally-treated lignin precipitate for c) 20 hours and d) 15 hours.

115
Figure S3.3. a) FTIR and b) DSC of DMSO degradation products.
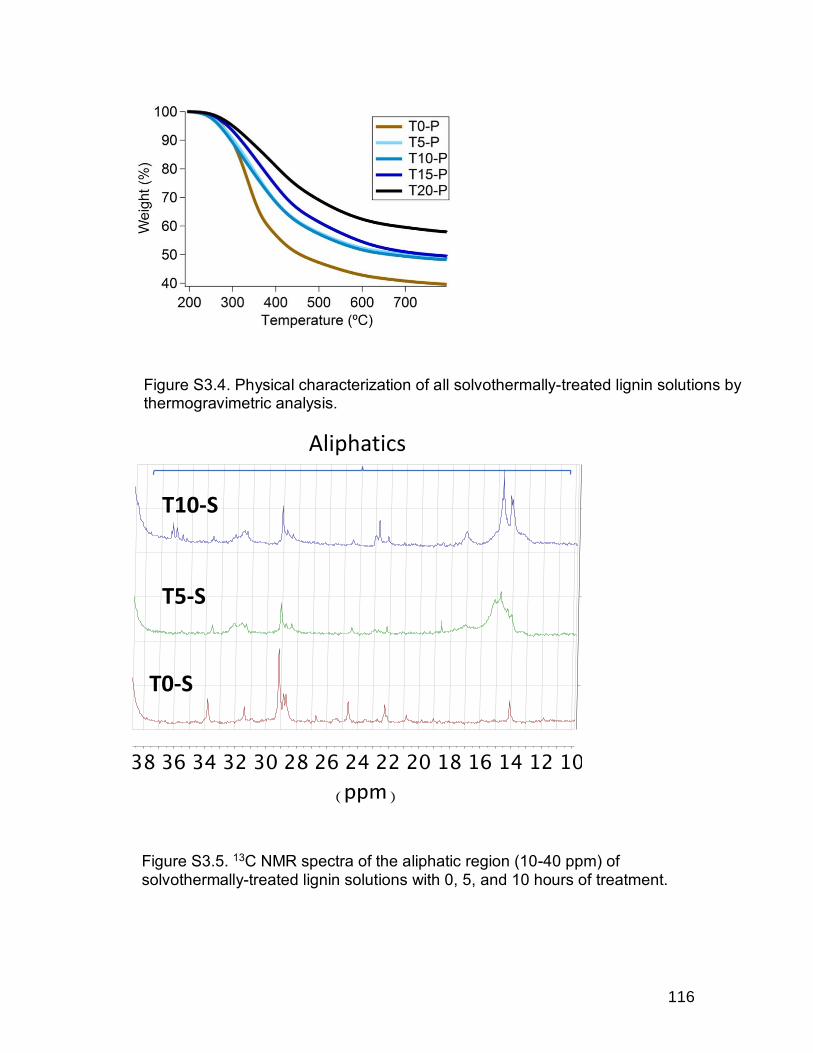
116
Figure S3.4. Physical characterization of all solvothermally-treated lignin solutions by thermogravimetric analysis.
Figure S3.5. 13C NMR spectra of the aliphatic region (10-40 ppm) of solvothermally-treated lignin solutions with 0, 5, and 10 hours of treatment.

117
Figure S3.6. 13C NMR spectra of the region between ca. 52-61 ppm of solvothermally-treated lignin solutions with 0, 5, and 10 hours of treatment.

118
Figure S3.7. 13C NMR spectra of the region between ca. 67-89 ppm of solvothermally-treated lignin solutions with 0, 5, and 10 hours of treatment.

119
Figure S3.8. 13C NMR spectra of the region between ca. 100-160 ppm of solvothermally-treated lignin solutions with 0, 5, and 10 hours of treatment.

120
Figure S3.9. 13C NMR spectra of the region between ca. 160-190 ppm of solvothermally-treated lignin solutions with 0, 5, and 10 hours of treatment.

121
Figure S3.10. Proton NMR spectra for the region between ca. 0.5-2.4 ppm of solvothermally-treated lignin solutions with 0, 5, and 10 hours of treatment.

122
Figure S3.11. Proton NMR spectra for the region between ca. 5.8-9.8 ppm of solvothermally-treated lignin solutions with 0, 5, and 10 hours of treatment.

123
Figure S3.12. Proton NMR spectra for the region between ca. 9.45-10 ppm of solvothermally-treated lignin solutions with 0, 5, and 10 hours of treatment.

124
1. Gaylord Chemical Company, L. L. C. Dimethyl Sulfoxide Physical Properties; Bulletin 101, 2014.
Figure S3.13. Proton NMR spectra for the region between ca. 3-4.2 ppm of solvothermally-treated lignin solutions with 0, 5, and 10 hours of treatment.

125
CHAPTER IV: SYNTHESIZING LIGNIN-DERIVED CARBON NANOSPHERES AND THEIR APPLICATION IN POLYMER
COMPOSITES

126
This chapter is based on a manuscript under preparation. The authors include Hoi Chun Ho, Nihal Kanbargi, Logan Kearney, Ngoc A. Nguyen, Harry M. Meyer III, and Amit K. Naskar. All authors contributed to designing the experiments and preparing the manuscript. H.H. synthesized all materials and performed and analyzed all experimental data. N.N. assisted in the rheology studies. H.M. assisted in collecting the X-ray photoelectron spectroscopy data.
Abstract
Due to greater sustainability concerns, the development of renewable materials such as carbonized lignin has gained great importance. However, finding simple methods to produce free-flowing carbon particles from lignin with controlled morphology remains a challenge. To address this challenge, in this study, we explore nanoprecipitation of lignin via dialysis followed by hydrothermal treatment as a superior stabilization route. First, nanoprecipitation from dialysis produced spherical lignin nanoparticles. After conventional thermal or hydrothermal stabilization and carbonization, lignin-derived carbon nanospheres were produced. Compared to thermally stabilized lignin particles, hydrothermally stabilized particles released less volatiles during carbonization, leading to fewer defects and less porosity in the resulting carbon. Hydrothermally processed nanospherical carbon from lignin also exhibits improved adhesion and reinforcing effect with a styrene-butadiene rubber matrix.
Introduction
As an underutilized industrial byproduct,1 Kraft lignin is an attractive feedstock for renewable material research and development.2 One major area of research has been lignin-derived carbon.3 Carbon is an important commodity with a wide range of applications including water filtration, energy storage, colorant, composite reinforcement, etc. Spherical carbon particles, specifically, can be used as scaffolds, templates, capsules, fillers, and pigments.4-7 One facile way of producing carbonized lignin is the direct pyrolysis of lignin. However, such a method provides little control over carbonized lignin’s morphology.8 The morphology of the particles includes size and shape along with short- and long-range order in the carbon. To produce spherical carbonized lignin particles, more intricate methods which include additional steps and chemicals like surfactants, templates, and scaffolds, are thus often required.9-11
In the area of polymer research, nanoprecipitation is a simple and common method to produce polymer nanospheres.12-14 Using dialysis tubes,

127
nanoprecipitation of polymers can be carried out.14 Briefly, nanoprecipitation involves the precipitation of polymer nanospheres as an anti-solvent slowly diffuses into a dialysis tube containing the polymer dissolved in a good solvent. Zhang et al. showed that the production of polymer nanospheres using dialysis precipitation follows a nucleation-aggregation mechanism.12 As the anti-solvent diffuses into the dialysis membrane, the polymer nucleates. As nucleation continues, the nucleus could encounter one another, forming aggregates, and eventually precipitating.
In lignin-derived carbon production, stabilization is often the first step. Hydrothermal treatment (HT) of lignin is a common stabilization method which involves heating lignin in a superheated water suspension without requiring prior lignin dewatering.15 Lignin, a highly branched aromatic macromolecule, contains thermally unstable aromatic side chains that are cleaved during HT.16 Weak β-O-4 ether bonds could be cleaved to form phenoxy and alkyl aromatic radicals.16 Cα–Cβ can be hydrolyzed, creating aromatic aldehydes.17 After additional oxidation, these aldehydes can be transformed into their corresponding acids.18 Next, methoxy groups can also be degraded from lignin, creating phenolics.17
Whereas many side groups are reactive, the aromatic rings are generally stable under HT. Alkylation can form alkyl phenols. At high temperatures, these aliphatic side chains are reactive and can crosslink with other phenolics.17 Phenolic polymers can form through polymerization, and its yield increases with temperature.16 The polymerized phenolics would prefer depositing onto undissolved lignin to nucleation out of solution.19 As a result, the morphology of hydrothermally stabilized lignin can resemble its precursor’s morphology.20 We hypothesize that the degradation of lignin side chains and crosslinking of phenolics of stabilized lignin can be beneficial for producing lignin-derived carbon particles for polymer composite application. Degradation of lignin side chains during HT lowers the amount of volatiles evolved during carbonization, resulting in decreased porosity22 and increased mechanical stiffness23 in the final carbon particles.
Among the plethora of lignin-derived carbon research, applications in energy storage, gas adsorption, water filtration, and among others have gathered strong momentum.3, 24-25 By comparison, lignin-derived carbon particles for polymer composite application have received little attention. This work aims to investigate the potentials of producing lignin-derived carbon nanospheres for polymer composite application through the combination of nanoprecipitation and HT. The study also compares the results on carbon structures produced via commonly adopted stabilization methods in air and nitrogen. This work is the first attempt in combining nanoprecipitation and HT for the synthesis of lignin-derived carbon particles for polymer composite application.

128
Results and Discussion
Lignin-derived nano-spherical carbon particle precursors were easily synthesized by nanoprecipitation. Lignin was first dissolved into acetone, a good solvent, prior to the slow addition of an anti-solvent, water, across a dialysis bag to precipitate lignin nanospheres (Figure 4.1). Upon dialysis, the lignin spheres were first stabilized in air at 240ºC for 3 hours and then subsequently further stabilized for another 3 hours at 240ºC either in air, or nitrogen, or HT with the headspace purged with air prior to the start of the reaction, or HT with the headspace purged with nitrogen prior to the start of the reaction. The stabilized lignin spheres are referred to as S-Air, S-N, S-HTCAir, and S-HTCN, respectively. After carbonization at 1000ºC, these samples will be referred to as C-Air, C-N, C-HTCAir, and C-HTCN respectively.
Lignin nanospheres produced from dialysis have diameters of 0.72 ± 0.41 μm (Table 4.1). After stabilization with different methods and carbonization, their diameters became 0.71 ± 0.38 μm, 0.72 ± 0.27 μm, 0.83 ± 0.21 μm, 0.71 ± 0.29 μm for C-Air, C-N, C-HTCAir, and C-HTCN, respectively. The lowering of sphere
Figure 4.1. Scanning electron images of a) lignin precipitates from dialysis, b) stabilized lignin in air, c) stabilized lignin in hydrothermal condition with the headspace filled with air prior to the start of the reaction, d) stabilized lignin in nitrogen, and e) stabilized lignin in hydrothermal condition with the headspace purged with nitrogen prior to the start of the reaction.

129
diameters was expected from the stabilization and carbonization steps.26 However, it was not apparent in this study. Although the sizes of the carbonized lignin spheres were largely the same across different stabilization methods, it was interesting to see C-HTCN spheres being fused to a small degree. We speculate the fusion of the spheres was due to 1) the plasticizing effect of water during HT27-28 and 2) the slower stabilization kinetics of lignin in an anaerobic environment.29 Bouajila et al. showed that with ca. 30% molar concentration of water, Kraft lignin’s Tg may be reduced by ca. 50%.28 Secondly, Norberg et al. showed that the stabilization time for softwood lignin could take twice as long in an inert environment than in an oxidative environment.29 Future work involving a well-controlled experiment to ensure the complete absence of dissolved oxygen in the hydrothermal solution would be needed to quantitatively determine the effect of the two factors on the stabilization kinetics of lignin.
Upon carbonization, all carbonized lignin samples were dispersed in styrene-butadiene rubber (SBR) matrix with very low concentration (3 wt.%) to form composites. Typically, the strength of carbon-polymer interaction can be recorded by the increase of the polymer’s Tg.30 Differential scanning calorimetry (DSC) was used to study the composites (Figure 4.2a); however, because of the broad thermal transitions, it is difficult to directly determine differences in the reinforcing effects of the carbon samples with the SBR matrix. The broad Tg can be caused by the polydispersity of SBR and the wide range of polymer-carbon interaction strength. The polymer closest to the carbon surface is tightly bound and is the stiffest.31 As the separation distance between polymer chains and carbon increases, polymers will be less tightly bound and have higher mobility.32 Therefore, analyzing the reinforcing effects of the four carbon samples remains inconclusive based on the DSC data. However, the rheological properties of the SBR composites could provide more insights into interactions of the carbon particles with the rubber matrix.
Table 4.1. The diameters of the lignin precipitates from dialysis and lignin-derived carbon nanosphere particles.
Lignin precipitates from dialysis C-Air C-HTCAir C-N C-HTCN
Diameter (μm) 0.72 ± 0.41 0.71 ± 0.38 0.83 ± 0.21 0.72 ± 0.27 0.71 ± 0.29

130
Figure 4.2. a) Differential scanning calorimetry, b) viscosity vs. shear rate, c) shear stress vs. shear rate, and d) expanded shear stress vs. shear rate of the lignin-derived carbon nanosphere particles and styrene-butadiene rubber composites.
b)a)
c) d)
-65.7 ± 0.7 °C
-65.6 ± 0.4 °C
-65.9 ± 0.7 °C
-65.8 ± 0.5 °C
-66.6 ± 0.6 °C
Exo En
do

131
From Figure 4.2 b-d, all carbon samples increased the viscosity and shear stress of the SBR matrix. The two carbon samples obtained via hydrothermal stabilization gave very similar shear viscosity. Surprisingly, the two samples stabilized under air and nitrogen also gave very similar rheological properties. The hydrothermally stabilized carbon containing SBR samples have a higher viscosity than the samples containing carbon produced via stabilization in air and nitrogen. As expected, the neat SBR exhibits the lowest viscosity and shear stress. This trend suggests that when compared to the stabilization of lignin in air or nitrogen, lignin-derived carbon nanosphere particles formed by HT have stronger stiffening effects with the SBR matrix. Chemical and physical interactions between the two phases determine the strength of their interfacial activities.35 In order to understand the causes of the stronger adhesion of C-HTCAir and C-HTCN with SBR, the interactions between carbon and SBR was further studied. In terms of chemical interaction, the surface chemistry of the carbon will be of great importance in determining its adhesion with SBR.36 As such, the carbon’s surface functionality was studied using X-ray photoelectron spectroscopy (XPS). (Table S4.1) XPS results showed that all carbon samples were similar except for C-air containing that highest amount of oxygen-containing polar functionalities with ca. 6.3% surface oxygen content. C-N, C-HTCAir, and C-HTCN are very similar with ca. 4.7-4.9% of surface oxygen. Because SBR is a non-polar rubber, the polar oxygen functionality on C-air will lead to a poor hydrophobic interaction with the SBR matrix, which agreed with the rheology results. XPS alone, however, did not explain why C-N has a poorer interaction with the SBR matrix when compared to the hydrothermally stabilized samples. For this, we turned to the physical interaction of the composites.
In terms of physical interaction, the surface morphology and porosity of the carbon will be vital in determining its interfacial properties with the matrix material.35 In the carbon-polymer composite industry, it has been established that carbon black with a higher surface area due to its smaller size gives a stronger mechanical interlocking with the matrix material.32 Carbon black with smaller sizes provides a higher external surface area for the polymer matrix to interact, leading to a stronger physical interaction.37 Having a high surface area is also a reason that nanomaterials like carbon nanotubes gaining significant attention in polymer composite research.38 From the rheology results, it was expected that C-HTCAir and C-HTCN would have a rougher surface and higher surface area than C-Air and C-N. However, in the micrometer scale as observed under the SEM, all carbon displayed a relatively smooth surface with no significant observable difference in terms of surface roughness. Furthermore, the fused spheres of C-HTCN even seem to have limited its available surface area for the SBR matrix to adhere. To further quantify the surface area and porosity of the carbon, nitrogen adsorption-desorption experiments were carried out (Figure 4.3).

132
Figure 4.3. a) The compiled surface area and pore volume, b) isotherms, and c) pore size distributions from nitrogen adsorption-desorption experiments of the lignin-derived carbon nanosphere particles.
b)
c)
a) C-Air C-HTCAir C-N C-HTCN
Surface Area (m2/g) 575 ± 15 475 ± 49 521 ± 51 482 ± 61

133
From Figure 4.3a, C-N has a ca. 20% higher surface area than C-HTCAir and C-HTCN samples. This inverse correlation between surface area and carbon-rubber interaction strength could be opposite to conventional belief.37 In fact, the inverse correlation between surface area and the rheology data applies to all carbon samples. Further analysis of the pore size distribution revealed that the porosity in the carbon produced is largely microporous, as can be seen from the typical type I isotherms (Figure 4.3 b-c). For the nitrogen adsorption-desorption experiments, ca. 0.85 nm pore width was the lower limit of the pore size measurement. In addition, ca. 60% of all measurable pores on the carbon samples are smaller than the lower measurable limit. We speculate some of these micropores produced here are internal pores with a possible networked structure originated from volatile evolution during carbonization. The abundant internal pores rather than the external surface area would have limited interaction with the viscous SBR matrix in this study. Microporosity, besides, could also be a source of defects which affects the microstructure of the carbon, reducing its mechanical strength.35 Porosity could, however, be used to understand the mechanism of lignin stabilization under different environments further.
Pore developments on lignin-derived carbon can be expected from the carbonization step.22 During carbonization, lignin is known to give out volatiles, leaving behind pores.3 It has been shown that the oxygen content of a carbon precursor can be a good indication of the carbon’s porosity.39 Oxygen-containing volatiles like CO2 and H2O are also known to be activating agents, edging along the walls of the stabilized lignin samples during carbonization, creating porosity.40 Therefore, the oxygen contents of the stabilized samples were analyzed. As expected, their oxygen contents directly correlated with their derived carbon’s surface area and pore volume (Table 4.2). It was apparent that the effect of HT slightly suppressed the oxygen content on the stabilized lignin. This can be expected from the greater degree of oxygen-containing lignin side chain breakages under HT.17 Furthermore, because of the lack of oxygen, lignin nanospheres stabilized in nitrogen environment had lower oxygen content than their counterparts stabilized in air.29
In parallel, thermal gravimetric analysis (TGA) was carried out for the stabilized samples (Figure 4.4). TGA results further supported the greater amount of volatile evolution with C-Air and C-N when compared with C-HTCAir and C-HTCN. The yields of the carbonized lignin spheres followed the same trends as their surface area and the oxygen contents of the stabilized lignin. Finally, the early weight loss of S-HTCAir and S-HTCN as recorded from the TGA was likely due to the early volatilization of small molecules originated from the broken lignin side chains during HT.16-17

134
Table 4.2. The oxygen contents of the stabilized lignin.
S-Air S-HTCAir S-N S-HTCN
O (%) 34.85 ± 0.64 30.12 ± 2.15 33.56 ± 0.51 30.54 ± 0.84
Figure 4.4. Thermal gravimetric analysis of the stabilized lignin.

135
Conclusions
We have produced spherical lignin-derived nanoparticles from the combined use of dialysis and hydrothermal stabilization. Using nanoprecipitation from dialysis, lignin nanospheres were produced. With the subsequent hydrothermal stabilization step, the need for dewatering of lignin nanospheres from dialysis could potentially be eliminated. Oxygen analysis and thermogravimetric analysis of the stabilized materials revealed that hydrothermal stabilization of lignin released less volatiles and gave higher yields during carbonization. Nitrogen adsorption-desorption experiments supported the observation by measuring a smaller surface area and pore volume on the carbon nanospheres stabilized hydrothermally when compared to the carbon produced via stabilization in air or nitrogen. Pore size distribution showed that ca. 60% of all pores measured from the carbon samples were smaller than ca. 0.85 nm in diameter. The less porous surface leads to less defect and an improved reinforcing effects for the hydrothermally stabilized carbon nanosphere particles when loaded into a styrene-butadiene rubber matrix. As a reinforced SBR composite, the carbon nano-spherical particles produced from hydrothermal stabilization have a higher viscosity and shear stress measured by the rheometer. This report involving the combined use of nanoprecipitation and hydrothermal stabilization as a potential tool for the synthesis of lignin-derived carbon particles exhibits new promise for lignin-derived carbon’s use in polymer composite application.
Methodology
Preparation of Nanosized-Lignin-Derived Carbon Sphere Particles 2% of lignin, a softwood Kraft Lignin from Kruger Wayagamack Inc., was first dissolved in acetone (Fischer Scientific), a good lignin solvent. Lignin acetone solution was then placed in a dialysis bag and stirred in a large amount of RO water overnight. Lignin precipitates in water were then collected and dried with a centrifuge and vacuum. The nanosized-lignin-precipitates were then first stabilized in air at 240 ºC for 3 hours with a ramp rate of 0.1 ºC/min. Subsequently, they were either stabilized in air, or nitrogen, or HT with the headspace filled with air prior to the start of the reaction, or HT with the headspace purged with nitrogen prior to the start of the reaction. All hydrothermal reactions were carried out in a 300 ml glass-lined Parr reactor equipped with a safety rupture disc and needle valve with a fill rate of 60%. After HT, stabilized lignin was dried under vacuum. All stabilized lignin was then placed in a tube
furnace and ramped to 1000°C in an hour and carbonized for an hour in a nitrogen atmosphere.

136
Preparation of Carbon-Polymer Composites A masterbatch of styrene-butadiene rubber (SBR, Sartomer) was blended with 3% of various carbon nanosphere particles with a Silverson high shear mixer for the preparation of composites.
Characterization Scanning electron microscope (SEM) images were collected with a Hitachi S4800 accelerated at 10kV. Image J software was used to measure the carbon nanosphere particle diameters. For each sample, the sphere diameters were averaged with at least 100 spheres chosen at random, and the standard deviations were calculated. Thermogravimetric analysis was done with an SDT650, TA instruments. Ca. 10 mg of sample was used for each run. Temperature was ramped to 1000 ºC in an hour in a nitrogen atmosphere. Oxygen analysis was conducted by Galbraith Laboratories Inc., Knoxville, TN, with a Thermo Finnigan FlashEA™ 1112 Elemental Analyzer (Oxygen Modification). Surface area and pore volume were obtained from nitrogen adsorption-desorption experiments using a Quantachrome Autosorb iQ at 77 K. Surface area was obtained by using the Brunauer–Emmett–Teller (BET) model. Pore size distribution and pore volume were determined using the nonlocal density functional theory (NLDFT).58 For differential scanning calorimetry measurement, ca. 4 mg of each sample was used in a hermetic pan with a DSC Q2000, TA instruments. Samples were heated and cooled for three cycles between -80 °C and 0 °C at a ramp rate of 2 °C/min. Analysis was done with the data obtained from the second cycle data. Rheology experiments were performed using a discovery hybrid rheometer (DHR3, TA instruments). Measurements were done at 25 °C with a 40 mm parallel and Peltier plates. X-ray photoelectron spectroscopy (XPS) was performed with a Thermo Scientific Model K-Alpha XPS Instrument. The instrument uses micro-focused, monochromatic Al Kα X-rays (1486.6 eV) that can be focused on a range of spot sizes from 30 to 400 microns. Analyses of most samples are typically conducted with a 400 µm X-ray spot size for maximum signal and to obtain an average surface composition over the largest possible area. The instrument uses a hemispherical electron energy analyzer equipped with a 128 multi-channel electron detection system. Base pressure in the analysis chamber is typically 2 x 10⁻⁹ mbar or lower. Samples for this study were mounted using double-sided tape fixed to clean glass slides. Wide energy range survey spectra (0-1350 eV) were acquired for qualitative and quantitative analysis (pass energy=200 eV, step size=1.0 eV). Assessment of chemical bonding of the identified elements was accomplished by collecting core level spectra over a narrow energy range (pass energy=50 eV; step size=0.1 eV). Because the samples were mounted on insulating glass sides, a charge compensation system consisting of both low energy Ar-ions and low energy electrons was employed. The typical pressure in
137
the analysis chamber with charge compensation system operating is 2 x 10-
7 mbar. Data were collected and processed using the Thermo Scientific Avantage XPS software package (v 5.966). When necessary, spectra are charge corrected using the C 1s core level peak set to 284.6 eV.
Acknowledgements
This research at Oak Ridge National Laboratory, managed by UT Battelle, LLC, for the U.S. Department of Energy (DOE) under contract DE-AC05-00OR22725, was sponsored by the Office of Energy Efficiency and Renewable Energy, BioEnergy Technologies Office Program. The lignin used in this work was generously donated by Kruger Wayagamack Inc, Canada.

138
References
1. Chung, Y.-L.; Olsson, J. V.; Li, R. J.; Frank, C. W.; Waymouth, R. M.; Billington, S. L.; Sattely, E. S., A renewable lignin–lactide copolymer and application in biobased composites. ACS Sustainable Chemistry & Engineering 2013, 1 (10), 1231-1238. 2. Ragauskas, A. J.; Beckham, G. T.; Biddy, M. J.; Chandra, R.; Chen, F.; Davis, M. F.; Davison, B. H.; Dixon, R. A.; Gilna, P.; Keller, M.; Langan, P.; Naskar, A. K.; Saddler, J. N.; Tschaplinski, T. J.; Tuskan, G. A.; Wyman, C. E., Lignin valorization: improving lignin processing in the biorefinery. Science 2014, 344 (6185), 1246843. 3. Ho, H. C.; Nguyen, N. A.; Meek, K. M.; Alonso, D. M.; Hakim, S. H.; Naskar, A. K., A Solvent-Free Synthesis of Lignin-Derived Renewable Carbon with Tunable Porosity for Supercapacitor Electrodes. ChemSusChem 2018, 11 (17), 2953-2959. 4. Callister, W. D.; Rethwisch, D. G., Materials science and engineering. John wiley & sons NY: 2011; Vol. 5. 5. Sun, X.; Li, Y., Colloidal carbon spheres and their core/shell structures with noble‐metal nanoparticles. Angewandte Chemie 2004, 116 (5), 607-611.
6. Puziy, A. M.; Poddubnaya, O. I.; Sevastyanova, O., Carbon Materials from Technical Lignins: Recent Advances. Top Curr Chem (Cham) 2018, 376 (4), 33. 7. Sun, X.; Liu, J.; Li, Y., Use of carbonaceous polysaccharide microspheres as templates for fabricating metal oxide hollow spheres. Chemistry–A European Journal 2006, 12 (7), 2039-2047. 8. Snowdon, M. R.; Mohanty, A. K.; Misra, M., A study of carbonized lignin as an alternative to carbon black. ACS Sustainable Chemistry & Engineering 2014, 2 (5), 1257-1263. 9. He, Z.-W.; Yang, J.; Lu, Q.-F.; Lin, Q., Effect of structure on the electrochemical performance of nitrogen-and oxygen-containing carbon micro/nanospheres prepared from lignin-based composites. ACS Sustainable Chemistry & Engineering 2013, 1 (3), 334-340. 10. Shimada, T.; Hata, T.; Kijima, M., Thermal Conversion of Lignin–Cellulose Composite Particles into Aggregates of Fine Carbon Grains Holding Micro- and Mesoporous Spaces. ACS Sustainable Chemistry & Engineering 2015, 3 (8), 1690-1695. 11. Zhao, H.; Wang, Q.; Deng, Y.; Shi, Q.; Qian, Y.; Wang, B.; Lü, L.; Qiu, X., Preparation of renewable lignin-derived nitrogen-doped carbon nanospheres as anodes for lithium-ion batteries. RSC Advances 2016, 6 (81), 77143-77150. 12. Zhang, C.; Chung, J. W.; Priestley, R. D., Dialysis nanoprecipitation of polystyrene nanoparticles. Macromol Rapid Commun 2012, 33 (20), 1798-803. 13. Legrand, P.; Lesieur, S.; Bochot, A.; Gref, R.; Raatjes, W.; Barratt, G.; Vauthier, C., Influence of polymer behaviour in organic solution on the production

139
of polylactide nanoparticles by nanoprecipitation. Int J Pharm 2007, 344 (1-2), 33-43. 14. Hornig, S.; Heinze, T.; Becer, C. R.; Schubert, U. S., Synthetic polymeric nanoparticles by nanoprecipitation. Journal of Materials Chemistry 2009, 19 (23), 3838-3840. 15. Hu, B.; Wang, K.; Wu, L.; Yu, S. H.; Antonietti, M.; Titirici, M. M., Engineering carbon materials from the hydrothermal carbonization process of biomass. Adv Mater 2010, 22 (7), 813-28. 16. Yong, T. L.-K.; Matsumura, Y., Kinetic analysis of lignin hydrothermal conversion in sub-and supercritical water. Industrial & Engineering Chemistry Research 2013, 52 (16), 5626-5639. 17. Kang, S.; Li, X.; Fan, J.; Chang, J., Hydrothermal conversion of lignin: a review. Renewable and Sustainable Energy Reviews 2013, 27, 546-558. 18. Funke, A.; Ziegler, F., Hydrothermal carbonization of biomass: a summary and discussion of chemical mechanisms for process engineering. Biofuels, Bioproducts and Biorefining 2010, 4 (2), 160-177. 19. Kang, S.; Li, X.; Fan, J.; Chang, J., Characterization of hydrochars produced by hydrothermal carbonization of lignin, cellulose, D-xylose, and wood meal. Industrial & engineering chemistry research 2012, 51 (26), 9023-9031. 20. Hu, J.; Shen, D.; Wu, S.; Zhang, H.; Xiao, R., Effect of temperature on structure evolution in char from hydrothermal degradation of lignin. Journal of Analytical and Applied Pyrolysis 2014, 106, 118-124. 21. Hiemenz, P. C.; Lodge, T. P., Polymer chemistry. CRC press: 2007. 22. Ho, H. C.; Goswami, M.; Chen, J.; Keum, J. K.; Naskar, A. K., Amending the Structure of Renewable Carbon from Biorefinery Waste-Streams for Energy Storage Applications. Sci Rep 2018, 8 (1), 8355. 23. Hosseinaei, O.; Harper, D. P.; Bozell, J. J.; Rials, T. G., Improving processing and performance of pure lignin carbon fibers through hardwood and herbaceous lignin blends. International journal of molecular sciences 2017, 18 (7), 1410. 24. Saha, D.; Van Bramer, S. E.; Orkoulas, G.; Ho, H.-C.; Chen, J.; Henley, D. K., CO2 capture in lignin-derived and nitrogen-doped hierarchical porous carbons. Carbon 2017, 121, 257-266. 25. Carrott, P.; Carrott, M. R., Lignin–from natural adsorbent to activated carbon: a review. Bioresource technology 2007, 98 (12), 2301-2312. 26. Cho, M.; Ko, F. K.; Renneckar, S., Impact of Thermal Oxidative Stabilization on the Performance of Lignin-Based Carbon Nanofiber Mats. ACS Omega 2019, 4 (3), 5345-5355. 27. Sakata, I.; Senju, R., Thermoplastic behavior of lignin with various synthetic plasticizers. Journal of Applied Polymer Science 1975, 19 (10), 2799-2810. 28. Bouajila, J.; Dole, P.; Joly, C.; Limare, A., Some laws of a lignin plasticization. Journal of applied polymer science 2006, 102 (2), 1445-1451.

140
29. Norberg, I.; Nordström, Y.; Drougge, R.; Gellerstedt, G.; Sjöholm, E., A new method for stabilizing softwood kraft lignin fibers for carbon fiber production. Journal of applied polymer science 2013, 128 (6), 3824-3830. 30. Bai, X.; Wan, C.; Zhang, Y.; Zhai, Y., Reinforcement of hydrogenated carboxylated nitrile–butadiene rubber with exfoliated graphene oxide. Carbon 2011, 49 (5), 1608-1613. 31. Qu, M.; Deng, F.; Kalkhoran, S. M.; Gouldstone, A.; Robisson, A.; Van Vliet, K. J., Nanoscale visualization and multiscale mechanical implications of bound rubber interphases in rubber–carbon black nanocomposites. Soft Matter 2011, 7 (3), 1066-1077. 32. Kohls, D.; Beaucage, G., Rational design of reinforced rubber. Current opinion in solid state and materials science 2002, 6 (3), 183-194. 33. Frogley, M. D.; Ravich, D.; Wagner, H. D., Mechanical properties of carbon nanoparticle-reinforced elastomers. Composites Science and Technology 2003, 63 (11), 1647-1654. 34. Fu, S.-Y.; Feng, X.-Q.; Lauke, B.; Mai, Y.-W., Effects of particle size, particle/matrix interface adhesion and particle loading on mechanical properties of particulate–polymer composites. Composites Part B: Engineering 2008, 39 (6), 933-961. 35. Tang, L. G.; Kardos, J. L., A review of methods for improving the interfacial adhesion between carbon fiber and polymer matrix. Polymer composites 1997, 18 (1), 100-113. 36. Kang, M.-J.; Heo, Y.-J.; Jin, F.-L.; Park, S.-J., A review: role of interfacial adhesion between carbon blacks and elastomeric materials. Carbon Letters (Carbon Lett.) 2016, 18, 1-10. 37. Dannenberg, E.; Boonstra, B., Performance of Carbon Blacks-Influence of Surface Roughness and Porosity. Industrial & Engineering Chemistry 1955, 47 (2), 339-344. 38. Cadek, M.; Coleman, J.; Ryan, K.; Nicolosi, V.; Bister, G.; Fonseca, A.; Nagy, J.; Szostak, K.; Beguin, F.; Blau, W., Reinforcement of polymers with carbon nanotubes: the role of nanotube surface area. Nano Letters 2004, 4 (2), 353-356. 39. Jeon, J. W.; Zhang, L.; Lutkenhaus, J. L.; Laskar, D. D.; Lemmon, J. P.; Choi, D.; Nandasiri, M. I.; Hashmi, A.; Xu, J.; Motkuri, R. K.; Fernandez, C. A.; Liu, J.; Tucker, M. P.; McGrail, P. B.; Yang, B.; Nune, S. K., Controlling Porosity in Lignin‐Derived Nanoporous Carbon for Supercapacitor Applications. ChemSusChem 2015, 8 (3), 428-432. 40. Tran, C. D.; Ho, H. C.; Keum, J. K.; Chen, J.; Gallego, N. C.; Naskar, A. K., Sustainable Energy‐Storage Materials from Lignin–Graphene Nanocomposite‐Derived Porous Carbon Film. Energy Technology 2017, 5 (11), 1927-1935.

141
Appendix
Table S4.1. X-ray photoelectron spectroscopy results of the lignin-derived carbon nanosphere particles.
C
O
Ca
Na
S
Si
sp
2
sp
3
C-O
C
=O
O
=C
O
-C
OH
C-A
ir 5
1.7
%
35
.0%
3
.5%
2
.7%
3
.4%
2
.9%
N
A
0.4
%
NA
0
.5%
N
A
C-H
TC
Air
76
.2%
1
3.5
%
0.8
%
3.9
%
3.7
%
0.8
%
0.1
%
0.1
%
0.2
%
0.4
%
0.3
%
C-N
7
6.9
%
12
.5%
1
.0%
3
.7%
3
.9%
1
.0%
0
.1%
0
.5%
0
.1%
0
.3%
0
.2%
C-H
TC
N
76
.6%
1
3.0
%
1.1
%
3.7
%
3.6
%
1.1
%
0.2
%
0.1
%
0.1
%
0.3
%
0.3
%

142
CONCLUSION
This dissertation explored the potentials of utilizing simple methods to convert lignin into carbon with a controllable morphology for energy storage and polymer composite applications. First, by studying the self-assembly mechanism of a simpler carbohydrate and a biomass pretreatment byproduct under hydrothermal conditions, I learned that carbon sphere particles can be produced. Laboratory experiments and modeling revealed that when an emulsion medium was used with hydrothermal treatment, hollow carbon spheres with abundant microporosity can be formed. After carbonization and activation, the carbon produced can be used as supercapacitor electrodes. Next, I explored how supercapacitor electrodes can be designed from lignin-derived activated carbon without the needs of solvents. The morphology of lignin can be controlled by simple melt-mixing with a 10% rubbery macromolecule and/or stabilization in air to induce lignin crosslinking. After a one-step carbonization and activation, derived activated carbon’s surface area and supercapacitor performance can be increased by 22%. Producing lignin-derived carbon sphere particles have drawn significant interest recently but with limited success. With the lessons learned from lignin crosslinking in solid-state and self-assembly of carbonaceous hydrochar spheres via solvothermal pathways, lignin-derived carbon sphere particles were produced successfully by subjecting lignin with a solvothermal treatment in DMSO, a good solvent for lignin. Solvothermal treatment eventually caused precipitation―similar to carbohydrate-derived spherical hydrochar―of modified lignin particles with high carbon yield. After carbonization, spherical carbon particles can be formed without the need for templates, scaffolds, surfactants, or copolymers. Lastly, I discovered that using hydrothermal stabilization, lignin-derived carbon particles displayed a stronger reinforcing effect with a styrene-butadiene rubber matrix than those obtained via stabilization in air or nitrogen. In addition, by utilizing a simple self-assembly mechanism of lignin in nanoprecipitation, spherical lignin nanoparticles can be produced and used as the carbon precursor, avoiding the needs to superheat organic solvents. During hydrothermal treatment, lignin underwent crosslinking and became stabilized. When compared with conventional lignin stabilization methods in air or nitrogen, hydrothermal stabilization of lignin released less volatiles during stabilization, leading to fewer defects and less porosity in the resulting carbon particles.
143
VITA
Hoi was originally born and raised in the metropolitan city of Hong Kong. When he was 16, he moved to Fort Scott, Kansas and completed high school. After falling in love with the area, he stayed and attended Johnson County Community College. Being an enthusiastic and curious person who likes new challenges, Hoi developed a passion for the environment and climate change and continued to pursue his education at the University of Illinois at Urbana-Champaign in a B.S. degree in Agricultural and Biological Engineering. Wanting more and being unsatisfied, Hoi went onto pursuing a Ph.D. degree with The Bredesen Center for Interdisciplinary Research and Graduate Education, where he completed course works at the University of Tennessee while working on his dissertation research work with Dr. Amit Naskar, the group leader of the Carbon and Composites Group, at Oak Ridge National Laboratory (ORNL). At ORNL, Hoi focuses on developing facile processes for valorizing industrial byproducts like lignin, which has a high structural complexity and poor processability. Hoi learned that many organic byproducts can be turned into carbon. By carefully controlling the morphology and functional properties of renewable carbon, they can be used as carbon black, porous carbon, and activated carbon for energy storage, supercapacitor, water desalination, and polymer composite applications. On top of his dissertation research, Hoi was also active in personal development and was involved with the local entrepreneurship, energy policy, and scientific outreach communities. During his Ph.D., Hoi has discussed ideas with Governors and venture capitalists. In parallel, Hoi has also developed his business acumen by completing two internships in the chemical, pharmaceutical, and luxury home appliance industry in Europe. Upon graduation, Hoi aspires to have a career that will work closely with the forefront of technology development and continuously broaden his worldview.