detailed topography and surface survey. what is the...
TRANSCRIPT

Detailed Topography and Surface Survey. What is the point? Tanagra City Survey 2000
Emeri Farinetti Faculteit der Archeologie
Reuvensplaats 4, Postbus 9515,
2300 RA Leiden, The Netherlands Phone:+31 71 5272931 -Fax:+31 71 [email protected]
Lefteris Sigalos Faculteit der Archeologie
Reuvensplaats 4, Postbus 9515,
2300 RA Leiden, The Netherlands Phone:+3171 5272425-Fax:+31 71 [email protected]
Abstract: Topographical surveys and the creation of digital elevation models have become quite common in the archaeological projects. In the excavations they are used as a frame to locate the excavated area in a wider context. On the other hand, in artifact surface surveys, detailed topographical surveys produce a base layer over which the results of the collection can be lain.
The paper aims to illustrate the topographical survey and the mapping of the architectural features visible on the surface carried out at the ancient city of Tanagra in Boeotia, Central Greece, as a part of a wider city survey project. The methodology used will be illustrated and examined, and the results will be analyzed to evaluate their effectiveness for the final goals of the artifact surface survey project. Technical aspects will be illustrated and discussed together with the validity of the methods employed.
Furthermore, from this analysis crucial methodological questions can be raised: is a topographical detailed survey useful only to map data resulting from the artifact surface collection, and to give us a general picture of the area we are working on? Or rather, by inserting the results as a layer into a Geographical Information System and linking it to a diversified database, could we gain new information and squeeze fresh juice out of something that would not be a mere Digital Elevation Model?
Key words: swvey, topography, digital elevation models, geogiaphical information systems, cityscape
Archaeologists of the Classical world, traditionally, regard computer applications and especially GIS as a good means of visualization of the results they have strenuously studied and processed by hand. The immense number of dots covering maps of publications is the greatest proof Presentation of data is of course a basic function, but computer applications can be used for the analysis of data, the combination of information and the creation of new data that have not been collected from the field.
The study of the city of Tanagra, under the direction of Profes- sor John Bintlifffrom Leiden University, having as a primary aim to extract as much information about the city as possible with non-destructive means, such as excavation, has been utilizing technological means so as to manage and analyze the vast in number and variety data collected on a day-to-day ba- sis. Our target is to reconstruct the cityscape and activity zones of Tanagra at its peaks, that is the late Classical and late Roman periods, and, additionally, investigate the trends of occupation and reoccupation of the site from prehistoric times to nowadays. For this purpose three teams have been created for the collec- tion and study of surface remains, mainly ceramic, the
architectural and topographical survey, and the geophysical prospection.
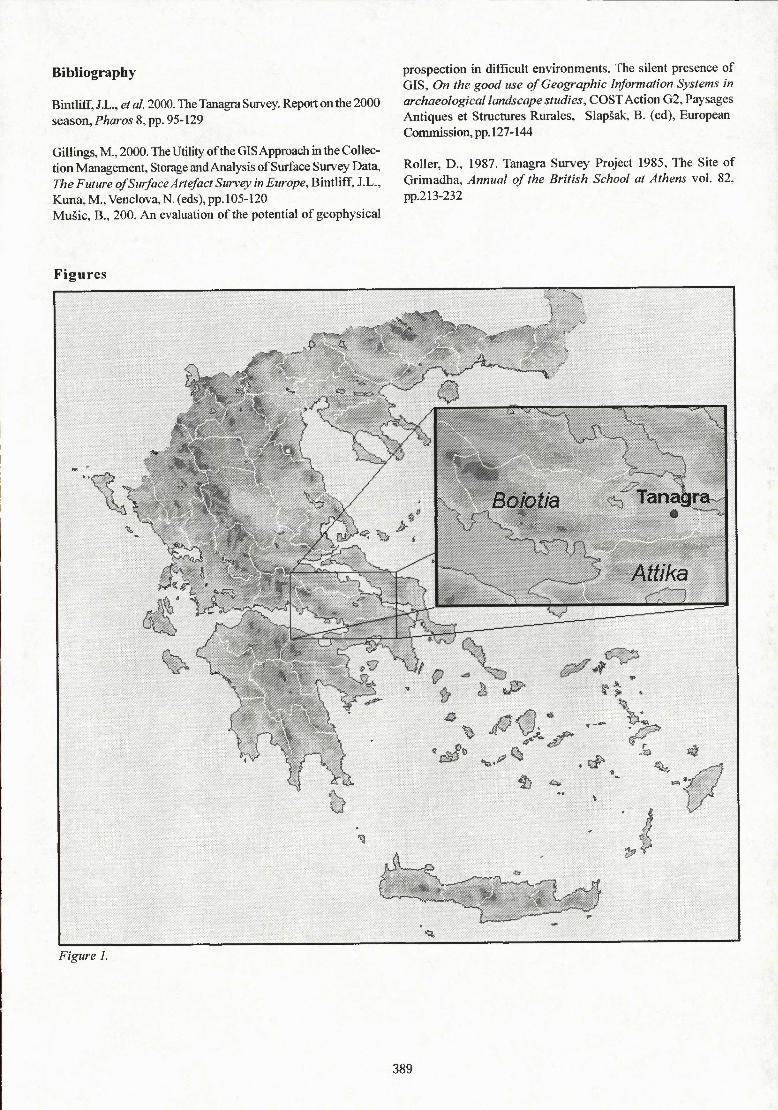
The ancient site of Tanagra, locally known as Grimada, lies in southeast Boiotia in Central Greece, close to the borders with Attica (fig. 1 ). The settlement is situated on the precipitous northern slope of Mt Soros, identified as the ancient Mt Kerykion. The ridge of Mt Soros separates the two Boiotian plains of Thebes and the coastal areas to the east, respectively. At a distance of less than one kilometre to the south of the city runs the river Asopos that used to be the ancient border between Boiotia and Attica. To the west of Tanagra is a little stream, nowadays called Lari that joins the river Asopos SW of the city. The city itself is marked by its late Classical fortification walls covering a total area of 30 hectares. Being situated on sloping ground, the city has been built on different levels and terraces. The theatre, dominating the site, is built against a steep slope at the SW comer of the city and the agora with the public buildings on a flat high terrace, or acropolis, raised above the rest of the city (fig.2).
385

The city had been identified already in the 19" century by travellers in the process of the rediscovery of Greece. The first attempt, though, to study it systematically was made by Pro- fessor Roller with a team from the university of Wilfrid Laurier in Canada. The aim of the team was the survey and mapping of the architectural features of the site and locating the quarries of the city. The interpretation of the plotted architectural remains allowed the team to locate various aspects of the plan of the city. Thus, they identified a series of roads running parallel to each other with a S W-NE direction at approximately 52m intervals, and avenues crossing them at right angles every 102m. The residential blocks would, therefore, be rectangular with dimensions of 50x 100, if we allow 4m for the width of the roads (Roller 1987).
In this paper we will present some preliminary results of the 2000 season, focusing our attention on the micro-topographical survey and its relevance to the general surface survey project. Our aim is to stress the importance of such a method for the reconstruction of the topography of the city. Not only are we interested in locating architectural features, ceramic assemblages and scatters, geophysical data on a detailed Digital Elevation Model (DEM), but also our main intention is to attempt to combine the various levels of information to produce data that is not readily available in the field. The paper is divided into two sections. Firstly, we will discuss the methods applied by the groups for the retrieval of the data as well as their nature. Consequently, we will not only assess the value of the topographical data as a mere displaying background, but also as an active layer in a complex Geographical Information Sys- tem (GIS) environment, examining processes, such as erosion patterns and their affect on the data retrieved.
Thus, having Roller's interpretations at hand, we decided to divide the walled area of the city in units of 50 by 50 m following the directions of the proposed insulae. These units were approximately half the size of the occupational blocks (see Rol- ler 1987). Once a number of units were laid out both survey and topographical teams could get into action. After evaluating the visibility of the unit, the teams would count the ceramic material from the surface. Due to the large number of specimens within each unit, the most diagnostic and peculiar sherds would be collected ranging from 150 to 250 pieces per unit. Simultaneou- sly, two people of each team would collect all the ceramics from a lane of 10 by 30 m at the south eastern comer of the unit. Finally, a third group, the so-called specialist group, would cover the unit once again conducting a targeted search for particular ceramics and other artifacts, not easily detected otherwise. All samples would be placed in different bags with different recording sheets related to them and sent for study and proces- sing at the lab. There, every find would be given a unique number and its characteristics, function and date would be inserted in a database for further analysis. During the first sea- son, the area covered by the ceramic survey teams was approximately 1/3 of the total city, or a little less than 12 hectares.
The units used for the city survey were also the physical frame- work of the topography team. Each unit was surveyed in detail taking measurements at 4m intervals. Ideally, approximately 145 measurements would be taken per unit capturing as many details as possible. Special attention was paid to topographical features
such as terraces and depressions that could easily be missed by the grid of points. Furthermore, all visible architectural features whether in situ (walls, terrace walls, cornerstones and large masoned fragments) or scattered in the cityscape (column drums, capitals, friezes, triglyphs and rubble heaps) were located and recorded both manually and electronically. For this pur- pose we used a SOKKISHA Total Station provided by the Uni- versity of Leiden. This method was a development of the one first introduced to the preceding Boiotia project by Mark Gillings, who very successfully managed to capture invaluable information about the residential area of the Prankish and Early Ottoman site VM4 or Palaio-Panagia, in the vicinity of ancient Askra, in the Valley of the Muses (Gillings 2000). Due to the number of measurements and the variety of architectural data collected, the team only managed to cover a considerably smal- ler region than that of the ceramic collection (approximately 6 hectares).
The question that may be raised is: Why should one get in so much trouble? Beyond the self-evident reason for capturing the topography and testing Roller's hypotheses, there is an additional one and it can be summarized in the following question: To what extent is it possible to reconstruct a citys- cape with non-destructive means? Or, otherwise, can we study a city without excavation? And that was exactly the aim of the Tanagra city project as a whole.
Before looking at some preliminary interpretations two aspects of the city should be mentioned. In the first place, it has been known that Tanagra during the 4"' century BC got a new fortification wall and possibly a regular street plan. A characteristic example is Olynthos, in Northern Greece. Secondly, Tanagra being situated at an irregular slope would have required extensive terracing so as to allow a regular street plan to be introduced. Based on these two assumptions the detailed topographical survey would permit the plotting of such ter- racing to be identified.
Since the area covered topographically did not have slope differences exceeding 2-3m within each unit it was regarded acceptable to produce contour lines at 0.20 metres intervals (fig. 3). This was also permitted by the frequency of our measurements resulting a pattern of approximately 2 contour lines between two measurements. From the site plan produced it seemed that the direction of the walls were coinciding with the majority of the scattered architectural features, represented by points, the latter following a directional pattern too. In addi- tion, the plan that our team produced seems to have many similarities with that proposed by Roller. Concerning the roads, that is the streets running from SW-NE direction, both Roller's and our plans seem to coincide. On the contrary, the avenues, or the streets parallel to the roads, seem to be differently located (see below).
As for the architectural features themselves, marked in bold (fig. 4), a series of walls were discovered and recorded that in most cases, especially in the SW comer of the city, seem to have belonged to road terracing or continuous house walls bounding the streets. Some more elaborate structures are evi- dent in the NW side of the area covered during the first season. These particular structures are at most 20 cm above the ground
386

surface, but their location on the top of a ridge and the nature of the masonry, imply that either a public building or a temple was located on the site. Furthermore, a capital located towards the south of the city may indicate the presence of a temple or a civic building in the vicinity (Roller 1987). At the S and SW side of the surveyed area a section of the fortification wall was measured which in large was concealed by soil and rubble.
Moving from the methodologies used in the field and the preliminary interpretations of the architectural features, we will examine the DEM interpolation methods applied and some GIS applications based on preliminary results. The area covered by the topographical survey consists of a small part of the most rugged part of the city, to the South, the eastern part of the ridge prominent over the lower city to the North, a small part of the slope gently descending from the ridge towards the North, and a depression to the South-East, terminating against the eastern side of the city wall. The elevation difference is 29 m and topographical features are characterized by different directions (fig.5).
The point elevation data (a quasi-regular grid of three- dimensional point coordinates) collected during the survey have been interpolated in order to build a DEM, a virtual continuous representation of the surface topography. The points, as we said, have been taken on a 4 x 4 m grid and the accuracy of z values is 1 cm. The raw data matrix has then been enhanced by different kind of interpolation methods so as to produce a simulated surface with an interval of 0.2 m between contour lines. We tested various interpolation methods, changing anisotropic rates and search radius, in the attempt of detecting significant anomalies and structural evidence, taking into account topographical discontinuities, which characterize the surveyed area.
The application of the Shepard's method, usefiil to maintain inhalterated line distances, created the so-called Bull's Eye effects and the resulting picture was very different from the actual topography. The Radial Basis Functions method, which takes into account the exact location of control points and does not smooth the data, was not of any help, as it created strange effects (trying to maintain the exact location of the points without calculating an average). The TIN method though, despite not giving average results either, creates triangles having as vertices the measured points (fig.3). It is usually suitable for perfect grid (in our case it was regular but not perfect) and very steep areas (which we do have in some locations). We tried also to apply an anisotropy ratio (1.5 and 2) along the direction of the slope towards the theatre, but no new information seemed to appear. The results obtained applying the TIN method, however, see- med to be the best for visualization purposes. Although this procedure does not create any smoothing effect itself, the resulting image shows a smoothed surface, without sharp interruptions but being very steep in certain areas. The main macro-features characterizing the topography are the ridge that crosses the city along the central axis, from the West to the East, and the hollow close to the city wall to the East.
The micro-features clearly discernible are quite wide terraces in the area to the South of the ridge, going up towards the West, and narrower and steeper terraces going up towards the South,
to reach the theatre. These terraces were meant to sustain the roads and the buildings along them. The correlation between terrace features and roads can be clearly seen in fig.6, displaying the road system of the ancient city as suggested by Roller (1987). As for the roads running SW-NE we have plentiful evidence. On the other hand, as for the avenues, or the streets running perpendicularly to the previous, we have topographical proof in only one case. Here terraces have been built perpendicularly to support a crossroad. Another feature clearly visible is the steep slope leading to the easternmost edge of the ridge, starting few meters from the city wall.
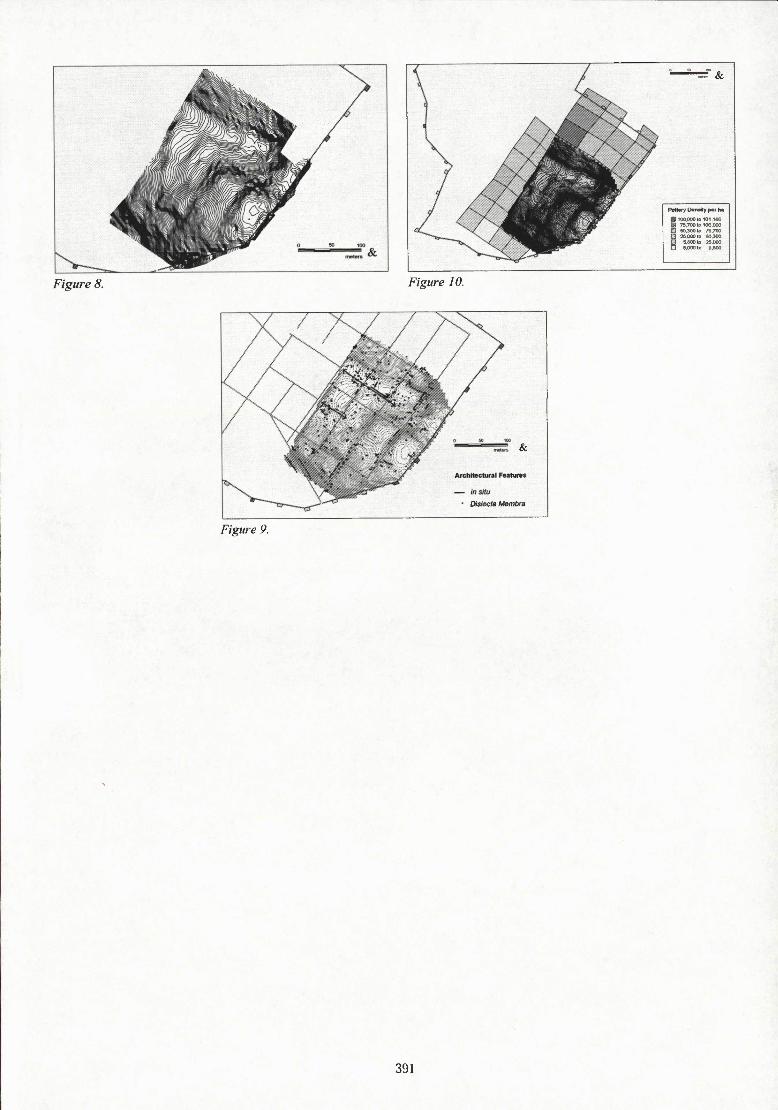
We tried then to apply Kriging's interpolation method. It smooths data too much and in our case it did not give the possibility to detect anomalies, even when considering the direction of the terraces. The general resulting image is nice to see though and, if we produce an interpolated surface (fig.7), consisting of continuous data instead of contours, it shows better the detectable features - terraces in our case. Using the Inverse Distance to a Power method, we could notice some discontinuities on the simulated surface, but nothmg new. The same happened with the Minimum Curvature method (fig.8). In both resulting DEMs some small terraces in the slope gently descending from the ridge towards the North seem to appear. Applying the Minimum Curvature method though, which smoothens the data but in the meanwhile tends to be as exact as possible, the results can be distorted sometimes and they need to be checked.
Generally speaking, topographical surveys and the creation of DEMs have become quite common in the archaeological projects. In the excavations they are used as a frame to locate the excavated area in a wider context. On the other hand, in artefact surface surveys, detailed topographical surveys produce a base layer over which the results of the collection can be laid. In the framework of the Tanagra Survey Project, the purpose of a detailed DEM was, as mentioned above, twofold: surveying topographically the area covered by the artifact collection in order to produce a detailed base map over which to overlay and 'over-display" collected data, and processing and analysing topographical data as an autonomous data set. According to this approach, present topography is interpreted and studied in a research framework, in order to capture any surviving trace concerning past use and spatial organisation of the city.
Examining the mere DEM, only few micro-features and the topographic anomalies noticed earlier can be clearly detected. However, new information can be added to the 1:5000 map of the area (the only one available before our survey), where only the general sloping nature of the hillside and macro-features such as the central ridge are represented. For instance, the exact location of the terraces was crucial for the interpretation of the plan of the city.
Furthermore, when the architectural features recorded during our survey are overlain, adding a new information layer, the picture becomes clearer. Some terrace walls that follow topography can be detected. The remains of other terrace walls are probably under the surface soil, but the terraces are clearly visible through topography. Looking closely at the architectural
387

features recorded (fig.4), they represent, as stated above, more or less what Roller detected some years ago (Roller 1987). In recording them, we distinguished features (stone blocks) in situ in evident coimection with each other and belonging to walls (walls in situ), from what we have called disiecta membra (the architectural blocks not in their original place or if/« situ not in evident connection with others). We attempted to compare the density of the two categories, according to their presence in each collection unit, but no clear pattern appeared. On the other hand, considering and plotting them individually on the general topography we can easily see that they follow directions and present clear patterns in some cases. In the S part of the surveyed area, not only the few preserved walls but also the scattered architectural features, represented by points, follow the main direction of terraces and proposed roads. On the contrary, as pointed out earlier, some of the avenues (perpendicular to the roads) seem to be differently located (fig.9). They are, at least in this area, running in the same direction with the slope resulting them to be more vulnerable to erosion. On the top of the ridge, where we have the 'plateau' gently ascending towards the East, the pattern is less clear, but it is easy to connect the position of the features with the presence of larger and possibly public buildings, characterized by diffe- rent sizes as well as different orientation. On the slope to the North we cannot detect any pattern, and the majority of the present blocks cannot be considered in situ. They have probably rolled down from the structures on the top of the ridge.
Overlaying the collection grid upon filtered DEM, we can directly compare the results of the artifact surface survey, such as the density of pottery per collection unit corrected by visibility, with topography and topographical features (fig. 10). As we can see, inside the city wall, the largest concentration of pottery is on the slope coming down from the main ridge. This can be due to erosion factors, if we also consider that we have the highest evidence of prehistoric pottery at this location. Moreover, looking at the relationship between density of pottery and the presence of architectural features on the surface, we may notice a presence of the latter where the former is smaller. Considering the architectural remains certainly in situ together with the topography, we can see that they are visible on the surface especially on the bare area on the top of the ridge. The surface soil, rich in ceramic material, has moved and rolled down the slope. Erosion can, therefore, explain pottery concentrations (on the slope) and architectural features concentrations (on the flattened bare area), as well as the apparent absence of some probable avenues at the lower areas. ;
Later in the year, in November, jointly with a Slovenian team from the University of Ljubljana, we carried out a campaign of geological investigation and geophysical prospection, in a rat- her flat area close to the southern city wall, probably residential in the urban plan of the 4th century BC. The aim of the geophysical prospection were in many respects similar to those of the topographical survey, ranging from the detection of structural features to that of functional areas and organization of space inside the urban area (Bintliff et al. 2000). For our purposes it is of interest noting that it confirmed our hypothesis of the urban street plan and supported the interpretation of the topographical features clearly emerging from our survey.
To store all data coming from the field and derived information, both from the artifact surface collection and the architectural features survey, geophysics and geology, a database was structured and implemented in Microsoft Access 2000. All the informafion recorded in the field on the recording sheets have been inserted into the database, providing also a quantity of further insights concerning the way of collecting data. The set of basic units of the information collection has been carefully constructed as topologically consistent. Once spatially plotted, they have been linked directly to the attribute information relating to the finds made within each of the grid units and all the features have been assigned to different information layers.
Within the GIS system then, the resulting survey maps have been geo-referenced and integrated with the available paper maps at smaller scale ( 1:5000 -1:50000) converted into a digital format, using control points taken in the field. Moving beyond this relatively simple task of spatially distributed data management, the GIS has been used to pro- cess and explore the data set resulting from the topographical survey, integrating it with the architectural features recorded and the artifact collection data.
To sum up, from the described case-study crucial methodological questions can be risen: is a topographical detai- led survey useful only to map data resulting from the artifact surface collection, and to give us a general picture of the area we are working on? Or rather, by inserting the results as a layer into a Geographical Information System and linking it to a diversified database, could we gain new information and squeeze fresh juice out of something that would not be a mere Digital Elevation Model?
As we have shown above, certainly the topographical survey has enabled us to plot and overlay the artifact surface survey results on a more detailed terrain model of the surveyed area. Additionally, though, a GIS based recording procedure has provided us with a uniform framework, based on multilayer and multiscale procedures, within which to bring together and curate data derived from a varied range of sources. Furthermore, the relationship between Database and GIS has been shown as complementary and one of synergy. Thanks to a well- constructed Database, GIS plays a crucial role in the analysis of a complex site, as Tanagra has proved to be, since it works as a single, integrated, highly flexible analytical environment. Within it, every single layer contributes to the analyses concerning archaeological problematics, and also Topography becomes a meaningful, high information potenrial data set.
Acknowledgements
We would like to express our gratitude for the encouragement and support of Professor Dr John L. Bintliff, Leiden University, who provided us with the opportunity to work for the Tanagra City Survey Project. We would also like to thank the University of Leiden for its technical support, as well as the students that assisted us with practical aspects of the project. It would be an omission not to thank Professor Bozidar Slapsak and DrBranko Music for having provided us with their expertise on Geophysical prospection.
388
Bibliography
BintlifF, J.L., et al. 2000. TheTanagra Survey. Report on the 2000 season. Pharos 8, pp. 95-129
Gillings, M., 2000. The Utility of the GIS Approach in the Collec- tion Management, Storage and Analysis of Surface Survey Data, The Future of Surface Artefact Survey in Europe, Bintliff, J.L., Kuna, M., Venclova, N. (eds), pp.105-120 Music, B., 200. An evaluation of the potential of geophysical
prospection in difficult environments. The silent presence of GIS, On the good use of Geographic Information Systems in archaeological landscape studies, COST Action G2, Paysages Antiques et Structures Rurales, Slapsak, B. (ed), European Commission, pp. 127-144
Roller, D., 1987. Tanagra Survey Project 1985, The Site of Grimadha, Annual of the British School at Athens vol. 82, pp.213-232
Figures
•Çf
Figure 1.
J'i \ I
rv
'^•
r. i
_ _^..__^ -~-\
Boiotia Tanabra
Attika
'^^
.- t>.
.«# <äf
\s^
-A 2^^ --^
389

Figuie
Figure 5.
M %\.^
>
M B l" /
Ä ̂ ̂ P f
N^^% ^^ 0 50 100
•J<>t
Figure 6.
Figure 3.
Architectural Features
— in situ
• Disiecta Membra
Figure 7.
150 200
Figure 4.
390
&
Potl«fy 0«n«ly pw ha B 100,000)0 101,166
75,700 EO 100.000 50.300 W 75,700 25,00010 50,300
5,600 to 25,000
^ 5.000 to 5,900
Figure 8. Figure 10.
&
DfSiecta MembrB
Figure 9.
391