details of the ishikawa environment of the ishikawa environment ... resize drag arrow tail 546 ......
TRANSCRIPT
Chapter 18Details of the ISHIKAWA Environment
Chapter Table of Contents
SUMMARY OF OPERATIONS . . . . . . . . . . . . . . . . . . . . . . . . 529
OPERATIONS . . . . . . . . . . . . . . . . . . . . . . . . . . . . . . . . . . 534Adding Arrows . . . . . . . . . . . . . . . . . . . . . . . . . . . . . . . . . 534Labeling Arrows . . . . . . . . . . . . . . . . . . . . . . . . . . . . . . . . 537Moving Arrows . . . . . . . . . . . . . . . . . . . . . . . . . . . . . . . . . 540Deleting Arrows . . . . . . . . . . . . . . . . . . . . . . . . . . . . . . . . . 544Resizing Arrows . . . . . . . . . . . . . . . . . . . . . . . . . . . . . . . . 546Swapping Arrows . . . . . . . . . . . . . . . . . . . . . . . . . . . . . . . . 549Balancing Arrows . . . . . . . . . . . . . . . . . . . . . . . . . . . . . . . . 551Notepads . . . . . . . . . . . . . . . . . . . . . . . . . . . . . . . . . . . . 557Managing Complexity . . . . . . . . . . . . . . . . . . . . . . . . . . . . . 558Zooming Arrows . . . . . . . . . . . . . . . . . . . . . . . . . . . . . . . . 561Isolating Arrows . . . . . . . . . . . . . . . . . . . . . . . . . . . . . . . . 562Merging Diagrams . . . . . . . . . . . . . . . . . . . . . . . . . . . . . . . 563Creating Graphics Output Using SAS/GRAPH Software. . . . . . . . . . . 566Creating Bitmap Graphics Output . . . . . . . . . . . . . . . . . . . . . . . 568Modifying Fonts . . . . . . . . . . . . . . . . . . . . . . . . . . . . . . . . 570Modifying Box Colors . . . . . . . . . . . . . . . . . . . . . . . . . . . . . 571Modifying Arrow Colors and Line Styles . . . . . . . . . . . . . . . . . . . 572Modifying Text Colors . . . . . . . . . . . . . . . . . . . . . . . . . . . . . 578Modifying Arrow Heads . . . . . . . . . . . . . . . . . . . . . . . . . . . . 579Modifying Environmental Attributes. . . . . . . . . . . . . . . . . . . . . . 580Saving an Ishikawa Diagram for Future Editing. . . . . . . . . . . . . . . . 581Reading an Existing Ishikawa Diagram . . . . . . . . . . . . . . . . . . . . 582Displaying Multiple Ishikawa Diagrams. . . . . . . . . . . . . . . . . . . . 584
INPUT AND OUTPUT DATA SETS . . . . . . . . . . . . . . . . . . . . . . 586
SYNTAX . . . . . . . . . . . . . . . . . . . . . . . . . . . . . . . . . . . . . 588
EXAMPLES . . . . . . . . . . . . . . . . . . . . . . . . . . . . . . . . . . . 589Example 18.3 Quality of Air Travel Service . .. . . . . . . . . . . . . . . . 589Example 18.3 Integrated Circuit Failures . . . . . . . . . . . . . . . . . . . . 589Example 18.3 Photographic Development Process. . . . . . . . . . . . . . . 589
527

Part 4. The CAPABILITY Procedure
SAS OnlineDoc: Version 8528

Chapter 18Details of the ISHIKAWA Environment
This chapter presents detailed information about and examples of all the operationsavailable in the ISHIKAWA environment. Some of the examples build upon the dia-gram created in the tutorial on page 519.
Summary of OperationsTo invoke the following context-sensitive operations, apply the specified action(mouse event) to the appropriate hotspot, using the left mouse button:
Table 18.1. Primary OperationsOperation Mouse Event Hotspot Page
Add Click Near the intended attachment point534
Edit Click Arrow tail 537
Move Click (to pick) Arrow head
Click (to drop) Near the intended attachment point540
Delete Double click Arrow head 544
Resize Drag Arrow tail 546
Notepad Double click Arrow tail 557
529

Part 4. The CAPABILITY Procedure
To invoke the following operations, make the specified selection from the appropriatecontext-sensitive popup menu using the right mouse button:
Table 18.2. Secondary OperationsOperation Menu Selection Page
Swap Head or tail Swap 549
Balance Head or tail Balance 551
Hide Detail Background < Detail 558
Show Detail Background > Detail 558
Zoom Head or tail Zoom 561
Isolate Head or tail Isolate 562
Print Pull-down File . Save as. Graph 566
Save Pull-down File . Save as. Data Set 581
Save Pull-down File . Save as. Image .
Subset Head or tail Subset 572
Copy Head or tail Copy 563
Refresh Background Refresh .
Unsubset Background Unsubset 572
Unbalance Background Unbalance 551
Undelete Background Undelete 544
SAS OnlineDoc: Version 8530
Chapter 18. Summary of Operations
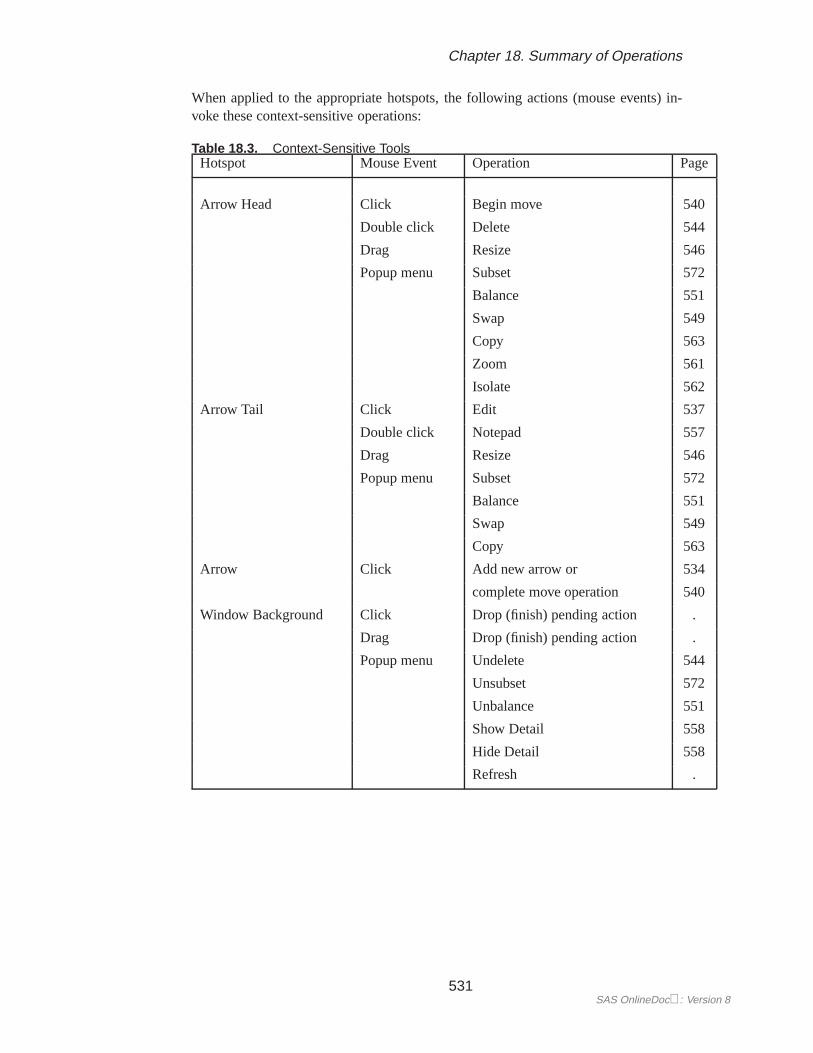
When applied to the appropriate hotspots, the following actions (mouse events) in-voke these context-sensitive operations:
Table 18.3. Context-Sensitive ToolsHotspot Mouse Event Operation Page
Arrow Head Click Begin move 540
Double click Delete 544
Drag Resize 546
Popup menu Subset 572
Balance 551
Swap 549
Copy 563
Zoom 561
Isolate 562
Arrow Tail Click Edit 537
Double click Notepad 557
Drag Resize 546
Popup menu Subset 572
Balance 551
Swap 549
Copy 563
Arrow Click Add new arrow or 534
complete move operation 540
Window Background Click Drop (finish) pending action .
Drag Drop (finish) pending action .
Popup menu Undelete 544
Unsubset 572
Unbalance 551
Show Detail 558
Hide Detail 558
Refresh .
531SAS OnlineDoc: Version 8

Part 4. The CAPABILITY Procedure
The File menu on the command bar can be used to control the following operations:
Table 18.4. File MenuFile . Description Page
New Start a new diagram 519
Open Open an existing diagram 582
Close Close the current window .
Merge Merge in an existing diagram 563
Save as. Data Set Save as a SAS data set 581
Graph Print using SAS/GRAPH software 566
Image Save as an IMAGE, catalog entry 568
Export as Bitmap. File... Copy to a bitmap file 568
Customize... Export options 569
The Edit menu on the command bar can be used to control the following operations:
Table 18.5. Edit MenuEdit . Description Page
Copy Copy the diagram to host clipboard 568
Clear... Clear the window .
SAS OnlineDoc: Version 8532

Chapter 18. Summary of Operations
The View menu on the command bar can be used to control the following operations:
Table 18.6. View MenuView . Description Page
Ishikawa Settings. Palettes Line and color palettes 572
Background Color Change window backgroundcolor
.
Save Attributes Save window attributes:size, fonts and backgroundcolor
.
Balance Method Select a balancing style 551
Resize Method Select a resizing method 546
Primary Fonts. . . Font dialog for first 3 levels 570
Secondary Fonts. . . Font dialog for levels 4-10 570
Colors. . . Color dialog 571
Arrows. . . Arrow style dialog 579
Other. . . Style dialog 580
Refresh Refresh the window .
The Help menu on the command bar can be used to control the following operations:
Table 18.7. Help MenuHelp. Description
SAS System Help SAS help system
Using This Window Ishikawa specific help
533SAS OnlineDoc: Version 8

Part 4. The CAPABILITY Procedure
Operations
This section provides details concerning the operations available in the ISHIKAWAenvironment. The order in which the topics appear is the order in which the opera-tions are typically encountered. Some of the examples in this section build upon thediagram created in the tutorial.
Adding Arrows
You add an arrow by pointing with the mouse to the intended attachment point alongan existing arrow and clicking the mouse. You control the direction of the new arrowby offsetting the mouse cursor a small distance away from the parent arrow on theside where the new arrow is to appear.
For example, to add upper branches, you offset the cursor slightly above the trunk.To add lower branches, you offset the cursor slightly below the trunk. Likewise, youoffset the cursor to the right of the branch to add a right-hand stem and slightly leftfor a left-hand stem.
If a new arrow is not drawn as you intended (either positionally or directionally), youcan easily move or delete it. To delete a new arrow before you have entered any text,click in the background. To move a new arrow before you have entered any text,move the cursor to a new attachment point and click.
Once an arrow is drawn, you are immediately prompted for its label (note the hint,Edit..., displayed on the message line and the appearance of the text cursor at the endof the arrow). See “Labeling Arrows” on page 537, for details on the text editingfeatures of the ISHIKAWA environment.
A diagram can contain up to ten levels of detail, but the number of arrows is limitedonly by the resolution and size of your graphics display.
ExampleContinuing with the tutorial example from “Tutorial” on page 519, suppose thatyou have obtained detailed information for each of the three major service areas,which you want to display by adding stems to the branches of the diagram you pre-viously created. If you closed the ISHIKAWA environment after saving the data set,SASUSER.AIRLINE, you can easily restore the diagram by submitting:
proc ishikawa data=sasuser.airline;run;
SAS OnlineDoc: Version 8534

Chapter 18. Operations
To add a stem to the left side of the branch labeledIn-Flight Service, position thecursor so that it is just to the left of the point where you want the stem to attach.Click the mouse. The new arrow (pending text) appears as follows:
Figure 18.1. Adding the Left Stem
Type the labelMealsand pressReturn twice.
To add a stem to the right side of the same branch, position the cursor so that it is justto the right of the attachment point. When you click the mouse, your window willappear as follows:
Figure 18.2. Adding the Right Stem
535SAS OnlineDoc: Version 8

Part 4. The CAPABILITY Procedure
Type the labelFlight attendantson two lines and pressReturn to terminate textentry.
Complete the diagram by adding the remaining stems shown in the following win-dow:
Figure 18.3. Stem-Level Diagram
Experiment further by adding several of the leaves shown in the following window.Don’t be concerned if some of the labels collide with each other. Later, you will learnhow to move and resize arrows.
Figure 18.4. Leaf-Level Diagram
SAS OnlineDoc: Version 8536

Chapter 18. Operations
Labeling Arrows
To edit the label of an existing arrow, click on one of the following areas:
� the label� the arrow tail (if the arrow does not have a label)� inside the box for trunk and branch labels
Use your keyboard to enter the text.
On hosts that support direct graphical text entry,� the following functions are sup-ported:
� edit keys such asBack space , Delete char , Delete line , andReturn
� cursor navigation keys such as" , # ,! and
� the Insert key to toggle between insert and overstrike modes
� buffers to copy, cut, or paste text into and from external sources
Text entry is terminated whenever you pressReturn on an empty line or exceed themaximum line limit for a label. Text entry is also terminated whenever you click themouse. This shifts focus away from the editing operation and to the new location.
Labels are restricted to 40 characters per line. The trunk label can have up to fivelines, and labels for other levels are limited to two lines.
You can split a line of text into two lines by pressing theReturn key anywhereinside the line. Likewise, flow a line with the previous line of text by pressing theBack space key at the beginning of the line.
You can copy the contents of the paste buffer into a label using the PASTE command.This can be helpful when the information for your diagram is available from anothersource (a flat file, for example). Use the paste buffer to copy the information fromthat source to your Ishikawa diagram.
Some hosts designate the right mouse button for pasting, some use control keys (likectrl-p), while others use a designated function key. For more details about using pastebuffers with the SAS System, consult the SAS companion for your host.
To paste text into a label, you must first select the label. For existing arrows, se-lect the arrow, position the cursor where you want the text to appear, and then issuethe PASTE command. For new arrows pending text entry, simply issue the PASTEcommand. Any text in the paste buffer that causes the label to exceed its limits istruncated.
When your mouse has a paste key defined, instead of adding an arrow and pasting thetext in two operations, use theright mouse button to add the arrow. This action adds
�Devices such as the IBM3179 do not support the direct graphical text entry mechanism describedin these examples. Instead, a text entry window pops up whenever you select an arrow for editing. Youmust edit the text for the arrow from the dialog box and close the text entry window before the diagramis updated.
537SAS OnlineDoc: Version 8

Part 4. The CAPABILITY Procedure
a new arrow, automatically copies the label from the paste buffer, and terminates textentry, in a single operation.
ExampleIn the following diagram, the branch labeledIn-Flight Servicehas been selected byclicking on the arrow tail. The arrow is highlighted with a narrow dotted line, and thetext cursor is positioned over the first character in the label.
Figure 18.5. Selecting an Arrow for Editing
SAS OnlineDoc: Version 8538

Chapter 18. Operations
To change the label so that the wordServiceappears on a separate line, use the!or key to move the cursor to the space before the wordService, as shown in thefollowing:
Figure 18.6. Using Cursor Keys
Now pressReturn to split the text into two lines.
Figure 18.7. Splitting Text
Remember to delete the space precedingServicebefore pressingReturn to terminatetext entry.
539SAS OnlineDoc: Version 8

Part 4. The CAPABILITY Procedure
Moving Arrows
You move an arrow by picking up the arrow and dropping it at a new location:
� To pick up an arrow, position the cursor over the arrow head and click themouse. The arrow you selected will be highlighted with a narrow dotted line.If the arrow is not highlighted, move the cursor closer to the arrow head andrepeat the click.
� To drop an arrow, move the cursor slightly to one side of the new attachmentpoint and click (just as though you are adding a new arrow).
When you move an arrow, all its descendants move with it.
To cancel a move after picking up an arrow, click in the background area of theISHIKAWA window.
Do not try to drop the arrow back into place by clicking on the arrow head asecond time.A double click on (or near) the arrow head deletes the arrow. To movean arrow a short distance, move the cursor away from the arrow head before clickingto drop the arrow. On some systems the cursor will change shape when you havemoved outside the context-sensitive area.
ExampleAs your diagrams develop, you will want to reposition arrows, either because oferrors or for aesthetic reasons. The following is an example of an Ishikawa diagramthat needs to be modified:
Figure 18.8. An Inelegantly Arranged Ishikawa Diagram
The diagram lacks balance, and some of the branches are too close, resulting in col-lisions and clipping.
SAS OnlineDoc: Version 8540

Chapter 18. Operations
One way to improve the diagram is to move the branch forPre-Flight Servicetowardthe center of the trunk. First select the arrow head for this branch.
Figure 18.9. Selecting an Arrow to Move
Then move the cursor to a point just slightly above the trunk near the desired newattachment point.
Figure 18.10. Locating the New Attachment Point
541SAS OnlineDoc: Version 8

Part 4. The CAPABILITY Procedure
Drop the arrow in place by clicking the mouse.
Figure 18.11. Dropping an Arrow into Position
Next, you should reflect the middle branch to the lower half of the diagram to bal-ance the diagram and eliminate the remaining collisions. Once you have selected thebranch, position the cursor slightly below the trunk near the desired new attachmentpoint.
Figure 18.12. Selecting an Arrow for Reflecting
SAS OnlineDoc: Version 8542

Chapter 18. Operations
Click the mouse to complete the reflection.
Figure 18.13. Reflecting an Arrow
Note that the stems are reflected with the branch and that their positions (relative tothe trunk) are preserved.
Finally, the stem labeledMeals is incorrectly attached to the branch labeledPre-Flight Serviceand should be moved to the branch labeledIn-Flight Service. Onceyou have selected the stem, move the cursor slightly left of the new attachment point.
Figure 18.14. Locating the New Attachment Point
543SAS OnlineDoc: Version 8
Part 4. The CAPABILITY Procedure
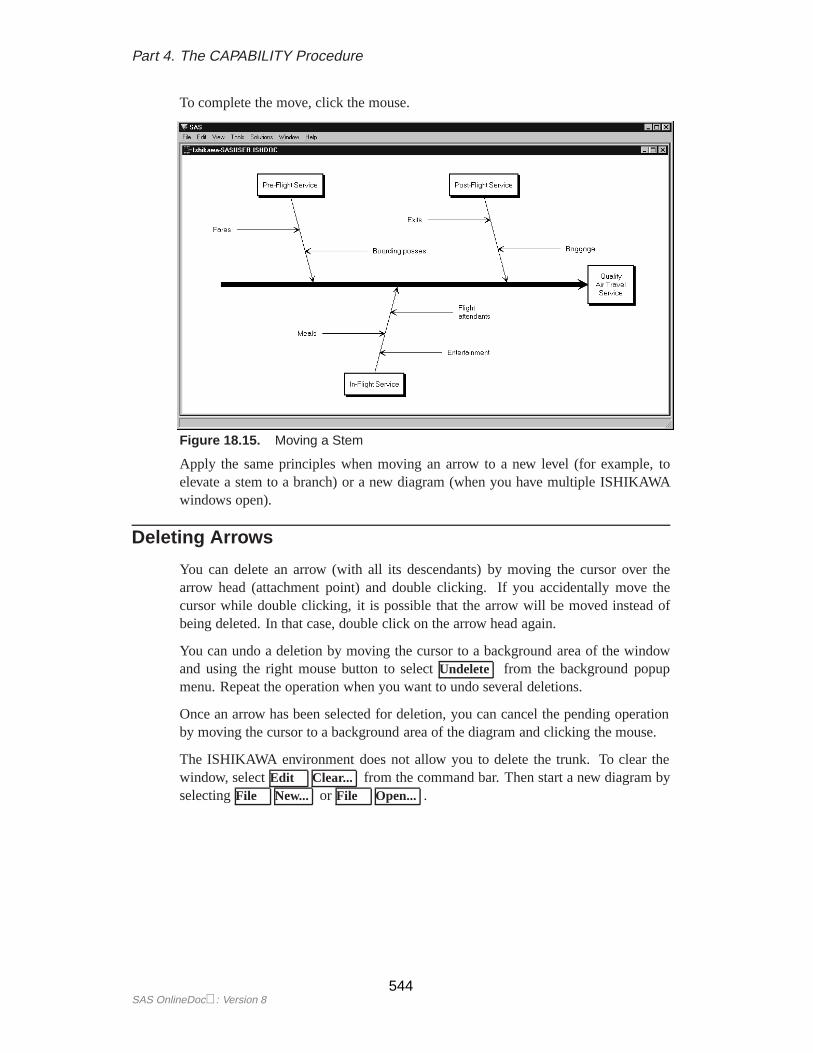
To complete the move, click the mouse.
Figure 18.15. Moving a Stem
Apply the same principles when moving an arrow to a new level (for example, toelevate a stem to a branch) or a new diagram (when you have multiple ISHIKAWAwindows open).
Deleting Arrows
You can delete an arrow (with all its descendants) by moving the cursor over thearrow head (attachment point) and double clicking. If you accidentally move thecursor while double clicking, it is possible that the arrow will be moved instead ofbeing deleted. In that case, double click on the arrow head again.
You can undo a deletion by moving the cursor to a background area of the windowand using the right mouse button to selectUndelete from the background popupmenu. Repeat the operation when you want to undo several deletions.
Once an arrow has been selected for deletion, you can cancel the pending operationby moving the cursor to a background area of the diagram and clicking the mouse.
The ISHIKAWA environment does not allow you to delete the trunk. To clear thewindow, selectEdit . Clear... from the command bar. Then start a new diagram byselectingFile . New... or File . Open... .
SAS OnlineDoc: Version 8544

Chapter 18. Operations
ExampleIn the following diagram, the branch labeledPost-Flight Servicehas been selectedfor deletion (note that the branch is highlighted):
Figure 18.16. Selecting a Branch for Deletion
Without moving the cursor, click on the arrow head a second time to delete the branch.
Figure 18.17. Deleting a Branch
545SAS OnlineDoc: Version 8
Part 4. The CAPABILITY Procedure
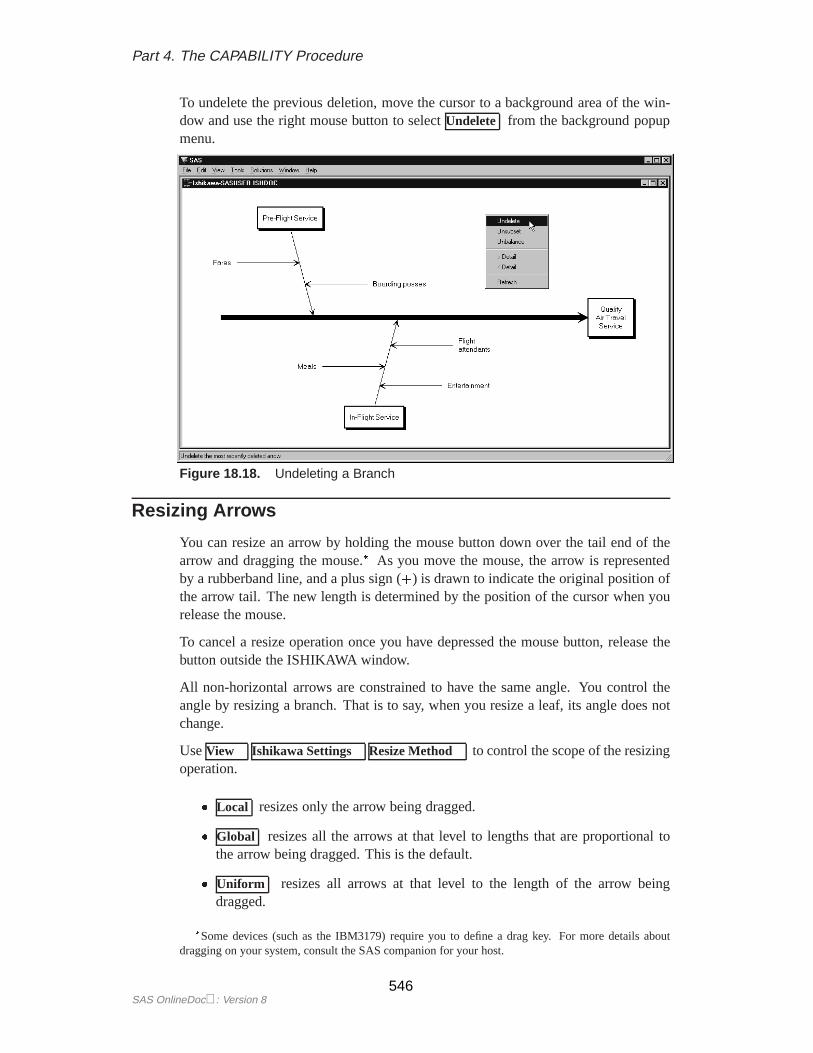
To undelete the previous deletion, move the cursor to a background area of the win-dow and use the right mouse button to selectUndelete from the background popupmenu.
Figure 18.18. Undeleting a Branch
Resizing Arrows
You can resize an arrow by holding the mouse button down over the tail end of thearrow and dragging the mouse.� As you move the mouse, the arrow is representedby a rubberband line, and a plus sign (+) is drawn to indicate the original position ofthe arrow tail. The new length is determined by the position of the cursor when yourelease the mouse.
To cancel a resize operation once you have depressed the mouse button, release thebutton outside the ISHIKAWA window.
All non-horizontal arrows are constrained to have the same angle. You control theangle by resizing a branch. That is to say, when you resize a leaf, its angle does notchange.
UseView . Ishikawa Settings. Resize Method. to control the scope of the resizingoperation.
� Local resizes only the arrow being dragged.
� Global resizes all the arrows at that level to lengths that are proportional tothe arrow being dragged. This is the default.
� Uniform resizes all arrows at that level to the length of the arrow beingdragged.
�Some devices (such as the IBM3179) require you to define a drag key. For more details aboutdragging on your system, consult the SAS companion for your host.
SAS OnlineDoc: Version 8546

Chapter 18. Operations
When you resize an arrow, you also update the default size for all new arrows at thatlevel.
By default, global and uniform resizing applies to all the arrows at the level of thearrow being resized. To restrict resizing to a specific subset of arrows, you can subsetthem as follows:
� Move the cursor over the arrow head of an arrow to subset that arrow and allits descendants.
� Move the cursor over the arrow tail of an arrow to subset only that arrow (andnot its descendants).
� Use the right mouse button to activate the popup menu.
� SelectSubset .
On some hosts, shift-clicking on the arrow head or tail also subsets an arrow.
Subsetted arrows are indicated by underlined labels. Subsetting is a toggle operation,so tounsubsetan arrow, repeat the preceding steps.
To unsubset all the arrows in the diagram, do the following:
� Move the cursor to a background area of the window.
� Use the right mouse button to activate the background popup menu.
� SelectUnsubset .
Be sure to remove all subsets after you have finished modifying the diagram, sinceremaining subsets can alter the focus of other operations.
See “Modifying Arrow Colors and Line Styles” on page 572, for more examples ofhow subsets are used.
547SAS OnlineDoc: Version 8

Part 4. The CAPABILITY Procedure
ExampleArrows that are too long can cause clipping and collisions, as illustrated in the fol-lowing diagram:
Figure 18.19. Before Resizing the Diagram
To resize the stems in the upper half of the diagram, proceed as follows:
� Subset the branch forPre-Flight Serviceby moving the cursor over its arrowhead and selectingSubset .
� Do the same toPost-Flight Service.
� Shorten one of the subsetted stems by dragging its tail to the desired length.
� Remove all subsets by selectingUnsubset .
SAS OnlineDoc: Version 8548
Chapter 18. Operations
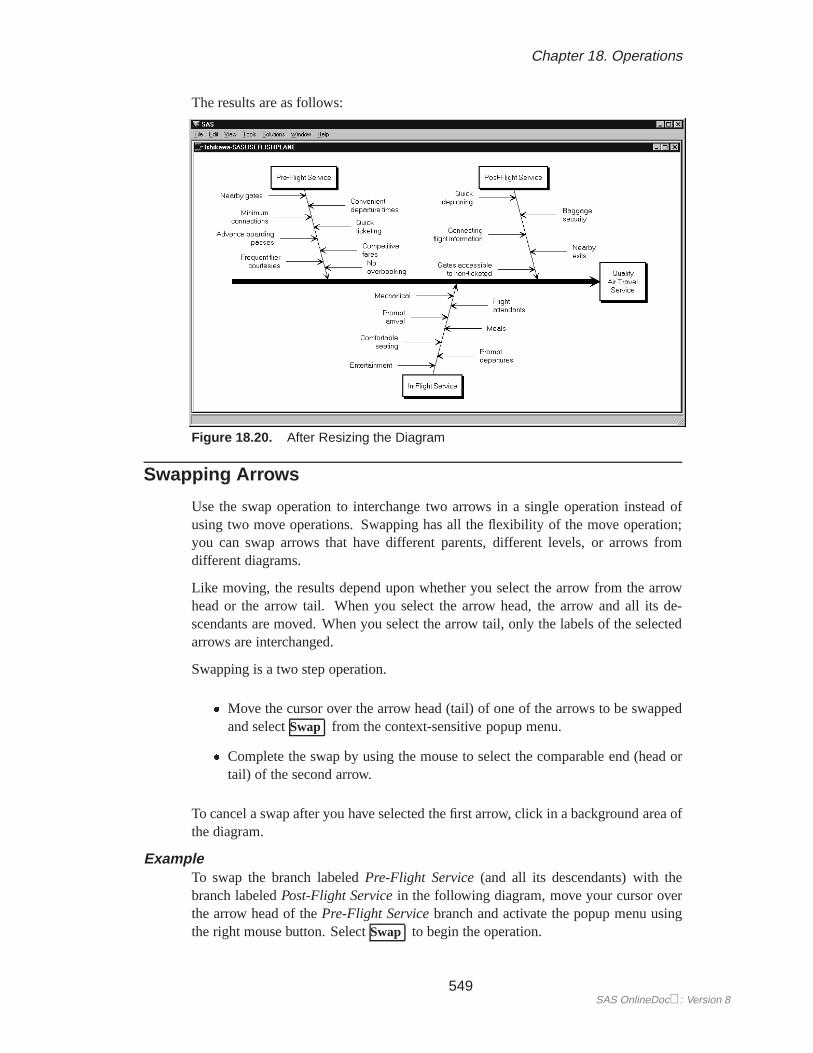
The results are as follows:
Figure 18.20. After Resizing the Diagram
Swapping Arrows
Use the swap operation to interchange two arrows in a single operation instead ofusing two move operations. Swapping has all the flexibility of the move operation;you can swap arrows that have different parents, different levels, or arrows fromdifferent diagrams.
Like moving, the results depend upon whether you select the arrow from the arrowhead or the arrow tail. When you select the arrow head, the arrow and all its de-scendants are moved. When you select the arrow tail, only the labels of the selectedarrows are interchanged.
Swapping is a two step operation.
� Move the cursor over the arrow head (tail) of one of the arrows to be swappedand selectSwap from the context-sensitive popup menu.
� Complete the swap by using the mouse to select the comparable end (head ortail) of the second arrow.
To cancel a swap after you have selected the first arrow, click in a background area ofthe diagram.
ExampleTo swap the branch labeledPre-Flight Service(and all its descendants) with thebranch labeledPost-Flight Servicein the following diagram, move your cursor overthe arrow head of thePre-Flight Servicebranch and activate the popup menu usingthe right mouse button. SelectSwap to begin the operation.
549SAS OnlineDoc: Version 8

Part 4. The CAPABILITY Procedure
Figure 18.21. Swapping Two Arrows
To complete the swap, select the arrow head of thePost-Flight Servicebranch.
Figure 18.22. Swapping Two Arrows (continued)
SAS OnlineDoc: Version 8550

Chapter 18. Operations
The completed diagram illustrates how the swap operation simplifies interchangingtwo arrows.
Figure 18.23. Completing a Swap
An alternative to swapping the arrows is to move them. However, moving arrows inthis situation requires more steps and tends to be more cumbersome than swapping.
Balancing Arrows
An Ishikawa diagram is said to bebalancedif the sub-arrows attached to each arroware equally spaced.
To balance the immediate descendants of an arrowand all its descendants, proceedas follows:
� Move the cursor over the arrow head.
� Activate the popup menu using the right mouse button.
� SelectBalance .
To balance only the immediate descendants of an arrow, selectBalance from thepopup menu for the arrow tail.
You can restore the arrows to their original positions by doing the following:
� Activate the background popup menu using the right mouse button.
� SelectUnbalance .
551SAS OnlineDoc: Version 8

Part 4. The CAPABILITY Procedure
The ISHIKAWA environment provides three alternative methods for balancing ar-rows. Select one of the following choices from theView . Ishikawa Setting.Balance Method. menu:
� Preserve order/sides maintains the order and directions of the sub-arrows butrepositions them so they are evenly spaced.
� Preserve order/alternate sides maintains the ordering of the arrows but reposi-tions adjacent arrows so that they appear on opposite sides. This is the default.
� Preserve sides maintains the side on which the sub-arrows are attached thenspaces each side of the arrow independently.
ExampleConsider the following unbalanced diagram:
Figure 18.24. An Unbalanced Ishikawa Diagram
SAS OnlineDoc: Version 8552
Chapter 18. Operations
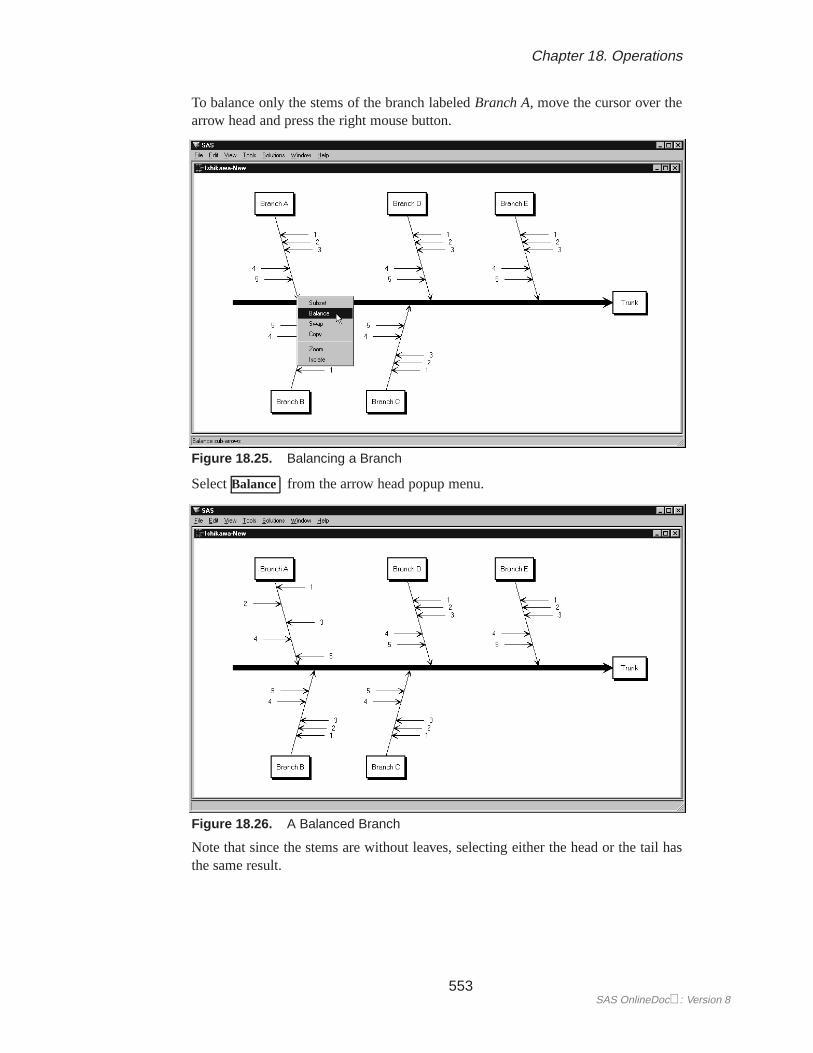
To balance only the stems of the branch labeledBranch A, move the cursor over thearrow head and press the right mouse button.
Figure 18.25. Balancing a Branch
SelectBalance from the arrow head popup menu.
Figure 18.26. A Balanced Branch
Note that since the stems are without leaves, selecting either the head or the tail hasthe same result.
553SAS OnlineDoc: Version 8

Part 4. The CAPABILITY Procedure
To balance only the five major branches in the preceding diagram without affectingtheir stems, move the cursor to the tail end of the trunk and selectBalance from thepopup menu.
Figure 18.27. Balancing Only the Branches
To balance the entire diagram (from head to tail, so to speak), move the cursor to thehead of the trunk and selectBalance from the popup menu.
Figure 18.28. Balancing the Entire Diagram
Note that the balancing method used here not only changes the spacing of the stemsbut reflects them as needed to achieve a balanced appearance. You can control thisby specifying a balancing method, as illustrated by the next example.
SAS OnlineDoc: Version 8554
Chapter 18. Operations
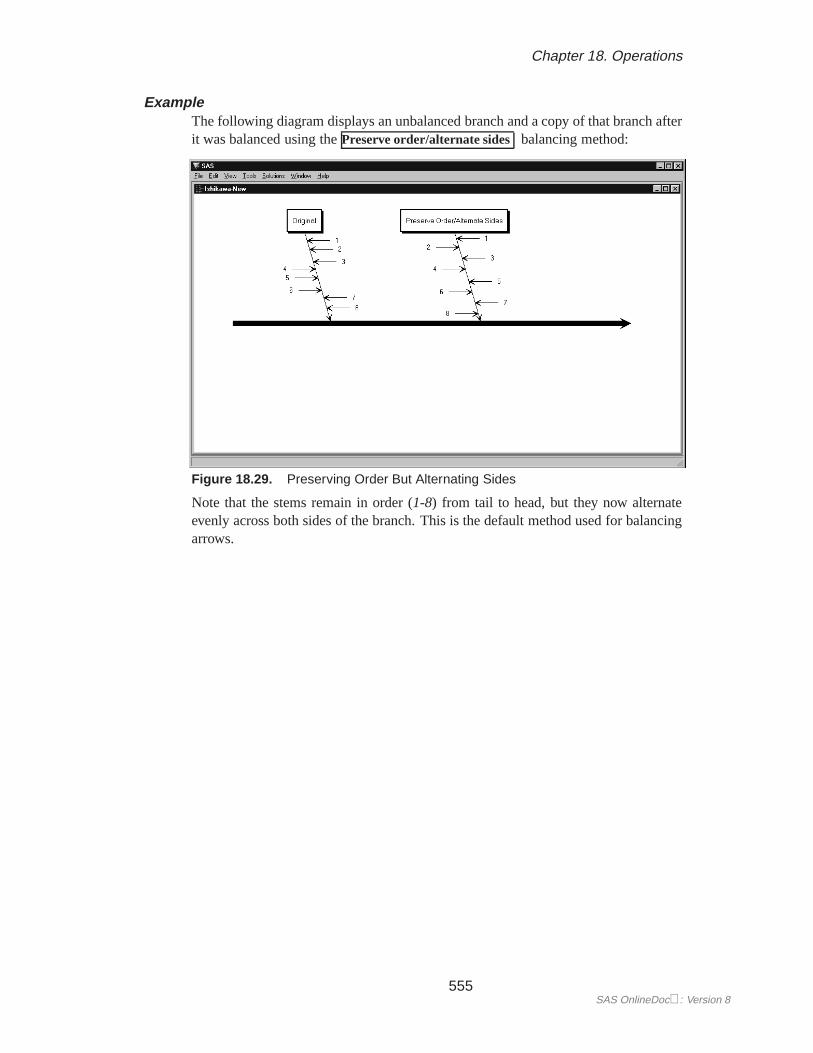
ExampleThe following diagram displays an unbalanced branch and a copy of that branch afterit was balanced using thePreserve order/alternate sides balancing method:
Figure 18.29. Preserving Order But Alternating Sides
Note that the stems remain in order (1-8) from tail to head, but they now alternateevenly across both sides of the branch. This is the default method used for balancingarrows.
555SAS OnlineDoc: Version 8
Part 4. The CAPABILITY Procedure
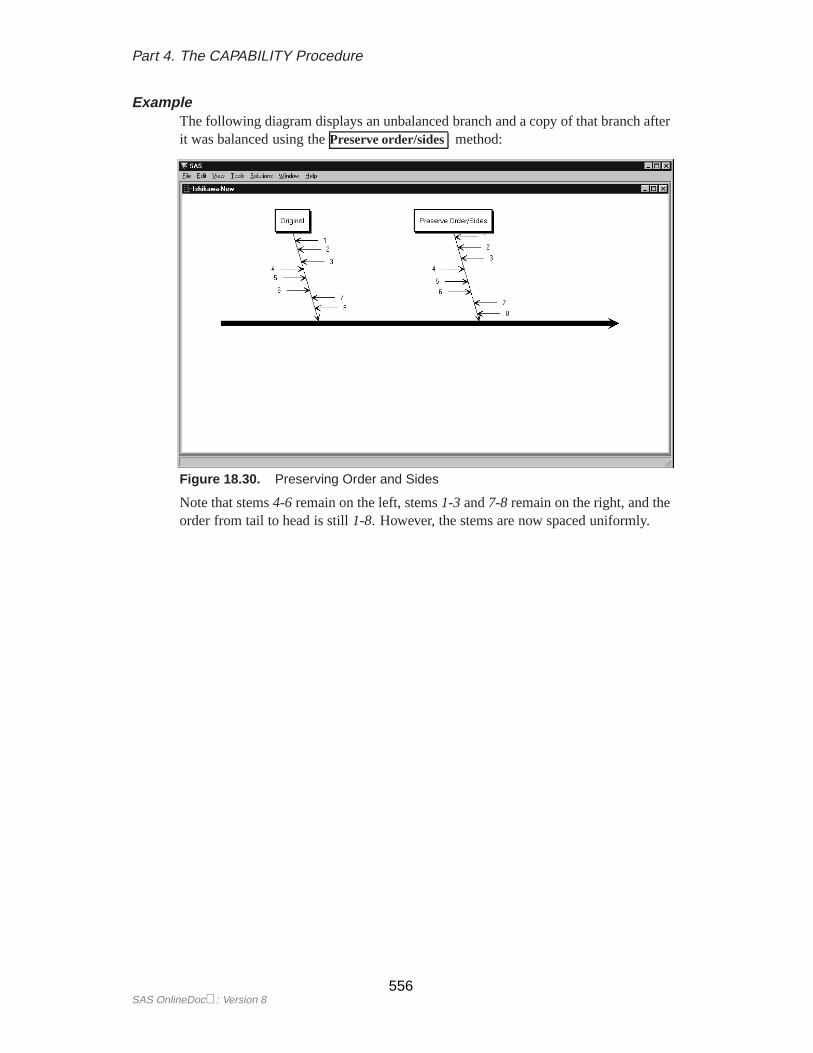
ExampleThe following diagram displays an unbalanced branch and a copy of that branch afterit was balanced using thePreserve order/sides method:
Figure 18.30. Preserving Order and Sides
Note that stems4-6 remain on the left, stems1-3and7-8 remain on the right, and theorder from tail to head is still1-8. However, the stems are now spaced uniformly.
SAS OnlineDoc: Version 8556

Chapter 18. Operations
ExampleThe following diagram displays an unbalanced branch and a copy of that branch afterit was balanced using thePreserve sides balancing method:
Figure 18.31. Preserving Sides
Note that the stems on the left (4-6) are spaced uniformly, and the stems on the right(1-3 and7-8) are spaced uniformly. The two sides are spaced independently of eachother.
Notepads
Ishikawa (1982) and Kume (1985) advocate the display of quantitative informationwith the arrows in an Ishikawa diagram.
In the ISHIKAWA environment, you can useNotepadwindows to record or displayinformation associated with each arrow. To open the Notepad window, move thecursor over the arrow tail and double click.
Figure 18.32. Ishikawa Notepad
Notes are limited to four lines of text with no more than 40 characters per line.
When you save your Ishikawa diagram, your notes are saved with the SAS data set.
557SAS OnlineDoc: Version 8

Part 4. The CAPABILITY Procedure
Later, when you retrieve your diagram, all the notes are restored.
You must close theNotepadwindow before you continue working in the ISHIKAWAenvironment.
ExampleIn the following figure, double clicking on thePrompt arrival stem reveals detailsabout prompt arrival times:
Figure 18.33. Using Notepads to Organize Details
Managing Complexity
A major advantage of the ISHIKAWA environment is that you can quickly organizea highly complex diagram. However, not everyone may be interested in seeing all thedetails—at least initially.
To increase the level of detail by one level, do the following:
� Move the cursor to a background area of the window, and use the right mousebutton to activate the background popup menu.
� Select> Detail . On some hosts, you can press the> key instead of using thepopup menu (as long as you are not editing text).
Each time you select> Detail from the background popup menu, the detail increasesby one level.
To reverse the process and decrease the level of detail, select< Detail from thepopup menu, or press the< key.
SAS OnlineDoc: Version 8558
Chapter 18. Operations
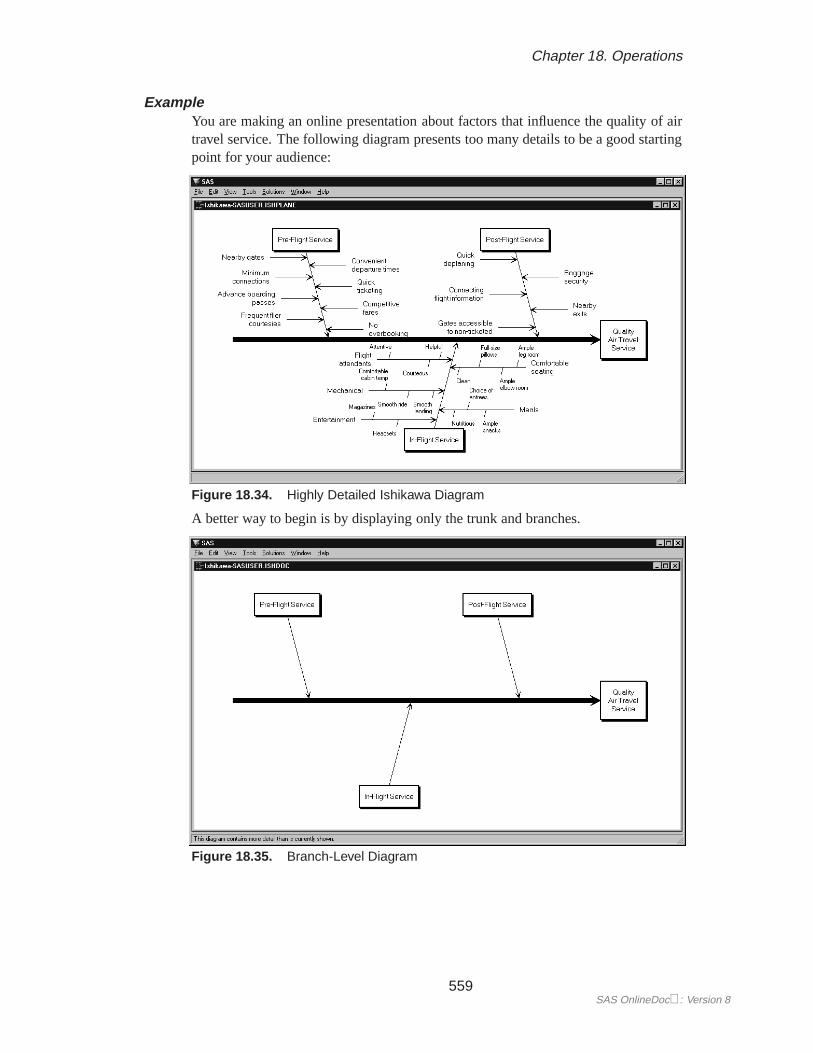
ExampleYou are making an online presentation about factors that influence the quality of airtravel service. The following diagram presents too many details to be a good startingpoint for your audience:
Figure 18.34. Highly Detailed Ishikawa Diagram
A better way to begin is by displaying only the trunk and branches.
Figure 18.35. Branch-Level Diagram
559SAS OnlineDoc: Version 8

Part 4. The CAPABILITY Procedure
Then, at the next stage of your presentation, dynamically foliate the branches withstems, as follows:
Figure 18.36. Increasing the Level of Detail
The amount of detail is increased by one level.
Figure 18.37. Increasing the Level of Detail
SAS OnlineDoc: Version 8560

Chapter 18. Operations
Zooming Arrows
A second method for managing a highly detailed Ishikawa diagram is to work witha subsection of the diagram in a separate window. The window and the sub-arrowsinside it can be resized independently of the parent window. In all other respects, theinformation in the two diagrams is linked dynamically. Changes in one window (forinstance, moving, adding, and editing arrows) are reflected in the other window.
To zoom an arrow, proceed as follows:
� Move the cursor over the arrow head.
� Activate the popup menu using the right mouse button.
� SelectZoom .
To return orunzoom, selectFile . Close .
You can have up to four windows open at one time.
To reduce the amount of window management, you can specify that zoomed diagramsare to be displayed in the current window rather than in new windows by settingZoom Window to Current in the View . Ishikawa Settings. Other... dialog.
ExampleThe following figure shows a branch labeledIn-Flight Serviceafter it has beenzoomed into a new window:
Figure 18.38. Zooming a Branch
561SAS OnlineDoc: Version 8
Part 4. The CAPABILITY Procedure
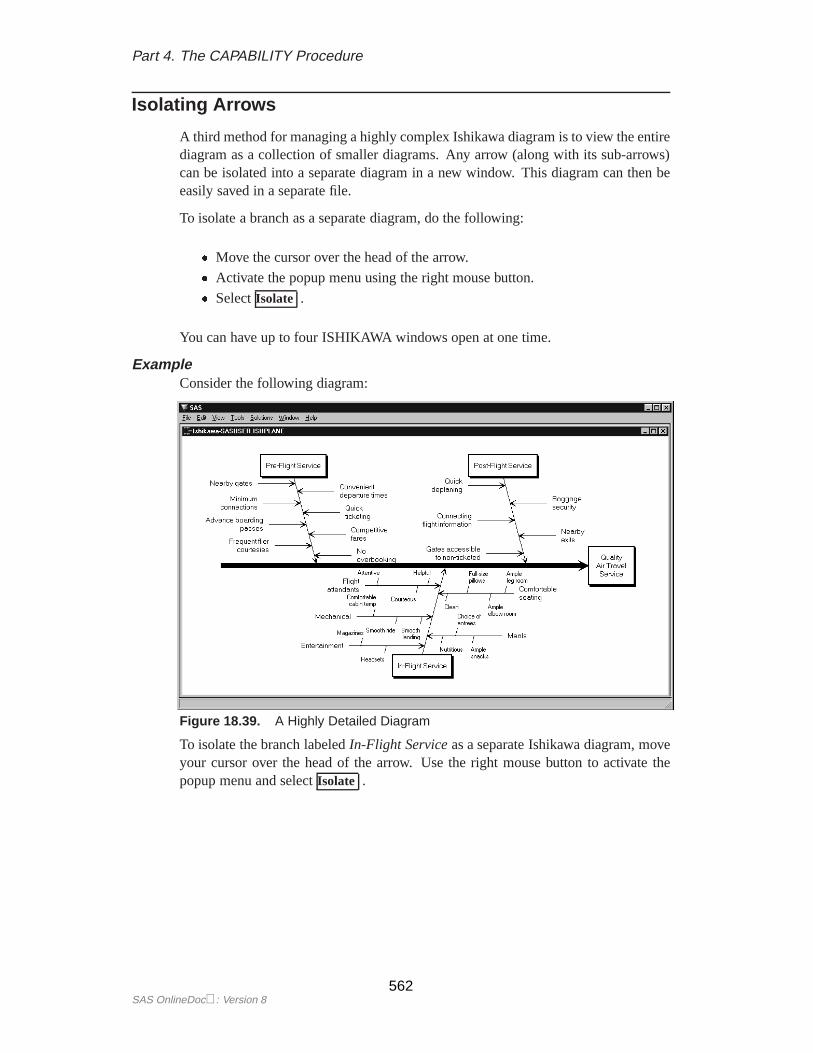
Isolating Arrows
A third method for managing a highly complex Ishikawa diagram is to view the entirediagram as a collection of smaller diagrams. Any arrow (along with its sub-arrows)can be isolated into a separate diagram in a new window. This diagram can then beeasily saved in a separate file.
To isolate a branch as a separate diagram, do the following:
� Move the cursor over the head of the arrow.
� Activate the popup menu using the right mouse button.
� SelectIsolate .
You can have up to four ISHIKAWA windows open at one time.
ExampleConsider the following diagram:
Figure 18.39. A Highly Detailed Diagram
To isolate the branch labeledIn-Flight Serviceas a separate Ishikawa diagram, moveyour cursor over the head of the arrow. Use the right mouse button to activate thepopup menu and selectIsolate .
SAS OnlineDoc: Version 8562

Chapter 18. Operations
The following figure shows the main diagram in one window and the branch labeledIn-Flight Serviceafter it has been isolated to another window:
Figure 18.40. Promoting a Branch into a New Diagram
To return to the original diagram, selectFile . Close .
Merging Diagrams
You can combine multiple Ishikawa diagrams into amasterdiagram by using themerge operation. To merge a stored diagram into the current diagram, proceed asfollows:
� SelectFile . Merge .
� Specify the name of a SAS data set that contains a saved Ishikawa diagram.
Another way to combine diagrams is to open separate ISHIKAWA windows for eachsub-diagram then copy them into the master diagram. To copy all or part of anIshikawa diagram from one window to another, do the following:
� Move the cursor over the head of the arrow.
� Activate the popup menu using the right mouse button.
� SelectCopy .
� Position the cursor slightly to one side of the new attachment point and click(just as though you are adding a new arrow).
563SAS OnlineDoc: Version 8

Part 4. The CAPABILITY Procedure
ExampleSuppose you want to create the following diagram by combining information fromdiagrams already created by each of the major service areas (Pre-Flight, In-Flight,and Post-Flight) and stored in different SAS data sets:
Figure 18.41. A Completed Master Diagram
First, use the ISHIKAWA environment to create the trunk for the new master diagram.
Figure 18.42. Starting a Master Diagram
SAS OnlineDoc: Version 8564

Chapter 18. Operations
SelectFile . Merge from the command bar to open the File Requestor dialog.
Figure 18.43. Member Selector
Specify the name of the data set forPre-flight servicesand pressOpen .
Now click on a point along the trunk where this sub-diagram is to attach.
Figure 18.44. Constructing a Master Diagram
To complete the diagram, repeat the process for the remaining branches.
565SAS OnlineDoc: Version 8

Part 4. The CAPABILITY Procedure
Creating Graphics Output Using SAS/GRAPH Software
One way to create a hard copy of your Ishikawa diagram is to send it to a graphicsdevice using SAS/GRAPH software. To do this, you should submit a GOPTIONSstatement to direct the graphics output to the appropriate location and control the out-put formatbefore you invoke the ISHIKAWA environment. For example, the followingGOPTIONS statement directs the output to a PostScript device:
goptions target=psl noprompt;
If you do not specify a target device before invoking the ISHIKAWA environment,you will be prompted for one before the graph is generated.
In the ISHIKAWA environment, when you are ready to route your out-put to a hard copy device, selectFile . Save as. Graph . This opensa dialog that enables you to customize various aspects of your graph.
Figure 18.45. Hard Copy Requestor
To save the diagram to the default graphics catalog in the WORK library(WORK.GSEG), simply pressOK and close the dialog. The default membername is ISHIKAWA.
To save the diagram to a different graphics catalog, selectSave... and then use theMember selector window to specify a library, a SAS catalog, and a member name.
When sending a diagram directly to an output device, you can ignore the membername entirely.
To save to your own graphics catalog, selectSave... and then use the Save a memberselection window to specify a catalog and data set name. Simply selectOK whenyou want to save your diagram to the default graphics catalog (WORK.GSEG). Whensending a diagram directly to an output device, you can useOK .
You must specify two SAS/GRAPH fonts for drawing the labels in the hard copy ofthe diagram. The hardware fonts used in the ISHIKAWA environment cannot be usedfor your hard copy. Theprimary font and size are used for the first three levels of text.Thesecondaryfont and size are used for the remaining levels of text.
To change fonts, enter a valid SAS/GRAPH font name in the font field or click on thebutton to the right of the font field to display a font requestor dialog. The default fontis SIMPLEX.
SAS OnlineDoc: Version 8566

Chapter 18. Operations
You can specify the height of the text directly in the height field (in screen percentunits), or you can click on the button to the right of the field to request anabsoluteheight or arelativeheight.
Figure 18.46. Font Height Selector
SelectAbsolute when you want the font height in the output to be the same heightas the font height used in the ISHIKAWA environment even if the output windowand the ISHIKAWA window differ in size. SelectRelative to maintain the samefont height to window size proportion in both the ISHIKAWA window and the outputwindow. The numeric value entered in the height field after either choice is a screenpercent unit. The default text height isabsolute.
Use the� Fill Text Boxes and� Draw Shadow check boxes to suppress the box fillsand box shadows from the output. They cannot be used toadd these features to thehard copy if they were not present in the ISHIKAWA window.
Use the� Use background color check box to indicate whether the background colorfrom the ISHIKAWA environment is used in the output. This option is useful whenyou are sending your diagram to acolor device and you want the background in yourhard copy to match that of your ISHIKAWA environment.
Use the� Switch Black and White check box to interchange black and white whenthe diagram is sent to the output device. This option is useful when you send yourdiagram from a white-on-black display to a black-on-white hard copy device.
Click on OK to generate the hard copy output or click onCancel to quit.
567SAS OnlineDoc: Version 8
Part 4. The CAPABILITY Procedure
Creating Bitmap Graphics Output
A second way to create a hard copy of your Ishikawa diagram is to export it as abitmap to one of the following:
� the host graphical clipboard� an external bitmap file� a SAS/GRAPH Image catalog entry
To copy the Ishikawa diagram as a bitmap to the host clipboard, selectEdit . Copy. The results are host specific. For more details about copying to the host clipboardon your system, consult the SAS companion for your host.
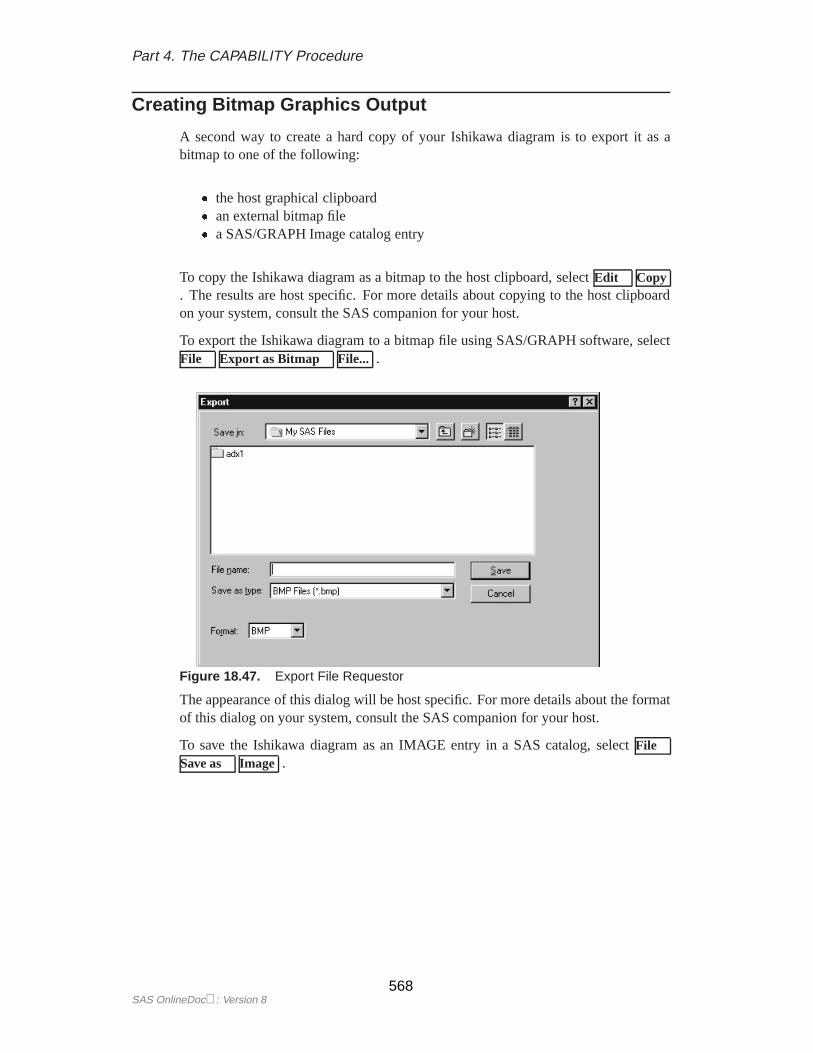
To export the Ishikawa diagram to a bitmap file using SAS/GRAPH software, selectFile . Export as Bitmap . File... .
Figure 18.47. Export File Requestor
The appearance of this dialog will be host specific. For more details about the formatof this dialog on your system, consult the SAS companion for your host.
To save the Ishikawa diagram as an IMAGE entry in a SAS catalog, selectFile .Save as. Image .
SAS OnlineDoc: Version 8568

Chapter 18. Operations
Figure 18.48. Entry Selector
You must specify a SAS catalog in which to save the IMAGE entry as well as a namefor the object.
When exporting your diagram to a bitmap or saving to a SAS/GRAPH IMAGE entry,you can have the colors mapped so that color diagrams are saved in black on white orwhite on black. You do not have to make those changes to the diagram yourself. UseFile . Export as Bitmap . Customize... to display the following dialog:
Figure 18.49. Customize Export Dialog
Select� Black on white to convert the output to a black diagram on a white back-ground. This is useful when the diagram is being exported to a document.
Select�White on black to convert the output to a white diagram on a black back-ground. This is useful when the diagram is being exported for display on a black andwhite terminal.
569SAS OnlineDoc: Version 8

Part 4. The CAPABILITY Procedure
Modifying Fonts
By default, the ISHIKAWA environment uses the same hardware font as the SASDisplay Manager. However, you have the option of specifying two different fontstyles/sizes.
Theprimary font is used for labeling arrows in the first three levels of the diagram.The secondaryfont is used for labeling arrows in the remaining levels. You willtypically use a smaller font in the detailed (secondary) areas of the diagram.
To change a font, selectView . Ishikawa Settings. Primary Fonts... or View .
Ishikawa Settings. Secondary Fonts... to display the Font Requestor window, asfollows:
Figure 18.50. Font Requestor
The layout of the Font requestor window is host specific. Typically, it will contain alist of available fonts and sizes displayed in a scrollable region. Refer to your hostdocumentation for specific information regarding the format of this dialog.
To change fonts, select a font from the list.
You must close the Font Requestor window before you can proceed. SelectOK toapply the font orCancel to cancel the dialog.
To customize your session so that these fonts are permanently associated with theISHIKAWA environment, selectView . Save Attributes from the command bar.
SAS OnlineDoc: Version 8570

Chapter 18. Operations
Modifying Box Colors
By default, the box fill (background) color is empty and the shadow (outline) color isthe same as the arrow color.
To modify the colors associated with trunk and branch boxes, selectView .
Ishikawa Settings. Colors... . A dialog, similar to the following, is displayed:
Figure 18.51. Colors Dialog
To change the fill color of all the boxes� in the Ishikawa diagram, do the following:
� Select a color from the color palette.
� SelectInfill .
Once modified, the fill color is unaffected by changes in the arrow color. To returnthe box to an empty fill, proceed as follows:
� Select the current infill color from the color palette (if it is not already thecurrent color).
� SelectInfill .
To change the shadow color of the boxes, selectShadow and follow the same proce-dure.
SelectOK to close the dialog orCancel to cancel the changes.
�You cannot directly modify the colors of individual boxes from this dialog.
571SAS OnlineDoc: Version 8

Part 4. The CAPABILITY Procedure
Modifying Arrow Colors and Line Styles
The ISHIKAWA environment provides a line style palette and a color palette that youcan use to customize the arrows in your Ishikawa diagram. SelectView . Palettesto activate both palettes.�
Figure 18.52. Line Style and Color Palettes
To specify the arrows to which color and line selections apply, subset them with thesubset function. To toggle an arrow in or out of the list of subsetted arrows, do thefollowing:
� Use the right mouse button to display the arrow head or the arrow tail popupmenu. To subset an arrow and all its descendants, use the arrow head popupmenu. Use the arrow tail popup menu to subset an arrow without any descen-dants.
� SelectSubset .
The labels of all subsetted arrows are underlined.
On some hosts, shift-clicking on the arrow head or tail will also subset the arrow. Youcan subset any combination of arrows in the diagram.
You can change the color of all the subsetted arrows by selecting the desired color inthe color palette with the mouse. Likewise, use the line palette to control the styleand width of the arrows.
�If you are working on a black-and-white terminal, you should not use the color palette.
SAS OnlineDoc: Version 8572

Chapter 18. Operations
To unsubset all the arrows in the diagram, do the following:
� Move the cursor to abackgroundarea of the ISHIKAWA window.
� Use the right mouse button to activate the background popup menu.
� SelectUnsubset from the popup menu.
To unsubset a specific arrow in the diagram, selectSubset from the context-sensitivepopup menu for the arrow head or tail.
Be sure to remove all subsets once you have finished modifying the diagram, sincesubsets affect the focus of many other operations.
ExampleContinuing with the diagram from the previous section, subset the trunk using thearrow tail popup menu.
Figure 18.53. Subsetting Only the Trunk
573SAS OnlineDoc: Version 8

Part 4. The CAPABILITY Procedure
Note that only the trunk is subsetted (as indicated by the underlined label).
Figure 18.54. Subsetting Only the Trunk (continued)
When you select a line style from the line palette, only the line style of the subsettedarrow is changed.
Figure 18.55. Modified Diagram
SAS OnlineDoc: Version 8574

Chapter 18. Operations
Alternately, if you subset the trunk using the arrow head popup menu, all of thearrows in the diagram are subsetted.
Figure 18.56. Subsetting the Entire Diagram
Note that all of the labels in the diagram are now underlined.
Figure 18.57. Subsetting the Entire Diagram (continued)
575SAS OnlineDoc: Version 8
Part 4. The CAPABILITY Procedure
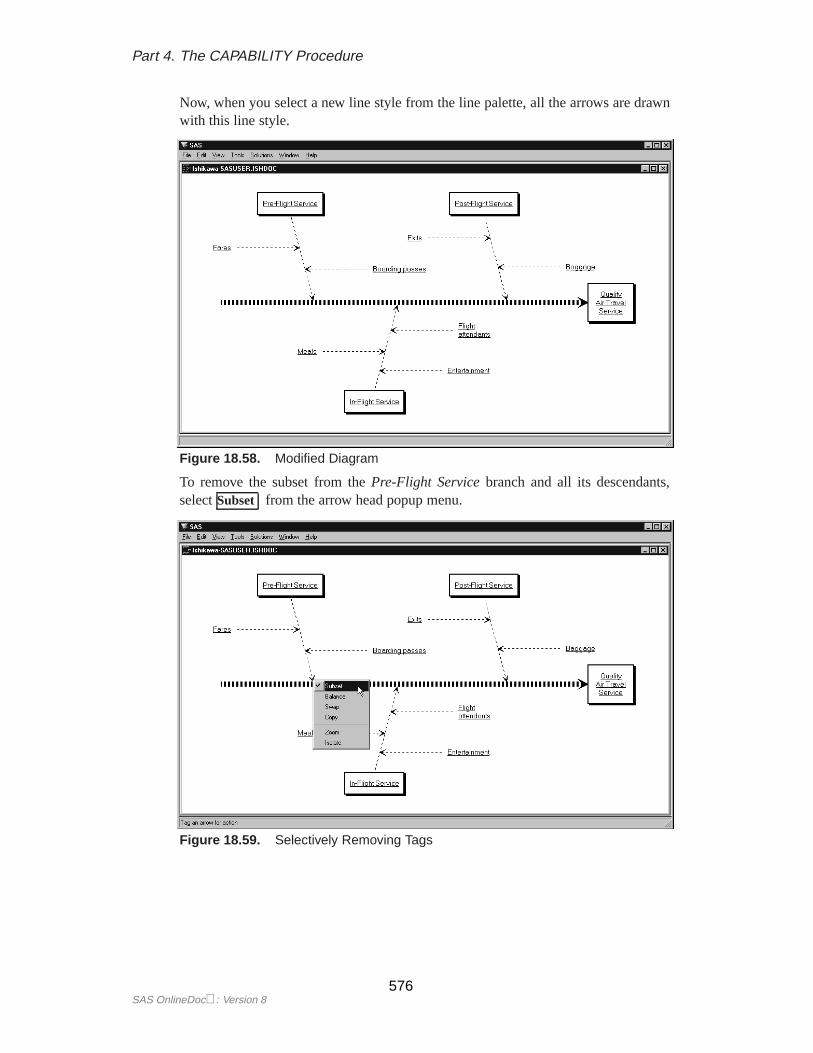
Now, when you select a new line style from the line palette, all the arrows are drawnwith this line style.
Figure 18.58. Modified Diagram
To remove the subset from thePre-Flight Servicebranch and all its descendants,selectSubset from the arrow head popup menu.
Figure 18.59. Selectively Removing Tags
SAS OnlineDoc: Version 8576
Chapter 18. Operations
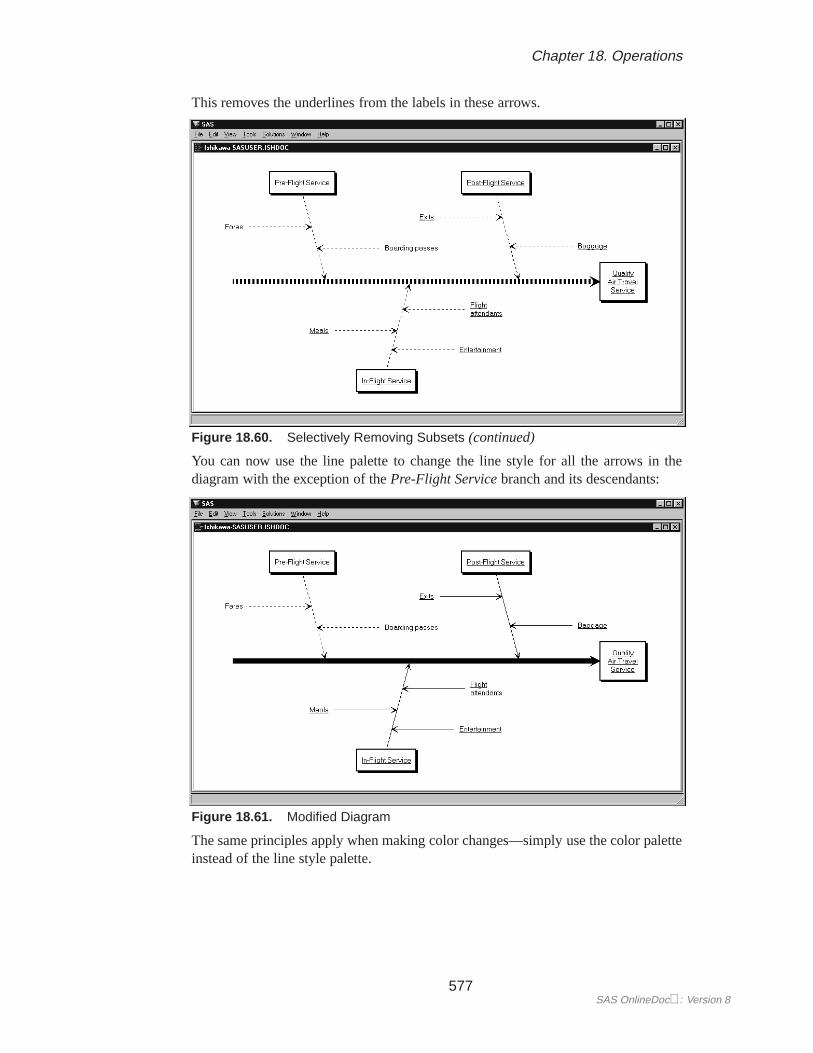
This removes the underlines from the labels in these arrows.
Figure 18.60. Selectively Removing Subsets (continued)
You can now use the line palette to change the line style for all the arrows in thediagram with the exception of thePre-Flight Servicebranch and its descendants:
Figure 18.61. Modified Diagram
The same principles apply when making color changes—simply use the color paletteinstead of the line style palette.
577SAS OnlineDoc: Version 8

Part 4. The CAPABILITY Procedure
Modifying Text Colors
By default, labels have the same color as the arrow. To modify the text color in-dependently of the arrow color, selectView . Ishhikawa Settings. Colors... . TheCustomize Color window, similar to the following, will open:
Figure 18.62. Colors Dialog
To change the text color of all the arrows� in the Ishikawa diagram, do the following:
� Select a color from the color palette.
� SelectText .
Once modified, the text color is unaffected by changes to the arrow color. To relinkthe text color to the arrow color, do the following:
� Select the current text color from the color palette (if it is not already the currentcolor).
� SelectText .
SelectOK to close the dialog window. To cancel the changes, selectCancel .
�You cannot directly modify the text color for individual arrows from this dialog.
SAS OnlineDoc: Version 8578
Chapter 18. Operations
Modifying Arrow Heads
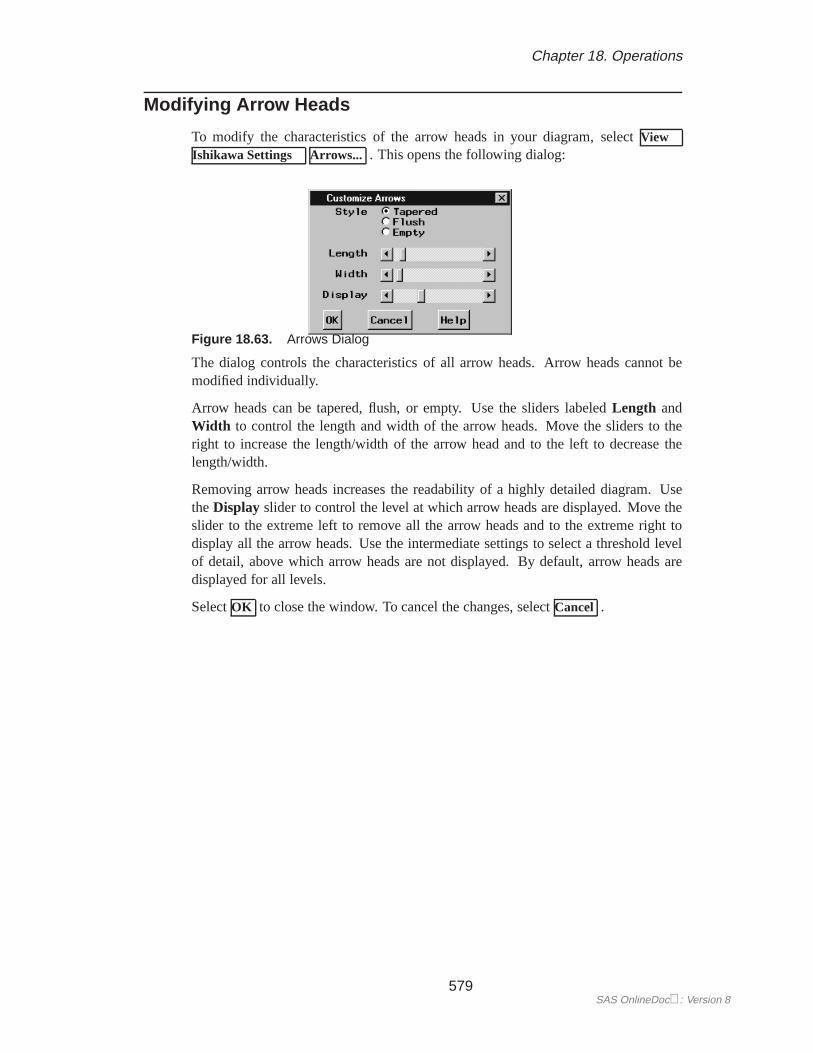
To modify the characteristics of the arrow heads in your diagram, selectView .
Ishikawa Settings. Arrows... . This opens the following dialog:
Figure 18.63. Arrows Dialog
The dialog controls the characteristics of all arrow heads. Arrow heads cannot bemodified individually.
Arrow heads can be tapered, flush, or empty. Use the sliders labeledLength andWidth to control the length and width of the arrow heads. Move the sliders to theright to increase the length/width of the arrow head and to the left to decrease thelength/width.
Removing arrow heads increases the readability of a highly detailed diagram. UsetheDisplay slider to control the level at which arrow heads are displayed. Move theslider to the extreme left to remove all the arrow heads and to the extreme right todisplay all the arrow heads. Use the intermediate settings to select a threshold levelof detail, above which arrow heads are not displayed. By default, arrow heads aredisplayed for all levels.
SelectOK to close the window. To cancel the changes, selectCancel .
579SAS OnlineDoc: Version 8

Part 4. The CAPABILITY Procedure
Modifying Environmental Attributes
You can modify other features of the ISHIKAWA environment such as zooming,mouse sensitivity, and shadow attributes by selectingView . Ishikawa Settings.Other... to open the following dialog:
Figure 18.64. Others Dialog
Zoom Window controls whether the zoom operation opens a new window or draws inthe current window. Select� Current to reduce the amount of window managementrequired.
TheShadow Typebutton controls the type of shadow that is drawn around the trunkand branch boxes.
� � Bevel 1 draws a beveled edge box with a lower-right light source.
� � Bevel 2 draws a beveled edge box with an upper-left light source.
� � Drop draws a box with a drop shadow. This is the default.
� � None suppresses the shadow.
TheShadow Width slider controls the shadow width if the boxes have shadows orthe outline width when boxes are displayed without shadows. Move the slider to theright to increase the shadow width and to the left to decrease the width.
TheAdd Sensitivity slider controls how closely you must position the cursor to anexisting arrow before a mouse click results in an add arrow operation. Move the sliderto the right to increase the size of the context-sensitive area and to the left to reducethe size of the context-sensitive area.
TheSelect Sensitivityslider controls how closely you must position the cursor to anexisting arrow before a mouse click results in an edit, delete, move, or popup arrowoperation. Operate this slider in the same manner as theAdd Sensitivity slider.
SAS OnlineDoc: Version 8580

Chapter 18. Operations
Saving an Ishikawa Diagram for Future Editing
You must save your Ishikawa diagram as a SAS data set if you intend to edit it inthe future with the ISHIKAWA environment. The ISHIKAWA environment doesnot reconstruct Ishikawa diagrams by reading graphics entries (GRSEG) from SAScatalogs.
SelectFile . Save As. Data Set to activate the Data Set Requestor window.
Figure 18.65. Output File Requestor
A list of SAS librefs is displayed in the Libraries tree in the left region of the dialog.Begin by selecting a libref from the list. A libref refers to a permanent SAS datalibrary located on your host system. For example, the default SASUSER libref (onmost hosts) points to a directory called SASUSER, located under the working direc-tory of your current SAS session. Any data sets saved with the librefSASUSERwillbe saved in that directory.
To direct your SAS data sets to a different directory, select theCreate new librarytool icon to open the New Library dialog. Use this dialog to specify the directory andassign a libref to that directory.
To select the librefSASUSER, move your cursor over that entry in the list and click.The region to the right of the Libraries tree is used to display any existing SAS datasets in that library.
To save your diagram in an existing SAS data set, use the mouse to click on an entryin the list. Themember namefield will be updated to reflect your choice. If you wantto save your diagram in a new SAS data set, move your cursor to themember namefield and type the new name (in this example, SERVICE).
SelectSave to save the diagram and return to the ISHIKAWA environment or selectCancel to cancel the save.
581SAS OnlineDoc: Version 8

Part 4. The CAPABILITY Procedure
Reading an Existing Ishikawa Diagram
To enter the ISHIKAWA environment and resume editing an existing diagram, youmust have previously saved the diagram as a SAS data set. The ISHIKAWA environ-mentdoes notallow you to modify graphs stored in SAS/GRAPH catalogs.
You can specify the name of this data set when you establish the ISHIKAWA envi-ronment with the following statements:
proc ishikawa data=libref.dataset;run;
Alternatively, the ISHIKAWA environment will prompt you for a data set after youinvoke the environment with the following statements:
proc ishikawa;run;
When you specify a data set in the PROC statement, the ISHIKAWA environment isinitialized and your diagram is displayed up to the branch level. The message areawill indicate if any additional detail is hidden. You can edit your diagram even ifsome of the diagram is hidden. To add or remove detail one level at a time, select> Detail or < Detail from the background popup menu.
When you do not specify a data set in the PROC statement, you will see the followingmenu:
Figure 18.66. Initial Menu
SAS OnlineDoc: Version 8582

Chapter 18. Operations
Since you are editing an existing diagram rather than starting a new diagram, selectEdit an Existing Diagram to activate the Member Selector window.
figheadishinput2Input Member Selector
Use the Member Selector window to specify an input SAS data set. For informationon how to specify the SAS data set name, follow the steps outlined in “Saving anIshikawa Diagram for Future Editing” on page 581.
To establish the ISHIKAWA environment and display the diagram you have selected,selectOpen . The diagram is displayed up to the branch level.
To quit or start a new diagram, return to the main menu by selectingCancel .
583SAS OnlineDoc: Version 8

Part 4. The CAPABILITY Procedure
Displaying Multiple Ishikawa Diagrams
The ISHIKAWA environment enables you to view multiple Ishikawa diagrams si-multaneously for side-by-side comparisons of different diagrams. You can also usethis feature to transfer information between diagrams, since the move and copy oper-ations function across windows. You can have up to four ISHIKAWA windows openat one time.
To open a window for another Ishikawa diagram, selectFile . Open . This willdisplay the Member Selector window, which you can use to specify the name of theinput SAS data set for the other Ishikawa diagram.
You can also start new diagrams while displaying other Ishikawa diagrams. To open awindow for a new Ishikawa diagram, selectFile . New . This opens an ISHIKAWAwindow with a template for a new diagram.
ExampleThe following figure shows an Ishikawa diagram forQuality Air Travel Serviceafteran initial brainstorming session:
Figure 18.67. Single Ishikawa Diagram
SAS OnlineDoc: Version 8584

Chapter 18. Operations
The current diagram and another Ishikawa diagram can be viewed simultaneously byselectingFile . Open from the command bar.
Figure 18.68. Opening a Second Diagram
In this situation, displaying both diagrams concurrently emphasizes the improvedunderstanding of the process. It also enables you to transfer information from onediagram to another.
Figure 18.69. Viewing Multiple Ishikawa Diagrams
585SAS OnlineDoc: Version 8

Part 4. The CAPABILITY Procedure
Input and Output Data Sets
ISHIKAWA Procedure
The following is a complete list of the variables in output SAS data sets created bythe ISHIKAWA environment:
Variable Type Len Description----------------------------------------------------
_LEVEL_ Num 8 Level of detail_TEXT1_ Char 40 First line of label_TEXT2_ Char 40 Second line of label_TEXT3_ Char 40 Third line of label_TEXT4_ Char 40 Fourth line of label_TEXT5_ Char 40 Fifth line of label_NOTE1_ Char 40 First line of note_NOTE2_ Char 40 Second line of note_NOTE3_ Char 40 Third line of note_NOTE4_ Char 40 Fourth line of note_RELPOS_ Num 8 Relative arrow position_SIDE_ Char 1 Side arrow attaches to parent_ANGLE_ Num 8 Angle (non-horizontal arrows)_LWIDTH_ Num 8 Line width_LSTYLE_ Num 8 Line style_LCOLOR_ Char 8 Line color_TCOLOR_ Char 8 Text color_ICOLOR_ Char 8 Box infill color_SCOLOR_ Char 8 Shadow color_STYPE_ Char 1 Shadow type_SWIDTH_ Num 8 Shadow width_RELLNG_ Num 8 Relative length of an arrow_HLEVEL_ Num 8 Arrow head threshold_HSTYLE_ Num 8 Arrow head style_HLNGTH_ Num 8 Arrow head length_HWIDTH_ Num 8 Arrow head width_HTEXT_ Num 8 Font height_FTEXT_ Char 8 Font
SAS OnlineDoc: Version 8586

Chapter 18. Input and Output Data Sets
Only the variables–LEVEL– and–TEXT1– are required in the input data set forthe ISHIKAWA procedure. Each observation in the input data set corresponds to aparticular arrow in the diagram. The order of the observations is critical because itdefines the relationships of the arrows.
� The trunk is always the first observation.
� The remaining observations are ordered so that leaves are nested within stems,stems are nested within branches, and branches are nested within the trunk.
� The variable–LEVEL– is numeric and indicates the level within the diagram.The trunk has a level of 0, branches have a level of 1, stems have a level of 2,and so on.
� The first line of text in a label is stored as–TEXT1–, the second as–TEXT2–,and so on.
ExampleThe following is a partial listing of the SAS data set used to create the Ishikawadiagram shown in Figure 18.4 on page 536:
The SAS System
Obs _level_ _text1_ _text2_ _text3_
1 0 Quality Air Travel Service2 1 Pre-Flight Service3 2 Competitive fares4 2 Convenient departure times5 2 Quick ticketing6 2 Frequent flier courtesies7 1 In-Flight Service8 2 Prompt departures9 2 Comfortable seating
Figure 18.70. Input SAS Data Set
Note the structure of this data set:
� The trunk (always the first observation) has a–LEVEL– value of zero.
� All subsequent observations for which–LEVEL– is equal to one are branchesthat emerge from the trunk.
� Observations 4 and 5 are both leaves that emerge from the preceding stem(observation 3).
� Likewise, leaves 7 and 8 emerge from the preceding stem (observation 6).
You can use this data set as a way of extracting text and notepad information fromthe diagram.
587SAS OnlineDoc: Version 8

Part 4. The CAPABILITY Procedure
Syntax
There are only three options that can be specified in the PROC ISHIKAWA statement,since the ISHIKAWA procedure is primarily a user-driven procedure.
DATA=SAS-data-setidentifies the name of a SAS data set that specifies an existing Ishikawa diagram. Bydefault, the procedure will prompt you to edit an existing Ishikawa diagram or starta new one. When you specify the DATA= option, the procedure bypasses this initialmenu. For example, the following statements simplify editing an existing Ishikawadiagram saved in a SAS data set:
proc ishikawa data=work.airline;run;
NEWstarts a new Ishikawa diagram. By default, the procedure will prompt you to edit anexisting Ishikawa diagram or start a new one. When you specify the NEW option, theprocedure bypasses this initial menu and starts with a new diagram. Do not specifyany other options when using the NEW option. For example, the following statementssimplify starting a new Ishikawa diagram:
proc ishikawa new;run;
NOFSallows you to create hard copies of Ishikawa diagrams saved as SAS data sets withoutinvoking the interactive features of the procedure. You must specify the DATA=option when you use the NOFS option. For example, the following statements createa hard copy of the Ishikawa diagram saved in the SAS data setwork.airline:
goptions dev=psl noprompt;proc ishikawa data=work.airline nofs;
run;
SAS OnlineDoc: Version 8588

Chapter 18. Examples
Examples
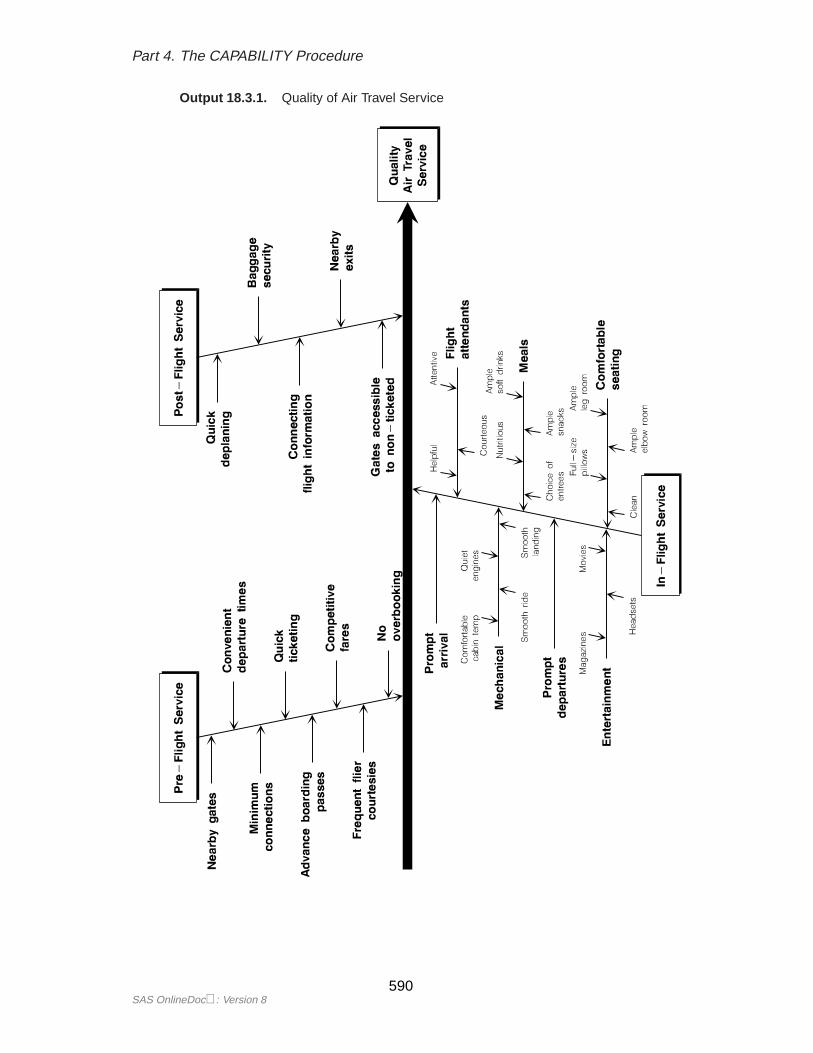
Example 18.1. Quality of Air Travel Service
Output 18.1.1 on page 590 illustrates factors affecting the quality of air travel service.See ISHPLANEin the SAS/QCSample Library
Example 18.2. Integrated Circuit Failures
Output 18.2.1 on page 591 illustrates common sources of failure in integrated cir-See ISHCHIPin the SAS/QCSample Library
cuits.
Example 18.3. Photographic Development Process
Output 18.3.1 on page 592 depicts the various stages of the photographic develop-See ISHPHOTOin the SAS/QCSample Library
ment process and specific quality control points.
589SAS OnlineDoc: Version 8
Part 4. The CAPABILITY Procedure
Output 18.3.1. Quality of Air Travel Service
SAS OnlineDoc: Version 8590

Chapter 18. Examples
Output 18.3.2. Common Causes of Integrated Circuit Failure
591SAS OnlineDoc: Version 8

Part 4. The CAPABILITY Procedure
Output 18.3.3. Photographic Development Process
SAS OnlineDoc: Version 8592

The correct bibliographic citation for this manual is as follows: SAS Institute Inc.,SAS/QC ® User’s Guide, Version 8, Cary, NC: SAS Institute Inc., 1999. 1994 pp.
SAS/QC® User’s Guide, Version 8Copyright © 1999 SAS Institute Inc., Cary, NC, USA.ISBN 1–58025–493–4All rights reserved. Printed in the United States of America. No part of this publicationmay be reproduced, stored in a retrieval system, or transmitted, by any form or by anymeans, electronic, mechanical, photocopying, or otherwise, without the prior writtenpermission of the publisher, SAS Institute Inc.U.S. Government Restricted Rights Notice. Use, duplication, or disclosure of thesoftware by the government is subject to restrictions as set forth in FAR 52.227–19Commercial Computer Software-Restricted Rights (June 1987).SAS Institute Inc., SAS Campus Drive, Cary, North Carolina 27513.1st printing, October 1999SAS® and all other SAS Institute Inc. product or service names are registered trademarksor trademarks of SAS Institute in the USA and other countries.® indicates USAregistration.IBM®, ACF/VTAM®, AIX®, APPN®, MVS/ESA®, OS/2®, OS/390®, VM/ESA®, and VTAM®
are registered trademarks or trademarks of International Business Machines Corporation.® indicates USA registration.Other brand and product names are registered trademarks or trademarks of theirrespective companies.The Institute is a private company devoted to the support and further development of itssoftware and related services.