detecting white matter alterations in multiple sclerosis
TRANSCRIPT

Detecting white matter alterations in multiple sclerosis using advanced diffusion magnetic resonance imaging
https://www.ncbi.nlm.nih.gov/pmc/articles/PMC6262996/?report=printable[7/17/2019 1:14:51 PM]
Neural Regen Res. 2019 Jan; 14(1): 114–123.doi: 10.4103/1673-5374.243716: 10.4103/1673-5374.243716
PMCID: PMC6262996PMID: 30531085
Detecting white matter alterations in multiple sclerosis usingadvanced diffusion magnetic resonance imagingSourajit M. Mustafi, Jaroslaw Harezlak, Chandana Kodiweera, Jennifer S. Randolph, James C. Ford,Heather A. Wishart, and Yu-Chien Wu, PhD, DABMP
Department of Radiology and Imaging Sciences, Indiana University School of Medicine, Indianapolis, IN, USADepartment of Epidemiology and Biostatistics, School of Public Health, Indiana University, Bloomington, IN, USADepartment of Psychological and Brain Sciences and Dartmouth Brain Imaging Center, Dartmouth College, Hanover,
NH, USADepartment of Psychiatry, Geisel School of Medicine at Dartmouth, Lebanon, NH, USACorrespondence to: Yu-Chien Wu, [email protected].
Author contributions: Study concept: YCW and HAW; study design and protocol writing: YCW and HAW; data
collection: SMM, CK, and JCF; statistical analysis: JH and JSR; manuscript writing: SMM and YCW; manuscript editing:
JSR, JCF, HAW, and YCW. All authors approved the final version of this paper.
Received 2018 Aug 28; Accepted 2018 Jun 4.
Copyright : © Neural Regeneration Research
This is an open access journal, and articles are distributed under the terms of the Creative Commons Attribution-NonCommercial-ShareAlike 4.0 License, which allows others to remix, tweak, and build upon the work non-commercially,as long as appropriate credit is given and the new creations are licensed under the identical terms.
AbstractMultiple sclerosis is a neurodegenerative and inflammatory disease, a hallmark of which is demyelinatinglesions in the white matter. We hypothesized that alterations in white matter microstructures can be non-invasively characterized by advanced diffusion magnetic resonance imaging. Seven diffusion metrics wereextracted from hybrid diffusion imaging acquisitions via classic diffusion tensor imaging, neurite orientationdispersion and density imaging, and q-space imaging. We investigated the sensitivity of the diffusionmetrics in 36 sets of regions of interest in the brain white matter of six female patients (age 52.8 ± 4.3 years)with multiple sclerosis. Each region of interest set included a conventional T2-defined lesion, a matchedperilesion area, and normal-appearing white matter. Six patients with multiple sclerosis (n = 5) or clinicallyisolated syndrome (n = 1) at a mild to moderate disability level were recruited. The patients exhibitedmicrostructural alterations from normal-appearing white matter transitioning to perilesion areas and lesions,consistent with decreased tissue restriction, decreased axonal density, and increased classic diffusion tensorimaging diffusivity. The findings suggest that diffusion compartment modeling and q-space analysisappeared to be sensitive for detecting subtle microstructural alterations between perilesion areas and
1 2 3 4 4
4 1,3,*
1
2
3
4
*

Detecting white matter alterations in multiple sclerosis using advanced diffusion magnetic resonance imaging
https://www.ncbi.nlm.nih.gov/pmc/articles/PMC6262996/?report=printable[7/17/2019 1:14:51 PM]
normal-appearing white matter.
Keywords: multiple sclerosis, hybrid diffusion imaging, NODDI, diffusion tensor imaging, q-space imaging
Chinese Library Classification No. R445; R742
IntroductionMultiple Sclerosis (MS) is a chronic inflammatory and neurodegenerative disease, characterized bywidespread central nervous system damage that includes demyelinating white matter (WM) lesions andchanges in normal-appearing white matter (NAWM) and gray matter. Conventional magnetic resonanceimaging, including T2-weighted fluid-attenuated inversion recovery (T2-FLAIR) and pre- and post-contrastT1-weighted imaging, aids in establishing the diagnosis of MS and monitoring disease progression in a safe,noninvasive manner (Filippi and Rocca, 2007; Polman et al., 2011). These forms of conventional MRI,however, provide limited information regarding the underlying microstructural changes in MS. Themechanisms of the observed alterations in T2-FLAIR maps may be elucidated by diffusion magneticresonance imaging (dMRI) approaches, which allow for probing human brain microstructure by measuringwater diffusion properties influenced by the biologic activity of the surrounding tissues. Thus, advancedmicrostructural imaging biomarkers are potentially more sensitive to MS-specific microstructural changesthan conventional T1- or T2-weighted imaging.
Among dMRI techniques, diffusion tensor imaging (DTI) is most widely used to study MS. DTI-derivedparameters are well established to differ in patients with MS compared to controls (Filippi et al., 2000,2001; Rovaris and Filippi, 2007; Warlop et al., 2009; Liu et al., 2012; Bester et al., 2013; Bodini et al.,2013; Harrison et al., 2013; Sbardella et al., 2013; Vishwas et al., 2013; Banaszek et al., 2015; Rocca et al.,2016; Schneider et al., 2017). DTI, however, has inherent limitations. First, DTI uses a simplified mono-Gaussian diffusion model that limits the technique to the approximation of a single fiber at each voxel; thus,DTI-derived indices may be biased in WM tracts that contain crossing fibers (Wheeler-Kingshott andCercignani, 2009; Kodiweera et al., 2016). Second, DTI is a second-order approximation of the complexdiffusion function that comprises a mixture of diffusion compartments.
The finer granularity of diffusion compartments can be assessed using higher-order diffusion modeling.Diffusion signals in WM tissue are modeled with different approaches: fast and slow diffusion components(Clark and Le Bihan, 2000); anisotropic hindered and restricted compartments (Jespersen et al., 2010;Fieremans et al., 2011; De Santis et al., 2013); fast isotropic free water and anisotropic tissue compartments(Pasternak et al., 2009); three compartments of fast isotropic diffusion, slow restricted isotropic diffusion,and restricted anisotropic diffusion (Chiang et al., 2014); and three compartments of fast isotropic diffusion(e.g., CSF), anisotropic hindered diffusion (e.g., extracellular water), and highly restricted anisotropicdiffusion (e.g., intra-axonal compartments) (Zhang et al., 2012). The output parameters from diffusionmodeling are potentially less ambiguous than those of DTI for characterizing diffusion-weightedmicrostructures with increased specificity in clinical studies of the human brain.
Herein, we performed a feasibility study using one of the three-compartment models, neurite orientationdispersion and density imaging (NODDI). The NODDI axonal density index in WM was almost identical tothe values obtained from electron microscopy of ex vivo mouse brain and is in good agreement withpreviously reported fiber densities of human brain using electron microscopy (Sepehrband et al., 2015); andthe neurite density index in gray matter correlates with tau pathology in an animal model of Alzheimer’s

Detecting white matter alterations in multiple sclerosis using advanced diffusion magnetic resonance imaging
https://www.ncbi.nlm.nih.gov/pmc/articles/PMC6262996/?report=printable[7/17/2019 1:14:51 PM]
disease (Colgan et al., 2015). The NODDI model was validated in ex vivo spinal cord with MS pathology ina study concluding that the NODDI-derived diffusion metrics match their histologic counterparts (Grussu etal., 2017). Other NODDI applications include in vivo human studies of MS (Schneider et al., 2017), classicgalactosemia (Timmers et al., 2015), neonatal encephalopathy (Lally et al., 2014), WM development in thenewborn (Kunz et al., 2014), brain aging (Billiet et al., 2015; Nazeri et al., 2015; Kodiweera et al., 2016),and mild traumatic brain injury (Mustafi et al., 2016), and has yielded valuable microstructural informationon neurologic disorders of the human brain.
Alternatively, microstructural changes in WM may be studied by a non-parametric analysis, q-spaceimaging. The q-space approach estimates the water diffusion function, the probability density function(PDF), also called mean apparent propagator (MAP) (Ozarslan et al., 2013) or ensemble average propagator(EAP) (Descoteaux et al., 2011; Hosseinbor et al., 2013), through a Fourier transform relationship(Callaghan, 1991): P ( , Δ)=FT [E ( )], where P is PDF; is the displacement vector; Δ is the diffusiontime; E is the normalized q-space signal; and is the q-space wavevector determined by the diffusiongradient strength ( ) and the duration (δ), =γ δ. The zero displacement probability, P , is the return to
origin probability (P = P ( = 0, Δ)), and represents the probability of those water molecules having no netdiffusion within the diffusion time Δ. P is often interpreted as a measure of restricted diffusion andcellularity (Assaf et al., 2000; Wu and Alexander, 2007; Ozarslan et al., 2013). In animal studies ofdysmyelination, P exhibited high sensitivity to myelination and brain maturation (Biton et al., 2006; Wu etal., 2011), consistent with other studies of P in demyelination of the human brain with MS (Assaf et al.,2002, 2005). These studies show decreased P associated with myelin-deficient WM and NAWM in MS.
In the present study, we used hybrid diffusion imaging (HYDI) (Wu and Alexander, 2007), a flexible andversatile dMRI technique, to acquire multishell diffusion data in patients with MS and clinically isolatedsyndrome (first episode of neurologic symptoms consistent with MS). The HYDI approach convenientlyenables complementary data-processing strategies, such as model-fitting and non-parametric analyses, usingone diffusion dataset. Here, the microstructural changes were characterized by the above-mentioned dMRImetrics in MS lesions, perilesion areas (hereafter referred to as perilesions), and NAWM. Statisticalcomparisons between types of tissues were performed for individual sets of regions of interest (ROIs)including a lesion, a matched perilesion, and NAWM (36 sets), and also at the group level.
Participants and Methods
Participants
Six female patients (age 52.8 ± 4.3 years), diagnosed and classified according to internationally acceptedcriteria (Kurtzke, 1983; Polman et al., 2011), participated in this observational study from Dartmouth-Hitchcock Medical Center (Table 1). Four had relapsing-remitting MS, one had secondary progressive MS,and one had clinically isolated syndrome. Neurologic disability level, measured using the ExpandedDisability Status Scale (EDSS) (Kurtzke, 1983), was mild to moderate, with scores ranging from 1.5 to 3.5(out of 10). All of the participants were at least 1 month post-exacerbation and post-steroid therapy, and hadhad no change in disease-modifying therapy within the preceding month. Patients with other neurologicdisorders or a current substance use disorder were excluded from the study. All participants providedinformed consent approved by the guidelines of the institutional review board of the Geisel School ofMedicine at Dartmouth on October 17, 2013 (No. 11482) and all procedures were in accordance with an
–1 Δ
0
00
00
0

Detecting white matter alterations in multiple sclerosis using advanced diffusion magnetic resonance imaging
https://www.ncbi.nlm.nih.gov/pmc/articles/PMC6262996/?report=printable[7/17/2019 1:14:51 PM]
institutional review board-approved study plan.
Image acquisition
Images were acquired using a Philips 3T Achieva scanner (Cleveland, OH, USA) with an 8-channel headcoil. T1-weighted images were acquired using a 3D magnetization-prepared rapid gradient echo (MPRAGE)sequence with echo time (TE) = 3.3 ms, repetition time (TR) = 6.8 ms, field of view (FOV) = 240 mm,voxel size = 1.2 × 1 × 1 mm, and 140 sagittal slices. Two-dimensional axial T2-FLAIR scans were obtainedwith: inversion time = 2800 ms, TE/TR = 125/11,000 ms, FOV = 240 mm, in-plane resolution of 0.94 mm,and 44 slices with a 3-mm slice thickness. The HYDI sequence used single-shot spin-echo echo-planarimaging (SS SE EPI) with five diffusion-weighting b-value shells (b = 250, 1000, 2250, 4000, and 6250s/mm ) and 143 diffusion-weighting gradient directions (Table 2). HYDI MR parameters were: TE/TR =114.24/3590 ms, diffusion gradient duration (δ) = 46 ms and separation (Δ) = 58.4 ms, 2-mm in-planeresolution, 40 axial slices with 3-mm slice thickness, and a parallel imaging SENSE factor of 2. The totalscan time for HYDI was 24 minutes.
HYDI data analyses
Pre-processing
All the diffusion data were visually inspected for severe scanner-related artifacts or motion artifacts prior toentering the pre-processing pipeline. The HYDI data pre-processing pipeline included denoising with a localprincipal component analysis approach (Manjon et al., 2013) and eddy current and motion corrections usingthe eddy_correct tool from the diffusion processing toolbox in the FMRIB Software Library (FSL)(https://fsl.fmrib.ox.ac.uk/fsl/fslwiki) (Jenkinson et al., 2002). All of the images, including T1-weighted andT2-FLAIR images, were transformed to the diffusion space where the b image (i.e., the first image inHYDI with zero diffusion weighting) served as a common reference. Linear registration was performed toalign the T1-weighted and T2-FLAIR images with the b image using the FLIRT toolbox in FSL with sevenparameters, including six rigid-body parameters and one global rescaling parameter. The same b image wasalso used as the reference image in FSL eddy_correct for registering the remaining diffusion-weightedimages.
DTI
DTI indices, including axial diffusivity (AD), radial diffusivity (RD), mean diffusivity (MD), and fractionalanisotropy (FA), were computed using inner HYDI shells with b-values of 0, 250, and 1000 s/mm (Table 2). The DTI analysis used the dtifit command in the FSL software package (Behrens et al., 2003). AD is themajor eigenvalue of the diffusion tensor; RD is defined as the mean of the medium and minor eigenvaluesof the diffusion tensor; MD is the mean of the three eigenvalues; and FA is the normalized variation of thethree eigenvalues (Basser et al., 1994).
NODDI
NODDI metrics were computed with the whole HYDI dataset. The NODDI formalism describes thedetectable normalized diffusion signal A = V A + (1 – V ) [V A + V A ] (Figure 1), where Vand V are the volume fractions of fast isotropic diffusion of CSF and intracellular water, respectively. Theextracellular volume fraction is V = (1–V ), a complementary value to V (Zhang et al., 2012). The
2
0
00
2
iso iso iso ic ic ec ec isoic
ec ic ic

Detecting white matter alterations in multiple sclerosis using advanced diffusion magnetic resonance imaging
https://www.ncbi.nlm.nih.gov/pmc/articles/PMC6262996/?report=printable[7/17/2019 1:14:51 PM]
symbols A , A , and A represent the signal contributions from the fast isotropic diffusion (e.g., CSF),intracellular (intra-axonal), and extracellular (extra-axonal) compartments, respectively. Using the Watsondistribution, NODDI analysis also provides an estimate of the orientation dispersion index (ODI) describingan averaged dispersion of axons within an imaging voxel in WM. NODDI metrics were computed on avoxel-by-voxel basis with nonlinear fits coded in a MATLAB toolbox provided by the MicrostructureImaging Group at University College London (http://mig.cs.ucl.ac.uk/index.php?n=Tutorial.NODDIMATLAB). For NODDI fitting, the initial conditions for isotropic free-water diffusivityand the intrinsic diffusivity of the neural tissue were set to 3 × 10 mm /s and 1.7 × 10 mm /s,respectively, as suggested previously (Zhang et al., 2012).
q-Space analyses
P was computed using the whole HYDI data set with a q-space analysis approach using in-houseMATLAB code (Wu and Alexander, 2007; Wu et al., 2008). Table 3 summarizes the diffusion metrics’acronyms, units, intensity ranges, and microstructural implications.
ROI
A whole-brain WM mask was segmented using the FSL FAST toolbox on subject’s co-registered T1-weighted MPRAGE images in the diffusion space (see Pre-processing). This WM mask may or may notcontain lesions, which will eventually be excluded by the lesion masks described below. For each subject,within the WM, three ROI types were selected. Lesion (red in Figure 2): T2-FLAIR hyperintense lesionswere segmented using an in-house semi-automated approach (Wishart et al., 2010). All segmented WMlesions were used in this study while gray matter lesions were excluded. Perilesion (blue in Figure 2):Perilesions were WM voxels that surrounded the lesions with a thickness of one voxel. Similar to (Colasantiet al., 2014), the perilesion WM voxels were generated by intersecting dilated lesion masks and the WMmask. NAWM (green in Figure 2): NAWM were WM voxels surrounding the perilesions, but with a gap ofat least one voxel from the perilesion. Similarly, the NAWM ROIs were also generated using the dilationapproach. As demonstrated in Figure 2, a set of ROIs includes a lesion (red), a matched perilesion (blue),and NAWM (green); in this case, there were six sets identified for Patient no. 4. All ROIs were threedimensional and extended across several slices depending on their sizes.
Statistical analyses
For each ROI, the means and standard deviations were computed for eight MRI measures: T2-FLAIRintensity and the seven diffusion metrics. Image data were assessed for outliers using boxplots and excludedif the values were outside the median ± 1.5 interquartile range (IQR). At the individual lesion level: For eachset of ROIs, pairwise comparisons were performed between the lesion, matched perilesion, and NAWM,followed by multiple-comparison adjustment (across MRI measures and ROI sets). A false discovery rate(FDR) of less than 5% (i.e., q-value < 0.05) was considered significant. For each MRI measure and eachcomparison pair, the number of significant ROI sets was summarized as a percentage relative to the totalnumber of sets detected in the participants. At the group level: Means of each ROI were collected accordingto the type of ROI (i.e., lesion, perilesion, and NAWM). The means of means and standard deviations ofmeans were compared for each type of ROI by analysis of variance (ANOVA). Because T2-FLAIRintensity is not a quantitative measure, it was only included in the comparisons at the individual ROI levelwithin individual subjects, and not in the group level analyses. Mauchly’s test of sphericity (Mauchly, 1940)was calculated for each ANOVA, and when the test indicated a violation of sphericity, the Greenhouse-
iso ic ec
–3 2 –3 2
0
Detecting white matter alterations in multiple sclerosis using advanced diffusion magnetic resonance imaging
https://www.ncbi.nlm.nih.gov/pmc/articles/PMC6262996/?report=printable[7/17/2019 1:14:51 PM]
Geisser adjustment was applied. Given the number of ANOVAs utilized in our analysis, we appliedBonferroni’s adjustment for multiple comparisons, yielding a critical (P) threshold of 0.007 (0.05/7diffusion indices). For ANOVAs with a significant overall result, additional post hoc pairwise testingcomparing between the three ROI types (i.e., lesion, perilesion, and NAWM) was conducted, withBonferroni’s adjustment applied for three pairwise comparisons with a critical P = 0.017 (0.05/3 pairs). Allanalyses were performed using IBM SPSS Statistics, version 23 (IBM, Armonk, NY, USA).
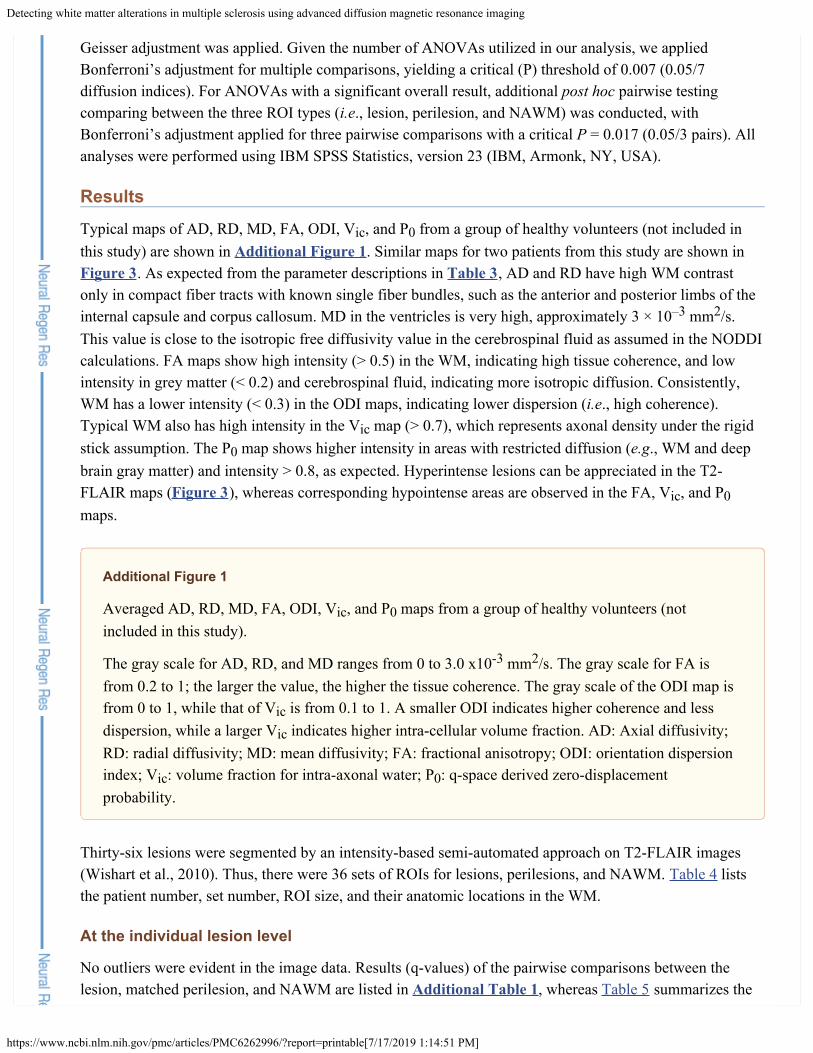
ResultsTypical maps of AD, RD, MD, FA, ODI, V , and P from a group of healthy volunteers (not included inthis study) are shown in Additional Figure 1. Similar maps for two patients from this study are shown in Figure 3. As expected from the parameter descriptions in Table 3, AD and RD have high WM contrastonly in compact fiber tracts with known single fiber bundles, such as the anterior and posterior limbs of theinternal capsule and corpus callosum. MD in the ventricles is very high, approximately 3 × 10 mm /s.This value is close to the isotropic free diffusivity value in the cerebrospinal fluid as assumed in the NODDIcalculations. FA maps show high intensity (> 0.5) in the WM, indicating high tissue coherence, and lowintensity in grey matter (< 0.2) and cerebrospinal fluid, indicating more isotropic diffusion. Consistently,WM has a lower intensity (< 0.3) in the ODI maps, indicating lower dispersion (i.e., high coherence).Typical WM also has high intensity in the V map (> 0.7), which represents axonal density under the rigidstick assumption. The P map shows higher intensity in areas with restricted diffusion (e.g., WM and deepbrain gray matter) and intensity > 0.8, as expected. Hyperintense lesions can be appreciated in the T2-FLAIR maps (Figure 3), whereas corresponding hypointense areas are observed in the FA, V , and Pmaps.
Additional Figure 1
Averaged AD, RD, MD, FA, ODI, V , and P maps from a group of healthy volunteers (notincluded in this study).
The gray scale for AD, RD, and MD ranges from 0 to 3.0 x10 mm /s. The gray scale for FA isfrom 0.2 to 1; the larger the value, the higher the tissue coherence. The gray scale of the ODI map isfrom 0 to 1, while that of V is from 0.1 to 1. A smaller ODI indicates higher coherence and lessdispersion, while a larger V indicates higher intra-cellular volume fraction. AD: Axial diffusivity;RD: radial diffusivity; MD: mean diffusivity; FA: fractional anisotropy; ODI: orientation dispersionindex; V : volume fraction for intra-axonal water; P : q-space derived zero-displacementprobability.
Thirty-six lesions were segmented by an intensity-based semi-automated approach on T2-FLAIR images(Wishart et al., 2010). Thus, there were 36 sets of ROIs for lesions, perilesions, and NAWM. Table 4 liststhe patient number, set number, ROI size, and their anatomic locations in the WM.
At the individual lesion level
No outliers were evident in the image data. Results (q-values) of the pairwise comparisons between thelesion, matched perilesion, and NAWM are listed in Additional Table 1, whereas Table 5 summarizes the
ic 0
–3 2
ic0
ic 0
ic 0
-3 2
icic
ic 0

Detecting white matter alterations in multiple sclerosis using advanced diffusion magnetic resonance imaging
https://www.ncbi.nlm.nih.gov/pmc/articles/PMC6262996/?report=printable[7/17/2019 1:14:51 PM]
percentage of significant sets for each MRI measure and comparison pair. Most of the MRI measuresdemonstrated significant differences between lesions and the other two ROIs (i.e., perilesions and NAWM)in more than 80% of the ROI sets, except ODI, which did not differ between the three types of ROIs. Forcomparisons between perilesions and NAWM, only V and P were significantly different at least 89% ofthe ROI sets.
Additional Table 1
Results (q-values) of the pairwise comparisons between the lesion, matched perilesion, and NAWM
At the group level
The means and standard deviations for each MRI measure and ROI type are listed in Table 6. The table alsolists the results of the ANOVAs and post-hoc pairwise t-tests. None of the DTI indices (AD, RD, MD, andFA) and NODDI-derived ODI differed significantly between ROIs. V and P differed among the threeROIs with a corrected P < 0.007. Post-hoc testing showed that V and P were significantly decreased(corrected P < 0.017) in lesions and perilesions compared with NAWM. The bar plots of the diffusionmetrics in the three ROI types with significant findings are shown in Figure 4 with overhead arrowsrepresenting significant pairwise t-tests. T2-FLAIR intensity and DTI indices were similar betweenperilesions and NAWM, whereas V and P differed significantly in these two ROIs. Further, the extent ofchanges in the perilesions was intermediate between that in the lesions and NAWM.
DiscussionIn this study, a flexible dMRI technique, HYDI, was used to investigate changes in microstructural indicesderived from different modeling approaches. The HYDI method is versatile and conducive to multiplestrategies of diffusion data processing (Wu and Alexander, 2007; Wu et al., 2008). HYDI has at least 126diffusion directions, which requires approximately 25 minutes of scan time with parallel imaging and lessthan 7 minutes when using simultaneous multislice (also called multi-band) techniques (Setsompop et al.,2012).
Using the HYDI dataset, we studied the differences in DTI indices (AD, RD, MD, and FA), NODDI indices(ODI and V ), and P across lesion, perilesion, and NAWM ROIs in patients with MS. Compared withNAWM, MS lesions were characterized by decreased tissue restriction as described by P , a model-freeindex from q-space analysis. Consistent with previous studies in an animal model of MS (Biton et al., 2006;Wu et al., 2011), decreased P suggests the deterioration of myelination and/or the absence of myelinatedaxons. The loss of myelinated axons is further implied by a decreased in V , a NODDI index of axonaldensity, consistent with an ex vivo MS spinal cord study (Grussu et al., 2017).
At both the lesion level and group level, V and P detected WM alterations between the perilesions andNAWM that were not detected in T2-FLAIR. Alterations of WM in these perilesion ROIs were significant,though more subtle than those in the lesions. Similarly, previous studies, though with different imagingmodalities, demonstrated that MS perilesions are moderately associated with a decreased intensity of themagnetization transfer ratio, increased microglial density (Moll et al., 2011), and increased binding with aPET inflammation tracer, 18-kDa translocator protein (Colasanti et al., 2014). Our preliminary resultssuggest that dMRI metrics are sensitive to subtle changes in MS-affected WM that are not detectable using
ic 0
ic 0ic 0
ic 0
ic 00
0ic
ic 0

Detecting white matter alterations in multiple sclerosis using advanced diffusion magnetic resonance imaging
https://www.ncbi.nlm.nih.gov/pmc/articles/PMC6262996/?report=printable[7/17/2019 1:14:51 PM]
conventional imaging approaches. An advantage of model based diffusion metrics and q-space analysis isthat they can provide insights into the underlying mechanisms.
In this study, the fiber dispersion inferred based on NODDI-derived ODI did not differ significantly amongthe three ROI types (i.e., lesions, perilesions, and NAWM). While not seen in the group level tests due tovariations across ROI sets, decreased FA was observed at the individual lesion level and is consistent with adecrease in tissue coherence, as seen in previous reports of adult mild MS (Filippi et al., 2000), adultmoderate MS (Filippi et al., 2001), and pediatric mild MS (Vishwas et al., 2013; Rocca et al., 2016). DTIdiffusivities (i.e., AD, RD, and MD) have discrimination capabilities comparable to T2-FLAIR in separatingthe lesions from the rest of the WM. In this study they failed to distinguish perilesions from NAWM. Thepotential explanation may be the stringent multiple comparison adjustment filtered out those DTI metrics,which were otherwise significant.
This feasibility study has several limitations. First, although there were 36 ROIs, they were obtained fromonly six subjects, which could undermine the DTI results. In addition, the differences in subjects’ diseasestage, ROI size, and anatomical locations of ROIs with distinct underlying microstructural compositionsmay contribute additional variations in the results. It is also possible that different anatomical locations ofROIs may have different degrees or types of neurodegeneration. Future studies may focus on the implicationof anatomically varying diffusion metrics to underlying pathophysiological changes in MS.
Second, NODDI may not be the best model for characterizing MS lesions. While NODDI-derived V foraxonal density is robust within WM, it tends to be overestimated in tissues with intermediate to lowmicroscopic anisotropy, such as gray matter and lesions (Jelescu et al., 2016; Lampinen et al., 2017). Theoverestimation of NODDI could be caused by a violation of the NODDI assumptions of tortuosity and“rigid-stick” describing fixed axial diffusivities and close to zero radial diffusivity (compared with axialdiffusivity). Further investigation is necessary to estimate intra-axonal diffusivities through other diffusionmodels, such as diffusion kurtosis imaging (Fieremans et al., 2011), diffusion basis spectrum imaging(Wang et al., 2011), restriction spectrum imaging (White et al., 2013), or the constrained diffusionalvariance decomposition method (Lampinen et al., 2017).
Finally, the definition of lesion, perilesion and NAWM ROIs may affect the results. In this study, lesionROIs were defined based on a procedure optimized for detection of T2-FLAIR hyperintense regions. Inaddition, a small percentage (approximately 1.37 lesion count per brain (Wen et al., 2009)) of the lesionsmay be age-related white matter hyperintensities. It is also possible that perilesions have a partial volumeeffect from NAWM. Despite these factors, this study provides evidence and novel insights regarding themicrostructural alterations from NAWM to intermediate perilesion areas to MS lesions.
Additional files:
Additional Figure 1: Averaged AD, RD, MD, FA, ODI, Vic, and P0 maps from a group of healthyvolunteers.
Additional Table 1: Results (q-values) of the pairwise comparisons between the lesion, matched perilesion,and NAWM.
FootnotesConflicts of interest: No competing financial interests exist.
ic

Detecting white matter alterations in multiple sclerosis using advanced diffusion magnetic resonance imaging
https://www.ncbi.nlm.nih.gov/pmc/articles/PMC6262996/?report=printable[7/17/2019 1:14:51 PM]
Financial support: This work was supported by Indiana University-Purdue University Indianapolis Imaging Technology
Development Program (IUPUI ITDP), National Institutes of Health (NIH) grant R21 NS075791, and R01 AG053993.
Funders had no involvement in the study design; data collection, analysis, and interpretation; paper writing; or decision to
submit the paper for publication.
Institutional review board statement: All participants provided informed consent approved by the guidelines of the
institutional review board of the Geisel School of Medicine at Dartmouth on October 17, 2013 (No. 11482) and this study
was performed in accordance with the Declaration of Helsinki.
Declaration of patient consent: The authors certify that they have obtained all appropriate patient consent forms. In the
form the patients have given their consent for their images and other clinical information to be reported in the journal. The
patients understood that their names and initials will not be published and due efforts will be made to conceal their
identity, but anonymity could not be guaranteed.
Reporting statement: This study followed the Strengthening the Reporting of Observational Studies in Epidemiology
(STROBE) statement.
Biostatistics statement: The statistical methods of this study were reviewed by Jaroslaw Harezlak of Indiana University
in USA
Copyright license agreement: The Copyright License Agreement has been signed by all authors before publication.
Data sharing statement: For data sharing, individual participant data that underlie the results reported in this article,
after deidentification (text, tables, figures, and appendices) will be shared. Individual participant data will not be available.
However, the study protocol, statistical analysis plan, analytic code, and informed consent form without signatures will be
made available beginning 3 months and ending 5 years following article publication to investigators whose proposed use
of the data has been approved by an independent review committee identified to achieve aims in the approved proposal.
Proposals should be directed to [email protected]. To gain access, data requestors will need to sign a data access
agreement and institutional IRB approval will be required.
Plagiarism check: Checked twice by iThenticate.
Peer review: Externally peer reviewed.
Funding: This work was supported by Indiana University-Purdue University Indianapolis Imaging Technology
Development Program (IUPUI ITDP), National Institutes of Health (NIH) grant R21 NS075791, and R01 AG053993.
C-Editor: Zhao M; S-Editor: Li CH; L-Editor: Song LP; T-Editor: Liu XL
References1. Assaf Y, Mayk A, Cohen Y. Displacement imaging of spinal cord using q-space diffusion-weighted MRI.Magn Reson Med. 2000;44:713–722. [PubMed: 11064406]
2. Assaf Y, Chapman J, Ben-Bashat D, Hendler T, Segev Y, Korczyn AD, Graif M, Cohen Y. White matterchanges in multiple sclerosis: correlation of q-space diffusion MRI and 1H MRS. Magn Reson Imaging.2005;23:703–710. [PubMed: 16198825]
3. Assaf Y, Ben-Bashat D, Chapman J, Peled S, Biton IE, Kafri M, Segev Y, Hendler T, Korczyn AD, GraifM, Cohen Y. High b-value q-space analyzed diffusion-weighted MRI: application to multiple sclerosis.Magn Reson Med. 2002;47:115–126. [PubMed: 11754450]
4. Banaszek A, Bladowska J, Pokryszko-Dragan A, Podemski R, Sasiadek MJ. Evaluation of the

Detecting white matter alterations in multiple sclerosis using advanced diffusion magnetic resonance imaging
https://www.ncbi.nlm.nih.gov/pmc/articles/PMC6262996/?report=printable[7/17/2019 1:14:51 PM]
degradation of the selected projectile, commissural and association white matter tracts within normalappearing white matter in patients with multiple sclerosis using diffusion tensor MR imaging - a preliminarystudy. Pol J Radiol. 2015;80:457–463. [PMCID: PMC4603607] [PubMed: 26516389]
5. Basser PJ, Mattiello J, LeBihan D. MR diffusion tensor spectroscopy and imaging. Biophys J.1994;66:259–267. [PMCID: PMC1275686] [PubMed: 8130344]
6. Behrens TE, Woolrich MW, Jenkinson M, Johansen-Berg H, Nunes RG, Clare S, Matthews PM, BradyJM, Smith SM. Characterization and propagation of uncertainty in diffusion-weighted MR imaging. MagnReson Med. 2003;50:1077–1088. [PubMed: 14587019]
7. Bester M, Lazar M, Petracca M, Babb JS, Herbert J, Grossman RI, Inglese M. Tract-specific white mattercorrelates of fatigue and cognitive impairment in benign multiple sclerosis. J Neurol Sci. 2013;330:61–66.[PMCID: PMC4651179] [PubMed: 23643443]
8. Billiet T, Vandenbulcke M, Madler B, Peeters R, Dhollander T, Zhang H, Deprez S, Van den Bergh BR,Sunaert S, Emsell L. Age-related microstructural differences quantified using myelin water imaging andadvanced diffusion MRI. Neurobiol Aging. 2015;36:2107–2121. [PubMed: 25840837]
9. Biton IE, Duncan ID, Cohen Y. High b-value q-space diffusion MRI in myelin-deficient rat spinal cords.Magn Reson Imaging. 2006;24:161–166. [PubMed: 16455404]
10. Bodini B, Cercignani M, Khaleeli Z, Miller DH, Ron M, Penny S, Thompson AJ, Ciccarelli O. Corpuscallosum damage predicts disability progression and cognitive dysfunction in primary-progressive MS afterfive years. Hum Brain Mapp. 2013;34:1163–1172. [PubMed: 22328451]
11. Callaghan PT. Principles of nuclear magnetic resonance microscopy. Oxford: Clarendon Press; 1991.
12. Chiang CW, Wang Y, Sun P, Lin TH, Trinkaus K, Cross AH, Song SK. Quantifying white matter tractdiffusion parameters in the presence of increased extra-fiber cellularity and vasogenic edema. Neuroimage.2014;101:310–319. [PMCID: PMC4165711] [PubMed: 25017446]
13. Clark CA, Le Bihan D. Water diffusion compartmentation and anisotropy at high b values in the humanbrain. Magn Reson Med. 2000;44:852–859. [PubMed: 11108621]
14. Colasanti A, Guo Q, Muhlert N, Giannetti P, Onega M, Newbould RD, Ciccarelli O, Rison S, ThomasC, Nicholas R, Muraro PA, Malik O, Owen DR, Piccini P, Gunn RN, Rabiner EA, Matthews PM. In vivoassessment of brain white matter inflammation in multiple sclerosis with (18)F-PBR111 PET. J Nucl Med.2014;55:1112–1118. [PubMed: 24904112]
15. Colgan N, Siow B, O’Callaghan JM, Harrison IF, Wells JA, Holmes HE, Ismail O, Richardson S,Alexander DC, Collins EC, Fisher EM, Johnson R, Schwarz AJ, Ahmed Z, O’Neill MJ, Murray TK, ZhangH, Lythgoe MF. Application of neurite orientation dispersion and density imaging (NODDI) to a taupathology model of Alzheimer’s disease. Neuroimage. 2015;125:739–744. [PMCID: PMC4692518][PubMed: 26505297]
16. De Santis S, Drakesmith M, Bells S, Assaf Y, Jones DK. Why diffusion tensor MRI does well onlysome of the time: Variance and covariance of white matter tissue microstructure attributes in the livinghuman brain. Neuroimage. 2013;89:35–44. [PMCID: PMC3988851] [PubMed: 24342225]
17. Descoteaux M, Deriche R, Le Bihan D, Mangin JF, Poupon C. Multiple q-shell diffusion propagator

Detecting white matter alterations in multiple sclerosis using advanced diffusion magnetic resonance imaging
https://www.ncbi.nlm.nih.gov/pmc/articles/PMC6262996/?report=printable[7/17/2019 1:14:51 PM]
imaging. Med Image Anal. 2011;15:603–621. [PubMed: 20685153]
18. Fieremans E, Jensen JH, Helpern JA. White matter characterization with diffusional kurtosis imaging.Neuroimage. 2011;58:177–188. [PMCID: PMC3136876] [PubMed: 21699989]
19. Filippi M, Rocca MA. Conventional MRI in multiple sclerosis. J Neuroimaging. 2007;17(Suppl 1):3S–9S. [PubMed: 17425727]
20. Filippi M, Cercignani M, Inglese M, Horsfield MA, Comi G. Diffusion tensor magnetic resonanceimaging in multiple sclerosis. Neurology. 2001;56:304–311. [PubMed: 11171893]
21. Filippi M, Iannucci G, Cercignani M, Assunta Rocca M, Pratesi A, Comi G. A quantitative study ofwater diffusion in multiple sclerosis lesions and normal-appearing white matter using echo-planar imaging.Arch Neurol. 2000;57:1017–1021. [PubMed: 10891984]
22. Grussu F, Schneider T, Tur C, Yates RL, Tachrount M, Ianus A, Yiannakas MC, Newcombe J, ZhangH, Alexander DC, DeLuca GC Gandini Wheeler-Kingshott CAM. Neurite dispersion: a new marker ofmultiple sclerosis spinal cord pathology? Ann Clin Transl Neurol. 2017;4:663–679.[PMCID: PMC5590517] [PubMed: 28904988]
23. Harrison DM, Shiee N, Bazin PL, Newsome SD, Ratchford JN, Pham D, Calabresi PA, Reich DS.Tract-specific quantitative MRI better correlates with disability than conventional MRI in multiple sclerosis.J Neurol. 2013;260:397–406. [PMCID: PMC3753185] [PubMed: 22886062]
24. Hosseinbor AP, Chung MK, Wu YC, Alexander AL. Bessel Fourier Orientation Reconstruction(BFOR): an analytical diffusion propagator reconstruction for hybrid diffusion imaging and computation ofq-space indices. Neuroimage. 2013;64:650–670. [PMCID: PMC3508305] [PubMed: 22963853]
25. Jelescu IO, Veraart J, Fieremans E, Novikov DS. Degeneracy in model parameter estimation for multi-compartmental diffusion in neuronal tissue. NMR Biomed. 2016;29:33–47. [PMCID: PMC4920129][PubMed: 26615981]
26. Jenkinson M, Bannister P, Brady M, Smith S. Improved optimization for the robust and accurate linearregistration and motion correction of brain images. Neuroimage. 2002;17:825–841. [PubMed: 12377157]
27. Jespersen SN, Bjarkam CR, Nyengaard JR, Chakravarty MM, Hansen B, Vosegaard T, Ostergaard L,Yablonskiy D, Nielsen NC, Vestergaard-Poulsen P. Neurite density from magnetic resonance diffusionmeasurements at ultrahigh field: comparison with light microscopy and electron microscopy. Neuroimage.2010;49:205–216. [PMCID: PMC2862296] [PubMed: 19732836]
28. Kodiweera C, Alexander AL, Harezlak J, McAllister TW, Wu YC. Age effects and sex differences inhuman brain white matter of young to middle-aged adults: A DTI, NODDI, and q-space study. Neuroimage.2016;128:180–192. [PMCID: PMC4824064] [PubMed: 26724777]
29. Kunz N, Zhang H, Vasung L, O’Brien KR, Assaf Y, Lazeyras F, Alexander DC, Huppi PS. Assessingwhite matter microstructure of the newborn with multi-shell diffusion MRI and biophysical compartmentmodels. Neuroimage. 2014;96:288–299. [PubMed: 24680870]
30. Kurtzke JF. Rating neurologic impairment in multiple sclerosis: an expanded disability status scale(EDSS) Neurology. 1983;33:1444–1452. [PubMed: 6685237]
31. Lally P, Zhang H, Pauliah S, Price D, Bainbridge A, Balraj G, Cady E, Shankaran S, Thayyil S.

Detecting white matter alterations in multiple sclerosis using advanced diffusion magnetic resonance imaging
https://www.ncbi.nlm.nih.gov/pmc/articles/PMC6262996/?report=printable[7/17/2019 1:14:51 PM]
Microstructural changes in neonatal encephalopathy revealed with the neurite orientation dispersion anddensity imaging (NODDI) model. Arch Dis Child Fetal Neonatal Ed. 2014;99(Suppl 1):A14.
32. Lampinen B, Szczepankiewicz F, Martensson J, van Westen D, Sundgren PC, Nilsson M. Neuritedensity imaging versus imaging of microscopic anisotropy in diffusion MRI: A model comparison usingspherical tensor encoding. Neuroimage. 2017;147:517–531. [PubMed: 27903438]
33. Liu Y, Mitchell PJ, Kilpatrick TJ, Stein MS, Harrison LC, Baker J, Ditchfield M, Li K, Egan GF,Butzkueven H, Kolbe SC. Diffusion tensor imaging of acute inflammatory lesion evolution in multiplesclerosis. J Clin Neurosci. 2012;19:1689–1694. [PubMed: 23084347]
34. Manjon JV, Coupe P, Concha L, Buades A, Collins DL, Robles M. Diffusion weighted image denoisingusing overcomplete local PCA. PLoS One. 2013;8:e73021. [PMCID: PMC3760829] [PubMed: 24019889]
35. Mauchly JW. Significance test for sphericity of a normal n-variate distribution. Ann Math Statist.1940;11:204–209.
36. Moll NM, Rietsch AM, Thomas S, Ransohoff AJ, Lee JC, Fox R, Chang A, Ransohoff RM, Fisher E.Multiple sclerosis normal-appearing white matter: pathology-imaging correlations. Ann Neurol.2011;70:764–773. [PMCID: PMC3241216] [PubMed: 22162059]
37. Mustafi SM, Kodiweera C, Flashman LA, McAllister TW, Wu YC. International Society of MagneticResonance in Medicine (ISMRM) 24th Annual Meeting. Singapore: 2016. Hybrid diffusion imaging todetect acute white matter injury after mild TBI.
38. Nazeri A, Chakravarty MM, Rotenberg DJ, Rajji TK, Rathi Y, Michailovich OV, Voineskos AN.Functional consequences of neurite orientation dispersion and density in humans across the adult lifespan. JNeurosci. 2015;35:1753–1762. [PMCID: PMC4308611] [PubMed: 25632148]
39. Ozarslan E, Koay CG, Shepherd TM, Komlosh ME, Irfanoglu MO, Pierpaoli C, Basser PJ. Meanapparent propagator (MAP) MRI: a novel diffusion imaging method for mapping tissue microstructure.Neuroimage. 2013;78:16–32. [PMCID: PMC4059870] [PubMed: 23587694]
40. Pasternak O, Sochen N, Gur Y, Intrator N, Assaf Y. Free water elimination and mapping from diffusionMRI. Magn Reson Med. 2009;62:717–730. [PubMed: 19623619]
41. Polman CH, Reingold SC, Banwell B, Clanet M, Cohen JA, Filippi M, Fujihara K, Havrdova E,Hutchinson M, Kappos L, Lublin FD, Montalban X, O’Connor P, Sandberg-Wollheim M, Thompson AJ,Waubant E, Weinshenker B, Wolinsky JS. Diagnostic criteria for multiple sclerosis: 2010 revisions to theMcDonald criteria. Ann Neurol. 2011;69:292–302. [PMCID: PMC3084507] [PubMed: 21387374]
42. Rocca MA, Sonkin M, Copetti M, Pagani E, Arnold DL, Narayanan S, Sled JG, Banwell B, Filippi M.Diffusion tensor magnetic resonance imaging in very early onset pediatric multiple sclerosis. Mult Scler.2016;22:620–627. [PubMed: 26199355]
43. Rovaris M, Filippi M. Diffusion tensor MRI in multiple sclerosis. J Neuroimaging. 2007;17(Suppl1):27S–30S. [PubMed: 17425731]
44. Sbardella E, Tona F, Petsas N, Pantano P. DTI measurements in multiple sclerosis: Evaluation of braindamage and clinical implications. Mult Scler Int 2013. 2013:671730. [PMCID: PMC3628664] [PubMed:23606965]

Detecting white matter alterations in multiple sclerosis using advanced diffusion magnetic resonance imaging
https://www.ncbi.nlm.nih.gov/pmc/articles/PMC6262996/?report=printable[7/17/2019 1:14:51 PM]
45. Schneider T, Brownlee W, Zhang H, Ciccarelli O, Miller DH, Wheeler-Kingshott CG. Sensitivity ofmulti-shell NODDI to multiple sclerosis white matter changes: a pilot study. Funct Neurol. 2017;32:97–101.[PMCID: PMC5507159] [PubMed: 28676143]
46. Sepehrband F, Clark KA, Ullmann JF, Kurniawan ND, Leanage G, Reutens DC, Yang Z. Brain tissuecompartment density estimated using diffusion-weighted MRI yields tissue parameters consistent withhistology. Hum Brain Mapp. 2015;36:3687–3702. [PMCID: PMC4545675] [PubMed: 26096639]
47. Setsompop K, Gagoski BA, Polimeni JR, Witzel T, Wedeen VJ, Wald LL. Blipped-controlled aliasingin parallel imaging for simultaneous multislice echo planar imaging with reduced g-factor penalty. MagnReson Med. 2012;67:1210–1224. [PMCID: PMC3323676] [PubMed: 21858868]
48. Timmers I, Zhang H, Bastiani M, Jansma BM, Roebroeck A, Rubio-Gozalbo ME. White mattermicrostructure pathology in classic galactosemia revealed by neurite orientation dispersion and densityimaging. J Inherit Metab Dis. 2015;38:295–304. [PMCID: PMC4341012] [PubMed: 25344151]
49. Vishwas MS, Healy BC, Pienaar R, Gorman MP, Grant PE, Chitnis T. Diffusion tensor analysis ofpediatric multiple sclerosis and clinically isolated syndromes. AJNR Am J Neuroradiol. 2013;34:417–423.[PubMed: 22859275]
50. Wang Y, Wang Q, Haldar JP, Yeh FC, Xie M, Sun P, Tu TW, Trinkaus K, Klein RS, Cross AH, SongSK. Quantification of increased cellularity during inflammatory demyelination. Brain. 2011;134:3590–3601. [PMCID: PMC3235568] [PubMed: 22171354]
51. Warlop NP, Achten E, Fieremans E, Debruyne J, Vingerhoets G. Transverse diffusivity of cerebralparenchyma predicts visual tracking performance in relapsing-remitting multiple sclerosis. Brain Cogn.2009;71:410–415. [PubMed: 19576672]
52. Wen W, Sachdev PS, Li JJ, Chen X, Anstey KJ. White matter hyperintensities in the forties: theirprevalence and topography in an epidemiological sample aged 44-48. Hum Brain Mapp. 2009;30:1155–1167. [PubMed: 18465744]
53. Wheeler-Kingshott CA, Cercignani M. About “axial” and “radial” diffusivities. Magn Reson Med.2009;61:1255–1260. [PubMed: 19253405]
54. White NS, Leergaard TB, D’Arceuil H, Bjaalie JG, Dale AM. Probing tissue microstructure withrestriction spectrum imaging: Histological and theoretical validation. Hum Brain Mapp. 2013;34:327–346.[PMCID: PMC3538903] [PubMed: 23169482]
55. Wishart HA, Kee ER, Ford JF, MacDonald JW, Aney S, J. LZ. Acapulco, Mexico: Annual Meeting ofthe International Neuropsychological Society; 2010. A novel approach for semi-automated segmentation ofMS lesions on FLAIR imaging: Reliability and clinical correlates.
56. Wu YC, Alexander AL. Hybrid diffusion imaging. Neuroimage. 2007;36:617–629.[PMCID: PMC2428345] [PubMed: 17481920]
57. Wu YC, Field AS, Alexander AL. Computation of diffusion function measures in q-space usingmagnetic resonance hybrid diffusion imaging. IEEE Trans Med Imaging. 2008;27:858–865.[PMCID: PMC2674390] [PubMed: 18541492]
58. Wu YC, Field AS, Duncan ID, Samsonov AA, Kondo Y, Tudorascu D, Alexander AL. High b-value

Detecting white matter alterations in multiple sclerosis using advanced diffusion magnetic resonance imaging
https://www.ncbi.nlm.nih.gov/pmc/articles/PMC6262996/?report=printable[7/17/2019 1:14:51 PM]
and diffusion tensor imaging in a canine model of dysmyelination and brain maturation. Neuroimage.2011;58:829–837. [PMCID: PMC3166414] [PubMed: 21777681]
59. Zhang H, Schneider T, Wheeler-Kingshott CA, Alexander DC. NODDI: practical in vivo neuriteorientation dispersion and density imaging of the human brain. Neuroimage. 2012;61:1000–1016. [PubMed:22484410]
Figures and Tables
Table 1
Demographics and characteristics of all the included patients
Table 2
Hybrid diffusion imaging (HYDI) encoding scheme
Figure 1

Detecting white matter alterations in multiple sclerosis using advanced diffusion magnetic resonance imaging
https://www.ncbi.nlm.nih.gov/pmc/articles/PMC6262996/?report=printable[7/17/2019 1:14:51 PM]
Visualization of diffusion compartments in the NODDI model.
V and V are the volume fraction of the free isotropic diffusion and intra-axonal compartment, respectively. Theextracellular volume fraction is V = (1 – V ), a complement number to V . A , A , and A are the normalizeddiffusion signal contributed from individual diffusion compartments. A : Diffusion signal from extra-axonal water; A :diffusion signal from intra-axonal water; A : diffusion signal from isotropic fast diffusion; NODDI: neurite orientationdispersion and density imaging; V : volume fraction for extra-cellular water; V : volume fraction for intra-axonal water;V : volume fraction for isotropic fast diffusion; CSF: cerebrospinal fluid.
Table 3
Abbreviations of diffusion metrics
Figure 2
iso ic
ec ic ic iso ic ec
ec ic
iso
ec ic
iso

Detecting white matter alterations in multiple sclerosis using advanced diffusion magnetic resonance imaging
https://www.ncbi.nlm.nih.gov/pmc/articles/PMC6262996/?report=printable[7/17/2019 1:14:51 PM]
Segmentation of lesions, perilesions, and normal-appearing white matter (NAWM) on a T2-FLAIR map of patient No. 4.
A set of ROIs includes a lesion (red), a matched perilesion (blue) and NAWM (green); this patient (Expanded DisabilityStatus Scale score was 3.5) had six sets of lesions (No. 4). The set number for this patient, sizes of corresponding ROIs, andanatomic locations in the white matter are listed in Table 4. The gray scale is 0–300 AU for the T2-FLAIR map. Numbers1–6 denote ROI sets listed in Table 3. AU: Arbitrary unit; FLAIR: fluid attenuated inversion recovery; no: number; ROIs:regions of interest.
Figure 3

Detecting white matter alterations in multiple sclerosis using advanced diffusion magnetic resonance imaging
https://www.ncbi.nlm.nih.gov/pmc/articles/PMC6262996/?report=printable[7/17/2019 1:14:51 PM]
Co-registered MRI maps of two patients with multiple sclerosis (MS).
(A) Patient No. 4. Six hyperintense lesions in the T2-FLAIR image can be appreciated. Note that the two separatedhyperintense regions of lesion 1 were connected in another slice (not shown). The lesion segmentation results in the samepatient are shown in Figure 2. The corresponding areas in the diffusion maps appeared hyperintense in the AD, RD, andMD maps, and hypointense in the FA, V , and P maps. The gray scale is 0–300 AU for T2-FLAIR; 0–3 × 10 mm /s forAD, RD, and MD; and 0–1 for FA, ODI, V , and P . (B) Patient No. 5. Three hyperintense lesions in the T2-FLAIR imagecan be appreciated. AD: Axial diffusivity; AU: arbitrary unit; FA: fractional anisotropy; FLAIR: fluid attenuated inversionrecovery; MD: mean diffusivity; ODI: orientation dispersion index; P : q-space derived zero-displacement probability; RD:radial diffusivity; V : volume fraction for intra-axonal water.
Table 4
Classifications of region of interest (ROI)
ic 0 –3 2
ic 0
0
ic

Detecting white matter alterations in multiple sclerosis using advanced diffusion magnetic resonance imaging
https://www.ncbi.nlm.nih.gov/pmc/articles/PMC6262996/?report=printable[7/17/2019 1:14:51 PM]
Table 5
Pairwise comparisons of diffusion parameters between lesion-perilesion, lesion-NAWM, andperilesion-NAWM at the level of individual set of ROIs

Detecting white matter alterations in multiple sclerosis using advanced diffusion magnetic resonance imaging
https://www.ncbi.nlm.nih.gov/pmc/articles/PMC6262996/?report=printable[7/17/2019 1:14:51 PM]
Table 6
Comparisons of diffusion parameters in the lesion, perilesion, and NAWM ROIs at the group level

Detecting white matter alterations in multiple sclerosis using advanced diffusion magnetic resonance imaging
https://www.ncbi.nlm.nih.gov/pmc/articles/PMC6262996/?report=printable[7/17/2019 1:14:51 PM]
Figure 4
Bar plots of T2-FLAIR and diffusion metrics in the three types of ROIs.
The lesion, perilesion, and NAWM ROIs are color-coded in red, blue, and green, respectively. Error bars denote thestandard deviation across 36 ROI sets. The overhead arrows denote significant differences in measurements between pairsof ROIs at a Bonferroni-corrected P threshold of 0.017 (Table 6). Note that T2-FLAIR intensity is not a quantitativemeasure; thus, it was not tested for statistical significance at the group level. FLAIR: Fluid attenuated inversion recovery;NAWM: normal-appearing white matter; ROIs: regions of interest.

Detecting white matter alterations in multiple sclerosis using advanced diffusion magnetic resonance imaging
https://www.ncbi.nlm.nih.gov/pmc/articles/PMC6262996/?report=printable[7/17/2019 1:14:51 PM]
Articles from Neural Regeneration Research are provided here courtesy of Wolters Kluwer -- MedknowPublications