detection of equatorial waves in data. olr power spectrum, 1979–2001 (symmetric) from wheeler and...
Post on 21-Dec-2015
219 views
TRANSCRIPT
Detection of Equatorial Waves in Data

OLR power spectrum, 1979–2001 (Symmetric)
fromWheeler and Kiladis, 1999

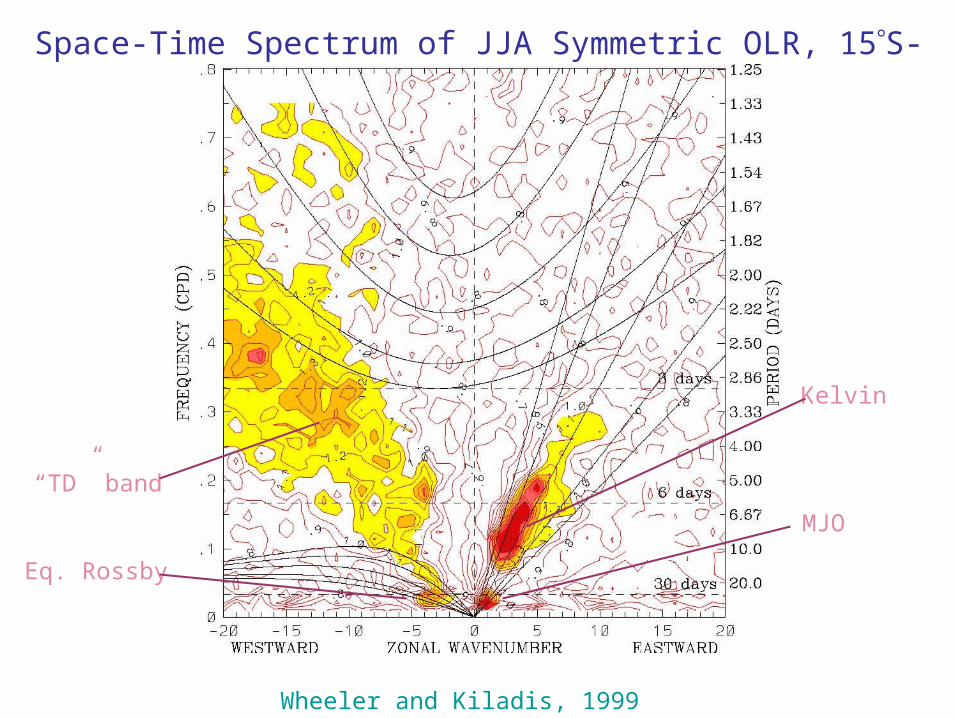
Space-Time Spectrum of JJA Symmetric OLR, 15S-15N
Wheeler and Kiladis, 1999
Kelvin
MJO
“TD” band
Eq. Rossby

Space-Time Spectrum of JJA Antisymmetric OLR, 15S-15N
Wheeler and Kiladis, 1999
Inertio-Gravity
MJO
“TD” band
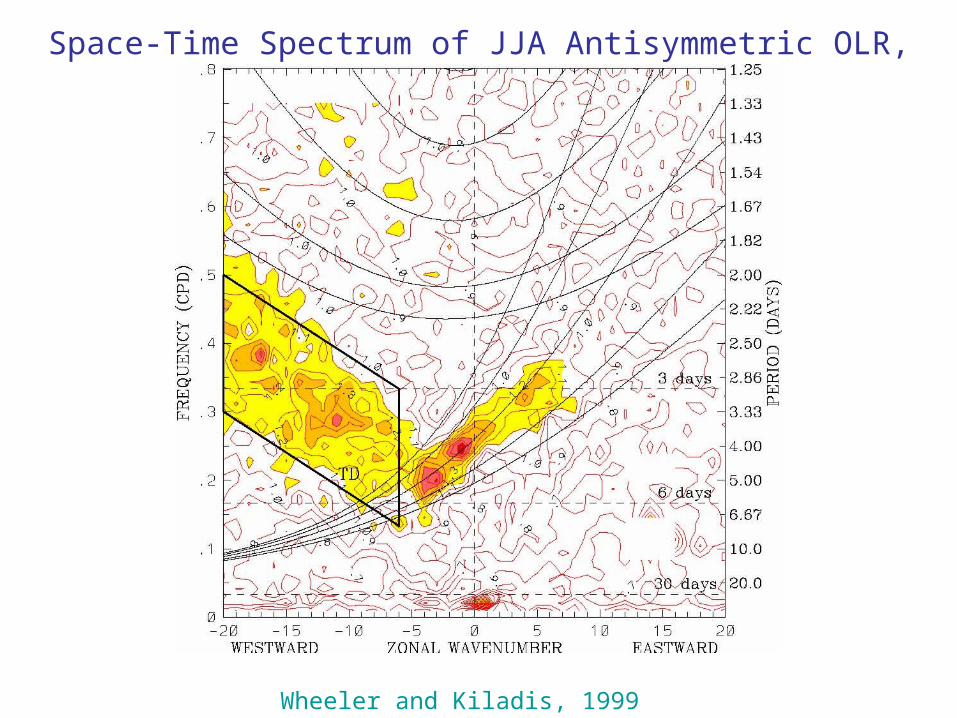
Space-Time Spectrum of JJA Antisymmetric OLR, 15S-15N
Wheeler and Kiladis, 1999

2002 CLAUS Brightness Temperature 5ºS-5º N

2002 CLAUS Brightness Temperature 5ºS-5º N
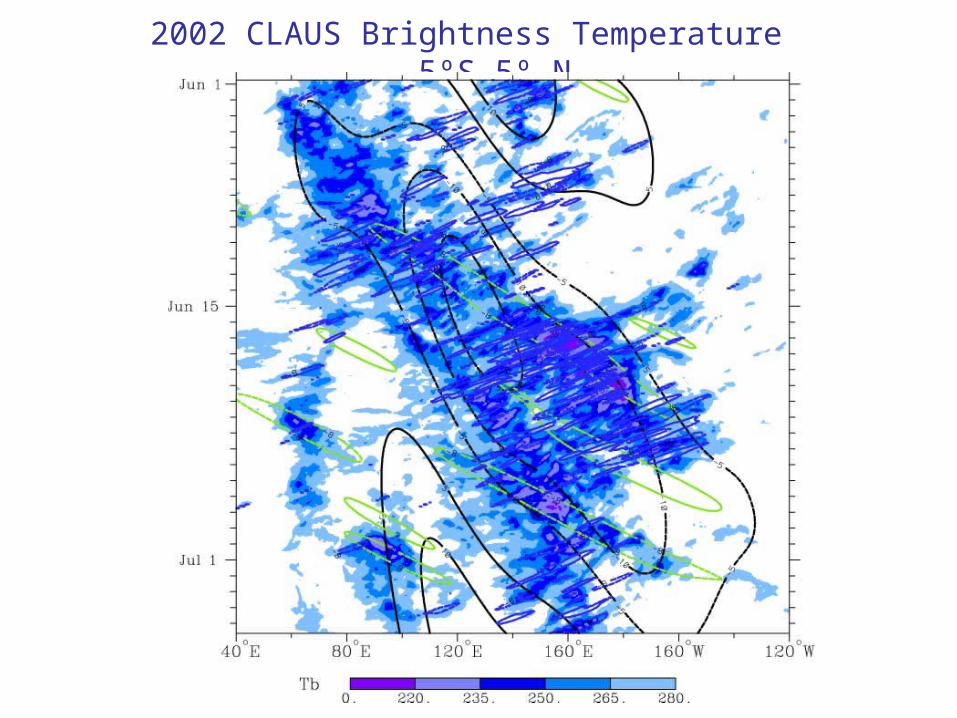
2002 CLAUS Brightness Temperature 5ºS-5º N
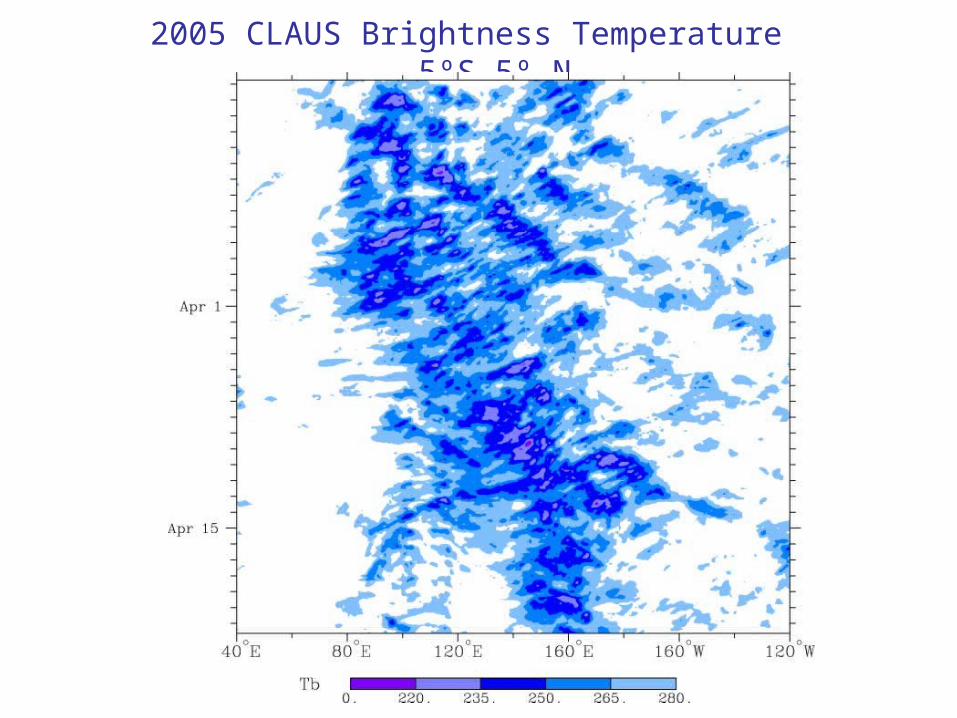
2005 CLAUS Brightness Temperature 5ºS-5º N

2005 CLAUS Brightness Temperature 5ºS-5º N

2005 CLAUS Brightness Temperature 5ºS-5º N

1987 CLAUS Brightness Temperature 5ºS-5º N
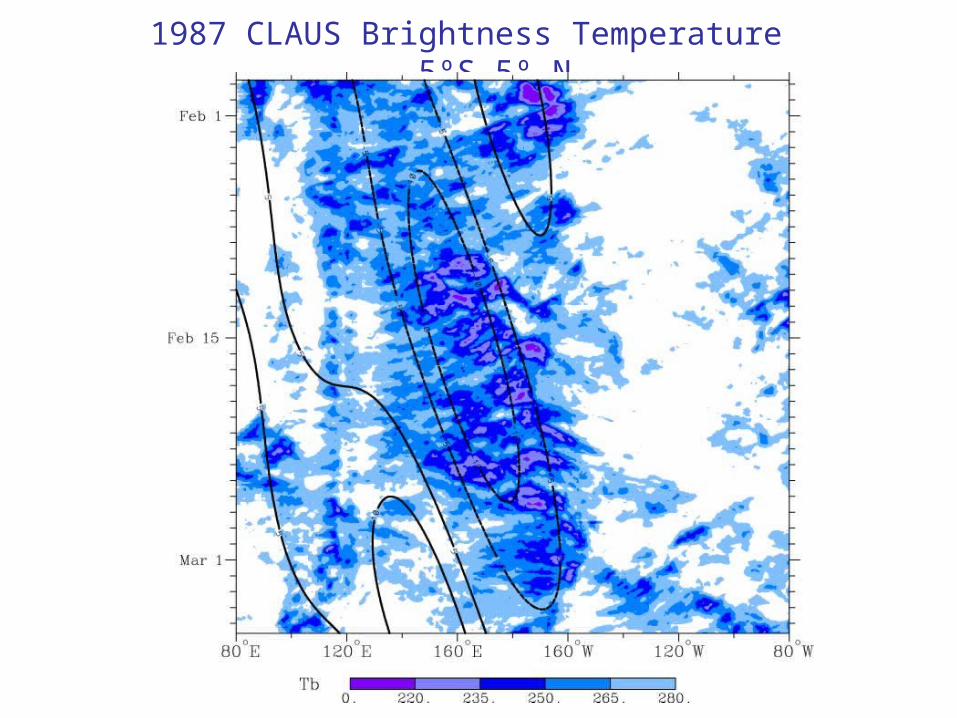
1987 CLAUS Brightness Temperature 5ºS-5º N
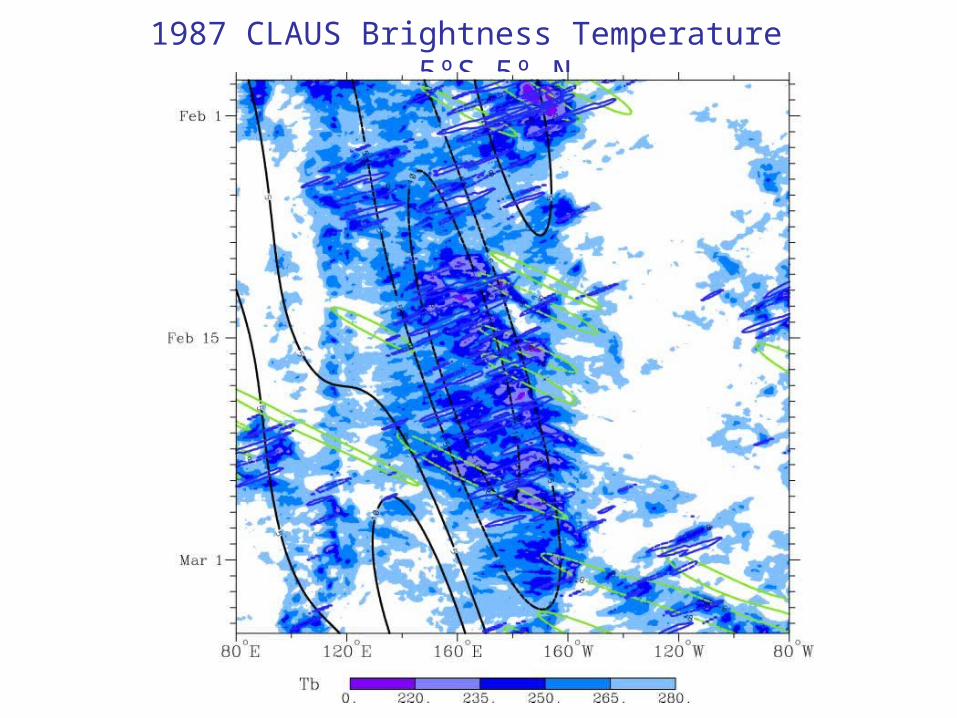
1987 CLAUS Brightness Temperature 5ºS-5º N

2001 CLAUS Brightness Temperature 5ºS-5º N
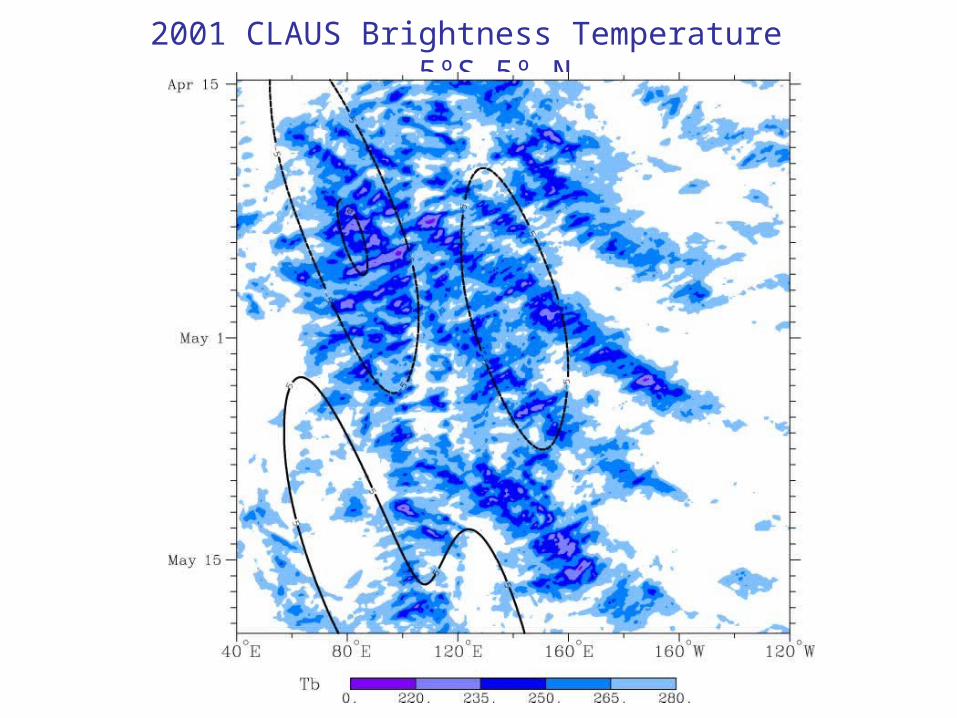
2001 CLAUS Brightness Temperature 5ºS-5º N
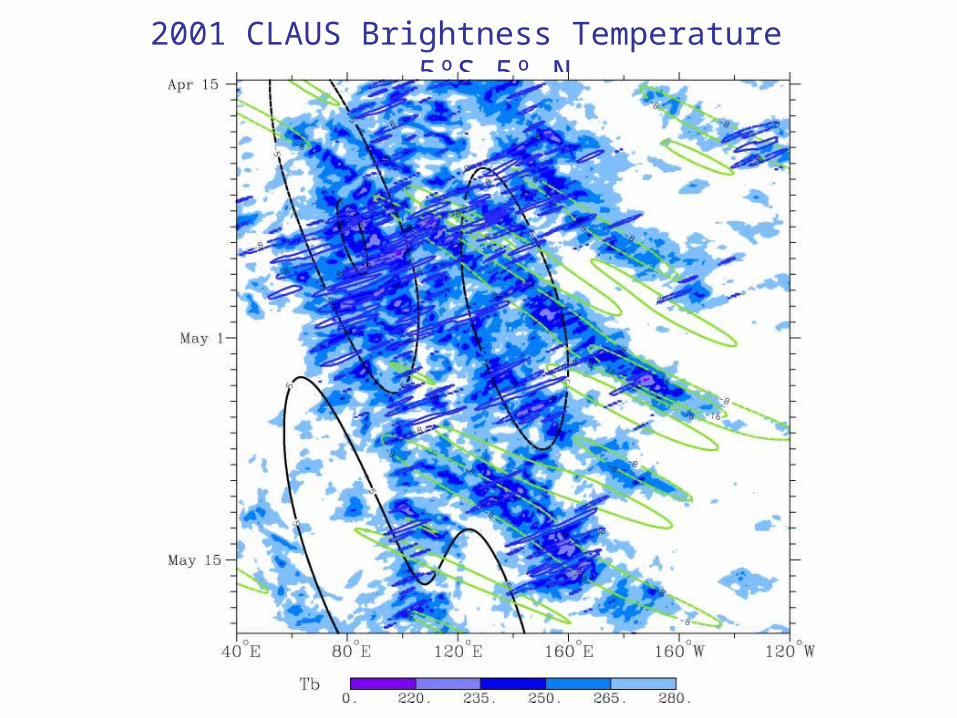
2001 CLAUS Brightness Temperature 5ºS-5º N
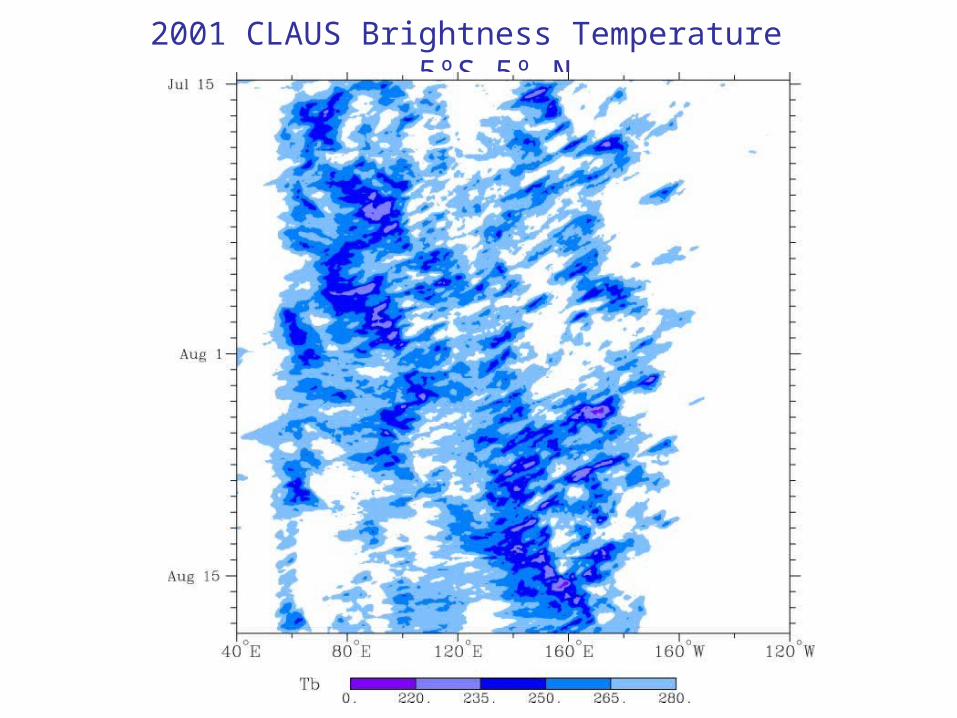
2001 CLAUS Brightness Temperature 5ºS-5º N
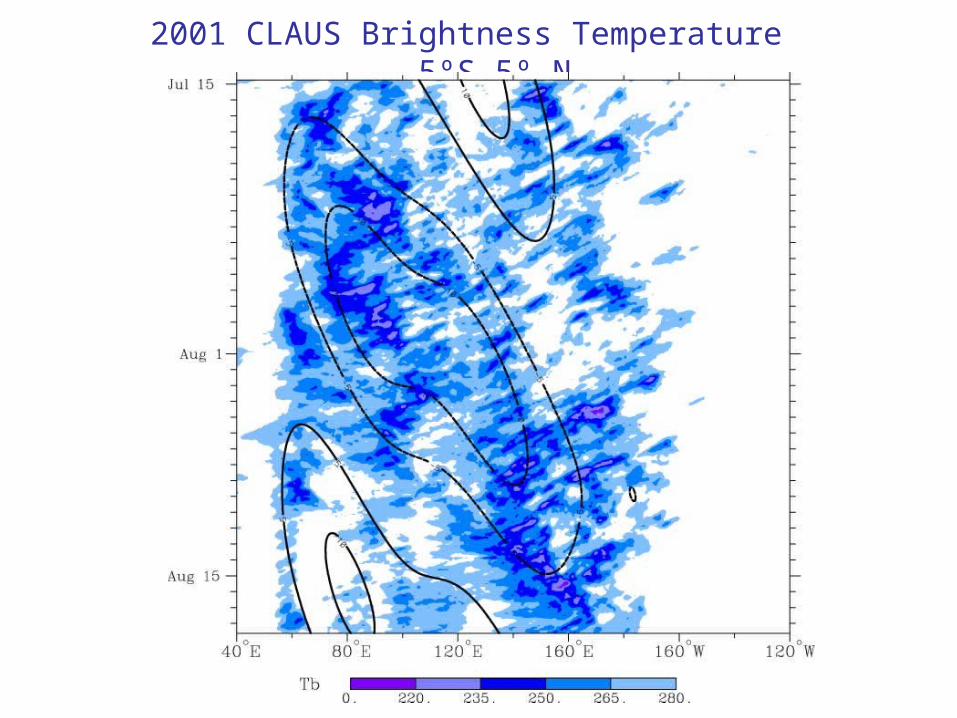
2001 CLAUS Brightness Temperature 5ºS-5º N

2001 CLAUS Brightness Temperature 5ºS-5º N

Vertical Structure of Equatorial Waves
C W C W
Direction of Motion
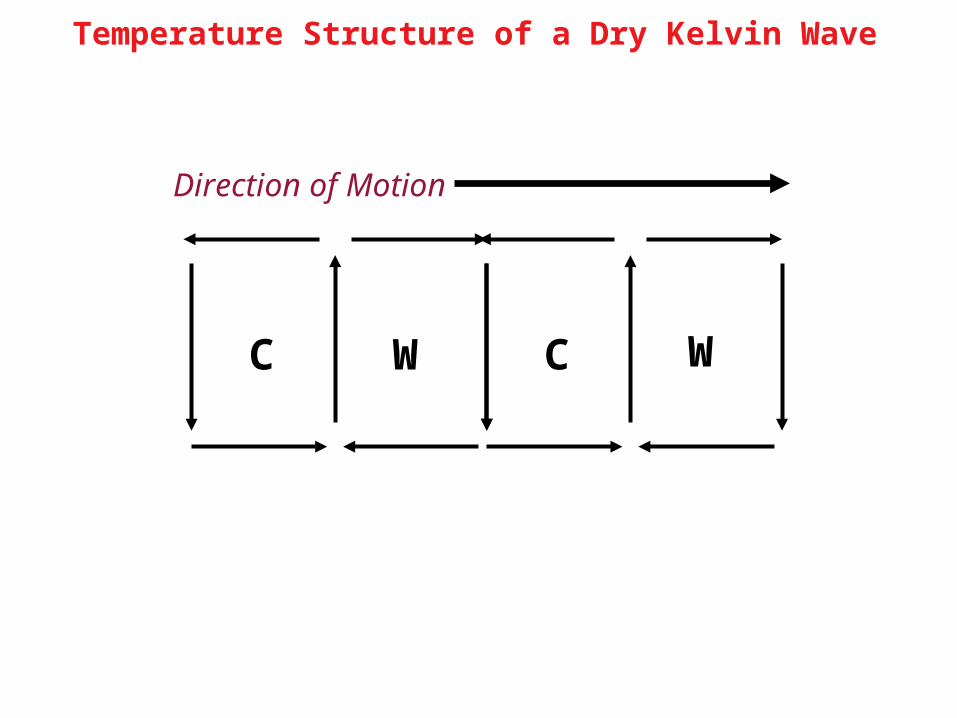
Temperature Structure of a Dry Kelvin Wave

C W C W
Direction of Motion
Temperature Structure of a Dry Kelvin Wave
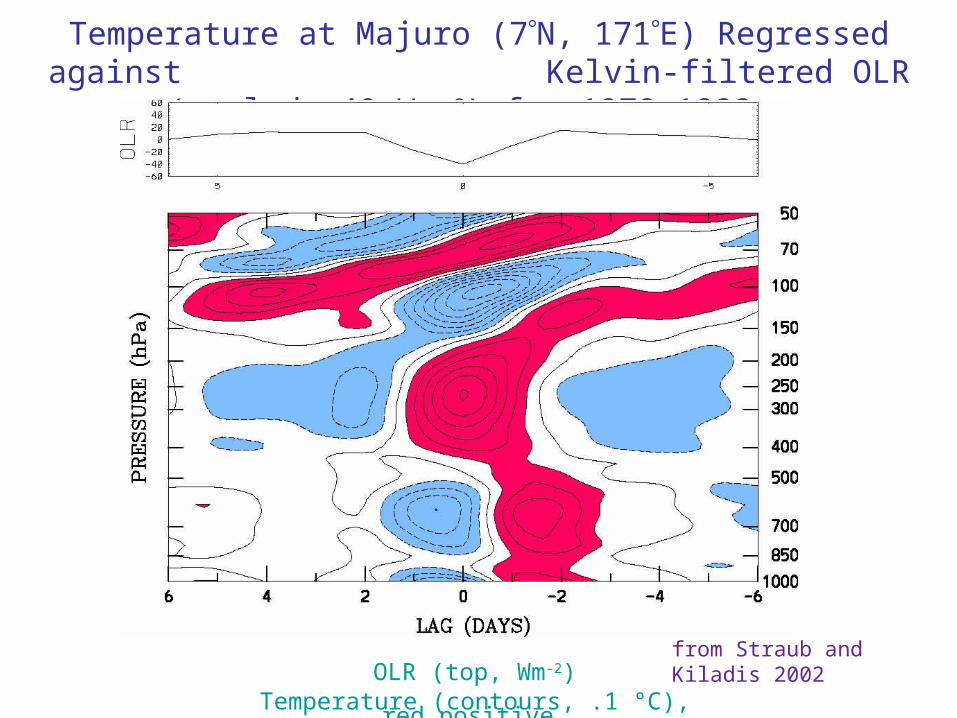
Temperature at Majuro (7N, 171E) Regressed against Kelvin-filtered OLR
(scaled -40 W m2) for 1979-1999
OLR (top, Wm-2)Temperature (contours, .1 °C),
red positive
from Straub and Kiladis 2002
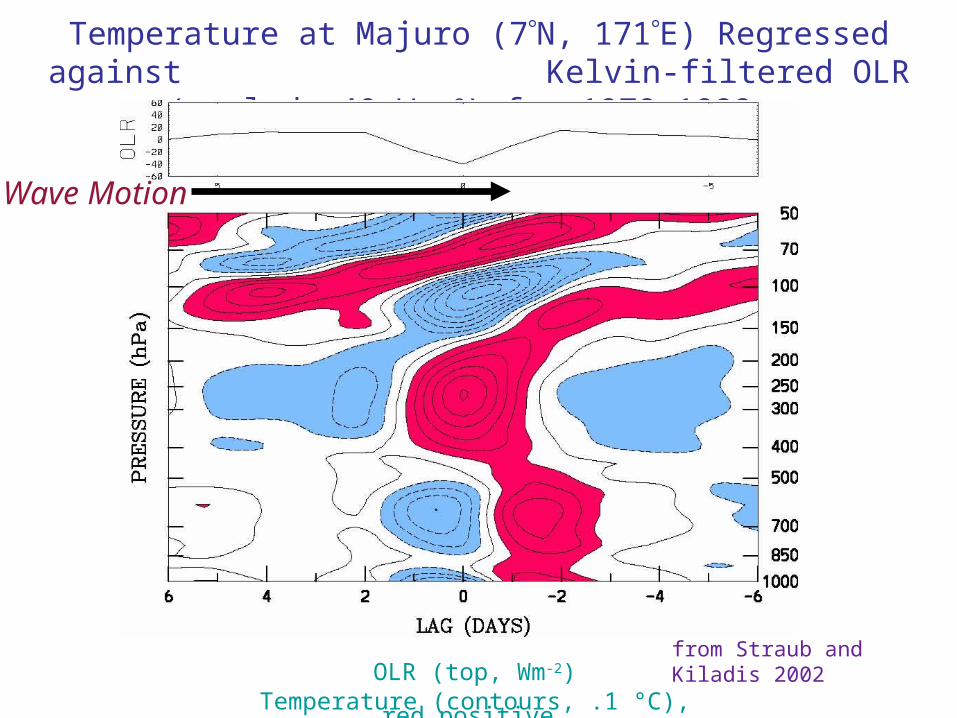
Temperature at Majuro (7N, 171E) Regressed against Kelvin-filtered OLR
(scaled -40 W m2) for 1979-1999
OLR (top, Wm-2)Temperature (contours, .1 °C),
red positive
from Straub and Kiladis 2002
Wave Motion
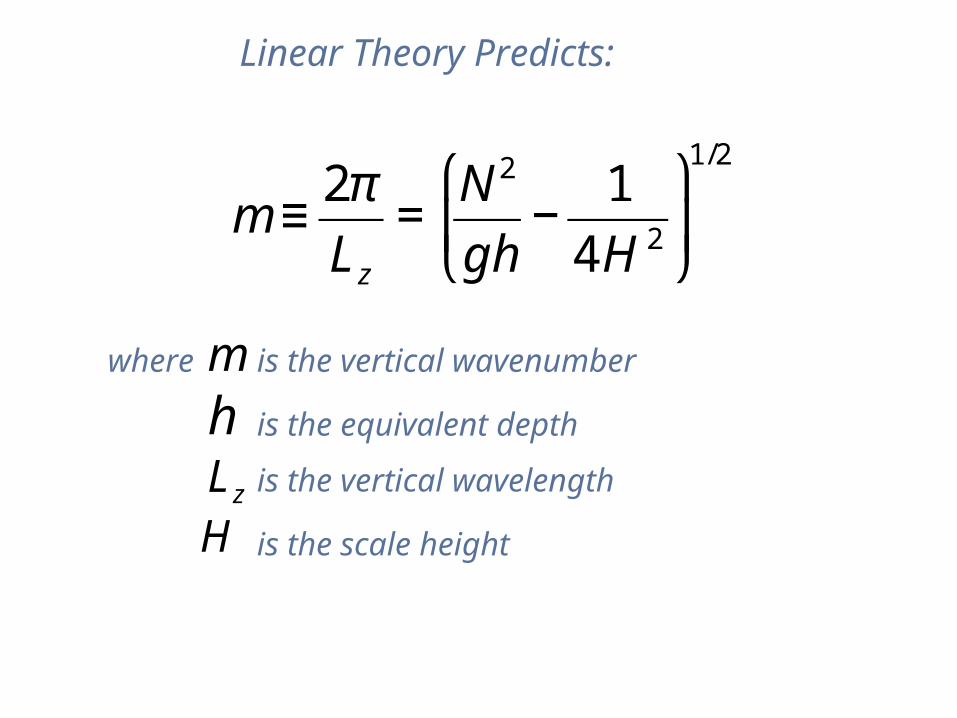
is the equivalent depth
where
€
m ≡2π
Lz=N 2
gh−
1
4H 2
⎛
⎝ ⎜
⎞
⎠ ⎟
1/2
€
h
€
m
€
Lz
€
H
is the vertical wavenumber
is the vertical wavelength
is the scale height
Linear Theory Predicts:

Using Representative Numbers for the Tropical Stratosphere:
for h=200 m, c=45 m/s, Lz=12.0 km
“Peak Projection Response”
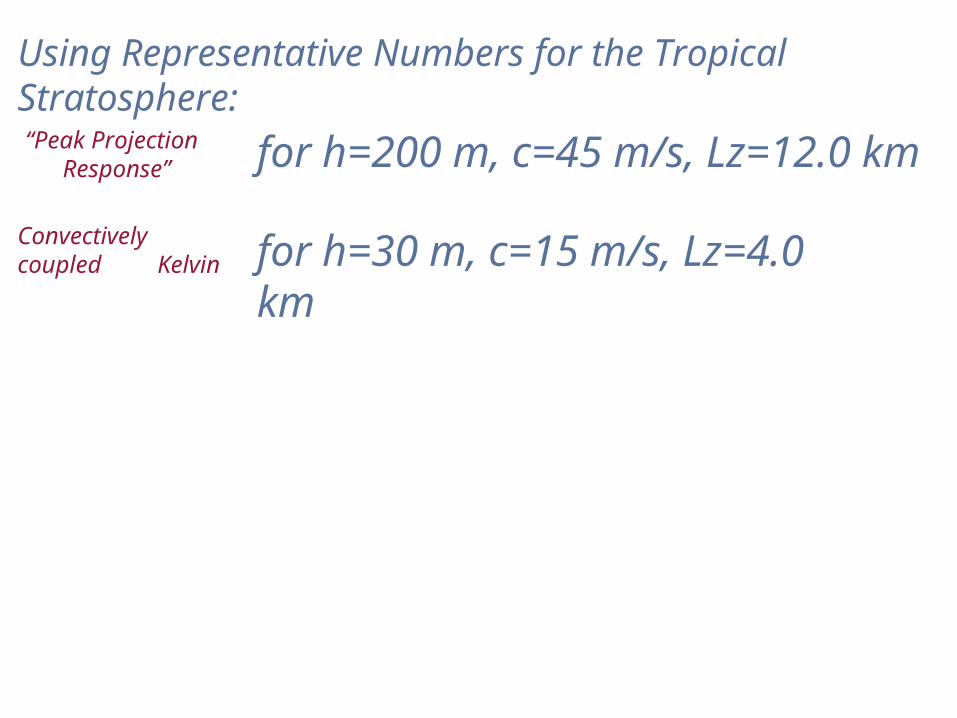
for h=30 m, c=15 m/s, Lz=4.0 km
Using Representative Numbers for the Tropical Stratosphere:
for h=200 m, c=45 m/s, Lz=12.0 km
“Peak Projection Response”Convectively coupled Kelvin
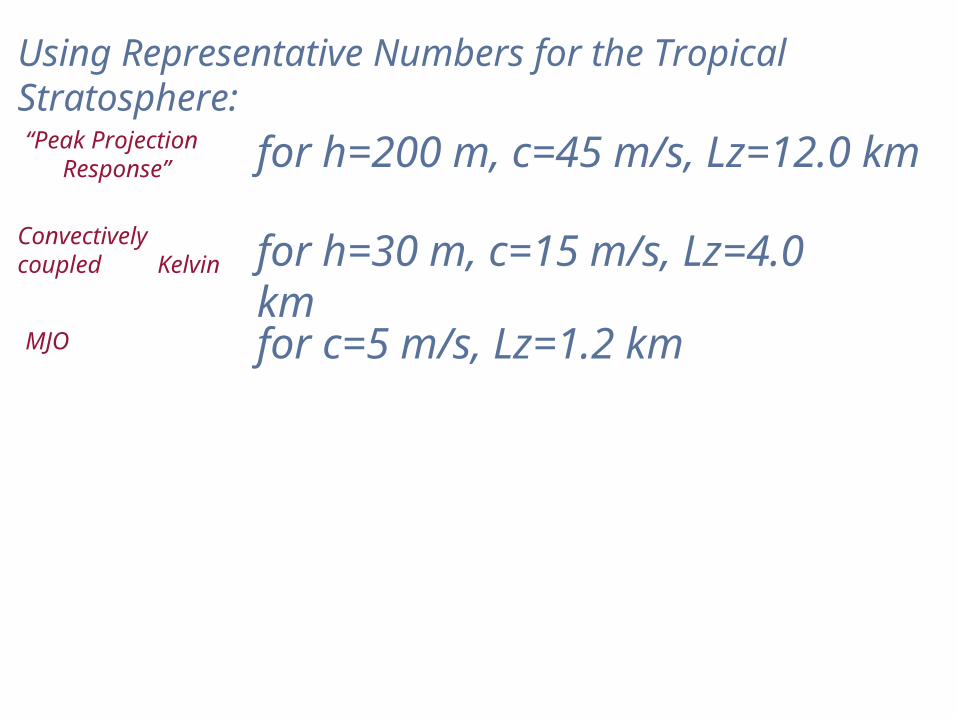
for h=30 m, c=15 m/s, Lz=4.0 kmfor c=5 m/s, Lz=1.2 km
Using Representative Numbers for the Tropical Stratosphere:
for h=200 m, c=45 m/s, Lz=12.0 km
“Peak Projection Response”Convectively coupled Kelvin
MJO
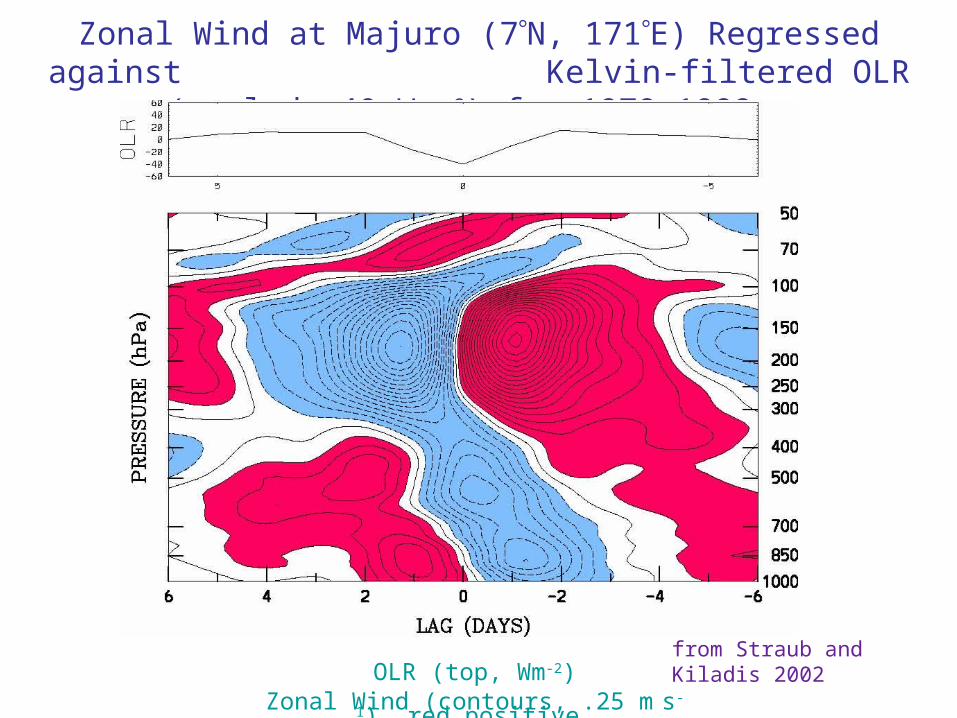
Zonal Wind at Majuro (7N, 171E) Regressed against Kelvin-filtered OLR
(scaled -40 W m2) for 1979-1999
OLR (top, Wm-2)Zonal Wind (contours, .25 m s-
1), red positive
from Straub and Kiladis 2002

Temperature at Majuro (7N, 171E) Regressed against Kelvin-filtered OLR
(scaled -40 W m2) for 1979-1999
OLR (top, Wm-2)Temperature (contours, .1 °C),
red positive
from Straub and Kiladis 2002
Wave Motion

Specific Humidity at Majuro (7N, 171E) Regressed against Kelvin-filtered OLR
(scaled -40 W m2) for 1979-1999
from Straub and Kiladis 2002OLR (top, Wm-2)
Specific Humidity (contours, 1 X 10⁻¹ g kg-1), red positive
Wave Motion
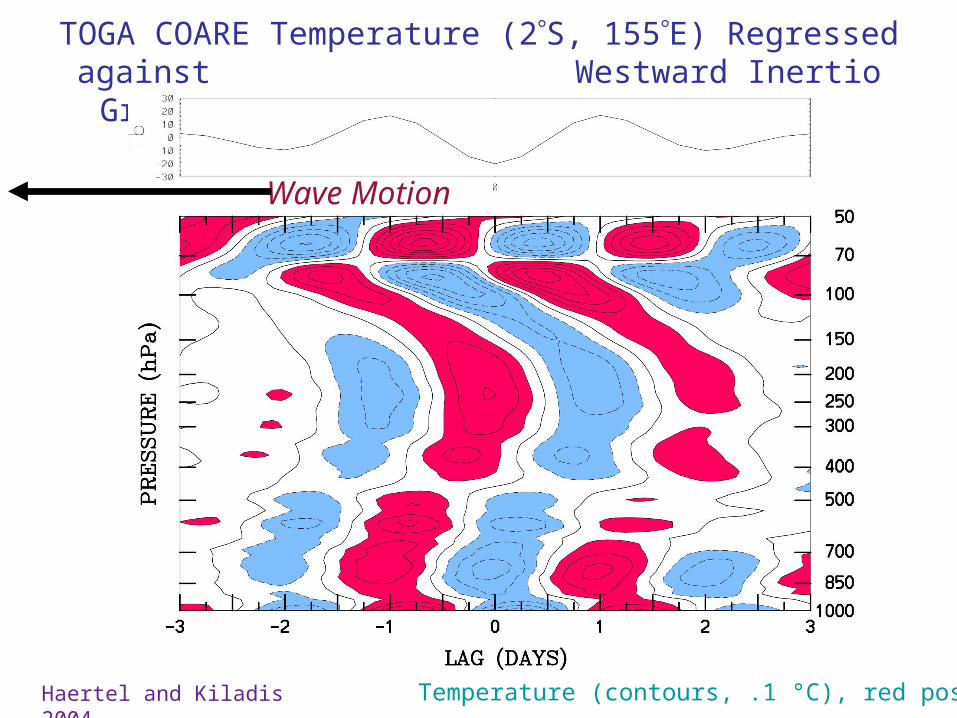
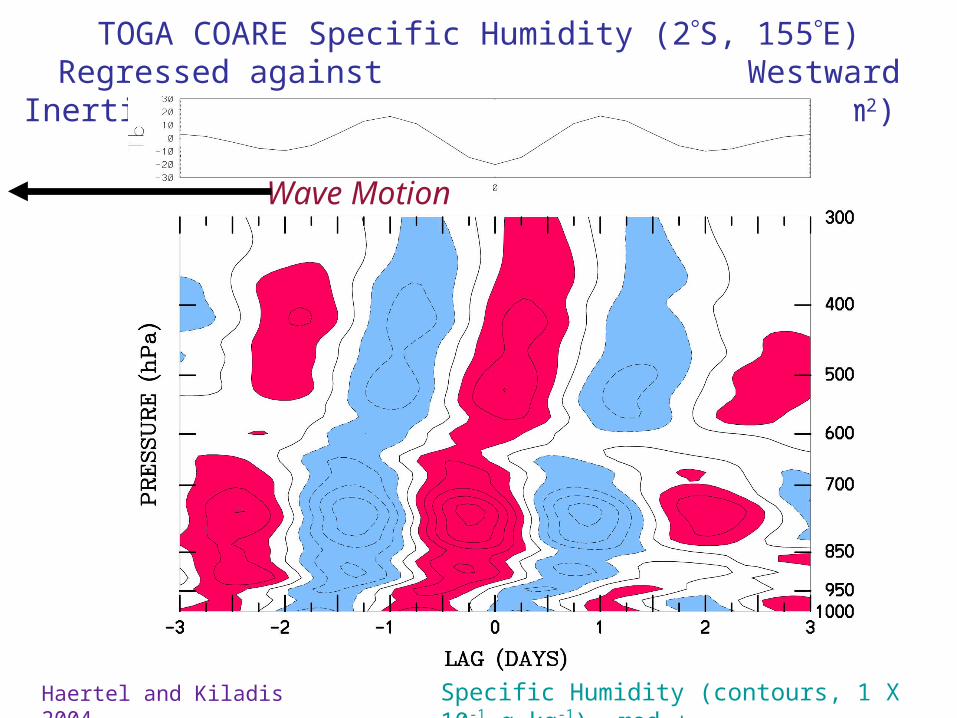
Haertel and Kiladis 2004
TOGA COARE Temperature (2S, 155E) Regressed against Westward Inertio Gravity-filtered OLR (scaled -40 W m2)
Temperature (contours, .1 °C), red positive
Wave Motion
Haertel and Kiladis 2004
TOGA COARE Specific Humidity (2S, 155E) Regressed against Westward
Inertio Gravity-filtered OLR (scaled -40 W m2)
Specific Humidity (contours, 1 X 10⁻¹ g kg-1), red +
Wave Motion
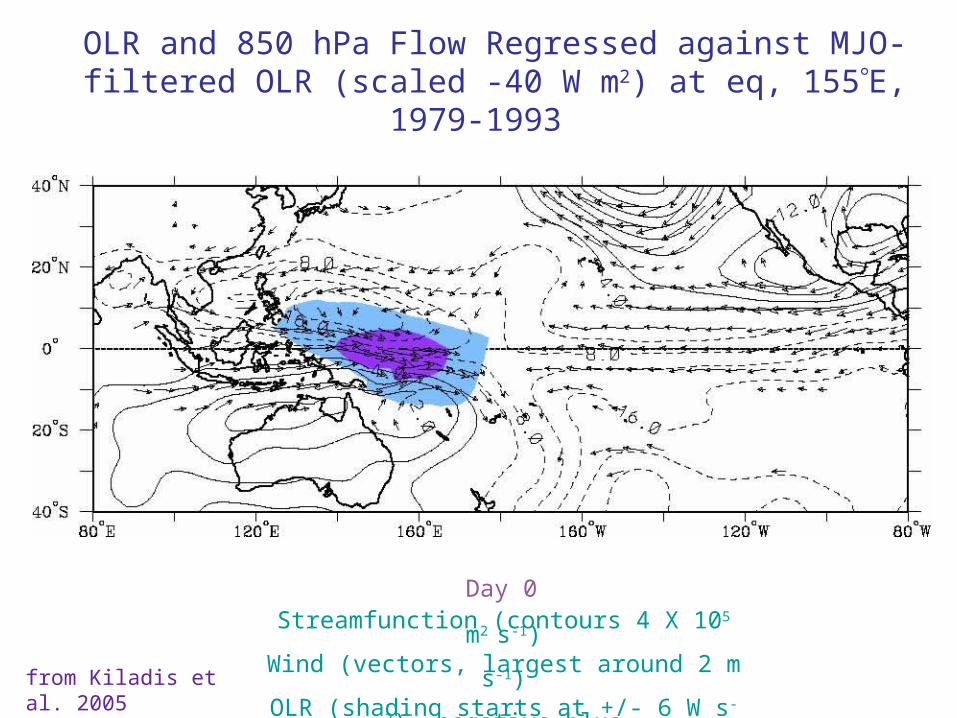
OLR and 850 hPa Flow Regressed against MJO-filtered OLR (scaled -40 W m2) at eq, 155E,
1979-1993
Day 0Streamfunction (contours 4 X 10⁵
m2 s-1)Wind (vectors, largest around 2 m
s-1)OLR (shading starts at +/- 6 W s-
2), negative blue
from Kiladis et al. 2005

OLR and 850 hPa Flow Regressed against MJO-filtered OLR (scaled -40 W m2) at eq, 155E,
1979-1993
Day-16Streamfunction (contours 4 X 10⁵
m2 s-1)Wind (vectors, largest around 2 m
s-1)OLR (shading starts at +/- 6 W s-
2), negative blue
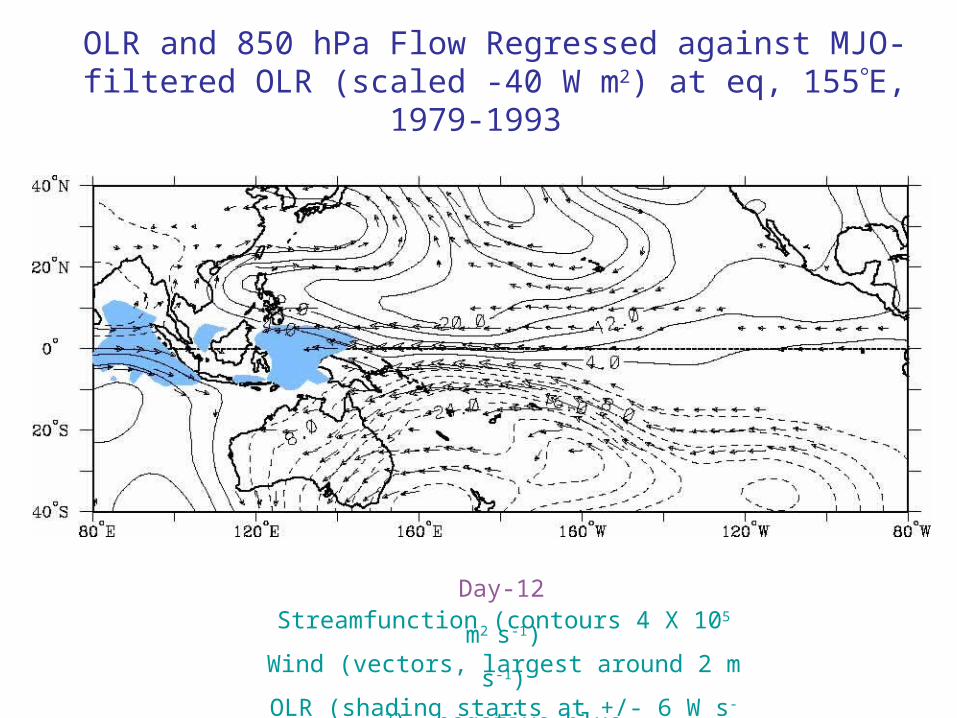
OLR and 850 hPa Flow Regressed against MJO-filtered OLR (scaled -40 W m2) at eq, 155E,
1979-1993
Day-12Streamfunction (contours 4 X 10⁵
m2 s-1)Wind (vectors, largest around 2 m
s-1)OLR (shading starts at +/- 6 W s-
2), negative blue
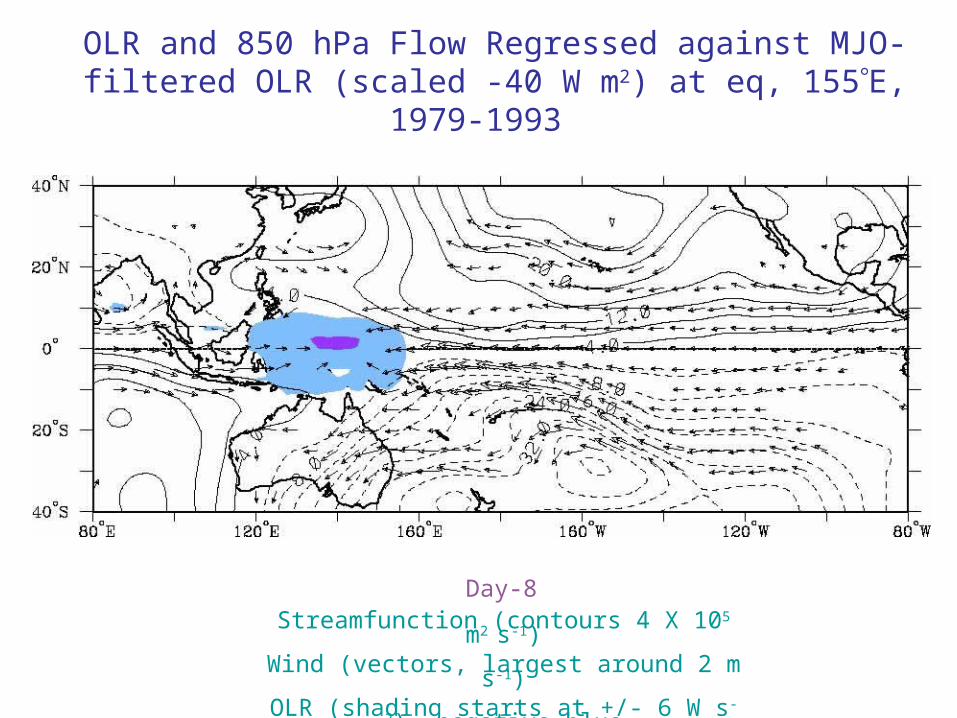
OLR and 850 hPa Flow Regressed against MJO-filtered OLR (scaled -40 W m2) at eq, 155E,
1979-1993
Day-8Streamfunction (contours 4 X 10⁵
m2 s-1)Wind (vectors, largest around 2 m
s-1)OLR (shading starts at +/- 6 W s-
2), negative blue
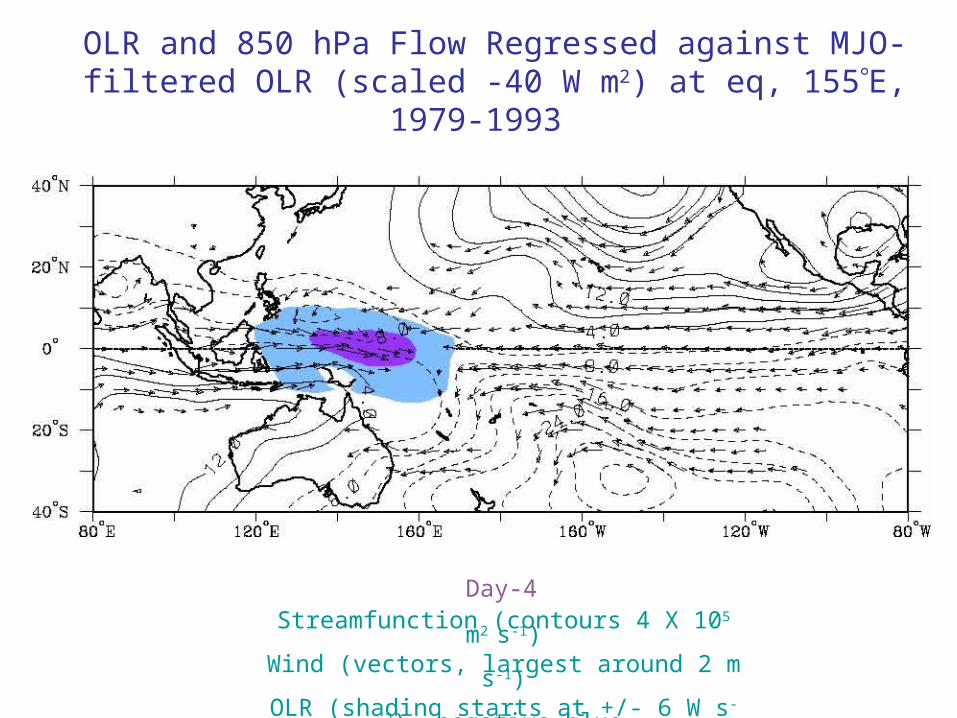
OLR and 850 hPa Flow Regressed against MJO-filtered OLR (scaled -40 W m2) at eq, 155E,
1979-1993
Day-4Streamfunction (contours 4 X 10⁵
m2 s-1)Wind (vectors, largest around 2 m
s-1)OLR (shading starts at +/- 6 W s-
2), negative blue

OLR and 850 hPa Flow Regressed against MJO-filtered OLR (scaled -40 W m2) at eq, 155E,
1979-1993
Day 0Streamfunction (contours 4 X 10⁵
m2 s-1)Wind (vectors, largest around 2 m
s-1)OLR (shading starts at +/- 6 W s-
2), negative blue
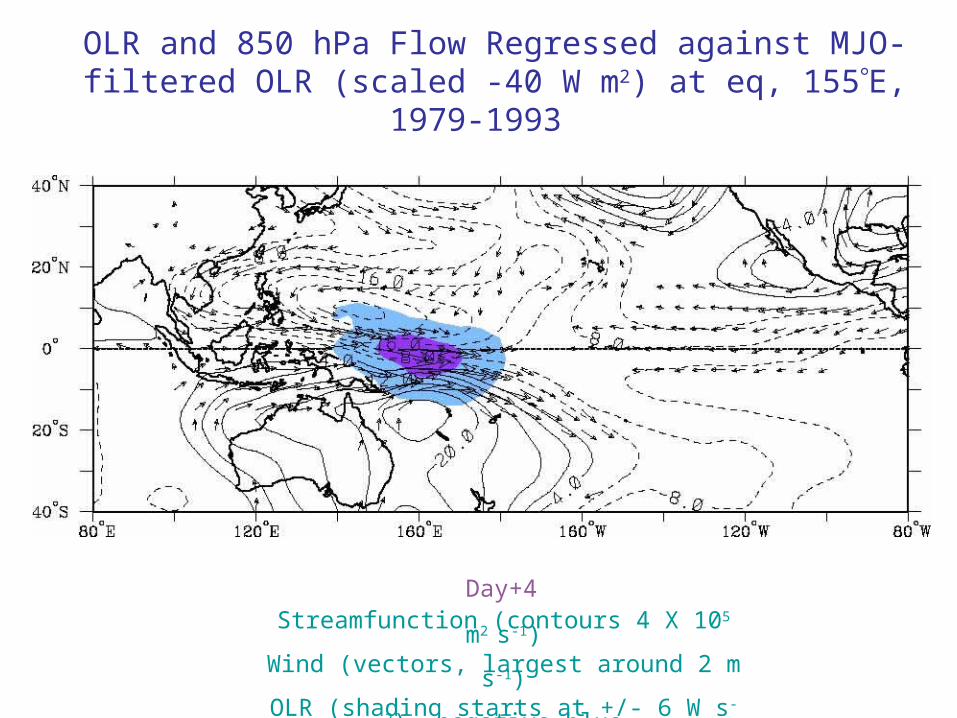
OLR and 850 hPa Flow Regressed against MJO-filtered OLR (scaled -40 W m2) at eq, 155E,
1979-1993
Day+4Streamfunction (contours 4 X 10⁵
m2 s-1)Wind (vectors, largest around 2 m
s-1)OLR (shading starts at +/- 6 W s-
2), negative blue

OLR and 850 hPa Flow Regressed against MJO-filtered OLR (scaled -40 W m2) at eq, 155E,
1979-1993
Day+8Streamfunction (contours 4 X 10⁵
m2 s-1)Wind (vectors, largest around 2 m
s-1)OLR (shading starts at +/- 6 W s-
2), negative blue
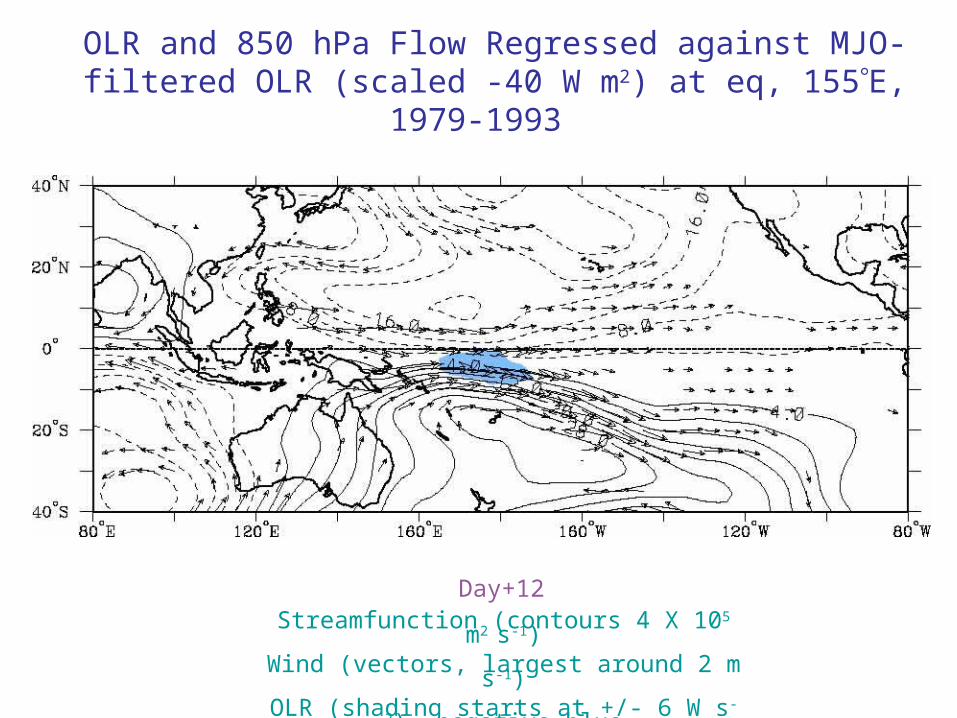
OLR and 850 hPa Flow Regressed against MJO-filtered OLR (scaled -40 W m2) at eq, 155E,
1979-1993
Day+12Streamfunction (contours 4 X 10⁵
m2 s-1)Wind (vectors, largest around 2 m
s-1)OLR (shading starts at +/- 6 W s-
2), negative blue
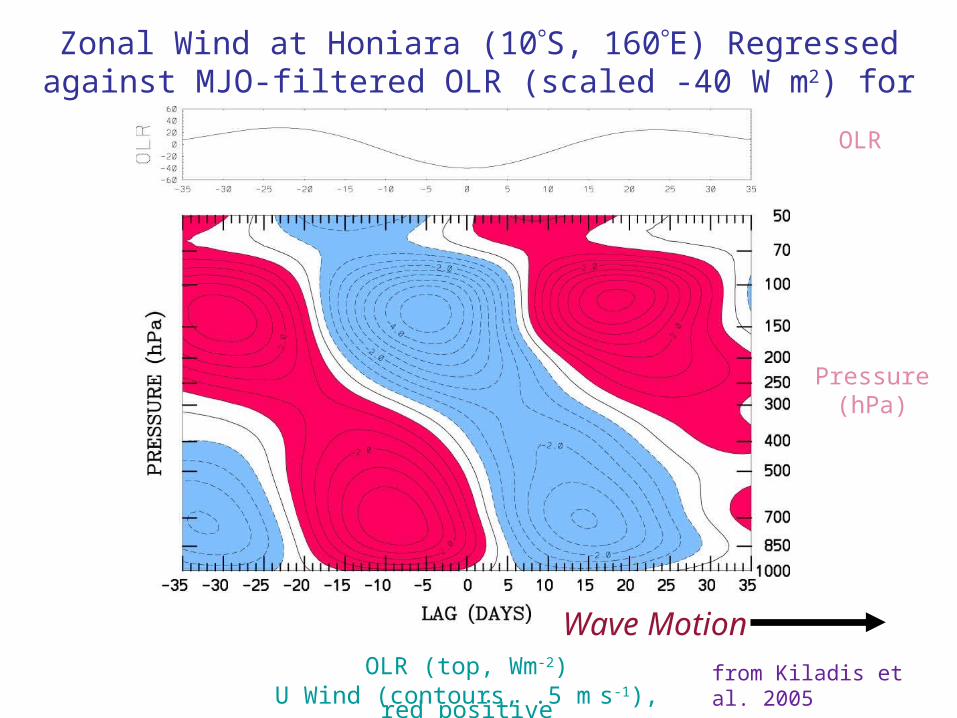
Zonal Wind at Honiara (10S, 160E) Regressed against MJO-filtered OLR (scaled -40 W m2) for
1979-1999
OLR (top, Wm-2)U Wind (contours, .5 m s-1),
red positive
OLR
Pressure(hPa)
from Kiladis et al. 2005
Wave Motion
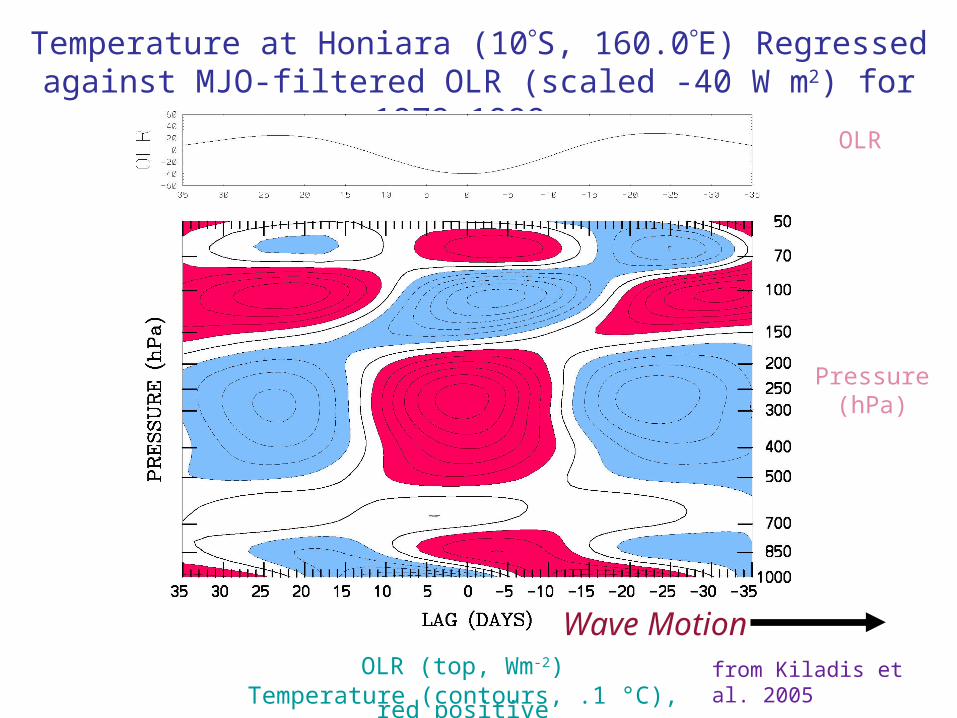
Temperature at Honiara (10S, 160.0E) Regressed against MJO-filtered OLR (scaled -40 W m2) for
1979-1999
OLR (top, Wm-2)Temperature (contours, .1 °C),
red positive
OLR
Pressure(hPa)
from Kiladis et al. 2005
Wave Motion
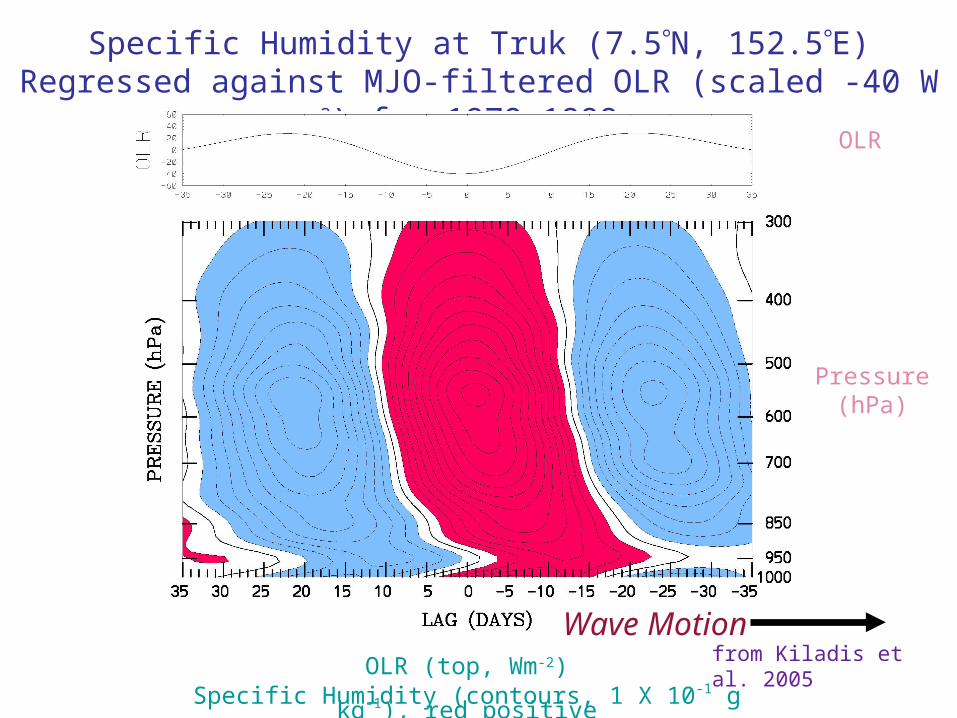
Specific Humidity at Truk (7.5N, 152.5E) Regressed against MJO-filtered OLR (scaled -40 W
m2) for 1979-1999
OLR (top, Wm-2)Specific Humidity (contours, 1 X 10⁻¹ g
kg-1), red positive
OLR
Pressure(hPa)
from Kiladis et al. 2005
Wave Motion
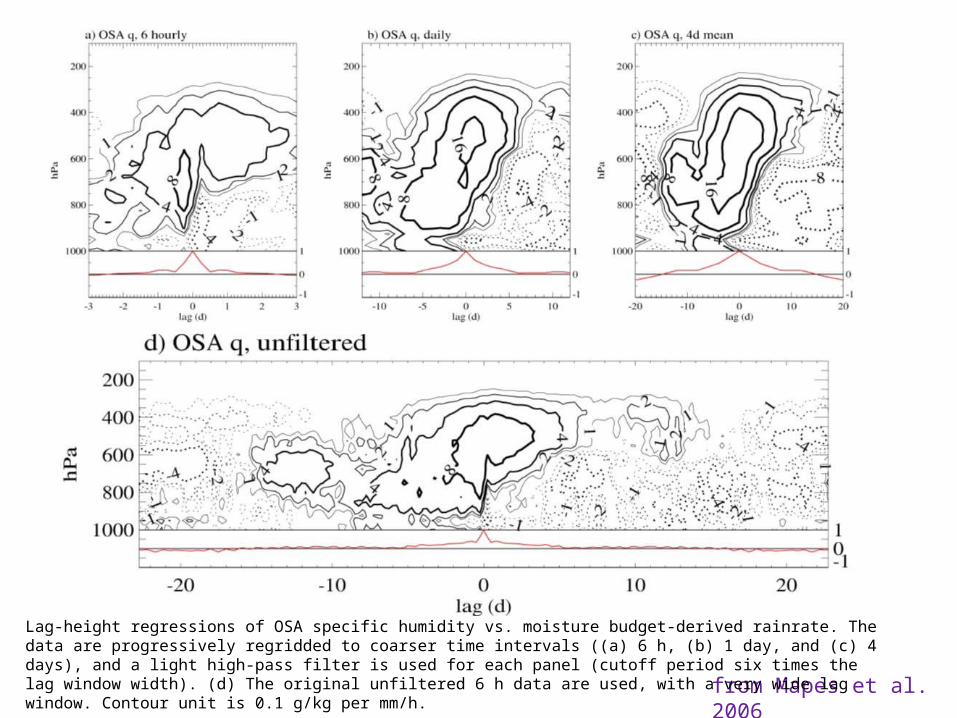
from Mapes et al. 2006
Lag-height regressions of OSA specific humidity vs. moisture budget-derived rainrate. The data are progressively regridded to coarser time intervals ((a) 6 h, (b) 1 day, and (c) 4 days), and a light high-pass filter is used for each panel (cutoff period six times the lag window width). (d) The original unfiltered 6 h data are used, with a very wide lag window. Contour unit is 0.1 g/kg per mm/h.
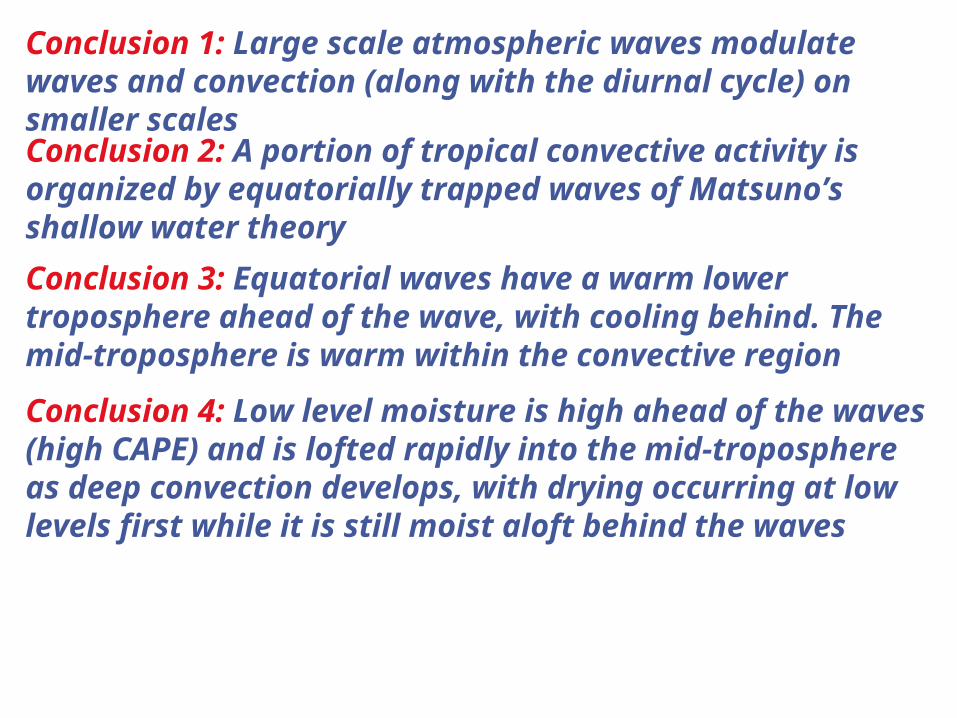
Conclusion 2: A portion of tropical convective activity is organized by equatorially trapped waves of Matsuno’s shallow water theory
Conclusion 1: Large scale atmospheric waves modulate waves and convection (along with the diurnal cycle) on smaller scales
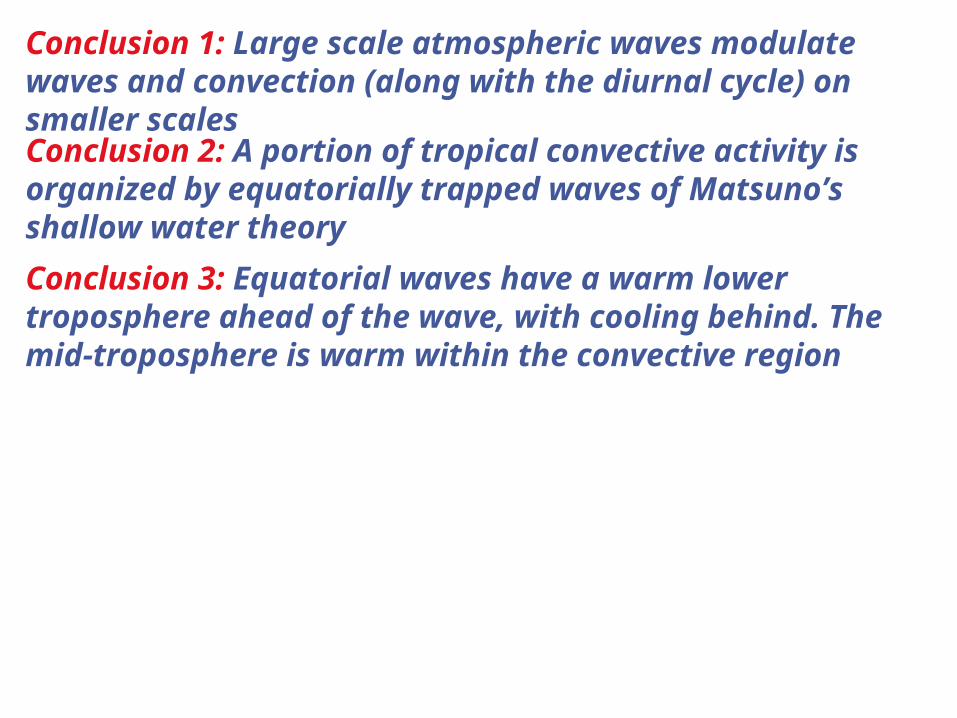
Conclusion 2: A portion of tropical convective activity is organized by equatorially trapped waves of Matsuno’s shallow water theoryConclusion 3: Equatorial waves have a warm lower troposphere ahead of the wave, with cooling behind. The mid-troposphere is warm within the convective region
Conclusion 1: Large scale atmospheric waves modulate waves and convection (along with the diurnal cycle) on smaller scales
Conclusion 4: Low level moisture is high ahead of the waves (high CAPE) and is lofted rapidly into the mid-troposphere as deep convection develops, with drying occurring at low levels first while it is still moist aloft behind the waves

Haertel and Kiladis 2004
TOGA COARE Diabatic Heating Q1 (2S, 155E) Regressed against Westward
Inertio Gravity-filtered OLR (scaled -40 W m2)
Diabatic Heating (contours, °K/day), red +
Wave MotionWave Motion
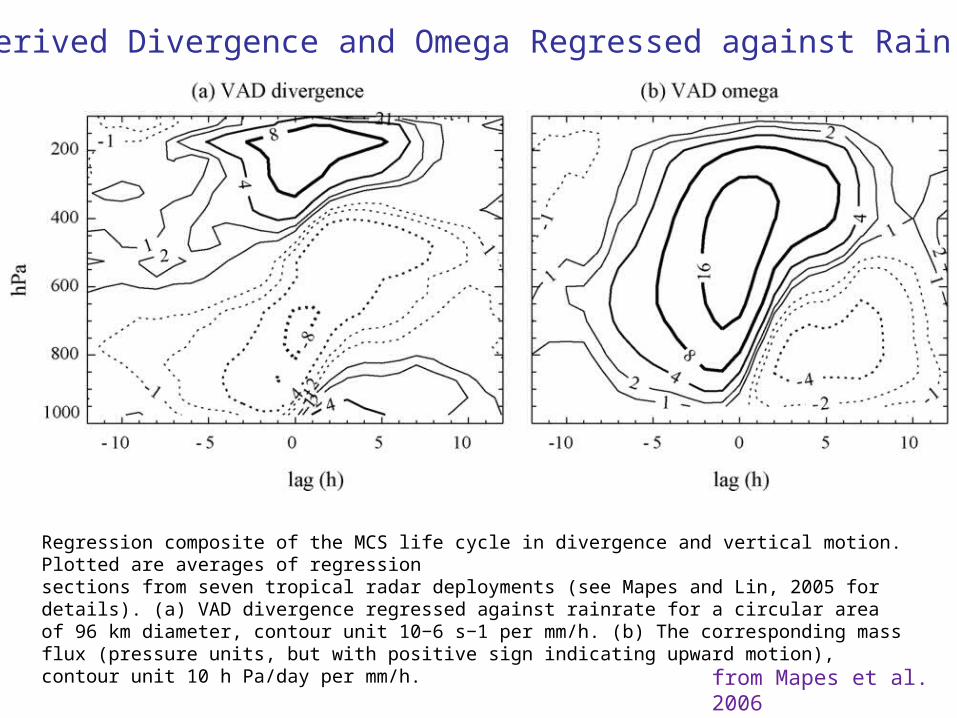
Radar Derived Divergence and Omega Regressed against Rain Rate
from Mapes et al. 2006
Regression composite of the MCS life cycle in divergence and vertical motion. Plotted are averages of regressionsections from seven tropical radar deployments (see Mapes and Lin, 2005 for details). (a) VAD divergence regressed against rainrate for a circular area of 96 km diameter, contour unit 10−6 s−1 per mm/h. (b) The corresponding mass flux (pressure units, but with positive sign indicating upward motion), contour unit 10 h Pa/day per mm/h.

Q1 Regressed against MJO-filtered OLR over the IFA during COARE
from Kiladis et al. 2005
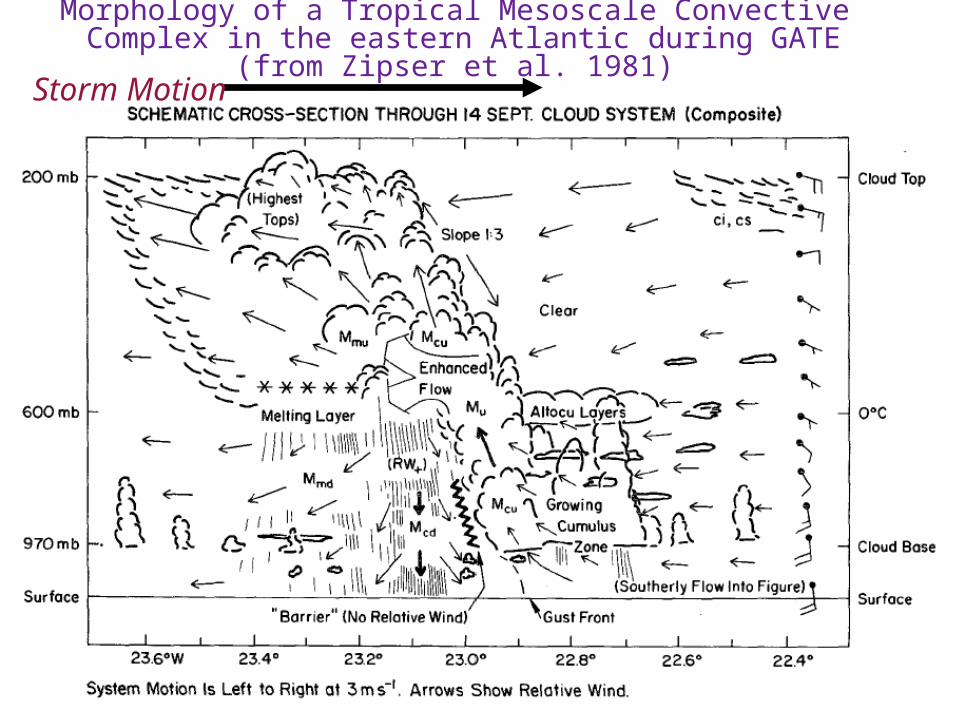
Morphology of a Tropical Mesoscale Convective Complex in the eastern Atlantic during GATE
(from Zipser et al. 1981)Storm Motion

Observed Kelvin wave morphology (from Straub and Kiladis 2003)
Wave Motion

Two day (WIG) wave cloud morphology (from Takayabu et al. 1996)
Wave Motion

from Benedict and Randall, 2007
MJO Propagation
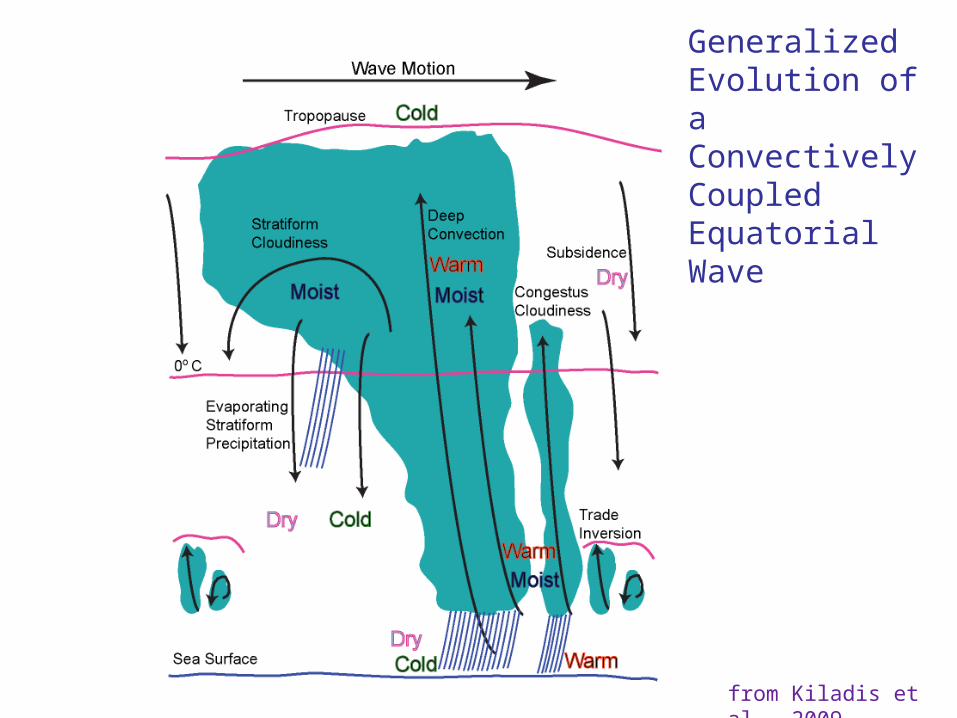
from Kiladis et al., 2009
Generalized Evolution of a Convectively Coupled Equatorial Wave
Conclusion 2: A portion of tropical convective activity is organized by equatorially trapped waves of Matsuno’s shallow water theoryConclusion 3: Equatorial waves have a warm lower troposphere ahead of the wave, with cooling behind. The mid-troposphere is warm within the convective region
Conclusion 1: Large scale atmospheric waves modulate waves and convection (along with the diurnal cycle) on smaller scales
Conclusion 4: Low level moisture is high ahead of the waves (high CAPE) and is lofted rapidly into the mid-troposphere as deep convection develops, with drying occurring at low levels first while it is still moist aloft behind the waves
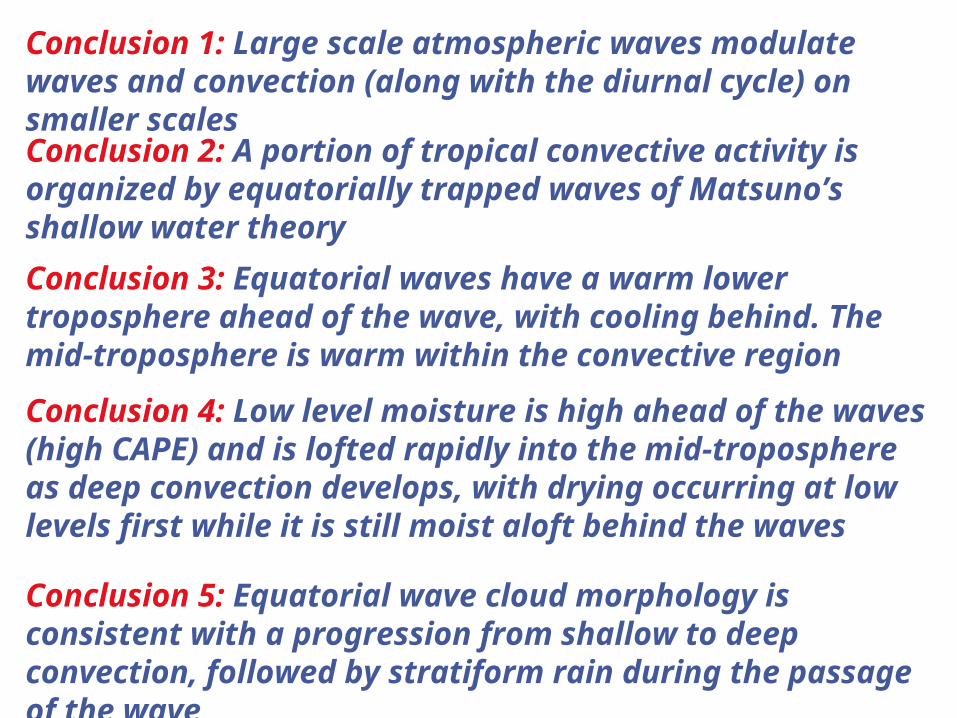
Conclusion 2: A portion of tropical convective activity is organized by equatorially trapped waves of Matsuno’s shallow water theoryConclusion 3: Equatorial waves have a warm lower troposphere ahead of the wave, with cooling behind. The mid-troposphere is warm within the convective region
Conclusion 1: Large scale atmospheric waves modulate waves and convection (along with the diurnal cycle) on smaller scales
Conclusion 4: Low level moisture is high ahead of the waves (high CAPE) and is lofted rapidly into the mid-troposphere as deep convection develops, with drying occurring at low levels first while it is still moist aloft behind the waves Conclusion 5: Equatorial wave cloud morphology is consistent with a progression from shallow to deep convection, followed by stratiform rain during the passage of the wave

Summary and QuestionSummary and Question
All waves examined have broadly self-similar vertical structures in terms of their dynamical fields (temperature, wind, pressure, diabatic heating, cloud morphology)
This is consistent with a progression of shallow to deep convection, followed by stratiform precipitation from the mesoscale on up to the MJO
Suggests a fundamental interaction between wave dynamics and convection across a wide range of scales
All waves examined have broadly self-similar vertical structures in terms of their dynamical fields (temperature, wind, pressure, diabatic heating, cloud morphology)
This is consistent with a progression of shallow to congestus and then deep convection, followed by stratiform precipitation from the mesoscale on up to the MJO
Suggests a fundamental interaction between wave dynamics and convection across a wide range of scales
Is a systematic cascade of energy from the mesoscale on up to the planetary scale crucial for the maintenance of equatorial waves?
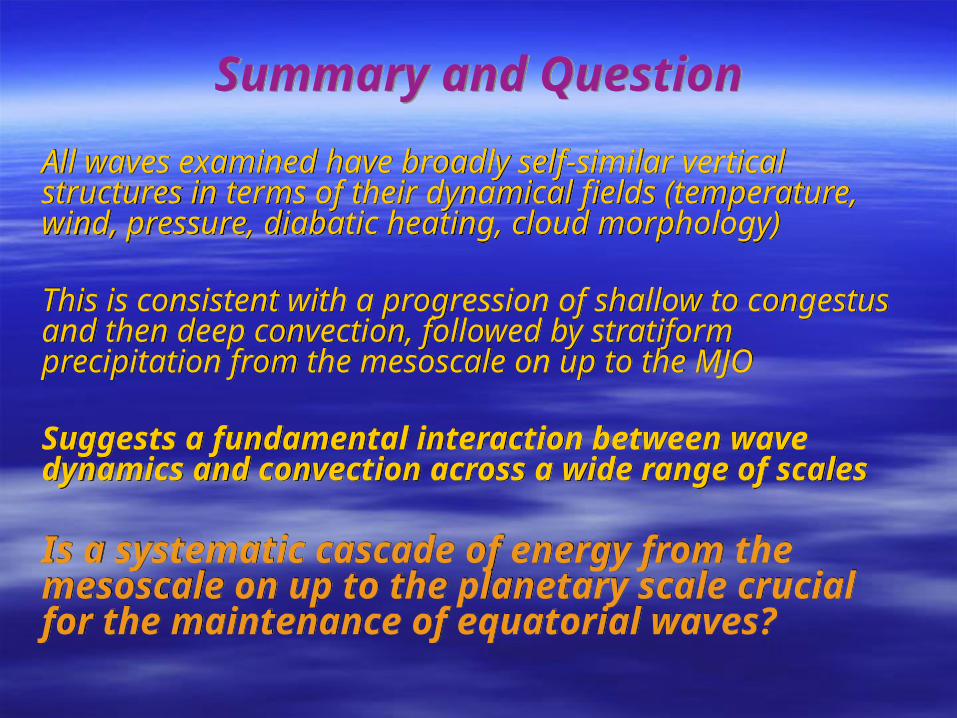
Summary and QuestionSummary and Question
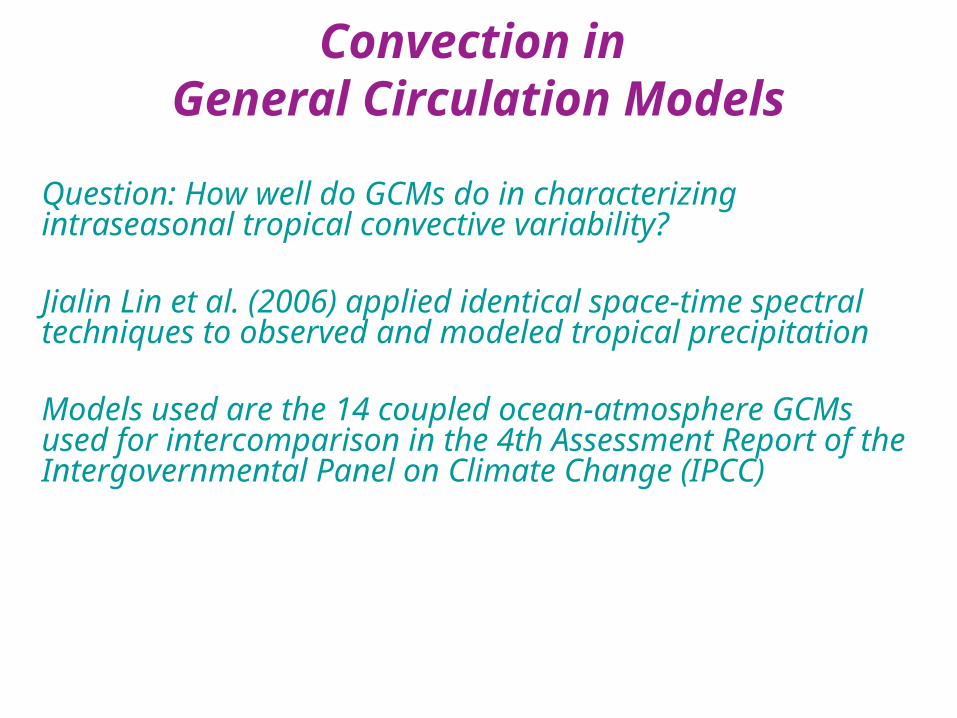
Convection in General Circulation Models
Question: How well do GCMs do in characterizing intraseasonal tropical convective variability?
Jialin Lin et al. (2006) applied identical space-time spectral techniques to observed and modeled tropical precipitation
Models used are the 14 coupled ocean-atmosphere GCMs used for intercomparison in the 4th Assessment Report of the Intergovernmental Panel on Climate Change (IPCC)
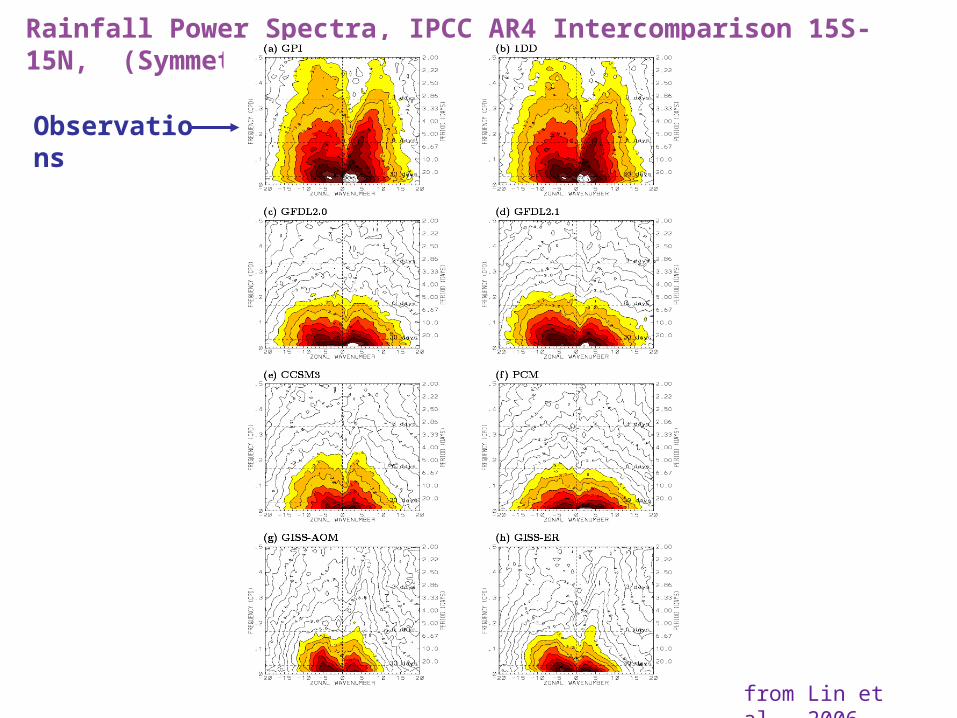
Rainfall Power Spectra, IPCC AR4 Intercomparison 15S-15N, (Symmetric)
from Lin et al., 2006
Observations
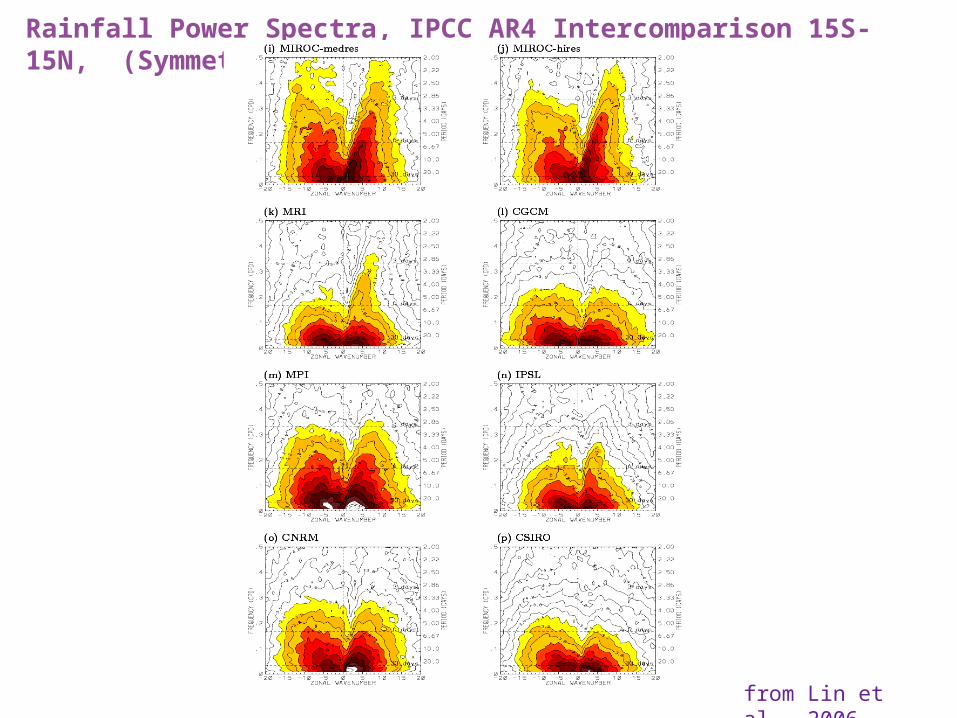
Rainfall Power Spectra, IPCC AR4 Intercomparison 15S-15N, (Symmetric)
from Lin et al., 2006
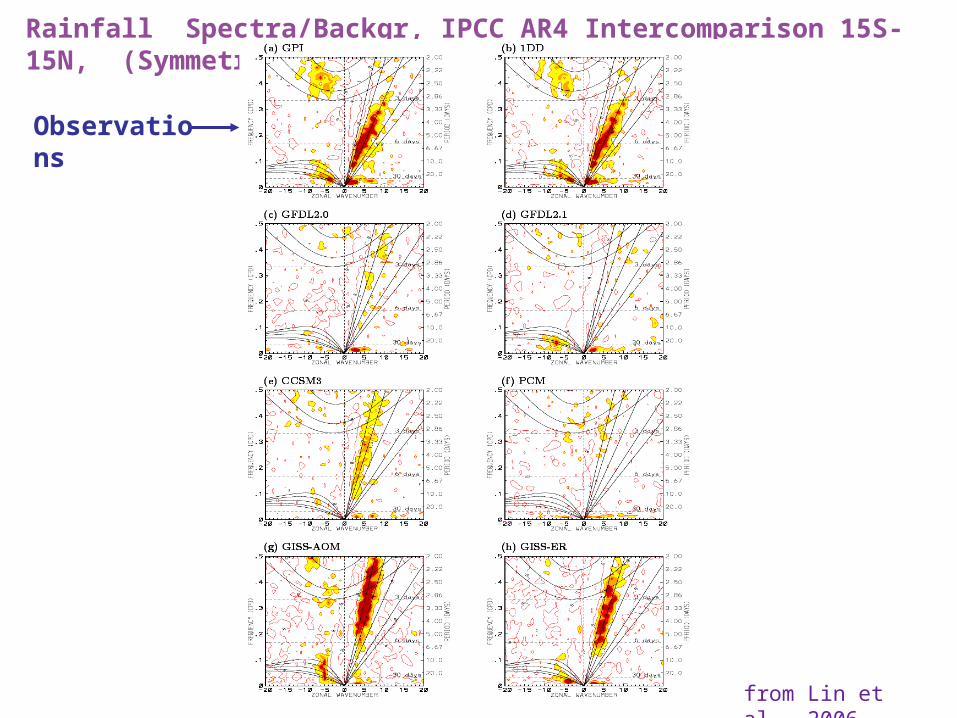
Rainfall Spectra/Backgr, IPCC AR4 Intercomparison 15S-15N, (Symmetric)
from Lin et al., 2006
Observations

from Lin et al., 2006
Rainfall Spectra/Backgr, IPCC AR4 Intercomparison 15S-15N, (Symmetric)

Rainfall Spectra/Backgr., IPCC AR4 Intercomparison 15S-15N, (Antisymm.)
from Lin et al., 2006
Observations
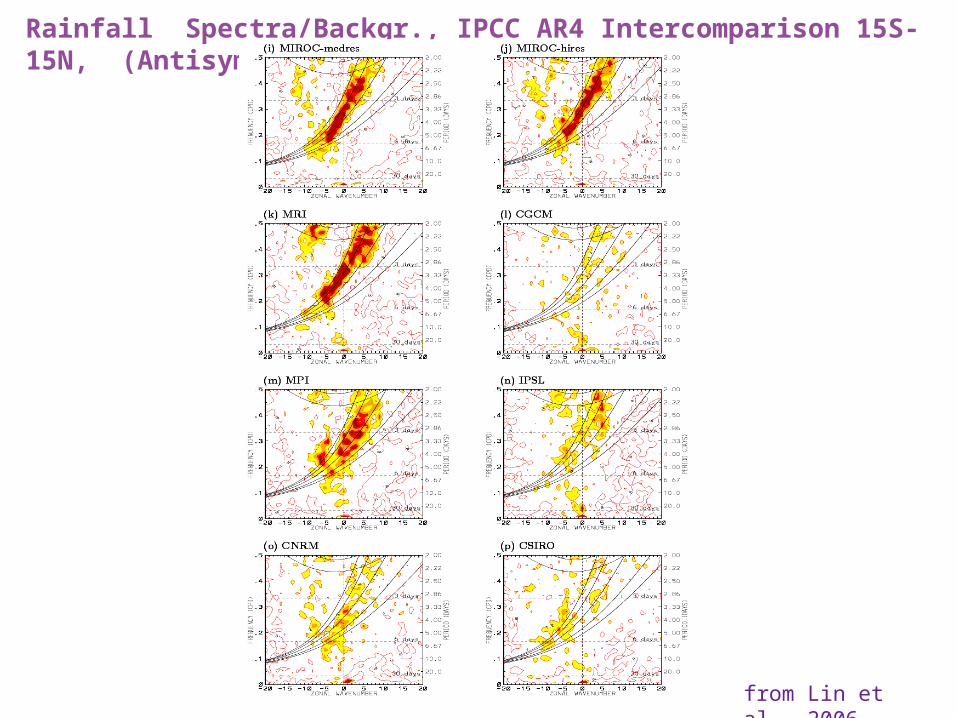
Rainfall Spectra/Backgr., IPCC AR4 Intercomparison 15S-15N, (Antisymm.)
from Lin et al., 2006
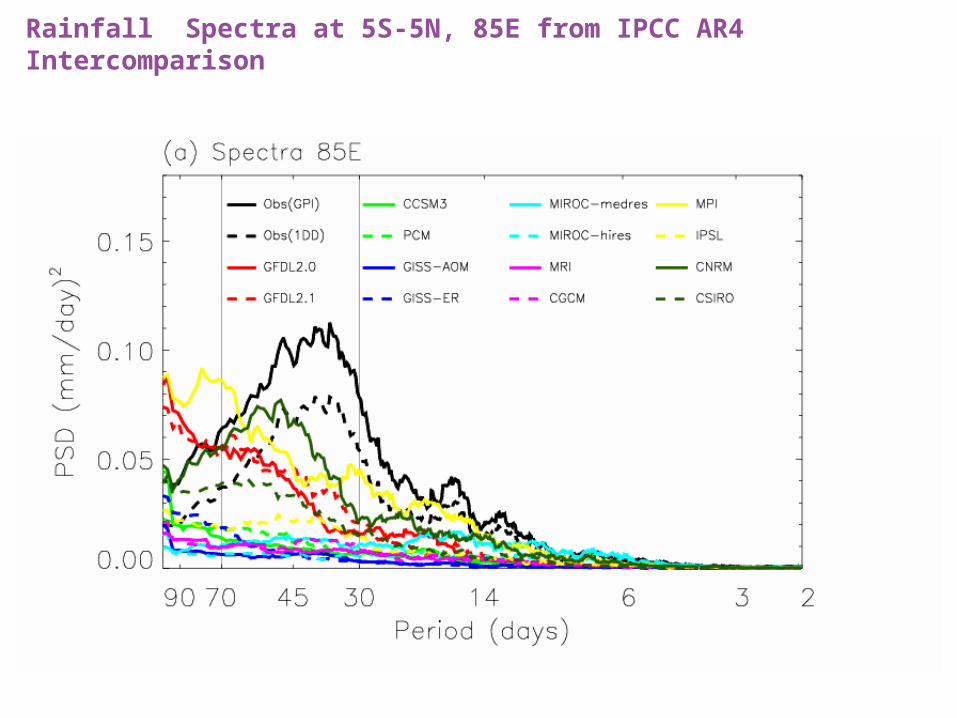
Rainfall Spectra at 5S-5N, 85E from IPCC AR4 Intercomparison

Models with good KW variability
CCSR, Japan
GISS-AOM, USA
GISS-EH, USA
GISS-ER, USA
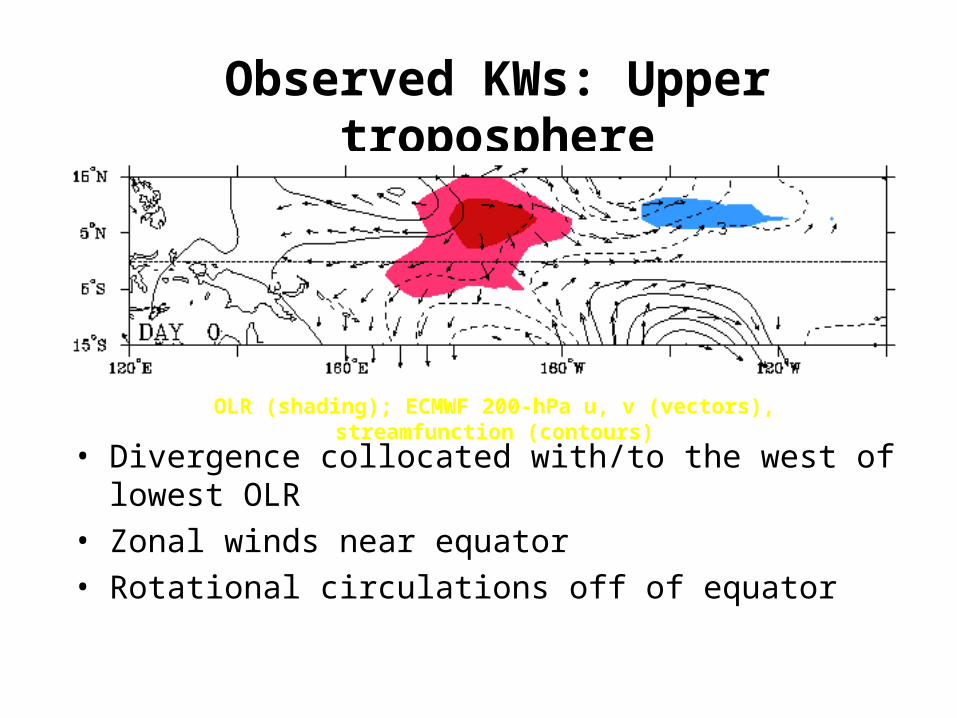
Observed KWs: Upper troposphere
• Divergence collocated with/to the west of lowest OLR
• Zonal winds near equator• Rotational circulations off of equator
OLR (shading); ECMWF 200-hPa u, v (vectors), streamfunction (contours)

Model KWs: Upper troposphere
MIUB
MPI
MRI
Precipitation (shading); 200-hPa u, v (vectors); streamfunction (contours)

Temperature at Majuro (7N, 171E) Regressed against Kelvin-filtered OLR
(scaled -40 W m2) for 1979-1999
OLR (top, Wm-2)Temperature (contours, .1 °C),
red positive
from Straub and Kiladis 2002
Wave Motion
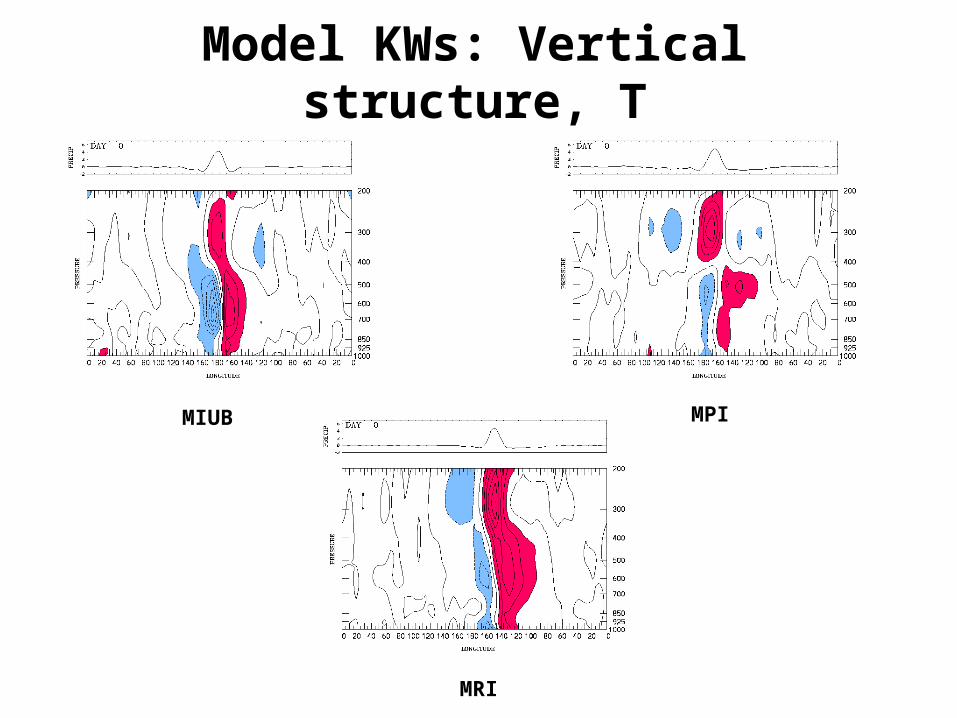
Model KWs: Vertical structure, T
MIUB MPI
MRI
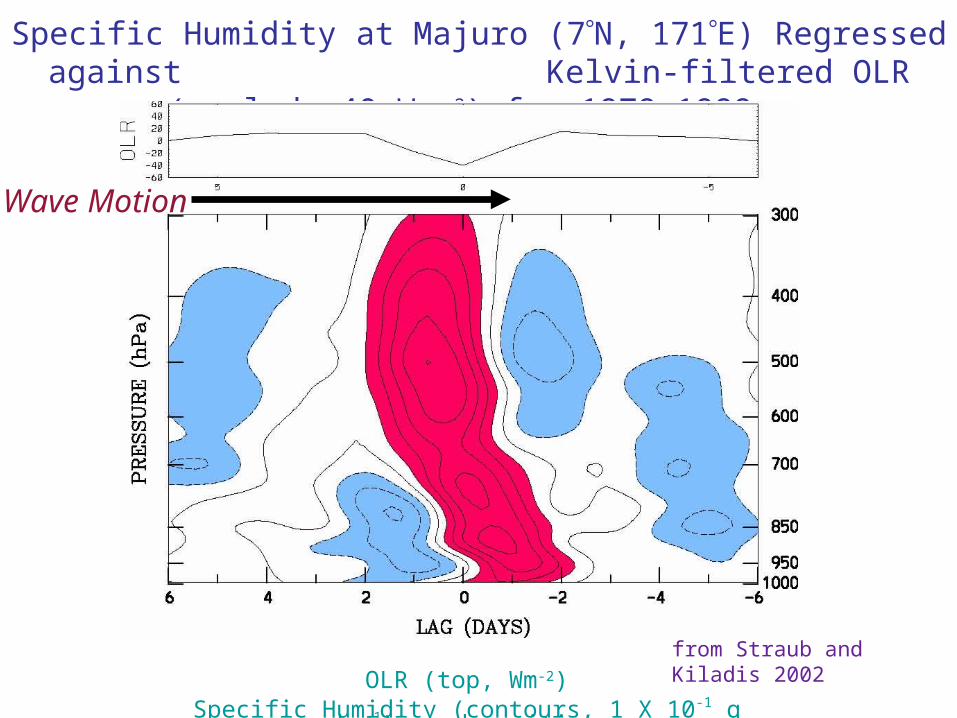
Specific Humidity at Majuro (7N, 171E) Regressed against Kelvin-filtered OLR
(scaled -40 W m2) for 1979-1999
from Straub and Kiladis 2002OLR (top, Wm-2)
Specific Humidity (contours, 1 X 10⁻¹ g kg-1), red positive
Wave Motion
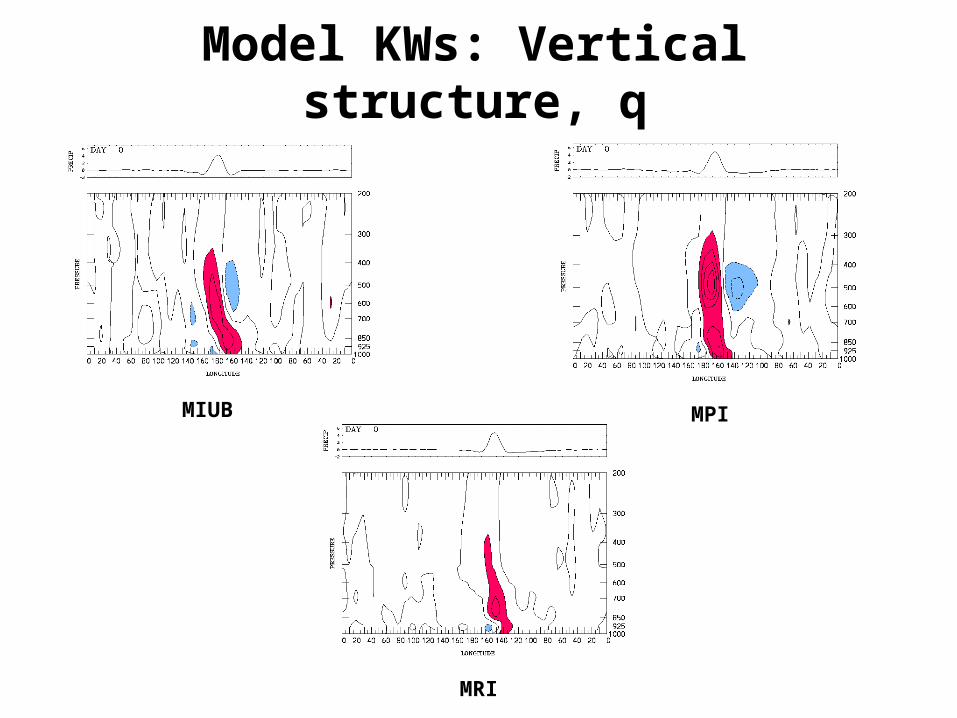
Model KWs: Vertical structure, q
MIUB MPI
MRI

Outstanding Issues
General Circulation Models do a relatively poor job in correctly simulating variability in tropical convection (but not necessarily its mean state)
Is this due to the misrepresentation of convection itself, or its coupling to the large scale (or both)?
Is convection even parameterizable in models?
Improvements in the representation of tropical convection will lead to improvements in medium-range weather forecasts in mid-latitudes (and perhaps to ENSO) What is the impact of poor tropical variability in GCMs on climate change scenarios?