detection of fog and low cloud boundaries with … · detection of fog and low cloud boundaries...
TRANSCRIPT
Detection of Fog and Low Cloud Boundaries with Ground-Based RemoteSensing Systems
DANIELA NOWAK
Institute for Atmospheric and Climate Science, ETH Zurich, Zurich, Switzerland
DOMINIQUE RUFFIEUX
Federal Office of Meteorology and Climatology, MeteoSwiss, Payerne, Switzerland
JUDITH L. AGNEW
STFC Rutherford Appleton Laboratory, Chilton, Didcot, United Kingdom
LAURENT VUILLEUMIER
Federal Office of Meteorology and Climatology, MeteoSwiss, Payerne, Switzerland
(Manuscript received 13 December 2006, in final form 3 August 2007)
ABSTRACT
The performance of the boundary determination of fog and low stratiform cloud layers with data from afrequency-modulated continuous-wave (FMCW) cloud radar and a Vaisala ceilometer is assessed. Duringwintertime stable episodes, fog and low stratiform cloud layers often occur in the Swiss Plateau, where theaerological station of Payerne, Switzerland, is located. During the international COST 720 Temperature,Humidity, and Cloud (TUC) profiling experiment in winter 2003/04, both a cloud radar and a ceilometerwere operated in parallel, among other profiling instruments. Human eye observations (“synops”) andtemperature and humidity profiles from radiosoundings were used as reference for the validation. Inaddition, two case studies were chosen to demonstrate the possibilities and limitations of such ground-basedremote sensing systems in determining low clouds. In these case studies the cloud boundaries determinedby ceilometer and cloud radar were furthermore compared with wind profiler signal-to-noise ratio timeseries. Under dry conditions, cloud-base and -top detection was possible in 59% and 69% of the cases forlow stratus clouds and fog situations, respectively. When cases with any form of precipitation were included,performances were reduced with detection rates of 41% and 63%, respectively. The combination of ceilo-meter and cloud radar has the potential for providing the base and top of a cloud layer with optimalefficiency in the continuous operational mode. The cloud-top height determination by the cloud radarwas compared with cloud-top heights detected using radiosounding humidity profiles. The average heightdifference between the radiosounding and cloud radar determination of the cloud upper boundary is 53 �32 m.
1. Introduction
Precise forecasting of the formation, evolution, anderosion of fog and low stratus is a major challenge formeteorology, especially in complex topography. One ofthe goals of the COST 720 Temperature, Humidity, andCloud (TUC) winter experiment undertaken in Swit-
zerland in 2003/04 (Ruffieux et al. 2006) was to providea dataset for determining the base and top of low cloudsusing a simple combination of ground-based remotesensing instruments.
Frequent and detailed information about the meteo-rological conditions are important for weather forecast-ers, climate studies, and aviation control. One of thehigh priority duties of observers is the description of theevolution of clouds, especially within the planetaryboundary layer. However, automatic weather reportsare becoming important because human observationsare becoming more difficult to organize, especially dur-
Corresponding author address: Daniela Nowak, Federal Officeof Meteorology and Climatology, MeteoSwiss, Les Invuardes,CH-1530 Payerne, Switzerland.E-mail: [email protected]
AUGUST 2008 N O W A K E T A L . 1357
DOI: 10.1175/2007JTECHA950.1
© 2008 American Meteorological Society
JTECHA950
ing nighttime (Aviolat et al. 1998). The cloud amount(sky coverage in octas) can be automatically estimatedusing for example incoming longwave radiation andsurface parameters (Dürr and Philipona 2004). How-ever, this method does not include information oncloud-base and -top height, and such measurements arecrucial for a variety of applications. Cloud-base and-top heights are important in order to describe the im-pact of clouds in a changing climate (Ramanathan et al.1989), and there is a general need for improvement ofautomatic cloud observation at weather stations andcontinuous cloud description for climatological issues.For aviation and traffic, such systems improve the de-tection of fog and low stratus, but the prediction of theirappearance and dispersion is still an ongoing challenge.High-resolution observations of the cloud and fogboundaries can help modelers verify and improve localfog prediction models or numerical weather prediction/climate models (e.g., the Baltex Bridge Campaign;Crewell et al. 2004). In response to such demands, long-term and high-resolution cloud-base and -top heightmeasurements are performed at some meteorologicalstations [e.g., at Chilbolton Observatory (United King-dom), at the Site Instrumental de Recherche parTélédétection Atmosphérique (SIRTA) in Palaiseau(France), and in Cabauw (Netherlands), where long-term cloud measurement schemes were developed aspart of the Cloudnet project (Illingworth et al. 2007)].
During wintertime stable episodes, fog and lowstratiform cloud layers often occur over the Swiss Pla-teau, a relatively flat region between the Jura Moun-tains to the north-northwest (1000–1500 MSL) and theAlps to the south-southeast (2000–2400 MSL). Theaerological station of Payerne, Switzerland, is located inthis area, and was the site of the international COST720 TUC profiling experiment (Ruffieux et al. 2006).This experiment, which took place during three monthsin winter 2003–04, was mainly designed to test ground-based temperature and humidity profiling systems andcloud detection instruments. Among other instruments,a Vaisala CT25K ceilometer and a 78-GHz frequency-modulated continuous-wave (FMCW) cloud radar wereinstalled and operated at the measurement site frommid-November 2003 to mid-February 2004.
In this paper a method to determine fog and lowstratiform cloud layers from cloud radar and ceilometerdata is described. The efficacy of the combination of thetwo systems during the winter 3-month period is as-sessed. In section 2, the instruments and the method ofthe determination of cloud or fog base and top aredescribed as well as the data used for validation of theresults (human eye observations, radiosoundings, and,as an additional confirmation, wind profiler data). In
section 3, the performance of the method is assessedfirst with the help of two selected cases and then overthe entire campaign. Section 4 presents a discussion ofthe performance of the studied remote sensing instru-ments for low cloud and fog detection and comparesour results with previous studies. Our concluding re-marks are given in section 5.
2. Instrumentation and method
The aerological station of Payerne is an officialWorld Meteorological Organization (WMO) site forsynoptic weather observations, including cloud infor-mation, which are performed every 3 h, starting at 0000UTC. It is also a site for balloon-borne meteorologicalradiosoundings including pressure, temperature, andhumidity profiling twice a day at 1200 and 0000 UTC(launched at 1100 and 2300 UTC respectively). (Radio-sondes are launched an hour before the officially re-ported time, in order to account for the balloon ascent.In the rest of the paper the official time will be re-ported, but comparison will be made with the data mea-sured at launching time.) In addition, a wind profiler isoperated continuously. During the TUC campaign, sev-eral additional radiosoundings were performed withdifferent types of radiosonde. A large set of additionalremote sensing instruments were operated, including aceilometer, a cloud radar, as well as microwave radi-ometers profiling temperature and humidity, and otherinstruments. The ceilometer and cloud radar were usedin combination for the detection of fog and stratiformlow clouds, and for determining their lower and upperboundaries. To estimate the detection efficiency, hu-man eye observations were used as a reference. Thedetermination of the upper boundary by the cloud ra-dar was compared with a determination using radio-sounding humidity profiles according to Wang et al.(1999). Technical details of the observation techniquesused for this study are listed in Table 1 and describedmore precisely below.
Cloud-base height was determined with a commer-cially available Vaisala ceilometer CT25K, using themeasured vertical visibility. This light detection andranging (lidar) system sends out short, powerful laserpulses (905 nm) in the vertical direction. The reflectionof light (backscatter) caused by aerosol, fog, mist,clouds, or precipitation is measured as the laser pulsestraverse the atmosphere. The resulting backscatter pro-file (signal strength versus height) is processed to detectcloud-base height. The ceilometer can detect up tothree cloud layers simultaneously and retrieve cloudheights every 30 s with a vertical resolution of 15 m upto 7.5 km above the ground. The minimum vertical vis-
1358 J O U R N A L O F A T M O S P H E R I C A N D O C E A N I C T E C H N O L O G Y VOLUME 25
ibility that can be measured is 15 m (e.g., in case of fog).A disadvantage of this system is that high cirrus cloudscan hardly be detected because they often occur above7.5 km. This kind of system is widely used to detectcloud-base heights and cloud cover (e.g., at airports orwithin climate studies such as stratocumulus research inthe southeast Pacific; Kollias et al. 2004).
The 78-GHz FMCW cloud radar, designed at theRutherford Appleton Laboratory, retrieves backscatterinformation at a time interval of 30 s. It is sensitive toclouds and precipitation and was set up to measure upto 8 km above the ground with a vertical resolution ofabout 15 m. The FMCW radar has a transmitter powerof approximately 120 mW. It transmits at a frequency of78.2 GHz with a frequency modulation of approxi-mately 10 MHz over a period of approximately 770 �s.In general cloud radars use two basic types of transmis-sion: pulsed or FMCW. The most important benefit ofthe FMCW system in this application is that it can makemeasurements at a shorter range than pulsed systems,which are typically only measuring above 150 m. Forthe system operated in Payerne during TUC campaign,the lowest detected cloud-top height is 65 m and theminimum range for the detection of mist or fog is about50 m above the radar. The radar was calibrated at theChilbolton Observatory, United Kingdom, alongsidethe pulsed 35-GHz Copernicus cloud radar. The resultsfrom this calibration indicate that the sensitivity of the78-GHz FMCW cloud radar is comparable to that of amodern pulsed cloud radar (Nash et al. 2005). It is stillbetter to use a ceilometer to detect the cloud base offog and low clouds, because such instruments are moreefficient and precise for this task (Clothiaux et al. 2000).With a FMCW system, the vertical resolution is con-trolled by the quality of the system phase noise, thecontinuous-wave slew rate, and the sampling speed ofthe detected signal, while fast Fourier transform effectstend to place a limit on the minimum detection height.For a pulsed system the minimum height is predomi-nantly determined by the length of the transmittedpulse, with no measurements possible below a heightequivalent to the pulse duration. FMCW radars are alsosimpler and cheaper than pulsed cloud radars, the costof a pulsed system being partly driven by the magne-tron, which needs replacement after few thousandhours of operation.
A simple empirical method was applied to retrievecloud-top height from the cloud radar (Ruffieux et al.2006). An automatic search for the cloud-top signallevel within a specified range was performed on eachvertical profile recorded by the FMCW cloud radar.Provided the maximum signal in a profile was higherthan a threshold value (indicating the presence of
TA
BL
E1.
Obs
erva
tion
tech
niqu
esan
din
stru
men
tsus
edfo
rth
est
udy,
oper
atio
nal
atth
em
eteo
rolo
gica
lst
atio
nin
Pay
erne
,Sw
itze
rlan
d(i
.e.,
syno
p,ra
dios
onde
s,w
ind
prof
iler)
and
expe
rim
enta
lfo
rth
eT
UC
cam
paig
n(i
.e.,
ceilo
met
eran
dcl
oud
rada
r).
Obs
erva
tion
tech
niqu
eP
aram
eter
Tim
ere
solu
tion
Hei
ght
reso
luti
onL
ower
limit
Upp
erlim
it
Fie
ldof
view
(ver
tica
l)M
anuf
actu
rer
Ref
eren
ces
Syno
p*C
loud
amou
nt,t
ype,
heig
ht;v
isib
ility
3h
30m
for
low
-lev
elcl
ouds
Gro
und
21km
180°
Mül
ler
(198
2)
FM
CW
clou
dra
dar
Clo
ud-t
ophe
ight
30s
15m
50m
8km
0.8°
Rut
herf
ord
App
leto
nL
abor
ator
y;U
KN
ash
etal
.(20
05)
CT
25K
ceilo
met
erC
loud
-bas
ehe
ight
30s
15m
15m
7.57
km�
0.6
mra
dV
aisa
la,F
inla
ndK
ollia
set
al.
(200
4)R
adio
sond
esSR
S40
0,Sn
owW
hite
,RS8
0A
Tem
pera
ture
,hum
idit
y,pr
essu
re12
h�
15m
20–3
0m
34–3
5km
Ver
tica
lpr
ofile
Met
eola
bor
AG
,Sw
itze
rlan
dR
ichn
er(1
999)
Vai
sala
,Fin
land
Ruf
fieu
xet
al.
(200
6)L
AP
3000
1290
-MH
zw
ind
prof
iler
Sign
al-t
o-no
ise
rati
o30
s42
m15
8m
1489
m6°
Vai
sala
,Fin
land
Nef
f(19
90)
*H
uman
eye
obse
rvat
ions
.
AUGUST 2008 N O W A K E T A L . 1359
cloud), the height of the maximum radar reflectivitywas registered. A second threshold value was specifiedfor determining the cloud top. The height at which thereflectivity decreased below this second threshold valuewas taken as the cloud top. The current configurationallowed the detection of the upper boundary for onecloud layer only.
Human eye observations (“synop”) were used to es-timate the efficiency of cloud detection by the ceilome-ter and cloud radar combination. Cloud cover, type,and base height are reported for the three main cloudlevels (low, middle, and high clouds) as well as theground visibility (Müller 1982). These human eye ob-servations are generally of excellent quality and giveregular and important information to meteorologistsabout the state of the sky, the meteorological condi-tions (fog, snow, rain, etc.), and the visibility. A knownlimitation is the restriction to the lowest cloud layer inthe case of multilayer clouds with full sky coverage ofthe lowest layer. In addition, observations are difficultto perform during nighttime; they remain subjectiveand may vary from one observer to another. However,such observations are extremely reliable for verifyingthe presence or absence of low clouds or fog.
For our study, fog situations were defined as eitherfog being reported or mist with a code 9 for the param-eter “total cloud cover” (sky not visible because of fog,snow, or other meteorological phenomenon). Situa-tions with fog or stratus clouds in combination withother clouds or more than one cloud layer were dis-carded and just low-level stratus and fog situations withtotal sky coverage (8 octas) were selected. This allowedtesting of the automatic detection of fog or stratusboundaries with the ceilometer and cloud radar insimple and clearly identified cases.
Three different radiosondes were used for humidityand temperature profiling during the TUC campaign.Operational radiosoundings were performed with theSRS 400 (Richner 1999; Ruffieux et al. 2006). In addi-tion, radiosoundings with the Snow White hygrometer(Miloshevic et al. 2006) were available for some of thestudied cloudy situations, and one case was detectedconcurrently with a sounding using the Vaisala RS80A(Verver et al. 2006). The radiosoundings include mea-surements of the temperature and relative humidityfrom the ground to about 35 km (relative humidity pro-files up to 12 km). The vertical resolution in the loweratmosphere is about 15 m (Table 1). Cloud layers wereidentified as regions with a relative humidity above agiven threshold. Cloud upper boundaries were deter-mined by finding sudden negative relative humidityjumps (hydrolapse; Wang et al. 1999). The thresholdschosen for this study depend on the radiosondes used
for the profile, the minimum being 93% for the SRS400.
Studies on specific cases also used information fromwind profiler signal-to-noise ratio (Gossard et al. 1982)time series measured concurrently. The wind profiler isused to observe the vertical profile of wind directionand velocity. It sends a signal at 1290 MHz when oper-ated at low mode, the vertical resolution is 42 m, thefirst layer of detection is at 158 m, and the maximumheight range is 1489 m AGL. Information on the cloudupper boundaries can be derived from the wind profilersignal because of the strong gradients at the cloud top:the backscattered signal from the wind profilers is di-rectly proportional to the refractive-index structurefunction parameter C2
n, and there is a close relationshipbetween refractive-index gradient with height and thedistribution of Bragg backscatter power (Gossard et al.1999). The refractive-index structure function param-eter C2
n profile depends mainly on temperature and hu-midity gradients in the atmosphere as well as turbu-lence. At the top of a well-defined stratus layer, thestrong change in humidity and temperature with heightas well as a possible increase of turbulence initiated bywind shear between the two distinct layers can be usedas information to detect it. In the presence of precipi-tation, however, this layer is often masked by the strongreturn from large falling particles.
3. Automatic detection of cloud base and top
a. Case studies
Two single-day case studies are chosen to demon-strate the possibilities and limitations of such ground-based remote sensing systems in determining lowclouds. The first case is typical of a day with low stratuschanging with time but remaining present the entireday. The second case represents a more complex situ-ation with a thick fog layer developing during the af-ternoon.
The first example illustrates a day with an excellentdetermination of the stratus (Fig. 1). On 9 December2003, a low-level stratus cloud layer was reported in thesynops at 0000, 0900, 1200, 1500, 1800, and 2100 UTCand at 0000 UTC the following day. At 0300 and 0600UTC, fog with visibility below 1 km was observed. Inthis situation a good determination of the fog and lowstratiform cloud situation was possible over 24 h. A fewmeasurement points of the cloud radar (cloud top) re-trieval are detected crossing or going below the ceilo-meter (cloud base) signal (after 0900 UTC and between1200 and 1800 UTC). This may be explained either bythe instruments pointing in slightly different directions,
1360 J O U R N A L O F A T M O S P H E R I C A N D O C E A N I C T E C H N O L O G Y VOLUME 25
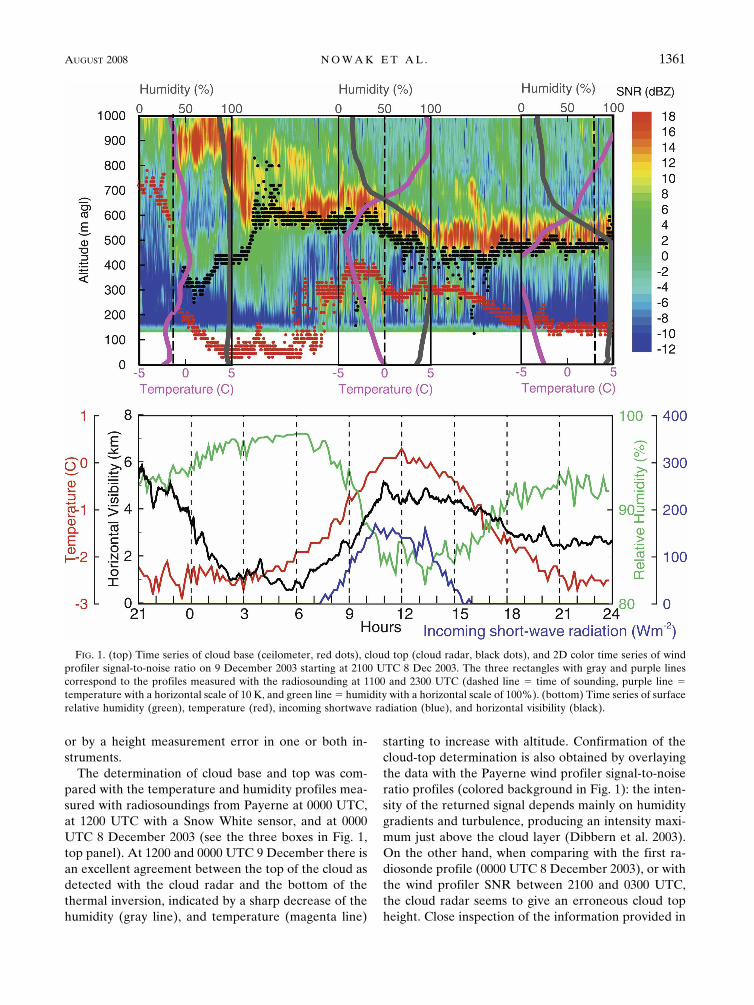
or by a height measurement error in one or both in-struments.
The determination of cloud base and top was com-pared with the temperature and humidity profiles mea-sured with radiosoundings from Payerne at 0000 UTC,at 1200 UTC with a Snow White sensor, and at 0000UTC 8 December 2003 (see the three boxes in Fig. 1,top panel). At 1200 and 0000 UTC 9 December there isan excellent agreement between the top of the cloud asdetected with the cloud radar and the bottom of thethermal inversion, indicated by a sharp decrease of thehumidity (gray line), and temperature (magenta line)
starting to increase with altitude. Confirmation of thecloud-top determination is also obtained by overlayingthe data with the Payerne wind profiler signal-to-noiseratio profiles (colored background in Fig. 1): the inten-sity of the returned signal depends mainly on humiditygradients and turbulence, producing an intensity maxi-mum just above the cloud layer (Dibbern et al. 2003).On the other hand, when comparing with the first ra-diosonde profile (0000 UTC 8 December 2003), or withthe wind profiler SNR between 2100 and 0300 UTC,the cloud radar seems to give an erroneous cloud topheight. Close inspection of the information provided in
FIG. 1. (top) Time series of cloud base (ceilometer, red dots), cloud top (cloud radar, black dots), and 2D color time series of windprofiler signal-to-noise ratio on 9 December 2003 starting at 2100 UTC 8 Dec 2003. The three rectangles with gray and purple linescorrespond to the profiles measured with the radiosounding at 1100 and 2300 UTC (dashed line � time of sounding, purple line �temperature with a horizontal scale of 10 K, and green line � humidity with a horizontal scale of 100%). (bottom) Time series of surfacerelative humidity (green), temperature (red), incoming shortwave radiation (blue), and horizontal visibility (black).
AUGUST 2008 N O W A K E T A L . 1361
Fig 1 live 4/C
the top panel of Fig. 1 reveals the reason for this dis-crepancy. First, between 0000 and 0300 UTC, the windprofiler shows higher SNR at two altitudes separated byone region of lower SNR. This may indicate multiplelayers in the first 1000 m, of which the cloud radarwould have picked the lowest one. Second, the tem-perature inversion was at 1500 m AGL (not shown),which is out of the limit chosen for the cloud radar topheight detection algorithm (1200 m, the study focuseson fog and low clouds). Finally, the ceilometer shows atransition period from a higher cloud layer to well de-tected low stratus cloud between 2100 and 0000 UTC.Thus, it can be assumed that there was a transitionperiod until 0400 UTC from a multilayer cloud situa-tion in the lower troposphere to a well-defined low stra-tus cloud situation for the rest of the day.
Surface information (Fig. 1 bottom) is consistent witha day constantly overcast with a low cloud layer or fog.The relative humidity (green) was high all day long(�80%), the temperature (red) shows only a modestincrease during daytime, and the incoming shortwaveradiation (global radiation, blue) is very low even atnoon. Similarly, the horizontal visibility was low all daycorresponding well with the low visibilities reported inthe synops, even though the correspondence is not per-fect (synops indicate �10 km of visibility at 0 UTC,then visibility �2 km until 1500 UTC, then again�10 km).
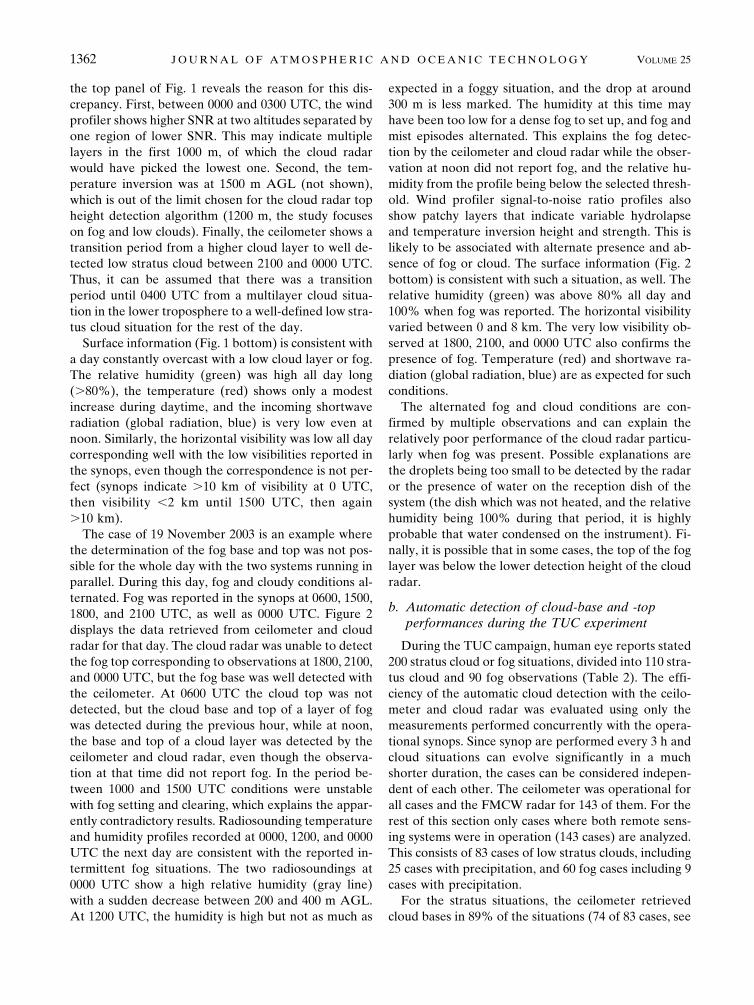
The case of 19 November 2003 is an example wherethe determination of the fog base and top was not pos-sible for the whole day with the two systems running inparallel. During this day, fog and cloudy conditions al-ternated. Fog was reported in the synops at 0600, 1500,1800, and 2100 UTC, as well as 0000 UTC. Figure 2displays the data retrieved from ceilometer and cloudradar for that day. The cloud radar was unable to detectthe fog top corresponding to observations at 1800, 2100,and 0000 UTC, but the fog base was well detected withthe ceilometer. At 0600 UTC the cloud top was notdetected, but the cloud base and top of a layer of fogwas detected during the previous hour, while at noon,the base and top of a cloud layer was detected by theceilometer and cloud radar, even though the observa-tion at that time did not report fog. In the period be-tween 1000 and 1500 UTC conditions were unstablewith fog setting and clearing, which explains the appar-ently contradictory results. Radiosounding temperatureand humidity profiles recorded at 0000, 1200, and 0000UTC the next day are consistent with the reported in-termittent fog situations. The two radiosoundings at0000 UTC show a high relative humidity (gray line)with a sudden decrease between 200 and 400 m AGL.At 1200 UTC, the humidity is high but not as much as
expected in a foggy situation, and the drop at around300 m is less marked. The humidity at this time mayhave been too low for a dense fog to set up, and fog andmist episodes alternated. This explains the fog detec-tion by the ceilometer and cloud radar while the obser-vation at noon did not report fog, and the relative hu-midity from the profile being below the selected thresh-old. Wind profiler signal-to-noise ratio profiles alsoshow patchy layers that indicate variable hydrolapseand temperature inversion height and strength. This islikely to be associated with alternate presence and ab-sence of fog or cloud. The surface information (Fig. 2bottom) is consistent with such a situation, as well. Therelative humidity (green) was above 80% all day and100% when fog was reported. The horizontal visibilityvaried between 0 and 8 km. The very low visibility ob-served at 1800, 2100, and 0000 UTC also confirms thepresence of fog. Temperature (red) and shortwave ra-diation (global radiation, blue) are as expected for suchconditions.
The alternated fog and cloud conditions are con-firmed by multiple observations and can explain therelatively poor performance of the cloud radar particu-larly when fog was present. Possible explanations arethe droplets being too small to be detected by the radaror the presence of water on the reception dish of thesystem (the dish which was not heated, and the relativehumidity being 100% during that period, it is highlyprobable that water condensed on the instrument). Fi-nally, it is possible that in some cases, the top of the foglayer was below the lower detection height of the cloudradar.
b. Automatic detection of cloud-base and -topperformances during the TUC experiment
During the TUC campaign, human eye reports stated200 stratus cloud or fog situations, divided into 110 stra-tus cloud and 90 fog observations (Table 2). The effi-ciency of the automatic cloud detection with the ceilo-meter and cloud radar was evaluated using only themeasurements performed concurrently with the opera-tional synops. Since synop are performed every 3 h andcloud situations can evolve significantly in a muchshorter duration, the cases can be considered indepen-dent of each other. The ceilometer was operational forall cases and the FMCW radar for 143 of them. For therest of this section only cases where both remote sens-ing systems were in operation (143 cases) are analyzed.This consists of 83 cases of low stratus clouds, including25 cases with precipitation, and 60 fog cases including 9cases with precipitation.
For the stratus situations, the ceilometer retrievedcloud bases in 89% of the situations (74 of 83 cases, see
1362 J O U R N A L O F A T M O S P H E R I C A N D O C E A N I C T E C H N O L O G Y VOLUME 25
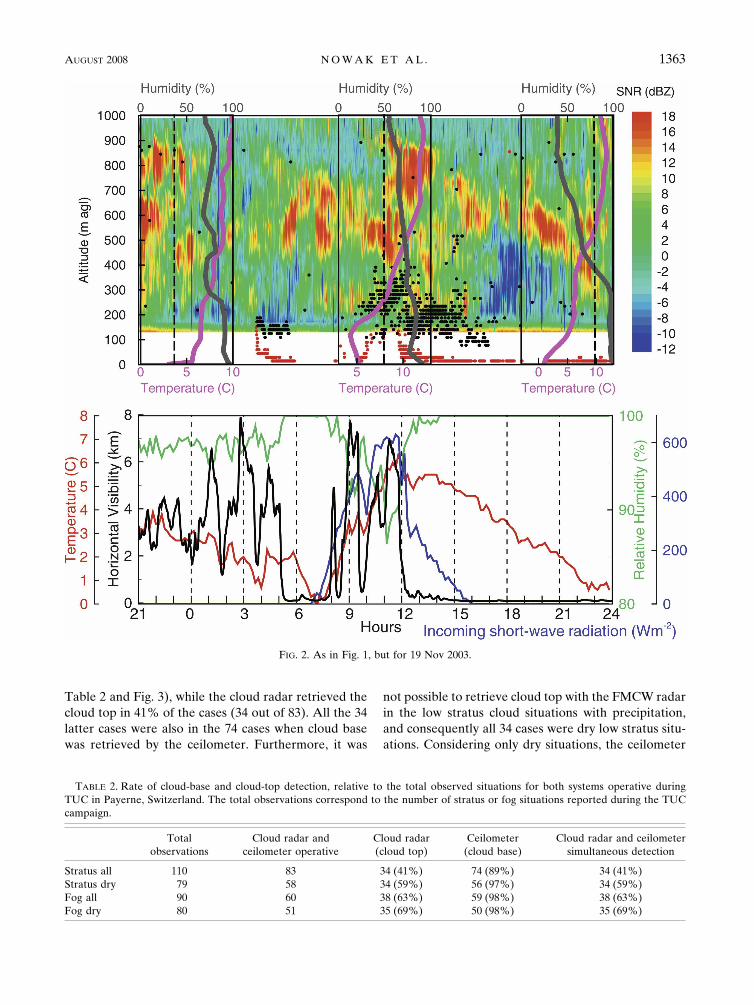
Table 2 and Fig. 3), while the cloud radar retrieved thecloud top in 41% of the cases (34 out of 83). All the 34latter cases were also in the 74 cases when cloud basewas retrieved by the ceilometer. Furthermore, it was
not possible to retrieve cloud top with the FMCW radarin the low stratus cloud situations with precipitation,and consequently all 34 cases were dry low stratus situ-ations. Considering only dry situations, the ceilometer
FIG. 2. As in Fig. 1, but for 19 Nov 2003.
TABLE 2. Rate of cloud-base and cloud-top detection, relative to the total observed situations for both systems operative duringTUC in Payerne, Switzerland. The total observations correspond to the number of stratus or fog situations reported during the TUCcampaign.
Totalobservations
Cloud radar andceilometer operative
Cloud radar(cloud top)
Ceilometer(cloud base)
Cloud radar and ceilometersimultaneous detection
Stratus all 110 83 34 (41%) 74 (89%) 34 (41%)Stratus dry 79 58 34 (59%) 56 (97%) 34 (59%)Fog all 90 60 38 (63%) 59 (98%) 38 (63%)Fog dry 80 51 35 (69%) 50 (98%) 35 (69%)
AUGUST 2008 N O W A K E T A L . 1363
Fig 2 live 4/C
retrieved the cloud base in 97% of the cases (56 out of58), and the cloud radar also detected the cloud top in59% of the cases.
In 59 of the 60 fog situations, the vertical visibilitycould be retrieved by the ceilometer (98%), leading tothe detection of a lower boundary, while the cloud ra-dar detected the cloud top in 63% of the situations (38of 60 cases). In fog situations also, precipitation againmade cloud-top detection with the cloud radar moredifficult. Three situations with drizzle were detected bythe cloud radar out of nine fog situations with precipi-tation. When cases with any form of precipitation aredisregarded, the fog detection with both systemsworked for 69% of the observed fog situations (35 of 51cases).
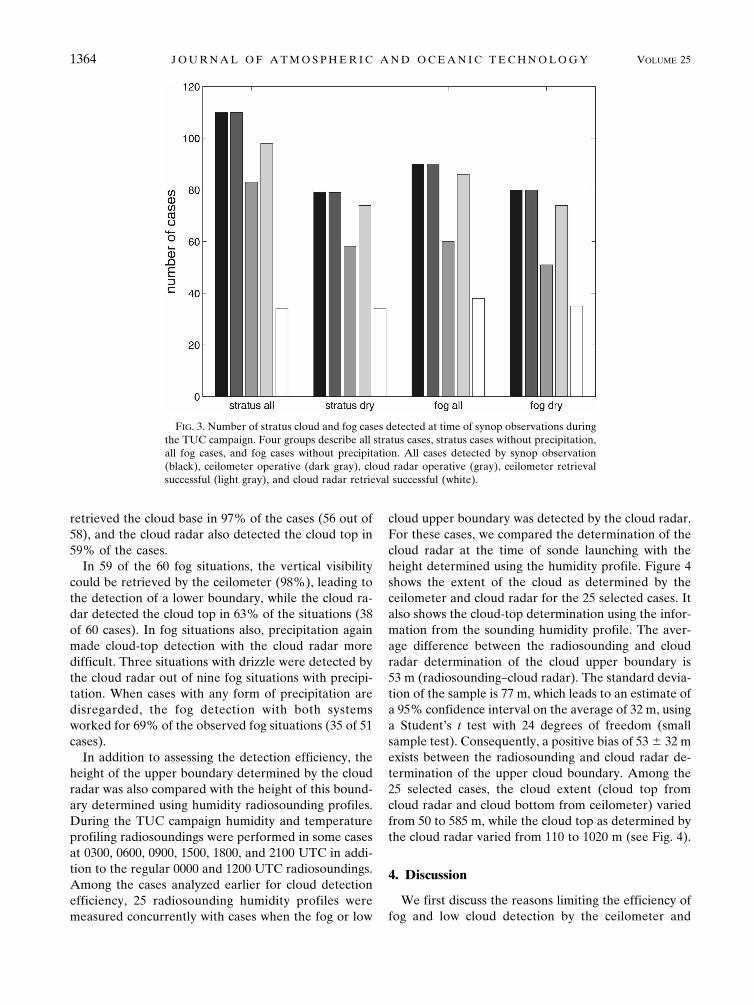
In addition to assessing the detection efficiency, theheight of the upper boundary determined by the cloudradar was also compared with the height of this bound-ary determined using humidity radiosounding profiles.During the TUC campaign humidity and temperatureprofiling radiosoundings were performed in some casesat 0300, 0600, 0900, 1500, 1800, and 2100 UTC in addi-tion to the regular 0000 and 1200 UTC radiosoundings.Among the cases analyzed earlier for cloud detectionefficiency, 25 radiosounding humidity profiles weremeasured concurrently with cases when the fog or low
cloud upper boundary was detected by the cloud radar.For these cases, we compared the determination of thecloud radar at the time of sonde launching with theheight determined using the humidity profile. Figure 4shows the extent of the cloud as determined by theceilometer and cloud radar for the 25 selected cases. Italso shows the cloud-top determination using the infor-mation from the sounding humidity profile. The aver-age difference between the radiosounding and cloudradar determination of the cloud upper boundary is53 m (radiosounding–cloud radar). The standard devia-tion of the sample is 77 m, which leads to an estimate ofa 95% confidence interval on the average of 32 m, usinga Student’s t test with 24 degrees of freedom (smallsample test). Consequently, a positive bias of 53 � 32 mexists between the radiosounding and cloud radar de-termination of the upper cloud boundary. Among the25 selected cases, the cloud extent (cloud top fromcloud radar and cloud bottom from ceilometer) variedfrom 50 to 585 m, while the cloud top as determined bythe cloud radar varied from 110 to 1020 m (see Fig. 4).
4. Discussion
We first discuss the reasons limiting the efficiency offog and low cloud detection by the ceilometer and
FIG. 3. Number of stratus cloud and fog cases detected at time of synop observations duringthe TUC campaign. Four groups describe all stratus cases, stratus cases without precipitation,all fog cases, and fog cases without precipitation. All cases detected by synop observation(black), ceilometer operative (dark gray), cloud radar operative (gray), ceilometer retrievalsuccessful (light gray), and cloud radar retrieval successful (white).
1364 J O U R N A L O F A T M O S P H E R I C A N D O C E A N I C T E C H N O L O G Y VOLUME 25

cloud radar, and then the quality of the cloud upperboundary determination by the cloud radar. Finally, thecase studies are looked into, and our results are com-pared to other studies. Concerning the detection effi-ciency, the main limiting factor of the experiment wasthe availability of cloud radar data. The cloud radarused during the campaign was not an operational sys-tem, but a prototype, and was affected by problemstypical of prototypes, limiting the data availability.Therefore some loss of data due to communication fail-ure, changes of settings according to local conditionsand other problems was inevitable. Considerable avail-ability and performance improvements are expectedwith a new system currently under construction. Theseinclude improvement in sensitivity, a reduction in theoccurrence of data artifacts, particularly when there arestrong returns (e.g., in presence of precipitation), and ageneral improvement in the stability and reliability ofoperation. In other systems of comparable complexity(e.g., wind profilers or stratospheric ozone monitoringradiometer) operational mode data availability betterthen 95% is achieved (Engelbart et al. 2007). In thefollowing discussion, the 143 situations with both re-mote sensing system operatives are considered.
The ceilometer showed excellent efficiency as 98% ofthe fog situations and 89% of the low stratus situationscould be determined. Restricting the stratus cases tosituations without precipitation allows an overall detec-tion efficiency �95%. The lower efficiency in case of
precipitation is explained by the laser light of the in-strument being scattered back by the hydrometeors.
In the case of the FMCW radar, precipitation (snowand rain) produces artifacts in the reflectivity signal. Itwas thus not possible to determine the cloud top whenprecipitations occurred, using the algorithm for cloud-top detection. However, under fog conditions withdrizzle, the determination of the top of the cloud wasstill possible. Boers et al. (2000) mention similar limi-tations with precipitation for the Delft AtmosphericResearch Radar (DARR), which is an FMCW radaroperating at 3.315 GHz with a range of 15 m. In thecurrent study, about 60% of the stratus cloud tops and70% of the fog tops could be determined under dry(without precipitation) conditions. In the remainingcases, the cloud top may sometimes have been outsidethe detection range of our algorithm, which was set to1200 m AGL. Another possibility for cases when theFMCW cloud radar did not detect the cloud top in drysituations may be its lack of sensitivity to small droplets,or to saturation in the first range gates in the presenceof very thin fog layers. Finally, further improvement ofthe cloud-top retrieval algorithm would probably resultin better scores (e.g., in the case of multilayer clouds).
Comparison of the stratus cloud or fog upper-boundary determination by the cloud radar with thatusing the radiosonde profile revealed a statistically sig-nificant bias of about 50 m. Ruffieux et al. (2006) men-tioned that the SRS400 (used in 21 of the 25 studiedcases) is affected by a bias of about 100 m in the deter-mination of the hydrolapse above fog or low stratuscloud layers, compared to other radiosondes. Our com-parison shows a similar but smaller bias. In addition, itshould be noted that for the three cases using a Snow-White sensor and the case using an RS80 sensor all dif-ferences are within �30 m. Ruffieux et al. attributedthe bias of the SRS400 to a combination of dropletscontaminating the protective duct of the carbon hygris-tor and lower ventilation early in flight, while the bal-loon is still accelerating. Taking into consideration thatthe determination of the fog or stratus cloud upper-boundary determination by the SRS400 is affected by apositive bias, the 95% confidence interval of about �30m shows a good agreement, given that both the radio-sonde and the cloud radar height resolution is about 15m. Finally, comparison with the wind profiler SNR con-firmed that the highest SNR is normally found justabove the cloud radar–determined upper boundary, asexpected.
The case study of 9 December (Fig. 1) further dem-onstrates that the capabilities of the ceilometer andcloud radar combination to determine cloud bound-aries are good for well delimited clouds. In this case, the
FIG. 4. Comparison of cloud extent (cloud base from ceilometerto cloud top from cloud radar) with determination of cloud topfrom radiosounding humidity profile (radiosoundings includethree types of sondes: SRS400, SnowWhite, and RS80).
AUGUST 2008 N O W A K E T A L . 1365
location of the cloud top as determined by the cloudradar is confirmed during the day by the high signal-to-noise ratio of the wind profiler and the inversions de-tected by the radiosoundings (section 3a). This excel-lent result was helped by good conditions such as theabsence of precipitation, well-defined low stratus cloud,and a marked inversion at the top of the cloud. Thecloud top detected with the radiosoundings at 0000 and1200 UTC 9 December and 000 UTC 10 December2003 (2 SRS 400 and 1 Snow White sounding) alsoagrees within 10–110 m with the cloud-top observationof the cloud radar.
The case of 19 November 2003 shows that such de-tection is more complex when the boundaries them-selves are not well defined as inferred from the sound-ing profiles and the wind profiler signal-to-noise ratiotime series. Note that the stratus cloud situations arereported by ground-based observations. The cloudsmay be multilayered and/or nonhomogenous, which isdifficult to assess since the first cloud layer hides po-tential higher cloud layers. This hypothesis is givenweight by the wind profiler SNR that at some timesshows multiple maxima at different altitudes, and alsoexhibits a large and rapid variability with respect totime. In such cases, the retrieval of the cloud top seemsto be hampered by the nature of the cloud itself (inho-mogeneous, rapidly changing, etc.). In addition, theceilometer detected a very low base after 1200 UTCand the visibility was below 1 km indicating the pres-ence of ground fog. Therefore, it is also possible thatthe fog top was below the lower detection limit of thecloud radar.
For situations without precipitation the combinationof cloud radar and ceilometer is promising for thedetection of fog and low stratus clouds. Despite itsprototype nature, the cloud radar already displayed sat-isfactory performances, and its cloud-top height detec-tion efficiency will be further enhanced by improve-ments in its algorithm and design. The two systems run-ning in parallel deliver information at a very hightemporal resolution with a reasonable cost, whichwould allow deployment at additional meteorologicalstations in Europe or over the world. They can givevaluable information for the understanding of the de-velopment of clouds, help establishing cloud climatol-ogy, and improve the analysis of cloud–radiation inter-action. Protat et al. (2006) showed that in order toevaluate the representation of clouds in operationalmodels, the use of both a cloud radar and a lidar isimperative. The sampling should be regular but notnecessarily continuous, and should not be driven bymeteorological conditions. In comparison, the setup ofthe systems used for the TUC campaign was limited in
altitude. For high cloud detection, the cloud radarshould be used with a different setup and a ceilometerwith a longer range should be used.
As mentioned in section 2, it is better to use a ceilo-meter for detecting the base of clouds, rather than usingthe cloud radar for determining both boundaries. Thecloud radar is more sensitive to precipitation and thedetection of the cloud base is attenuated (O’Connor etal. 2005). The radar reflectivity is dependent on thedrop concentration and on the sixth power of the drop-let diameter so the larger precipitation droplets in andbelow a cloud dominate the radar return. Therefore,the radar is able to detect the large droplets but cleardistinction between precipitation and cloud is not pos-sible. The ceilometer is efficient for measuring thecloud base; its dependency to the concentration of thedroplets is only affected by the square of the drop size.However it cannot normally detect the cloud top due toattenuation of the beam in the cloud. The cloud radarcan penetrate the cloud and detect the cloud top. Fur-ther advantages of this FMCW radar system are the lowcosts compared to other cloud radars and the simplicityto operate them in a continuous way. The estimatedcost of the prototype was at least a factor of 2 belowthat of a commercially available pulsed system, andeven a combination of a Vaisala ceilometer and FMCWcloud radar would remain significantly less expensivethan a pulsed system.
Other studies attempted to assess the potential fordetecting the cloud boundaries by different means.Wang et al. (1999) analyzed cloud radar and ceilometerdata to determine cloud vertical structure duringthe Atlantic Stratocumulus Transition Experiment(ASTEX) in June 1992 and compared the results withsatellite and radiosonde data. They also used radio-soundings for determining low cloud base and top for a20-yr dataset in the ASTEX region. They conclude thata combination of cloud radar, ceilometers, and lidar isneeded to provide the most accurate and complete in-formation on cloud vertical structure. Using radio-soundings severely limits the number of locations andthe time resolution.
The temporal resolution (30 s) of the wind profiler iswell suited for this task, but its cost is the main limitingfactor for an operational network. Further studies areunder way to combine wind profiler information withother systems to improve unambiguous determinationof cloud levels (Engelbart et al. 2007).
The collocation of cloud radar and ceilometer wasalso tested also during the Cloud and Radiation experi-ment (CLARA) in 1996. Hollars et al. (2004) presentedcomparisons of data from a vertically pointing 35-GHzMillimeter Wave Cloud Radar (MMCR) and the Geo-
1366 J O U R N A L O F A T M O S P H E R I C A N D O C E A N I C T E C H N O L O G Y VOLUME 25
stationary Meteorological Satellite-5 (GMS-5). Retriev-als of both single-layer and multilayer clouds as seen byradar were compared, but only for satellite-detectedclouds with 100% coverage of one cloud type within a0.3° � 0.3° domain centered at the Atmospheric Ra-diation Measurement (ARM) site on Manus Island inthe tropical West Pacific. Good agreement of the cloud-top heights was found between MMCR and GMS-5retrievals. For convective clouds with heavy precipita-tion, MMCR retrievals underestimated the cloud-topheights significantly.
Ground fog detection has been shown to be possiblefrom space using data from the Moderate ResolutionImaging Spectroradiometer (MODIS) during daytime(Bendix et al. 2005) and from the Spinning EnhancedVisible and Infrared Imager (SEVIRI) aboard Meteo-rological Satellite (Meteosat) Second Generation (Cer-mak et al. 2006). Encouraging performance was foundfor the discrimination between low stratus and groundfog, but the method of Bendix et al. does not yet allowindisputable distinction.
5. Summary
A combination of both ceilometer and cloud radarhas the potential for providing the height of a cloudlayer with optimal efficiency in continuous operationalmode (by optimal we mean satisfactory capabilities at areasonable cost). These instruments complement eachother: the ceilometer is very efficient at detectingclouds and can locate the bottom of a cloud layer pre-cisely, but cannot usually detect the cloud top due toattenuation of the beam in the cloud. On the otherhand, the cloud radar is able to detect the cloud top,although signal artifacts can cause difficulties duringprecipitation. It could eventually detect higher layers incase of multilayered clouds. Furthermore, the cloud ra-dar used in this study was a prototype system and con-siderable performance improvements are expected witha new system. Once set up and adjusted to the localconditions, the systems operate autonomously and re-quire little maintenance. The costs of both systems arelow compared to other types of radar. This makes thesesystems in combination with another system to estimatethe cloud cover amount a good alternative when humanobservations are not available for monitoring low cloudevolution.
Comparison of the cloud-top height determinationby the cloud radar and using radiosounding humidityprofile showed a bias of about 50 m. A previous studymentioned that the determination using radiosoundinghumidity profile with the type of sonde operated duringthe campaign suffered from a bias of even larger mag-
nitude (about 100 m). Once a 50-m bias is taken intoaccount, the agreement between both determinations isgood. Comparison with wind profiler data confirmedthe quality of the cloud-top height determination by thecloud radar. To improve information on the accuracy ofthe cloud boundary retrievals with the ceilometer andcloud radar, systematic comparisons should be made infuture studies with 94-GHz cloud radar, which have ahigher sensitivity to small droplets compared to theFMCW radar. Additionally, cloud-top height could alsobe compared with satellite data.
In this study, the information from two systems wascombined in order to provide a better description of acloud layer. It was possible to achieve this in a simpleand straightforward manner because both systems de-liver the same type of information (elevation of alayer). When information from more systems is inte-grated, this task becomes more difficult, especiallywhen the information provided cannot be easily com-bined. In this study, it would have been relatively dif-ficult to also integrate the information from the windprofiler and the radiosounding; while the informationfrom these systems is clearly related to the informationfrom the ceilometer and the cloud radar, their relation-ship is not straightforward. A promising direction toexplore for more ambitious multisystem integration isthe Bayesian model-based inversion technique such asexplored by Löhnert et al. (2004).
Acknowledgments. This study is supported by theNational Centre of Competence in Climate Research(NCCR Climate) sponsored by the Swiss National Sci-ence Foundation. Financial support for the TUC cam-paign was provided by the COST 720 Action. The au-thors wish to acknowledge the valuable support fromthe Aerological station of Payerne, especially Mr.Heinz Berger and the radiosounding team. We thankthe Millimetre-Wave Technology Group of the STFCRutherford Appleton Laboratory for providing thecloud radar and for their support during the TUC cam-paign.
REFERENCES
Aviolat, F., T. Cornu, and D. Cattani, 1998: Automatic cloudsobservation improved by an artificial neural network. J. At-mos. Oceanic Technol., 15, 114–126.
Bendix, J., B. Thies, J. Cermak, and T. Nauss, 2005: Ground fogdetection from space based on MODIS daytime data—A fea-sibility study. Wea. Forecasting, 20, 989–1005.
Boers, R., H. Russchenberg, J. Erkelens, and V. Venema, 2000:Ground-based remote sensing of stratocumulus propertiesduring CLARA, 1996. J. Appl. Meteor., 39, 169–181.
Cermak, J., M. Schneebeli, D. Nowak, L. Vuilleumier, and J. Ben-
AUGUST 2008 N O W A K E T A L . 1367
dix, 2006: Characterization of low clouds with satellite andground-based remote sensing systems. Meteor. Z., 15, 65–72.
Clothiaux, E. E., T. P. Ackerman, G. C. Mace, K. P. Moran, R. T.Marchand, M. A. Miller, and B. E. Martner, 2000: Objectivedetermination of cloud heights and radar reflectivities using acombination of active remote sensors at the ARM CARTsites. J. Appl. Meteor., 39, 645–665.
Crewell, S., and Coauthors, 2004: The Baltex Bridge Campaign:An integrated approach for a better understanding of clouds.Bull. Amer. Meteor. Soc., 85, 1565–1584.
Dibbern, J., W. Monna, J. Nash, and G. Peters, Eds., 2003: COSTAction 76: Development of VHF/UHF wind profilers andvertical sounders for use in European observing systems. Fi-nal Rep. EUR 20614, European Commission, 352 pp.
Dürr, B., and R. Philipona, 2004: Automatic cloud amount detec-tion by surface longwave downward radiation measurements.J. Geophys. Res., 109, D05201, doi:10.1029/2003JD004182.
Engelbart, D. A. M., W. Monna, J. Nash, and C. Maetzler, Eds.,2007: COST Action 720: Integrated ground-based remotesensing stations for atmospheric profiling. COST Office,Brussels, Belgium, Final Rep., in press.
Gossard, E. E., R. B. Chadwick, W. D. Neff, and K. P. Moran,1982: The use of ground-based Doppler radars to measuregradients, fluxes, and structure parameters in elevated layers.J. Appl. Meteor., 21, 211–226.
——, D. E. Wolfe, and B. B. Stankov, 1999: Measurement of hu-midity profiles in the atmosphere by the Global PositioningSystem and radar wind profilers. J. Atmos. Oceanic Technol.,16, 156–164.
Hollars, S., Q. Fu, J. Comstock, and T. Ackerman, 2004: Com-parison of cloud-top height retrievals from ground-based35GHz MMCR and GMS-5 satellite observations at ARMTWP Manus site. Atmos. Res., 72, 169–186.
Illingworth, A. J., and Coauthors, 2007: CLOUDNET—Continuous evaluation of cloud profiles in seven operationalmodels using ground-based observations. Bull. Amer. Meteor.Soc., 88, 883–898.
Kollias, P., C. W. Fairall, P. Zuidema, J. Tomlinson, and G. A.Wick, 2004: Observation of marine stratocumulus in SE Pa-cific during the PACS 2003 cruise. Geophys. Res. Lett., 31,L22110, doi:10.1029/2004GL020751.
Löhnert, U., S. Crewell, and C. Simmer, 2004: An integrated ap-proach toward retrieving physically consistent profiles oftemperature, humidity, and cloud liquid water. J. Appl. Me-teor., 43, 1295–1307.
Miloshevic, L. M., H. Voemel, D. N. Whiteman, B. M. Lesht, F. J.Schmidlin, and F. Russo, 2006: Absolute accuracy of water
vapor measurements from six operational radiosonde typeslaunched during AWEX-G and implications for AIRS vali-dation. J. Geophys. Res., 111, D09S10, doi:10.1029/2005JD006083.
Müller, G., 1982: Handbuch für Beobachter des automatischenBeobachtungsnetzes. Schweizerische Meteorologische An-stalt, 121 pp.
Nash, J., D. Lyth, and M. Oldfield, 2005: Observing fog and lowclouds with a combination of 78GHz cloud radar and laserceilometer. Proc. WMO Instruments and Methods Observa-tion Programme, Tech. Conf. on Meteorological and Environ-mental Instruments and Methods of Observation, WMO/TD-1265, Bucharest, Romania, WMO, 7 pp. [Available online athttp://www.wmo.ch/pages/prog/www/IMOP/publications/IOM-82-TECO_2005/Posters/P2(11)_UK_3_Nash.pdf.]
Neff, W. D., 1990: Atmospheric Processes over Complex Terrain.Meteor. Monogr., No. 45, Amer. Meteor. Soc., 173–228.
O’Connor, E. J., R. J. Hogan, and A. J. Illingworth, 2005: Retriev-ing stratocumulus drizzle parameters using Doppler radarand lidar. J. Appl. Meteor., 44, 14–27.
Protat, A., A. Armstrong, M. Haeffelin, Y. Morille, J. Pelon, J.Delanoë, and D. Burniol, 2006: Impact of conditional sam-pling and instrumental limitations on the statistics of cloudproperties derived from cloud radar and lidar at SIRTA.Geophys. Res. Lett., 33, L11805, doi:10.1029/2005GL025340.
Ramanathan, V., R. D. Cess, E. F. Harrison, P. Minnis, B. R.Barkstrom, E. Ahmad, and D. Hartmann, 1989: Cloud radia-tive forcing and climate: Results from the Earth RadiationBudget Experiment. Science, 243, 57–63.
Richner, H., 1999: Grundlagen aerologischer Messungen speziellmittels der Schweizer Sonde SRS 400 (Fundamentals ofaerological measurements especially when using the Swissradiosonde SRS400). Veröffentlichungen der SMA-MeteoSchweiz, No. 61, 140 pp.
Ruffieux, D., J. Nash, P. Jeannet, and J. L. Agnew, 2006: TheCOST 720 temperature, humidity and cloud profiling cam-paign: TUC. Meteor. Z., 15, 5–10.
Verver, G., M. Fujiwara, P. Dolmans, C. Becker, P. Fortuin, andL. Miloshevic, 2006: Performance of the Vaisala RS80A/Hand RS90 Humicap sensors and the Meteolabor “SnowWhite” chilled-mirror hygrometer in Paramaribo, Suriname.J. Atmos. Oceanic Technol., 23, 1506–1518.
Wang, J., W. B. Rossow, T. Uttal, and M. Rozendaal, 1999: Vari-ability of cloud vertical structure during ASTEX observedfrom a combination of rawinsonde, radar, ceilometer, andsatellite. Mon. Wea. Rev., 127, 2484–2502.
1368 J O U R N A L O F A T M O S P H E R I C A N D O C E A N I C T E C H N O L O G Y VOLUME 25