determinants factor of accommodation online buying through
TRANSCRIPT
*Corresponding author Email: [email protected] P-ISSN : 2252-8997
Asia-Pacific Management and Business Application, 9, 2 (2020): 83-98 E-ISSN: 2615-2010
ARTICLE Asia-Pacific Management and Business Application
9 (2) 83-98 ©UB 2020
University of Brawijaya Malang, Indonesia
http://apmba.ub.ac.id
Determinants Factor of Accommodation Online Buying
through Online Travel Agent (OTA)
Aditia Sovia Pramuditaa*
M. Ardhya Bismab
Darfial Guslanc
a,b,c Logistics Business Department, Politeknik Pos Indonesia, Bandung, Indonesia
Abstract
The objective of this research is to identifying the determinants factor of online shopping
behavior in accommodation buying to increase purchase intention and the actual buying in the
hospitality sector. The hospitality industry in Indonesia is growing along with the growth of
the tourism industry. Since ICT is developed in Indonesia, the behavior of the traveller
changed. Online Travel Agent (OTA) and Accommodation Network Orchestrator (ANO) are
emerging to fill consumer wants and needs in the way of accommodation buying. Technology
Acceptance Model (TAM) is used as an approach to defining the determinants factor of online
shopping behavior in accommodation buying. This research used the questionnaire to get
primary data which is distributed to 358 respondents. The statistical tools used were Structural
Equation Model-Partial Least Square (SEM-PLS). The result showed that all of the variables
(perceived ease of use, perceived usefulness, perceived risk, perceived cost) were a significant
and positive impact to purchase intention and actual use in online accommodation buying
behavior.
Keywords
Technology Acceptance Model; Online Distribution Channel; SEM-PLS; Consumer Behavior Received: 3 September 2020; Accepted: 1 October 2020; Published Online: 31 December 2020 DOI: 10.21776/ub.apmba.2020.009.02.1
Introduction
The tourism industry in Indonesia has the
potential to develop rapidly. According to
the Indonesian Investment Coordinating
Board (Badan Koordinasi Penanaman
Modal), two sectors have the potential to
grow rapidly in Indonesia which are the
tourism and e-commerce sectors (Badan
Koordinasi Penanaman Modal, 2018).
Wonderful Indonesia Branding, which has
been put forward since 2013, has made
Indonesia's ranking as a tourism
destination country soared from 70 to 42 in
2017. The impact is the tourism sector has
been able to contribute 15% to the total
Gross Domestic Product (GDP) in 2017
(Badan Pusat Statisik, 2018). This shows
that the tourism sector has the potency to
become one of the main drivers of the
Indonesian economy in the future.
The growth of tourism in Indonesia is
along with the growth of tourism facilities
and infrastructure throughout Indonesia.
Accommodation, as a supporting factor for
tourism, growth has become an indicator of
tourism success in a certain area (Berita
Satu, 2016).

84 Aditia Sovia Pramudita, et. al
Asia-Pacific Management and Business Application, 9, 2 (2020): 83-98
Figure 1. Accommodation`s Growth in Indonesia Source: (Badan Pusat Statisik, 2019)
Based on the data figure the growth of
accommodation in Indonesia reaches
12.3% per year (CAGR). The growth in the
number of accommodations shows that
businesses practitioner and investors have
an interest in the tourism industry in
Indonesia. However, this growth is not a
match by inadequate growth in the
occupancy rate of accommodation because
it continues to decline every year.
Figure 2. Accommodation`s Occupancy Rate in Indonesia
Source: (Badan Pusat Statisik, 2019)
Based on the data in Figure 2, the growth
in the occupancy rate reaches -0.9% per
year (CAGR). However, the occupancy
rate of big hotels can still reach 60% while
small hotels are still at 30% (Berita Satu,
2016). One of the presumptions is that big
hotels have used multi-distribution
channels in selling their rooms, especially
on online media, while small hotels are
still selling their rooms directly (go show).
1.306 1.489
1.623 1.778
1.996 2.197
2.387
3.314
2 0 1 1 2 0 1 2 2 0 1 3 2 0 1 4 2 0 1 5 2 0 1 6 2 0 1 7 2 0 1 8
ACCOMMODATION`S GROWTH IN INDONESIA
Accommodation Linear (Accommodation)
35,98%
38,74% 38,22%37,34%
35,87%
33,21%34,85%
33,66%
2 0 1 1 2 0 1 2 2 0 1 3 2 0 1 4 2 0 1 5 2 0 1 6 2 0 1 7 2 0 1 8
ACCOMMODATION`S OCCUPANCY RATE IN INDONESIA
Occupancy Rate Linear (Occupancy Rate)
Determinants Factor of Accommodation Online Buying through Online Travel Agent (OTA) 85
Asia-Pacific Management and Business Application, 9, 2 (2020): 83-98
The development of Information
Communication and Technology (ICT) in
the world is very fast. This has led to a
more dynamic business movement,
especially in the distribution of products or
services (Pramudita, 2018). In the hotel
industry itself, the development of ICT has
led to several types of new business
models such as the Online Travel Agent
(OTA) or the Accommodation Network
Orchestrator (ANO) (Pramudita, Yanuar,
& Hilman, 2019).
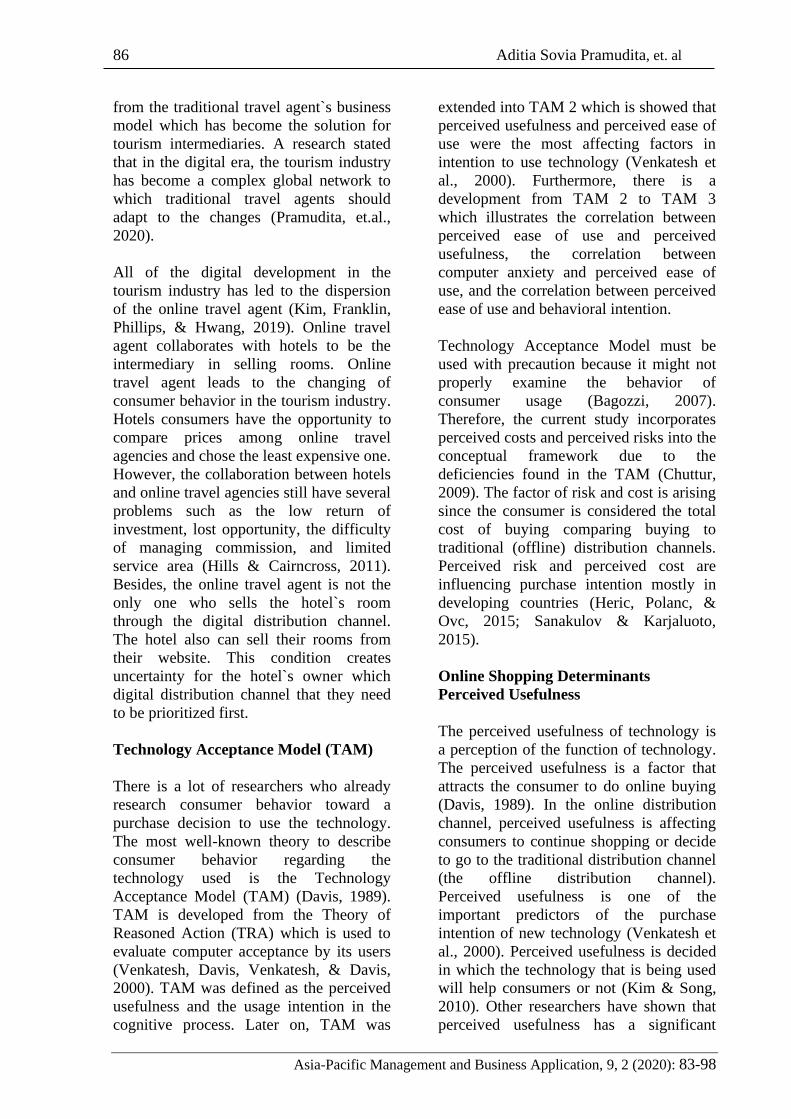
The growth of ICT in Indonesia itself has
grown very rapidly. Indonesia is one of the
countries with the largest internet user
penetration growth rate in the world. This
makes Indonesia one of the countries that
have the potential for the development of
high e-commerce users in the world.
Figure 3. Growth of Internet Users in Indonesia Source: (Asosiasi Penyelenggara Jasa Internet Indonesia, 2018)
The behavior of online purchasing does not
only refer to the distribution channel itself,
it is also referring to buying decision
making process study (Priyanka & Ramya,
2016). Consumers are considering some
factors before doing online buying which
are perceived usefulness, perceived ease of
use, social influence, performance
expectations, habits, and conditions of the
facility (Delafrooz, Paim, & Khatibi, 2010;
Ofori & Appiah-nimo, 2019; Priyanka &
Ramya, 2016). Nonetheless, those
researchers only research online purchase
behavior in the general buying process.
There are still limited researches that
already discuss the factor of online
purchase in accommodation buying,
especially in Indonesia. Since the
accommodation sector in Indonesia has a
huge potency to growth, this research has
an objective to identifying the determinants
factor of online shopping behavior in
accommodation buying to increase
purchase intention and actual buying in the
accommodation sector.
Theoretical Foundation and Hypothesis
Development
Online Distribution Channel in the
Tourism Industry
Information and Communication
Technology (ICT) in the tourism industry
has emerged the term of e-tourism.
Promote and sell products or services in
this industry are become common through
online media. There is no doubt that the
travel agent has a significant role in the
tourism industry (Camilleri, 2018). ICT
development has allowed new business
model development in the world which is
also affected travel agent`s business
models. In the digital era, there is a
terminology which is called online travel
agent (OTA). OTA is the development
86 Aditia Sovia Pramudita, et. al
Asia-Pacific Management and Business Application, 9, 2 (2020): 83-98
from the traditional travel agent`s business
model which has become the solution for
tourism intermediaries. A research stated
that in the digital era, the tourism industry
has become a complex global network to
which traditional travel agents should
adapt to the changes (Pramudita, et.al.,
2020).
All of the digital development in the
tourism industry has led to the dispersion
of the online travel agent (Kim, Franklin,
Phillips, & Hwang, 2019). Online travel
agent collaborates with hotels to be the
intermediary in selling rooms. Online
travel agent leads to the changing of
consumer behavior in the tourism industry.
Hotels consumers have the opportunity to
compare prices among online travel
agencies and chose the least expensive one.
However, the collaboration between hotels
and online travel agencies still have several
problems such as the low return of
investment, lost opportunity, the difficulty
of managing commission, and limited
service area (Hills & Cairncross, 2011).
Besides, the online travel agent is not the
only one who sells the hotel`s room
through the digital distribution channel.
The hotel also can sell their rooms from
their website. This condition creates
uncertainty for the hotel`s owner which
digital distribution channel that they need
to be prioritized first.
Technology Acceptance Model (TAM)
There is a lot of researchers who already
research consumer behavior toward a
purchase decision to use the technology.
The most well-known theory to describe
consumer behavior regarding the
technology used is the Technology
Acceptance Model (TAM) (Davis, 1989).
TAM is developed from the Theory of
Reasoned Action (TRA) which is used to
evaluate computer acceptance by its users
(Venkatesh, Davis, Venkatesh, & Davis,
2000). TAM was defined as the perceived
usefulness and the usage intention in the
cognitive process. Later on, TAM was
extended into TAM 2 which is showed that
perceived usefulness and perceived ease of
use were the most affecting factors in
intention to use technology (Venkatesh et
al., 2000). Furthermore, there is a
development from TAM 2 to TAM 3
which illustrates the correlation between
perceived ease of use and perceived
usefulness, the correlation between
computer anxiety and perceived ease of
use, and the correlation between perceived
ease of use and behavioral intention.
Technology Acceptance Model must be
used with precaution because it might not
properly examine the behavior of
consumer usage (Bagozzi, 2007).
Therefore, the current study incorporates
perceived costs and perceived risks into the
conceptual framework due to the
deficiencies found in the TAM (Chuttur,
2009). The factor of risk and cost is arising
since the consumer is considered the total
cost of buying comparing buying to
traditional (offline) distribution channels.
Perceived risk and perceived cost are
influencing purchase intention mostly in
developing countries (Heric, Polanc, &
Ovc, 2015; Sanakulov & Karjaluoto,
2015).
Online Shopping Determinants
Perceived Usefulness
The perceived usefulness of technology is
a perception of the function of technology.
The perceived usefulness is a factor that
attracts the consumer to do online buying
(Davis, 1989). In the online distribution
channel, perceived usefulness is affecting
consumers to continue shopping or decide
to go to the traditional distribution channel
(the offline distribution channel).
Perceived usefulness is one of the
important predictors of the purchase
intention of new technology (Venkatesh et
al., 2000). Perceived usefulness is decided
in which the technology that is being used
will help consumers or not (Kim & Song,
2010). Other researchers have shown that
perceived usefulness has a significant
Determinants Factor of Accommodation Online Buying through Online Travel Agent (OTA) 87
Asia-Pacific Management and Business Application, 9, 2 (2020): 83-98
effect on e-commerce use (Alalwan,
Baabdullah, Rana, Tamilmani, & Dwivedi,
2018).
The hypotheses proposed as follow:
H1: Perceived usefulness has a significant
and positive correlation to purchase
intention.
H2: Perceived usefulness has a significant
and positive correlation to the actual use of
online accommodation buying.
Perceived Ease of Use
Perceived ease of use is defined as the
easiness level of using or adapting to new
technology (Davis, 1989). Easiness was
shown by less cost or effort to acquire the
technology. Furthermore, the use of
technology itself can be time-consuming
for tech-illiterate people. The resistance to
using something new becomes arise if the
effort to acquire new technology is higher.
On the contrary, if the perceived ease of
use toward new technology is considered
easy, the consumer will intend to use the
technology (Venkatesh et al., 2000).
Moreover, perceived ease of use is
influencing perceived usefulness in the
TAM model which perceived usefulness
becomes a moderator to increase purchase
intention and actual usage. Based on
previous research, perceived ease of use
has significant results in perceived
usefulness (Dutot, Bhatiasevi, &
Bellallahom, 2019; Shuhaiber & Mashal,
2019).
Therefore, it was hypothesized:
H3: Perceived ease of use has a significant
and positive correlation to purchase
intention.
H4: Perceived ease of use has a significant
and positive correlation to the actual use of
online accommodation buying.
H10: Perceived ease of use has a
significant and positive correlation to
perceived usefulness.
Perceived Risk
Perceived risk is defined as an assessment
of the uncertainty condition. Moreover,
lack of knowledge also increases the
perceived risk toward new technology
(Vlek & Stallen, 1980). In buying the
consumer behavior process, risk has
become part of the factor that is
influencing decision making. Furthermore,
perceived risk also can be defined as the
consumer expectation of suffering a loss in
the buying process (King & He, 2006).
Perceived risk has two major factors
involved in consumer behavior during the
online buying process which are financial
risk, product risk, time risk; and e-
transaction security, e-transaction privacy
(Li & Zhang, 2002). It is also related to
Indonesia`s condition in which security
and privacy in e-transaction have become
an issue.
Therefore, it was hypothesized:
H5: Perceived risk has a significant and
positive correlation to purchase intention
H6: Perceived risk has a significant and
positive correlation to the actual use of
online accommodation buying.
Perceived risk is interpreted as the
capability of the consumer to overcome the
risk. It shows that the higher perceived risk
than the higher also the purchase intention
and the actual use of buying online
accommodation, vice versa.
Perceived Cost
Perceived cost defined the possibility
expense or effort in terms of using the
technology such as access cost, transaction
cost, equipment cost, and related cost
(Choudhury & Dey, 2014). Moreover,
perceived cost is also associated with
online transactions which arise from
information asymmetry and investment in
terms of accessing the technology (L. Wu,
Chen, Chen, & Cheng, 2014). Perceived
costs also include delivery cost,
comparison cost, and product searches (J.

88 Aditia Sovia Pramudita, et. al
Asia-Pacific Management and Business Application, 9, 2 (2020): 83-98
Wu & Wang, 2005). Those conditions are
no different from the current condition in
Indonesia regarding online buying. In
accommodation buying, the hidden cost
usually appears such as service charge.
This cost is intentionally hidden in purpose
lowering offering price. It becomes
common knowledge that the consumer
should spend extra to cover this cost.
Therefore, it was hypothesized:
H7: Perceived cost has a significant
correlation to purchase intention.
H8: Perceived cost has a significant
correlation to the actual use of online
accommodation buying.
Purchase Intention
Purchase intention is one of the important
parts of the consumer decision-making
process (Kotler & Keller, 2012). Purchase
intention reflected beliefs, attitudes,
intentions on buying a product or services
(Kian, Boon, Fong, & Ai, 2017). Purchase
intention also defined which level of
consciousness in terms of purchase
products or services. Purchase intention is
a factor that influencing consumers to do
buying a product or service.
Therefore, it was hypothesized:
H9: Purchase intention has a significant
correlation to the actual use of online
accommodation buying.
Actual Usage
Actual use is one of the important
processes in the consumer decision-making
process as indicated by the actual purchase
of a product or service by the consumer
(Kotler & Keller, 2012). The actual
successful use of online purchases
indicates by the frequency of online
purchases within a certain period (Ariff,
Yan, Zakuan, Bahari, & Jusoh, 2013).
Three major factors influencing actual
usage in online buying are brand image,
self-efficacy, and social brand
communication (perceived ease of use,
risk, cost, usefulness, and others related)
(Muda, Mohd, & Hassan, 2016).
Research Method
Data collection techniques used in this
study are questionnaires that are reflected
through statements and statements
arranged in such a way as to represent the
three variables that exist using five levels
of Likert scale preference. The population
of this research is a person who is already
experienced in buying hotels through
online distribution channels (website,
online travel agent, online network agent).
The sample of this research is referring to
Isaac and Michael with an alpha level of
5% and the given population is unlimited
(Sugiyono, 2010). Based on Isaac and
Michael's sampling table, the number of
respondents needed is 349. However, the
questionnaire is spread to 400 respondents
to mitigate the risk of the broken
questionnaire. The purposive sampling
technique is used to select respondents in
this research. From 400 total questionnaire
that is being gathered, only 358
questionnaires that are used in the analysis,
and the rest is considered broken
questionnaire. The questionnaire is
gathered from January 2020 – March 2020
using both online and offline platforms.
The questionnaire includes questions about
variables: perceived usefulness, perceives
ease of use, perceived risk, perceived costs,
purchase intention, and actual usage. Items
of the questionnaire were originally
developed by the various researcher (Chiou
& Pan, 2009; Hsieh & Liao, 2011; Li &
Zhang, 2002; Ofori & Appiah-nimo,
2019). The questionnaire design is adopted
from the various researcher which is
related to the object of the study (Davis,
1989; Morris & Dillon, 1997; Ofori &
Appiah-nimo, 2019). The questionnaire
design can be seen below.
Determinants Factor of Accommodation Online Buying through Online Travel Agent (OTA) 89
Asia-Pacific Management and Business Application, 9, 2 (2020): 83-98
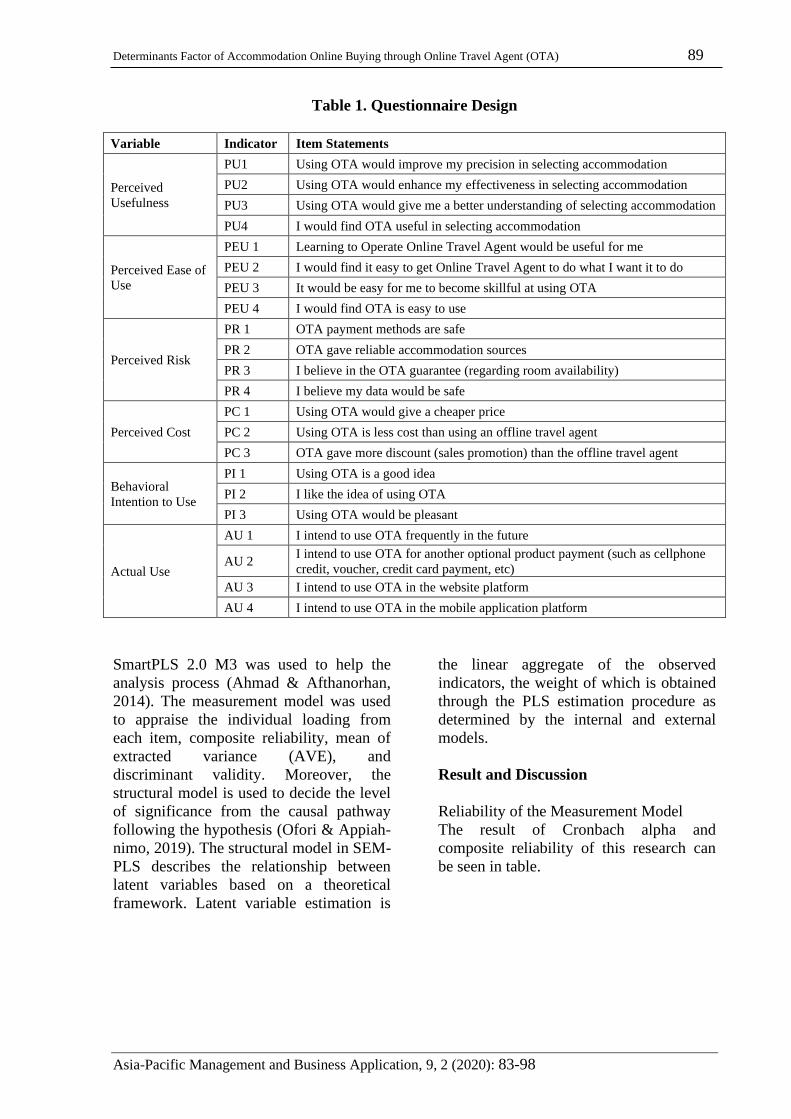
Table 1. Questionnaire Design
Variable Indicator Item Statements
Perceived
Usefulness
PU1 Using OTA would improve my precision in selecting accommodation
PU2 Using OTA would enhance my effectiveness in selecting accommodation
PU3 Using OTA would give me a better understanding of selecting accommodation
PU4 I would find OTA useful in selecting accommodation
Perceived Ease of
Use
PEU 1 Learning to Operate Online Travel Agent would be useful for me
PEU 2 I would find it easy to get Online Travel Agent to do what I want it to do
PEU 3 It would be easy for me to become skillful at using OTA
PEU 4 I would find OTA is easy to use
Perceived Risk
PR 1 OTA payment methods are safe
PR 2 OTA gave reliable accommodation sources
PR 3 I believe in the OTA guarantee (regarding room availability)
PR 4 I believe my data would be safe
Perceived Cost
PC 1 Using OTA would give a cheaper price
PC 2 Using OTA is less cost than using an offline travel agent
PC 3 OTA gave more discount (sales promotion) than the offline travel agent
Behavioral
Intention to Use
PI 1 Using OTA is a good idea
PI 2 I like the idea of using OTA
PI 3 Using OTA would be pleasant
Actual Use
AU 1 I intend to use OTA frequently in the future
AU 2 I intend to use OTA for another optional product payment (such as cellphone
credit, voucher, credit card payment, etc)
AU 3 I intend to use OTA in the website platform
AU 4 I intend to use OTA in the mobile application platform
SmartPLS 2.0 M3 was used to help the
analysis process (Ahmad & Afthanorhan,
2014). The measurement model was used
to appraise the individual loading from
each item, composite reliability, mean of
extracted variance (AVE), and
discriminant validity. Moreover, the
structural model is used to decide the level
of significance from the causal pathway
following the hypothesis (Ofori & Appiah-
nimo, 2019). The structural model in SEM-
PLS describes the relationship between
latent variables based on a theoretical
framework. Latent variable estimation is
the linear aggregate of the observed
indicators, the weight of which is obtained
through the PLS estimation procedure as
determined by the internal and external
models.
Result and Discussion
Reliability of the Measurement Model
The result of Cronbach alpha and
composite reliability of this research can
be seen in table.

90 Aditia Sovia Pramudita, et. al
Asia-Pacific Management and Business Application, 9, 2 (2020): 83-98
Table 2. Cronbach Alpha and Composite Reliability Result
Cronbach Alpha Composite Reliability
AU 0.819235 0.889394
PC 0.812741 0.888654
PEU 0.798376 0.868637
PI 0.877007 0.924485
PR 0.795625 0.867072
PU 0.847073 0.897055
The rule of thumb of an indicator to be
reliable is the value of Cronbach alpha
more than 0.6 and the composite reliability
is more than 0.7 (Hair et al., 2011). Based
on table 2, it is known that the variables
used in this study have a Cronbach alpha
value of more than 0.6 and the value of
composite reliability is more than 0.7. It
can be concluded that all of the variables
used in this study are reliable.
The Validity of the Measurement Model
Convergent validity test parameters are
known based on the output of the
smartPLS 2.0 M3 algorithm in the form of
outer loading, AVE, and communality.
Two primary validity tests were examined
which are convergent and discriminant
validity tests. The convergent validity test
assesses the relationship between
indicators and their constructs or latent
variables. In convergent validity, each
measurement item must have a loading
value above 0.7 and an average variance
extracted (AVE) higher than 0.50 (Hair et
al., 2011). The results of AVE and
communality are presented in Table 3.
Table 3. AVE and Communality
AVE Communality
AU 0.679267 0.679267
PC 0.726829 0.726829
PEU 0.623638 0.623638
PI 0.803375 0.803375
PR 0.620096 0.620096
PU 0.685649 0.685649
Determinants Factor of Accommodation Online Buying through Online Travel Agent (OTA) 91
Asia-Pacific Management and Business Application, 9, 2 (2020): 83-98
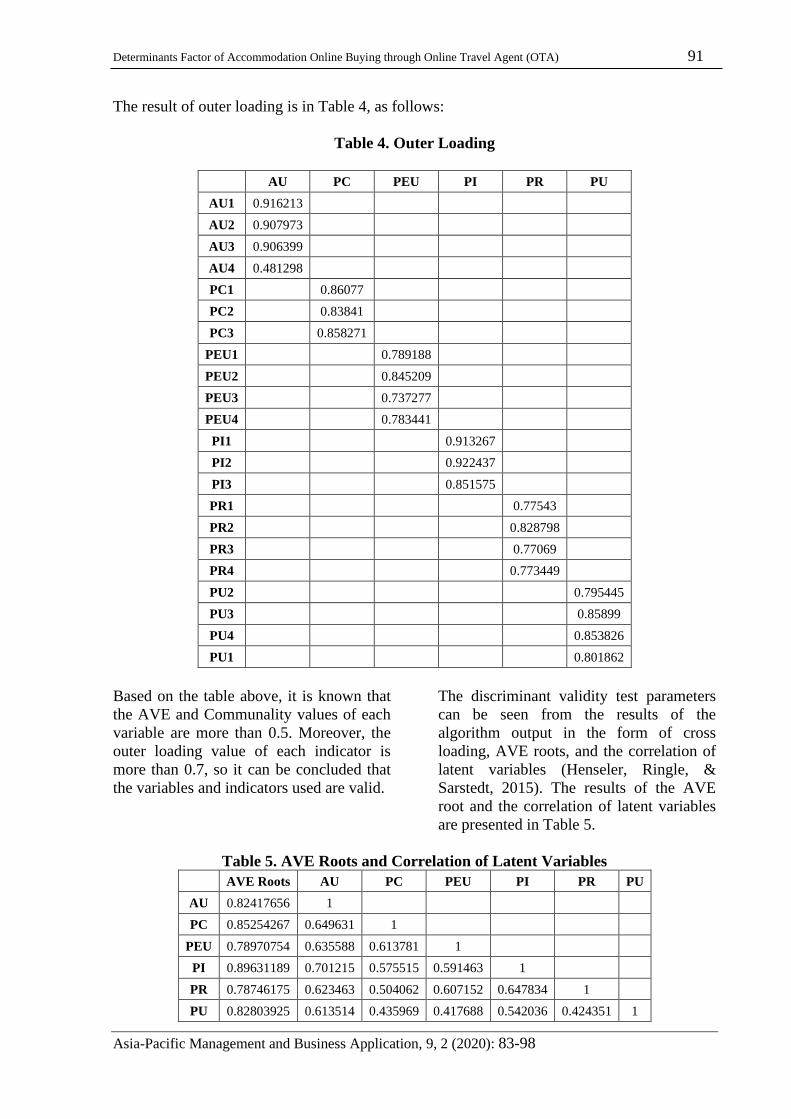
The result of outer loading is in Table 4, as follows:
Table 4. Outer Loading
AU PC PEU PI PR PU
AU1 0.916213
AU2 0.907973
AU3 0.906399
AU4 0.481298
PC1 0.86077
PC2 0.83841
PC3 0.858271
PEU1 0.789188
PEU2 0.845209
PEU3 0.737277
PEU4 0.783441
PI1 0.913267
PI2 0.922437
PI3 0.851575
PR1 0.77543
PR2 0.828798
PR3 0.77069
PR4 0.773449
PU2 0.795445
PU3 0.85899
PU4 0.853826
PU1 0.801862
Based on the table above, it is known that
the AVE and Communality values of each
variable are more than 0.5. Moreover, the
outer loading value of each indicator is
more than 0.7, so it can be concluded that
the variables and indicators used are valid.
The discriminant validity test parameters
can be seen from the results of the
algorithm output in the form of cross
loading, AVE roots, and the correlation of
latent variables (Henseler, Ringle, &
Sarstedt, 2015). The results of the AVE
root and the correlation of latent variables
are presented in Table 5.
Table 5. AVE Roots and Correlation of Latent Variables AVE Roots AU PC PEU PI PR PU
AU 0.82417656 1
PC 0.85254267 0.649631 1
PEU 0.78970754 0.635588 0.613781 1
PI 0.89631189 0.701215 0.575515 0.591463 1
PR 0.78746175 0.623463 0.504062 0.607152 0.647834 1
PU 0.82803925 0.613514 0.435969 0.417688 0.542036 0.424351 1

92 Aditia Sovia Pramudita, et. al
Asia-Pacific Management and Business Application, 9, 2 (2020): 83-98
The results of the cross-loading presented in Table 6.
Table 6. Cross Loading
AU PC PEU PI
AU1 0.916213 0.549809 0.523248 0.63784
AU2 0.907973 0.520822 0.518815 0.633177
AU3 0.906399 0.54249 0.490301 0.655148
AU4 0.681298 0.533978 0.586002 0.321729
PC1 0.563194 0.86077 0.561128 0.533562
PC2 0.494277 0.83841 0.505425 0.430789
PC3 0.596049 0.858271 0.501809 0.499499
PEU1 0.454861 0.495419 0.789188 0.467148
PEU2 0.540054 0.53991 0.845209 0.496867
PEU3 0.443562 0.452036 0.737277 0.442455
PEU4 0.559698 0.448604 0.783441 0.46088
PI1 0.63749 0.512336 0.545212 0.913267
PI2 0.668434 0.529156 0.54609 0.922437
PI3 0.576359 0.506061 0.497765 0.851575
PR1 0.458746 0.40999 0.506012 0.478458
PR2 0.546044 0.451164 0.532158 0.553935
PR3 0.455675 0.367842 0.440442 0.500431
PR4 0.496872 0.35496 0.431067 0.503649
PU2 0.481475 0.356489 0.338857 0.454021
PU3 0.546166 0.382516 0.384858 0.473496
PU4 0.555798 0.369492 0.359632 0.447395
PU1 0.437839 0.332343 0.292273 0.418035
Based on table 5, it can be seen that the
AVE root of all variables is greater than
the correlation between latent variables. In
table 6, it is also known that the indicators
used to measure the Perception Ease of
Use, Perception Usefulness, Perceived
Risk, Perceived Cost, Purchase Intention,
and Actual Usage variables from the
Online Travel Agent (OTA) are valid. It
can be concluded that the variables and
indicators used in this study have met
discriminant validity.
Collinearity Statistics
Based on the structural model procedure, a
collinearity test should be done to avoid a
high correlation between variables.
Multicollinearity is used when there are
multiple correlations that at the same time
will predict the large percentage of
variance in the dependent variable. The
inner VIF value is checked for collinearity
problems. In particular, the following
constructs are assessed for collinearity.
Based on the result in Table 7.
Determinants Factor of Accommodation Online Buying through Online Travel Agent (OTA) 93
Asia-Pacific Management and Business Application, 9, 2 (2020): 83-98
Table 7. Collinearity Statistics (VIF)
PI AU
PU 1.167 1.142
PEU 1.962 1.976
PR 1.409 1.414
PC 1.467 1.504
PI 1.486
The rule of thumb for the VIF value is
between 1-10. The result showed that there
are no collinearity issues in this model
(VIF value is between 1-10).
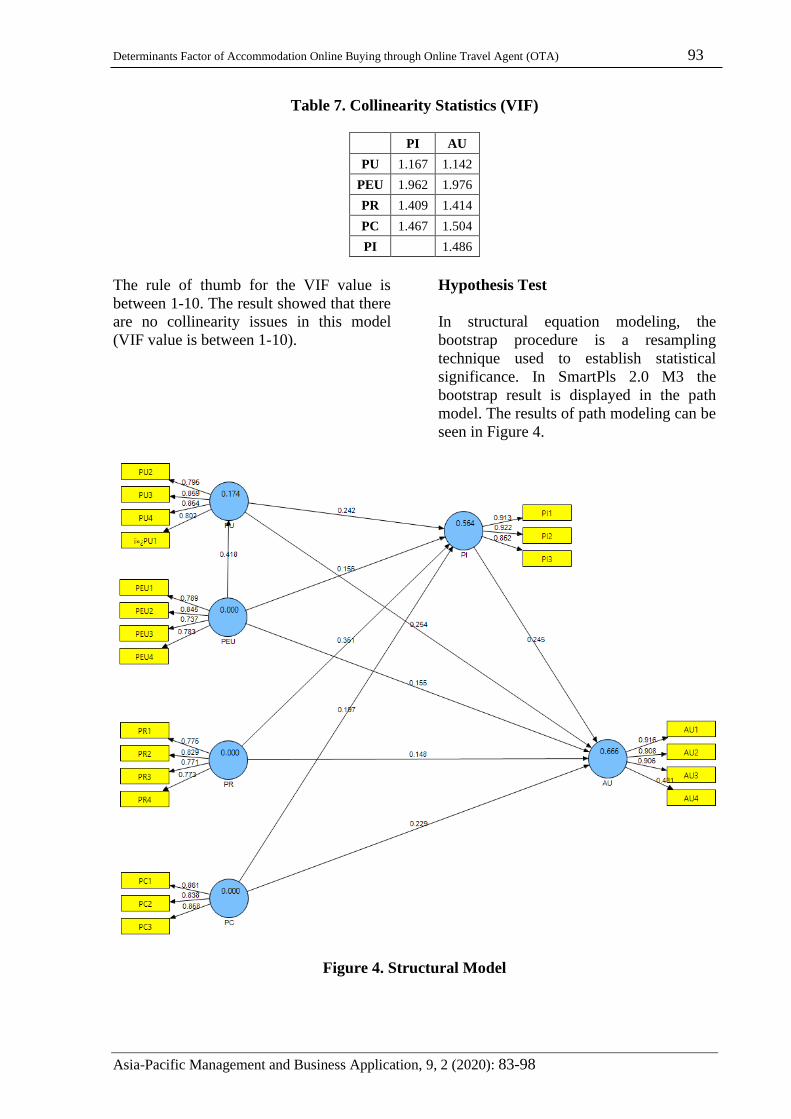
Hypothesis Test
In structural equation modeling, the
bootstrap procedure is a resampling
technique used to establish statistical
significance. In SmartPls 2.0 M3 the
bootstrap result is displayed in the path
model. The results of path modeling can be
seen in Figure 4.
Figure 4. Structural Model
94 Aditia Sovia Pramudita, et. al
Asia-Pacific Management and Business Application, 9, 2 (2020): 83-98
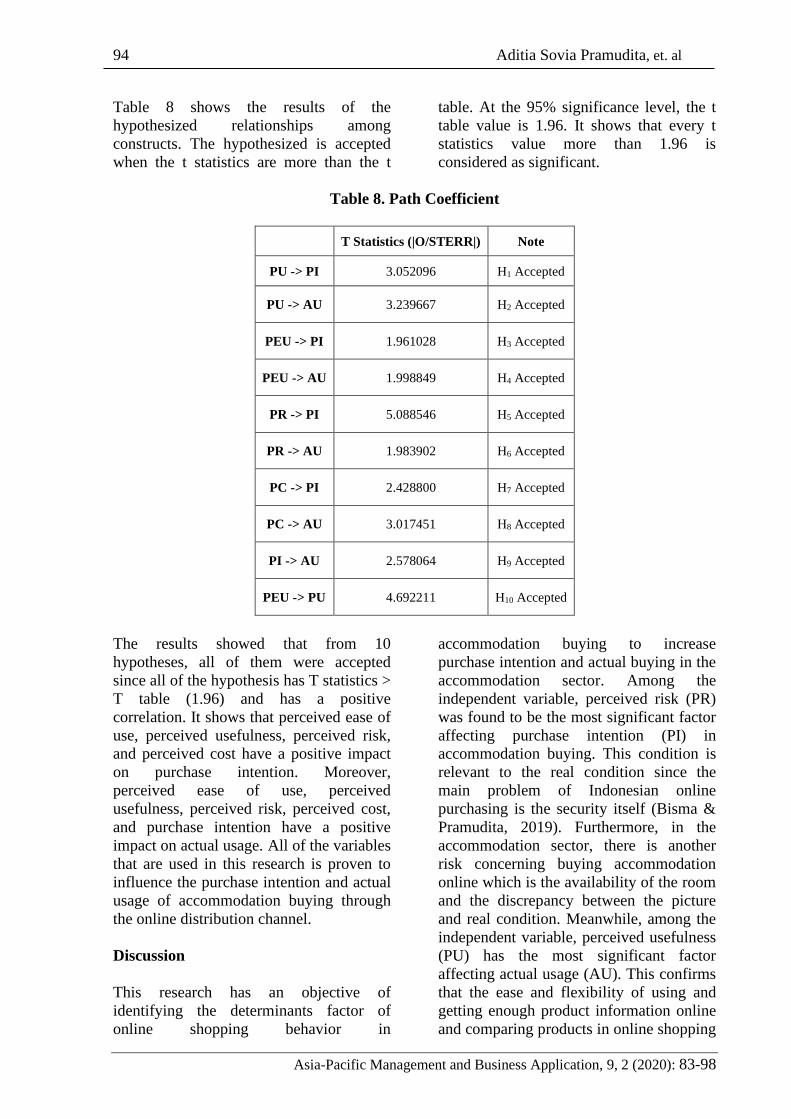
Table 8 shows the results of the
hypothesized relationships among
constructs. The hypothesized is accepted
when the t statistics are more than the t
table. At the 95% significance level, the t
table value is 1.96. It shows that every t
statistics value more than 1.96 is
considered as significant.
Table 8. Path Coefficient
T Statistics (|O/STERR|) Note
PU -> PI 3.052096 H1 Accepted
PU -> AU 3.239667 H2 Accepted
PEU -> PI 1.961028 H3 Accepted
PEU -> AU 1.998849 H4 Accepted
PR -> PI 5.088546 H5 Accepted
PR -> AU 1.983902 H6 Accepted
PC -> PI 2.428800 H7 Accepted
PC -> AU 3.017451 H8 Accepted
PI -> AU 2.578064 H9 Accepted
PEU -> PU 4.692211 H10 Accepted
The results showed that from 10
hypotheses, all of them were accepted
since all of the hypothesis has T statistics >
T table (1.96) and has a positive
correlation. It shows that perceived ease of
use, perceived usefulness, perceived risk,
and perceived cost have a positive impact
on purchase intention. Moreover,
perceived ease of use, perceived
usefulness, perceived risk, perceived cost,
and purchase intention have a positive
impact on actual usage. All of the variables
that are used in this research is proven to
influence the purchase intention and actual
usage of accommodation buying through
the online distribution channel.
Discussion
This research has an objective of
identifying the determinants factor of
online shopping behavior in
accommodation buying to increase
purchase intention and actual buying in the
accommodation sector. Among the
independent variable, perceived risk (PR)
was found to be the most significant factor
affecting purchase intention (PI) in
accommodation buying. This condition is
relevant to the real condition since the
main problem of Indonesian online
purchasing is the security itself (Bisma &
Pramudita, 2019). Furthermore, in the
accommodation sector, there is another
risk concerning buying accommodation
online which is the availability of the room
and the discrepancy between the picture
and real condition. Meanwhile, among the
independent variable, perceived usefulness
(PU) has the most significant factor
affecting actual usage (AU). This confirms
that the ease and flexibility of using and
getting enough product information online
and comparing products in online shopping

Determinants Factor of Accommodation Online Buying through Online Travel Agent (OTA) 95
Asia-Pacific Management and Business Application, 9, 2 (2020): 83-98
aids students in making prompt purchase
decisions (Alalwan et al., 2018; Dutot et
al., 2019; Li et al., 2017; Shuhaiber &
Mashal, 2019).
Theoretically, technology acceptance
model (TAM) is proven to assess
consumer behavior in adapting technology
in accommodation buying. TAM should
consider perceived risk and perceived cost
since it is proven to be significant
influencing purchase intention and actual
usage. İn line with the previous researcher
who consider risk and cost should be in
TAM equation (Chuttur, 2009; Heric,
Polanc, & Ovc, 2015; Sanakulov &
Karjaluoto, 2015).
In the accommodation sector, the
demography of its consumer is diverse.
The perception toward online distribution
channel is important to determine their
decision in buying. The online distribution
channel in the accommodation sector is
providing various information and
sometimes cheaper price than the
traditional channel. It is important to plant
the idea in consumer mind that using
online distribution channel in
accommodation buying is very helpful and
give a lot of benefit for them.
Conclusion
The development of ICT in Indonesia has
grown rapidly. Online buying becomes a
new habit since the consumer could spend
less time to find their needs and wants.
This condition also affecting in the
accommodation sector. There is plenty of
accommodation provider who already use
online distribution channel to sell their
services. Even all of the original TAM
indicators predicted purchase intention and
actual usage, this research showed that
consumers also consider risk, cost, and
usefulness to purchase intention and actual
usage. In this research, the cost is not the
most significant factor. Even though, the
value of cost is only slightly different to
perceive risk and usefulness. In the
accommodation sector, the cost is not the
only factor that needs to be considered
since every accommodation provider is
providing different services and
ambiances. Based on this research,
accommodation provider who provides
their services through online distribution
channel should convincing their potential
consumer that doing transaction through
online distribution channel is safe, reliable,
and very helpful to fulfill consumer`s
needs. Through this effort, it can change
the consumer`s mind to undoubted the
reliability of the online distribution
channel.
Notes on Contributors
Aditia Sovia Pramudita is a lecturer in
the Logistics Business Department,
Politeknik Pos Indonesia since 2017. His
research interest is focused on Online
Distribution Channel, Sustainable Business
Model, and Consumer Behavior. He got a
Master of Business Administration from
the School of Business Management
Institute Technology Bandung.
M. Ardhya Bisma is a lecturer in the
Logistics Business Department, Politeknik
Pos Indonesia since 2018. His research
interest is focused on Online Marketing,
Business Strategy, and Finance. He got a
Master of Business Administration from
the School of Business Management
Institute Technology Bandung.
Darfial Guslan is a lecturer in the
Logistics Business Department, Politeknik
Pos Indonesia since 2015. His research
interest is focused on Distribution
Management, Inventory Management, and
Transportation. He got a Master of
Industrial Engineering and pursuing a
Doctoral in Pasundan University Bandung.
96 Aditia Sovia Pramudita, et. al
Asia-Pacific Management and Business Application, 9, 2 (2020): 83-98
References
Ahmad, S., & Afthanorhan, W. M. A. B.
W. (2014). The Importance-
Performance Matrıx Analysıs In
Partıal Least Square Structural
Equatıon Modelıng ( PLS-SEM ).
International Journal of
Mathematical Research, 3(April), 1–
14.
Alalwan, A. A., Baabdullah, A., Rana, N.
P., Tamilmani, K., & Dwivedi, Y. K.
(2018). Examining Adoption of
Mobile Internet in Saudi Arabia:
Extending TAM with Perceived
Enjoyment, Innovativeness and Trust.
Technology in Society.
https://doi.org/10.1016/j.techsoc.2018
.06.007
Ariff, M. S. M., Yan, N. S., Zakuan, N.,
Bahari, A. Z., & Jusoh, A. (2013).
Web-based Factors Affecting Online
Purchasing Behaviour. IOP Conf.
Series: Materials Science and
Engineering, 46.
https://doi.org/10.1088/1757-
899X/46/1/012038
Asosiasi Penyelenggara Jasa Internet
Indonesia. (2018). Penetrasi & profil
perilaku pengguna internet indonesia.
Badan Koordinasi Penanaman Modal.
(2018). Kepala BKPM: Investor
Minati Sektor Pariwisata RI.
Retrieved from
https://www.bkpm.go.id/id/publikasi/
detail/berita/kepala-bkpm-investor-
minati-sektor-pariwisata-ri
Badan Pusat Statisik. (2018). Bandung
Municipality in Figures. Retrieved
from
https://bandungkota.bps.go.id/publicat
ion/download.html
Badan Pusat Statisik. (2019). Pariwisata
dalam Angka. Retrieved from
https://www.bps.go.id/site/resultTab
Bagozzi, R. P. (2007). The Legacy of the
Technology Acceptance Model and a
Proposal for a Paradigm Shift.
Journal of the Association for
Information Systems, 8(4).
https://doi.org/10.17705/1jais.00122
Berita Satu. (2016). Industri Perhotelan
Dukung Kemajuan Sektor Pariwisata.
Retrieved from
https://www.beritasatu.com/properti/3
94330-industri-perhotelan-dukung-
kemajuan-sektor-pariwisata.html
Bisma, M. A., & Pramudita, A. S. (2019).
Analisa Minat Pembelian Online
Konsumen Pada Saluran Distribusi
Digital Marketplace Online di Kota
Bandung. Competitive, 14(2), 36–44.
https://doi.org/http://dx.doi.org/10.36
618/competitive.v14i2.617
Broekhuizen, T. L. J. (2017).
Understanding Channel Purchase
Intentions : Measuring Online and
Offline Shopping Value Perceptions
University of Groningen
Understanding channel purchase
intentions.
Camilleri, M. (2018). The Tourism
Industry : An Overview.
https://doi.org/10.1007/978-3-319-
49849-2
Chiou, J.-S., & Pan, L.-Y. (2009).
Antecedents of Internet Retailing
Loyalty : Differences Between Heavy
Versus Light Shoppers. J Bus
Psychol, (24), 327–339.
https://doi.org/10.1007/s10869-009-
9111-7
Choudhury, D., & Dey, A. (2014). Online
Shopping Attitude among the Youth :
A study on University Students.
International Journal of
Entrepreneurship and Development
Studies, 2(1).
Chuttur, M. (2009). Overview of the
technology acceptance model:
Origins, developments and future
directions. Working Papers on
Information Systems, 9–37.
Davis, F. D. (1989). Perceived Usefulness,
Perceived Ease of Use, and User
Acceptance of Information
Technology. MIS Quarterly, 13(3),
319–340.
https://doi.org/10.2307/249008
Delafrooz, N., Paim, L. H., & Khatibi, A.
(2010). Students ’ Online Shopping
Behavior : An Empirical Study.
Determinants Factor of Accommodation Online Buying through Online Travel Agent (OTA) 97
Asia-Pacific Management and Business Application, 9, 2 (2020): 83-98
Journal of American Science, 6(1),
137–147.
Dutot, V., Bhatiasevi, V., & Bellallahom,
N. (2019). Journal of High
Technology Management Research
Applying the technology acceptance
model in a three-countries study of
smartwatch adoption. Journal of High
Technology Management Research,
30(1), 1–14.
https://doi.org/10.1016/j.hitech.2019.0
2.001
Hair, J. F., Ringle, C. M., Sarstedt, M.,
Hair, J. F., Ringle, C. M., & Sarstedt,
M. (2011). PLS-SEM : Indeed a
Silver Bullet. Journal of Marketing
Theory and Practice, 12(2), 139–151.
https://doi.org/10.2753/MTP1069-
6679190202
Henseler, J., Ringle, C. M., & Sarstedt, M.
(2015). A new criterion for assessing
discriminant validity in variance-
based structural equation modeling. J.
of the Acad. Mark. Sci, 43, 115–135.
https://doi.org/10.1007/s11747-014-
0403-8
Heric, M., Polanc, G., & Ovc, B. (2015).
Computers in Human Behavior
Factors impacting the acceptance of
mobile data services – A systematic
literature review. Computer in Human
Behavior, 53, 24–47.
https://doi.org/10.1016/j.chb.2015.06.
013
Hills, J. R., & Cairncross, G. (2011). How
small regional accommodation
providers view and respond to online
intermediaries, (June 2018).
https://doi.org/10.1177/13567667114
20835
Hsieh, J., & Liao, P. (2011). Antecedents
And Moderators Of Onlıne Shoppıng
Behavıor In Undergraduate Students.
Socıal Behavıor And Personalıty,
39(9), 1271–1280.
Kian, T. P., Boon, G. H., Fong, S. W. L.,
& Ai, Y. J. (2017). Factors That
Influence the Consumer Purchase
Intention in Social Media Websites.
International Journal of Supply Chain
Management, 6(4), 208–214.
Kim, H., & Song, J. (2010). The quality of
word-of-mouth in the online shopping
mall. Journal of Research in
Interactive Marketing, 4(4), 376–390.
https://doi.org/10.1108/17505931011
092844
Kim, J., Franklin, D., Phillips, M., &
Hwang, E. (2019). Online Travel
Agency Price Presentation :
Examining the Influence of Price
Online Travel Agency Price. Journal
of Travel Research, (July), 1–18.
https://doi.org/10.1177/00472875198
57159
King, W. R., & He, J. (2006). A meta-
analysis of the technology acceptance
model. Information & Management,
43, 740–755.
https://doi.org/10.1016/j.im.2006.05.0
03
Kotler, P., & Keller, K. L. (2012).
Marketing Management (Global Edi).
London: Pearson Education Limited
2012.
Li, N., & Zhang, P. (2002). Consumer
Onlıne Shoppıng Attıtudes And
Behavıor: An Assessment Of
Research. Eighth Americas
Conference on Information Systems,
(September).
Li, R., Chung, T. L. D., & Fiore, A. M.
(2017). Factors affecting current
users’ attitude towards e-auctions in
China: An extended TAM study.
Journal of Retailing and Consumer
Services, 34, 19–29. doi:10.1016/j.
jretconser.2016.09.003
Morris, M. G., & Dillon, A. (1997). Paper
accepted for publication in : IEEE
Transactions on Software Engineering
. The Influence of User Perceptions
on Software Utilization : Application
and Evaluation of a Theoretical
Model of Technology Acceptance.
IEEE Transactions on Software
Engineerin, 14(4).
https://doi.org/10.1109/52.595956
Muda, M., Mohd, R., & Hassan, S. (2016).
Online Purchase Behavior of
Generation Y in Malaysia. Procedia
Economics and Finance, 37(16), 292–

98 Aditia Sovia Pramudita, et. al
Asia-Pacific Management and Business Application, 9, 2 (2020): 83-98
298. https://doi.org/10.1016/S2212-
5671(16)30127-7
Ofori, D., & Appiah-nimo, C. (2019).
Cogent Business & Management
Determinants of online shopping
among tertiary students in Ghana : An
extended technology acceptance
model Determinants of online
shopping among tertiary students in
Ghana : An extended technology
acceptance model. Cogent Business &
Management, 6(1).
https://doi.org/10.1080/23311975.201
9.1644715
Pramudita, A. S. (2018). Formulasi Model
Bisnis Hostel di Bandung dengan
Pendekatan Value Chain dan Business
Model Canvas ( Studi Kasus : Pinisi
Backpacker ), II(1), 32–38.
https://doi.org/10.36217/ibmr.v2i1.44
Pramudita, A. S., Yanuar, A., & Hilman,
T. (2019). Busıness Model
Formulatıon For E-Newspaper In
Indonesıa ( Case Study : Pıkıran
Rakyat ). Jurnal Bisnis Dan
Manajemen, 20(1), 15–31.
https://doi.org/http://dx.doi.org/10.24
198/jbm.v20i1.250
Pramudita, A.S., Bisma, M.A., Guslan, D.
(2020). The Distribution Channel
Preferences in Purchase Decision-
Making of Backpacker Hostel
Customers.
https://doi.org/10.21512/bbr.v11i2.62
41
Priyanka, G. P., & Ramya, K. (2016).
Usage of Online Shopping among
College Students. Imperial Journal of
Interdisciplinary Research (IJIR),
2(8), 574–578.
Sanakulov, N., & Karjaluoto, H. (2015).
Consumer adoption of mobile
technologies : A literature review This
is an electronic reprint of the original
article . This reprint may differ from
the original in pagination and
typographic detail . International
Journal of Mobile Communications,
13(3), 244–275.
https://doi.org/10.1504/IJMC.2015.06
9120
Shuhaiber, A., & Mashal, I. (2019).
Technology in Society Understanding
users ’ acceptance of smart homes.
Technology in Society, 58.
https://doi.org/10.1016/j.techsoc.2019
.01.003
Sugiyono. (2010). Metodologi Penelitian
Pendidikan (Pendidikan Kualitatif,
Kuantitatif, dan R&D). Bandung:
Alfabeta.
Venkatesh, V., Davis, F. D., Venkatesh,
V., & Davis, F. D. (2000). A
Theoretical Extension of the
Technology Acceptance Model : Four
Longitudinal Field Studies.
Management Science, 46(2), 185–
204.
https://doi.org/https://doi.org/10.1287/
mnsc.46.2.186.11926
Vlek, C., & Stallen, P.-J. (1980). Ratıonal
And Personal Aspects Of Rısk *
Charles Vlek. Acta Psychologica, 45,
273–300.
Wu, J., & Wang, S. (2005). What drives
mobile commerce ? An empirical
evaluation of the revised technology
acceptance model. Information &
Management, 42, 719–729.
https://doi.org/10.1016/j.im.2004.07.0
01
Wu, L., Chen, K., Chen, P., & Cheng, S.
(2014). Perceived value , transaction
cost , and repurchase-intention in
online shopping : A relational
exchange perspective. Journal of
Business Research, 67(1), 2768–2776.
https://doi.org/10.1016/j.jbusres.2012.
09.007