determinants of cancer disparities: barriers to cancer screening,...
TRANSCRIPT

Surg Oncol Clin N Am
14 (2005) 655–669
Determinants of Cancer Disparities:Barriers to Cancer Screening,Diagnosis, and Treatment
Harold P. Freeman, MDa,b,c,*, Kenneth C. Chu, PhDc
aDepartment of Surgery, College of Physicians and Surgeons, Columbia University,
5141 Broadway at 220th Street, New York, NY 10034, USAbRalph Lauren Center for Cancer Care and Prevention,
1919 Madison Avenue, New York, NY 10035, USAcCenter to Reduce Cancer Health Disparities, National Cancer Institute,
6116 Executive Boulevard, Suite 602, Bethesda, MD 20892, USA
In 1971, President Richard Nixon declared a war on cancer and signedthe National Cancer Act. Since that time, there have been great researchadvances. In the subsequent years there have been declines in mortalityoverall and for some specific cancers, such as breast, colorectal, prostate,and lung cancers [1]. These declines have been attributed to cancerprevention and early detection measures and effective cancer treatments[2]. Examples of effective cancer screening tests are Pap smears for cervicalcancer, mammography for breast cancer, colorectal cancer screening, andperhaps prostate-specific antigen testing for prostate cancer. Smokingprevention also has reduced the incidence of lung cancer dramatically.
Unfortunately, however, not everyone in the United States has sharedsufficiently in these interventions and has not benefited as well with respectto declining mortality rates [3]. These findings suggest that there isa disconnect between the nation’s discovery and delivery enterprises, be-tween what we know and what we do. This discovery/delivery disconnectleads, at least in part, to the unequal burden of cancer, with resultant cancerhealth disparities (Fig. 1). Disparities occur when beneficial medicalinterventions are not shared by everyone in this country [4,5]. This unequalburden of cancer is a challenge to science and, more importantly, a moraland ethical dilemma for the United States [6].
* Corresponding author. Ralph Lauren Center for Cancer Care and Prevention, 1919
Madison Avenue, New York, NY 10035.
E-mail address: [email protected] (H.P. Freeman).
1055-3207/05/$ - see front matter � 2005 Elsevier Inc. All rights reserved.
doi:10.1016/j.soc.2005.06.002 surgonc.theclinics.com

656 FREEMAN & CHU
The major declines in cancer rates can be attributed mainly to cancerprevention [6] and screening [7–11]. Declines in cancer mortality rates maybe achieved through primary prevention or by screening and early detectioncoupled with timely and effective treatments. Effective cancer preventionand control activities cover the spectrum of cancer care from cancerprevention to early detection to effective diagnosis and treatment.
Causes of cancer health disparities
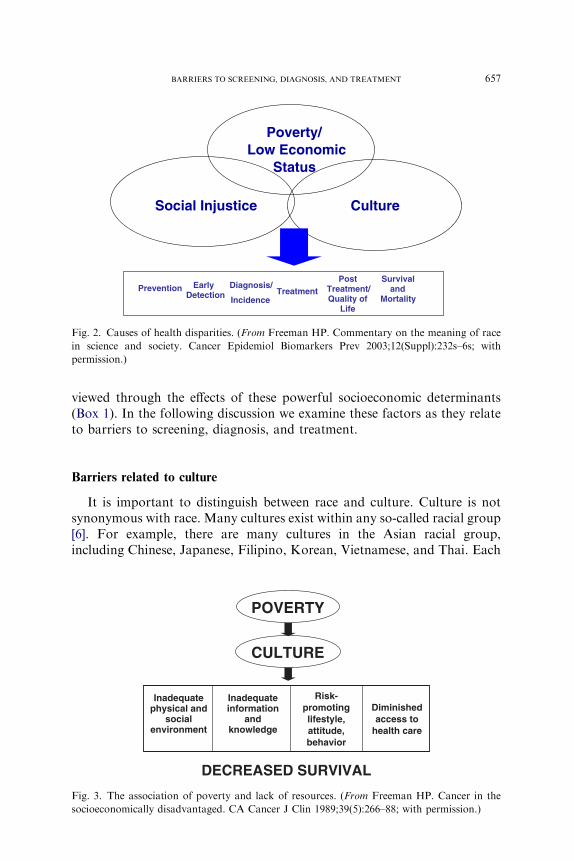
Disease always occurs within the context of human circumstances, andcancer is no exception. Three major determinants of health disparitiesamong groups are culture, poverty (ie, low socioeconomic status), and thehistorical and current effects of social injustice (Fig. 2) [5]. It is important todistinguish between the meanings of these critical social variables.
The meaning of culture encompasses an individual’s or community’sshared communication system, similarities in physical and social environ-ments, common beliefs, values, traditions, and world view, and similaritiesin lifestyle, attitude, perceptions, and behavior. Conversely, poverty isassociated with a lack of resources, inadequate information and knowledge;substandard living conditions, risk-promoting lifestyle, attitudes, andbehaviors, diminished access to health care, and poor nutrition (Fig. 3).Culture may augment or diminish poverty’s expected negative effects.Historically, social injustice has developed in the context of declaring certainpopulation groups ‘‘inferior’’ to others. Currently, forms of social injustice,such as racism and racial discrimination, are factors in diminishing equalaccess to health care for some populations. The effects of these causalfactors, namely culture, poverty, and social injustice, overlap with therelative importance of each factor changing with time. All aspects of thecancer continuum from cancer prevention, screening, early detection,diagnosis, treatment, and rehabilitation are impacted by these factors (seeFig. 2). Specific barriers to screening, diagnosis, and treatment can be
The research to delivery “disconnect” is a keydeterminant of the unequal burden of cancer.
Discovery Development Delivery
Critical Disconnect
Fig. 1. Source of cancer health disparities. (From Freeman HP. Poverty, culture, and social
injustice: determinants of cancer disparities. CA cancer J Clin 1989;39(5):266–88; with
permission.)
657BARRIERS TO SCREENING, DIAGNOSIS, AND TREATMENT
viewed through the effects of these powerful socioeconomic determinants(Box 1). In the following discussion we examine these factors as they relateto barriers to screening, diagnosis, and treatment.
Barriers related to culture
It is important to distinguish between race and culture. Culture is notsynonymous with race. Many cultures exist within any so-called racial group[6]. For example, there are many cultures in the Asian racial group,including Chinese, Japanese, Filipino, Korean, Vietnamese, and Thai. Each
CultureSocial Injustice
Poverty/Low Economic
Status
Prevention EarlyDetection
Diagnosis/
IncidenceTreatment
Post Treatment/Quality of
Life
Survival and
Mortality
Fig. 2. Causes of health disparities. (From Freeman HP. Commentary on the meaning of race
in science and society. Cancer Epidemiol Biomarkers Prev 2003;12(Suppl):232s–6s; with
permission.)
POVERTY
CULTURE
DECREASED SURVIVAL
Inadequatephysical and
socialenvironment
Inadequateinformation
andknowledge
Risk-promotinglifestyle,attitude,behavior
Diminishedaccess to
health care
Fig. 3. The association of poverty and lack of resources. (From Freeman HP. Cancer in the
socioeconomically disadvantaged. CA Cancer J Clin 1989;39(5):266–88; with permission.)

658 FREEMAN & CHU
Box 1. Barriers classified by cultural factors, social injustice,and poverty factors
Cultural barriersIndividual and role of culturePatient barriers related to educational information and their culture
� Lack of accurate cancer information� Available information is unusable because of literacy,
language, or cultural aspectsBarriers related to impact of culture and use of cancer care
� Cultural perspectives or biases, which may cause people toavoid screening
� Cultural belief about cancer and cancer fatalism, which mayprevent people from seeking treatment
� Cultural perception of illness, which may affect diagnosisand treatment of cancer
� Cultural factors that play a role in acting on medical andcaregiver preferences, including folk healing methods
� Cultural factors that determine how patients explain andtolerate pain
� Cultural perception of quality care� Cultural behaviors that are risk prompting� Lack of community support for screening activities
Health care provider and cultureCommunication barriers
� Health care provider–patient relationship, understanding,and sensitivity to culture of patient
Social injustice barriersSystem barriersLimited access because of racial and ethnic issues
� Lack of physician recommendation for screening test/diagnosis/treatment based on racial discrimination
� Physician perception/biases toward racial groups� Biases associated with treatment of racial and ethnic groups� Racial profiling: doing harm by projecting stereotypes of
a racial or ethnic group on an individual
PovertyIndividual and povertyFinancial barriers
� Financial issues that affect patient access to care� Insurance status

659BARRIERS TO SCREENING, DIAGNOSIS, AND TREATMENT
has its own language, oral and written. Many Asian languages have multipledialects, such as Mandarin and Cantonese for Chinese. Their cultures are asvaried as the distinctive nature of their cooking. In the United States,however, they are all classified into one racial group, which is Asian.
Culture may influence the ability of an individual to understand the needto seek or accept cancer care and perceptions related to the likelihoodof developing cancer. Culture may affect the capability to understandinformation on screening and cancer. Many sources of information oncancer are available; however, if an individual cannot understand thematerials, such information is meaningless to that individual. Culture maypromote risk-promoting lifestyles, such as heavy smoking, drinking ofalcohol, or eating of fatty foods. Culture is a determinant of the beliefs andperceptions about cancer. In some cultures there is a tendency to be fatalistic
Physical barriers� Transportation� Distance to cancer care� Time off work or daycare issues
Barriers related to impact of culture and access to cancer care� Poor provider–patient relationship� Understanding provider information� Understanding patient needs
Health care provider and povertyFinancial barriers
� Financial issues that affect health care providers� Insurance coverage� Reimbursement costs and paperwork� Failure to recommend screening� Inadequate patient education
Communication barriers� Do not share clinical information with patient� Poor provider interaction with community
Health care system and povertyBarriers that limit or prevent access to cancer care
� Underemphasis of cancer prevention� Lack of screening facilities� Limited education efforts� Lack of treatment for uninsured� Health insurance status� Problem of paying for services� Fragmentation of care� Limitations on screening and treatment services

660 FREEMAN & CHU
(eg, the perception that getting cancer is a death sentence). People with suchan attitude do not seek or accept cancer screening or care. Culturaltraditions may be a determinant of what treatments are acceptable, such asthe use of folk medications rather than standard care. High death ratesassociated with treatment of late-stage disease may create the suspicion ina community that cancer treatment is a cause of death [12]. Recommen-dations by health care providers under such circumstances may be ignored.To overcome such barriers, there is a need to provide culturally andlinguistically appropriate information and knowledge. Providers mustunderstand the culture of their patients and the factors that can enhancetheir patients’ willingness to comply with their recommendations [5]. Itshould be noted that care providers also are of particular cultures, a factorthat could influence health care–related decisions. We point out that allcaregivers are acculturated and socialized before they are educated.
Barriers related to poverty
Recent data on cancer mortality rates by socioeconomic status documentthe disparities associated with poverty [13]. The 1995–1999 cancer mortalityrates are reported by three levels of poverty: counties with !10% of peopleliving below the poverty level, counties with 10% to !20% of people livingbelow the poverty level, and counties with R20% of people living below thepoverty level. For all cancer sites combined for all races, the R20% povertygroup had the highest cancer mortality rates, with 13% higher rates for menand 3% higher rates for women than the !10% poverty groups [14].
The 1995–1999 cervical cancer mortality rates for the major racial andethnic groups (non-Hispanic whites, blacks, Hispanics, Asians and PacificIslanders, and American Indians/Alaska natives) have been shown tocorrelate directly to economic status. Within each population group, higherpoverty rates were associated with higher mortality at the county level. Foreach racial or ethnic group, the 10% to !20% poverty group had a higherrate than the !10% poverty group, and the R20% group had the highestpoverty rate. These rates demonstrate that poverty correlates withdisparities within and between racial and ethnic groups [13].
A report on excess cervical cancer mortality showed that areas with highcancer rates also had high cardiovascular mortality rates and high infantmortality rates. High rates of cervical cancer mortality are sentinel markersthat indicate larger, systemic health care issues that must be addressed bycancer control and other health care strategies [15].
The impact of poverty (low socioeconomic status) has major effects ondisease incidence and access to screening and treatment. Forty-five millionAmericans do not have health insurance, and an estimated additional 35million are underinsured [16]. Many of these people fall into a void, becausethey are too rich forMedicaid but too poor for Blue Cross insurance. Povertyis associated with risk and unhealthy diet and exposure to toxic environ-

661BARRIERS TO SCREENING, DIAGNOSIS, AND TREATMENT
ments. Poor people also have less information and knowledge, are less likelyto undergo cancer screening tests, and are less likely to be informed ofabnormal results on a timely basis [4–6]. Because of these factors and others,poor people tend to undergo initial treatment of cancer at later stages ofdisease.
Poverty also affects health care providers. Recent studies have suggestedthat low socioeconomic areas tend to have less well educated health careproviders, such as fewer board-certified physicians [17]. As a result, somehealth care providers may not recommend screening tests or appropriatetreatment to their patients. Physicians who practice in poor communities areless likely to be reimbursed appropriately for services rendered, which mayaffect the quality of service offered to patients. Sufficient resources may notbe available to educate patients about screening. Few resources may makescreening facilities and staff less available, affect the timely reporting ofscreening results, and diminish the quality of cancer treatment of uninsuredand underinsured patients.
Poverty and culture are interrelated closely. We suggest that poverty actsthrough the prism of culture. Culture may augment or diminish poverty’sexpected negative effects. Poverty is associated with inadequate physical andsocial environment, inadequate information and knowledge, risk-promotinglifestyles, attitudes and behaviors, and diminished access to health care,which result in decreased survival. Consider the people of Harlem, NewYork. They are mainly poor African Americans, many of whom smokeheavily, drink heavily, and eat a diet that is high in fat and salt. Similarlifestyles and behaviors are dominant in Harian, Kentucky, where thepeople are poor and white [6]. In contrast, consider the members of theSeventh Day Adventists, a culture driven strongly by religious beliefs.Persons who follow the religion consume a vegetarian diet and neithersmoke cigarettes nor drink alcohol. Even if a person is poor but is living inthat culture, it is unlikely that the individual will develop lung cancer,because 90% of lung cancer is related to smoking cigarettes. Similarly,known health effects of excess alcohol use likely would be avoided. A diethigh in vegetables and fruits seems to prevent disease. Clearly, health risksare driven by poverty and culture and not by race. In Figs. 4 and 5, cancersurvival rates for all cancers combined by each racial and ethnic group arelowest for the higher poverty group [13].
Barriers related to social injustice: the meaning of race
In addition to culture and poverty, forms of social injustice, such asracism, discrimination and other kinds of bias, are critical factors in creatingand maintaining disparities. Social injustice may be a factor in determiningaccess to screening and cancer care.
Racial and ethnic categories in the United States are designated by theOffice of the Management of the Budget (OMB). The OMB responsibility

662 FREEMAN & CHU
stemmed from the government’s mandate to enforce civil rights laws(directive number 15 on race and ethnic standards for federal statistics andadministrative reporting) [17]. Data were needed to monitor equal access tohousing, education, employment, and other areas for populations thathistorically had experienced discrimination and differential treatmentbecause of their race or ethnicity. The standards are used not only in thedecennial census but also in household surveys, on administrative forms,and in medical and other research. Currently, these racial and ethnic groupsinclude whites, blacks, Hispanics or Latinos, American Indians and Alaskanatives, Asians, native Hawaiians, and other Pacific Islanders [17].
The Institute of Medicine report ‘‘Unequal Treatment: ConfrontingRacial and Ethnic Disparities in Health Care’’ has shown evidence of racialbias in the distribution of cancer care [19]. These actions may includeconscious decisions not to recommend screening or denying access to cancertreatments because of being in particular racial and ethnic groups. TheInstitute of Medicine determined that African Americans are less likely toreceive standard treatments for cancer even at the same insurance andeconomic status. Bach and colleagues [17,20] showed that African-Americanpatients were substantially less likely than white patients to undergo curativesurgery for early-stage lung cancer, although they have the same insurancecoverage and seem to be at the same economic level. In non-cancer
Fig. 4. SEER cancer survival among men. (From Singh GK, Miller BA, Hankey BF, et al. Area
socioeconomic variations in US cancer incidence, mortality, stage, treatment, and survival,
1975–1999. NIH Publication No.03-5417. Bethesda (MD): National Cancer Institute; 2003.)

663BARRIERS TO SCREENING, DIAGNOSIS, AND TREATMENT
examples, Ayanian and colleagues [21] found that race is a major factor inwho is referred for renal transplantation. An individual is more likely to bereferred for transplantation if he or she is white rather than AfricanAmerican. Studies of emergency room experiences indicated that people alsoare treated for pain differently according to race. Compared with whites,African Americans and Hispanics are less likely to be treated with pain-reducing drugs when they have a long bone fracture, clearly a painfulcondition [22,23]. Evidence suggests that race does play a role in the provisionof medical care. Patient bias also may play a role. Patients are less likely tofollow screening diagnosis and treatment recommendations if they do nottrust their doctors. False assumptions on the part of either the caregiver orthe patient can have profound effects and may result in health care disparities[6]. Racial profiling may lead to errors in diagnosis and treatment. Racialprofiling is stereotyping racial and ethnic groups and projecting thosestereotypic characteristics on individuals in that group, which may lead tofalse assumptions that result in serious harmdintentional or unintentionaldto individuals. For example, a health care provider may decide thata particular form of care should not be offered to an individual of a certainracial or ethnic group because of assumptions about the characteristics ofmembers of the group, such as level of understanding and likelihood ofcompliance. Such actions may be unintentional but may have the effect that
Fig. 5. SEER cancer survival among women. (From Singh GK, Miller BA, Hankey BF, et al.
Area socioeconomic variations in US cancer incidence, mortality, stage, treatment, and survival,
1975–1999. NIH Publication No.03-5417. Bethesda (MD): National Cancer Institute; 2003.)

664 FREEMAN & CHU
an individual in a particular racial or ethnic group may be denied a beneficialintervention because of perceived racial and ethnic characteristics.
Another important related issue centers around the meaning and use ofracial categories in science and society. On one hand, there is generalagreement that racial and ethnic designation allows for monitoring for andcorrecting inequalities [18]. On the other hand, we conclude from populationgenetic and genomic studies that there is no biologic basis for the OMBclassifications. OMB has stated that ‘‘The categories represent a social-political construct designed for collecting data on the race and ethnicity ofbroad population groups in this country, and are not anthropologically orscientifically based’’ [18,24]. Genomic studies have shown that clusters ofancestral origins correspond to country of origin rather than the OMBclassifications. The OMB racial and ethnic classifications are used tomonitor equity in our society. Consider the following points. Genomicstudies have shown that Africans have the greatest genetic variation of anyracial group. In the OMB classification, however, all African Americans areclassified as one group. Hispanics are tied together by a common languageand not by geographic or genetic bounds. In the OMB classifications,however, all Hispanics are grouped together. The dilemma occurs when thebroad, nonscientific OMB classifications are used for scientific purposes,such as to determine if drugs are appropriate for specific racial and ethnicgroups. The inappropriate use of racial and ethnic classifications could leadto misjudgments in treatment decisions.
In science and society, race is often used as a proxy for poverty, class,education, discriminatory experiences, and certain behaviors, among otherfactors. Such proxies frequently are misleading. Given the fact that humanpopulations do differ and race is not the basis for those variations, however,scientists face the challenge of elucidating how populations really differ. Todiminish disparities, we must look much deeper than race and ethnicity tofind the real variables that cause disparities. Disparities may be caused bya lack of resources, cultural differences, lack of health insurance, or somecomplex array of these factors, for which race is only a surrogate measure.These factors somehow must be identified and quantified rather thanattributing the differences to racial and ethnic groups. We must move awayfrom assuming that being in a group is in itself the cause of disparity, exceptin cases in which the disparities are the result of inequity or social injustice [6].
Patient navigation: the Harlem experience
In recent years there has been progress in increasing screening rates inminority populations, particularly for breast cancer screening (Table 1) [25].In the 2000 National Health Interview Survey, 68% of African-Americanwomen reported having had a mammogram in the last 2 years, comparedwith 71% of white women. The closing of the screening gap has not beenreflected in a closing of the racial gap in mortality rates, however. The gap

665BARRIERS TO SCREENING, DIAGNOSIS, AND TREATMENT
between white and black female breast cancer mortality rates is stillwidening [3]. There seems to be a need for more than just screening rates tobe comparable to reduce disparities. Early detection through screening doesnot reduce mortality unless such screening is followed by timely treatment.
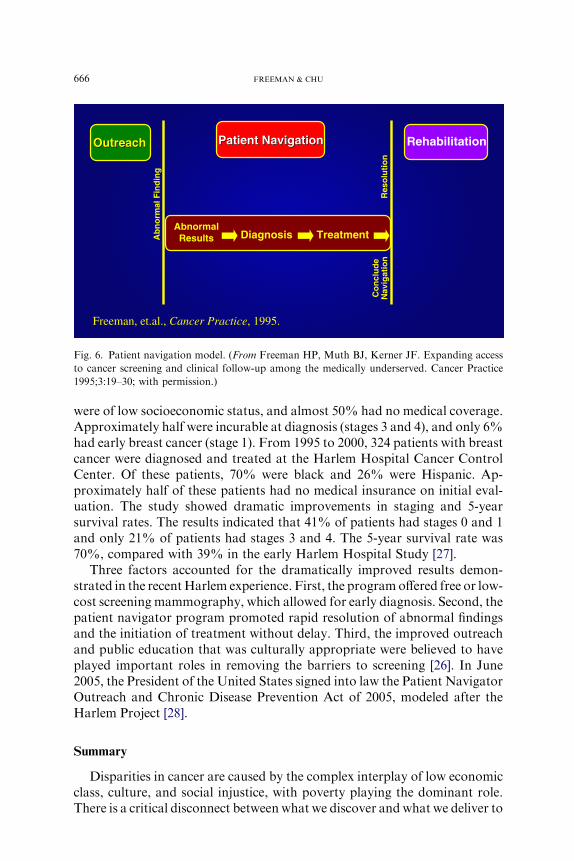
We have determined that one way to promote timely treatment aftera suspicious finding is through patient navigation. Patient navigators assurethat any barrier a patient encounters in seeking diagnosis and treatment iseliminated (Fig. 6) [13]. This program operates on the paradigm that onecan remove the effects of poverty, although poverty itself has not beenreduced. The patient navigation concept and program were pioneered inHarlem, New York. The program was created to help address the barriersthat poor people face in trying to obtain clinical follow-up services from anabnormal finding or cancer diagnosis and treatment. The patient navigatoridentifies, anticipates, and helps to alleviate the barriers that patientsencounter. Patient navigators help patients to overcome the barriers beforethey become an obstacle to obtaining prompt and appropriate care [26,27].
In the 22-year period that ended in 1986, 606 patients (94% black) withbreast cancer were treated at the Harlem Hospital Center. Almost all patients
Table 1
Percent utilization of screening tests by race/ethnicity, education, health insurance and
immigration status
Mammograms
in women R 40
(within last
2 years)
Colorectal cancer
screening in
adults R 50
Pap test in
Women R 25
(within last
3 years)
Prostate
specific
antigen test
within yearMale Female
Racial/ethnic Group
White 71 42 39 83 42
Black 68 40 32 84 37
AI/AN 52 37 28 75 28
Asian 59 34 27 71 26
Hispanic 61 27 27 77 30
Non-Hisp White 72 43 39 83 43
Education
! High school 57 29 29 74 29
Some college 73 42 42 84 46
College graduate 80 52 48 88 52
Health Insurance
None 38 19 18 62 13
Public 62 35 32 79 33
Private/Military 75 44 41 86 44
Immigration
In US !10 years 39 20 16 61 17
In US R10 years 65 33 31 79 32
Born in US 71 42 39 83 42
Abbreviations: AI, American Indian; AN, Alaska Native.
Data from Swan J, Breen N, Coates RJ, et al. Progress in cancer screening practices in the
United States. Cancer 2003;97:1528–40.
666 FREEMAN & CHU
were of low socioeconomic status, and almost 50% had no medical coverage.Approximately half were incurable at diagnosis (stages 3 and 4), and only 6%had early breast cancer (stage 1). From 1995 to 2000, 324 patients with breastcancer were diagnosed and treated at the Harlem Hospital Cancer ControlCenter. Of these patients, 70% were black and 26% were Hispanic. Ap-proximately half of these patients had no medical insurance on initial eval-uation. The study showed dramatic improvements in staging and 5-yearsurvival rates. The results indicated that 41% of patients had stages 0 and 1and only 21% of patients had stages 3 and 4. The 5-year survival rate was70%, compared with 39% in the early Harlem Hospital Study [27].
Three factors accounted for the dramatically improved results demon-strated in the recentHarlem experience. First, the programoffered free or low-cost screening mammography, which allowed for early diagnosis. Second, thepatient navigator program promoted rapid resolution of abnormal findingsand the initiation of treatment without delay. Third, the improved outreachand public education that was culturally appropriate were believed to haveplayed important roles in removing the barriers to screening [26]. In June2005, the President of the United States signed into law the Patient NavigatorOutreach and Chronic Disease Prevention Act of 2005, modeled after theHarlem Project [28].
Summary
Disparities in cancer are caused by the complex interplay of low economicclass, culture, and social injustice, with poverty playing the dominant role.There is a critical disconnect between what we discover and what we deliver to
OutreachOutreach Patient NavigationPatient Navigation Rehabilitation
AbnormalResults Diagnosis TreatmentA
bn
orm
al F
ind
ing
Res
olu
tio
nC
on
clu
de
Nav
igat
ion
Freeman, et.al., Cancer Practice, 1995.
Fig. 6. Patient navigation model. (From Freeman HP, Muth BJ, Kerner JF. Expanding access
to cancer screening and clinical follow-up among the medically underserved. Cancer Practice
1995;3:19–30; with permission.)

667BARRIERS TO SCREENING, DIAGNOSIS, AND TREATMENT
all Americans in the form of prevention, diagnosis, and treatment of cancer.This disconnect between what we know, at any given time, andwhat we do forthe American people is in and of itself a major determinant of cancerdisparities. Residents of poorer communities, regardless of race, have higherdeath rates from cancer. Viewed separately, within each racial and ethnicgroup, people who live in poorer counties have lower cancer survival.Evidence exists that race, in and of itself, is a determinant of the level of healthcare received. The biologic concept of race is untenable, but racial injusticedhistorical and currentdis one of the determinants of cancer disparities. In thisnation, we see, value, and behave toward one another through a powerful lensof ‘‘race.’’ This lens can create false assumptions that may result in seriousharm to members of some racial and ethnic groups.
The following recommendations are provided to ensure that all patientsreceive the appropriate care [5].
Ensure that populations at highest risk have access to age- and gender-appropriate screening and follow-up services for breast, cervical, andcolorectal cancer. Expand to include these services for other cancerswhen there is evidence that they are effective at improving survival.
Provide immediate medical coverage for uninsured and underinsuredpatients at the point of obtaining a suspicious result or diagnosis ofcancer to ensure that no person with cancer goes untreated.
Delineate and target geographic areas with excess mortality with anintense approach to providing culturally relevant education, appropri-ate access to screening, diagnosis, treatment, and improved socialsupport network.
Provide such communities with funding for patient navigator programs,the purpose of which is to provide personal assistance in obtainingtimely and adequate diagnosis and treatment.
Establish and implement systems for monitoring treatment equityaccording to standards of care to diminish bias in the provision ofhealth care.
Ensure that each individual, regardless of economic status, share in theresponsibility for promoting his or her own health and well-being.
Final thoughts
There is a critical disconnect between what we discover and what wedeliver to all Americans in the form of prevention, screening, detection,diagnosis, and treatment of cancer. This disconnect between what we knowat any given time and what we do for the American people is, in and of itself,a major determinant of cancer disparities. We must identify and eliminate allbarriers that prevent the benefits of research from reaching all people. Suchbarriers may be experienced at any point along the continuum of pre-vention, screening, diagnosis and treatment, and palliative care.

668 FREEMAN & CHU
The United States has made progress in providing some forms ofscreening, such as for breast, cervical, and prostate cancer. We face a par-ticular challenge in promoting and applying screening for colorectal cancer,which has the capability of markedly reducing death from colorectal cancer.Saving lives from cancer extends well beyond getting a particular screeningtest, however. Patients with suspicious findings at screening must be assuredtimely diagnosis and treatment. In communities of low socioeconomicstatus, patient navigation has proved to be an effective intervention inpromoting such timely diagnosis and treatment when applied at the point ofpositive finding.
Geographic areas with excess cancer mortality should be delineated andtargeted with an intense approach to providing culturally relevant edu-cation, appropriate access to screening diagnosis and treatment, and im-proved support systems, such as navigation.
The war against cancer has not been fought equitably on all fronts. Wemust tear down the economic, cultural, and societal barriers to early diag-nosis and treatment of cancer. We must apply what we know, at any giventime, to all people.
References
[1] Jemal A, Murray T, Ward E, et al. Cancer statistics, 2005. CA Cancer J Clin 2005;55(1):
10–30.
[2] Smith RA, Cokkinides V, Eyre HJ. American Cancer Society guidelines for the early
detection of cancer, 2005. CA Cancer J Clin 2005;55:31–44.
[3] Ries L, EisnerMP,KosaryCL, et al. SEER cancer statistics review, 1975–2001. Available at:
http://seer.cancer.gov/csr/1975_2001. Accessed March 16, 2005.
[4] FreemanHP. Cancer in the socioeconomically disadvantaged. CACancer J Clin 1989;39(5):
266–88.
[5] Freeman HP. Poverty, culture, and social injustice: determinants of cancer disparities. CA
Cancer J Clin 2004;54(2):72–7.
[6] FreemanHP. Commentary on the meaning of race in science and society. Cancer Epidemiol
Biomarkers Prev 2003;12(Suppl):232s–6s.
[7] Jemal A, Chu KC, Tarone RE. Cancer surveillance series: recent trends in lung cancer
mortality in the United States. J Natl Cancer Inst 2001;93:277–83.
[8] Chu KC, Tarone RE, Chow WH, et al. Temporal patterns in colorectal cancer incidence,
survival, and mortality from 1950 through 1990 [see comments]. J Natl Cancer Inst 1994;
86(13):997–1006.
[9] Chu KC, Tarone RE, Kessler LG, et al. Recent trends in US breast cancer incidence,
survival, and mortality rates [see comments]. J Natl Cancer Inst 1996;88(21):1571–9.
[10] Tarone RE, Chu KC. Age-period-cohort analyses of breast-, ovarian-, endometrial- and
cervical-cancer mortality rates for Caucasian women in the USA. J Epidemiol Biostat 2000;
5:221–31.
[11] Chu KC, Tarone RE, Freeman HP. Trends in prostate cancer mortality among black men
and white men in the United States. Cancer 2003;97(6):1507–16.
[12] MargolisML. Racial differences pertaining to a belief about lung cancer surgery. Ann Intern
Med 2003;139:558–63.
[13] Singh GK, Miller BA, Hankey BF, et al. Area socioeconomic variations in US cancer
incidence, mortality, stage, treatment, and survival, 1975–1999. NIH Publication No.
03–5417 [4]. Bethesda (MD): National Cancer Institute; 2003.
669BARRIERS TO SCREENING, DIAGNOSIS, AND TREATMENT
[14] Ward E, Jemal A, Cokkinides V, et al. Cancer disparities by race/ethnicity and
socioeconomic status. CA Cancer J Clin 2004;54(2):78–93.
[15] Freeman HP, Wingrove BK. Excess cervical cancer mortality: a marker for low access to
health care in poor communities. NIH Publication No. 050–05282. Rockville (MD):
National Cancer Institute, Center to Reduce Cancer Health Disparites; 2005.
[16] Bureau of the Census. 2000 Census. Available at: www.census.gov. 2004. Accessed March
17, 2005.
[17] Bach PB, Pham HH, Schrag D, et al. Primary care physicians who treat blacks and whites.
N Engl J Med 2004;351:375–84.
[18] Office ofManagement andBudget. Revisions to the standards for the classification of federal
data on race and ethnicity. Washington, DC: Office of Management and Budget; 1997.
[19] Smedley BD, Stith A, Nelson AR, editors. Unequal treatment: confronting racial and ethnic
disparities in health care. Washington, DC: Institute of Medicine, National Academy Press;
2002.
[20] Bach PB. Racial disparities and the site of care. Ethn Dis 2005;15(2 Suppl 2):S31–3.
[21] Ayanian JZ, Cleary PD, Weisman JS, et al. The effect of patient’s preferences on racial
differences in access to renal transplantation. N Engl J Med 1999;341:1661–9.
[22] Todd KH, Samaroo N, Hoffman JR. Ethnicity as a risk factor for inadequate emergency
department analgesia. JAMA 1993;269:1537–9.
[23] ToddKH, Deaton C, D’Amato AP, et al. Ethnicity and analgesic practice. Ann EmergMed
2000;(35):11–6.
[24] Office of Management and Budget. Race and ethnic standards for federal statistics and
administrative reporting. Directive No. 15. Washington, DC: Office of Management and
Budget; 1977.
[25] Swan J, BreenN, CoatesRJ, et al. Progress in cancer screening practices in theUnited States.
Cancer 2003;97:1528–40.
[26] FreemanHP,MuthBJ, Kerner JF. Expanding access to cancer screening and clinical follow-
up among the medically underserved. Cancer Pract 1995;3:19–30.
[27] Freeman HP. A model patient navigator program. Oncology Issues 2004;19:44–7.
[28] PatientNavigatorOutreach andChronicDisease PreventionAct of 2005, 898USC x 109–18.