determinants of non-performing loans in trinidad and...
TRANSCRIPT

Determinants of Non-Performing Loans in Trinidad and Tobago: A Generalized Method of
Moments (GMM) Approach Using Micro Level Data
Abstract
Akeem Rahaman, Timmy Baksh, Reshma Mahabir, Dhanielle Smith1
The incidence of non-performing loans (NPL), which is usually, expressed a percentage of total
loans, can be used as an indicator of credit quality. High NPL implies that poor credit quality
can affect the stability of any banking system. Although NPL has been steadily declining at the
aggregate level between 2011 and 2014, it has been increasing at the individual bank level for
some individual commercial banks thus increasing credit risk for specific institutions, which can
have an overall impact on financial stability, given the financial linkages of the system. This
paper uses unpublished panel data from the commercial banking sector in Trinidad and Tobago
to estimate the bank-specific determinants of NPL using a Generalized Methods of Moments
(GMM)/Dynamic Panel model. The model employed the Arellano-Bond (1991) two-step
estimation technique which provides unbiased estimators when compared to a pooled regression
model. The data satisfied all robust conditions and the results lend support to the ‘moral hazard’
hypothesis where banks may have lower capital levels than that which is optimal (although
capital ratios are high), consequently increasing the riskiness of their loan portfolio. Furthermore,
the estimation rejected the ‘bad management’ and ‘skimping’ hypothesis.
JEL Classification Numbers: C23, C26, G21
Keywords: Non-performing loans, dynamic panel, two-step estimation.
1The views expressed in this paper are those of the author and does not necessarily represent
those of the Central Bank of Trinidad and Tobago
Table of Contents
Introduction .................................................................................................................................................. 3
Literature Review .......................................................................................................................................... 4
Data Description and Stylized Facts .............................................................................................................. 7
Methodology and Estimation ..................................................................................................................... 10
Robust Analysis ....................................................................................................................................... 11
Results ..................................................................................................................................................... 12
Summary and Conclusion ........................................................................................................................... 13
References .................................................................................................................................................. 15

Introduction
According to Beck et al. (2013), non-performing loans (NPL) have been identified as one of the
major factors contributing to credit risk for commercial banks. Similarly, the European Banking
Authority advocated that the first risk identified to the banking system is credit risk and is thus a
pillar one risk. In Trinidad and Tobago, the ratio of NPL from 1986 to 1989 increased from 11.7
per cent to 24.6 per cent. This was due to deteriorated economic conditions in the 1980’s, weak
credit controls, loans to high risk individuals and the failure of several large businesses. It then
fell to 14.9 per cent in 1992 as a result of Central Bank intervention and tighter credit screening.
In mid-2011, NPL for the commercial banking sector stood at 7.5 per cent of total loans2.
Although it has gradually declined and currently stands at approximately 4.2 per cent in June
2014, a lower level would be beneficial to both the commercial banks and financial stability. At
the institutional level, NPL has increased for five (5) out of the eight (8) commercial banks in
Trinidad and Tobago from 2009 to 20143. Given the interconnectedness of the commercial
banking sector with the overall financial system and the economy, any major credit risk can
adversely affect the commercial bank’s balance sheet and have ripple effects throughout the
financial system thereby contributing to financial instability. As such, the rationale for this
paper is to go behind the overall NPL and identify the bank or institutional level factors that
can influence NPL given the importance of each individual institution to the overall health of
the financial system. To our knowledge, this paper is the first to examine NPL at the bank level
in Trinidad and Tobago using the dynamic panel model. This paper aims to answer two
questions: firstly, what are the major institution-specific factors that influence NPL and secondly,
test the hypotheses of NPL as put forward by Berger and DeYoung (1997).
The paper is organized as follows: Section Two identified the literature that was used to form the
basis of the model and the different methodologies used to examine NPL. Section Three
examined the variables used in the model as indicators of cost efficiency and portfolio risks. It
also compared NPL at the aggregate and micro-level. Section Three is the estimation of the
Generalized Methods of Moments (GMM) model and its results, as well as tests for model
validity. Section Four summarized the findings of the paper and suggestions for future research.
2 See Graph 1
3 See Graph 2

Literature Review
Berger and DeYoung (1997) investigated the problem of NPL in the United States’ commercial
banks from 1985 to 1994. Their aim was to test four (4) hypotheses, namely the ‘bad luck’, ‘bad
management’, ‘skimping’ behavior and ‘moral hazard’ hypotheses. The ‘bad luck’ hypothesis
advocated that as macroeconomic conditions worsen, banks will incur increasing cost to address
the issue of NPL. The ‘bad management’ hypothesis pertained to cost inefficiency at commercial
banks as a result of improper management and monitoring of their loan portfolios. Contrary to
the ‘bad luck’ and ‘bad management’ hypotheses which dealt with increasing costs, the
‘skimping’ hypothesis dealt with high cost efficiency since limited resources are allocated to
monitoring loans thus leading to loan problems. The ‘moral hazard’ hypothesis suggests that
banks with low capital may have incentives to increase the riskiness of their loan portfolio
causing NPL to rise. The authors found support for all hypotheses except the ‘skimping’
hypothesis through the use of a Granger Causality model and concluded that low cost
efficiencies and thin capital ratios resulted in increasing NPL.
In light of increasing NPL, the higher credit risks and other financial costs associated with NPL
in Sub-Saharan Africa, Fofack (2005) aimed to investigate the major bank level as well as
macroeconomic factors contributing to NPL. The model was estimated using a Fixed Effects
Pseudo-Panel (unbalanced panel) model with a total of ninety (90) observations. The author’s
results led to the conclusion that even though microeconomic and macroeconomic factors
contributed to NPL, it was largely driven by macroeconomic conditions such as Gross Domestic
Product (GDP), the real interest rate and the inflation rate. These results were reinforced by
similar inferences being drawn through the use of the Granger-Causality on the variables.
Podiera and Weill (2007) estimated a GMM model to identify the causal factors of NPL using a
panel dataset from the Czech banking sector for the period 1994 to 2005. The aim of this paper
stemmed from the fact that in 1994, the banking sector had forty-eight (48) banks in operation
but by 2004, twenty-one (21) of those banks had failed. Out of the banks that failed, it was
observed that a large proportion of their loan portfolio was classified as non-performing, thus
prompting the authors to examine if NPL is a significant determinant of banks failure. The
estimated results suggested that NPL was as a result of the ‘bad management’ hypothesis

supported by eroding cost efficiency. However, they rejected the ‘bad luck’ hypothesis which
suggested reverse causality and that macroeconomic conditions did not significantly contribute
to NPL.
Furthermore, Louzis et al. (2010) estimated a dynamic panel, comprising the nine (9) largest
Greek banks between 2003 and 2009, on the various categories of NPL (consumer, business and
real estate mortgage). They found that not only did macroeconomic variables affect NPL, but
institution-specific efficiency and performance indicators contributed significantly to NPL. There
was also extensive support for the ‘bad management’ hypothesis. The authors’ estimation
revealed that although NPL was highly sensitive to macroeconomic conditions, the sub-
component real estate mortgages was the least sensitive.
Karim et al. (2010) investigated the determinants of NPL in Malaysia and Singapore between
1998 and 2007. Contrary to the study by Berger and DeYoung (1997) which focused on Granger
Causality and by Podiera and Weill (2007) which estimated a GMM model, Karim et al. (2010)
used a Tobit regression to assess the contributing factors to NPL. Instead of using cost efficiency
indicators like those used in other models, they derived a cost efficiency score index through the
use of a stochastic cost frontier function. It was found that there were no major differences in
cost efficiency between banks in Malaysia and banks in Singapore. They concluded that poor
management on the part of the commercial banks contributed to the bad quality of loans issued.
The Indian commercial banking sector, which comprised eighty-seven (87) banks from 1995 to
2007, was analyzed by Reddy (2011). Similar to Karim et al. (2010), Reddy (2011) estimated
cost inefficiency using a Stochastic Frontier model and then applied the Granger Causality
framework used by Berger and DeYoung (1997). However, the commercial banks were sub-
divided into three (3) categories, namely Public Sector, Private Domestic and Foreign. The
analysis revealed the prevalence of the ‘moral hazard’ hypothesis and banks with low
capitalization had lower cost efficiency. Furthermore, the results suggested that there was no
‘skimping’ present in the Indian commercial banking system. Reddy (2011) went on to state that
the relationship between NPL and cost efficiency was more significant in foreign-owned banks.
Using data from 1998 to 2011, Klein (2013) aimed to explain the determinants of NPL in sixteen
(16) countries in Central, Eastern and South Eastern Europe (CESEE) using macro conditions
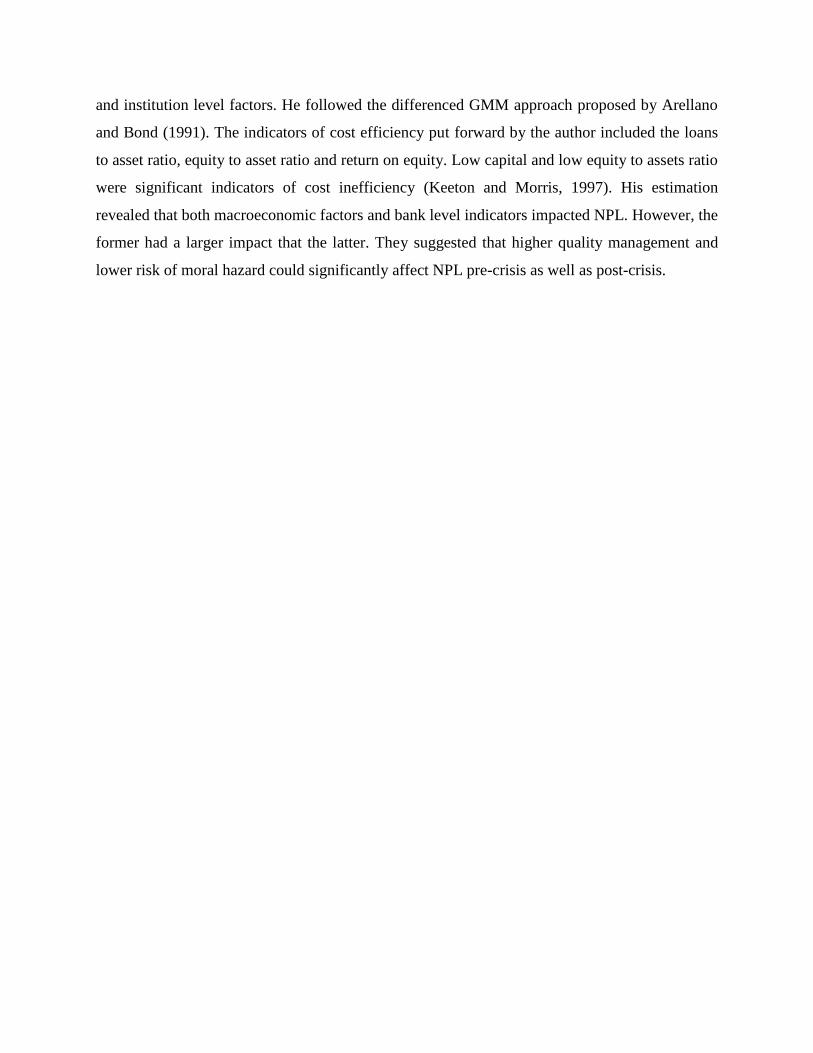
and institution level factors. He followed the differenced GMM approach proposed by Arellano
and Bond (1991). The indicators of cost efficiency put forward by the author included the loans
to asset ratio, equity to asset ratio and return on equity. Low capital and low equity to assets ratio
were significant indicators of cost inefficiency (Keeton and Morris, 1997). His estimation
revealed that both macroeconomic factors and bank level indicators impacted NPL. However, the
former had a larger impact that the latter. They suggested that higher quality management and
lower risk of moral hazard could significantly affect NPL pre-crisis as well as post-crisis.

Data Description and Stylized Facts
The literature advocates two broad categories of factors that can affect NPL. One category
consists of factors such as unemployment, interest rate and income that can impact overall
macroeconomic conditions. The second category entails institution-specific factors that signal
low cost efficiency or an increasing tendency to take risks.
Table 1: Variable and Hypotheses
The rationale for undertaking this study arises from the fact that NPL at the system and micro-
level convey contradictory stories. At the aggregate level, NPL rose from 2009 until 2011 (see
Graph 1). This may have been as a result of fragile macroeconomic and financial conditions
facing Trinidad and Tobago. However, since 2012, the level of NPL has been steadily declining
suggesting a lower level of loan defaults which may have been as a result of less subprime
lending and improvement in macroeconomic activity.
Variable Hypothesis Tested Impact on Efficiency/Risks
Non-Performing Loans
(NPL) Dependent Variable
Return on Equity (ROE)
Bad Management Lower returns may signal higher cost
due to poor management practices
Skimping
Lower cost since limited resources
are allocated to monitoring loans
thus leading to loan problems
Equity to Assets (EQTA) Moral Hazard Low capital may increase the desire
to take on a riskier portfolio
Loans to Assets (LTOA) Moral Hazard Increasing risk through a greater
amount of loans
Loans Growth (DLOANS) Pro-cyclical Credit Policy Increasing risk through a greater
amount of loans
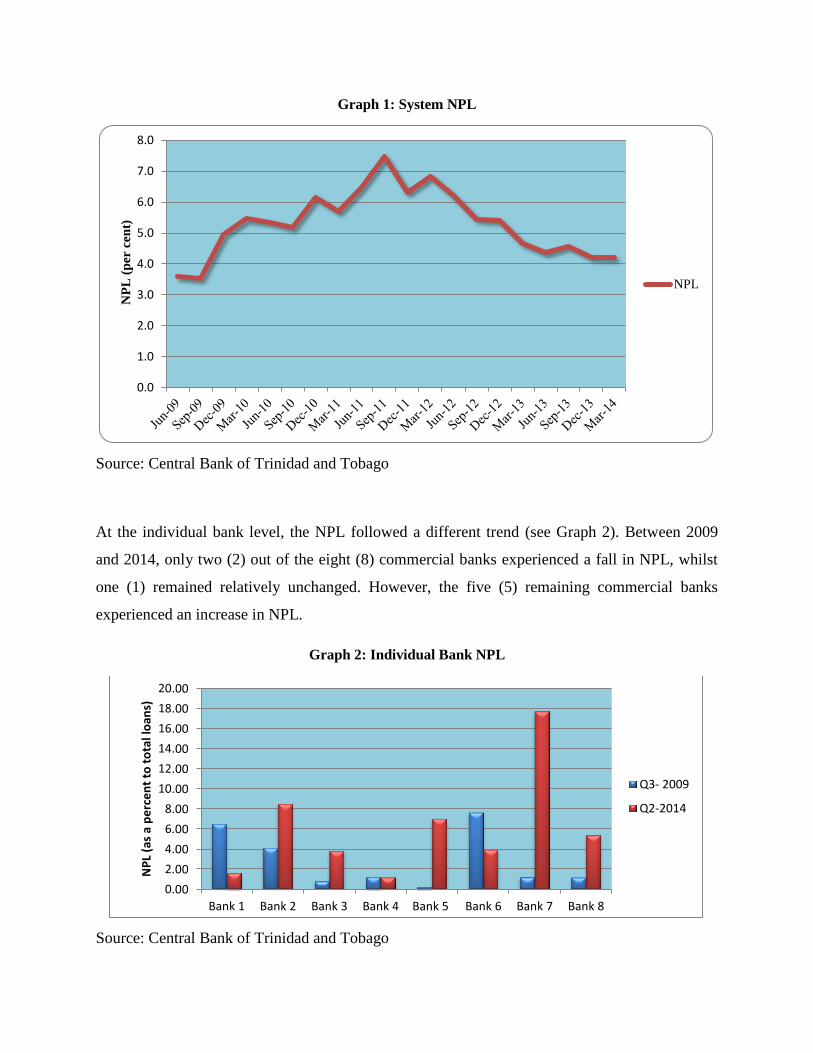
Graph 1: System NPL
Source: Central Bank of Trinidad and Tobago
At the individual bank level, the NPL followed a different trend (see Graph 2). Between 2009
and 2014, only two (2) out of the eight (8) commercial banks experienced a fall in NPL, whilst
one (1) remained relatively unchanged. However, the five (5) remaining commercial banks
experienced an increase in NPL.
Graph 2: Individual Bank NPL
Source: Central Bank of Trinidad and Tobago
0.0
1.0
2.0
3.0
4.0
5.0
6.0
7.0
8.0 N
PL
(p
er c
en
t)
NPL
Bank 1 Bank 2 Bank 3 Bank 4 Bank 5 Bank 6 Bank 7 Bank 8
NP
L (a
s a
pe
rce
nt
to t
ota
l lo
ans)
Q3- 2009
Q2-2014

Correlation analysis from one hundred and sixty (160) observations revealed a positive
correlation between loans to assets and NPL whilst all other variables had a negative correlation
coefficient. Furthermore, the Pairwise Granger causality tests revealed that the growth rate of
loans and the loans to asset ratio were highly significant in affecting NPL. However, return on
equity and the equity to assets ratio did not significantly impact NPL (see Table 2).
Table 2: Correlation and Causality Analysis of NPL to Explanatory Variables
Variables Correlation Coefficient Granger F Statistic
ROE -0.23 0.0344
EQTA -0.08 0.5417
LTOA 0.24 4.9230*
DLOANS -0.15 2.6672***
* and *** denotes significance at 10% and 1% level of significance respectively.

Methodology and Estimation
This paper uses unpublished quarterly data to estimate a GMM/Dynamic Panel model from
March 2009 to June 2014 for eight (8) commercial banks in Trinidad and Tobago giving a total
of one hundred and seventy-six (176) observations. The model specification is given in equation
1:
𝑦𝑖,𝑡 = 𝛾𝑦𝑖,𝑡−1 + 𝛽𝑥𝑖,𝑡 + 𝛼𝑖 + 𝜀𝑖,𝑡 (1)
𝑤ℎ𝑒𝑟𝑒 𝑦𝑖,𝑡 = (𝑁𝑃𝐿), 𝑥𝑖,𝑡 = (𝑅𝑂𝐸, 𝐸𝑄𝑇𝐴, 𝐿𝑇𝑂𝐴, 𝐷𝐿𝑂𝐴𝑁𝑆)
In the model specification, 𝑦 is the dependent variable, 𝑥 is the vector of regressors, 𝛼 is the
fixed individual effect of each bank and 𝜀 is the identically and independently distributed error
term. However, the lagged dependent variable will be correlated with the fixed effects term
(equation 2) and as such, the model should be first differenced to eliminate this problem resulting
in the following estimated model (equation 3):
𝐶𝑜𝑣 (𝑦𝑖,𝑡−1, 𝛼𝑖) ≠ 0 (2)
∆𝑦𝑖,𝑡 = 𝛾∆𝑦𝑖,𝑡−1 + 𝛽∆𝑥𝑖,𝑡 + ∆𝜀𝑖,𝑡 (3)
Furthermore, any endogeneity problem is eliminated since the lagged levels of the endogenous
variables for three or more periods are used as instruments for differenced lagged dependent
variables as suggested by Anderson and Hsiao (1982)4. Arellano and Bond (1991) proposed the
use of differenced GMM in which unbiased estimators were derived from the lagged endogenous
variables and the differenced error term.
4 Fortunately, values of the dependent variable lagged by two or more periods (data permitting) can be used as
instruments for the endogenous regressor.

The unbiased GMM estimator5 is derived by minimizing the following objective function
(equation 4) and choosing a weighting matrix ‘W’ that converges to its long-run covariance
matrix ‘ρ’ (equation 5):
𝐽(�̂�𝐺𝑀𝑀) = 𝑁�̅�(�̂�𝐺𝑀𝑀)′𝑊�̅�(�̂�𝐺𝑀𝑀) (4)
𝑝lim �̂� = 𝜌 (5)
In the above specification, �̅� is the sample moment condition based on a sample of size 𝑁 and
𝑊 is a 𝑝𝑥𝑝 weighting matrix of population moment conditions.
In the presence of heteroskedasticity, a two-step GMM can be used to provide robust estimators.
The Arellano-Bond estimator was also designed for models with a small time period, in this case
five (5) years. Although the cross-section size is small since it comprises only eight (8)
commercial banks, those represent all of the commercial banks in Trinidad and Tobago and the
time series is relatively small therefore raises no cause for concern
Robust Analysis
Prior to meaningful analysis and interpretation of the estimated results, the model must satisfy
two mandatory robust conditions. Firstly, it must satisfy the test for over-identifying restrictions
in the form of the Sargan (1958) test6 with 𝜒𝑗,𝑝−𝑘
2 degrees of freedom7 and secondly, it must
satisfy the Arellano-Bond (1991) test for serial correlation8. This is illustrated in table 3:
5 The GMM estimator is consistent and asymptotically normally distributed
6 Over-identifying restrictions exist when the number of instruments exceeds the number of endogenous variables.
7 Where 𝑗 is the J- statistic, 𝑝 is the instrument rank and 𝑘 is the number of endogenous variables.
8 This examines differenced error term for serial correlation.
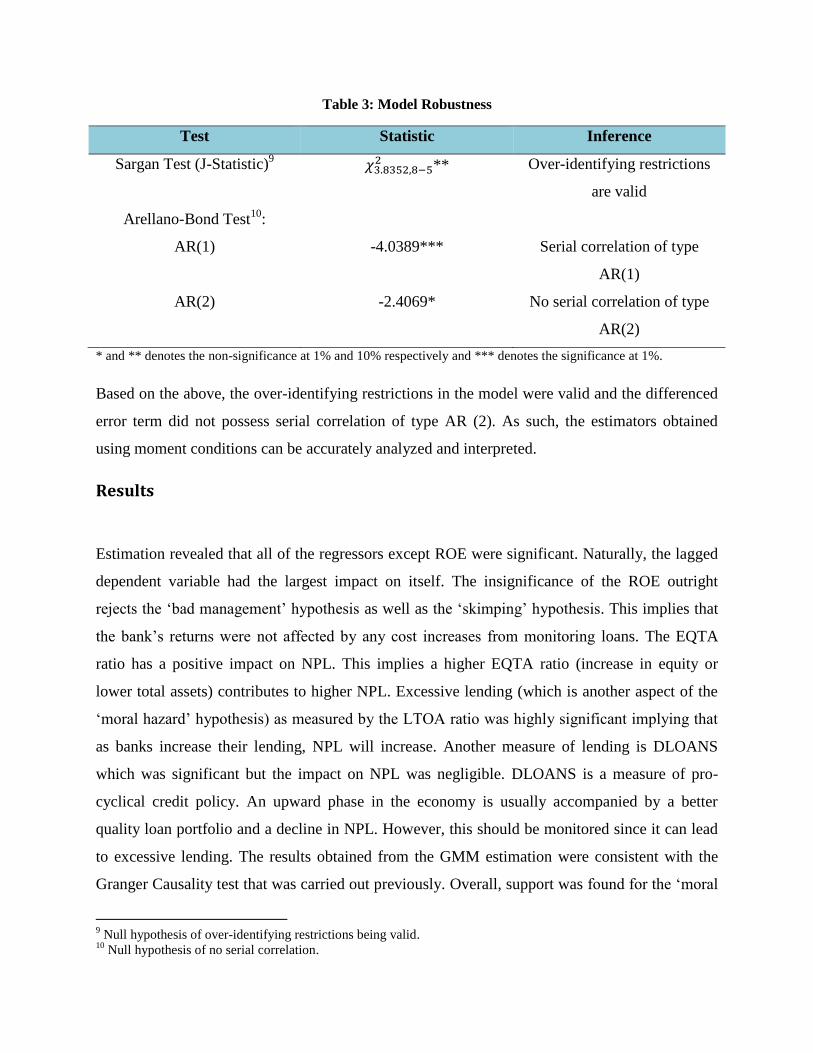
Table 3: Model Robustness
Test Statistic Inference
Sargan Test (J-Statistic)9 𝜒3.8352,8−5
2 ** Over-identifying restrictions
are valid
Arellano-Bond Test10
:
AR(1) -4.0389*** Serial correlation of type
AR(1)
AR(2) -2.4069* No serial correlation of type
AR(2)
* and ** denotes the non-significance at 1% and 10% respectively and *** denotes the significance at 1%.
Based on the above, the over-identifying restrictions in the model were valid and the differenced
error term did not possess serial correlation of type AR (2). As such, the estimators obtained
using moment conditions can be accurately analyzed and interpreted.
Results
Estimation revealed that all of the regressors except ROE were significant. Naturally, the lagged
dependent variable had the largest impact on itself. The insignificance of the ROE outright
rejects the ‘bad management’ hypothesis as well as the ‘skimping’ hypothesis. This implies that
the bank’s returns were not affected by any cost increases from monitoring loans. The EQTA
ratio has a positive impact on NPL. This implies a higher EQTA ratio (increase in equity or
lower total assets) contributes to higher NPL. Excessive lending (which is another aspect of the
‘moral hazard’ hypothesis) as measured by the LTOA ratio was highly significant implying that
as banks increase their lending, NPL will increase. Another measure of lending is DLOANS
which was significant but the impact on NPL was negligible. DLOANS is a measure of pro-
cyclical credit policy. An upward phase in the economy is usually accompanied by a better
quality loan portfolio and a decline in NPL. However, this should be monitored since it can lead
to excessive lending. The results obtained from the GMM estimation were consistent with the
Granger Causality test that was carried out previously. Overall, support was found for the ‘moral
9 Null hypothesis of over-identifying restrictions being valid.
10 Null hypothesis of no serial correlation.

hazard’ hypothesis while the ‘skimping’ and ‘bad management’ hypotheses were rejected. The
results were also consistent with Reddy (2011) and Klein (2013).
Table 4: Estimated Results
Variable GMM Pooled
Coefficient T-statistic Coefficient T-Statistic
NPL(-1) 0.566 3.57* 0.903 13.10*
ROE -0.005 -1.23 -0.016 -1.68***
LTOA 0.166 4.26* 0.023 1.60
DLOANS -0.042 -9.36* -0.045 -1.69***
EQTA 0.169 4.12* 0.013 0.44
When compared to the pooled regression model, LTOA and EQTA were both insignificant. The
results of the significant variables differed greatly from the two-step GMM since the pooled
regression model ignores the individual fixed effects for each cross-section. Other variables such
as the expenses to income ratio which was used as another measure of efficiency were eliminated
based on coefficient insignificance.
Summary and Conclusion
The Trinidad and Tobago economy has been experiencing a gradual decline in aggregate NPL
from the commercial banking sector since 2012, after a period of increase from 2008. However,
when examined at a micro-level, NPL for five (5) out of eight (8) commercial banks have been
increasing. As such, the aim of the paper was to examine the bank-specific determinants of NPL.
Estimation using a two-step GMM proposed by Arellano-Bond (1991) led to the rejection of the
‘skimping’ and ‘bad management’ hypotheses. However, support was found for the ‘moral
hazard’ hypothesis through excessive lending as a key determinant of NPL at the micro level.
One possible reason arises from the fact that banks have high capital adequacy ratios and may be
inclined to engage in subprime lending. The model also satisfied the Hansen test for over-
identifying restrictions and the Arellano-Bond test for serial correlation. The results of the GMM
estimation conformed to that found by the Granger Causality test. One suggestion that can be
proposed to limit banks increase in NPL is to provide higher provisioning for weaker credits .

Furthermore, since the significant variables supported the ‘moral hazard’ hypothesis which deals
with riskier portfolios and excessive loan growth, emphasis should be placed on risk
management systems to help avert this risk. This can be done by examining the lending policies
to counteract weak underwriting standards. The rehabilitation units at commercial can also
engage in earlier rehabilitation of NPL, perhaps from as early as thirty days, to ascertain reasons
and put in place well defined remediation and corrective strategies to avoid the loans becoming
ninety days past due. Further research can also be undertaken by calculating a cost efficiency
index. Research can also be extended to analysis of the macroeconomic factors that contribute to
NPL in an effort to compare the extent to which micro and macro factors affect NPL as well as
decomposing loans by specific purpose (commercial, residential and real estate mortgages).

References
Arellano, M. and S. Bond. 1991. “Some Tests of Specification for Panel Data: Monte Carlo
Evidence and an Application to Employment Equations.” Review of Economic Studies, 58,
277–297.
Berger, A. and R. DeYoung. 1997. “Problem Loans and Cost Efficiency in Commercial
Banks.” Journal of Banking and Finance, 21, 849–870.
Fofack, H. 2005. “Non-performing Loans in Sub-Saharan Africa: Causal Analysis and
Macroeconomic Implications.” World Bank Policy Research Working Paper No. 3769.
Keeton, W. and C. Morris. 1987. “Why Do Banks’ Loan Losses Differ?” Federal Reserve Bank
of Kansas City, Economic Review, May, pp. 3–21.
Louzis, D. P., A.T. Vouldis, and V.L. Metaxas. 2010. “Macroeconomic and Bank-specific
Determinants of Nonperforming Loans in Greece: A Comparative Study of Mortgage, Business,
and Consumer Loan Portfolios.”, Bank of Greece Working Paper 118.
Nkusu, M. 2011. “Nonperforming Loans and Macrofinancial Vulnerabilities in Advanced
Economies.” IMF Working Paper 11/161 (Washington: International Monetary Fund).
Podpiera, J. and L. Weill. 2008. “Bad Luck or Bad Management? Emerging Banking Market
Experience", Journal of Financial Stability, 4(2), pp. 135–148.
Mohd, Z., A. Karim, C. Sok-Gee., and H. Sallahundin. 2010. “Bank Efficiency and Non-
Performing Loans: Evidence from Malaysia and Singapore.” Prague Economic Papers, 2.
Beck, R., Petr, J., and Piloiu, A. 2013. “Non-performing Loans: What Matters in Addition to the
Economic Cycle? European Central Bank Working Papers, No. 1515,
Reddy, K. 2011.“Management Behavior in Indian Commercial Banks,” International Review of
Accounting, Banking and Finance, (3:3), 2011, pp 4170-4192.