determinants of the productive efficiency for the bank systems in the european union countries
TRANSCRIPT

Determinants of the productiveefficiency for the bank systems inthe European Union countriesManuel Espitia-Escuer and Lucıa Isabel Garcıa-Cebrian
Department of Economics and Business Administration,University of Zaragoza, Zaragoza, Spain
Keywords Banking, European Union, International economics, Resource efficiency,Stochastic modelling
Abstract In the framework of the European Union, one of the economic sectors of most interestto politicians, academics and professionals has been the banking sector. The aim of this paper is toverify the existence of differences in the efficiency of the banking sectors and what variablesdetermine these differences in European Union countries in the period 1988 to 1999. In spite ofthe role of the European Market as an element of homogenisation, the starting point of thebanking sector in each country is noticeably different. In this paper we will compare the bankingsystems, looking at aggregate data for each country, since both the characteristics of the financialsystems and the regulatory activity follow national guidelines. The efficiency values of each bankingsystem calculated by the means of stochastic frontiers in the European Union will then be used asthe dependent variable in the estimation of a regression.
IntroductionIn the framework of the European Union (EU), one of the economic sectors that hasbeen of most interest to politicians, academics and professionals has been the bankingsector. The reasons for this are very diverse, although they are fundamentallyconcerned with the characteristics of the sector itself and the type of resources that ituses. The fact that the sector is considered to be a particularly important sector in anyeconomy has led the public authorities to regulate the activity of financial institutionsat the national level, and this national regulation has subsequently been applied at theEU level too. Compared to other industrial sectors, the banking sector was essentiallynational in character at the advent of the single market
The creation of the Euro-zone simplifies the movement of capital and bankingactivity beyond national borders. Nevertheless, the starting point of the sector isnoticeably different in each country. In some cases, such as in France, there is a strongpresence of public sector companies; in others, such as in Spain and Italy, the sector isdominated by social entities; and finally, regional banking is fundamental in countriessuch as Germany. Moreover, factors such as the size of each of the national markets,the behaviour of the population with regard to their use of these services, and otherstructural variables shape each national banking sector and make them distinct anddifferentiated from those of their neighbours.
Just as in practically every other economic activity, the regulator has wished tocreate the conditions for competition within the scope of the whole market area of theEU, and this has led to the territorial expansion of banks into regions new to them. Onewould have expected that these initiatives would result in a greater homogenisation of
The Emerald Research Register for this journal is available at The current issue and full text archive of this journal is available at
www.emeraldinsight.com/researchregister www.emeraldinsight.com/1741-0401.htm
Bank systems inthe European
Union
435
Received December 2003Revised April 2004
Accepted April 2004
International Journal of Productivityand Performance Management
Vol. 53 No. 3, 2004pp. 435-446
q Emerald Group Publishing Limited1741-0401
DOI 10.1108/17410400410545905
the national sectors towards a European model. However, this does not appear to haveoccurred. Thus, Florez et al. (2002) point out that the presence of different organisationalcultures and inherited competitive advantages will hinder a convergence of resourceoptimisation and performance in European firms. Moreover, although the work ofBerger et al. (2003) is an analysis of the level of globalisation which banks have reachedsubsequent to the reduction in competitive barriers brought about by improvements intelecommunications, data processing and financial technologies, they also stress thatfactors such as the size of the bank sector and the financial development and legalstructure of each country can negatively affect such a globalisation and consequentlyimpede homogenisation between the bank sectors of the different countries.
The current work has two objectives. First, we aim to detect differences in the technicalefficiency between the bank sectors of the EU, with a view to demonstrating the existingdifferences in how national sectors exploit the productive resources they have availablefor their activity. For this, we will use the stochastic frontier method applied to a paneldata for the period 1988-1999. Second, we will try to learn more about the factorsexplaining the efficiency differences found, with the aim of finding the obstacles impedinga greater homogenisation of the EU bank sectors, and consequently finding the keyelements of this efficiency and the conditions for improving it. With regard to this point,we should mention two considerations. On the one hand, since the objective of this work isto detect the competitive advantages that the different EU bank sectors may obtain as aresult of the efficiency in their resource utilisation, we will calculate their technicalefficiency, as the differences in other measures, such as, for example, profits orprofitability, may be due not only to the technical efficiency itself but also to othercircumstances such as market power or the utilization of commercial variables. On theother hand, most of the literature comparing banks of different countries has been carriedout using individual banks as units of analysis (Gehrig and Sheldon, 1999; Maudos et al.,2001; Casu and Molyneux, 2000). In the present work, however, we intend to compare thebanking sector of each country, taking aggregate data for each country, since thecharacteristics of each financial system and the respective regulatory systems havecontinued to retain national distinctions. Although it is true that in looking at nationalaggregate data we lose the information provided by the heterogeneity of the units underanalysis, making it impossible to determine the technical efficiency of each of them, it ismore coherent with the analysis developed subsequently in this work. This is because theaggregate calculations of technical efficiency for bank sectors allow us to calculate theiroperation globally, and subsequently, by use of regressions, we obtain the relations ofthese results with the characteristics of each country taken as dependent variables. Ourinterest in making a country-aggregate evaluation of the results is due to the nationalcharacter that the banking sectors still maintain in the EU, reflected in the existence of adifferent regulation in each country, as well as the scarcity of cross-holdings betweenbanks of different nationalities compared to other sectors of the economy.
The work is structured as follows: in the following section we present the methodwe used for calculating the efficiency of European banking sectors; in the next, we shalluse the stochastic frontier method to estimate the representative production function ofthe European bank sectors between 1988 and 1999, and from this, we shall calculate thetechnical efficiency of the sample under analysis; then we shall study which variablescan be considered to be determinant of the efficiency values found; finally we will drawsome conclusions.
IJPPM53,3
436
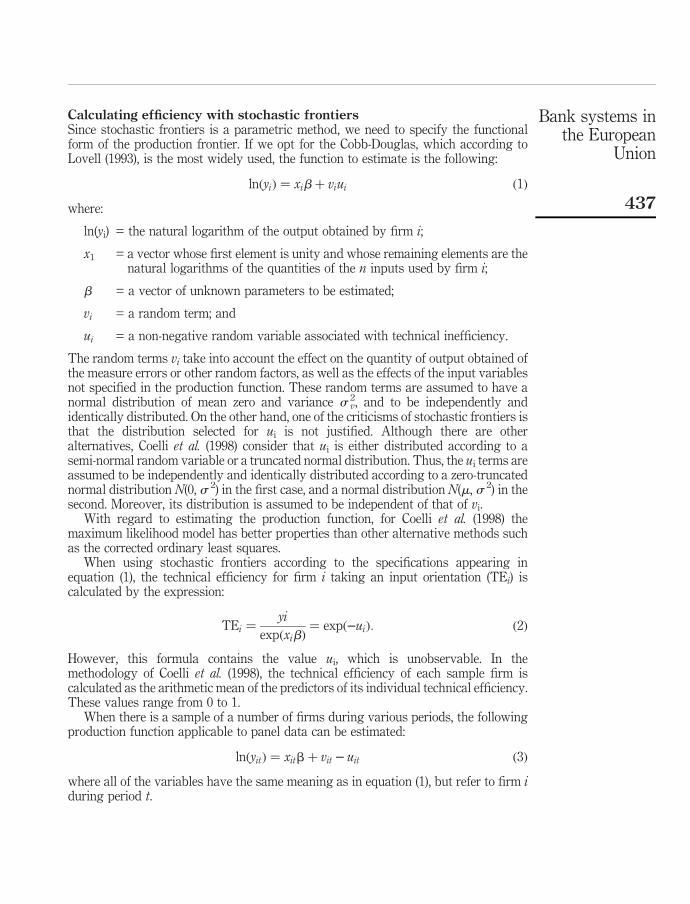
Calculating efficiency with stochastic frontiersSince stochastic frontiers is a parametric method, we need to specify the functionalform of the production frontier. If we opt for the Cobb-Douglas, which according toLovell (1993), is the most widely used, the function to estimate is the following:
lnðyiÞ ¼ xibþ viui ð1Þ
where:
ln(yi) = the natural logarithm of the output obtained by firm i;
x1 = a vector whose first element is unity and whose remaining elements are thenatural logarithms of the quantities of the n inputs used by firm i;
b = a vector of unknown parameters to be estimated;
vi = a random term; and
ui = a non-negative random variable associated with technical inefficiency.
The random terms vi take into account the effect on the quantity of output obtained ofthe measure errors or other random factors, as well as the effects of the input variablesnot specified in the production function. These random terms are assumed to have anormal distribution of mean zero and variance s 2
v, and to be independently andidentically distributed. On the other hand, one of the criticisms of stochastic frontiers isthat the distribution selected for ui is not justified. Although there are otheralternatives, Coelli et al. (1998) consider that ui is either distributed according to asemi-normal random variable or a truncated normal distribution. Thus, the ui terms areassumed to be independently and identically distributed according to a zero-truncatednormal distribution N(0, s 2) in the first case, and a normal distribution N(m, s 2) in thesecond. Moreover, its distribution is assumed to be independent of that of vi.
With regard to estimating the production function, for Coelli et al. (1998) themaximum likelihood model has better properties than other alternative methods suchas the corrected ordinary least squares.
When using stochastic frontiers according to the specifications appearing inequation (1), the technical efficiency for firm i taking an input orientation (TEi) iscalculated by the expression:
TEi ¼yi
expðxibÞ¼ expð�uiÞ: ð2Þ
However, this formula contains the value ui, which is unobservable. In themethodology of Coelli et al. (1998), the technical efficiency of each sample firm iscalculated as the arithmetic mean of the predictors of its individual technical efficiency.These values range from 0 to 1.
When there is a sample of a number of firms during various periods, the followingproduction function applicable to panel data can be estimated:
lnðyitÞ ¼ xitbþ vit � uit ð3Þ
where all of the variables have the same meaning as in equation (1), but refer to firm iduring period t.
Bank systems inthe European
Union
437

Using stochastic frontiers allows researchers to test hypotheses in order to choosethe model that best fits the starting data, making use of, as Coelli et al. (1998) point out,the generalised likelihood ratio[1]. Although this ratio can be used to compare any twohypotheses relating to the estimated parameters, Coelli et al. (1998) mainly refer tothree.
First, they propose to verify the inexistence of technical inefficiency in the model, inthe case of a cross-sectional analysis as well as in the case of panel data. For this, onemust compare the null hypothesis g ¼ 0 with the alternative g . 0, where:
g ¼s 2
s2s
and s2s ¼ s2 þ s2
v:
Second, once the production function is estimated, considering that ui or uit (accordingto whether the data are cross-sectional or panel) follows a truncated normaldistribution N(m,s 2), it can be verified whether the most appropriate model is the onewith the semi-normal distribution by verifying the null hypothesis m ¼ 0.
Finally, when the estimation is made using panel data, one can consider that theeffects of technical inefficiency are invariant over time or, in contrast, systematicallyvary over time[2]. If there is variation in the efficiency values over time, the distributionof the effects of inefficiency is assumed to have the following form (equation 4):
uit ¼ {exp½�hðt � TÞ�}ui ð4Þ
where T is the last period considered in the panel, h is a scalar which must beestimated, and ui is a random variable which can be considered as the technicalinefficiency of firm i in the last period of the panel. The evolution of the efficiency valueof each firm will depend on the sign of h: when it is positive, uit falls over time, and theefficiency consequently rises; when it is negative the reverse occurs. Moreover, giventhe functional form proposed, the firms’ ranks according to their efficiency values donot change over time. In this model, it may be interesting to verify the hypothesis of nochange in efficiency over time by testing the null hypothesis h ¼ 0.
If, in order to analyse which variables effect efficiency in the sample firms,regressions are used which take this inefficiency calculated from a previous stage as anindependent variable, a serious econometric problem arises, since in the first stage thevalues of uit are assumed to be independently and identically distributed for all theunits of the sample, while when estimating the regressions on inefficiency it is assumedthat the inefficiency is a function of a number of factors specific to each firm, and hencenot identically distributed. In order to avoid this problem, some authors, among themCoelli et al. (1998), propose to specify the stochastic frontier models defininginefficiency as an explicit function of certain factors specific to each firm and toestimate all the parameters, those of the production function as well as those of thefunction explaining the inefficiency, in a single stage. With this, they establish that forthe ith firm in the tth period, the technical inefficiency effect, uit, is obtained bytruncating in zero the N(mit, s
2) distribution and assuming:
mit ¼ zitd ð5Þ
where zit is a (1*M) vector of observable explanatory variables whose values are fixedconstants and d is an (M*1) vector of unknown scalar parameters to be estimated.
IJPPM53,3
438

Equation (5) specifies that the means of the normal distributions of the technicalinefficiency effects are not the same, but are functions of values of observable variablesand a common vector of parameters. With regard to the meaning of the signs of thevector d parameters, a positive sign indicates that the mean uit rises in thecorresponding explanatory variable, and consequently that this variable has anegative effect on efficiency; if it is negative the reverse effect occurs.
Efficiency of European banking sectorsBanks operate as intermediaries in operations involving assets and liabilities; that is,they attract savings in order to offer loans, and they meet the demand for loans viaoperations of savings gathering. This makes it difficult to define the productionfunction, and in the literature the debate is still in progress on this point.
There have been two classic approaches with regard to the production function inbanking. Berger and Humphrey (1997), Casu and Molyneux (2000) and Pastor et al.(1995) include as outputs in the production function loans as well as deposits, sincethey consider that deposits are an intermediate output. On the other hand, Allen andRai (1996) and Ruthenberg and Elias (1996) take loans only as output, includingmoreover value added. A proposal that might reconcile these two approaches can beseen in Hughes et al. (2001), where starting from the cash flow function they derive thefunction that must be minimised in order to determine economies of scale, productivityand other technical results.
In the work of Hughes et al. (2001), a model is presented for the banking productionfunction in which they conclude that the role of deposits as either output or input canbe decided by empirically contrasting the differential roles that inputs and outputsplay in the production function. Since the cost function is conditioned by the price ofthe deposits, and therefore the level of deposits contributes to minimizing costs, weshould implicitly classify deposits as inputs. Moreover, since the cost function dependson the level of deposits, this would be consistent with the deposits’ alternative role asoutput. These authors propose the use of an econometric test to determine if anincrease in the volume of deposits affects the variable costs of production for aparticular level of output. If the deposits were an output, a greater volume of variableinput would be required, and in consequence, a higher cost in order to obtain thecurrent level of output plus the volume of additional deposits. If deposits were an input,an increase in their level will lead to a decrease in the unitary variable costs required toproduce the same level of output as a consequence of scale economies. They concludethat deposits are an input of the production function after observing the behaviour ofthe marginal cost function.
For the analysis in this paper, we have used the OECD database “BankProfitability”, which gathers aggregate data on the national banking systems, as wellas data aggregated by type of entity. It includes aggregate data from the balance sheetsand profit statements, as well as additional information regarding employees, numberof branches and entities that make up the national banking system. The use of a singlesource of information implies that the informative content of the variables used is thesame, since the institution providing the information has carried out the appropriatehomogenisation. The fact that the information provided by “Bank Profitability” isaggregated at the national bank system level is, moreover, coherent with the objectiveof this work, since in the succeeding step we wish to analyse the characteristics of each
Bank systems inthe European
Union
439
country that may influence the efficiency of European bank sectors. The period ofstudy runs from 1988 to 1999. The information for each banking system wasappropriately homogenised using a homogenisation factor derived from thepurchasing power parity and measured in 1995 dollars. In this way the results areprotected from any purely monetary effects, and the comparison between countriesonly reflects operational aspects of the activity itself in each sector[3].
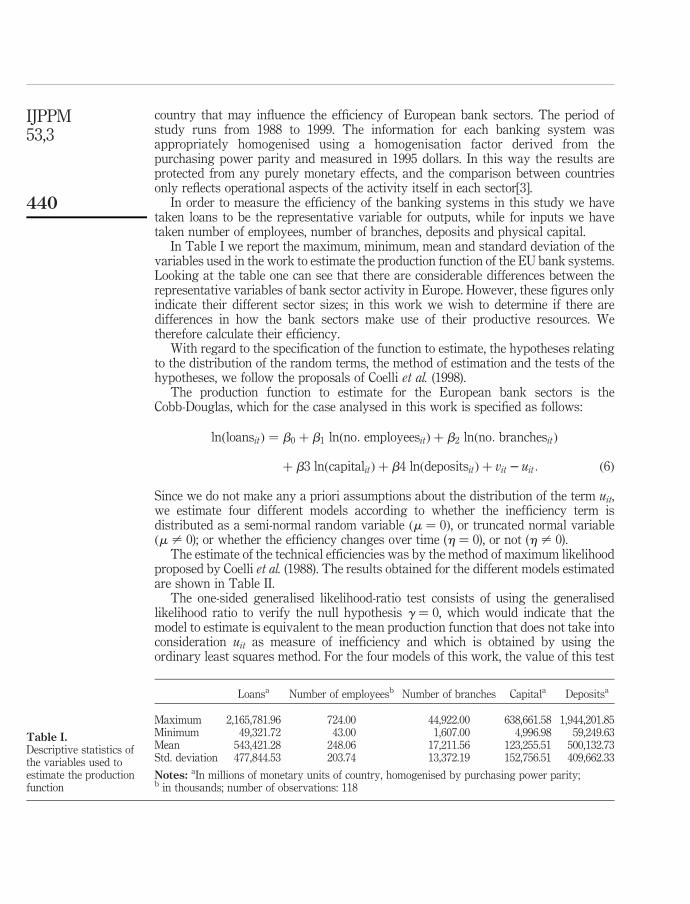
In order to measure the efficiency of the banking systems in this study we havetaken loans to be the representative variable for outputs, while for inputs we havetaken number of employees, number of branches, deposits and physical capital.
In Table I we report the maximum, minimum, mean and standard deviation of thevariables used in the work to estimate the production function of the EU bank systems.Looking at the table one can see that there are considerable differences between therepresentative variables of bank sector activity in Europe. However, these figures onlyindicate their different sector sizes; in this work we wish to determine if there aredifferences in how the bank sectors make use of their productive resources. Wetherefore calculate their efficiency.
With regard to the specification of the function to estimate, the hypotheses relatingto the distribution of the random terms, the method of estimation and the tests of thehypotheses, we follow the proposals of Coelli et al. (1998).
The production function to estimate for the European bank sectors is theCobb-Douglas, which for the case analysed in this work is specified as follows:
lnðloansitÞ ¼ b0 þ b1 lnðno: employeesitÞ þ b2 lnðno: branchesitÞ
þ b3 lnðcapitalitÞ þ b4 lnðdepositsitÞ þ vit � uit: ð6Þ
Since we do not make any a priori assumptions about the distribution of the term uit,we estimate four different models according to whether the inefficiency term isdistributed as a semi-normal random variable ðm ¼ 0Þ, or truncated normal variableðm – 0); or whether the efficiency changes over time (h ¼ 0), or not (h – 0).
The estimate of the technical efficiencies was by the method of maximum likelihoodproposed by Coelli et al. (1988). The results obtained for the different models estimatedare shown in Table II.
The one-sided generalised likelihood-ratio test consists of using the generalisedlikelihood ratio to verify the null hypothesis g ¼ 0, which would indicate that themodel to estimate is equivalent to the mean production function that does not take intoconsideration uit as measure of inefficiency and which is obtained by using theordinary least squares method. For the four models of this work, the value of this test
Loansa Number of employeesb Number of branches Capitala Depositsa
Maximum 2,165,781.96 724.00 44,922.00 638,661.58 1,944,201.85Minimum 49,321.72 43.00 1,607.00 4,996.98 59,249.63Mean 543,421.28 248.06 17,211.56 123,255.51 500,132.73Std. deviation 477,844.53 203.74 13,372.19 152,756.51 409,662.33
Notes: aIn millions of monetary units of country, homogenised by purchasing power parity;b in thousands; number of observations: 118
Table I.Descriptive statistics ofthe variables used toestimate the productionfunction
IJPPM53,3
440
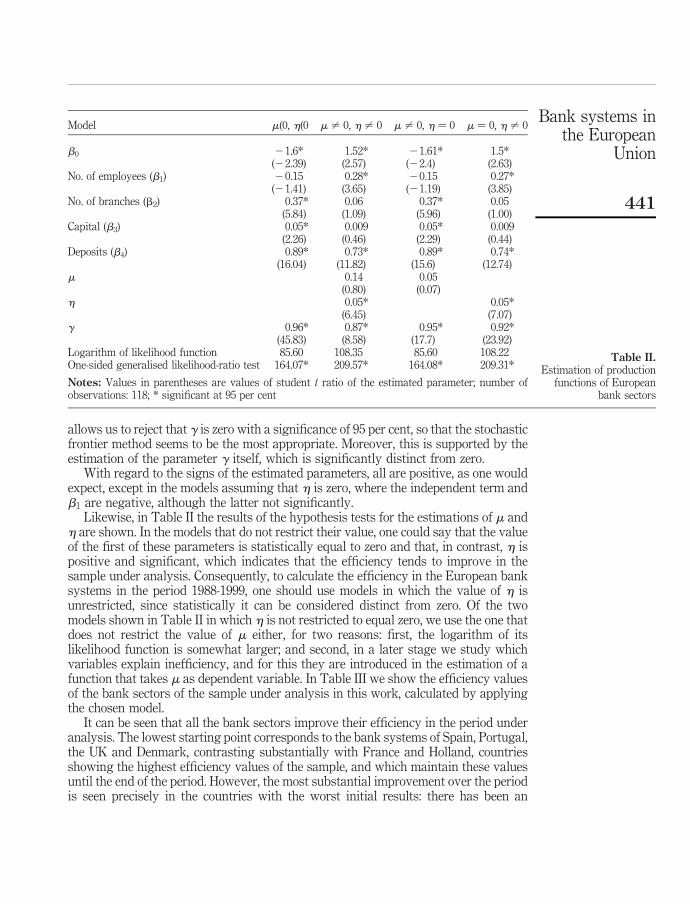
allows us to reject that g is zero with a significance of 95 per cent, so that the stochasticfrontier method seems to be the most appropriate. Moreover, this is supported by theestimation of the parameter g itself, which is significantly distinct from zero.
With regard to the signs of the estimated parameters, all are positive, as one wouldexpect, except in the models assuming that h is zero, where the independent term andb1 are negative, although the latter not significantly.
Likewise, in Table II the results of the hypothesis tests for the estimations of m andh are shown. In the models that do not restrict their value, one could say that the valueof the first of these parameters is statistically equal to zero and that, in contrast, h ispositive and significant, which indicates that the efficiency tends to improve in thesample under analysis. Consequently, to calculate the efficiency in the European banksystems in the period 1988-1999, one should use models in which the value of h isunrestricted, since statistically it can be considered distinct from zero. Of the twomodels shown in Table II in which h is not restricted to equal zero, we use the one thatdoes not restrict the value of m either, for two reasons: first, the logarithm of itslikelihood function is somewhat larger; and second, in a later stage we study whichvariables explain inefficiency, and for this they are introduced in the estimation of afunction that takes m as dependent variable. In Table III we show the efficiency valuesof the bank sectors of the sample under analysis in this work, calculated by applyingthe chosen model.
It can be seen that all the bank sectors improve their efficiency in the period underanalysis. The lowest starting point corresponds to the bank systems of Spain, Portugal,the UK and Denmark, contrasting substantially with France and Holland, countriesshowing the highest efficiency values of the sample, and which maintain these valuesuntil the end of the period. However, the most substantial improvement over the periodis seen precisely in the countries with the worst initial results: there has been an
Model m(0, h(0 m – 0, h – 0 m – 0, h ¼ 0 m ¼ 0, h – 0
b0 21.6* 1.52* 21.61* 1.5*(22.39) (2.57) (22.4) (2.63)
No. of employees (b1) 20.15 0.28* 20.15 0.27*(21.41) (3.65) (21.19) (3.85)
No. of branches (b2) 0.37* 0.06 0.37* 0.05(5.84) (1.09) (5.96) (1.00)
Capital (b3) 0.05* 0.009 0.05* 0.009(2.26) (0.46) (2.29) (0.44)
Deposits (b4) 0.89* 0.73* 0.89* 0.74*(16.04) (11.82) (15.6) (12.74)
m 0.14 0.05(0.80) (0.07)
h 0.05* 0.05*(6.45) (7.07)
g 0.96* 0.87* 0.95* 0.92*(45.83) (8.58) (17.7) (23.92)
Logarithm of likelihood function 85.60 108.35 85.60 108.22One-sided generalised likelihood-ratio test 164.07* 209.57* 164.08* 209.31*
Notes: Values in parentheses are values of student t ratio of the estimated parameter; number ofobservations: 118; * significant at 95 per cent
Table II.Estimation of production
functions of Europeanbank sectors
Bank systems inthe European
Union
441
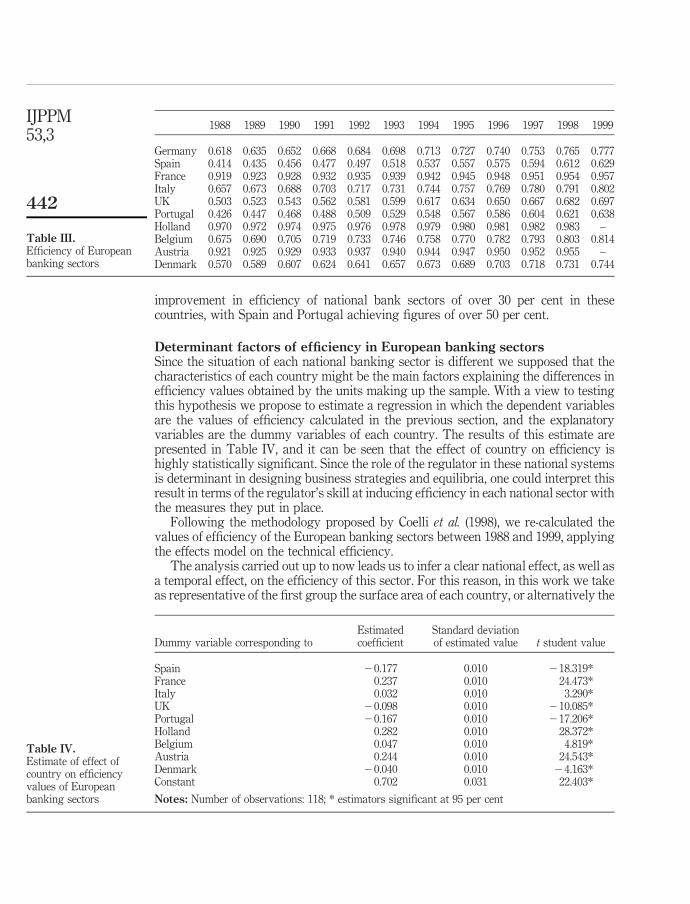
improvement in efficiency of national bank sectors of over 30 per cent in thesecountries, with Spain and Portugal achieving figures of over 50 per cent.
Determinant factors of efficiency in European banking sectorsSince the situation of each national banking sector is different we supposed that thecharacteristics of each country might be the main factors explaining the differences inefficiency values obtained by the units making up the sample. With a view to testingthis hypothesis we propose to estimate a regression in which the dependent variablesare the values of efficiency calculated in the previous section, and the explanatoryvariables are the dummy variables of each country. The results of this estimate arepresented in Table IV, and it can be seen that the effect of country on efficiency ishighly statistically significant. Since the role of the regulator in these national systemsis determinant in designing business strategies and equilibria, one could interpret thisresult in terms of the regulator’s skill at inducing efficiency in each national sector withthe measures they put in place.
Following the methodology proposed by Coelli et al. (1998), we re-calculated thevalues of efficiency of the European banking sectors between 1988 and 1999, applyingthe effects model on the technical efficiency.
The analysis carried out up to now leads us to infer a clear national effect, as well asa temporal effect, on the efficiency of this sector. For this reason, in this work we takeas representative of the first group the surface area of each country, or alternatively the
Dummy variable corresponding toEstimatedcoefficient
Standard deviationof estimated value t student value
Spain 20.177 0.010 218.319*France 0.237 0.010 24.473*Italy 0.032 0.010 3.290*UK 20.098 0.010 210.085*Portugal 20.167 0.010 217.206*Holland 0.282 0.010 28.372*Belgium 0.047 0.010 4.819*Austria 0.244 0.010 24.543*Denmark 20.040 0.010 24.163*Constant 0.702 0.031 22.403*
Notes: Number of observations: 118; * estimators significant at 95 per cent
Table IV.Estimate of effect ofcountry on efficiencyvalues of Europeanbanking sectors
1988 1989 1990 1991 1992 1993 1994 1995 1996 1997 1998 1999
Germany 0.618 0.635 0.652 0.668 0.684 0.698 0.713 0.727 0.740 0.753 0.765 0.777Spain 0.414 0.435 0.456 0.477 0.497 0.518 0.537 0.557 0.575 0.594 0.612 0.629France 0.919 0.923 0.928 0.932 0.935 0.939 0.942 0.945 0.948 0.951 0.954 0.957Italy 0.657 0.673 0.688 0.703 0.717 0.731 0.744 0.757 0.769 0.780 0.791 0.802UK 0.503 0.523 0.543 0.562 0.581 0.599 0.617 0.634 0.650 0.667 0.682 0.697Portugal 0.426 0.447 0.468 0.488 0.509 0.529 0.548 0.567 0.586 0.604 0.621 0.638Holland 0.970 0.972 0.974 0.975 0.976 0.978 0.979 0.980 0.981 0.982 0.983 –Belgium 0.675 0.690 0.705 0.719 0.733 0.746 0.758 0.770 0.782 0.793 0.803 0.814Austria 0.921 0.925 0.929 0.933 0.937 0.940 0.944 0.947 0.950 0.952 0.955 –Denmark 0.570 0.589 0.607 0.624 0.641 0.657 0.673 0.689 0.703 0.718 0.731 0.744
Table III.Efficiency of Europeanbanking sectors
IJPPM53,3
442
population density. Additionally, we have followed the recommendations of Bergeret al. (2003), who consider differences in the economic situation and the size of the banksector, among other factors, as possible obstacles to the globalisation of the banksectors of different countries. In this analysis, unemployment (measured asstandardised OECD unemployment) and the GDP (measured as GDP volume indexat constant prices) have been chosen to represent the economic situation. Finally, weintroduced the number of inhabitants per branch for national-sector structural reasons:the inhabitants are potential demanders of financial services, and hence reflect the sizeof the bank sector; and the number of branches is the result of the competitive modeldeveloped by each national sector and the point of reference with regard to the demand.We considered it appropriate to analyse the effect on efficiency of this variable becausein the bank sector, as in any other services sector, it can be assumed that one factor ofattraction for customers is physical proximity, and this is achieved with a widernetwork of branches. This variable is in consequence a structural variable of the sector.
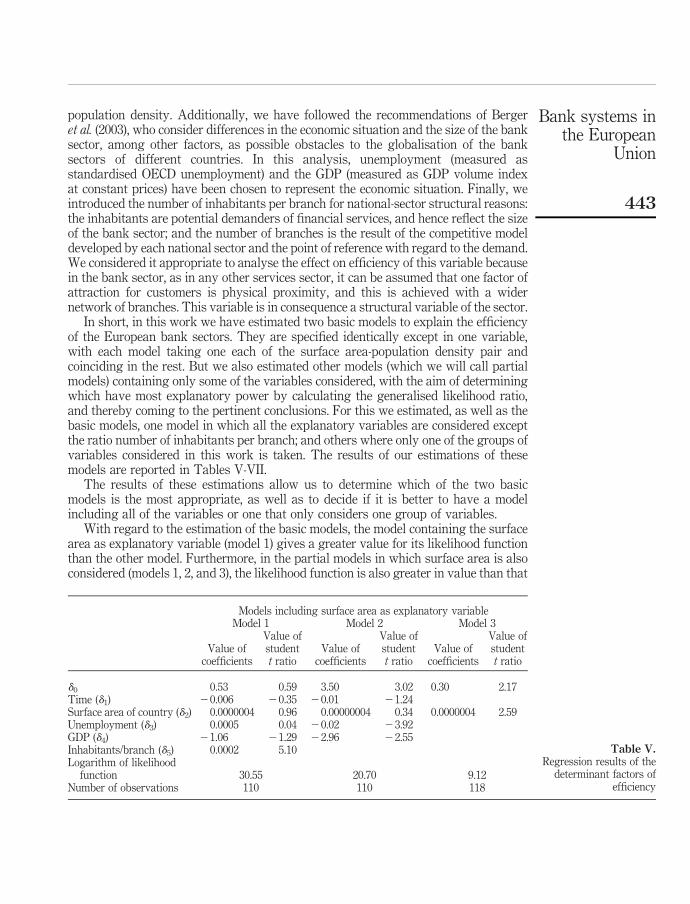
In short, in this work we have estimated two basic models to explain the efficiencyof the European bank sectors. They are specified identically except in one variable,with each model taking one each of the surface area-population density pair andcoinciding in the rest. But we also estimated other models (which we will call partialmodels) containing only some of the variables considered, with the aim of determiningwhich have most explanatory power by calculating the generalised likelihood ratio,and thereby coming to the pertinent conclusions. For this we estimated, as well as thebasic models, one model in which all the explanatory variables are considered exceptthe ratio number of inhabitants per branch; and others where only one of the groups ofvariables considered in this work is taken. The results of our estimations of thesemodels are reported in Tables V-VII.
The results of these estimations allow us to determine which of the two basicmodels is the most appropriate, as well as to decide if it is better to have a modelincluding all of the variables or one that only considers one group of variables.
With regard to the estimation of the basic models, the model containing the surfacearea as explanatory variable (model 1) gives a greater value for its likelihood functionthan the other model. Furthermore, in the partial models in which surface area is alsoconsidered (models 1, 2, and 3), the likelihood function is also greater in value than that
Models including surface area as explanatory variableModel 1 Model 2 Model 3
Value ofcoefficients
Value ofstudentt ratio
Value ofcoefficients
Value ofstudentt ratio
Value ofcoefficients
Value ofstudentt ratio
d0 0.53 0.59 3.50 3.02 0.30 2.17Time (d1) 20.006 20.35 20.01 21.24Surface area of country (d2) 0.0000004 0.96 0.00000004 0.34 0.0000004 2.59Unemployment (d3) 0.0005 0.04 20.02 23.92GDP (d4) 21.06 21.29 22.96 22.55Inhabitants/branch (d5) 0.0002 5.10Logarithm of likelihood
function 30.55 20.70 9.12Number of observations 110 110 118
Table V.Regression results of the
determinant factors ofefficiency
Bank systems inthe European
Union
443
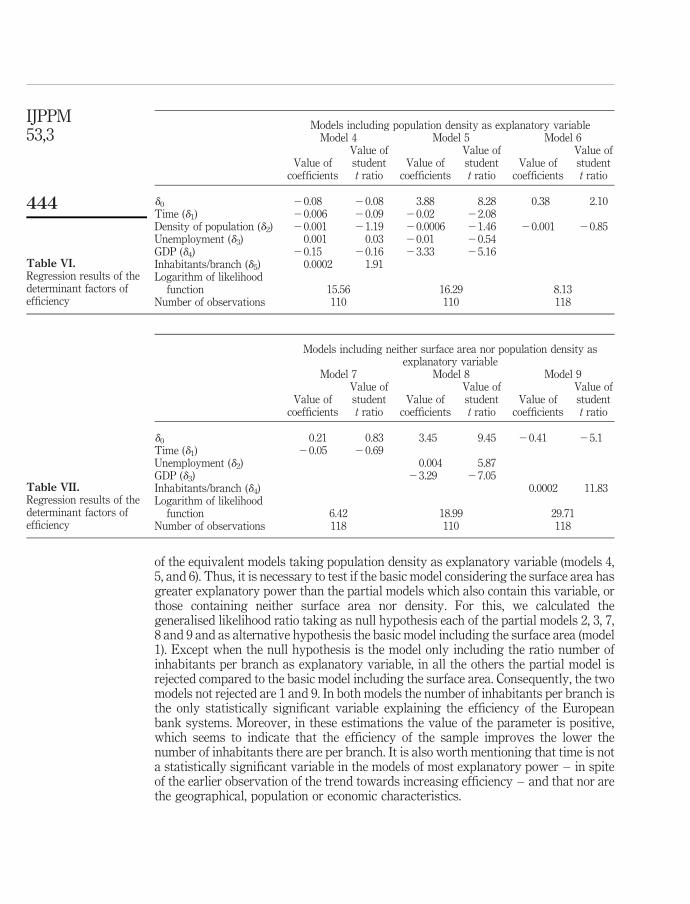
of the equivalent models taking population density as explanatory variable (models 4,5, and 6). Thus, it is necessary to test if the basic model considering the surface area hasgreater explanatory power than the partial models which also contain this variable, orthose containing neither surface area nor density. For this, we calculated thegeneralised likelihood ratio taking as null hypothesis each of the partial models 2, 3, 7,8 and 9 and as alternative hypothesis the basic model including the surface area (model1). Except when the null hypothesis is the model only including the ratio number ofinhabitants per branch as explanatory variable, in all the others the partial model isrejected compared to the basic model including the surface area. Consequently, the twomodels not rejected are 1 and 9. In both models the number of inhabitants per branch isthe only statistically significant variable explaining the efficiency of the Europeanbank systems. Moreover, in these estimations the value of the parameter is positive,which seems to indicate that the efficiency of the sample improves the lower thenumber of inhabitants there are per branch. It is also worth mentioning that time is nota statistically significant variable in the models of most explanatory power – in spiteof the earlier observation of the trend towards increasing efficiency – and that nor arethe geographical, population or economic characteristics.
Models including population density as explanatory variableModel 4 Model 5 Model 6
Value ofcoefficients
Value ofstudentt ratio
Value ofcoefficients
Value ofstudentt ratio
Value ofcoefficients
Value ofstudentt ratio
d0 20.08 20.08 3.88 8.28 0.38 2.10Time (d1) 20.006 20.09 20.02 22.08Density of population (d2) 20.001 21.19 20.0006 21.46 20.001 20.85Unemployment (d3) 0.001 0.03 20.01 20.54GDP (d4) 20.15 20.16 23.33 25.16Inhabitants/branch (d5) 0.0002 1.91Logarithm of likelihood
function 15.56 16.29 8.13Number of observations 110 110 118
Table VI.Regression results of thedeterminant factors ofefficiency
Models including neither surface area nor population density asexplanatory variable
Model 7 Model 8 Model 9
Value ofcoefficients
Value ofstudentt ratio
Value ofcoefficients
Value ofstudentt ratio
Value ofcoefficients
Value ofstudentt ratio
d0 0.21 0.83 3.45 9.45 20.41 25.1Time (d1) 20.05 20.69Unemployment (d2) 0.004 5.87GDP (d3) 23.29 27.05Inhabitants/branch (d4) 0.0002 11.83Logarithm of likelihood
function 6.42 18.99 29.71Number of observations 118 110 118
Table VII.Regression results of thedeterminant factors ofefficiency
IJPPM53,3
444

ConclusionsThe aim of this work is to determine the factors that influence the values of efficiencyobtained by European banking systems, taking country-aggregate data for the period1988-1999.
From our calculations of the technical efficiency of each of the bank sectorsanalysed, we can see that the efficiency improves over the period under analysis.Additionally, the differences in efficiency, calculated using the stochastic frontiermethod, do have a country effect.
Thus, in the specification of technical efficiency, we considered as explanatoryvariables time, geographical and population characteristics of each country (in terms ofthe surface area and population density), its economic situation (unemployment andGDP) and the size of the bank sector (the number of inhabitants per branch). Testingthe hypotheses in order to determine which model had greater explanatory powerallowed us to conclude that of all the variables considered in this work, only thenumber of inhabitants per branch is statistically significant as a determinant of theefficiency of European bank sectors. On the other hand, the effect that this variable wasfound to have on efficiency was negative – i.e. one should expect greater efficiency inthose bank systems in which the number of inhabitants per branch is lower. Moreover,for a particular bank sector to have a low number of inhabitants per branch wouldindicate that the branches were less crowded, that consequently the customers could beattended to more quickly, and, in short, they could be offered a better service. Onecould say, therefore, that we are in the presence of a type of economic activity in whichthe level of service offered bears favourably on the levels of efficiency achieved,probably due to the high level of standardisation of tasks and financial products.
The result obtained also has implications from the perspective of industrialorganisation. The differential characteristics of two national bank sectors do not seemto be due to the number of branches in each of them, but rather to the number ofinhabitants per branch. The result obtained in this work could advise against closing alarge number of branches in cases of bank mergers, as this would depress overallsector efficiency. For a given country, an increase in the number of bank branches(either due to the entry into the sector of new firms or to the expansion in the networksof already existing firms), if it was significant enough to substantially reduce thenumber of inhabitants per branch, could be beneficial for the sector as a whole, since, inview of the consequent increase in the level of service provided to customers, onewould expect this to lead to increased overall efficiency. However, as this work hasused aggregate sector data we cannot determine what the effects of such an increase inthe number of branches would be on individual firms. Thus, we cannot say whether thebank that carried out such an operation would benefit more than its competitors; or, incontrast, if the effect would be diluted in the sector. Neither can we infer from ourresults if a lower number of inhabitants per branch for a particular national banksector could encourage the entry of new banks into the market, which would be thecase if an individual bank could benefit from the greater overall sector efficiency.
Notes
1. The generalised likelihood ratio is calculated by the following expression: LR ¼ –2{ln[L(H0)] – ln[L(H1)]} where ln[L(H0)] and ln[L(H1)] are the natural logarithms of the valuesof the likelihood function under the null hypothesis (H0) and the alternative hypothesis (H1)
Bank systems inthe European
Union
445

respectively. This value is then compared to that of x2 or the Kodde and Palm (1986) table,depending on the alternative hypothesis.
2. In fact, this concern is a result of using the maximum likelihood method with the estimationsproposed by Coelli et al. (1998), since if traditional estimation methods in panel data are usedthere is no need to specify a distribution for the effects of inefficiency. However, theseauthors recognise the superiority of the estimation by the maximum likelihood method,unless there are reasons to think that the variables affecting the inefficiency and theregressors of the function are not independent.
3. We excluded some EU countries from the sample because they lacked complete data.
References
Allen, L. and Rai, A. (1996), “Operational efficiency in banking: an international comparison”,Journal of Banking and Finance, Vol. 20, pp. 665-72.
Berger, A. and Humphrey, D. (1997), “Efficiency of financial institutions: international surveyand directions for future research”, European Operational Research, Vol. 98, pp. 175-212.
Berger, A.N., Dai, Q., Ongena, S. and Smith, D.C. (2003), “To what extent will the bankingindustry be globalized? A study of bank nationality and reach in 20 European nations”,Journal of Banking and Finance, Vol. 27 No. 3, pp. 383-415.
Casu, B. and Molyneux, P. (2000), “A comparative study of efficiency in European banking”,working paper, University of Wales.
Coelli, T., Rao, P. and Battese, G. (1998), An Introduction to Efficiency and Productivity Analysis,Kluwer Academic Publishers, Dordrecht.
Florez, R., Fernandez, Y. and Gutierrez, C. (2002), “Efectos del Euro sobre la convergenciacompetitiva comunitaria: analisis de indicadores de gestion”, EFSI, III EncontroIberoamericano de Financas e Sistemas de Informacao, Setubal, Portugal, October.
Gehrig, T. and Sheldon, G. (1999), “Costs, competitiveness and the changing structure ofEuropean banking”, working paper, Foundation Banque de France pour la Recherche,Paris.
Hughes, J.P., Mester, L.J. and Moon, Ch.G. (2001), “Are scale economies in banking illusive?”,Journal of Banking and Finance, Vol. 25, pp. 2169-208.
Kodde, D.A. and Palm, F.C. (1986), “Wald criteria for jointly testing equality and inequalityrestrictions”, Econometrica, Vol. 54 No. 5, pp. 1243-8.
Lovell, C.A.K. (1993), “Production frontiers and productive efficiency”, in Fried, H.O., Lovell, C.A.K.and Schmidt, S.S. (Eds),TheMeasurement of Productive Efficiency, Oxford University Press,Oxford.
Maudos, J., Pastor, J.M., Perez, F. and Quesada, J. (2001), “Efficiency in European banks: whatexplains the differences?”, working paper, Valencian Institute of Economic Investigations,Valencia.
Pastor, J., Perez, F. and Quesada, J. (1995), “Efficiency analysis in banking firms: an internationalcomparison”, European Journal of Operational Research, Vol. 98 No. 2, pp. 395-407.
Ruthenberg, D. and Elias, R. (1996), “Cost economies and interest margins in unified Europeanbanking market”, Journal of Economics and Business, Vol. 48 No. 3, pp. 231-49.
IJPPM53,3
446