determination of crystal violet in water by direct solid phase spectrophotometry after rotating disk...
TRANSCRIPT
Talanta 106 (2013) 305–308
Contents lists available at SciVerse ScienceDirect
Talanta
0039-91
http://d
n Corr
E-m
journal homepage: www.elsevier.com/locate/talanta
Short communication
Determination of crystal violet in water by direct solid phasespectrophotometry after rotating disk sorptive extraction
Valentina Manzo a, Orielle Navarro a, Luis Honda a, Karen Sanchez b, M. Ines Toral c, Pablo Richter a,n
a Departamento de Quımica Inorganica y Analıtica, Facultad de Ciencias Quımicas y Farmaceuticas, Universidad de Chile, Casilla 233, Santiago, Chileb Departamento de Ciencias del Ambiente, Facultad de Quımica y Biologıa, Universidad de Santiago de Chile, Santiago, Chilec Departamento de Quımica, Facultad de Ciencias, Universidad de Chile, Santiago, Chile
a r t i c l e i n f o
Article history:
Received 24 July 2012
Received in revised form
5 November 2012
Accepted 6 November 2012Available online 15 November 2012
Keywords:
Rotating disk sorptive extraction
Polydimethylsiloxane
Water samples
Crystal violet
40/$ - see front matter & 2012 Elsevier B.V. A
x.doi.org/10.1016/j.talanta.2012.11.004
esponding author.
ail address: [email protected] (P. Richter)
a b s t r a c t
The microextraction of crystal violet (CV) from water samples into polydimethylsiloxane (PDMS) using
the rotating disk sorptive extraction (RDSE) technique was performed. The extracting device was a
small Teflon disk that had an embedded miniature magnetic stirring bar and a PDMS (560 mL) film
attached to one side of the disk using double-sided tape. The extraction involves a preconcentration of
CV into the PDMS, where the analyte is then directly quantified using solid phase spectrophotometry at
600 nm. Different chemical and extraction device-related variables were studied to achieve the best
sensitivity for the determination. The optimum extraction was performed at pH 14 because under this
condition, CV is transformed to the neutral and colorless species carbinol, which can be quantitatively
transferred to the PDMS phase. Although the colorless species is the chemical form extracted in the
PDMS, an intense violet coloration appeared in the phase because the –OH bond in the carbinol
molecule is weakened through the formation of hydrogen bonds with the oxygen atoms of the PDMS,
allowing the resonance between the three benzene rings to compensate for the charge deficit on the
central carbon atom of the molecule.
The accuracy and precision of the method were evaluated in river water samples spiked with 10 and
30 mgL�1 of CV, yielding a relative standard deviation of 6.2% and 8.4% and a recovery of 98.4% and
99.4%, respectively. The method detection limit was 1.8 mgL�1 and the limit of quantification was
5.4 mgL�1, which can be decreased if the sample volume is increased.
& 2012 Elsevier B.V. All rights reserved.
1. Introduction
Crystal violet (CV) is an aromatic organic dye that is soluble inwater, and it is used in the textile industry, medicine andaquaculture. This compound is highly toxic to organisms andthe aquatic environment, and it can result in death or mutationsin organisms that are exposed to it [1]. The use of CV is currentlybanned in Europe, USA and Japan. Although the use of CV as afungicide has been banned in Chilean aquaculture, it is still usedas an industrial dye and it could also be illegally used inaquaculture. Therefore, this compound is likely discharged intothe sewer system, where it then reaches surface waters such asrivers or seas, thereby affecting aquatic life [2].
The extraction of organic compounds is generally performedusing methods that use solvents, which introduce additionalcontamination into the environment. Although progress has beenmade to reduce the use of solvents during organic extractions, the
ll rights reserved.
.
development of new techniques that use the least amount ofchemical solvents is desirable. Solid phase microextraction(SPME) [3] is a solvent-free technique that is based on the useof a fused silica fiber coated with an adsorbent phase that ispolymeric in nature. This technique has allowed the developmentof new extraction techniques that improve the extraction effi-ciency by increasing the volume of the polymeric phase and itssurface area to volume ratio. In this regard, new sorptiontechniques have been described including stir bar sorptive extrac-tion (SBSE) [4], silicone rod extraction (PDMS-rod extraction) [5],micro-extraction with a thin sheet of PDMS (thin film PDMS) [6,7]and rotating disk sorptive extraction (RDSE) [8,9]. The advantageof these techniques is that they reduce solvent usage and arerapid and efficient.
All of these microextraction techniques have primarily been usedwith gas or liquid chromatography. However in RDSE the analytecan also be directly evaluated using solid phase spectrophotometryin the PDMS phase because of its geometry. In this context, a RDSEmethod has been described for malachite green [10].
In the case of the crystal violet dye, different analyticalmethods have been described for its determination in water
V. Manzo et al. / Talanta 106 (2013) 305–308306
samples, such as dispersive microextraction using ionic liquidsand HPLC [11], cloud point extraction coupled with spectro-photometry [12] and magnetic solid phase extraction that is alsocoupled with spectrophotometry [13]. All of these methodsrequire more than one sample preparation step.
In this study, RDSE technique was used for the extraction of CVfrom water samples using a rotating Teflon disk coated on onesurface with a layer of polydimethylsiloxane (PDMS). Afterextraction of the CV using RDSE, the analyte can be measureddirectly on the solid phase using UV–Visible spectrophotometry.The extraction mechanism of CV in PDMS involves that althoughthe colorless species (carbinol) is the extracted chemical form atpH 14, an intense violet coloration appeared in the phase becauseinteraction between analyte and PDMS allows a change in thecharge density of the molecule.
2. Experimental
2.1. Reagents
All reagents were analytical grade, and the solutions wereprepared with high-purity water from a Milli-Q PLUS ultrapurewater system. A stock solution of 1000 mgL�1 crystal violet(Sigma Aldrich, Milwaukee, WI, USA) was prepared by dissolving0.1 g of the reagent into water and diluting to 100 mL in avolumetric flask. Other concentrations were prepared by appro-priate dilutions of this stock solution. All solutions were stored inamber bottles at 4 1C.
A 0.1 M phosphate buffer (Merck, Darmstadt, Germany) wasprepared for the pH studies. The pH was adjusted using HCl orNaOH (Merck). Sodium sulfate (technical grade, Merck) was usedto study the salting out effect.
The PDMS phase was prepared from a Sylgard 184 siliconeelastomer kit (Dow Corning Co. MI, USA) according to therecommendations of the manufacturer.
2.2. Instrumental
All absorbance measurements were performed using a UnicamUV2 UV/Vis spectrophotometer. An AWTW Model pMX 3000 pHmeter with a combined glass electrode was used for pH determi-nations. A Heildolph MR 3002 magnetic stirrer with speed andheating control was used for the CV pre-concentration.
NN
N
CH3
CH3
CH3 CH3
CH3
CH3
OH
OH-
C+
N
N
N
CH3
CH3
CH3
CH3
CH3CH3
H+ð1Þ
2.3. Preparation of the rotating disk devices
The extraction device used in this study (Fig. 1) was a Teflondisk that had an embedded miniature magnetic stirring bar(Teflon-coated Micro Stir bar from VWR International, Inc.).
The PDMS films were prepared as follows: the ratio of base tocatalyst mixture was 10:1 (w/w), and the curing time at roomtemperature was 48 h. Before curing, the gel solution was pouredinto a square tile for PDMS gelation, in which the area is delimitedby a rubber band with a width of 2 mm. The thickness of theformed PDMS film may be modified by the rubber band width.One circular part of the phase, equivalent to the desired area(1.5 cm), was cut using a hollow punch and fixed onto the Teflondisk using double-sided tape.
2.4. General procedure
A 50 mL volume of the water sample (or standard) containingCV with concentrations from 5 to 200 mgL�1 was poured into abeaker, and sodium hydroxide was used to adjust the pH value to14. The rotating disk containing the PDMS phase was placedinside the beaker, and the disk was rotated at 1250 rpm for100 min at 70 1C.
After extraction, the PDMS film was detached from the diskand placed into a specially designed framed holder. The holderwas then inserted into the light path of the UV–Vis spectrometer.Absorbance measurements were performed at 600 nm against aPDMS blank phase located in a second PDMS film framed holder.
2.5. Real sample analysis
To assess the applicability of the method, water samples wereanalyzed from the Maipo River using the general procedure. Thesample was enriched with different concentrations of CV.
3. Results and discussion
The chemical variables and those related with the stirringextraction/preconcentration device were assessed to obtain thehighest sensitivity for the determination of CV.
3.1. Effect of pH and salt addition (salting out)
The effect of pH on the extraction of CV was examined betweenpH values of 3 and 14. The signal had a significant dependence onthe pH. In acidic, neutral and slightly alkaline media, the CV remainscolored in aqueous solution due to the presence of the cationic formof CV. Above pH 10, the solution becomes colorless due to theformation of carbinol base (Eq. (1)) [14].
However, the coloration in the PDMS phase as a function of pHis completely different than the coloration observed in the waterphase (Fig. 2). In acidic media, the coloration of the phase was
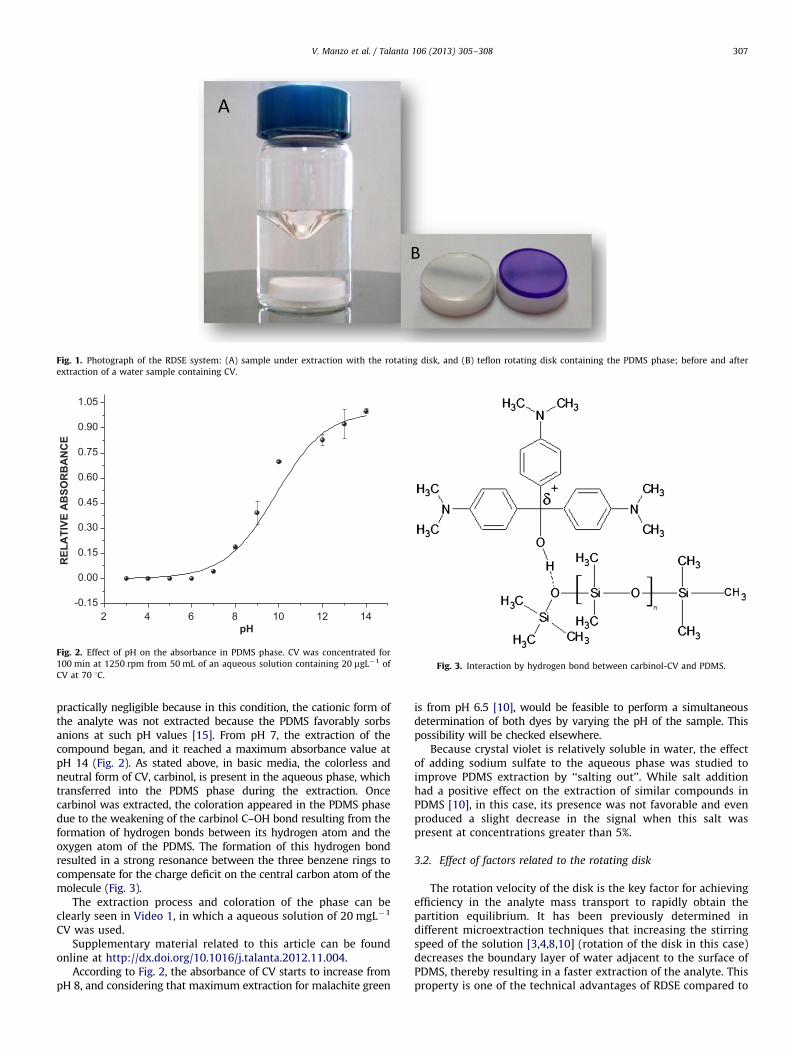
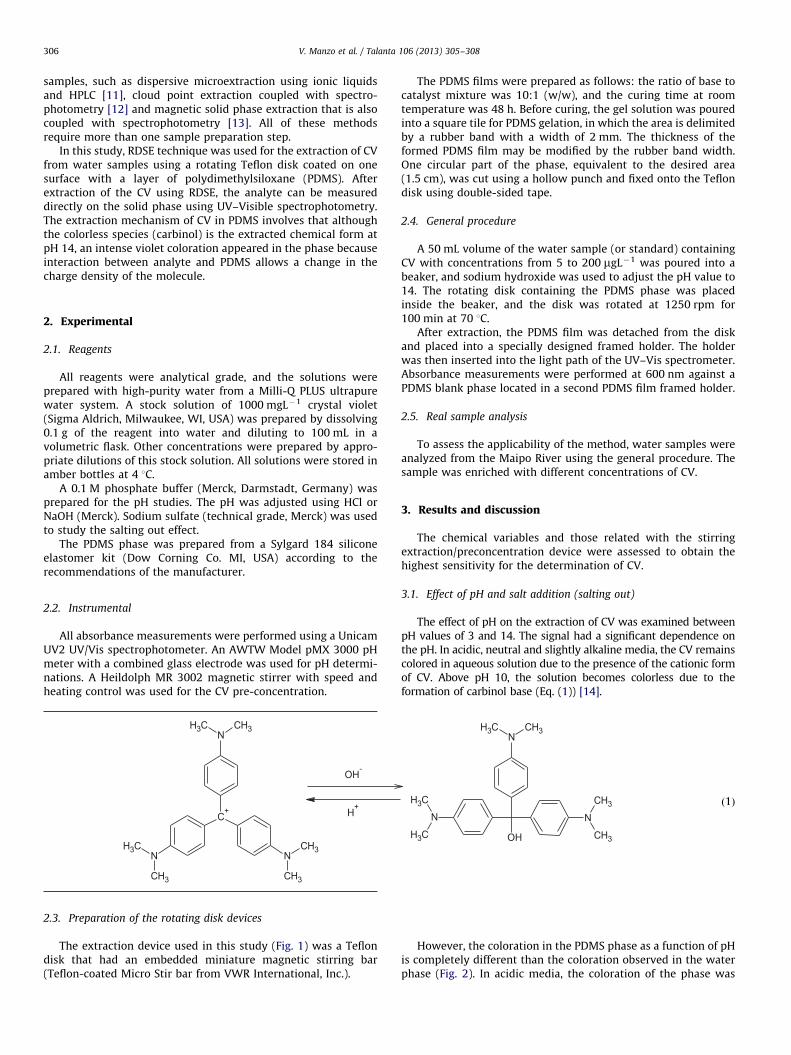
Fig. 1. Photograph of the RDSE system: (A) sample under extraction with the rotating disk, and (B) teflon rotating disk containing the PDMS phase; before and after
extraction of a water sample containing CV.
2 4 6 8 10 12 14-0.15
0.00
0.15
0.30
0.45
0.60
0.75
0.90
1.05
REL
ATI
VE A
BSO
RB
AN
CE
pH
Fig. 2. Effect of pH on the absorbance in PDMS phase. CV was concentrated for
100 min at 1250 rpm from 50 mL of an aqueous solution containing 20 mgL�1 of
CV at 70 1C.Fig. 3. Interaction by hydrogen bond between carbinol-CV and PDMS.
V. Manzo et al. / Talanta 106 (2013) 305–308 307
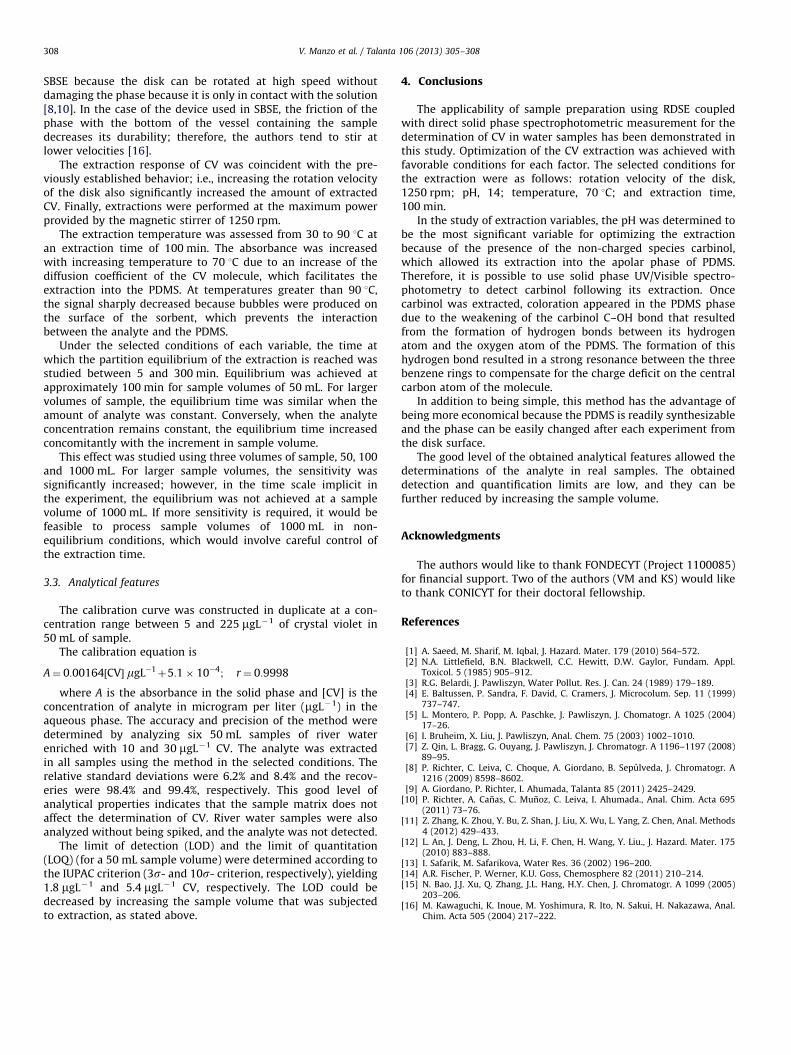
practically negligible because in this condition, the cationic form ofthe analyte was not extracted because the PDMS favorably sorbsanions at such pH values [15]. From pH 7, the extraction of thecompound began, and it reached a maximum absorbance value atpH 14 (Fig. 2). As stated above, in basic media, the colorless andneutral form of CV, carbinol, is present in the aqueous phase, whichtransferred into the PDMS phase during the extraction. Oncecarbinol was extracted, the coloration appeared in the PDMS phasedue to the weakening of the carbinol C–OH bond resulting from theformation of hydrogen bonds between its hydrogen atom and theoxygen atom of the PDMS. The formation of this hydrogen bondresulted in a strong resonance between the three benzene rings tocompensate for the charge deficit on the central carbon atom of themolecule (Fig. 3).
The extraction process and coloration of the phase can beclearly seen in Video 1, in which a aqueous solution of 20 mgL�1
CV was used.Supplementary material related to this article can be found
online at http://dx.doi.org/10.1016/j.talanta.2012.11.004.According to Fig. 2, the absorbance of CV starts to increase from
pH 8, and considering that maximum extraction for malachite green
is from pH 6.5 [10], would be feasible to perform a simultaneousdetermination of both dyes by varying the pH of the sample. Thispossibility will be checked elsewhere.
Because crystal violet is relatively soluble in water, the effectof adding sodium sulfate to the aqueous phase was studied toimprove PDMS extraction by ‘‘salting out’’. While salt additionhad a positive effect on the extraction of similar compounds inPDMS [10], in this case, its presence was not favorable and evenproduced a slight decrease in the signal when this salt waspresent at concentrations greater than 5%.
3.2. Effect of factors related to the rotating disk
The rotation velocity of the disk is the key factor for achievingefficiency in the analyte mass transport to rapidly obtain thepartition equilibrium. It has been previously determined indifferent microextraction techniques that increasing the stirringspeed of the solution [3,4,8,10] (rotation of the disk in this case)decreases the boundary layer of water adjacent to the surface ofPDMS, thereby resulting in a faster extraction of the analyte. Thisproperty is one of the technical advantages of RDSE compared to
V. Manzo et al. / Talanta 106 (2013) 305–308308
SBSE because the disk can be rotated at high speed withoutdamaging the phase because it is only in contact with the solution[8,10]. In the case of the device used in SBSE, the friction of thephase with the bottom of the vessel containing the sampledecreases its durability; therefore, the authors tend to stir atlower velocities [16].
The extraction response of CV was coincident with the pre-viously established behavior; i.e., increasing the rotation velocityof the disk also significantly increased the amount of extractedCV. Finally, extractions were performed at the maximum powerprovided by the magnetic stirrer of 1250 rpm.
The extraction temperature was assessed from 30 to 90 1C atan extraction time of 100 min. The absorbance was increasedwith increasing temperature to 70 1C due to an increase of thediffusion coefficient of the CV molecule, which facilitates theextraction into the PDMS. At temperatures greater than 90 1C,the signal sharply decreased because bubbles were produced onthe surface of the sorbent, which prevents the interactionbetween the analyte and the PDMS.
Under the selected conditions of each variable, the time atwhich the partition equilibrium of the extraction is reached wasstudied between 5 and 300 min. Equilibrium was achieved atapproximately 100 min for sample volumes of 50 mL. For largervolumes of sample, the equilibrium time was similar when theamount of analyte was constant. Conversely, when the analyteconcentration remains constant, the equilibrium time increasedconcomitantly with the increment in sample volume.
This effect was studied using three volumes of sample, 50, 100and 1000 mL. For larger sample volumes, the sensitivity wassignificantly increased; however, in the time scale implicit inthe experiment, the equilibrium was not achieved at a samplevolume of 1000 mL. If more sensitivity is required, it would befeasible to process sample volumes of 1000 mL in non-equilibrium conditions, which would involve careful control ofthe extraction time.
3.3. Analytical features
The calibration curve was constructed in duplicate at a con-centration range between 5 and 225 mgL�1 of crystal violet in50 mL of sample.
The calibration equation is
A¼ 0:00164½CV� mgL�1þ5:1� 10�4; r¼ 0:9998
where A is the absorbance in the solid phase and [CV] is theconcentration of analyte in microgram per liter (mgL�1) in theaqueous phase. The accuracy and precision of the method weredetermined by analyzing six 50 mL samples of river waterenriched with 10 and 30 mgL�1 CV. The analyte was extractedin all samples using the method in the selected conditions. Therelative standard deviations were 6.2% and 8.4% and the recov-eries were 98.4% and 99.4%, respectively. This good level ofanalytical properties indicates that the sample matrix does notaffect the determination of CV. River water samples were alsoanalyzed without being spiked, and the analyte was not detected.
The limit of detection (LOD) and the limit of quantitation(LOQ) (for a 50 mL sample volume) were determined according tothe IUPAC criterion (3s- and 10s- criterion, respectively), yielding1.8 mgL�1 and 5.4 mgL�1 CV, respectively. The LOD could bedecreased by increasing the sample volume that was subjectedto extraction, as stated above.
4. Conclusions
The applicability of sample preparation using RDSE coupledwith direct solid phase spectrophotometric measurement for thedetermination of CV in water samples has been demonstrated inthis study. Optimization of the CV extraction was achieved withfavorable conditions for each factor. The selected conditions forthe extraction were as follows: rotation velocity of the disk,1250 rpm; pH, 14; temperature, 70 1C; and extraction time,100 min.
In the study of extraction variables, the pH was determined tobe the most significant variable for optimizing the extractionbecause of the presence of the non-charged species carbinol,which allowed its extraction into the apolar phase of PDMS.Therefore, it is possible to use solid phase UV/Visible spectro-photometry to detect carbinol following its extraction. Oncecarbinol was extracted, coloration appeared in the PDMS phasedue to the weakening of the carbinol C–OH bond that resultedfrom the formation of hydrogen bonds between its hydrogenatom and the oxygen atom of the PDMS. The formation of thishydrogen bond resulted in a strong resonance between the threebenzene rings to compensate for the charge deficit on the centralcarbon atom of the molecule.
In addition to being simple, this method has the advantage ofbeing more economical because the PDMS is readily synthesizableand the phase can be easily changed after each experiment fromthe disk surface.
The good level of the obtained analytical features allowed thedeterminations of the analyte in real samples. The obtaineddetection and quantification limits are low, and they can befurther reduced by increasing the sample volume.
Acknowledgments
The authors would like to thank FONDECYT (Project 1100085)for financial support. Two of the authors (VM and KS) would liketo thank CONICYT for their doctoral fellowship.
References
[1] A. Saeed, M. Sharif, M. Iqbal, J. Hazard. Mater. 179 (2010) 564–572.[2] N.A. Littlefield, B.N. Blackwell, C.C. Hewitt, D.W. Gaylor, Fundam. Appl.
Toxicol. 5 (1985) 905–912.[3] R.G. Belardi, J. Pawliszyn, Water Pollut. Res. J. Can. 24 (1989) 179–189.[4] E. Baltussen, P. Sandra, F. David, C. Cramers, J. Microcolum. Sep. 11 (1999)
737–747.[5] L. Montero, P. Popp, A. Paschke, J. Pawliszyn, J. Chomatogr. A 1025 (2004)
17–26.[6] I. Bruheim, X. Liu, J. Pawliszyn, Anal. Chem. 75 (2003) 1002–1010.[7] Z. Qin, L. Bragg, G. Ouyang, J. Pawliszyn, J. Chromatogr. A 1196–1197 (2008)
89–95.[8] P. Richter, C. Leiva, C. Choque, A. Giordano, B. Sepulveda, J. Chromatogr. A
1216 (2009) 8598–8602.[9] A. Giordano, P. Richter, I. Ahumada, Talanta 85 (2011) 2425–2429.
[10] P. Richter, A. Canas, C. Munoz, C. Leiva, I. Ahumada., Anal. Chim. Acta 695(2011) 73–76.
[11] Z. Zhang, K. Zhou, Y. Bu, Z. Shan, J. Liu, X. Wu, L. Yang, Z. Chen, Anal. Methods4 (2012) 429–433.
[12] L. An, J. Deng, L. Zhou, H. Li, F. Chen, H. Wang, Y. Liu., J. Hazard. Mater. 175(2010) 883–888.
[13] I. Safarik, M. Safarikova, Water Res. 36 (2002) 196–200.[14] A.R. Fischer, P. Werner, K.U. Goss, Chemosphere 82 (2011) 210–214.[15] N. Bao, J.J. Xu, Q. Zhang, J.L. Hang, H.Y. Chen, J. Chromatogr. A 1099 (2005)
203–206.[16] M. Kawaguchi, K. Inoue, M. Yoshimura, R. Ito, N. Sakui, H. Nakazawa, Anal.
Chim. Acta 505 (2004) 217–222.