determining if a particle is a fiber
TRANSCRIPT

Determining if a Particle is a Fiber
Dr. Eric J. ChatfieldChatfield Technical Consulting Limited
2071 Dickson RoadMississauga, Ontario
CanadaL5B 1Y8

Sources of Error in Fiber Counting and Analysis for Determination of Asbestos Exposure
• Ambiguities in fiber counting criteria• Subjective interpretation of complex fibrous
structures• Failure to detect fibers• Multiple counting of the same fiber• In TEM analysis, failure to correctly identify fibers • Overloading of sample filters resulting in obscuration
of fibers in direct-transfer TEM preparations• Use of indirect-transfer TEM preparation, leading to
distorted size distributions and truncated data

Fiber Counting Criteria
• All analytical methods based on fiber counting incorporate fiber counting criteria
• The specific criteria defined in the analytical method, or the failure to define them, critically affect the results reported
• Published PCM analytical methods all contain ambiguities that seriously affect the precision and accuracy of the reported data
Phase Contrast Microscopy (PCM)Analytical Methods for Airborne Fibers
• NIOSH 7400• OSHA ID 160• International Organization for Standardization,
ISO 8672• World Health Organization (WHO)

Determination of Compliance Using NIOSH 7400
For calculation of 95% confidence limits, NIOSH 7400 recommends that 0.45 be used as the subjective coefficient of variation

NIOSH 7400Equations for Calculation of
95% Confidence Limits
)41(2))41(4)24((42
2
222 21
r
r
SXXSXXLCL
−−−+−+
=
)25.21(2))25.21(4)225.2((25.22
2
222 21
r
r
SXXSXXUCL
−−−+++
=
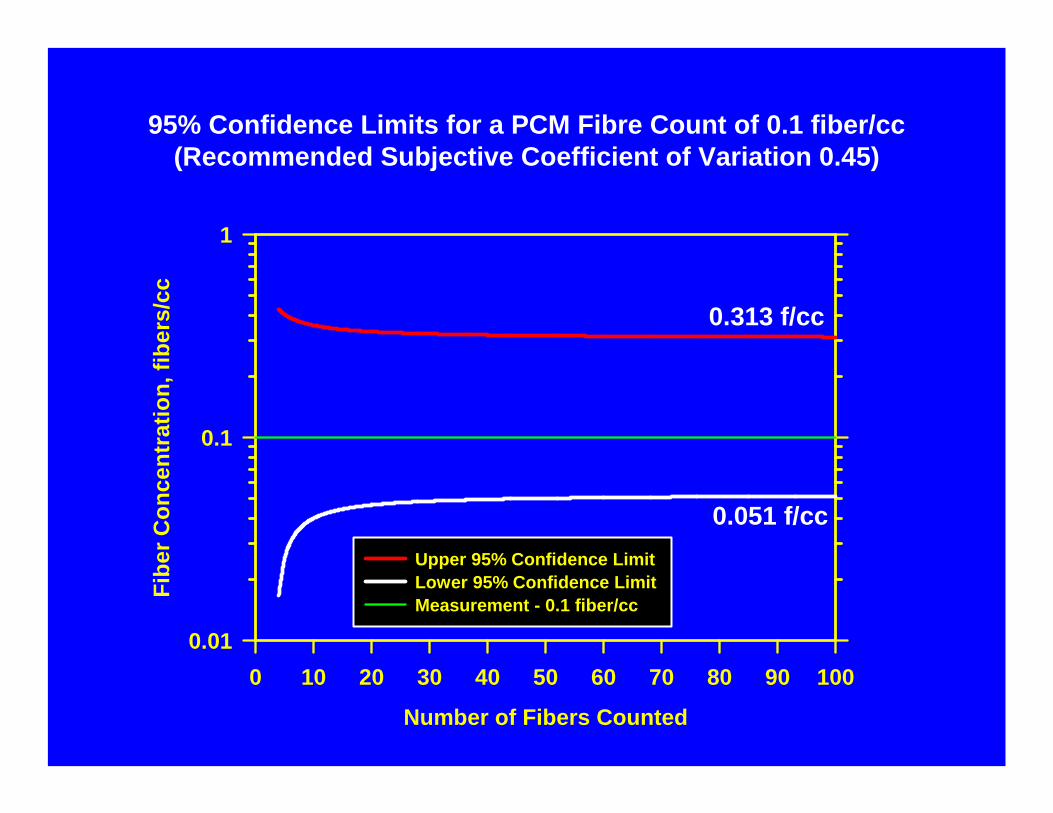
95% Confidence Limits for a PCM Fibre Count of 0.1 fiber/cc(Recommended Subjective Coefficient of Variation 0.45)
Number of Fibers Counted
0 10 20 30 40 50 60 70 80 90 100
Fibe
r Con
cent
ratio
n, fi
bers
/cc
0.01
0.1
1
Upper 95% Confidence Limit Lower 95% Confidence LimitMeasurement - 0.1 fiber/cc
0.313 f/cc
0.051 f/cc

Ambiguities Remain in PCM Fiber Counting Criteria
5 µm

It is not generally recognized that PCM measurements become more inaccurate asthe level of non-fibrous material in the air increases
In 1982, an international study was conducted by the Institute of Occupational Medicine, in which slides from various workplaces were analyzed by experienced laboratories. The results demonstrated that inter-laboratory coefficients of variation (CV) as high as 0.85could be experienced when sampling materials such as asbestos-cement.

Coe
ffici
ent o
f Var
iatio
n (C
V)
0.0
0.1
0.2
0.3
0.4
0.5
0.6
0.7
0.8
0.9
1.0Amosite Chrysotile TextileBrake Lining Asbestos-Cement Upper Limits of NIOSH 7400 FormulaeNIOSH 7400 Recommendation
Upper 95%
Lower 95%
NIOSH 7400
Coefficients of Variation Observed forVarious Types of Asbestos-Containing Materials
(Crawford N.P, Thorpe, H.L. and Alexander, W. 1982)

Number of Fibers Counted
0 10 20 30 40 50 60 70 80 90 100
Fibe
r Con
cent
ratio
n, fi
bers
/cc
0.01
0.1
1
10
100
Upper 95% Confidence Limit Lower 95% Confidence LimitMeasurement - 0.1 fiber/cc
10.1 f/cc
0.043 f/cc
95% Confidence Limits for a PCM Fibre Count of 0.1 fiber/cc(Subjective Coefficient of Variation 0.66)
REJECTION OFNON-RESPIRABLE FIBERS
• NIOSH 7400 requires that all fibers are included in the measurement, regardless of their widths and respirability
• ISO 8672 requires that fibers thicker than 3 µm and fibers in contact with particles larger than 3 µm be rejected

ISO 8672 (1), NIOSH 7400 (?)
5 µm

Determination of Asbestos by Electron Microscopy
• Yamate Draft TEM Method (1984) – Direct• NIOSH 7402 (1986 - 1994) - Direct• AHERA TEM Method (1987) - Direct• ISO 10312 (1995) - Direct• ASTM 6281 (1998) - Direct• ISO 13794 (1999) - Indirect• ISO 14966 (2001) – SEM - Direct
NIOSH 7402 (TEM) and ISO 14966 (SEM) are the only electron microscope methods specifically designed for determination of PCM-equivalent fibers only.
ISO 10312, ASTM 6281 and ISO 13794 are intended for application to ambient atmospheres, but all include procedures for determination of PCM-equivalent fibers.

The Yamate Draft TEM Method
• Introduced the concept of “asbestos structure”
• Classified asbestos structures as fibers, fiber bundles, clusters and matrices
• Incorporated the concept of a “level of analysis”, recognizing that the requirement for certainty of identification was not the same for all analyses

The AHERA TEM analytical method was never intended to relate to health
or exposure measurement
This method was intended only as a rapid procedure to demonstrate cleanliness in an asbestos abatement work area.
The method provides no fiber size information, other than to record how many of the “fibers” counted are longer than or shorter than 5 µm.

The Yamate Draft TEM Method did not define the minimum fiber length to be included
in the data
In the Yamate Draft TEM Method, a fiber is defined as a particle with a minimum 3:1 aspect ratio, with no specification of a minimum length.
An ISO study in 1981 showed that if the minimum fiber length to be counted is not defined in the method, each analyst will subconsciously select his or her own value, ranging from 0.1 µm to more than 2 µm. For some laboratories, 45% of the reported fibers were shorter than 0.5 µm.
National Bureau of Standards Study(Steel, E.B., Small, J.A. and Sheridan, P., 1982)
This study demonstrated that when chrysotile fibers were shorter than approximately 0.4 µm, TEM operators stood only a 50% chance or less of detecting them.

As a result of the ISO Inter-laboratory study and the NBS study, all subsequent TEM analytical methods incorporated a minimum fiber length of 0.5 µm
This decision had no health basis, but was the only way in which consistency of analysis could be obtained. This fiber length was also considered to be a reasonable minimum at which asbestos fibers could be reliably detected and identified in the TEM.

The ISO methods and the ASTM TEM method specify counting criteria that allow interpretation of the data in terms of all known legislated standards.
In order to achieve this, each fibrous structure is recorded in as much detail as possible.

Examples of Fiber Counting Criteria
Yamate – Record as 1 MatrixWidth = Fiber widthLength = Sum of all visible
fiber segments
AHERA – Record as 1 MatrixNo dimensions recorded
ISO (TEM) – Record as 1 MatrixRecord overall dimensions, and thedimensions of each of 4 constituentfibers

Examples of Fiber Counting Criteria
Yamate – Record as 1 ClusterWidth = Fiber widthLength = Sum of all visible
fiber segments
AHERA – Record as 1 ClusterNo dimensions recorded
ISO (TEM) – Record as 1 ClusterRecord overall dimensions, and thedimensions of each of 4 constituentfibers

The AHERA method considers all asbestos structures as the same. The small fiber bundle in the red circle is
considered equivalent to the large complex structure.
5 µm
1 Structure 1 Structure

TEM Examination: Recording of Complex Matrix
Yamate – 1 Matrix. Dimensionsreported as a fiber bundle of lengthequal to the sum of all visible fibersegments
AHERA – 1 Matrix. No dimensionsrecorded
ISO (TEM) – 1 Matrix. Overall dimensions recorded, plus lengthsand widths of the 5 longest fibersor fiber bundles. Dimensions of the balance of the matrix also recorded
5 µm

Non-respirable chrysotile matrix collected on an occupational air sample filter
5 µm

Characteristics of Indirect-transfer TEM Specimen Preparation
• Clusters and matrices are broken down into their constituent fibers and fiber bundles
• The overall size distribution shifts to smaller sizes with a corresponding reduction of larger sizes
• Any large, non-respirable clusters and matrices present on the sample collection filter disintegrate. The products of the disintegration then contribute to the measurement
• These effects are not significant in ambient measurements, but they dominate in occupational measurements
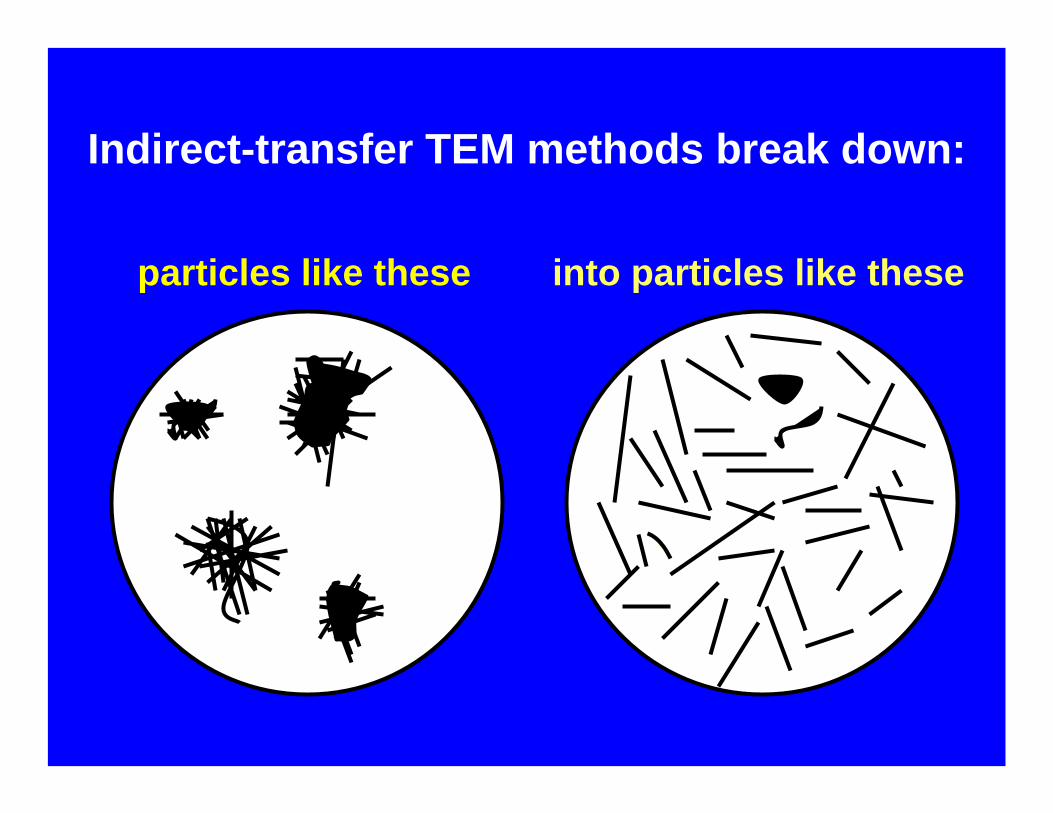
Indirect-transfer TEM methods break down:
into particles like theseparticles like these
Direct-transfer vs. Indirect-transfer TEM Analyses
Parallel analyses of air filters by the direct and indirect specimen preparation methods show that TEM specimens prepared using the indirect method do not represent the particles and fibers as they existed in the air

Appearance of TEM Specimens Prepared by Direct-Transfer and Indirect-Transfer Preparation Methods from an Air Filter
Collected During Abrasion of a Gasket
5 µm 5 µm
Direct-Transfer Indirect-Transfer

Appearance of Chrysotile in TEM Specimens Prepared by Direct and Indirect Methods from an Air Sample Collected
During Scraping of Pipe Elbow Cement
5 µm5 µm
Direct-Transfer Indirect-Transfer

Change of Particle Size Distribution Caused by Indirect TEM Specimen Preparation of Air Sample Collected During Scraping of Pipe Elbow Cement
X 12.071.265.94All Sizes
X 0.580.631.085.00 –34.06
X 7.4428.133.781.08 – 5.00
X 39.442.501.080.50 – 1.08
RatioIndirect (s/cc)Direct (s/cc)Size Range (µm)

The Majority of the Asbestos Structures Observed Using the Indirect TEM Method on Occupational Air Samples
are Generated by the Method Itself
97.12%62.501.80Fibers andBundles
91.68%71.265.93AllStructures
Generated by the Indirect Analytical
Method
Indirect (s/cc)
Direct (s/cc)
StructureType

Conclusions
• When sampling operations involving materials that contain high proportions of non-fibrous constituents, exposure measurements made by PCM should be treated with considerable caution
• The TEM analytical method selected for a task must be the appropriate one for the task
• Care must be taken to interpret the recorded dimensions of asbestos structures correctly. The recorded dimensions in the analytical data sheets may not mean what you think they mean
• Indirect-transfer TEM analysis misrepresents the nature of airborne asbestos in occupational settings