determining the readability of colored text · [email protected] univ. of pennsylvania...
TRANSCRIPT

Determining the Readability of Colored Text
Jordan [email protected]
Univ. of PennsylvaniaPhiladelphia, PA
Ayaka [email protected]
Univ. of PennsylvaniaPhiladelphia, PA
Joshua [email protected]
Univ. of PennsylvaniaPhiladelphia, PA
David [email protected]
Univ. of PennsylvaniaPhiladelphia, PA
Lyle [email protected]
Univ. of PennsylvaniaPhiladelphia, PA
ABSTRACTOur research develops an algorithm to determine the read-ability of colored text and background combinations on theWeb using machine learning techniques. We aim for thisalgorithm to be a useful alternative an existing formula putforth by the World Wide Web Consortium (W3C) which doesnot produce sufficiently detailed results.
We collected pair-wise image comparison data through Ama-zon Mechanical Turk to build a regression model for assign-ing numeric scores to specified color combinations. Our re-sults show that readability can be well expressed as a functionof red, green, and blue values in the RGB color space.
1. INTRODUCTIONConsider the three images in Figure 1. While it is clear
which option is the least readable, the other two are moredifficult to differentiate. What exactly is involved in textreadability? How do brightness, contrast, and choice of huescome into play? Our goal is to algorithmically determine thereadability of text based on these different properties andtheir relationships.
After determining the relative roles of the above factorsand creating an algorithm to determine readability, there arethree main applications to which our results can be applied:
1. improving existing designs,
2. rating existing or suggested designs, and
3. facilitating automated design generation.
The benefit of improving existing designs should be imme-diately obvious. Not all websites are particularly readable,and many could benefit from improved readability Figure2.
Rating designs is useful, for example, in improving searchengine results by considering text readability in the rankingalgorithm. That is, if the content were identical, a websitethat had white text on white background would be rankedlower than a website that had black text on white back-ground.
Lastly, the automation of design generation is a trickytask involving the careful selection of layout (which includescombination of images and text) and colors. In a world thatis increasingly automated, our algorithm may facilitate theselection of colors such that the resulting designs are bothreadable and aesthetically pleasing.
All three applications contribute to our ultimate goal ofmaking the Web easier and more pleasant to read. Thisis especially important in an era in which people spend anincreasingly large amount of time on the computer. Witha few clicks of the mouse, buyers can have anything froma box of tissues to a home sound system delivered right totheir doors. Research has shown that the legibility of anonline shop’s website directly affects the likelihood of thebuyer completing a purchase [15]. Furthermore, it has beenshown that text and background color combinations affectreading performance and comprehension [18].
Research has already been conducted on readability froma purely typographic vantage point [9]. However, most ofour current knowledge on typographic readability needs tobe extended because the research was done in an age wheretype was intended for paper, when there was not much colorvariation besides standard black text on white background.There also exists research on vision science (the study of hu-man visual perception) applied to typography, but the re-sults have not produced anything tangible or useful in termsof predicting text color readability [3].
In particular, the official W3C formula for readability failsto take into account certain properties of text that havebeen shown to affect readability based on prior research[5]. For example, the formula fails to consider the asym-metric nature, or polarity, of text and background color.Prior research has already shown that black text on a whitebackground is more readable than white text on a blackbackground [6]. Our goal is to bring together the collectiveknowledge of typographic and vision science-based metricsof readability to develop a model that is significantly betterat predicting text readability than such formulae.
In the following sections, we will discuss related workon text readability as well as some necessary background,our experimental design, and finally, our results and theroadmap ahead for this research.
2. DEFINITIONSBelow are some definitions of concepts that are crucial in
understanding the methods involved in our work.
2.1 Readability“Readability” is inherently subjective and difficult to de-
fine. On some level, it relies on our biology. Human visionis calibrated to perceive the world via a given set of colors.While most people have similar sensitivity to red, green, and

Figure 1: Images with different readabilities
Figure 2: Website with suboptimal colors
blue, some people are blind to some or all of the colors andthus have different opinions on readability. On the otherhand, individual preferences come into play. What one per-son claims to be readable on aesthetic grounds may not bereadable to another person. This could be due to familiarityor just pure preference. Figure 3 provides an example of ahigh-contrast image that while maybe readable on a biolog-ical level, may be aesthetically off-putting to some. We feelthat a laissez-faire approach to the definition of readabilityfits well for this line of research. Since the project seeksto derive a model for what subjects consciously determineis readable, it does not particularly matter to us why theydetermine it is readable.
2.2 Color ModelsWe will be referring to a number of different color models
in this project, including but not limited to RGB and HSL. Acolor model is a way to represent color numerically. Differentcolor models have different properties and applications.
2.2.1 RGBRGB stands for“red,”“green,”and“blue.” It is an additive
color model where varying amounts [0 - 255] of red, green,and blue are combined additively to produce other colors.RGB colors are often represented in a six digit hexadecimalformat, where the first two digits represent red, the secondtwo green, and the last two blue. The RGB color schemecorresponds well with human perception. We as humansperceive colors through combinations of red, green, and bluesensitive receptors in our eyes [3]. RGB is also the combina-tion of colors directly represented in most digital displays.It may be represented visually as a cube. (See Figure 4.)
2.2.2 HSLHSL stands for “hue,”“saturation,” and “lightness.” It is a
cylindrical-representation of points in the RGB color model,developed as an attempt to make the color model moreperceptually intuitive. Hue varies on the range [0 - 360],whereas saturation and lightness lie on the range [0 - 1],sometimes scaled up to percents. Hue is color like the col-
Figure 3: High contrast example
Figure 4: RGB Color Cube [11]
ors in a rainbow or on a traditional color wheel. Saturationrefers to how “vivid” or “grey” the colors are. Lightness ishow “dark” or “pale” the colors are. It may be representedby a cylinder. (See Figure 6.)
2.2.3 Other Color ModelsWhile RGB and HSL are the most frequently used in
daily life, other color models exist. One such family of mod-els, CIE, was developed by the Comission Internationale del’Eclairage in the early Twentieth Century with the goal ofcreating a model that closely matched human vision and wasdevice independent. This work remains relevant because ofthe poor match between the range expressible by RGB andthe range perceivable by the average human. A numberof CIE spaces have been developed including CIEL*a*b*,CIEL*c*h [12].
2.2.4 Amazon Mechanical TurkAmazon Mechanical Turk [1] is a portion of Amazon Web
Services which allows organizations or individuals to deploycrowdsourcing tasks such as surveys known as HITs. De-ployers have the ability to pay anonymous members, usuallyin the range of a few cents, for completing their HITs.
2.2.5 WekaWeka is a suite of machine learning software developed
at the University of Waikato [13]. It contains tools to aidin a wide variety of machine learning tasks. Importantly,Weka has the ability to take into account specified featuresto produce classification and regression models.
3. RELATED WORKRelated work on our project is divided primarily between
two fields: vision science (Sec. 3.1) and text readability (Sec.3.2). Vision science deals primarily with how we perceive the

Figure 5: HSL Color Cylinder [8]
Figure 6: Mismatch between RGB color space (rain-bow) and human perception (grey) [2]
world in neuroscientific terms. Text readability is a higherlevel study that pertains specifically to how well readers canfollow written text.
3.1 Vision SciencePrior research in vision science demonstrates that colors
are perceived differently depending on what the surroundingcolor is. For example, a green color will be perceived to bemore yellow when the surroundings are masked compared towhen it is presented along with a background where morecolors are present [3]. This suggests that background colormay have a strong effect on how text is perceived, which isfundamental to text readability. It implies that both textcolor and background color are relevant in determining read-ability, and that the surrounding area, that is, whitespaceor more text, may have an effect as well.
3.2 Text ReadabilityPrior research on text readability has generally been di-
vided into two broad categories: readability of the letterforms due to font style, size, or denseness, and readabilityby color choice. The former has a long history. Metrics thatwere devised centuries ago are still in use today [9]. The lat-ter, on the other hand, has only become relevant in recentyears. Before the advent of electronic displays and the Inter-net, color was not a variable that printers generally had to
consider. Text color defaulted to black on white. So muchso, that font metrics use “black area” and “white area” torefer to text and background respectively [9].
Since the advent of the Internet, there have been a num-ber of studies on the relationship between colors and textreadability. For these studies, data was collected from ac-tual web users in experimental settings [14]. While thesefind clear correlation between color, readability, aesthetics,and other effects such as color polarity, they did not putforth any algorithms with which to apply their findings [6,14]. Furthermore, they treated colors, as a discrete rainbowrather than the near-continuous spectrum that is more read-ily available and more frequently used on the web than inprint.
Unlike discrete font choices, color can be represented asa number of continuous values [3]. As a result, it shouldbe possible to create a metric to represent readability as afunction of a continuous specification of text and backgroundcolors. W3C has provided an formula for determining read-ability based on the RGB values of the text and backgroundcolors [5].
foreground color = (rf , gf , bf )
background color = (rb, gb, bb)
hue diff = |rf − rg|+ |gf − gg|+ |bf − bg|
brightness c =299 · rc + 587 · gc + 114 · bc
1000
brightness diff = |brightnessb − brightnessf |
Readable? =
readable if brightness diff > 125 & hue diff > 500
not readable Otherwise
The difference in brightness is the absolute value of thedifference between the text vs. background brightness. Ac-cording to W3C, a brightness difference score of 125 or higherand a hue difference of 500 or higher represents acceptablecontrast for readability.
There are a number of clear problems with the formula.The formula was created a priori rather than built on directresearch, then an attempt to validate the formula found thatits predictions had some correlation with actual readability,but that it failed in many instances [5]. This may be be-cause it does not take into account other relevant factors.For example, it is known inverting foreground and back-ground colors, i.e. inverting contrast polarity, has an effecton readability, and the formula does not take that into ac-count. It also ignores font style, size, and denseness. Also,since both are known to affect readability, It may be rea-sonable to assume that their interactions have additionaleffects. Hill demonstrated this to be the case, however, shedoes not provide an explanation for the observed effects [7].Furthermore, the W3C formula is very conservative whenit comes to marking something as “readable,” which leadsto many false negatives. See Figure 7 for example, whichis the logo for the popular social networking site, Facebook[17]. The background color’s RGB value is (59, 85, 152) andthe text’s is (255, 255, 255). Using the formula, we computethe hue difference:
|255− 59|+ |255− 85|+ |255− 152| = 469

Figure 7: Example that W3C formula marks un-readable.
Figure 8: Development Model
The formula gives 469 < 500 which means that this isnot readable; however, one would probably agree that thisis quite readable, though it might not be the most read-able. In fact with W3C’s formula there colors that neverreadable since they are not readable when paired with anyother color. It is also worth mentioning that out of the 900color combinations that we randomly generated, only 3 weremarked as readable by W3C’s algorithm.
To improve upon the success rate of the W3C formula, weare attempting to create an algorithm that does not sufferfrom some of W3C’s flaws. For example, the W3C formulacreates a simple distinction between readable and not read-able [5]. While this may be fine for extreme examples, itignores finer grained distinctions and may produce incor-rect results for borderline readable texts. In contrast, ouralgorithm will rate results on a scale.
4. SYSTEM MODELIn order to ensure reliable results, the experiments will
be split into multiple phases. For each phase, we will addan extra parameter and see how the addition of the newparameter affects the model. As we progress, we may findadditional features to consider. (See Figure 8.)
• Phase 0: Sanity check experiment. Vary greyscaletext and background colors to test methodology.
• Phase 1: Vary text and background colors along asingle axis.
Figure 9: Mockup of a binary comparison readabil-ity question.
• Phase 2: Vary text and background colors along thefull spectrum.
4.1 Data CollectionData collection was done through a web application in
which users were asked to fill out an online survey. Eachsurvey consisted of 55 questions. Each question consisted ofa binary comparison in which the participants were showntwo images and asked to click on the image that was morereadable. The textual content of each image was identical.Figure 9 shows a mockup of a binary comparison question.Between each question, the participants were required tomove their cursors to the center of the screen in order toprevent them from clicking through arbitrarily.
4.2 Data AnalysisAt the end of each phase of data collection, we converted
the binary comparison results from the surveys to a scaledranking over the data. We accomplished this using MLDS(Maximum Likelihood Difference Scaling) [4]. This methodassumed that each image’s readability lay on a one-dimensionalcontinuum. The more distant two images are on a the scale,the less likely the subjects are to confuse them in terms ofreadability.
Furthermore, MLDS allowed for us to take “sign post”images from previous surveys and include them in all rank-ings. That way, each scale could be normalized to produceone consistent result.
With the results converted from a set of binary compar-isons to a linear scaling, we were able to move on to creatinga model. We considered a variety of features based on theparameters of various color models.
• From RGB:
– Rtext, Rbackground, ∆R = Rtext − Rbackground,|∆R|, ∆R2
– Gtext, Gbackground, ∆G, |∆G|, ∆G2
– Btext, Bbackground, ∆B, |∆B|, ∆B2
• From HSL:
– Htext, Hbackground, ∆H, |∆H|, ∆H2
– Stext, Sbackground, ∆S, |∆S|, ∆S2
– Ltext, Lbackground, ∆L, |∆L|, ∆L2
• From CIEL*c*h:
– L∗text, L
∗background, ∆L∗, |∆L∗|, ∆L∗2

– c∗text, c∗background, ∆c∗, |∆c∗|, ∆c∗2
– htext, hbackground, ∆h, |∆h|, ∆h2
Features from multiple color models were considered be-cause it was not apparent which would be more useful indetermining readability. While RGB and HSL had the ad-vantage of intuitiveness and simplicity, CIEL*c*h had thebenefit of being tied to human perception.
4.3 Performance EvaluationPerformance evaluation were based primarily on the er-
ror results provided by Weka [13]. Accuracy of the modelwas the primary goal. However, we also chose to take intoaccount the complexity of the model under the assumptionthat people would be more willing to implement it on theirown if it were relatively simple.
5. SYSTEM IMPLEMENTATIONOn a high level, or system was divided into two primary
segments: data collection, which involved the creation ofcolored images and the administration of surveys, and dataanalysis which consisted of putting the data through a seriesof algorithms.
5.0.1 Image GenerationThe images were generated randomly with respect to color
on the RGB scale, with font size and style held constant.The font used wass Arial and the text was an excerpt fromEdwin A. Abbott’s Flatland [16]:
I looked, and afar off I saw an immense Polygonalstructure, in which I recognized the General As-sembly Hall of the States of Flatland, surroundedby dense lines of Pentagonal buildings at rightangles to each other, which I knew to be streets;and I perceived that I was approaching the greatMetropolis.
A total of 900 randomly generated images were deployedthroughout the phases of the experiment.
5.1 Data CollectionWe collected human data from Amazon Mechanical Turk
via a survey. The survey was designed as a series of binaryquestions presented in random order and asks which of thetwo presented images is more readable.
5.1.1 SurveyUpon beginning the survey, participants were asked to en-
ter the dimensions of a figure, so that the relative size andproportions of their screens could be determined if neces-sary. They were also asked to enter their Mechanical TurkWorker IDs, so that they could be tracked throughout theduration of the task. We used their Mechanical Turk WorkerIDs because they were void of any other identifying infor-mation. Participants were compensated between 0.03 and0.05. The number was varied to increase participation inthe survey.
The survey consisted of 55 image comparisons each. Foreach image pair, participants were asked to click on whichof the two images they found more readable. Upon comple-tion they were given a completion code to enter back into a
form on Mechanical Turk as a secondary method of track-ing. Matching users with surveys allowed us to determine ifusers deserve to be paid for their participation in the exper-iment on the occasion that a participant clearly cheated onthe survey.
5.1.2 Survey EthicsWe would like to take this time to briefly address any
ethical concerns that might arise from this experiment. Wewere granted official exemption by the Institutional ReviewBoard for this experiment. We do not store any identify-ing information about the participants, and using AmazonMechanical Turk allows us to rely on Amazon to target cer-tain demographics (e.g. United States residents) withoutour direct involvement in that process.
One may argue that paying a maximum of 5 cents per 50questions is unethically low for payment, but the AmazonMechanical Turk participants opted in to completing thesurvey.
Not only is there minimal risk involved in the experiment,the potential benefits seem to outweigh any potential con-sequences.
5.1.3 PhasesAs briefly mentioned in Section 4, our experiment was
launched in multiple phases. Phase 0, which acted as a“sanity check,” consisted entirely of greyscale images. Thisphase served as our sanity check to make sure that we couldget sensible results from crowdsourcing on Amazon Mechan-ical Turk. Phase 1 consisted of images that varied in textand background colors on a single axis. We varied just L ona CIEL*c*h scale. This served as a secondary sanity check,as well as confirmation that we could combine the resultsfrom Phase 0 using the “sign post” scaling method that isdiscussed in Section 5.3.1. Content with our results fromPhase 0 and Phase 1, we launched Phase 2, which con-sisted of 900 randomly generated images that varied in coloron the RGB scale.
In total, data was collected from 5682 participants over312,129 pairwise comparisons.
5.1.4 Data StorageData was stored in a MySQL database located on a vir-
tual machine. Data access and manipulation was managedthrough models in the Ruby on Rails web framework. Af-ter surveys were completed, a script was run to export thedata as CSV, so that it could be imported into MATLABfor analysis [10].
5.2 Data AnalysisWe first processed the data collected from Amazon Me-
chanical Turk using MATLAB, then use machine learningsoftware to extract features and build a regression model.
5.2.1 MLDSWe accomplished preliminary data analysis in MATLAB
using an algorithm called MLDS (Maximum Likelihood Dif-ference Scaling) to convert binary comparisons to a rank-ing on a linear scale such that every image was assigned areadability score. MLDS assumed that each image could bemapped to a point on a one dimensional continuum by someprobability. Images that were close in ranking could getconfused in terms of readability, whereas objects that were
0 0.1 0.2 0.3 0.4 0.5 0.6 0.7 0.8 0.9 10
0.1
0.2
0.3
0.4
0.5
0.6
0.7
0.8
0.9
1
Actual
Sim
ulat
ed fr
om M
LDS
v1: Predictions versus data
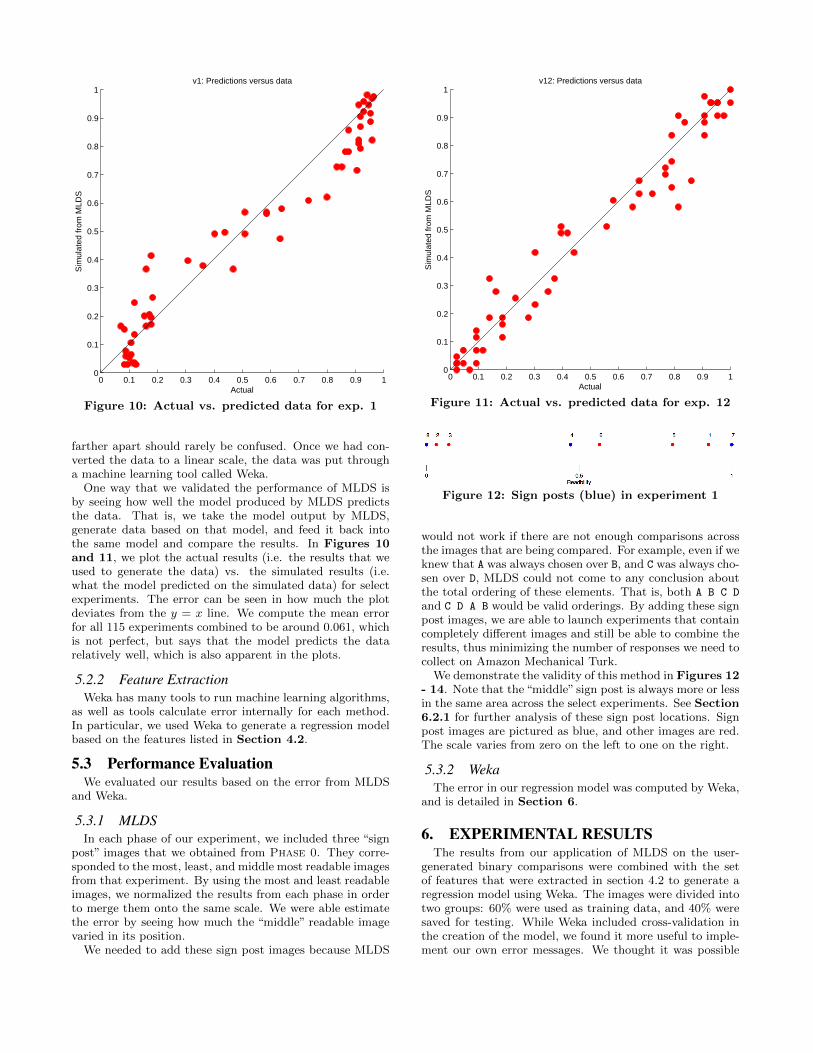
Figure 10: Actual vs. predicted data for exp. 1
farther apart should rarely be confused. Once we had con-verted the data to a linear scale, the data was put througha machine learning tool called Weka.
One way that we validated the performance of MLDS isby seeing how well the model produced by MLDS predictsthe data. That is, we take the model output by MLDS,generate data based on that model, and feed it back intothe same model and compare the results. In Figures 10and 11, we plot the actual results (i.e. the results that weused to generate the data) vs. the simulated results (i.e.what the model predicted on the simulated data) for selectexperiments. The error can be seen in how much the plotdeviates from the y = x line. We compute the mean errorfor all 115 experiments combined to be around 0.061, whichis not perfect, but says that the model predicts the datarelatively well, which is also apparent in the plots.
5.2.2 Feature ExtractionWeka has many tools to run machine learning algorithms,
as well as tools calculate error internally for each method.In particular, we used Weka to generate a regression modelbased on the features listed in Section 4.2.
5.3 Performance EvaluationWe evaluated our results based on the error from MLDS
and Weka.
5.3.1 MLDSIn each phase of our experiment, we included three “sign
post” images that we obtained from Phase 0. They corre-sponded to the most, least, and middle most readable imagesfrom that experiment. By using the most and least readableimages, we normalized the results from each phase in orderto merge them onto the same scale. We were able estimatethe error by seeing how much the “middle” readable imagevaried in its position.
We needed to add these sign post images because MLDS
0 0.1 0.2 0.3 0.4 0.5 0.6 0.7 0.8 0.9 10
0.1
0.2
0.3
0.4
0.5
0.6
0.7
0.8
0.9
1
Actual
Sim
ulat
ed fr
om M
LDS
v12: Predictions versus data
Figure 11: Actual vs. predicted data for exp. 12
Figure 12: Sign posts (blue) in experiment 1
would not work if there are not enough comparisons acrossthe images that are being compared. For example, even if weknew that A was always chosen over B, and C was always cho-sen over D, MLDS could not come to any conclusion aboutthe total ordering of these elements. That is, both A B C D
and C D A B would be valid orderings. By adding these signpost images, we are able to launch experiments that containcompletely different images and still be able to combine theresults, thus minimizing the number of responses we need tocollect on Amazon Mechanical Turk.
We demonstrate the validity of this method in Figures 12- 14. Note that the “middle” sign post is always more or lessin the same area across the select experiments. See Section6.2.1 for further analysis of these sign post locations. Signpost images are pictured as blue, and other images are red.The scale varies from zero on the left to one on the right.
5.3.2 WekaThe error in our regression model was computed by Weka,
and is detailed in Section 6.
6. EXPERIMENTAL RESULTSThe results from our application of MLDS on the user-
generated binary comparisons were combined with the setof features that were extracted in section 4.2 to generate aregression model using Weka. The images were divided intotwo groups: 60% were used as training data, and 40% weresaved for testing. While Weka included cross-validation inthe creation of the model, we found it more useful to imple-ment our own error messages. We thought it was possible

Figure 13: Sign posts (blue) in experiment 12
Figure 14: Sign posts (blue) in experiment 15
for the resulting error to be quite large due to the subjectivenature of readability.
6.1 ModelThe resulting regression model returns a score from about
0 to about 100 quantifying the readability of a colored textand background care. It would have been convenient if thealgorithm would produce results in the exact range 0 to 100.However it is not possible to fix the bounds on the algo-rithm’s output without knowing beforehand what the ab-solute 0 “least readable” and absolute 100 “most readable”combinations are. To approximate the effect, we fixed ourleast and most readable sign post images as 0 and 100. Then,on the rare occasion that there exists a color combinationwhose readability lies outside the bounds of the signposts,its readability value is set artificially to 0 or 100.
Readability score = 1.0 ∗ 10−1 ∗ |∆R|+ 5.7 ∗ 10−1 ∗ |∆G|+ 8.6 ∗ 10−2|∆B| − 1.1 ∗ 10−2 ∗∆B
− 1.1 ∗ 10−3 ∗∆G2 − 1.5 ∗ 10−4 ∗∆B2
− 3.6
Where ∆ is defined as a foreground value minus the cor-responding background value.
There are a few interesting points regarding the algorithm.First, despite the supposed superiority of the CIE family ofcolor models in terms of approximating human perception,no CIE features appear in the resulting algorithm. Second,the value of ∆B is signed. This has the effect of taking colorpolarity into account, which should be expected in a goodmodel because it corresponds to the importance of color po-larity in human perception.
6.2 Error AnalysisError analysis was accomplished through the calculation
of multiple metrics.
6.2.1 Movement of the Middle Sign PostOur first error metric was calculated by determining the
movement of the middle sign post image across MLDS rank-ings. This is relevant because when combining rankingsacross experiments, we had to make the assumption thatthe sign post images were fixed on the scale. Thus, themovement of the middle sign post is indicative of error inMLDS. Error was calculated as follows:
Middle Sign Post Error =
normalized(Phase0 MLDS(mid signpost))−normalized(other MLDS(mid signpost))
Figure 15: Middle sign post error
Figure 15 shows our MLDS error with raking resultsnormalized to a 0 to 100 scale. As can be seen, error on themiddle sign post clusters around 10 in the positive directionwith a standard deviation of 4.61 and mean of 8.54. Thismeans that MLDS frequently skewed upward the ranking ofthe middle sign post image. Since any error from MLDS iscarried over into the model’s error, it is important for us tobe able to track it.
6.2.2 Error in Training DataOur second error metric tracks error between the linear
rankings from MLDS and readability scores produced byour model. Error for each training image was calculated asfollows:
Training Data Error =
normalized(Algorithm score(image))−normalized(MLDS rank(image))
Figure 16 shows the results of the error calculation withrankings and scores normalized to 100. As the algorithmstands, the standard deviation is 17.48 and the mean is 0.
6.2.3 Error in Testing DataThe final error calculation was carried out on testing data
as follows for each test image:
Training Data Error =
normalized(Algorithm score(image))−normalized(MLDS rank(image))
Figure 17 shows the results, from which we can see thatour model does not appear to overfit the data since the trainand test models have a very similar standard deviation of19.94 and mean of 0.3.
6.3 Possible ShortcomingsOne possible issue involves the text we used to create our
survey images. The text across all images was fixed to agiven paragraph from Flatland. There is a chance that read-ability varies with the length of text (i.e. a sentence com-pared to a paragraph or an entire page). There is also apossibility that prior familiarity with the content of the text

Figure 16: Error in training data
Figure 17: Error in testing data
plays a part. The text from Flatland was specifically chosento be out of context as not to bias unfamiliar survey takes.
One clear fault in our algorithm is the high rating of par-ticularly bright high contrast images. This runs counter toour initial assumptions that subjects would rate unattractiveor bright images as less readable.
While as it stands, our model is not perfect, we believethat it is reasonably accurate for the majority of color com-binations. Furthermore, our method creates a means bywhich to modify and improve such algorithms.
6.4 Web ApplicationWe built a simple demo web application using JavaScript.
It is available at http://upenncolortheory.com. The pur-pose of this application is to demonstrate our algorithm inaction. It allows a user to enter background and text col-ors in hexadecimal (the standard for web designers), and itwill show a preview of the color combination and a read-ability score (between 0 and 100) based on our best regres-sion model, as well as what the W3C algorithm says. Forconvenience, we provide a “Random” button that randomlygenerates color combinations and calculates the results.
7. FUTURE WORK
More than just successfully producing a model that pre-dicts colored text readability, we have developed a processto test readability and create models based on other factorssuch as text size, font style (i.e. by proportion or pres-ence/absence of serifs), and spacing. Using this process, wehope to expand our model past color by considering suchother factors as well. While still considering color we canexpand on our color analysis by taking into account multi-ple colored swatches at a time in a way approximating realwebsites more closely. Another topic we can address is color-blindness. It would be more difficult to collect colorblindnessdata via Amazon Mechanical Turk, but the results would beideal to incorporate in real world applications, where color-blindness and accessibility are real issues.
It will also be useful to do research on where users believethe cutoff for readability lies on our scale. We believe colorsscored in the 90s and above are universally readable, but wehave not done any extensive testing to determine a generalconsenus. For now, a user of our algorithm can define hisown cutoff point based on how much he values readability,since readability and aesthetics are sometimes competingforces.
All in all, we expect to implement our algorithm in pro-ducing color swatches, rating existing websites, or modifyingthe presentation existing websites for the user on the fly inorder to make them more readable.
8. CONCLUSIONAlthough our model is not yet perfect, we believe it is a
great first step towards modeling human perception on read-ability using real human data by means of crowdsourcing.In addition to getting sensible results, our data shows thatcrowdsourcing is a workable way to quickly collect qualitydata from real humans, especially when the experimentalinterface to be computer display based. We hope our resultscan benefit designers, businesses, engineers, and the web andmobile space as a whole.
9. REFERENCES[1] Amazon Mechanical Turk.
https://www.mturk.com/mturk/welcome
[2] “CIExy1931 sRGB gamut D65” Image. wikipedia.orgJun. 26, 2007. Apr. 20, 2013.http://en.wikipedia.org/wiki/File:
CIExy1931_sRGB_gamut_D65.png
[3] E. B. Goldstein “Sensation and Perception, 7thedition” Thomson Wadsworth, Belmont, CA, 2007.
[4] F. A. A. Kingdom and N. Prins “Psychophysics”Academic Press, Amsterdam, 2010.
[5] Hall, Richard H. “Color Combinations andReadability”. n.d. Web. 15 Oct. 2012.http://web.mst.edu/~rhall/web_design/color_
readability.html
[6] Hall, Richard H, Hanna, Patrick. “The impact of webpage text-backround colour combinations onreadability, retention, aesthetics and behaviouralintention” Behaviour and Information Technology,May-June 2004, vol. 23, no. 3. PDF.
[7] Hill, Alyson L. “Readability of Websites With VariousForeground/Background Color Combinations, FontTypes And Word Styles”. Department of Psychology,

Stephen F. Austin State University, n.d. Web. 15Oct. 2012. http://www.mmeissner.de/AHNCUR.html
[8] “HSL color solid cylinder alpha lowgamma” Image.wikipedia.org Mar. 22, 2005. Oct. 16, 2012.http://en.wikipedia.org/wiki/File:
HSL_color_solid_cylinder_alpha_lowgamma.png
[9] Legge, Gordon E, Bigelow, Charles A. “Does printsize matter for reading? A review of findings fromvision science and typography.” Jornal of Vision,August 9, 2011, vol. 11 no. 5 article B. PDF.
[10] MATLAB.http://www.mathworks.com/products/matlab/
[11] “RGB color solid cube” Image. wikipedia.org. Jan.12, 2008. Oct. 16, 2012.http://en.wikipedia.org/wiki/File:
RGB_color_solid_cube.png
[12] “The CIE Color Models”. Department of Psychology,Stephen F. Austin State University, n.d. Web. 20Apr. 2013. http://dba.med.sc.edu/price/irf/Adobe_tg/models/cie.html
[13] Weka. http://www.cs.waikato.ac.nz/ml/weka/
[14] Zuffi, Silva, Brambilla, Carla, Beretta, Giordano,Scala, Paolo “Understanding the readability ofcolored text by crowd-sourcing on the Web” HPLaboratories. 2009. PDF. 15 Oct. 2012 http://www.
hpl.hp.com/techreports/2009/HPL-2009-182.pdf
[15] Yong Jian Wang, Michael S. Minor, Jie Wei“Aesthetics and the online shopping environment:Understanding consumer responses” Journal ofRetailing, Volume 87, Issue 1, March 2011, Pages46-58
[16] Abbott, Edwin Abbott. “Flatland: A Romance ofMany Dimensions” New York: Barnes & Noble, 1963.Web. http://www.gutenberg.org/9/97/
[17] Facebook. http://www.facebook.com
[18] Jen-Her Wu, Yufei Yuan, Improving searching andreading performance: the effect of highlighting andtext color coding, Information & Management,Volume 40, Issue 7, August 2003, Pages 617-637http://www.sciencedirect.com/science/article/
pii/S0378720602000915