deterrence in tort and no-fault: the new zealand experience€¦ · deterrence in tort and...
TRANSCRIPT
California Law Review
Volume 73 | Issue 3 Article 12
May 1985
Deterrence in Tort and No-Fault: The NewZealand ExperienceCraig Brown
Follow this and additional works at: http://scholarship.law.berkeley.edu/californialawreview
Link to publisher version (DOI)http://dx.doi.org/https://doi.org/10.15779/Z38ZF11
This Article is brought to you for free and open access by the California Law Review at Berkeley Law Scholarship Repository. It has been accepted forinclusion in California Law Review by an authorized administrator of Berkeley Law Scholarship Repository. For more information, please [email protected].
Recommended CitationCraig Brown, Deterrence in Tort and No-Fault: The New Zealand Experience, 73 Cal. L. Rev. 976 (1985).Available at: http://scholarship.law.berkeley.edu/californialawreview/vol73/iss3/12
Deterrence in Tort and No-Fault:The New Zealand Experience
Craig Brownt
The question of deterrence retains a prominent place in debatesabout the effectiveness of negligence law in attaining socially usefulgoals.' Deterrence has been a key factor in the deliberations of policy-makers considering whether a no-fault insurance system should replaceall or part of an existing tort law system,' particularly in the UnitedStates and Canada.3 According to the traditional view, the threat of aserious financial burden resulting from tort liability serves as an incentivefor potential tortfeasors to avoid injury-causing activities-or at least toconduct such activities with a greater regard for safety.4 Heavily influ-enced by economic theory, commentators more recently have regardedthe deterrent role of negligence law as seeking not the elimination of allinjuries, but an optimum balance between the number of injuries and thesocial benefits of the activities which produce them.5
This economic theory of deterrence depends on the "internaliza-tion" of injury costs. If those participating in a particular activity arecharged with the full cost of the injuries that activity causes, they mustdetermine whether, given the costs, they can afford to continue with theactivity. If the cost is prohibitive, they are forced to cease the activity orseek ways to reduce the cost of the activity (i.e. reduce the number and/or severity of the injuries caused). Consequently, a more efficient alloca-tion of society's resources results.
t Associate Dean and Associate Professor of Law, University of Western Ontario. LL.B.1973, Otago University; LL.M. 1977, University of Illinois. I wish to acknowledge the valuableassistance given me in the preparation of this Article by my colleagues Professors Bruce Feldthusenand John Smillie.
1. For recent articles on the subject, see Fleming, Is There a Future for Tort?, 58 AUSTL. L.J.131 (1984); Klar, New Zealand's Accident Compensation Scheme: A Tort Lawyer's Perspective, 33 U.TORONTO L.. 80 (1983).
2. See, eg., 1 NATIONAL COMM. OF INQUIRY, COMPENSATION AND REHABILITATION IN
AUSTRALIA $% 117-120, at 47-48 (1974).3. See, eg., Report of the Special Committee on Automobile Accident Reparations, 94 REP.
A.B.A. 559, 573 (1969).4. For a detailed discussion of the deterrence goal of tort law, see Williams, The Aims of the
Law of Tort, 4 CURRENT LEGAL PROBS. 137 (1951).5. The most noteworthy of these commentators are G. CALABRESI, THE COSTS OF Acci-
DENTS (1970); Posner, A Theory of Negligence, 1 J. LEGAL STUD. 29 (1972). For a critical survey ofthese and other theorists, see Englard, The System Builders: A Critical Appraisal of Modern Ameri-can Tort Theory, 9 J. LEGAL STUD. 27 (1980).
NEW ZEALAND TORT LAW
In contrast, if the system of cost allocation fails to charge all orsome of the costs to the activity causing them, the activity must be "sub-sidized" by other segments of society. This "subsidy" causes a misalloca-tion of resources. The activity continues without taking its injury costsinto account. Since more of the activity will be conducted than its truecosts warrant, there is an underincentive to reduce accident costs.6 Theeconomic model suggests, for example, that as more of the costs of acci-dents are externalized to the activity of motoring, motoring will increaseat the expense of other, possibly more socially useful, activities.
In the automobile accident context, tort liability can operate simul-taneously both to internalize the costs of motoring and to provide deter-rence incentives (in the traditional sense) to those involved in motoring.In the traditional model of deterrence, those groups thought most likelyto take effective measures to avoid accidents bear the cost. Thus, negli-gent motorists bear the cost of the injuries they cause, just as manufac-turers bear the cost of injuries caused by defective automobiles. Whethernegligence or strict liability controls, the possible tortfeasor has an incen-tive to take cost-justified precautions. In the absence of tort liability, thecosts of injuries to pedestrians or roadside property,7 for example, wouldbe externalized, whereas under a tort regime the motorist bears at leastsome of these costs.
Liability insurance does not undermine the internalizing function oftort law because the costs of accidents, although spread widely, are nev-ertheless borne by motorists as a group. Yet as those advancing thetraditional view admit, insurance surely does have an impact on injury-causing behavior.8 Motorists-sometimes voluntarily, but also oftenunder some form of state compulsion-protect themselves against theworst effects of incurring liability.9 As I have argued elsewhere,10 such
6. See Calabresi, Some Thoughts on Risk Distribution and the Law of Torts, 70 YALE L.J. 499(1961).
7. Whether the costs of an injury to a pedestrian are properly attributable to the activity ofmotoring or walking remains problematical. See J. O'CONNELL, ENDING INSULT TO INJURY: NO-FAULT INSURANCE FOR PRODUCTS AND SERVICES 144 (1975) (quoting R. Roddis, Memorandumto Special Committee to Draft a Uniform Motor Vehicle Accident Reparation Act for the NationalCommission on Uniform State Laws, (June 15, 1972)). Note, however, that a no-fault scheme thatgives pedestrians access to a motorist-funded insurance plan eliminates this externality.
8. See R. KEETON & J. O'CONNELL, BASIC PROTECTION FOR THE TRAFFIC VICTIM 252-56(1965); Atiyah, Accident Prevention and Variable Premium Rates for Work-Connected Accidents (pts.1 & 2), 4 INDUS. L.J. (U.K.) 1, 89 (1975); Englard, supra note 5, at 46; Fleming, The Role ofNegligence in Modern Tort Law, 53 VA. L. REv. 815, 823-25 (1967).
9. Incentives in the form of premium adjustments based on driving records may remain.However, such incentives would have much less deterrent effect than uninsured liability. Moreover,liability insurance rates may reflect costs for accidents caused by defective automobiles, and individ-ual drivers will not be "deterred" by paying higher insurance rates for vehicle defects which theycannot, in all probability, discover and correct.
10. Brown, Deterrence and Accident Compensation Schemes, 17 U.W. ONT. L. REv. 111(1978-79).
CALIFORNIA LAW REVIEW
protection weakens the deterrent effect of negligence law, at least as con-cerns automobile accidents.
Despite the protection provided by liability insurance, the deterrenteffect of negligence law remains strong outside the context of motoring.For example, in products liability or medical malpractice cases, findingsof liability may carry sanctions beyond any damage award, such asadverse publicity. In addition, different types of accident cases may cre-ate different opportunities for insurers to provide incentives thatencourage their policyholders to take safety precautions. For example, inthe industrial sphere, an insurer can inspect for hazards and use thatinformation as a basis for deciding whether to accept an employer's lia-bility risk and as a basis for setting premiums. Alternatively, an insurercan establish a system of experience rating and provide for penalties orbonuses. 1
In the area of automobile accidents, 2 on the other hand, a differentset of factors alters the deterrence model. For example, motoring may beso important to people that they would be prepared to incur even sub-stantially higher costs before abandoning the activity, hence castingdoubt on the notion that internalization of costs would force significantchanges in driving habits. Accident-producing behavior carries a sub-stantial risk of injury to the potential tortfeasor himself. Dangerous con-duct commonly constitutes a criminal offense.' If a motorist isundeterred by the threat of injury to himself and the threat of penal sanc-tions, 4 he will be unlikely to be deterred by the possibility of tort liabil-ity, particularly if an insurer will absorb the worst consequences.Finally, in a world where traffic accidents have become commonplace,and where moral blame rarely follows,'" the prospect of adverse publicityattaching to a mere finding of negligence constitutes an acutely impotentsanction, particularly when an insurance company will most likely
11. Because of administrative costs, such ratings are useful for only some types of liabilityinsurance. For example, employer liability insurance has successfully utilized a rating system. Thismight be due either to the availability of relatively complete records or to safeguards such as rigor-ous inspection procedures. On the other hand, the high administrative costs involved in implement-ing a truly personalized system of premium rating in automobile insurance militate against its use.See Brown, supra note 10, at 120; Johnson & Flanigan, The Outlook for Insurance Rates Based onDriving Records, 1975 INS. L.J. 35.
12. This excludes accidents involving defective automobiles which belong under the productsliability analysis mentioned above.
13. In this regard, one commentator has written of the "partnership" between tort law andcriminal law. See A. LINDEN, CANADIAN NEGLIGENCE LAW 480 (1972).
14. Sanctions may include loss of driving privileges.
15. See REPORT OF THE ROYAL COMMISSION ON CIVIL LIABILITY AND COMPENSATION FOR
PERSONAL INJURY 210-11 (1978) [hereinafter cited as PEARSON REPORT]; see also ROYAL COMM'NOF INQUIRY, COMPENSATION FOR PERSONAL INJURY IN NEW ZEALAND 89 (1967) [hereinaftercited as WOODHOUSE REPORT].
(Vol. 73:976

NEW ZEALAND TORT LAW
defend (and settle)16 the action.These observations lead naturally to the conclusion that deterrence
should play a minor role in determining whether to abolish or modifytort law and replace it with a no-fault compensation system. Incentivesfor safer conduct should be left to criminal sanctions or administrativecontrol 17 or perhaps should be pursued within the injury compensationsystem through experience rating."8 Insofar as tort law deters throughadverse publicity or education, the same benefits could be achievedthrough other means. 9
Over the past ten years, much of the discussion about the merits ofno-fault compensation has focused on the system adopted in New Zea-land.20 There are a number of reasons why this plan has attracted somuch attention. First, the system comprehensively covers all personalinjury caused by accident-whether on the road, at work, in the home, orelsewhere. Second, a government corporation provides the benefits,which are funded in such a way as to create significant externalities.Third, the system has completely replaced the common law action forpersonal injury caused by accident.2"
These facts make it interesting to compare accident compensation inNew Zealand with other common law jurisdictions that retain traditionaltort actions for most personal injury cases. 2 In the same vein, compar-ing automobile accidents in New Zealand before 1974 with those after1974, when the common law action was replaced, might furnish someuseful insight into the two competing systems.23 In this Article, I propose
16. As to the high percentage of cases settled in the United Kingdom, see PEARSON REPORT,
supra note 15, at 25.17. Under New Zealand's Accident Compensation Scheme, safety is handled by an extensive
program of education, research, and related efforts. See Brown, supra note 10, at 138.18. Monroe Berkowitz has recommended such a rating system for work accidents. M.
BERKOWITZ, THE ECONOMICS OF WORK ACCIDENTS IN NEW ZEALAND 195-98 (1979). But see
supra note 11.19. See Brown, supra note 10, at 121-22; cf. Fleming, supra note 1, at 133-35.20. Resembling in its general philosophy the WOODHOUSE REPORT, supra note 15, New Zea-
land's controversial system was implemented in 1974 by the Accident Compensation Act of 1972,[1972] 1 N.Z. Stat. 521. The legislation and subsequent amendments have been consolidated andreprinted as Accident Compensation Act 1982, [1982] 3 N.Z. Stat. 1552. The general features ofaccident compensation in New Zealand since the passage of the Accident Compensation Act of 1972are discussed in A. BLAIR, ACCIDENT COMPENSATION IN NEW ZEALAND (1978); J. FAHY, ACCI-DENT COMPENSATION COVERAGE: THE ADMINISTRATION OF THE ACCIDENT COMPENSATION
ACT 1972 (6th ed. 1982); and T. ISON, ACCIDENT COMPENSATION: A COMMENTARY ON THE NEW
ZEALAND SCHEME (1980).21. Accident Compensation Act 1982, § 27, [1982] 3 N.Z. Stat. 1552, 1578.22. The comparison is valuable even though some of these common law jurisdictions have
adopted no-fault schemes for work accidents.23. Indeed, several empirical studies have suggested that, at least in the area of automobile
accidents, the curtailment of tort rights in favor of a no-fault system for personal injuries has had ademonstrably adverse effect on accident rates. See, eg., Grayston, Deterrence in Automobile Liabil-ity Insurance-The Empirical Evidence, 40 INS. COUNS. J. 117 (1973); Landes, Insurance, Liability,
1985]
CALIFORNIA LAW REVIEW
to determine, based on the available data about accident trends, whetherany significant changes in driving habits have occurred since the intro-duction of the no-fault system in New Zealand. If, for a given categoryof accidents, no significant changes occurred after 1974, it might suggestthat the abolition of tort rights and the externalization of some accidentcosts did not affect motorist behavior.24 In turn, such a finding wouldcall into question the deterrence rationale of a system based on tortrights. On the other hand, an increase in accidents would suggest thatthe existence of tort rights served to deter accident-causing behavior onthe part of motorists.
Of the various categories of tort liability, the only one for whichvalid statistics are available is automobile accidents.25 The basis for col-lecting information in that area has remained largely the same through-out the period under study. This comparison between the pre-1974system based upon tort rights and the post-1974 system based upon a no-fault concept is therefore drawn only from the data concerning automo-bile accidents.
INEW ZEALAND INJURY COMPENSATION-
THE Two SYSTEMS
To analyze accurately the information on automobile accidenttrends in New Zealand, one must first understand the injury compensa-tion systems prevailing before and after 1974.
A. The Pre-1974 Tort System
Before 1974, a person injured in a motor vehicle accident had a rightof action against any person who had negligently or intentionally causedthe injury. The standard for liability, failure to exercise reasonable care,broadly paralleled that which now applies in most North American juris-dictions. In those cases that proceeded to trial, a jury most often heardthe dispute. Juries awarded damages for both economic and nonpecu-niary loss, although the amounts awarded for nonpecuniary losses were
and Accidents: A Theoretical and Empirical Investigation of the Effect of No Fault Accidents, 25J.L. & ECON. 49 (1982).
24. See infra notes 57-68 and accompanying text for a discussion of factors other than theabolition of tort rights that might have also affected accident rates.
25. It was not possible, for a variety of reasons, to extend the analysis to tort liability otherthan that arising from automobile accidents. For products liability, for example, no information wasavailable; there are no systematic records documenting injuries arising from defects in products,either before or after 1974. Nor were records concerning the incidence of injuries stemming frommedical malpractice kept before 1974. Finally, although there are some data on the number andkinds of industrial injuries both before and after 1974, no useful comparisons can be drawn becausethe basis for reporting such injuries changed with the introduction of accident compensation.
[Vol. 73:976

NEW ZEALAND TORT LAW
significantly lower than those common in the United States at the time.2 6
Presumably, this system represented some degree of internalizationof the accident costs attributable to motoring. Motorists' insurance paidfor damages arising from both wage loss and nonpecuniary loss. Eventhen, however, considerable externalities existed. In addition to heavilysubsidizing medical expenses (particularly hospital and pharmaceuticalcosts), the social security system provided unemployment benefits tothose too severely injured to work. Consequently, where victims, them-selves "internal" participants in the activity of motoring, had no tortclaim, many of their accident costs were externalized. 27 Furthermore,victims who suffered their injuries "in the course of employment" andwho were unable to sue a tortfeasor were entitled to workers' compensa-tion benefits.
Regarding individual incentives, two special characteristics of thesystem are of particular relevance. First, New Zealand law embraced aform of comparative negligence. 28 The contributory negligence of theplaintiff did not defeat his claim completely'; it merely resulted in a pro-portionate reduction in the damages awarded. If the tort system didoperate as an incentive for individuals to take greater care, the fact thatcontributory negligence no longer acted as a complete bar to recoverywould tend to strengthen its deterrent effect, since the chance of a poten-tial tortfeasor escaping liability completely would be greatly reduced.Second, New Zealand required motorists to carry compulsory liabilityinsurance, with unlimited coverage, against claims for personal injury ordeath.29 As previously discussed, this requirement would tend to reducethe force of the incentive represented by the threat of tort liability.30 Lia-bility insurance for property damage, however, was entirely optional.
Insurers also operated a system of "no claims" bonuses for bothproperty and comprehensive coverage. If the motorist made no claimsduring the year against any part of his policy, the motorist's premium forthe following year was reduced by a substantial margin.31 Even where
26. See Franklin, Personal Injury Accidents in New Zealand and the United States: Some Strik-
ing Similarities, 27 STAN. L. REv. 653, 667 n.90 (1975).27. In theory at least, the collateral benefit rule meant that tort damages, when available, could
not generally be adjusted on account of welfare payments. The cost of motoring would therefore
continue to reflect these costs in such cases.
28. Given effect by the Contributory Negligence Act 1942, [1942] 2 N.Z. Stat. 29, the doctrine
was, ironically, called "Contributory Negligence."
29. Transport Act 1962, § 79, [1962] 2 N.Z. Stat. 919, 975-76. A limit was subsequently
placed, however, on liability for injuries to guests and paying passengers. Transport AmendmentAct 1963, § 5, [1963] 1 N.Z. Stat. 542, 544-46.
30. Where accidents involved only property damage, claims would be settled by insurers either
by waiving subrogation rights, or by obtaining recovery from the driver at fault. In addition, the
administrative agency that set premiums made no provision for experience rating.
31. By avoiding damage both to his own vehicle and that payable to a third party, a driver
1985]
CALIFORNIA LAW REVIEW
there was a claim against the insured for property damage, the bonusremained if another party was at fault.32 Thus, the tort-insurance systemprovided a direct incentive to avoid accidents: if an insured driverincurred no liability during the previous year, he would save substan-tially on insurance premiums. The effect of this incentive remains uncer-tain, however. Insurers often made the determinations of faultinformally, without regard to the civil law negligence standard, insteadcomparing the established facts with the quasi-criminal traffic laws.33
Under this informal standard, it was possible that a motorist who hadnot been at fault in the traditional sense (e.g., because he did not causethe accident) could still lose his bonus if the insurer judged him at fault(e.g., because the motorist had been speeding). 34 Nevertheless, the no-claim bonus mechanism did serve some deterrent function. Its existencemeant that a motorist who damaged the property of a third party whilebreaching a traffic regulation faced an additional "fine."' 35 In this way,the tort system bolstered the regulatory system. The existence of no-claim bonuses remains an important factor today, since the AccidentCompensation Act only abolished tort rights for accidental personalinjury or death,36 and not for property damage. Thus, the no-claim bonussystem should still play a significant role in our comparison between thepre- and post-1974 regimes.
B. The Post-1974 No-Fault System
In 1974, New Zealand implemented the Accident CompensationAct. This system has been described in depth elsewhere, 37 and a sum-mary of its provisions relating to motor vehicle accidents will prove suffi-cient for our purposes. A person injured (or the dependents of a personkilled) in an automobile accident may no longer bring a tort action fordamages even if another person caused the accident. Instead, a victim,
could earn a bonus up to 40% of the previous year's premium (depending on his age and previousrecord).
32. This information was provided by the S.I.M.U. Insurance Office in Dunedin, New Zealand.33. This information also came from the S.I.M.U. Insurance Office.34. For a discussion of the lack of correlation between violations of traffic laws and accident-
causing behavior, see Cramton, Driver Behavior and Legal Sanctions: A Study of Deterrence, 67MICH. L. REV. 421, 435 (1969).
35. Inasmuch as drivers at fault are often not convicted-or for that matter, even prosecuted-this might prove the only "fine" in some cases.
36. See supra text accompanying note 20. Some tort actions, such as one involving punitivedamages for abuse of official authority, appear to have survived. See G. PALMER, COMPENSATIONFOR INCAPACITY 271-78 (1979).
37. See, e.g., G. PALMER, supra note 36; see also Dahl, Injury Compensation for Everyone?-The New Zealand Experience, 53 J. URa. L. 925 (1976); Harris, Accident Compensation in NewZealand: A Comprehensive Insurance System, 37 MOD. L. REV. 361 (1974); Palmer & Lemons,Toward the Disappearance of Tort Law-New Zealand's New Compensation Plan, 1972 U. ILL. L.F.693.
[Vol. 73:976

NEW ZEALAND TORT LAW
whether at fault or not, must apply to a government body, the AccidentCompensation Corporation, for compensation. The Corporation pro-vides virtually all medical, rehabilitation and funeral expenses, plusincome replacement equal to eighty percent of the income actually lost.38
In addition, an amount of nonpecuniary compensation (modest by tortstandards) is available for physical disability, loss of enjoyment of lifeand pain and suffering.
Prior to 1982, the funding of compensation for motor accident vic-tims came from two sources. If the victim happened to be an earner andwas injured in the course of employment, his compensation was paidfrom a fund financed by levies paid by employers and self-employed peo-ple. For all other victims, the money came from the motor vehicle fundpaid for mostly by owners of vehicles as part of the annual registrationfee and, to a small extent, by owners as part of their license fee.39 Thisfunding system meant that some of the accident costs of motoring, previ-ously internalized to that activity, were externalized. Prior to the imple-mentation of the accident compensation scheme, people injured in motoraccidents while working could recover damages in tort from any othermotorist at fault notwithstanding that they could have claimed insteadunder the then-existing workers' compensation plan. The accident costsrepresented by such damages were therefore borne by the automobile lia-bility insurers (and thereby internalized to the activity of motoring).Under accident compensation, until 1982, such costs were borne byemployers and the self-employed.
An indication of the extent of this externalization is provided by therates charged to motorists over the relevant period. From 1974 to 1983,a period of high inflation in New Zealand, the levy on automobile ownersremained relatively stable. Over that time it increased from $11.35 peryear to only $14.20. In 1982, effectively the end of the period understudy in this paper, the funding basis was changed so that all automobileinjuries were compensated from the motor vehicle fund.' One result ofthis change was a fifty percent increase in the levy rates in 1984.4'
A further relevant point concerning funding is that, although thereis statutory authority for individual motorists to be variably rated
38. This remedy is limited to a maximum of $700 per week (as of June 1984). This compares
favorably with the average New Zealand weekly income of between $200 and $300 per week.
39. As of June 1984, the amount of accident levy was $21.55 for the owner of a private auto-mobile, Otago Daily Times, May 17, 1984, and the amount levied against each driver's license feewas $2.
40. The initial funding provisions may be found in Accident Compensation Act 1972,
§ 97(2)(b), [1972] 1 N.Z. Stat. 521, 609; id., § 33, [1972] 1 N.Z. Stat. at 550. The new fundingprovision is contained in Accident Compensation Act 1982, § 19(2)(b), [1982] 3 N.Z. Stat. 1552,1575-76.
41. See supra note 39.
1985]

CALIFORNIA LAW REVIEW
according to accident experience,42 this has never been done.
In considering, both the pre- and post-1974 periods, one mustremember that a sophisticated system of traffic regulations and policingwas continuously in effect.43 This regulatory system is an important fac-tor in any deliberations about accident trends-particularly wherechanges in rules or requirements have occurred.
IISTATISTICAL COMPARISON OF AUTOMOBILE ACCIDENTS
UNDER THE TORT AND NO-FAULT SYSTEMS
The following statistical information comes from official, publishedsources. In many cases, figures were only available up to 1981 or 1982.This analysis, therefore, compares (1) the eight- or ten-year period priorto 1974 and (2) the period from 1974 to 1980 or 1981.
Initially, we must determine whether the externalization of a signifi-cant proportion of the accident costs attributable to motoring has hadany impact on the system. According to economic theory, a decrease inmotoring costs should produce an increase in motoring. Additionally, adecrease in the "insurance." portion of the cost of owning an automobileshould produce an increase in the number of automobile owners. Table Isets out the number of registered motor vehicles per capita in New Zea-land for the years 1964 through 1980.
Table L Registered Motor Vehicles per Head of Population.44
TABLE 1
Year Ratio Year Ratio Year Ratio
1964 0.37 1970 0.42 1976 0.521965 0.38 1971 0.44 1977 0.521966 0.39 1972 0.45 1978 0.531967 0.39 1973 0.48 1979 0.551968 0.40 1974 0.49 1980 0.561969 0.41 1975 0.50
Figure 1 sets out the same information in graph form.
42. Accident Compensation Act 1982, § 49(d), 1982 [3] N.Z. Stat. 1552, 1604; Accident Com-pensation Act 1972, § 100(d), 1972 [1] N.Z. Stat. 521, 612.
43. I have tried to keep this in mind during my analysis; I have noted important developmentsin the regulatory system, and have tried to incorporate them into my calculations.
44. Source: NEW ZEALAND MINISTRY OF TRANSPORT, MOTOR ACCIDENTS IN NEWZEALAND, STATISTICAL STATEMENT 8 (1982).
[Vol. 73:976
NEW ZEALAND TORT LAW
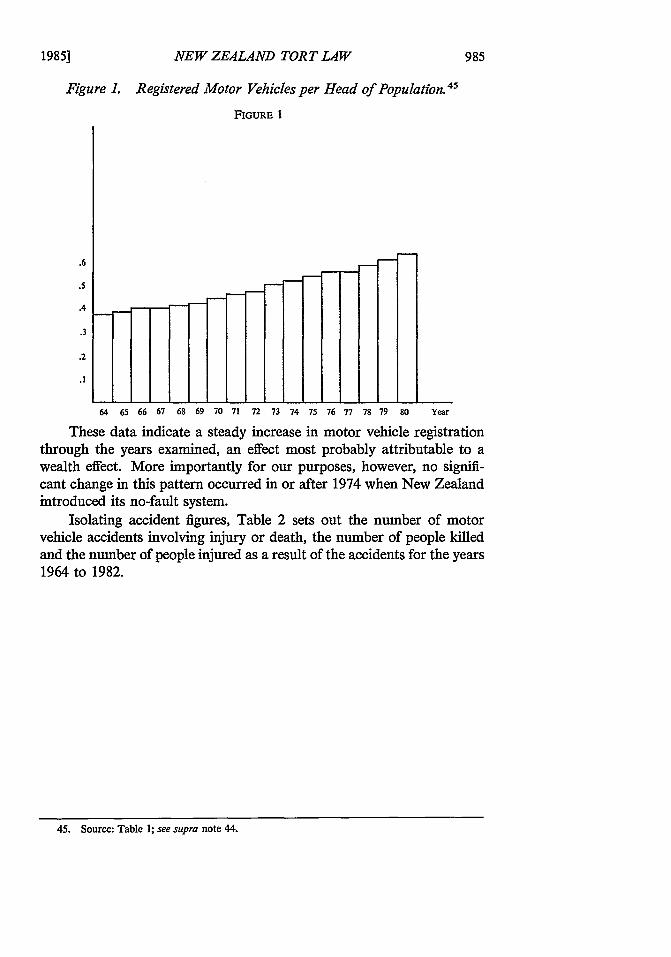
Figure 1. Registered Motor Vehicles per Head of Population.45
FIGURE 1
.6
.5
.4
.3
.2
64 65 66 67 68 69 70 71 72 73 74 75 76 77 78 79 80 Year
These data indicate a steady increase in motor vehicle registrationthrough the years examined, an effect most probably attributable to awealth effect. More importantly for our purposes, however, no signifi-cant change in this pattern occurred in or after 1974 when New Zealandintroduced its no-fault system.
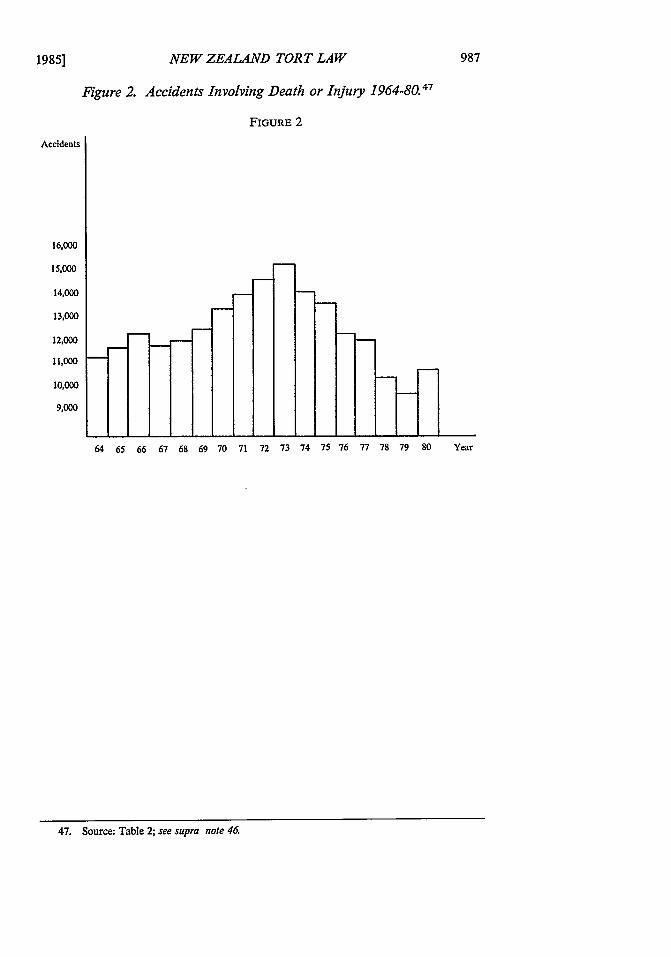
Isolating accident figures, Table 2 sets out the number of motorvehicle accidents involving injury or death, the number of people killedand the number of people injured as a result of the accidents for the years1964 to 1982.
45. Source: Table 1; see supra note 44.
1985]
CALIFORNIA LAW REVIEW
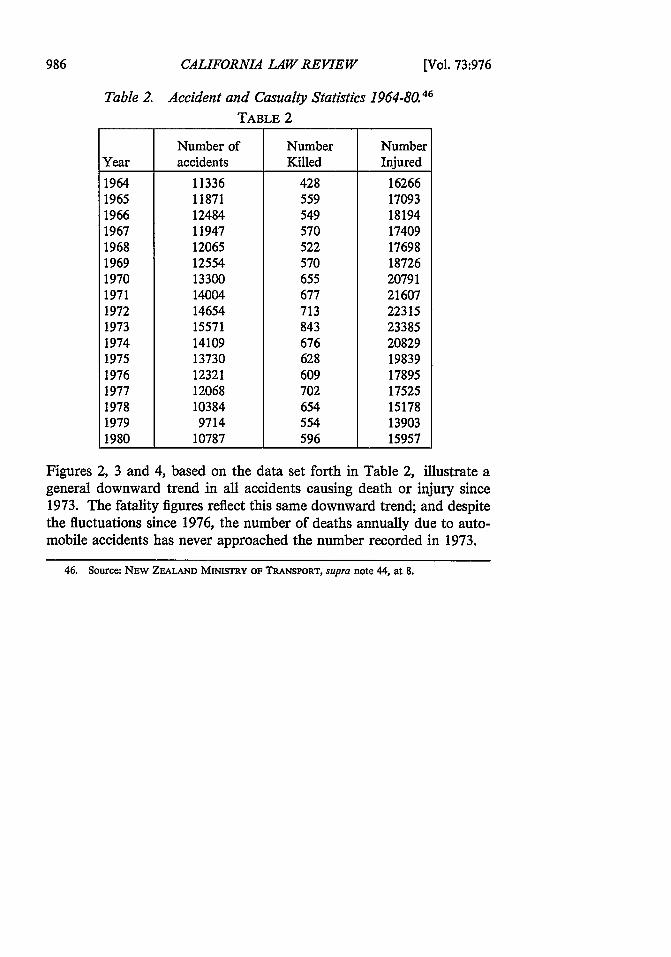
Table 2. Accident and Casualty Statistics 1964-80.46
TABLE 2
Number of Number NumberYear accidents Killed Injured
1964 11336 428 162661965 11871 559 170931966 12484 549 181941967 11947 570 174091968 12065 522 176981969 12554 570 187261970 13300 655 207911971 14004 677 216071972 14654 713 223151973 15571 843 233851974 14109 676 208291975 13730 628 198391976 12321 609 178951977 12068 702 175251978 10384 654 151781979 9714 554 139031980 10787 596 15957
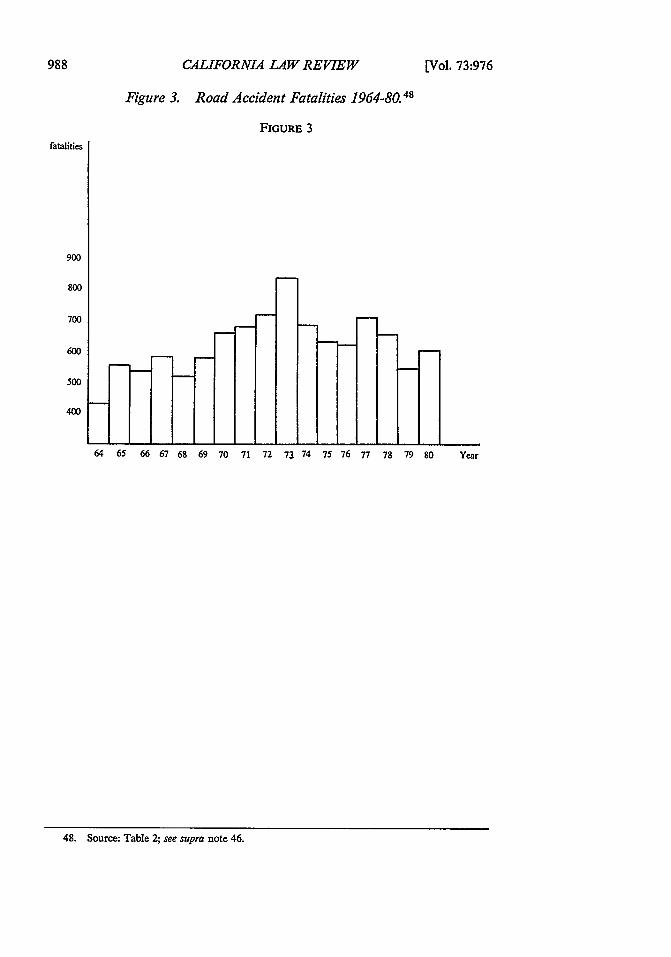
Figures 2, 3 and 4, based on the data set forth in Table 2, illustrate ageneral downward trend in all accidents causing death or injury since1973. The fatality figures reflect this same downward trend; and despitethe fluctuations since 1976, the number of deaths annually due to auto-mobile accidents has never approached the number recorded in 1973.
46. Source: NEW ZEALAND MINISTRY OF TRANSPORT, supra note 44, at 8.
[Vol. 73:976
1985] NEW ZEALAND TORT LAW 987
Figure 2. Accidents Involving Death or Injury 1964-80.'7
FIGURE 2
Accidents
16,000
15,000
14,000
13,000
12,00
11,000
10,000
9,000
64 65 66 67 68 69 70 71 72 73 74 75 76 77 78 79 80 Year
47. Source: Table 2; see supra note 46.
988
ftatities
900
800
700
600
500
400
CALIFORNIA LAW REVIEW
Figure 3. Road Accident Fatalities 1964-8. 48
FIGURE 3
[Vol. 73:976
64 65 66 67 68 69 70 71 72 73 74 75 76 77 78 79 80 Year
48. Source: Table 2; see supra note 46.

NEW ZEALAND TORT LAW
Injuries24,000
23,000
22,000
21,000
20,000
19,000
18,000
17,000
16,000
15,000
14,000
Figure 4. Road Accident Injuries 1964-80.49
FIGURE 4
64 65 66 67 68 69 70 71 72 73 74 75 76 77 78 79 80 Year
Several factors combine to explain this general decline in the abso-lute number of accidents, injuries, and deaths since the 1973 peak. Inas-much as all of its oil supplies were imported at the time, New Zealandwas particularly hard hit by the 1974 world oil crisis. The crisis caused adramatic increase in the price of gasoline which, predictably, led to lowerconsumption and less motoring. In addition, as a fuel conservation mea-sure, the government reduced the open-road speed limit from fifty-fivemiles per hour to fifty miles per hour. This reduction alone may haveresulted in fewer accidents. The government later adopted additionalconservation measures. For example, gasoline sales on weekends wereprohibited from February 27, 1979 to August 29, 1980. Furthermore,automobiles could not be operated on one day per week 0 from July 1,1979 to May 13, 1980. These measures produced a reduction in totalmiles driven, which the accident figures and particularly the fatalityfigures reflect.
The following table sets out the estimated annual distance travelled
49. Source: Table 2; see supra note 46.50. The owner picked the day of the week, which was then identified by a colored sticker.
1985]
CALIFORNIA LAW REVIEW
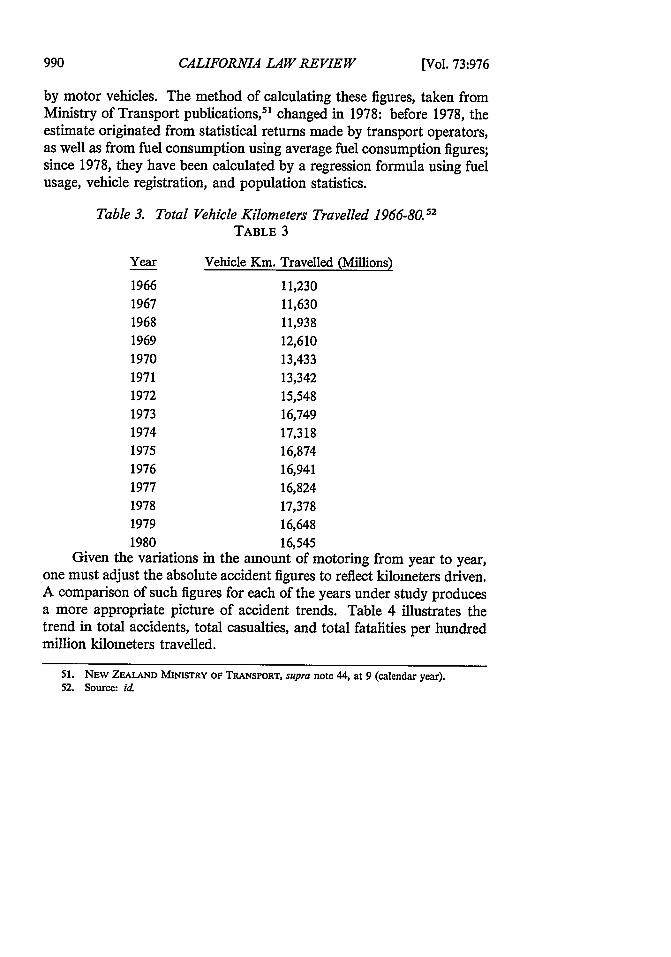
by motor vehicles. The method of calculating these figures, taken fromMinistry of Transport publications,51 changed in 1978: before 1978, theestimate originated from statistical returns made by transport operators,as well as from fuel consumption using average fuel consumption figures;since 1978, they have been calculated by a regression formula using fuelusage, vehicle registration, and population statistics.
Table 3. Total Vehicle Kilometers Travelled 1966-80. 52TABLE 3
Year Vehicle Kn. Travelled (Millions)
1966 11,2301967 11,6301968 11,9381969 12,6101970 13,4331971 13,3421972 15,5481973 16,7491974 17,3181975 16,8741976 16,9411977 16,8241978 17,3781979 16,6481980 16,545
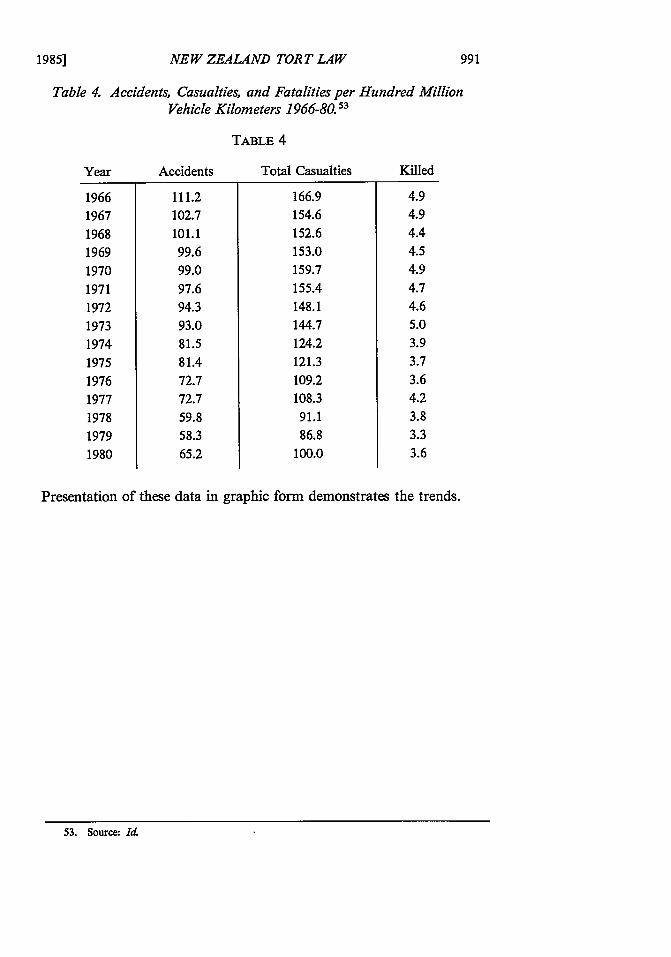
Given the variations in the amount of motoring from year to year,one must adjust the absolute accident figures to reflect kilometers driven.A comparison of such figures for each of the years under study producesa more appropriate picture of accident trends. Table 4 illustrates thetrend in total accidents, total casualties, and total fatalities per hundredmillion kilometers travelled.
51. NEw ZEALAND MINISTRY OF TRANSPORT, supra note 44, at 9 (calendar year).52. Source: ia
[Vol. 73:976
NEW ZEALAND TORT LAW
Table 4. Accidents, Casualties, and Fatalities per Hundred MillionVehicle Kilometers 1966-80. 13
TABLE 4
Year Accidents Total Casualties Killed
111.2102.7101.199.699.097.694.393.081.581.472.772.759.858.365.2
166.9 4.9154.6 4.9
152.6 4.4153.0 4.5
159.7 4.9155.4 4.7148.1 4.6
144.7 5.0
124.2 3.9121.3 3.7
109.2 3.6
108.3 4.2
91.1 3.886.8 3.3
100.0 3.6
Presentation of these data in graphic form demonstrates the trends.
53. Source: Id.
19661967
19681969197019711972197319741975
19761977197819791980
1985]
992 CALIFORNIA LAW REVIEW [Vol. 73:976
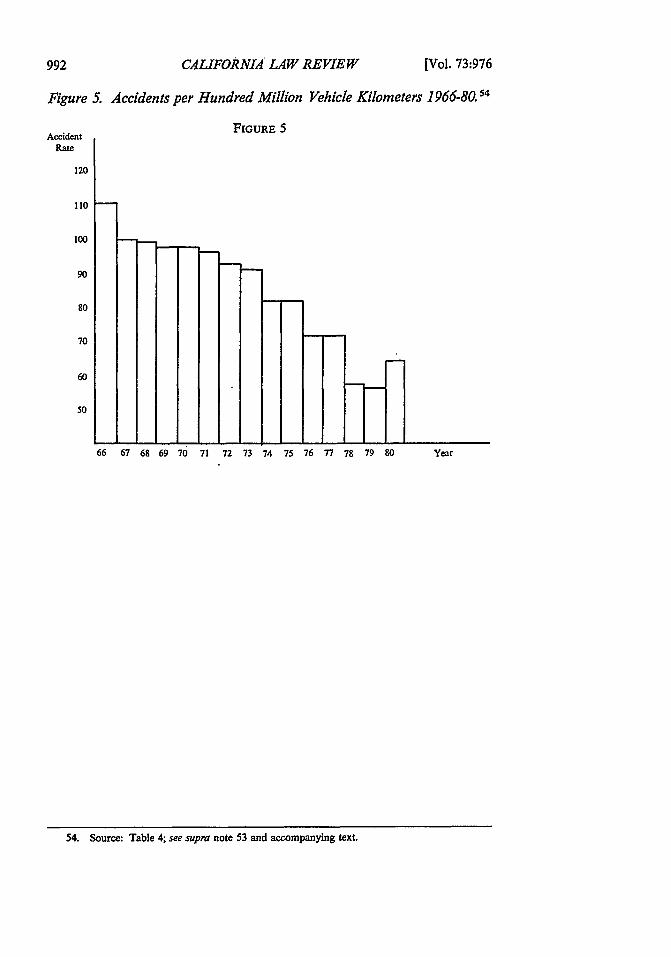
Figure 5. Accidents per Hundred Million Vehicle Kilometers 1966-80. 5
FIGURE 5Accident
Rate
120
110
100
90
go
70
60
50
66 67 68 69 170 71 72 73 74 75 76 77 78 79 80 Year
54. Source: Table 4; see supra note 53 and accompanying text.
1985] NEW ZEALAND TORT LAW 993
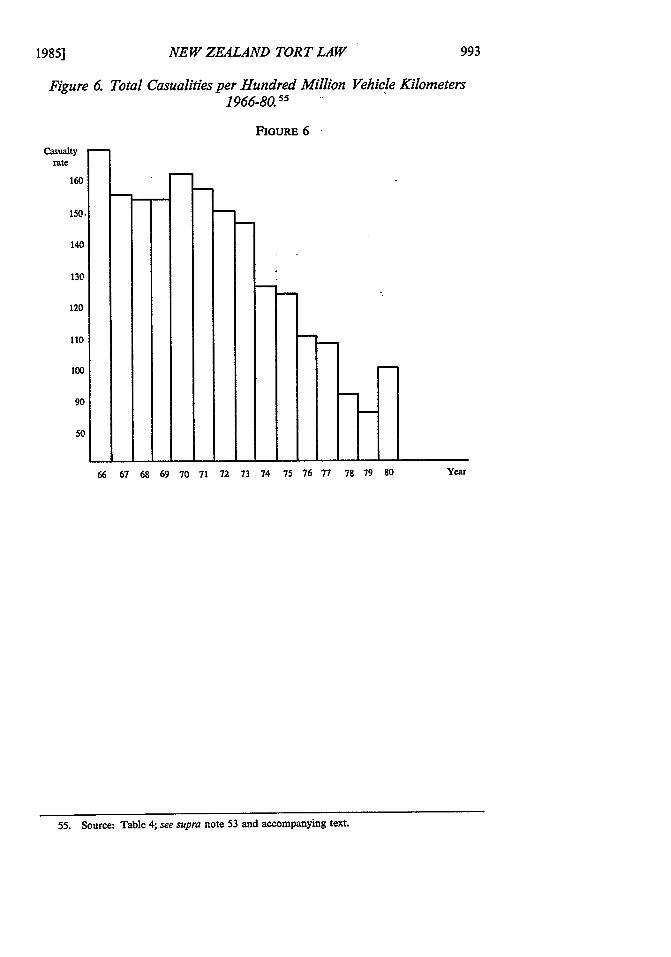
Figure 6. Total Casualities per Hundred Million Vehicle Kilometers1966-80.55
FIGURE 6
Casualtyrate
16011__
66 67 68 69 70 71 72 73 74 75 76 77 78 79 80 Year
55. Source: Table 4; see supra note 53 and accompanying text.
CALIFORNIA LAW REVIEW
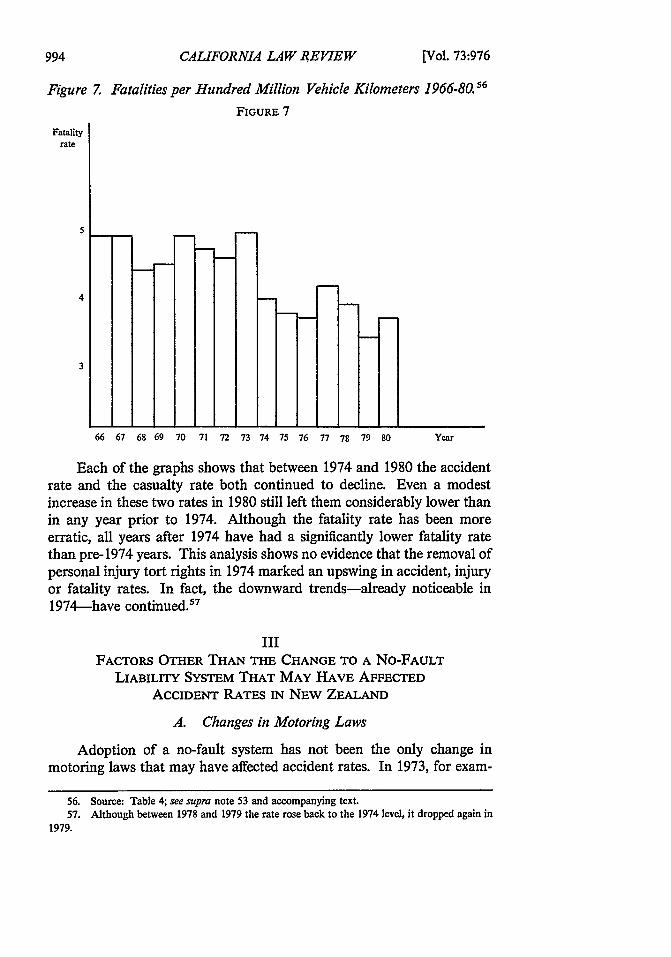
Figure 7. Fatalities per Hundred Million Vehicle Kilometers 1966-80.56
FIGURE 7
Fatalityrate
5
4
3
66 67 68 69 70 71 72 73 74 75 76 77 78 79 80 Year
Each of the graphs shows that between 1974 and 1980 the accidentrate and the casualty rate both continued to decline. Even a modestincrease in these two rates in 1980 still left them considerably lower thanin any year prior to 1974. Although the fatality rate has been moreerratic, all years after 1974 have had a significantly lower fatality ratethan pre-1974 years. This analysis shows no evidence that the removal ofpersonal injury tort rights in 1974 marked an upswing in accident, injuryor fatality rates. In fact, the downward trends-already noticeable in1974--have continued.57
IIIFACTORS OTHER THAN THE CHANGE TO A No-FAULT
LIABILITY SYSTEM THAT MAY HAVE AFFECTEDACCIDENT RATES IN NEW ZEALAND
A. Changes in Motoring Laws
Adoption of a no-fault system has not been the only change inmotoring laws that may have affected accident rates. In 1973, for exam-
56. Source: Table 4; see supra note 53 and accompanying text.57. Although between 1978 and 1979 the rate rose back to the 1974 level, it dropped again in
1979.
[Vol. 73:976
NEW ZEALAND TORT LAW
pie, the open-road speed limit was reduced to fifty miles per hour. 8 Thatsame year safety helmets became compulsory for motorcyclists and pas-sengers, at all speeds. 9 Previously, they had been compulsory only if thevehicle was travelling in excess of thirty miles per hour. In 1972, thegovernment introduced compulsory fitting and wearing of safety belts fordrivers of, and front seat passengers in, most classes of vehicles registeredsince 1965. 60 In 1975, the government extended these seat belt require-ments to motor vehicles registered on or after January 1, 1955,61 and, in1979, to cover all persons over seven years of age.62 In 1977, a new set oftraffic regulations took effect.63 These regulations included new rulesdealing with the right of way at intersections as well as measuresdesigned to clarify the obligations of drivers and others. Another regula-tion enacted in 1977 required the installation of safety glass for the win-dows of new vehicles and for the replacement of windows in existingvehicles.64
In 1978, two changes were made in the laws regarding the use of thebreathalizer to test the level of a driver's intoxication. First, the use ofthe breath sample for evidentiary purposes was permitted even in theabsence of a blood test. Second, the permissible blood alcohol level wasreduced from 100 milligrams of alcohol per 100 milliliters of blood to 80milligrams per 100 milliliters. In addition, once a person had his licenserevoked, it became more difficult for him to obtain a limited license.65
No doubt these changes in the law have reduced the number andseverity of road accidents. The seat belt requirement alone has probablyhelped prevent fatalities.66 And, although it is probably impossible todetermine the precise impact these measures have had on the deterrenceeffect,67 some of these factors most certainly have contributed to thereduction in accident rates. If none of the various measures implementedsince 1973 had been taken, the rates would have probably remained more
58. Transport (Motor Spirits Conservation) Regulations, [1973] 3 N.Z. Stat. Regs. No. 283, at
1743.59. Traffic Regulations 1956, Amendment No. 26, Regulation 6, [1973] 3 N.Z. Stat. Regs. No.
316, at 2065, 2067.60. Traffic Regulations 1956, Amendment No. 22, [1972] 1 N.Z. Stat. Regs. No. 83, at 259.
61. Traffic Regulations 1956, Amendment No. 28, [1974] 3 N.Z. Stat. Regs. No. 273, at 1764.
62. Traffic Regulations 1976, Amendment No. 2, [1978] 3 N.Z. Stat. Regs. No. 301, at 1259.The relevant age had been 15 years.
63. Traffic Regulations 1976, [1976] 3 N.Z. Stat. Regs. No. 227, at 1259.
64. Id., Regulation 73, at 1302.65. Transport (Breath Tests) Notice, [1978] 3 N.Z. Stat. Regs. No. 310, at 1300.
66. Green & Sharpe, Seat Belt Legislation, (paper presented at 23rd annual conference of theAmerican Association for Automobile Medicine, 1979) (on file with the California Law Review).
67. Factors such as education, improvement in car design and road design from the point ofview of safety, and increased enforcement activity by police all have some effect, as does the pressure
of fuel prices. Determining the relative importance of each would indeed seem to be impossible. See,
e.g., Road Death Toll Shows Drastic Drop, London Free Press, July 14, 1973, at All.
1985]

CALIFORNIA LAW REVIEW
or less constant. Of course, this conclusion cannot absolutely be provedone way or the other. What can be stated unequivocally, nevertheless, isthat during this period, the accident rate decreased.
B. Changes in Policing Activity
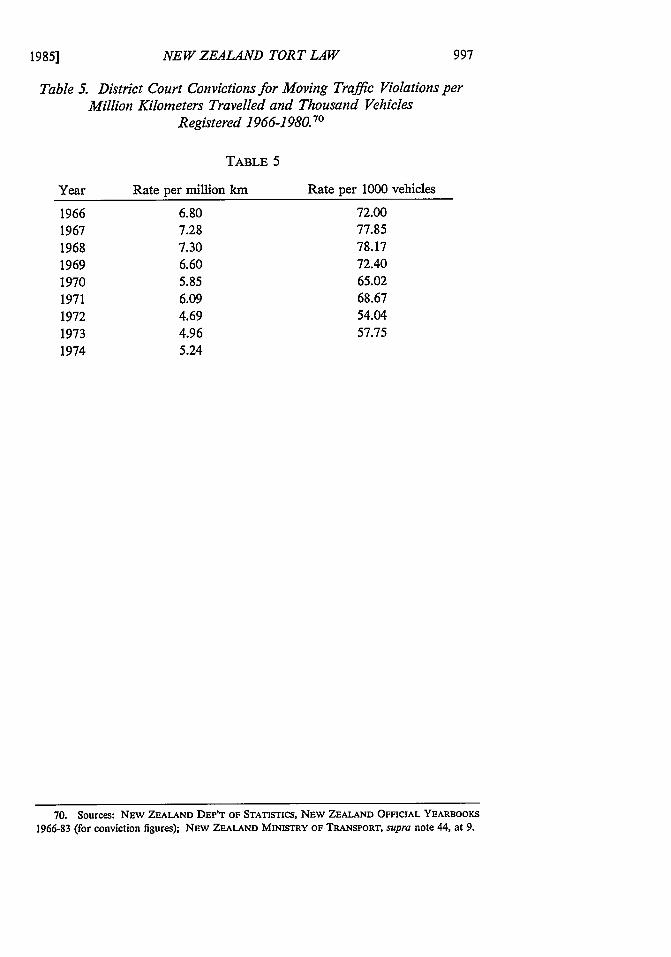
In addition to the examination of the figures concerning accidentrates, an examination of the results of policing activity during the rele-vant years should provide some useful insight for our comparison. Oncedeterrence is removed, the traditional view would predict that motoristswould act more recklessly, whether or not this behavior resulted in moreaccidents. Such an increase in dangerous behavior behind the wheelshould be reflected in police statistics detailing convictions for dangerousconduct. While not entirely conclusive, an examination of police statis-tics concerning convictions for those offenses related to accident-causingconduct for the years in question should prove helpful.6" Assuming con-viction rates remained more or less constant before and after 1974, itappears that no significant change in accident-causing behavior hasoccurred. The data in Table 5 include conviction figures for recklessdriving, drunk driving, and speeding offenses.69
Once again, the rate of convictions calculated by relating the total ineach year to the total vehicle kilometers travelled provides the most use-ful comparison. For further comparison, I calculated a figure represent-ing the number of convictions per thousand vehicles registered.
68. Any change in the conviction rate may, of course, be attributable to an increase or decreasein police activity: for example, periodic "blitzes" on speeding motorists or drunk drivers.
69. The data in Table 5 represent convictions for the following offenses: (1) reckless, danger-ous, or careless use of, or driving of, a motor vehicle resulting in death or injury; (2) driving orhaving control of a motor vehicle while under the influence of alcohol or drugs resulting in death orinjury; (3) driving or having control of a motor vehicle or other vehicle while under the influence ofalcohol or drugs; (4) exceeding the speed limit; (5) reckless, dangerous, careless or inconsiderate useof, or driving of, a motor vehicle. These convictions were recorded in the District Courts (formerlythe Magistrates' Courts) in New Zealand from 1964 to 1980.
[Vol. 73:976
NEW ZEALAND TORT LAW
Table 5. District Court Convictions for Moving Traffic Violations perMillion Kilometers Travelled and Thousand Vehicles
Registered 1966-1980.70
TABLE 5
Rate per million km
6.807.287.306.605.856.094.694.965.24
Rate per 1000 vehicles
72.0077.8578.1772.4065.0268.6754.0457.75
70. Sources: NEw ZEALAND DEP'T OF STATISTICS, NEW ZEALAND OFFICIAL YEARBOOKS
1966-83 (for conviction figures); NEW ZEALAND MINISTRY OF TRANSPORT, supra note 44, at 9.
Year
196619671968196919701971197219731974
998 CALIFORNIA LAW REVIEW [Vol. 73:976
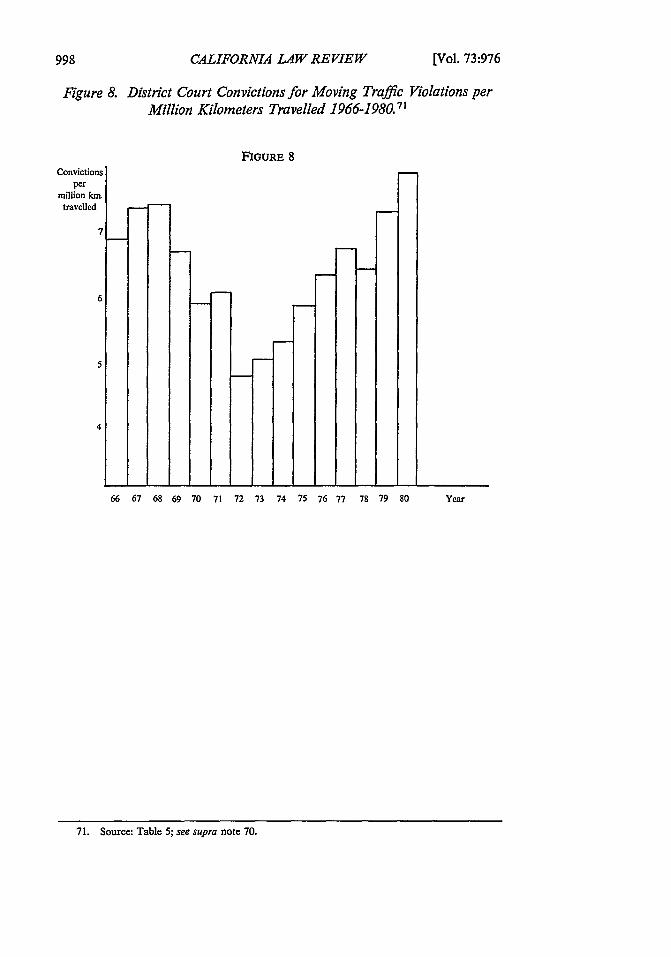
Figure 8. District Court Convictions for Moving Traffic Violations perMillion Kilometers Travelled 1966-1980. 71
FIGURE 8
66 67 68 69 70 71 72 73 74 75 76 77 78 79 80 Year
71. Source: Table 5; see supra note 70.
Convictionsper
million km.travelled
7
6
5
4
NEW ZEALAND TORT LAW
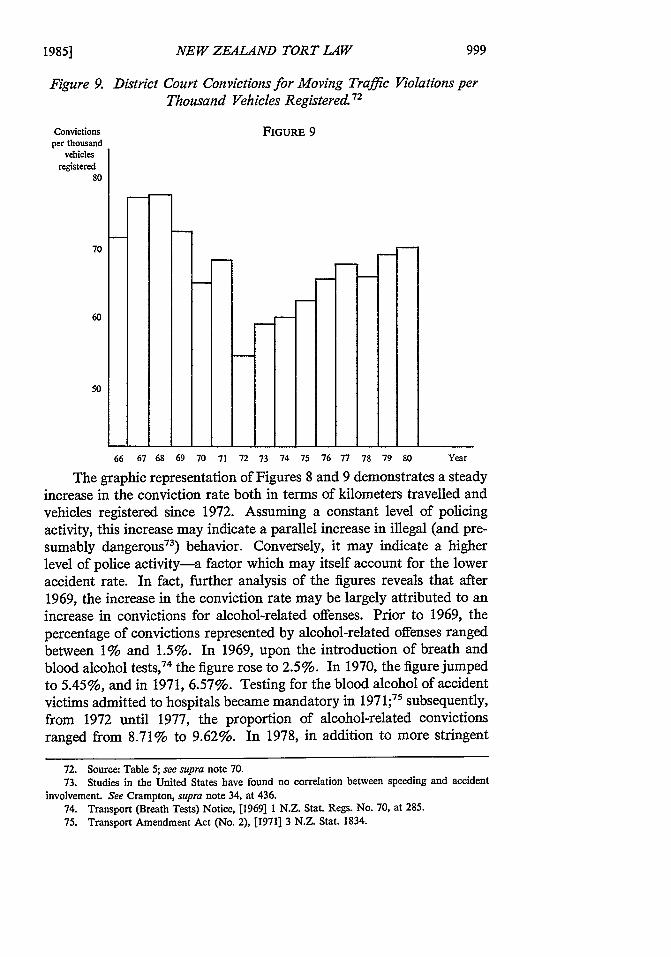
Figure 9. District
Convictionsper thousand
vehiclesregistered
80
70
60
50
Court Convictions for Moving Traffic Violations perThousand Vehicles Registered.7 2
FIGURE 9
66 67 68 69 70 71 72 73 74 75 76 77 78 79 80 Year
The graphic representation of Figures 8 and 9 demonstrates a steadyincrease in the conviction rate both in terms of kilometers travelled andvehicles registered since 1972. Assuming a constant level of policingactivity, this increase may indicate a parallel increase in illegal (and pre-sumably dangerous 73) behavior. Conversely, it may indicate a higherlevel of police activity-a factor which may itself account for the loweraccident rate. In fact, further analysis of the figures reveals that after1969, the increase in the conviction rate may be largely attributed to anincrease in convictions for alcohol-related offenses. Prior to 1969, thepercentage of convictions represented by alcohol-related offenses rangedbetween 1% and 1.5%. In 1969, upon the introduction of breath andblood alcohol tests,74 the figure rose to 2.5%. In 1970, the figure jumpedto 5.45%, and in 1971, 6.57%. Testing for the blood alcohol of accidentvictims admitted to hospitals became mandatory in 1971; 71 subsequently,from 1972 until 1977, the proportion of alcohol-related convictionsranged from 8.71% to 9.62%. In 1978, in addition to more stringent
72. Source: Table 5; see supra note 70.73. Studies in the United States have found no correlation between speeding and accident
involvement. See Crampton, supra note 34, at 436.74. Transport (Breath Tests) Notice, [1969] 1 N.Z. Stat. Regs. No. 70, at 285.75. Transport Amendment Act (No. 2), [1971] 3 N.Z. Stat. 1834.
1985]
CALIFORNIA LAW REVIEW
breath testing, the maximum blood alcohol level was lowered.76 Sinceenactment of these latest amendments, alcohol-related offenses accountedfor 11.18% of convictions in 1978, 9.24% in 1979, and 10.73% in 1980.
Rather than indicating an increase in illegal and dangerous behav-ior, therefore, these increases in total convictions probably resulted froma more efficient system of detection and prosecution of a specific categoryof offenses. 7 7 In comparison to the increase in alcohol-related convic-tions, convictions for recklessness and for speeding have remained at arelatively constant level. Table 6 illustrates precisely this point. Thefigures in Table 6 were compiled by dividing the figure representing thenumber of millions of kilometers travelled in each year by the figures forthe number of drunk driving offenses, speeding offenses, and recklessdriving offenses in the same year. This compilation produces a figurerepresenting the number of kilometers travelled for each conviction.
76. See supra note 65 and accompanying text.77. A similar conclusion might be reached concerning the more modest increase in speeding
convictions since 1971, when a new speeding infringement system was introduced. Transport(Speeding Infringements) Notice, [1971] 1 N.Z. Stat. Regs. No. 132, at 603. The increased use ofradar detection at that time was no doubt another factor.
1000 [Vol. 73:976
NEW ZEALAND TORT LAW
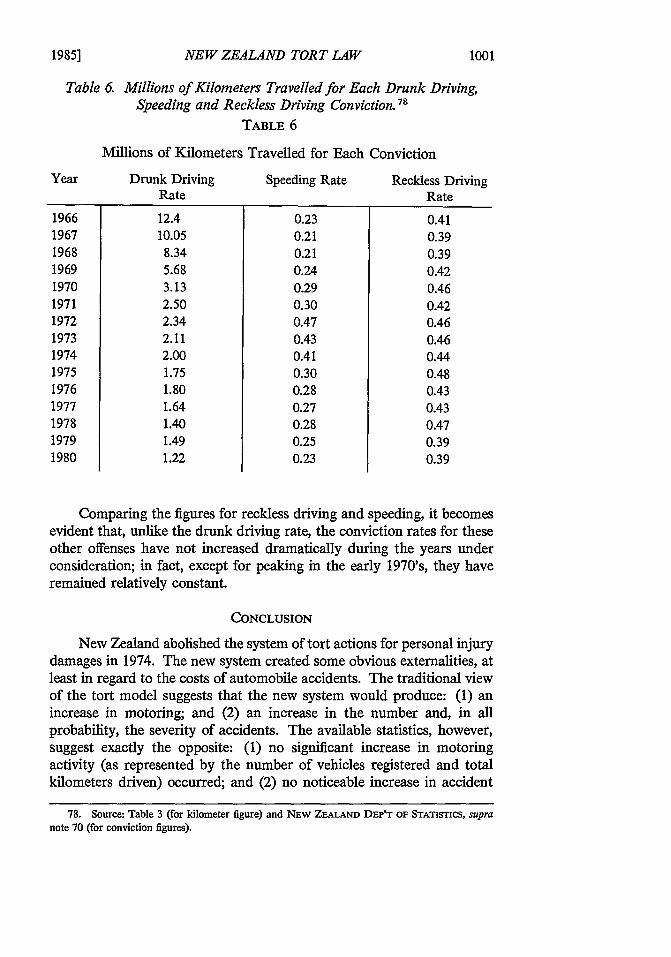
Table 6. Millions of Kilometers Travelled for Each Drunk Driving,Speeding and Reckless Driving Conviction.78
TABLE 6
Millions of Kilometers Travelled for Each Conviction
Drunk DrivingRate
12.410.058.345.683.132.502.342.112.001.751.801.641.401.491.22
Speeding Rate
0.230.210.210.240.290.300.470.430.410.300.280.270.280.250.23
Reckless DrivingRate
0.410.390.390.420.460.420.460.460.440.480.430.430.470.390.39
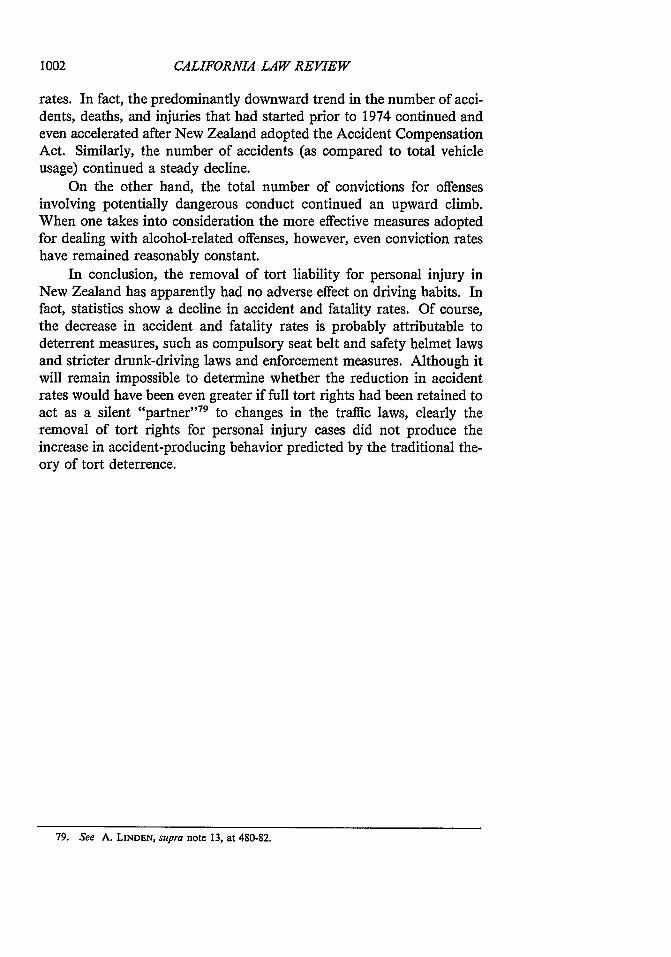
Comparing the figures for reckless driving and speeding, it becomesevident that, unlike the drunk driving rate, the conviction rates for theseother offenses have not increased dramatically during the years underconsideration; in fact, except for peaking in the early 1970's, they haveremained relatively constant.
CONCLUSION
New Zealand abolished the system of tort actions for personal injurydamages in 1974. The new system created some obvious externalities, atleast in regard to the costs of automobile accidents. The traditional viewof the tort model suggests that the new system would produce: (1) anincrease in motoring; and (2) an increase in the number and, in allprobability, the severity of accidents. The available statistics, however,suggest exactly the opposite: (1) no significant increase in motoringactivity (as represented by the number of vehicles registered and totalkilometers driven) occurred; and (2) no noticeable increase in accident
78. Source: Table 3 (for kilometer figure) and NEW ZEALAND DEP'T OF STATISTICS, supranote 70 (for conviction figures).
Year
196619671968196919701971197219731974197519761977197819791980
1985] 1001
CALIFORNIA LAW REVIEW
rates. In fact, the predominantly downward trend in the number of acci-dents, deaths, and injuries that had started prior to 1974 continued andeven accelerated after New Zealand adopted the Accident CompensationAct. Similarly, the number of accidents (as compared to total vehicleusage) continued a steady decline.
On the other hand, the total number of convictions for offensesinvolving potentially dangerous conduct continued an upward climb.When one takes into consideration the more effective measures adoptedfor dealing with alcohol-related offenses, however, even conviction rateshave remained reasonably constant.
In conclusion, the removal of tort liability for personal injury inNew Zealand has apparently had no adverse effect on driving habits. Infact, statistics show a decline in accident and fatality rates. Of course,the decrease in accident and fatality rates is probably attributable todeterrent measures, such as compulsory seat belt and safety helmet lawsand stricter drunk-driving laws and enforcement measures. Although itwill remain impossible to determine whether the reduction in accidentrates would have been even greater if full tort rights had been retained toact as a silent "partner"79 to changes in the traffic laws, clearly theremoval of tort rights for personal injury cases did not produce theincrease in accident-producing behavior predicted by the traditional the-ory of tort deterrence.
79. See A. LINDEN, supra note 13, at 480-82.
1002